local advertising forecasts for 2022
TRANSCRIPT
© 2021 Borrell Inc. ALL RIGHTS RESERVED
Local Advertising Forecasts for 2022October 12, 2021
© 2021 Borrell Inc. ALL RIGHTS RESERVED 3
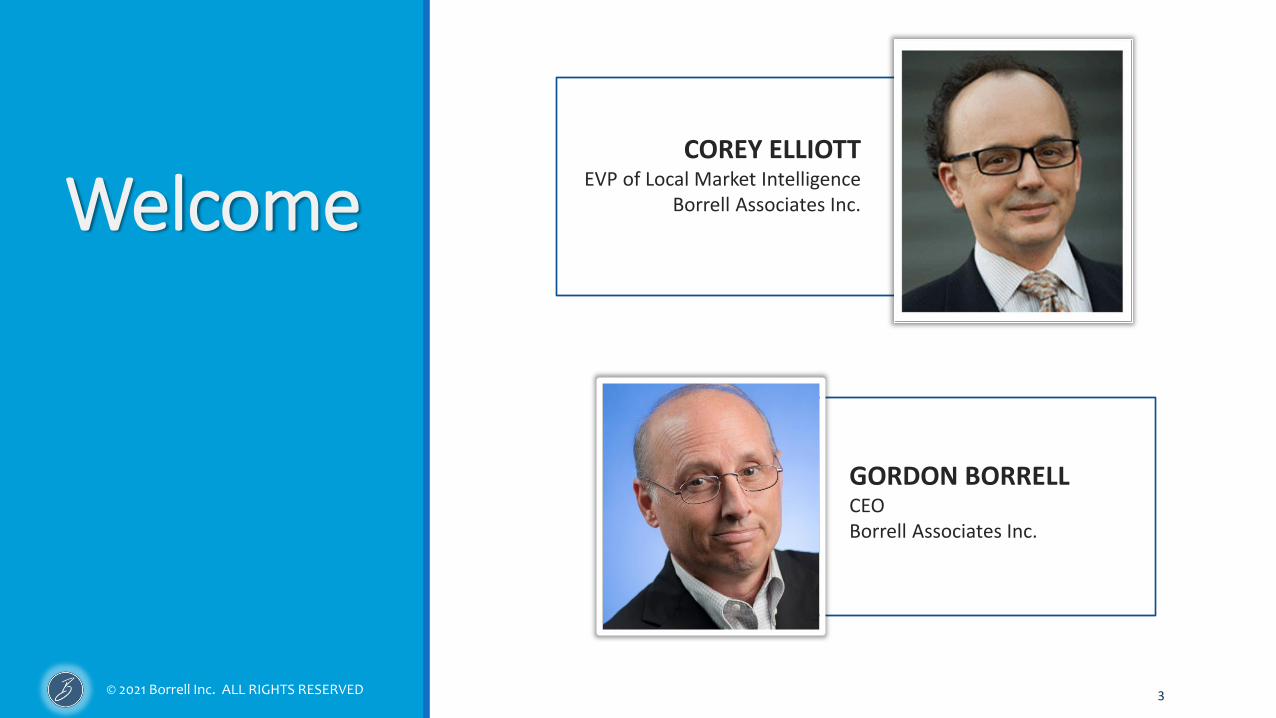
Welcome
GORDON BORRELLCEOBorrell Associates Inc.
COREY ELLIOTTEVP of Local Market Intelligence
Borrell Associates Inc.

© 2021 Borrell Inc. ALL RIGHTS RESERVED 4
Our Newest Team
Members
IntroducingLEAH MUENCH
Director of Client Services
757-221-6641
YANJIE LONG
Data Analyst
757-221-6641
ANDREW FOSTER
Front-End Web Developer
757-221-6641
© 2021 Borrell Inc. ALL RIGHTS RESERVED
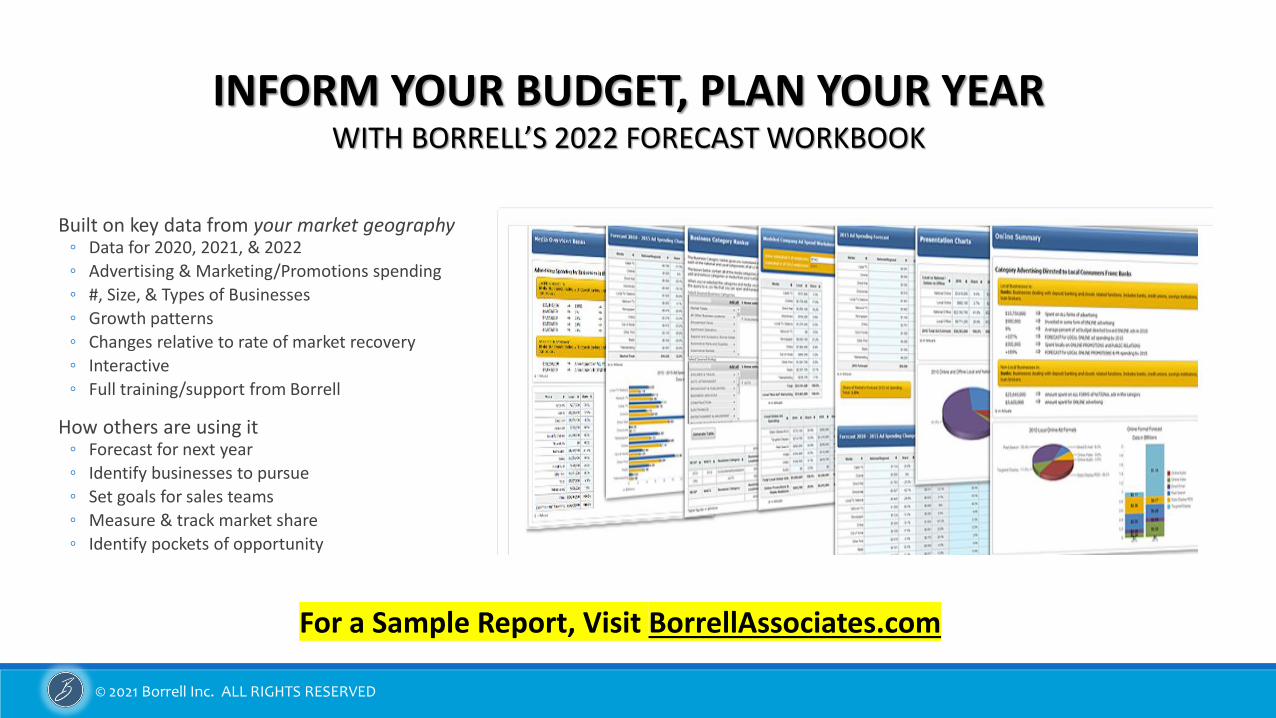
Built on key data from your market geography◦ Data for 2020, 2021, & 2022
◦ Advertising & Marketing/Promotions spending
◦ #, Size, & Types of Businesses
◦ Growth patterns
◦ Changes relative to rate of market recovery
◦ Interactive
◦ Full training/support from Borrell
How others are using it◦ Forecast for next year
◦ Identify businesses to pursue
◦ Set goals for sales teams
◦ Measure & track market share
◦ Identify pockets of opportunity
INFORM YOUR BUDGET, PLAN YOUR YEARWITH BORRELL’S 2022 FORECAST WORKBOOK
For a Sample Report, Visit BorrellAssociates.com
© 2021 Borrell Inc. ALL RIGHTS RESERVED 6
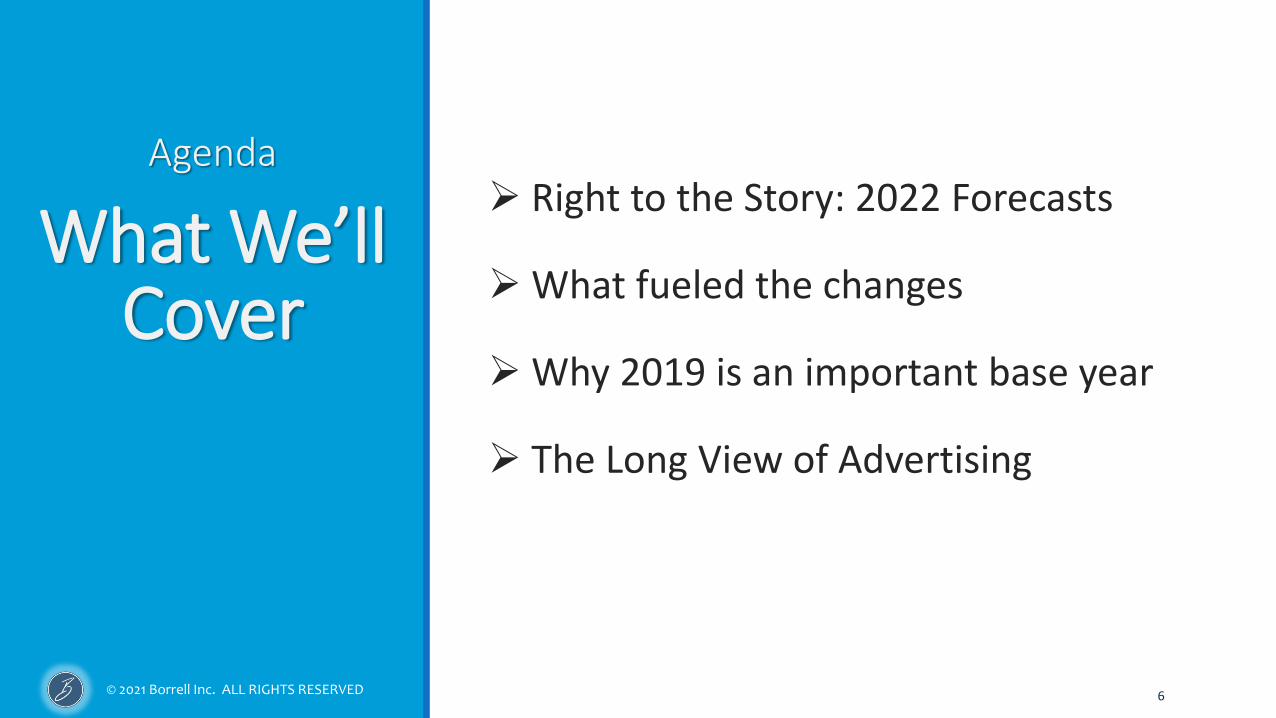
What We’ll Cover
Agenda➢ Right to the Story: 2022 Forecasts
➢ What fueled the changes
➢ Why 2019 is an important base year
➢ The Long View of Advertising
© 2021 Borrell Inc. ALL RIGHTS RESERVED
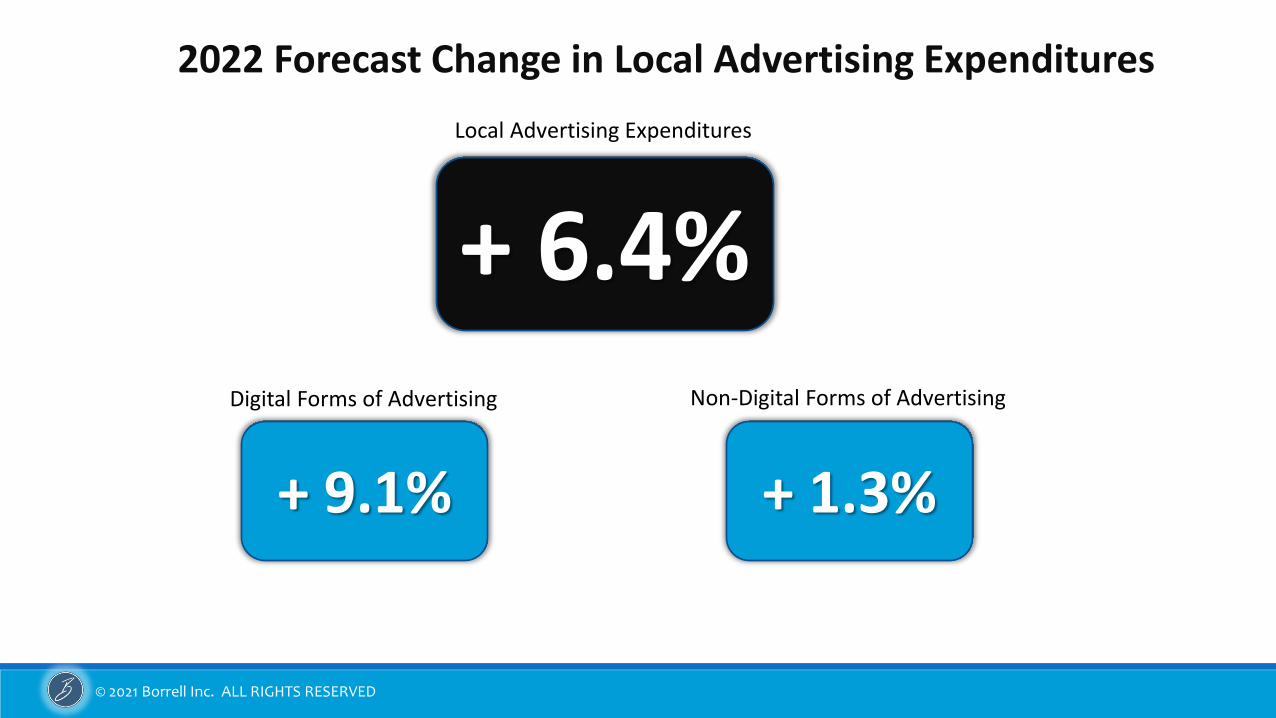
2022 Forecast Change in Local Advertising Expenditures
+ 6.4%
Local Advertising Expenditures
+ 9.1% + 1.3%
Digital Forms of Advertising Non-Digital Forms of Advertising
© 2021 Borrell Inc. ALL RIGHTS RESERVED
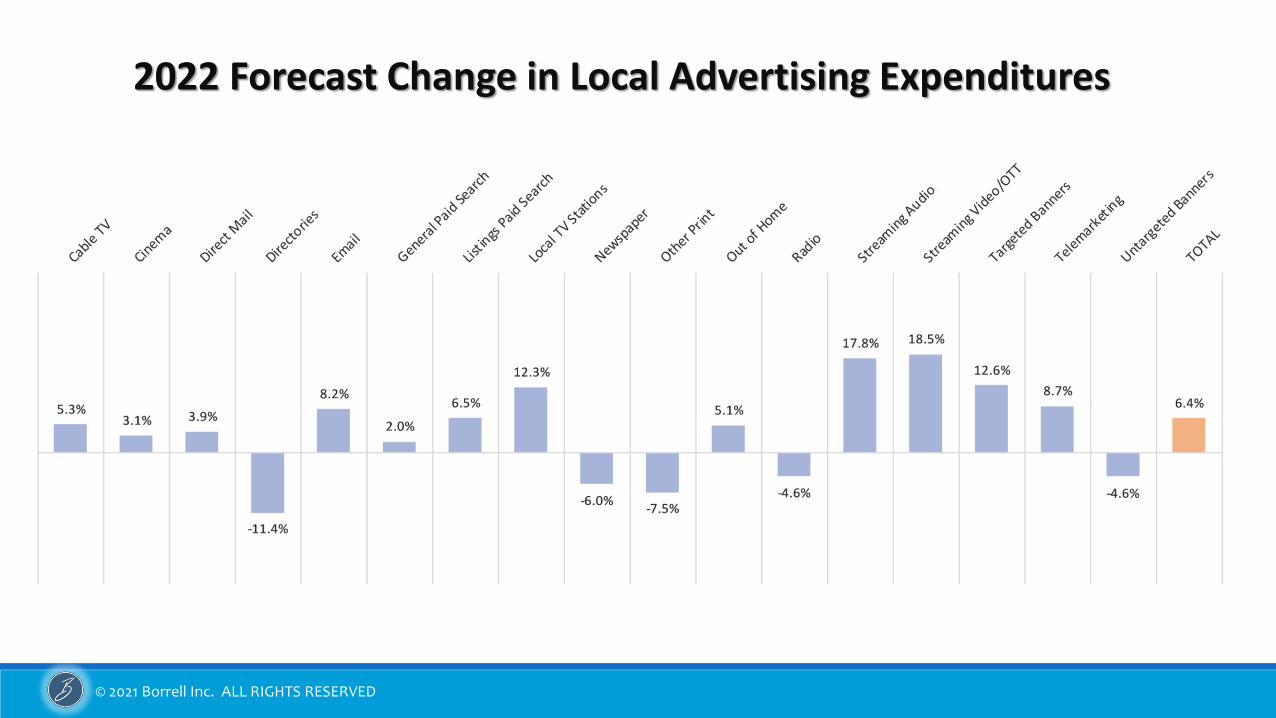
2022 Forecast Change in Local Advertising Expenditures
© 2021 Borrell Inc. ALL RIGHTS RESERVED
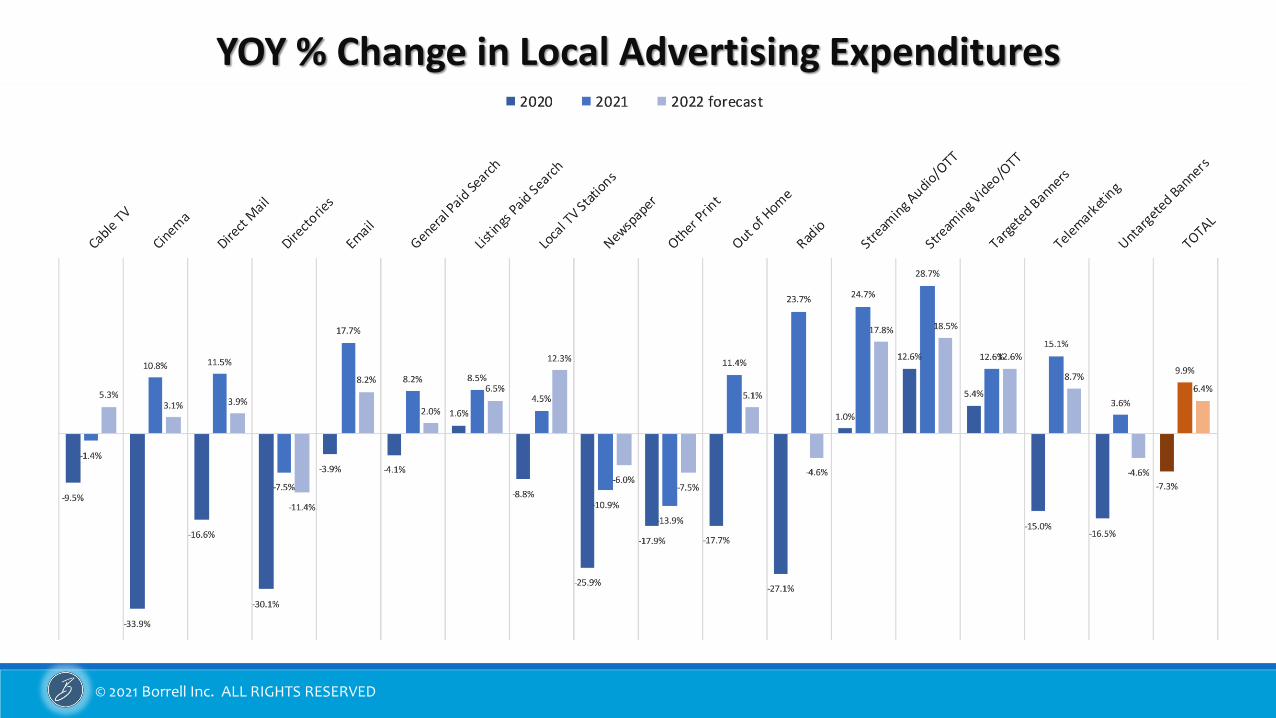
YOY % Change in Local Advertising Expenditures
© 2021 Borrell Inc. ALL RIGHTS RESERVED 10
What We’ll Cover
Agenda➢ 2022 Forecasts (overall)
➢ What fueled the changes
➢ Why 2019 is an important base year
➢ The Long View of Advertising
© 2021 Borrell Inc. ALL RIGHTS RESERVED 11
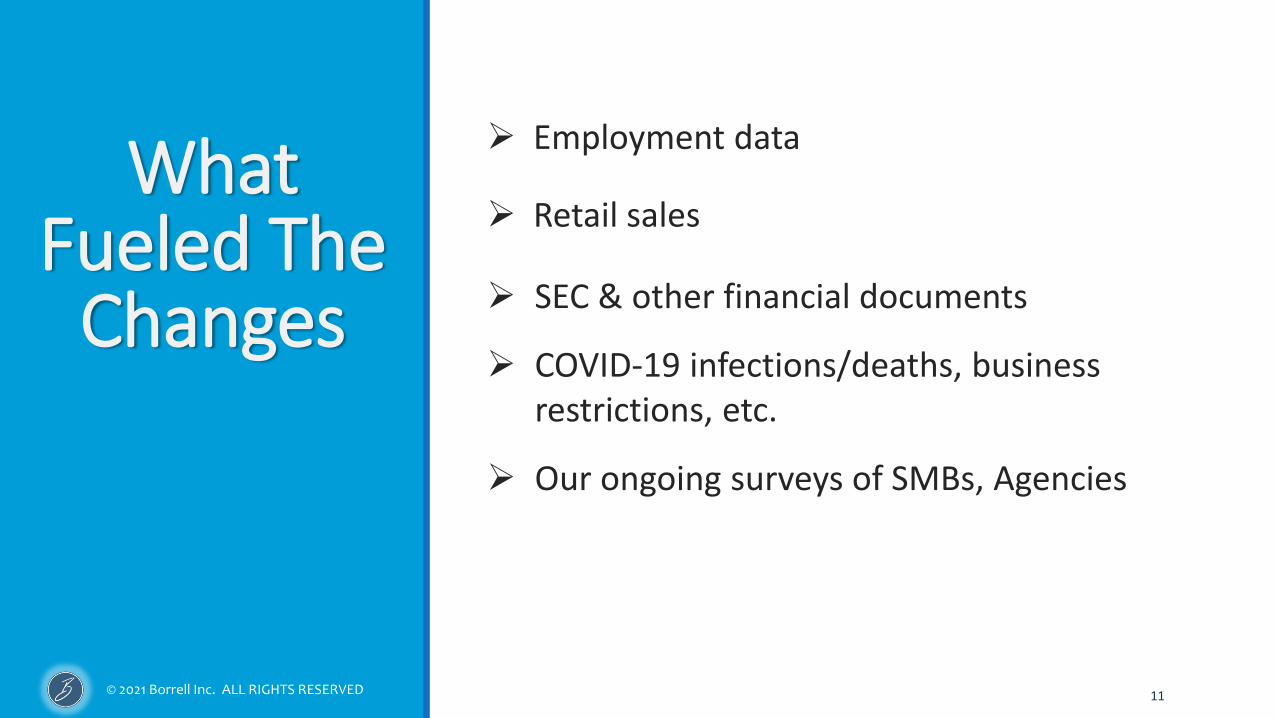
What Fueled The
Changes
➢ Employment data
➢ Retail sales
➢ SEC & other financial documents
➢ COVID-19 infections/deaths, business restrictions, etc.
➢ Our ongoing surveys of SMBs, Agencies
© 2021 Borrell Inc. ALL RIGHTS RESERVED
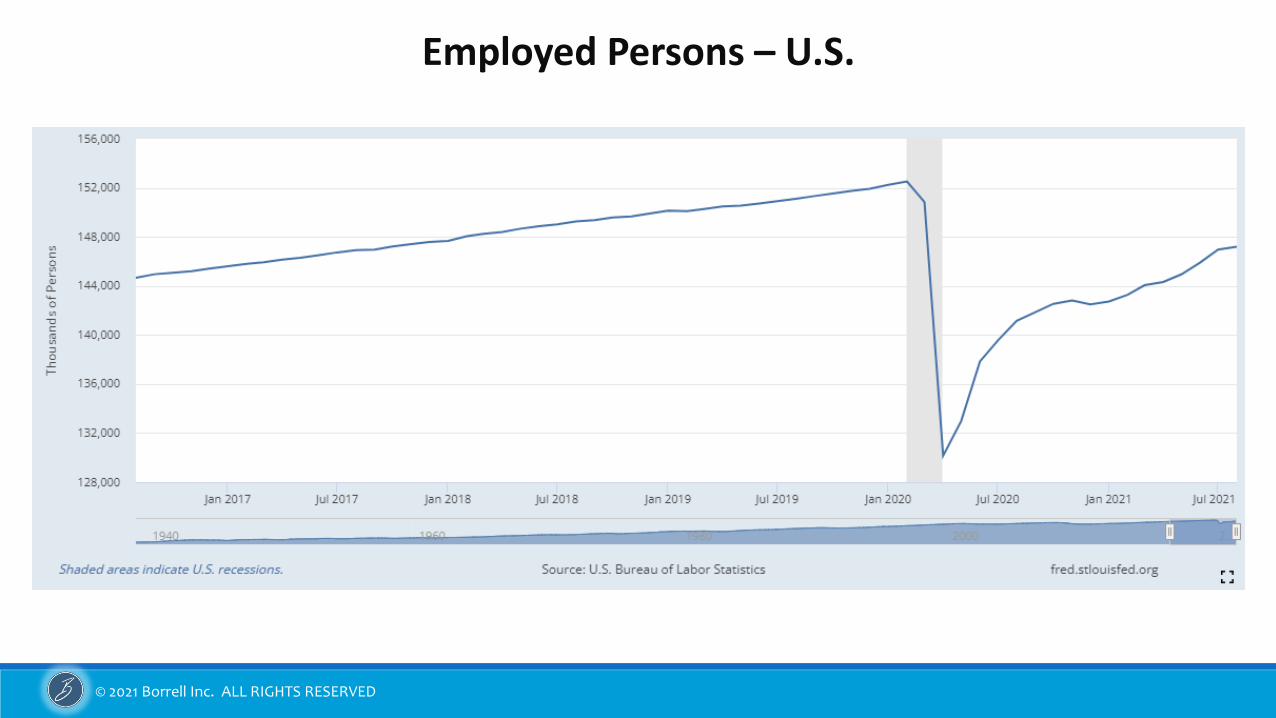
Employed Persons – U.S.
© 2021 Borrell Inc. ALL RIGHTS RESERVED
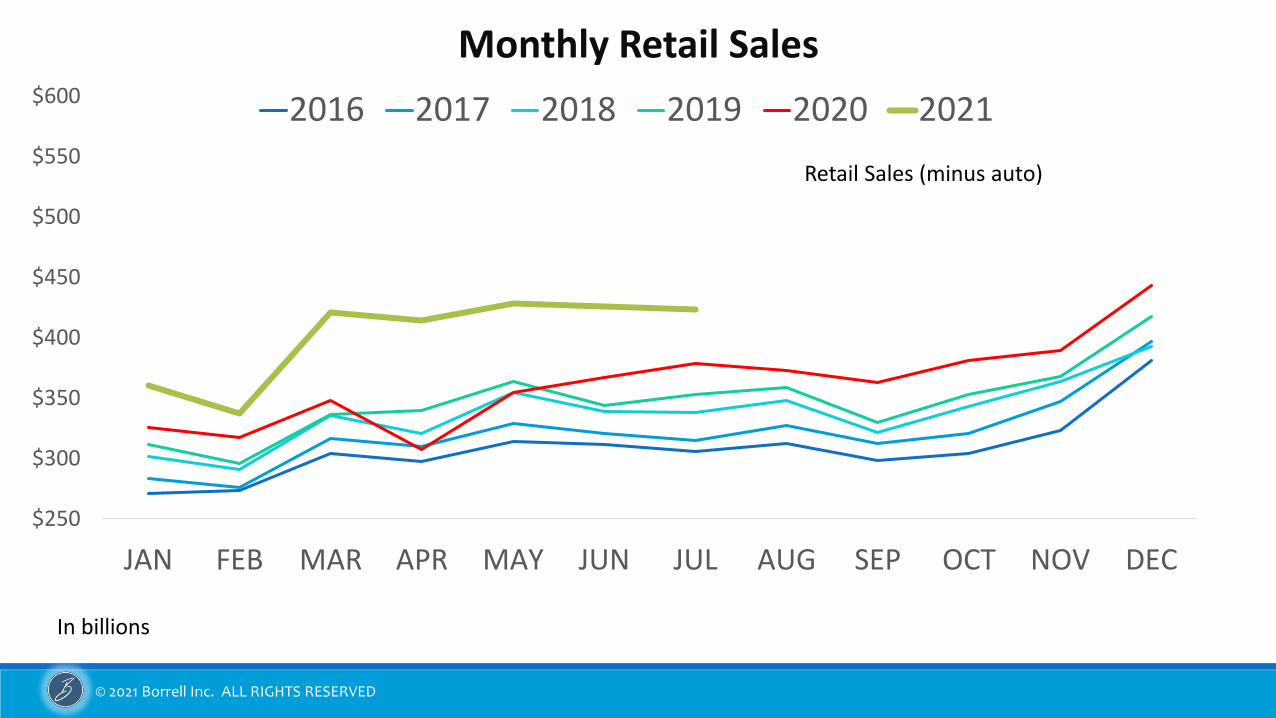
$250
$300
$350
$400
$450
$500
$550
$600
JAN FEB MAR APR MAY JUN JUL AUG SEP OCT NOV DEC
2016 2017 2018 2019 2020 2021
Retail Sales (minus auto)
Monthly Retail Sales
In billions
© 2021 Borrell Inc. ALL RIGHTS RESERVED
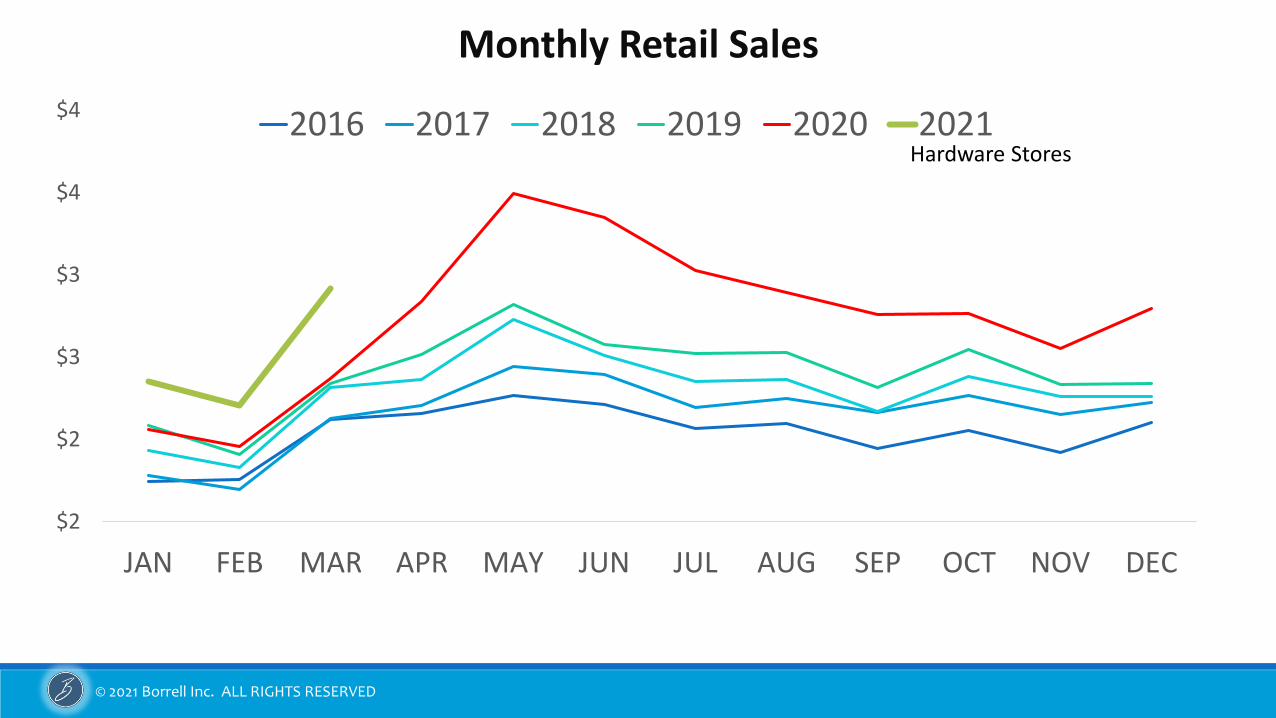
$2
$2
$3
$3
$4
$4
JAN FEB MAR APR MAY JUN JUL AUG SEP OCT NOV DEC
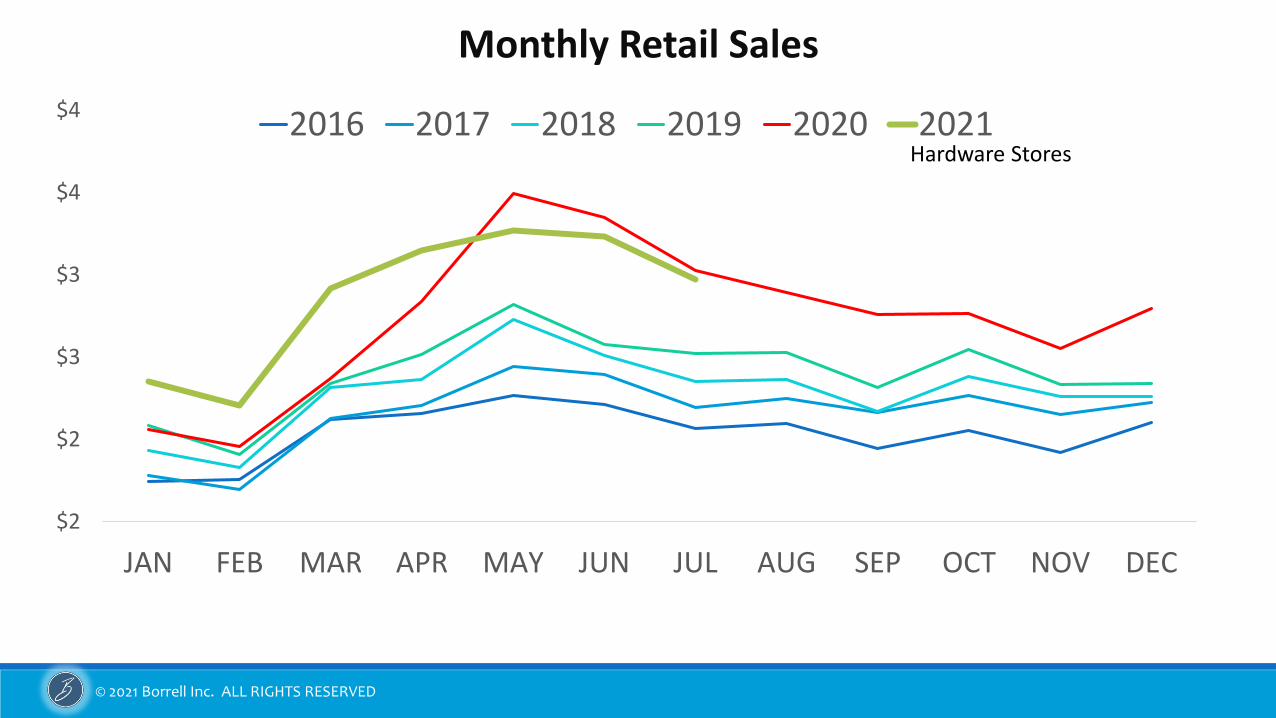
2016 2017 2018 2019 2020 2021Hardware Stores
Monthly Retail Sales
© 2021 Borrell Inc. ALL RIGHTS RESERVED
$2
$2
$3
$3
$4
$4
JAN FEB MAR APR MAY JUN JUL AUG SEP OCT NOV DEC
2016 2017 2018 2019 2020 2021Hardware Stores
Monthly Retail Sales
© 2021 Borrell Inc. ALL RIGHTS RESERVED
$0.50
$0.70
$0.90
$1.10
$1.30
$1.50
JAN FEB MAR APR MAY JUN JUL AUG SEP OCT NOV DEC
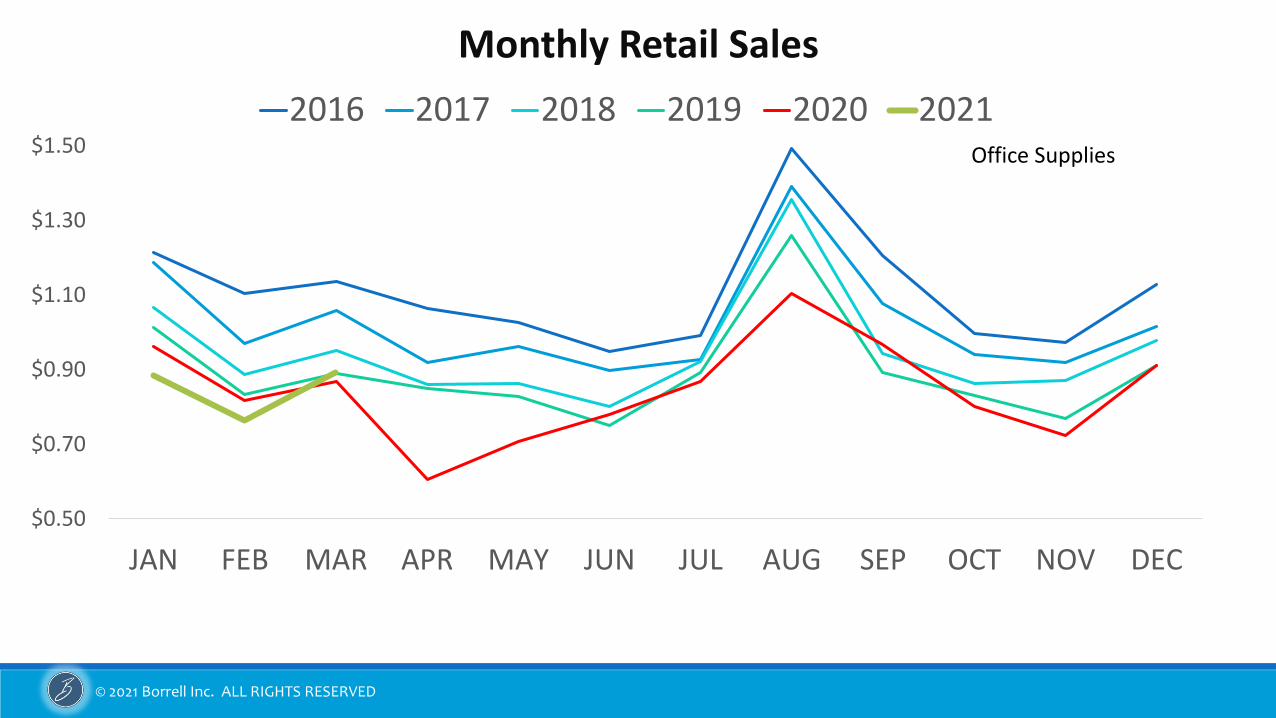
2016 2017 2018 2019 2020 2021Office Supplies
Monthly Retail Sales
© 2021 Borrell Inc. ALL RIGHTS RESERVED
$0.50
$0.70
$0.90
$1.10
$1.30
$1.50
JAN FEB MAR APR MAY JUN JUL AUG SEP OCT NOV DEC
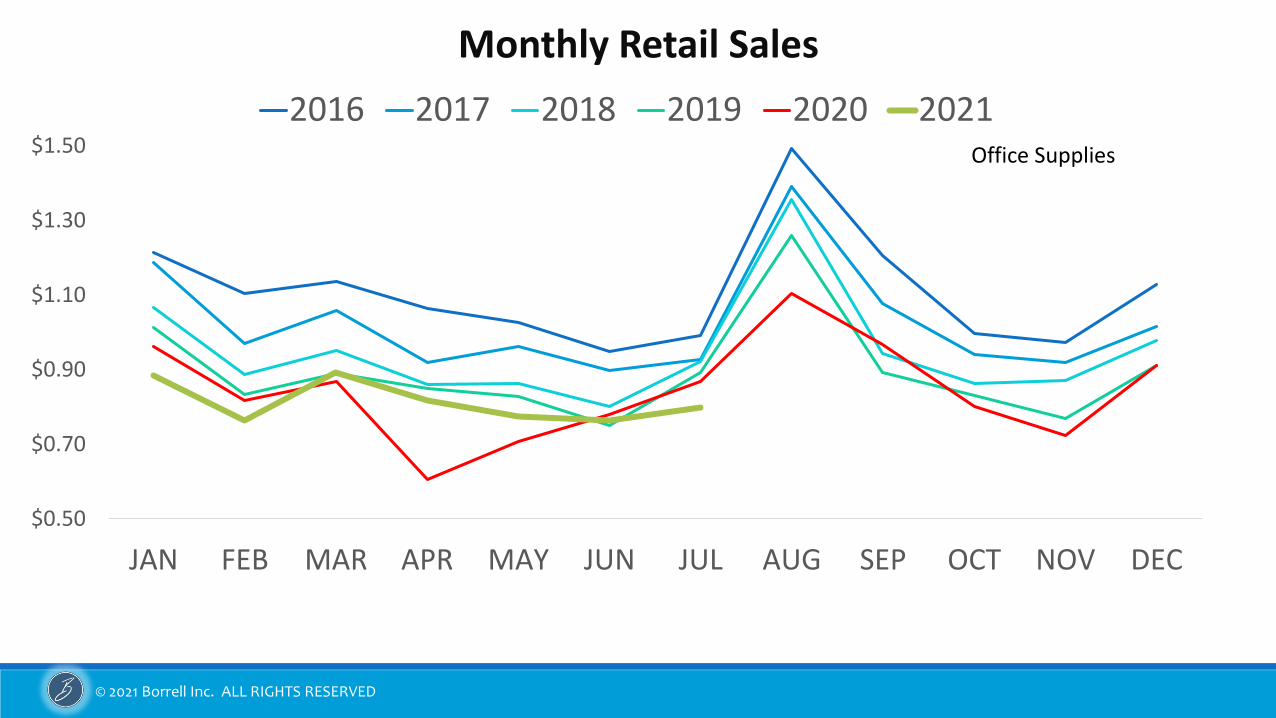
2016 2017 2018 2019 2020 2021Office Supplies
Monthly Retail Sales
© 2021 Borrell Inc. ALL RIGHTS RESERVED
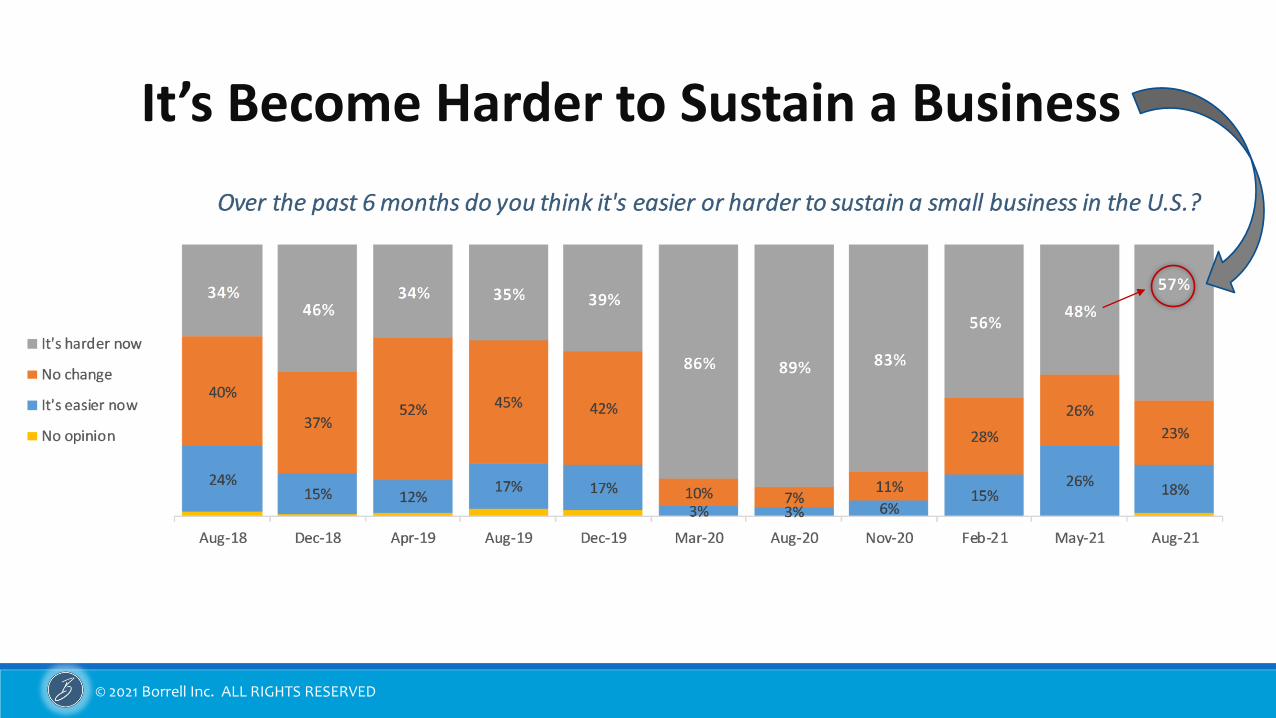
It’s Become Harder to Sustain a Business
© 2021 Borrell Inc. ALL RIGHTS RESERVED
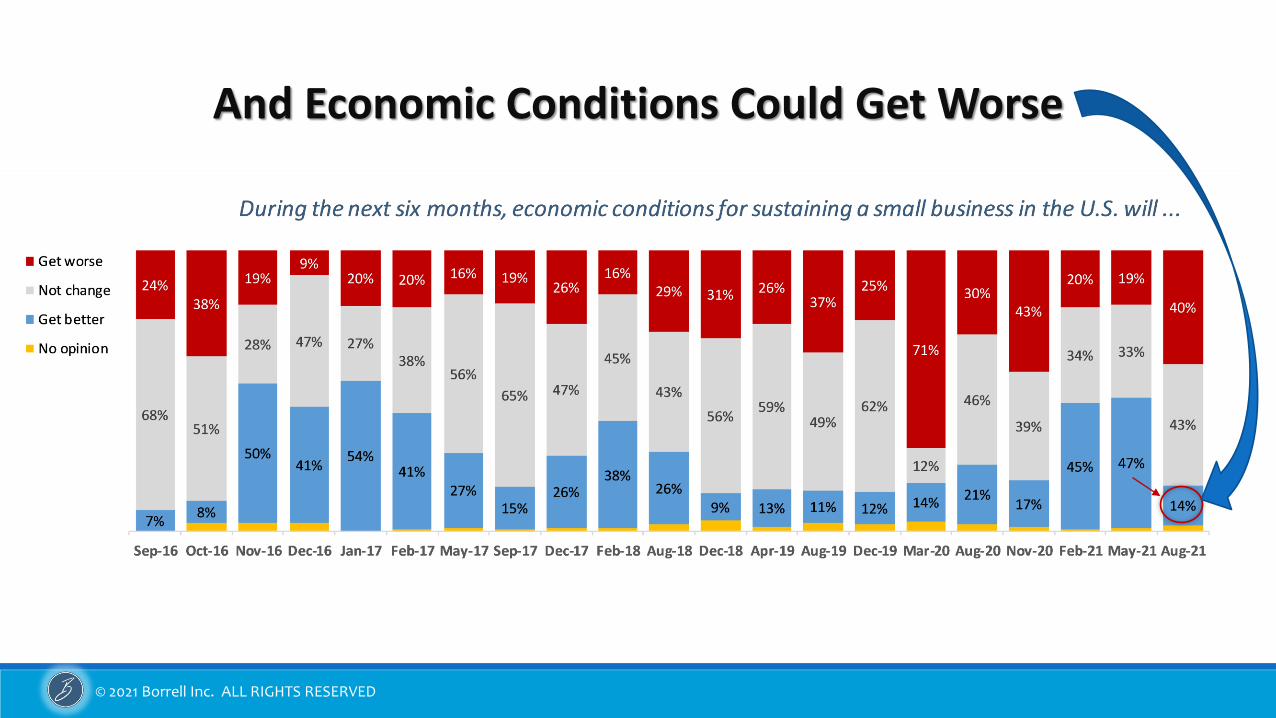
And Economic Conditions Could Get Worse
© 2021 Borrell Inc. ALL RIGHTS RESERVED
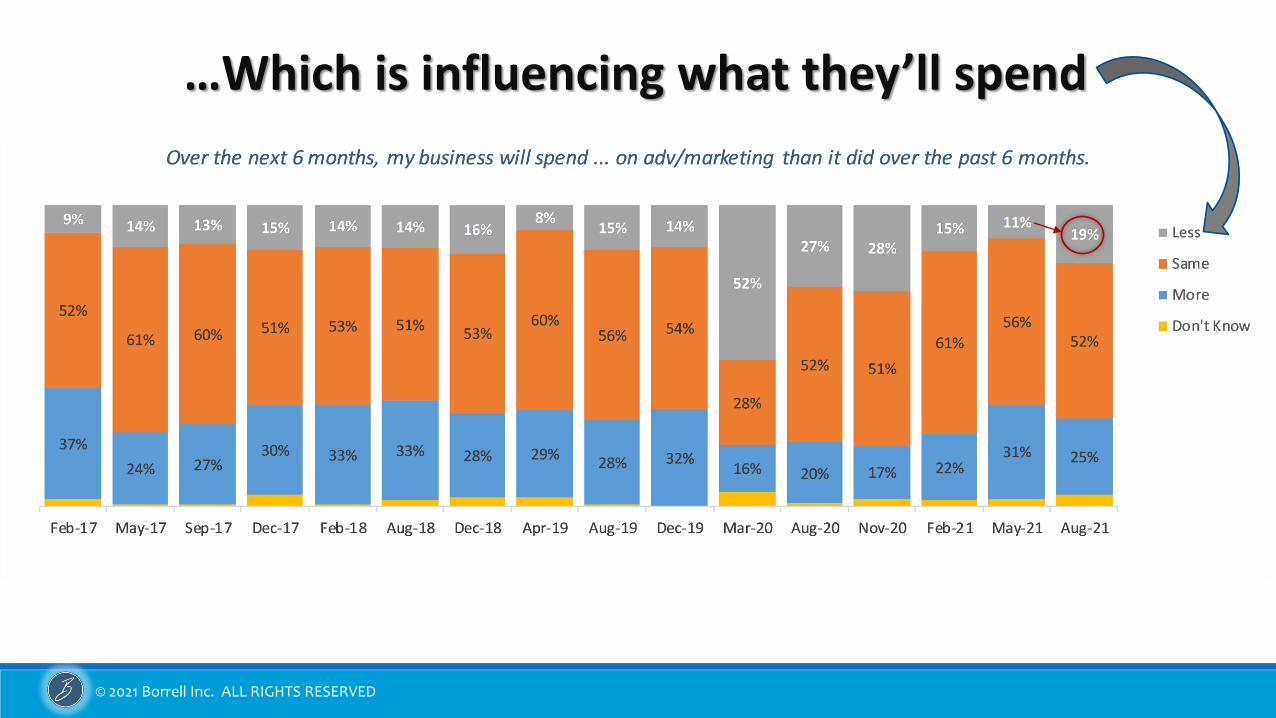
…Which is influencing what they’ll spend
© 2021 Borrell Inc. ALL RIGHTS RESERVED 21
What We’ll Cover
Agenda➢ 2022 Forecasts (overall)
➢ What fueled the changes
➢ Why 2019 is an important base year
➢ The Long View of Advertising
© 2021 Borrell Inc. ALL RIGHTS RESERVED
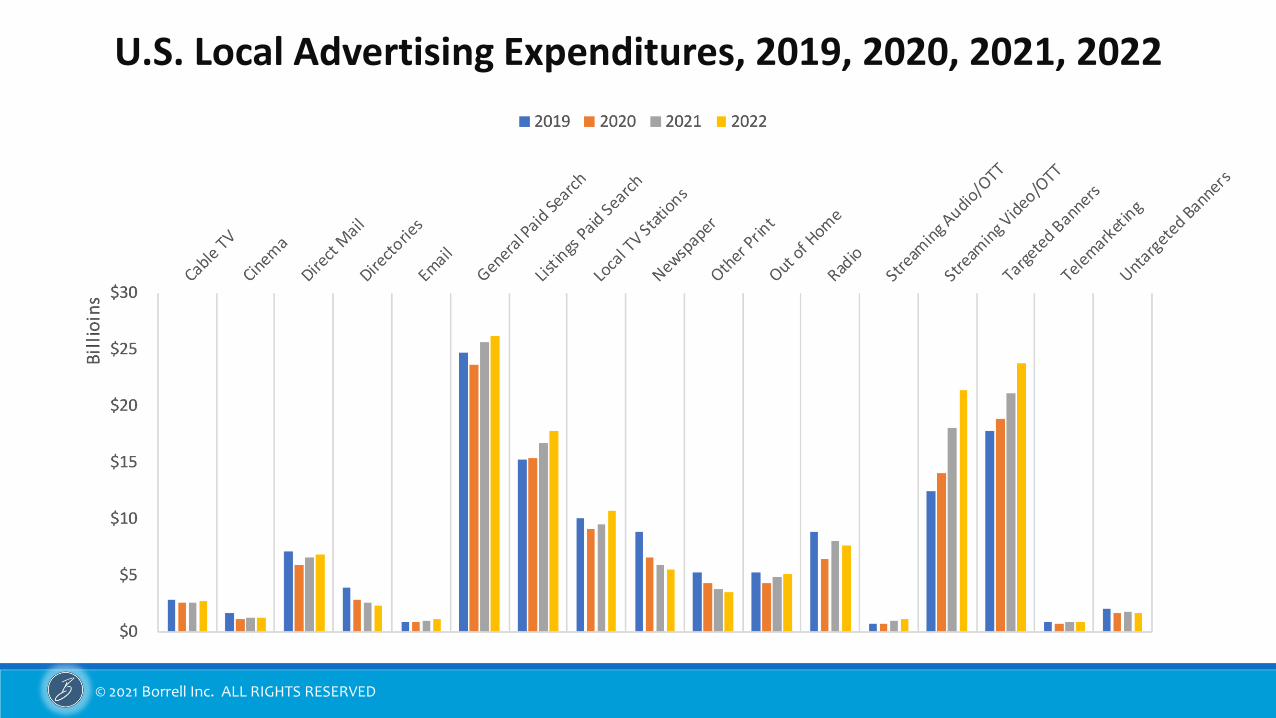
U.S. Local Advertising Expenditures, 2019, 2020, 2021, 2022
© 2021 Borrell Inc. ALL RIGHTS RESERVED
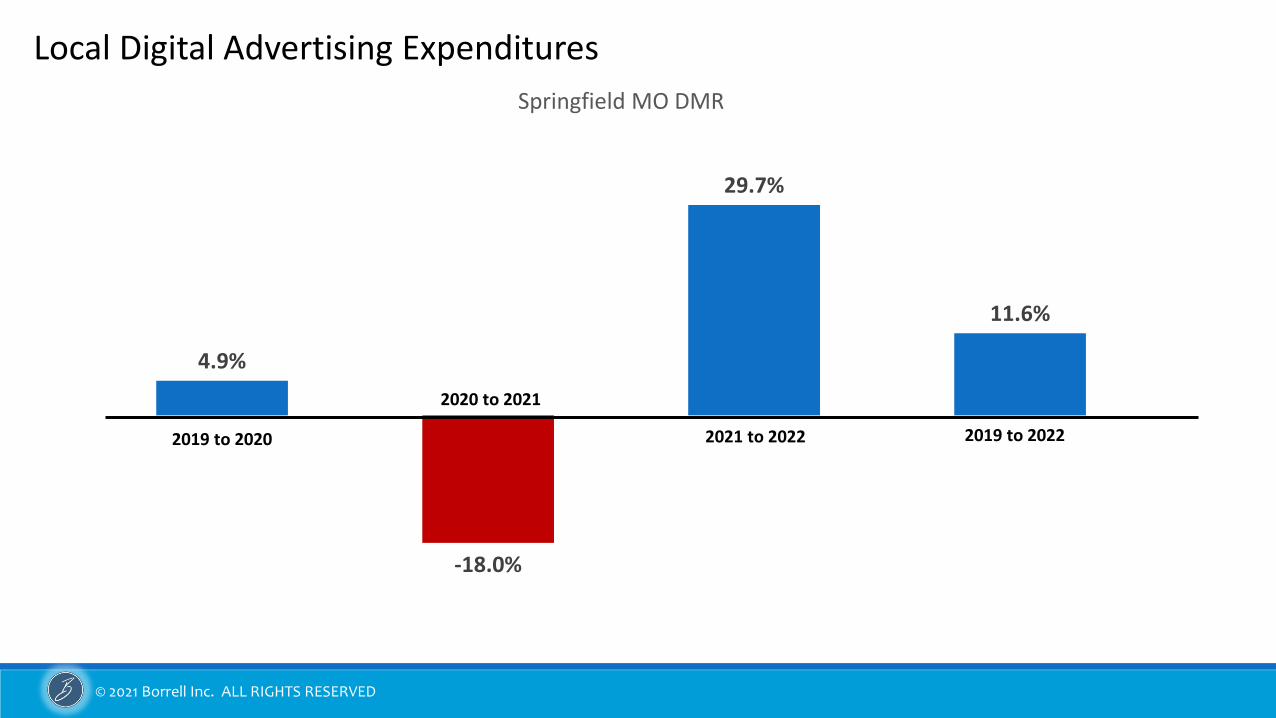
4.9%
-18.0%
29.7%
11.6%
Springfield MO DMR
2019 to 2020
2020 to 2021
2021 to 2022 2019 to 2022
Local Digital Advertising Expenditures
© 2021 Borrell Inc. ALL RIGHTS RESERVED
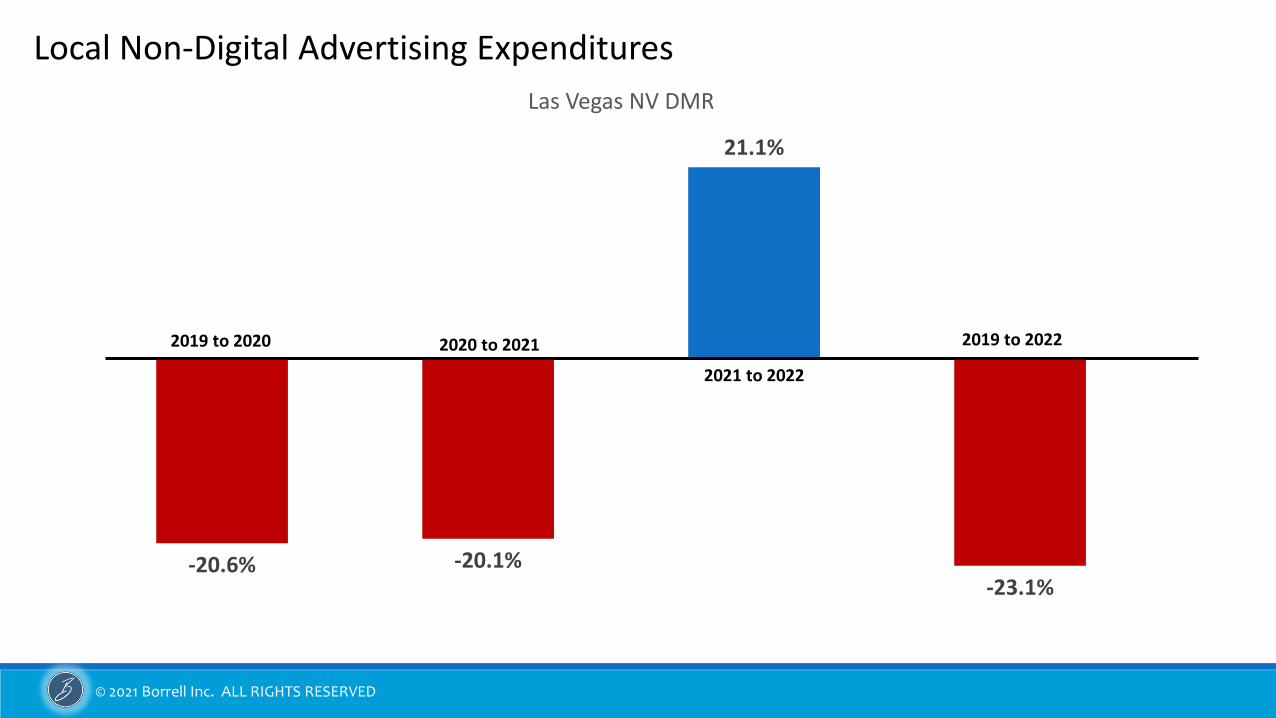
-20.6% -20.1%
21.1%
-23.1%
Las Vegas NV DMR
2019 to 2020 2020 to 2021
2021 to 2022
2019 to 2022
Local Non-Digital Advertising Expenditures
© 2021 Borrell Inc. ALL RIGHTS RESERVED
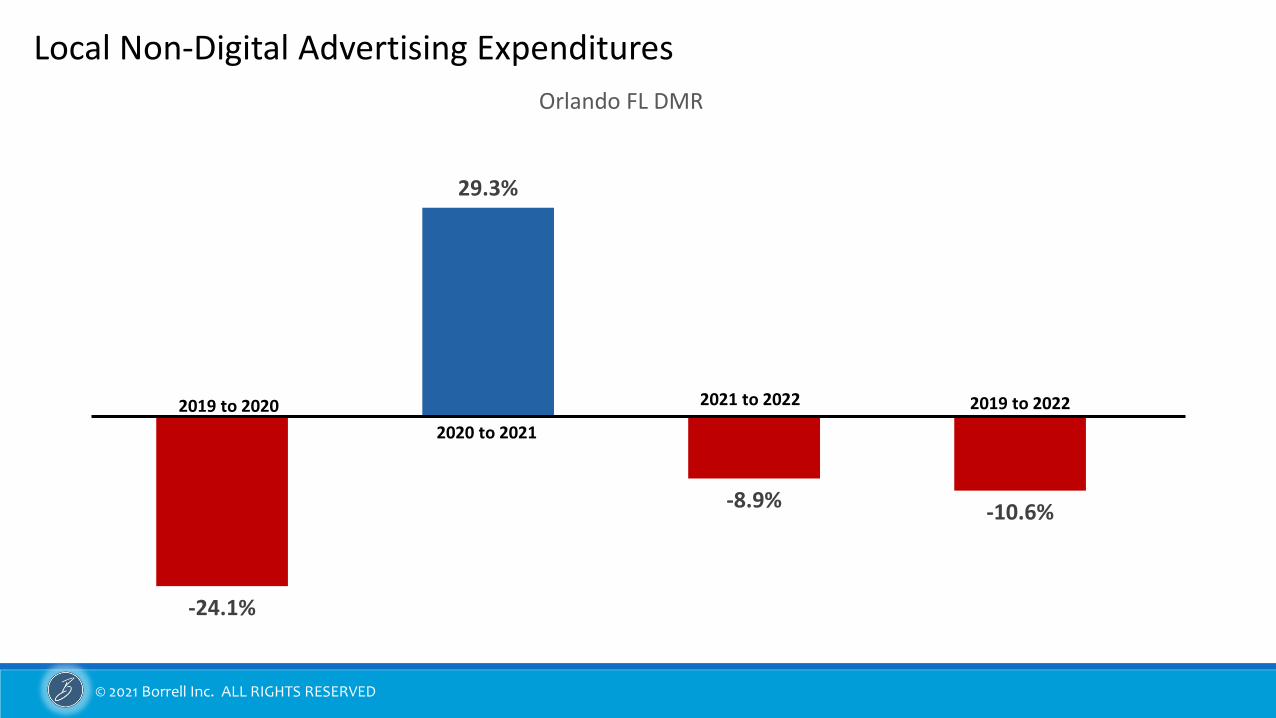
-24.1%
29.3%
-8.9%-10.6%
Orlando FL DMR
2019 to 2020
2020 to 2021
2021 to 2022 2019 to 2022
Local Non-Digital Advertising Expenditures
© 2021 Borrell Inc. ALL RIGHTS RESERVED
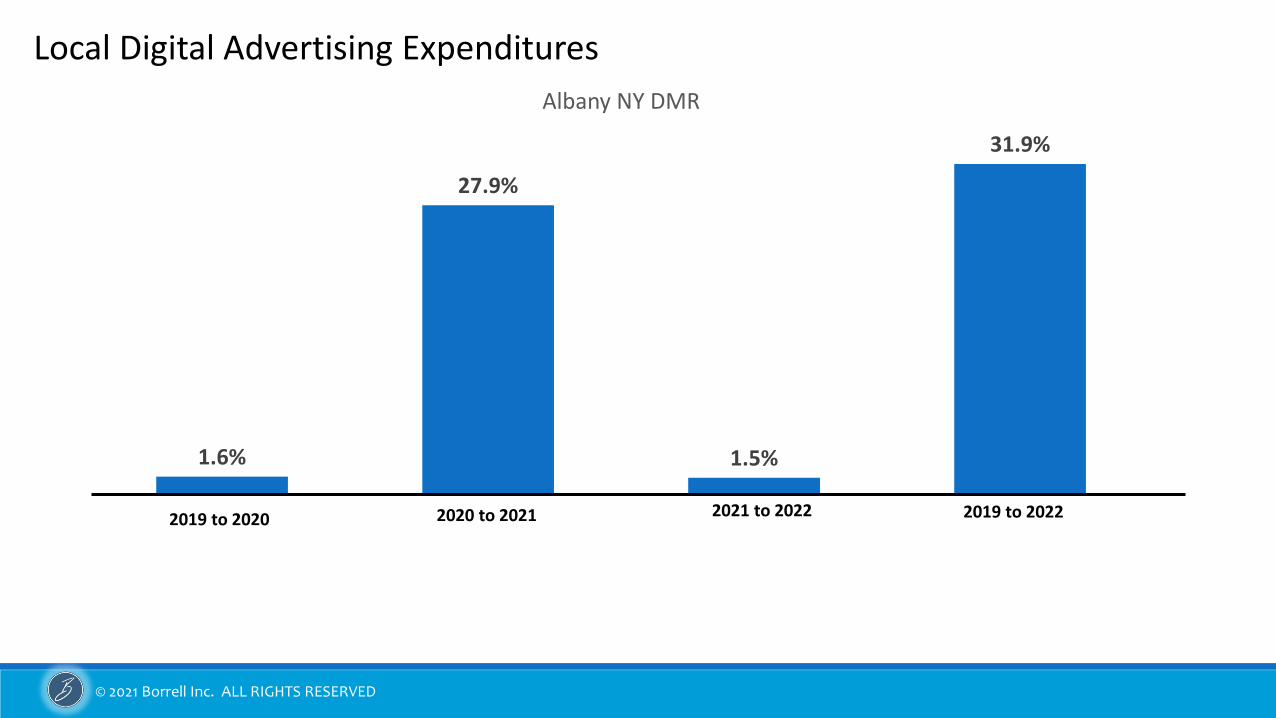
1.6%
27.9%
1.5%
31.9%
Albany NY DMR
Local Digital Advertising Expenditures
2020 to 20212019 to 2020 2021 to 2022 2019 to 2022
© 2021 Borrell Inc. ALL RIGHTS RESERVED
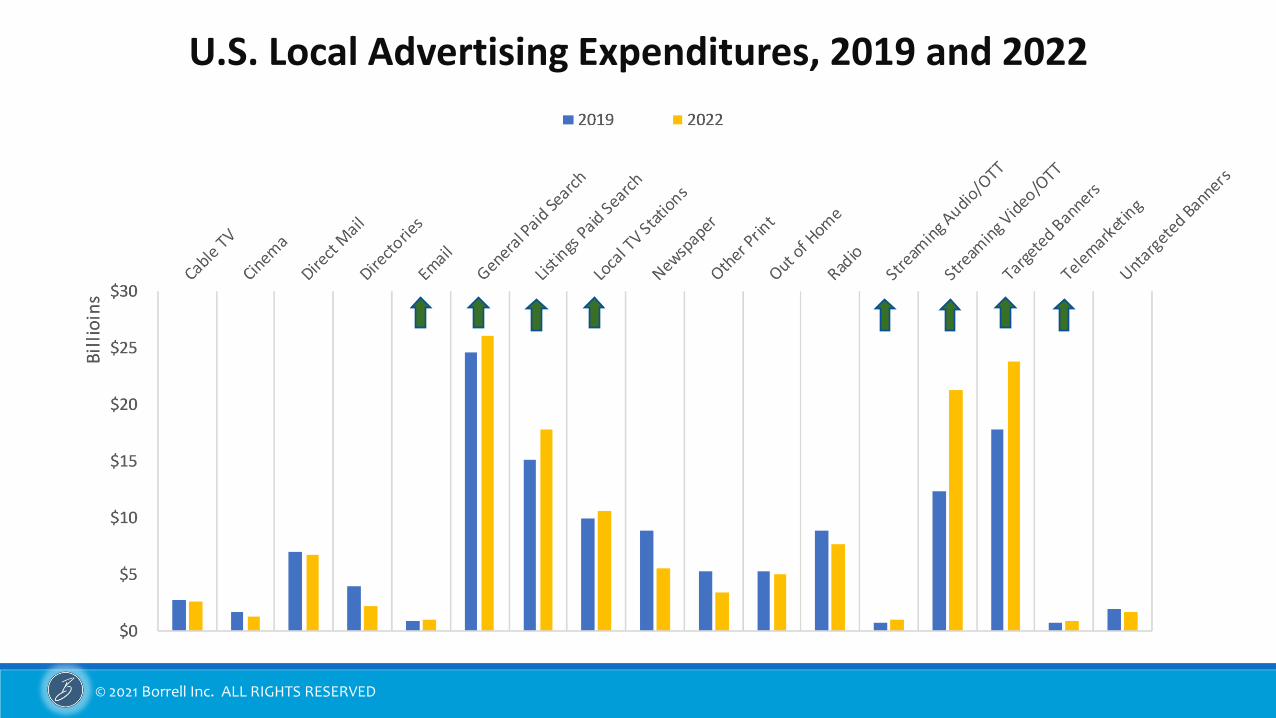
U.S. Local Advertising Expenditures, 2019 and 2022
© 2021 Borrell Inc. ALL RIGHTS RESERVED
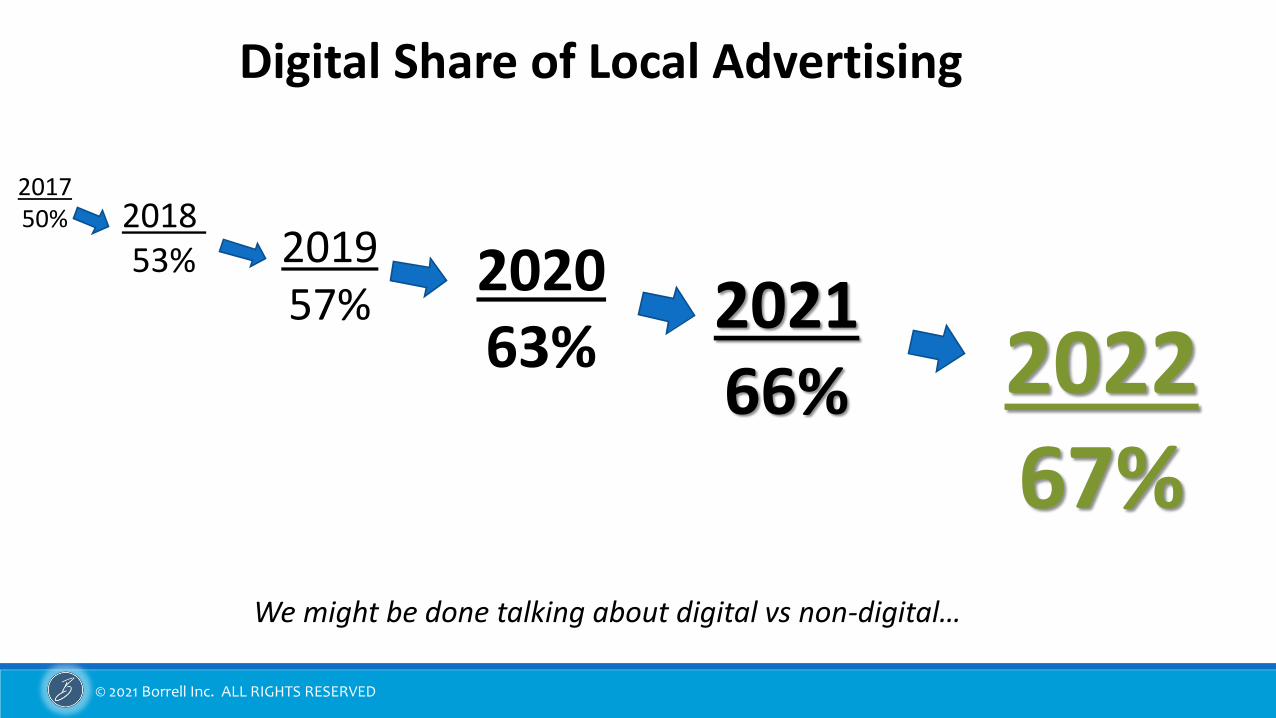
201750% 2018
53% 201957%
202063%
202166% 2022
67%
Digital Share of Local Advertising
We might be done talking about digital vs non-digital…
© 2021 Borrell Inc. ALL RIGHTS RESERVED 29
What We’ll Cover
Agenda➢ 2022 Forecasts (overall)
➢ What fueled the changes
➢ Why 2019 is an important base year
➢ The Long View of Advertising
© 2021 Borrell Inc. ALL RIGHTS RESERVED
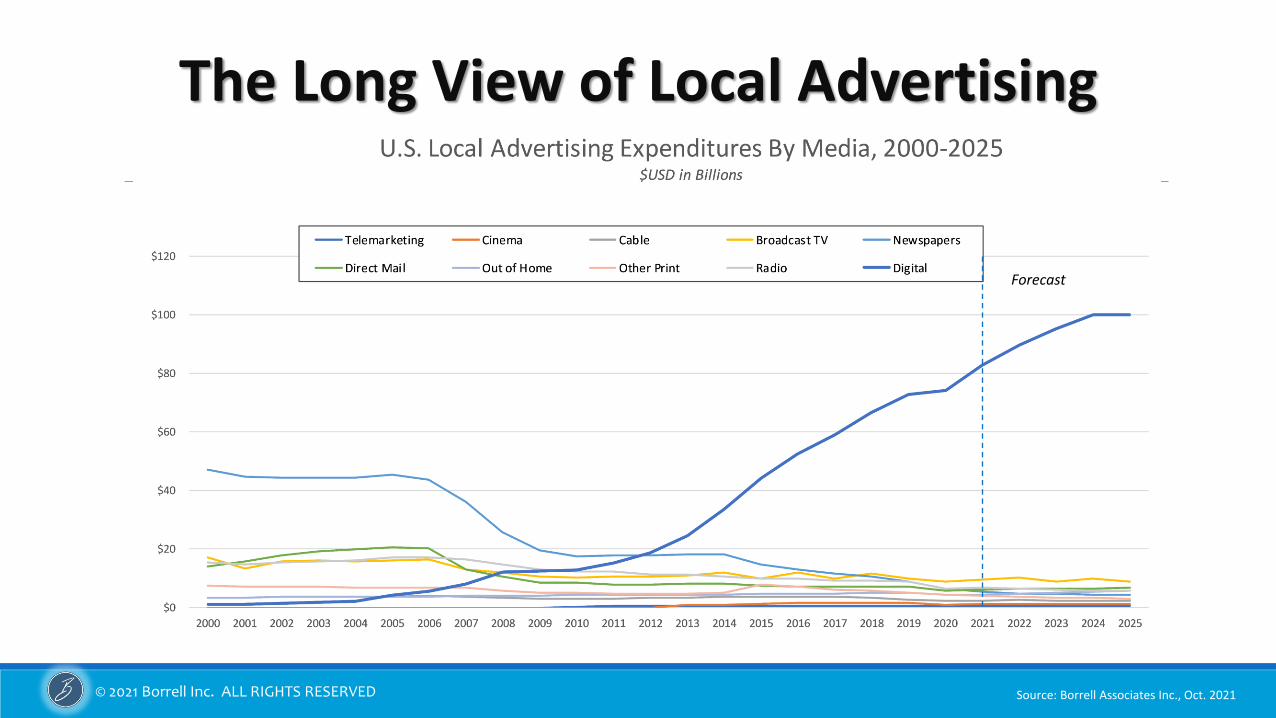
The Long View of Local Advertising
Forecast
Source: Borrell Associates Inc., Oct. 2021
© 2021 Borrell Inc. ALL RIGHTS RESERVED
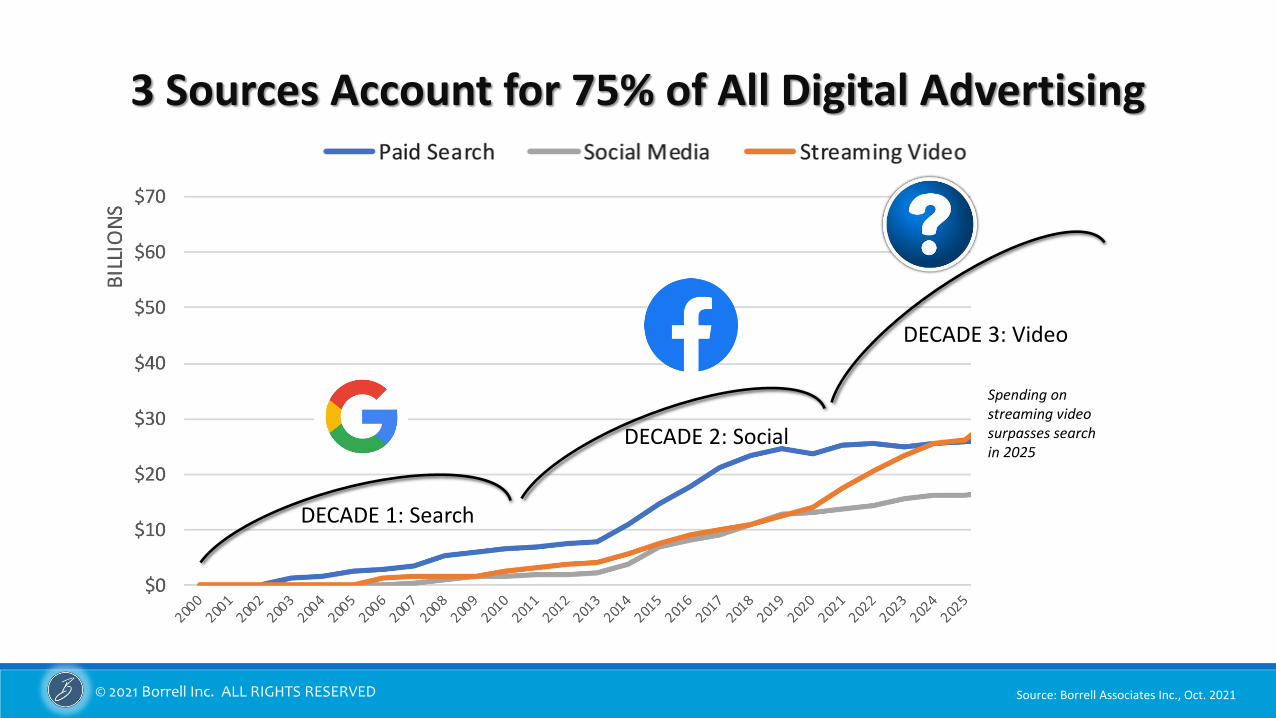
DECADE 1: Search
DECADE 2: Social
DECADE 3: Video
Source: Borrell Associates Inc., Oct. 2021
3 Sources Account for 75% of All Digital Advertising
Spending onstreaming videosurpasses searchin 2025
© 2021 Borrell Inc. ALL RIGHTS RESERVED
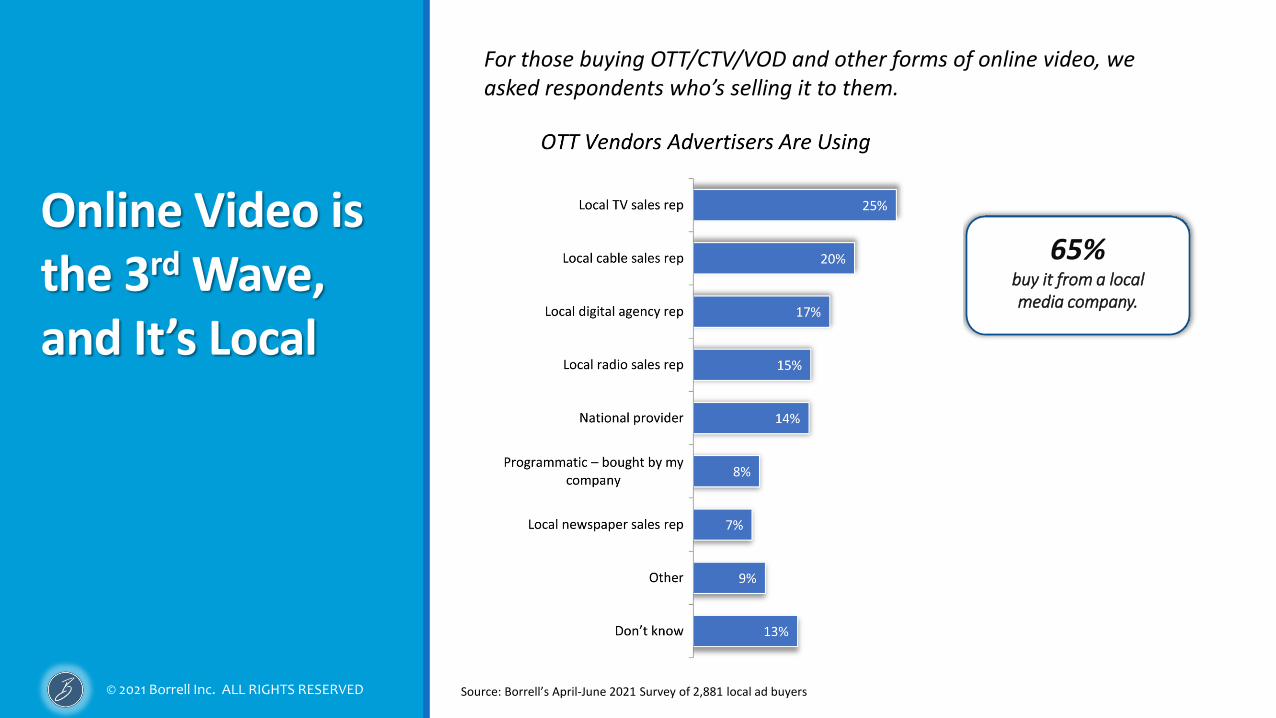
For those buying OTT/CTV/VOD and other forms of online video, we asked respondents who’s selling it to them.
65%buy it from a local media company.
Online Video is the 3rd Wave, and It’s Local
Source: Borrell’s April-June 2021 Survey of 2,881 local ad buyers
© 2021 Borrell Inc. ALL RIGHTS RESERVED
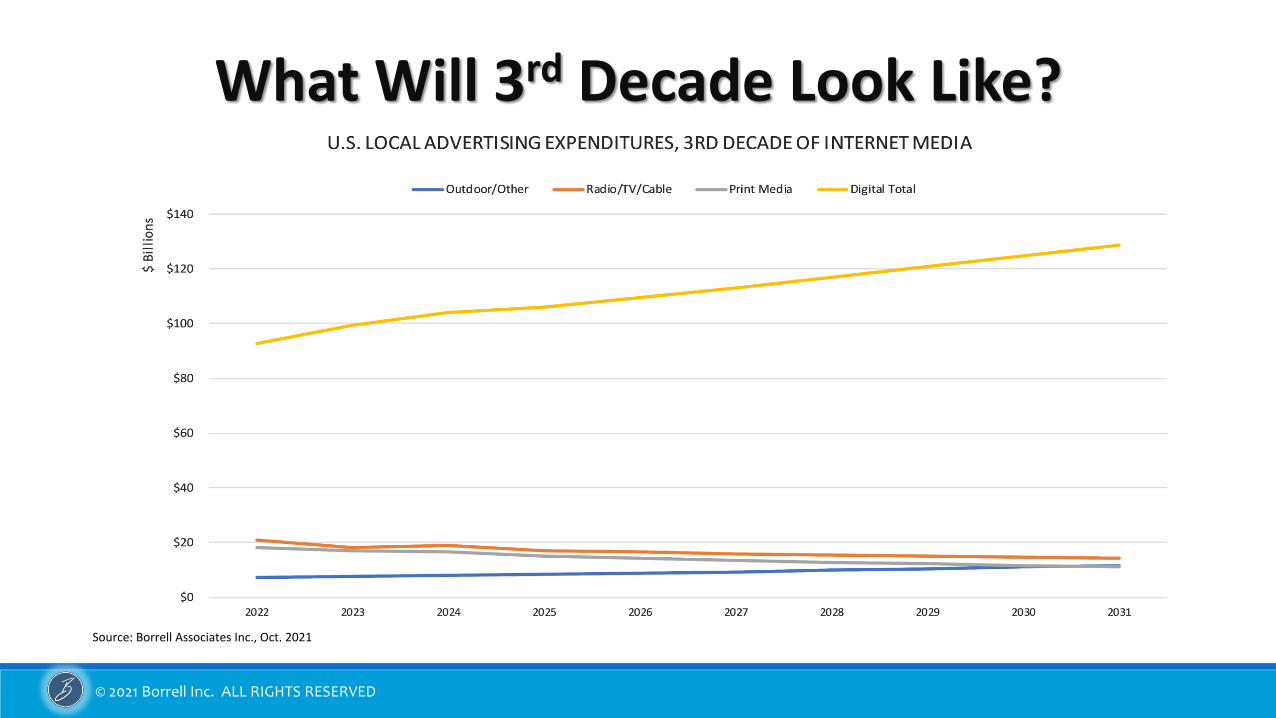
What Will 3rd Decade Look Like?
Source: Borrell Associates Inc., Oct. 2021

© 2021 Borrell Inc. ALL RIGHTS RESERVED
Built on key data from your market geography◦ Data for 2020, 2021, & 2022
◦ Advertising & Marketing/Promotions spending
◦ #, Size, & Types of Businesses
◦ Growth patterns
◦ Changes relative to rate of market recovery
◦ Interactive
◦ Full training/support from Borrell
How others are using it◦ Forecast for next year
◦ Identify businesses to pursue
◦ Set goals for sales teams
◦ Measure & track market share
◦ Identify pockets of opportunity
INFORM YOUR BUDGET, PLAN YOUR YEARWITH BORRELL’S 2022 FORECAST WORKBOOK
For a Sample Report, Visit BorrellAssociates.com
© 2021 Borrell Inc. ALL RIGHTS RESERVED
March 6-8
Google “Borrell Miami” for details