loblolly pine growth and yield prediction for managed ... · forest service loblolly pine growth...
TRANSCRIPT

Uni ted Sta tesDepar tment o fAgr icu l tu re
Fo res t Se rv i ce
Loblolly Pine Growth andYield Prediction for Managed
Southern ForestExperiment Station West Gulf PlantationsNew Or leans ,Louis iana
Research PaperSO-236
V. C. Baldwin, Jr. and D. P. Feduccia

Baldwin, V.C., Jr. and Feduccia, D.P. 1987. Loblolly pine growth and yield prediction for managed west gulf plantations. Res. Pap. SO-236. New Orleans, LA: U.S. Department of Agriculture, Forest Service, Southern Forest Experiment Station. 27 p.
ERRATA
Equation (6) and equation (7) on page 6 are both missing one instance of the gamma function that is necessary.
)1/2()1/1(2)( 222 +Γ++Γ+= cbcabaXE (6)
2/2
293
/19322
)65926.2()1/2()(
)65926.2()1/1()(2
)( acaXcaXa
XEX ccqmd ++Γ−++Γ−== (7)
Equation (12) on page 6 and equation (13) on page 8 each contain and error in the exponent term. The equations should read as follows:
Aqmd eTSHDX /45967.025968.070266.0 )()(14462.2 −= (12)
AeTSHDX /45967.022932.071401.093 )()(24213.2 −= (13)
Equation (19) on page 10 should read as follows:
babba BABAHDXX )/()(144246.5)(6102.0766348.063243.2 ,1,1 −++= (19)
In Table 10., page 14, the third and fourth dependent variables should be:
TDWob
TDWib.

SUMMARY
A growth and yield prediction system is presented for use in thinned orunthinned loblolly pine plantations in the west gulf region. The equationspredict cubic- and board-foot volume, green-weight, and dry-weight yields perunit area of wood only or wood with bark of entire tree boles, boles to any topdiameter limit, and branches. Green and dry weight of foliage can also bepredicted. Total stand yields for weight or volume are partitioned into l-inchdiameter classes to forecast stand and stock tables for all aboveground treecomponents for any stage of plantation development from ages 10 through 45.The data for this system of equations came from 859 measurements of thinnedand unthinned long-term research study plots on cutover sites located in eastTexas, Louisiana, and southern Mississippi. A computer program COMPUTE
P-LOB (Comprehensive Outlook for Managed Pines Using simulated Treat-ment Experiments-Planted Loblolly Pine) that produces the yield tables canbe obtained from the authors.
ACKNOWLEDGMENTS
The Southern Forest Experiment Station is indebted to the following organi-zations for their contributions and assistance in obtaining data for this study:
Boise Cascade, DeRidder, LAInternational Paper Co., Harrisburg, TX, and Colfax, LAGeorgia Pacific Corp., Meadville, MS and Bastrop, LAKisatchie National Forest, Pineville, LASouthwestern Timber Co., Jasper, TXRice Land and Lumber Co., Merryville, LACavenham Forest Industries, DeRidder, LA and Bogalusa, LALouisiana Office of Forestry, Woodworth, LAWe also recognize Dr. Mike R. Strub for some earlier cooperative work on
this project, Mr. Robert B. Ferguson’s programming efforts over the last2 years, and Dr. Eugene Shoulders for persistency in keeping the biometricapplications in line with silvics principles. Other scientists were at one timeresponsible for the studies that provided the data for this modeling effort. Theyare Dr. Hans G. Enghardt, Mr. Thomas E. Campbell, and Mr. William F.Mann, Jr.
Partial funding for this work was provided through a cooperative agreementwith the U.S. Department of Energy and administered by the Tennessee ValleyAuthority (contract number TV-64328A).
July 1987

Loblolly Pine Growth and Yield Predictionfor Managed West Gulf Plantations
V. C. Baldwin, Jr. and D. P. Feduccia
INTRODUCTION
Loblolly pine (Pinus taeda L.) is the most importantcommercial softwood species in the South and themost widely planted southern pine. Managers ofloblolly pine plantations need accurate and completepredictions of tree component growth and yield byweight, as well as volume, to formulate flexible man-agement policies and predict expected monetary re-turns for numerous product alternatives. There is acritical need for this information on cutover and pre-pared sites in the west gulf region.
Recently, a yield prediction system for thinnedloblolly pine plantations in this region was publishedby Matney and Sullivan (1982). However, this database consisted only of old-field plantation study data.Other thinned loblolly pine plantation models(Daniels and Burkhart 1975, Cao and others 1982,Burkhart and Sprinz 1984) utilized either old-field orcutover land data, but those data were from theSoutheast region of the United States. Only Coile andSchumacher (1964) used some cutover site data fromthe west Gulf region in the development of their yieldequations.
A growth and yield prediction system is presentedthat provides both weight and volume yields of above-ground tree components by diameter classes for lo- to45year-old thinned or unthinned loblolly pine plan-tations on cutover sites of the west gulf region. Thissystem expands the earlier work of Feduccia and oth-ers (1979) and Strub and others (19811, providing ac-curate yield forecasts for cutover sites and serving asan interim guide for yields in site prepared planta-tions.
M E T H O D S
Data
Study plots in unthinned and thinned loblolly pineplantations were established on cutover longleaf pine(Pinus palustris Mill.) forest land. In general, fre-quent wildfires burned the idle lands and prevented
natural regeneration and hardwood brush invasion.On some areas, the predominant heavy grass roughwas burned before planting; on others, it was not. Theestablished plantations had good initial survival andminimum levels of insect, disease, or other problems.
Data for unthinned stands came from control plotslocated in thinning studies and from supplementaryplots installed to include specific site, age, and initialplanting density combinations not well represented inthe existing studies. The unthinned plantation datacame from 85 unthinned research plots and from 167before-thinning measurements on thinned plantationresearch plots.
Thinned stand data came from four long-term stud-ies located in central Louisiana. The thinning inter-val in all these studies was 5 years unless insufficientgrowth had occurred during that period. Figure 1gives the geographic coverage, and tables 1 through 7provide more detailed background information aboutthe data and summarize the distribution of the obser-vations. Of the 167 thinned stand plots, all werethinned from below except 12 plots that were rowthinned.
Diameter growth of the residual trees after rowthinning was not significantly different from diame-ter growth on the residual trees on comparable plotsthat were thinned from below during the time periodcovered by these data. Therefore, all the thinnedstand data were combined and treated the same inthis modeling effort.
The average height of dominant and codominanttrees was obtained on each plot at each mesurementto determine site index. Diameter at breast height(d.b.h.) to the nearest 0.1 inch was measured for eachtree on the plot. Additionally, individual volume sam-ple trees were measured for total height, height to thebase of the full live crown, and upper stem outsidebark diameters. Where available, these trees wereselected in proportion to the total number within thediameter class.
Trees removed in thinnings were selected andmarked by the study leaders. In most cases, fellingwas done by loggers either employed or contracted by
V. C. Baldwin, Jr. is principal mensurationist with the Southern Forest Experiment Station, USDA-Forest Service, 2500 ShreveportHighway, Pineville, LA 71360; D. P. Feduccia is staff forester with the Louisiana Department of Agriculture and Forestry, Alexander StateForest, P. 0. Box 298, Woodworth, LA 71485.

HARRISON
TERREBONNE
CALCASIEU
C A M E R O NV E R M I L I O N
UNTHINNED PLOTS
Kq THINNED & UNTHINNED PLOTS
Figure l.-Geographic location by parish or county of the thinned and unthinned plantation study plots.
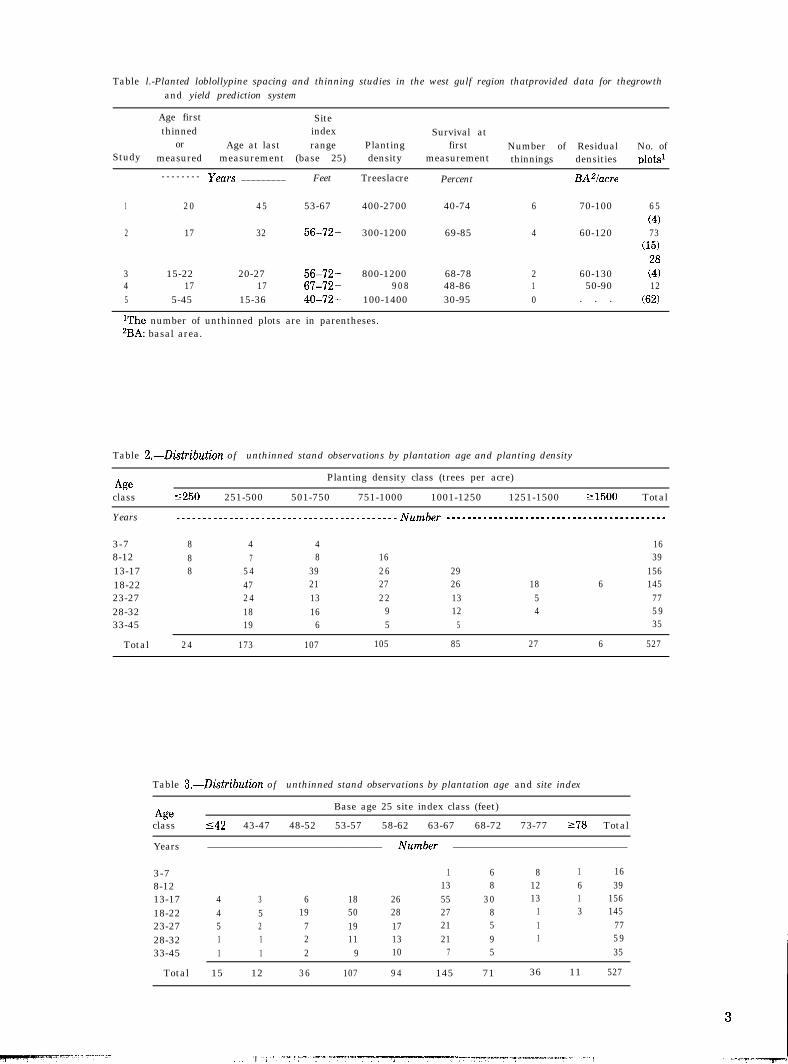
Table l.-Planted loblollypine spacing and thinning studies in the west gulf region thatprovided data for thegrowthand yield prediction system
Age first Sitethinned index Survival at
or Age at last range Planting first Number of Residual No. ofStudy measured measurement (base 25) density measurement thinnings densities plots’
-------- years _________ Feet Treeslacre Percent BA21acre
1 2 0 4 5 53-67 400-2700 40-74 6 70-100 6 5(4)
2 17 32 56-72+ 300-1200 69-85 4 60-120 73(15)
3 15-22 20-27 56-72+ 800-1200 68-78 2 60-130 z4 17 17 67-72+ 9 0 8 48-86 1 50-90 125 5-45 15-36 40-72+ 100-1400 30-95 0 . . . (62)
lThe number of unthinned plots are in parentheses.2BA: basal area.
Table 2.-Distribution of unthinned stand observations by plantation age and planting density
Ageclass 5250 251-500
Planting density class (trees per acre)
501-750 751-1000 1001-1250 1251-1500 21500 Total
Years ------------------------------------------Number ________________________________________--
3-7 8 4 4 168-12 8 7 8 16 3913-17 8 5 4 39 2 6 29 15618-22 47 21 27 26 18 6 14523-27 2 4 13 2 2 13 5 7728-32 18 16 9 12 4 5 933-45 19 6 5 5 35
Total 2 4 173 107 105 85 27 6 527
Table 3.-Distribution of unthinned stand observations by plantation age and site index
Ageclass
Years
Base age 25 site index class (feet)
542 43-47 48-52 53-57 58-62 63-67 68-72 73-77 ~78 Total
___________________________________ Number ___________________________________
3-7 1 6 8 1 168-12 13 8 12 6 3913-17 4 3 6 18 26 55 3 0 13 1 15618-22 4 5 19 50 28 27 8 1 3 14523-27 5 2 7 19 17 21 5 1 7728-32 1 1 2 11 13 21 9 1 5 933-45 1 1 2 9 10 7 5 35
Total 15 12 3 6 107 9 4 145 71 36 11 527

Table 4.-Distribution of unthinned stand observations by planting density and site index
Plantingdensity
class
Base age 25 site index class (feet)
542 43-47 48-52 53-57 58-62 63-67 68-72 73-77 278 Total
Trees _____________.____________________ Number ___________________________________
per acre
1250 3 12 9 2 4251-500 12 3 5 37 29 41 2 8 12 6 173501-750 1 4 19 16 42 12 8 5 107751-1000 3 2 13 23 15 30 13 6 1051001-1250 3 2 16 31 2 6 6 1 851251-1500 1 8 12 3 3 2721500 2 4 6
Total 15 12 36 107 94 145 71 36 11 527
Table 5.-Distribution of thinned stand observations by plantation age and site index
Ageclass 547 48-52
Base age 2.5 site index class (feet)
53-57 58-62 63-67 68-72 273 Total
Years ________._._______________________ Number __________________________________
13-17 5 15 2 8 17 5 7018-22 4 13 37 31 31 2 0 6 14223-27 3 9 36 29 2 9 19 5 13028-32 3 9 31 15 5 6333-38 3 9 3 2 16 4 6 43 9 4 5 3 9 32 16 5 65
Total 16 4 9 173 122 102 5 6 16 534
Table B.-Distribution of thinned stand observations by residual density after thinning and siteindex
Residualbasal area
class 547 48-52
Base age 25 site index class (feet)
53-57 58-62 63-67 68-72 273 Total
Ft.21acre ---------------------------------Number _________________________________
555 156-65 566-75 2 13 3876-85 8 6 5386-95 5 14 3396-105 14 2 9106-115 1 1 4116-125 1 92126 1
113113 43 02 0
49
171219
528
3153
221 5 61
2 787 2 129
1 8 81 1 5 107
1 1413 3 50
1 5
Total 16 49 173 122 102 5 6 16 534
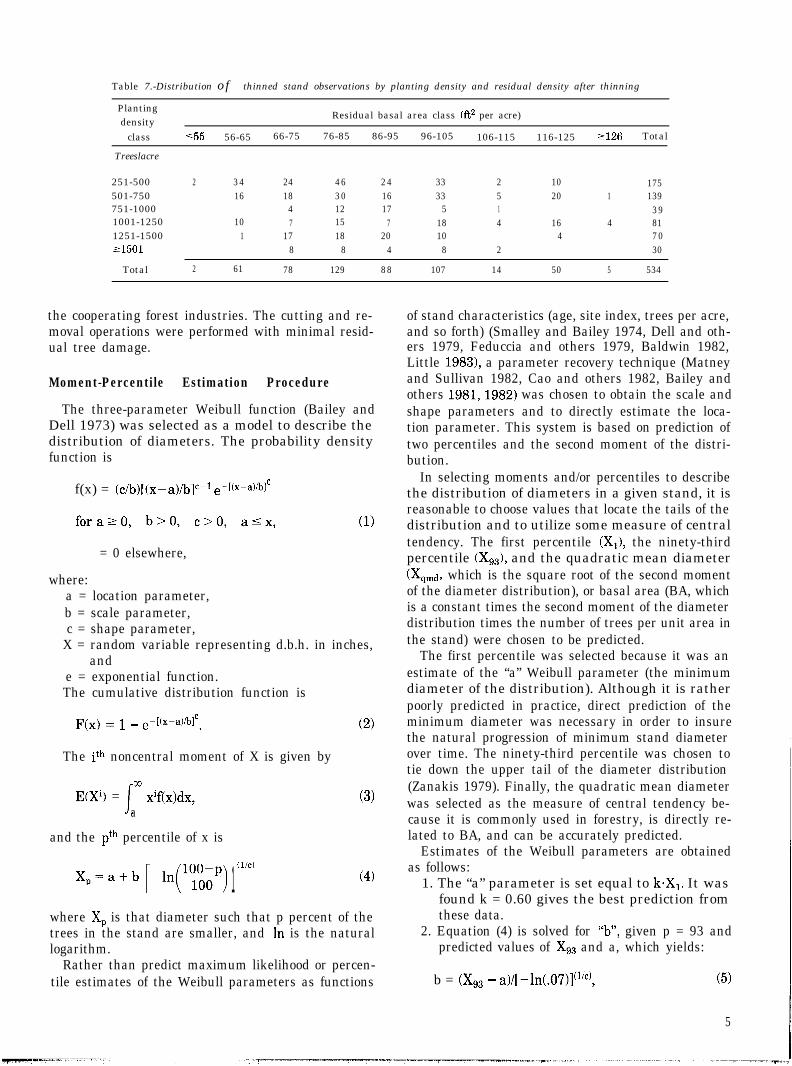
Table 7.-Distribution of thinned stand observations by planting density and residual density after thinning
Plantingdensity
Residual basal area class (ft? per acre)
class 555 56-65 66-75 76-85 86-95 96-105 106-115 116-125 2126 Total
Treeslacre
251-500 2 3 4 24 4 6 2 4 33 2 10 175501-750 16 18 3 0 16 33 5 20 1 139751-1000 4 12 17 5 1 3 91001-1250 10 7 15 7 18 4 16 4 811251-1500 1 17 18 20 10 4 7 021501 8 8 4 8 2 30
Total 2 61 78 129 8 8 107 14 50 5 534
the cooperating forest industries. The cutting and re-moval operations were performed with minimal resid-ual tree damage.
Moment-Percentile Estimation Procedure
The three-parameter Weibull function (Bailey andDell 1973) was selected as a model to describe thedistribution of diameters. The probability densityfunction is
f(x) = (c/b)[(x-a)/blc-l e-[(x-a)iblc
foraL0, b>O, c>O, alx,
= 0 elsewhere,
(1)
where:a = location parameter,b = scale parameter,c = shape parameter,
X = random variable representing d.b.h. in inches,and
e = exponential function.The cumulative distribution function is
F(x) = 1 - e-k-a)hfe
The ith noncentral moment of X is given by
(2)
i
mE(X’) = x’f(x)dx,
a
and the pth percentile of x is
(3)
X,=a+b [-in(e) 1(lid
(4)
where X, is that diameter such that p percent of thetrees in the stand are smaller, and In is the naturallogarithm.
Rather than predict maximum likelihood or percen-tile estimates of the Weibull parameters as functions
of stand characteristics (age, site index, trees per acre,and so forth) (Smalley and Bailey 1974, Dell and oth-ers 1979, Feduccia and others 1979, Baldwin 1982,Little 1983), a parameter recovery technique (Matneyand Sullivan 1982, Cao and others 1982, Bailey andothers 1981,1982) was chosen to obtain the scale andshape parameters and to directly estimate the loca-tion parameter. This system is based on prediction oftwo percentiles and the second moment of the distri-bution.
In selecting moments and/or percentiles to describethe distribution of diameters in a given stand, it isreasonable to choose values that locate the tails of thedistribution and to utilize some measure of centraltendency. The first percentile (X1), the ninety-thirdpercentile (X9,), and the quadratic mean diameter(Xqmd, which is the square root of the second momentof the diameter distribution), or basal area (BA, whichis a constant times the second moment of the diameterdistribution times the number of trees per unit area inthe stand) were chosen to be predicted.
The first percentile was selected because it was anestimate of the “a” Weibull parameter (the minimumdiameter of the distribution). Although it is ratherpoorly predicted in practice, direct prediction of theminimum diameter was necessary in order to insurethe natural progression of minimum stand diameterover time. The ninety-third percentile was chosen totie down the upper tail of the diameter distribution(Zanakis 1979). Finally, the quadratic mean diameterwas selected as the measure of central tendency be-cause it is commonly used in forestry, is directly re-lated to BA, and can be accurately predicted.
Estimates of the Weibull parameters are obtainedas follows:
1. The “a” parameter is set equal to k.X1. It wasfound k = 0.60 gives the best prediction fromthese data.
2. Equation (4) is solved for “b”, given p = 93 andpredicted values of X,, and a, which yields:
b = (X,, - a)/[-ln(.07)l(1’c), (5)
5

and this expression is substituted into the equa-tion for E(X2). In its solved form it is (from equa-tion (3) with i = 2)
E(X2) = a2 + 2 abI(l/c + 1) + b2(2/c + 1). (6)
The resulting expression is:
X2qmd = E(X2) =2a (Xs, - a)IYl/c + 1)
(2.65926)1’c
+ (X9, - aI2 (2/c + 1)(2.65926)2’c
+ a2 (7)
where I(=) = the gamma function evaluated atthe point(m).
3. Equation (7) is set equal to zero and is solved bynumerical techniques to obtain an estimate, c, ofthe shape parameter.
4. Finally, c is substituted back into equation (5) toobtain an estimate of the scale parameter b.Thus with estimates of a, b, and c, the Weibulldistribution of diameters in that stand can becompletely described. This fundamental proce-dure is repeatedly utilized to describe diameterdistributions in unthinned stands, residualstands after thinning, and thinned stands at anyparticular age desired by the user.
Growth and Yield Prediction System Options if only TP is known, or by
This prediction system allows a user to begin theprocess by: starting and ending with an unthinnedstand, starting with an unthinned stand and endingwith a stand thinned one or more times, or startingwith a previously thinned stand and ending with astand thinned one or more times.
Required input information when starting with aninitially unthinned stand includes stand age fromplanting (A), average height of the dominant andcodominant trees (HD), and surviving trees per acre(TS). If HD or TS is unknown, then site index (SD,basal area per acre (BA), or trees planted per acre (TP)are input variables that can be substituted for therequired site and density measures.
TS = [o ()2P&y.J (HD)l.40533 e0.91934/A BA-l]-2.08056(10)
if only BA is known, where A, HD, and BA are initialage, initial average height of the dominants andcodominants, and initial basal area per acre, respec-tively.
Given this initial information, the current standcan be described as mentioned before. The stand di-ameter attributes Xi, Xqmd, and Xss are predicted asfollows:
When starting with a previously thinned stand, thesystem requires A, HD, and TS. As in the unthinnedcase, an estimate of SI can be substituted for HD.Furthermore, if an estimate of TS is not known, it canbe predicted by providing the stand age and the resid-ual trees surviving (TS,) at the time of the last thin-ning. Figure 2 summarizes the prediction systemprocess.
x1 = 2.14462 (HD)0.70266 (TS)-0.36282 e-1.96895/A (11)
n = 527 FI = 0.63 SE = 1.04 in,
Xgmd = 2.14462 (HD)0.70266 (TS)-0.25968 e-O.459671A (12)
n = 527 FI = 0.91 SE = 0.60 in,
‘FI = Fit Index = {lG[Z(Yi - ~i)‘]/[C(Yi - WI}2S~ = Standard error of the estimate
PROCEDURES AND EQUATIONS
Yield Prediction in Unthinned Stands
If height of the dominant and codominant trees isnot available as an input, it is predicted using a givensite index function. The following site index equationis solved for dominant height:
HJ) = SI [2.14g15 (1 - e-O.O25O42 A)]O.755862
n = 1061 FI1 = 0.78 SE2 = 6.23 ft
where:
(8)
SI = site index (feet) at base age 25,HD = average height (feet) of dominants and
codominants,A = plantation age (years),e = exponential function.
Figure 3 illustrates the characteristics of site indexfunction for various index values for base age 25.
If initial survival (TS) in terms of trees per acre isnot known, the variable can be predicted using thefollowing equation derived from Feduccia and others(1979):
TS = TP/{EXP [A, (0.013480 In (TP)
+ 0.00139956 (HD)
- 0.01937002 (HD).5)1} (9)

Initial unthinned stand inputs
*Height of dominants and codominantsor site index
*Stand age
* T r e e s p e r a c r e , o r
Basa l a rea per acre , or
Trees planted per acre
LUBLOLLY PINE PLANTATION GROWTH AN0 YIELD PREOICTION SYSTEM
Initial thinned stand inputs
*Height of dominants andcodominants or site index
*Stand age
*Trees per acre, or
Residual trees per acre afterlast thinning and age lastthinned
Recover Weibull Parametersand output for initial conditions
if desired
Project unthinned stand
I
Thin the stand to theresidual BA or TSdesired
I
Project thinned stand
I Predict
HO2 ,TS, JIMIN ,QMO, ,P932
a t A2
Predict
H02,TS2,0flIN2.QM02, P932
Recover Weibull Parameters Recover Weibull parameterand output desired volume, and output desired volumeweight information by weight information bydiameter classes diameter classes
Recover Weibull Parametersand output desired volume,weight information bydiameter classes
~ Projectgrowtho funthinnedstand
T h i nt h estand
I 1
* Preferred inputs
Project growth oft h i n n e d s t a n d
P r o j e c tgrowtho ft h i n n e dstand
*I
Figure 2.-Schematzc diagram summarizing the operation of the yield prediction system.

110--xi-l Predicting Stand Attributes After Thinning
1 0 0 -
48 0 -
I2 0
I I I I I1 0 1 5 2 0 25 30 3 5 4 0
P L A N T A T I O N A G E ( Y E A R S )
Figure 3.-Height of dominants and codominants by planation agefor site indices 40-80.
X9, = 2.24213 (HD) 0 7 1 4 0 1 (TS)-O.22932 e-O.45967/A (13)
n = 527 FI = 0.91 SE = 0.74 in
This system of equations was constrained to insurethat Xi 5 Xqmd 5 Xg3. The constraining was accom-plished in this case by using the same model form andpredictor variables for each equation. It was insistedthat during the fitting process comparable coefficientsin equation (11) were always 5 the comparable coeffi-cients in equation (12) and that comparable coeffi-cients in equation (13) were always 2 the comparablecoefficients in equation (12). With estimates of Xi,Xqmd, and x93, the Weibull parameters can then beestimated.
Predictions of future stand attributes and, hencefuture stand table information in unthinned stands,are accomplished first by projecting TS from Ai to A2using the following equation:
TS2 = 100 {(TS,/100)-0s7372
+ (0.01859 - 0.3912OSI) [(A2/10)2.11g47
_ (A,/10)2.“947]}~‘.14454 (14)
n = 224 FI = 0.95 SE = 37 trees/acre
where: TSi, TSs = number of trees surviving per acreat times Al and A,, respectively.
Equation (8) is then employed to obtain an estimateHD2 at A2, and then these predictions of HD,, TS2, andAa are substituted for HD, TS, and A in equations (11)- (13) to obtain the new predictions of Xl, Xqmd, andX9, at A2.
Figures 4 through 7 give examples of the behaviorof these functions over time for selected site index andinitial density values.
8
The residual stand after thinning is determined byprediction of “thinned” values of Xl, Xqm& X9,, TS,and BA, followed by recovery of the new Weibullparameters, as already explained.
Many types of thinning could easily have been mod-eled and built into the prediction system. However,since these data represent stands essentially thinnedfrom below, only that thinning option was included inthis yield prediction system.
The low thinning in the study plots was not strictlya process of removing only the suppressed and inter-mediate trees until the desired leave-tree basal areaper acre was obtained. Spacing, stand uniformity, andstand vigor were also factors of equal weight. In somecases, especially during the first thinning, codomi-nants or even dominants were removed if they weredeformed or diseased, or if large “holes” would haveotherwise been left in the stand.
Graphical examination of the diameter distribu-tions before and after thinning showed the mostchange occurred in both shape and location after thefirst thinning, the next greatest after the second thin-ning, and so forth. It was determined that the data, atleast for thinnings beyond the second, should be com-bined. In some cases, the data beyond the first thin-ning should be combined. The attribute (Xi, X,,& X9,)equations for these groups were tested using an anal-ysis of covariance procedure (Freese 1964, Milliken1982) to see if there was some statistical, as well asvisual, justification for combining or separating someor all of the equations. The tests3 indicated Xl, andXqmd predictions would be much less variable if therewas one set of equations to accomplish this for the firstthinning and another set for all subsequent thin-nings. The tests also showed that Xl prediction wouldbe less variable and Xqmd predictions slightly lessvariable if there was also a separate set of equationsfor the second thinning, as well as a set for the firstthinning and a set for all subsequent thinnings. In allcases there were no significant differences for X9, pre-dictions. For the sake of simplicity, only two sets ofequations were chosen: one to predict the residualstand after the first thinning and another set to pre-dict the residual stand after all subsequent thinnings.
3The test of the hypothesis that the regressions (to predict X,,Xqm~, Xga after a thinning) for the first thinning should be keptseparate from the others rather than one overall regression be used,yielded calculated F4,eos values of 16.11, 14.94, 2.21 for XI, Xqmd,and Xo,, respectively. The test of the hypothesis that the regres-sions for the second thinning should be kept separate from the 2ndthrough last thinnings rather than the 2nd through last thinningregressions be combined into one overall regression, yielded calcu-lated F4,493 values of 7.67, 3.30, 0.86 for XI, Xqmd, and Xaa respec-tively.
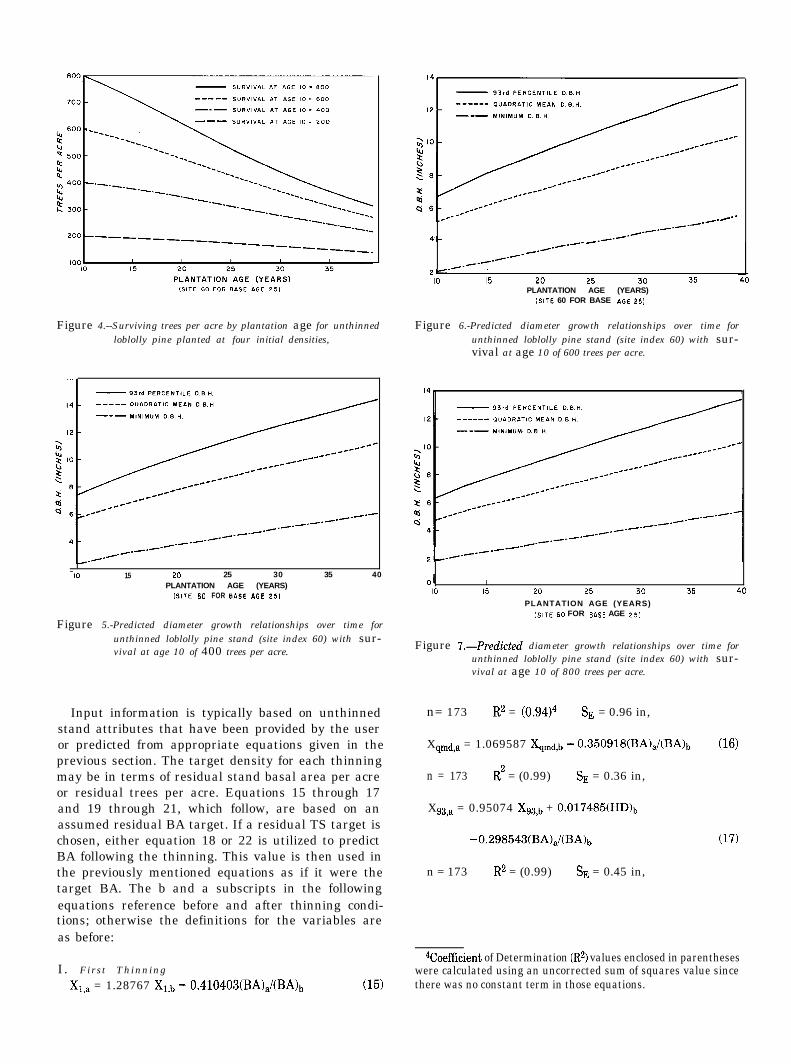
Figure 4.--Surviving trees per acre by plantation age for unthinnedloblolly pine planted at four initial densities,
-10 15 20 25 30 35 40PLANTATION AGE (YEARS)
(SITE 60 FOR BASE AGE 25,
Figure 5.-Predicted diameter growth relationships over time forunthinned loblolly pine stand (site index 60) with sur-vival at age 10 of 400 trees per acre.
Input information is typically based on unthinnedstand attributes that have been provided by the useror predicted from appropriate equations given in theprevious section. The target density for each thinningmay be in terms of residual stand basal area per acreor residual trees per acre. Equations 15 through 17and 19 through 21, which follow, are based on anassumed residual BA target. If a residual TS target ischosen, either equation 18 or 22 is utilized to predictBA following the thinning. This value is then used inthe previously mentioned equations as if it were thetarget BA. The b and a subscripts in the followingequations reference before and after thinning condi-tions; otherwise the definitions for the variables areas before:
I. First Thinning
X1,, = 1.28767 Xl,b - 0.410403(BA),/(BA),, (15)
I*-
-.-----.-.--
-A---
4-
zl-
~(~/--------/e/.----
I I I I I10 15 20 25 30 35
140
PLANTATION AGE (YEARS)(SITE 60 FOR BASE AGE 25,
Figure 6.-Predicted diameter growth relationships over time forunthinned loblolly pine stand (site index 60) with sur-vival at age 10 of 600 trees per acre.
01 I I I I 1 IIO 15 20 25 30 35 40
PLANTATION AGE (YEARS)(SITE 60 FOR BASE AGE 251
Figure 7.---Predicted diameter growth relationships over time forunthinned loblolly pine stand (site index 60) with sur-vival at age 10 of 800 trees per acre.
n= 173 R2 = (0.94j4 SE = 0.96 in,
Xqmd,a = 1.069587 Xqmd,b - 0.350918(BA)$(BA),, (16)
n = 173 R2 = (0.99) SE = 0.36 in,
Xs3,a = 0.95074 Xs3,b + 0.017485(HDjb
-0.298543(BA)$(BA)b (17)
n = 173 R2 = (0.99) SE = 0.45 in,
4CoefEcient of Determination (R2) values enclosed in parentheseswere calculated using an uncorrected sum of squares value sincethere was no constant term in those equations.

BA, = BA,Jl - (1 - TS,/TSb)0.83888]0.71395
n = 173 FI = 0.85 SE = 7.9 ft2
II. Subsequent thinningsX1,, = 2.63243 + 0.766348X1,b
(18)
- E~144246(BA),/(BA)~ (19)
n = 501 R2 = 0.82 SE = 1.17 in,
Xv&a = 1.278159 + 0.953873Xq,d,1, + 0.008981(HD)b
- 1.265008(BA),/(BA)b (20)
n = 501 R2 = 0.98 SE = 0.29 in,
X 93,a = 1.084635 + 0.972118X93,b - 0.67333(BA),/(BA),(21)
n = 501 R2 = 0.96 SE = 0.48 in,
BA, = BAb[l - (1 - TS,/TS&)0.85566]0.56963 cm
n = 501 FI = 0.95 SE = 3.5 ft2
In those cases where the residual density is speci-fied as basal area per acre, the number of residualtrees after thinning is obtained directly from the rela-tionship
(TS), = (BA),/0.005454(Xq,d,a)” (23)
where Xqmd a, is predicted using equation (16) or (201,as appropriate.
Thinned Stand Predictions
Equations in the thinned stand section of the yieldsystem take either predicted or user supplied after-thinning stand information at age A, and projectthese values into the future to time A, to providestand table predictions at the new age. The samestand diameter and height attributes as used else-where are also predicted here, and these values areused to obtain Weibull parameters for description ofthe new stand.
The equations for prediction of diameters at a sec-ond age in thinned stands are
Xl,, = [-529.8956 + 059995(TS,)
+ 5298956(A,/A,) - 0.59995(TS),(A2/A,)
+ (A,/A,)(X, 1)3.39763]1/3.39763 (24
n = 534, FI = 0.88, SE = 0.97 in,
10
Xqmd,2 = [ - 109.9872 + 0.12169(TS1) + 109.9872(A2/A1)
- 0.12169(TS1)(A2/A1)
+ (&/A1)(xqmd,l)2~3ggg8]1’2~3ggg8 (25)
n = 534, FI = 0.98, SE = 0.33 in,
Xg3,2 = [ - 146.8410 + 0.15597(TS1) + 146.8410(A2iA1)
- 0.15597(TS1)(A2/A1)
+ (A2/A1)(Xg3,,)2.33778]1’2.33778
n = 534, FI = 0.97, SE = 0.48 in.
where
(26)
Xi,i, Xi,z = smallest diameter tree at time A,,and at time AZ, respectively,
x Xqmd,2qmd,l 7 = quadratic mean diameter at timeA,, and at time A,, respectively,
x93,1, x93,2 = 93rd percentile diameter at time A,,and at time A2, respectively.
The equation for prediction of survival in thinnedstands is
TS2 = 100{(TS1/100)-1~066gg + (0.00941
+ 15.43171SI) [A2/10)o.2g683
_ (A,/10)0.29683]}-0.93722 (27)
n = 534 FI = 0.98 SE = 15.6 trees/acre
TSi = initial trees surviving per acre.
In figures 8 through 10, the behavior of these func-tions is illustrated for one site index value assumingsome common post-first thinning densities and no fur-ther thinning.
It must be noted here that equations 24, 25, and 26are not time invariant. In other words, given anordered time sequence ti, t,, t3, predictions for valuesof the variables at time t3 based on initial values attime t, (t,-+t,) will not be exactly the same as those attime t, that were projected from those at time t2,which were based on those at time ti (tl-+t2+t3). Timeinvariant equations, which are desirable, were devel-oped and tried, but the precision of predictions fromthe equations presently given, when used in conjunc-tion with equation 27, was much better than the pre-cision of the predictions from the time invariant set ofequations.
Nevertheless, this improved precision can be lost ifthe projection interval length differs much from 5years, the data measurement interval length. There-fore, to achieve the most reliable and consistent pre-

I I I I I15 20 25 30 35 40
PLANTATION AGE (YEARS)(SITE 60 F O R B&SE AOE 25)
Figure 8.-Predicted diameter growth relationships over time forloblolly pine stand (site index 60) thinned once at age 15to 300 trees per acre.
___----____-----
___----
___---___----
___---
__/--Y __/--pi 6 /----
_.__A---- _----
0 ; ___c_c-----
4- ./--._.A--
.A--
e-
0 I15 20 25 30 35 40
PLANTATION AGE (YEARS)(SITE 60 F O R MSE IlaC 25,
Figure B.-Predicted diameter growth relationships over time forloblolly pine stand (site index 60) thinned once at age 15to 500 trees per acre.
- 93d PERCENTILE 0 B H.
___--- ___---
__/-- __/-- __/--
-.-- ____c_---------
/~c/------__----
,.A-.
I I I
2 0 25 30 35PLANTATION AGE (YEARS)
(SITE 60 FOR B&SE AGE 25)
4 0
dictions with this system of equations, after-thinninggrowth projection intervals should be in multiples of5 years with the final projection, if required, done overthe remaining years.
Volume and Weight Prediction
Stand tables are generated at any age by apportion-ing the total number of trees surviving into l-inchdiameter classes according to the predicted Weibulldistribution for that age. The average total height ofall trees within a diameter class is predicted with thefollowing equations:5
H = exp11.203241 + 0.751234 ln(HD) - 1.767749/A
+ 0.048913 ln(TS/D)
+ 9.057581/(A)(D) - 3.113997/D] Cm
n = 7872 FI = 0.94, SE = 3.45 ft,
for trees in unthinned stands, and
H = expl1.124364 + 0.80562 In (HD) - 3.880531/A
+ 0.049332 ln(TS/D)
+ 42.279443/(A)(D) - 4.816993/D] (29)
n = 6007 FI = 0.90 SE = 3.34 ft,
for trees in thinned stands, where:H = mean predicted height of a tree, in feet,D = d.b.h., in inches, represented by the midpoint of
a diameter class.Given the mean height and midpoint of the diame-
ter class for all the predicted numbers of trees, thefollowing measurements are calculated for each aver-age tree: cubic foot volume, green weight, or oven-dryweight of the total stem or stem to a merchantable topdiameter limit, either inside or outside bark. Thisquantity is then multiplied by the predicted numberof trees per acre in that diameter class to obtain thevolume or weight per acre for each diameter class.Finally, the stand averages are obtained by summa-tion over all diameter classes.
Board-foot volume for trees with d.b.h(o.b.) 2 10inches to an o.b. top diameter of 8 inches is also pre-dicted. The user may elect to use either the Doyle,Scribner, or International l/4-inch log rules.
Figure lO.-Predicted diameter growth relationships over time forloblolly pine (site index 60) thinned once at age 15 to700 trees per acre.
5Equations 28 and 29 are presented in arithmetic form with FIand SE in arithmetic units although the equations were fitted inlogarithmic form!,
11

This procedure requires predictions of i.b. diame-ters at various log heights and also the prediction ofheight to the B-inch (o.b.) top diameter, of each aver-age tree in each diameter class L 10 inches. Our stemtaper data were fitted to the Max and Burkhart (1976)model in order to provide equations for these predic-tions. The model is presented below and the parame-ter coefficients and supporting statistics (Baldwin andFeduccia 1987) are given in table 8:
d2- = b,(X - 1) + b2(X2 - 1) + bJa, - Xj211D2
+ b4(a2 - Xj212 (30)
where:
Ii =[
1, ifX5ai
0, if X > aii = 1,2
d = stem diameter i.b. or o.b. (inches) at any givenheight, h,
D = d.b.h. (inches) o.b.,X = h/H,h = height (feet) at which diameter is to be deter-
mined (%H),H = tree total height (feet),ai = join points estimated from the data andbi = coefficients estimated from the data.
There are separate equations for height or diameterprediction of trees from unthinned stands (or treesfrom stands thinned less than 5 years previously) andfor trees from stands thinned 5 or more years earlier.
The volume and weight model selected was that ofSchumacher and Hall (1933). It is
In (Y) = bi + b2 In (D) + b, In (H) (31)
where bi, bat bs are coefficients to be estimated fromthe data, and Y represents either cubic-foot volume,green weight, or dry weight of appropriately definedtree components.
Table 8.-Regression coefficients for a stem-taper model useful in predicting upper stem diameters at a specifiedheight given breast-height diameter and total tree height.’
Dependentratio2 b
Unthinned standsdob2/D2 -8.07778dib2/D2 -4.58266
Thinned standsdob2/D2 -13.31391dib2/D2 -7.43322
‘The model is:
b
4.025422.24195
6.730983.74079
Parameter estimates
b3 b
>3.65499 229.739-2.34978 138.546
-6.65501 203.959-4.03111 191.149
al a2
0.89406 0.057030.80645 0.05980
0.91195 0.060350.85190 0.04833
Statistics3
FI SE
0.95 0.110.97 0.07
0.96 0.080.95 0.07
-$ = bl(X - 1) + b2(X2 - 1) + b3(a1 - Xl2 I, + b4(a2 - Xl2 I2
where: Ii =
[
1, ifXsai
0, if X > aii = 1,2
d = stem diameter Lb. or o.b.D = d.b.h. (inches) o.b.,X = h/Hh = height (feet) at which diameter is to be determined (sH),H = tree total height (feet),ai = join points estimated from the data, andbi = coeffkients estimated from the data.
2dob = diameter o.b. at any given height, h.dib = diameter i.b. at any given height, h.
D = d.b.h. (inches) o.b.
3FI = (1 - [C(Yi - Pi)2]/‘[Z(Yi - Y)‘]}
where: Yi =Jo
D2 $ and Y,= di.
SE = Standard error of the estimate in original units.

As explained in Baldwin (1987) and Baldwin andFeduccia (19871, this model was best when fitted sep-arately to cubic-foot volume stem data from thinnedstands and from unthinned stands. It also worked wellwhen utilized to develop equations to fit both weightand volume of various crown components with un-thinned and thinned stand tree data combined. How-ever, an age variable, A2, was added to provide moreprecise predictions of total stem green and dry weightfrom combined thinned and unthinned stand data.
Therefore, combined data from both thinned andunthinned plantations were fitted to Schumacher andHall’s model to predict the following yield compo-nents:
(1) cubic-foot volume, green weight, and oven-dryweight of branch wood and branch bark, and
(2) green and dry weight of the foliage.Combined data were also fitted to this model, with
the age variable added, to predict green-weight andoven-dry weight of the main stem. To precisely predictcubic-foot volume (o.b. and i.b.) of the main stem, sep-arate equations using the Schumacher and Hallmodel were developed from the thinned stand dataand from the unthinned stand data. Coefficients forall of these equations and accompanying fit statisticsare found in tables 9 through 11.
Merchantable cubic-foot volume and green and dryweight of the main stem (i.b.or o.b.) to any top diame-
ter limit (i.b. or o.b.1 are obtained from equations de-veloped from the following ratio model (Van Deusenand others 1981, Parresol 1983):
R = exp[b,(dbz/Db3)l
where:
(32)
R = predicted ratio of merchantable to totalvolume (cubic feet) or weight (green ordry weight in pounds),
bi, b2, b3 = coefficients estimated from the data.The coefficients, from Baldwin (1987) and Baldwinand Feduccia (19871, are given in table 12.
Testing
To avoid unneccessarily weakening the develop-ment data set, a subset of the development data wasnot withheld for testing purposes; instead it was de-cided to later validate against truly independent datasets. However, to make sure the combined system ofequations behaved well. as a unit, the completedgrowth and yield predictions system was testedagainst the data used to develop it. The tests verifiedthat predicted values were close to those observed.
The prediction phases tested were: initial predic-tion in an unthinned stand, growth prediction in anunthinned stand, residual stand after thinning, andgrowth prediction in a thinned stand. In each case
Table 9.-Regression coefficients for total stem volume’
DependentParameter estimates
variable2 bl b b3
Unthinned standsTVob -5.731735 1.896449 1.010252TVib -6.897192 1.836827 1.245844
Statistics3
FI SE c v
0.99 1.93 11.20.98 1.96 13.6
Thinned standsTVob -5.816087TVib -6.835331
2.036340 0.953537 0.99 2.93 10.82.040995 1.150022 0.98 3.50 15.6
‘The model is:
In(Y) = b1 + b21n(D) + b&(H)
where:Y = predicted stem volume (cubic feet) from a 6-in stump to the stem
tip,D = diameter outside bark (inches) at 4.5 feet,H = total tree height (feet), and
br, b2, ba = coefficients estimated from the data.
2TVob = total stem volume outside bark.TVib = total stem volume inside bark.
3Fit Index (FI) = (1 - [C(Yi - Pi)2]/[C(Yi - yj2]}
SE = Standard error of the estimate in original units.CV = Coefficient of variation in percent.

Table lO.-Regression coefficients for total stem weight equations’
Dependentvariable2 b,
Parameter estimates
b2 b3 b4
Statistics3
FI SE CV
TGWob -2.06033 1.93926 1.05077 .000061 0.99 153.4 11.4TGWib -2.53232 1.96524 1.12691 .000060 0.99 152.9 12.4TGWob -3.31353 1.91029 1.19118 .000076 0.99 70.1 10.5TGWib -4.20913 1.87667 1.38064 .000088 0.99 69.0 11.8
‘The model is:
In(W) = b; + b21n(D) + b&(H) + b4A2
where:W = predicted stem volume (pounds) from a 6-in stump to the stem tip,D = diameter outside bark (inches) at 4.5 feet,H = total tree height (feet),A = age from planting, and
b;, b2, ba, b4 = coefficients estimated from the data.
2TGWob = total stem green weight outside bark.TGWib = total stem green weight inside bark.TDWob = total stem dry weight outside bark.TDWib = total stem dry weight inside bark.
3Fit Index (FI) = {l - [B(Yi - Pi)2]/[~(Yi - Y)‘]}
SE = Standard error of the estimate in original units.CV = Coefficient of variation in percent.
Table Il.-Regression coefficients for crown green and dry weight equations1
Dependentvariable2
bo
Parameter estimates
bl b2 FI
Statistics3
SE CV
CGWW 1.735217 3.492293 - 1.243386 0.90 61.5 41.2CDWW 0.379049 3.454388 - 1.088445 0.90 28.5 41.3
CGWB 1.203148 3.023912 - 1.136030 0.85 14.6 36.9CDWB 0.264828 3.033934 -1.109824 0.86 6.9 38.2CGWF 3.652443 2.864732 - 1.454774 0.86 25.1 32.4
CDWF 2.796233 2.912819 -1.474651 0.85 11.4 33.5
‘The model is:
In(W) = bo + brln(D) + b&(H)
where:W = predicted weight (pounds) of crown component,D = diameter outside bark (inches) at 4.5 feet,H = total tree height (feet), and
bo, br, b2 = coefficients estimated from the data.
2CGWW = crown green weight of wood.CDWW = crown dry weight of wood.CGWB = crown green weight of bark.CDWB = crown dry weight of bark.CGWF = crown green weight of foliage.CDWF = crown dry weight of foliage.
3Fit Index (FI) = (1 - [C(Yi - Pi)2]/[C(Yi - Y)2]}
SE = Standard error of the estimate in original units.CV = Coefficient of variation in percent.
14

Table 12.-Regression coefficients for volume and weight ratio equations1
Dependentvariable2
Unthinned standsMVoblTVobMVib/TVibMGWobTGWobMGWib/TGWibMDWob/TDWobMDWibTDWib
Thinned standsMVoblTVobMViblTVibMGWob/TGWobMGWib/TGWibMDWob/TDWobMDWib/TDWib
Parameter estimates Statistics3
bo bl b FI SE
-0.799015 4 .975752 4.686168 0.98 0 .048-0.938014 4.950338 4.706034 0.98 0.049-1.153726 4.911545 4.723876 0.97 0.050-1.171351 4.957184 4.772917 0.97 0.055-0.842507 5.128205 4.854891 0.97 0.060-0.932732 5.101845 4.857412 0.96 0.059
-1.718906 5.261784 5.262902 0.97 0.053-2.177444 5.239462 5.314077 0.97 0.057-2.058914 5.124867 5.170415 0.97 0.050-2.075039 5.171997 5.218171 0.97 0.056- 1.875204 5.346034 5.397755 0.96 0.060- 2.020278 5.367307 5.436636 0.97 0.057
iThe ratio model is:
R = exp[bo(db1/Db2)],
where:R = predicted ratio of merchantable to total volume (ft3) or weight (pounds),d = upper stem diameter limit (inches, o.b.)D = diameter o.b. (inches) at 4.5 feet, and
bo, bi, b2 = coefficients estimated from the data.
2 MVob = Merchantable volume outside bark.TVob = Total volume outside bark.MVib = Merchantable volume inside bark.TVib = Total volume inside bark.
MGWob = Merchantable green weight outside bark.TGWob = Total green weight outside bark.MGWib = Merchantable green weight inside bark.TGWib = Total green weight inside bark.
MDWob = Merchantable dry weight outside bark.TDWob = Total dry weight outside bark.MDWib = Merchantable dry weight inside bark.TDWib = Total dry weight inside bark.
3Fit Index (FI) = {l - [Z(Yi - Pi)2]/[~(Yi - Q2]}
SE = Standard error of the estimate in original units.
predicted values of stand and yield table variableswere compared with their respective observed values.Mean predicted, mean observed, correlation coeffi-cient, mean difference, and mean percent differencestatistics were calculated. Results of these tests arefound in tables 13 through 17. Note that with thegeneral exception of the two lowest percentiles (Xiand Xi,), which are highly variable, nearly all theother stand and yield table variables were predictedwithin +-5 percent of the observed values.
These statistics, along with the Fit Index andStandard Error of the estimate statistics presented foreach separate prediction equation within the system,indicate that the entire system accurately predictsgrowth and yield within the stands from which it wasdeveloped. This system should provide good results
when used to make predictions in similar loblolly pineplantations.
Validation of the unthinned stand prediction sys-tem is in process, and a later publication will reportthese results and any necessary system updates if re-quired. Validation of the thinned stand system will beaccomplished as soon as an independent data set isavailable.
DISCUSSION AND RESULTS
Trends
Prediction trends for unthinned plantations andthinned plantations and some comparisons of resultsbetween those two management alternatives arenoted. In most cases, 700 trees per acre planted (about
15

Table 13.-Comparison of some observed versus predicted stand and yield table variables for initialvalues in an unthinned stand
ParameterXl6x10
x17
x24
x50
x63
X82
x 9 3
x 9 7
X qmdB AVOL
Mean Mean Correlation Mean Mean percentpredicted1 observed2 coefficient3 difference* difference5
3.48 3.34 0.80 0.14 19.844.97 4.79 0.84 0.18 6.825.51 5.47 0.90 0.03 2.475.92 5.96 0.92 -0.04 0.817.13 7.25 0.95 -0.12 -0.697.70 7.82 0.95 -0.11 -0.638.69 8.75 0.96 -0.06 0.059.61 9.66 0.96 -0.05 0.08
10.26 10.45 0.93 -0.20 -1.227.33 7.37 0.96 -0.04 0.17
127.92 130.26 0.92 -2.33 1.113298.0 3317.0 0.97 -9.04 -1.38
lMean predicted value = F = Z P,in
2Mean observed value = b = I: Oi/n
3Correlation coefficient = r =X[(Pi - P)(Oi - 011
~/B(Pi - P)‘Z(Oi - 0)’
*Mean difference = d = B (Pi - OJn
5Mean percent difference = %d = lOO/nC(Pi - Oi)/Oi
sxi, i = l-97, are the ith percentile values of the variable X.X ,& = Quadratic mean diameter (in).BA = Basal area per acre (ft?VOL = Total ft3 volume.
Table 14.-Comparison of some observed versus predicted stand and yield table variables forunthinned plantations after growth over 4-6 year time periods.
Mean MeanParameter predicted1 observed2
Xl6 4.07 4.33x10 5.62 5.67x17 6.21 6.39x24 6.66 6.91x50 7.99 8.33x63 8.61 8.96X82 9.69 10.03x 9 3 10.70 11.11x 9 7 11.40 11.96X qmd 8.20 8.48B A 130.6 136.7TS 396.3 394.3H D 56.7 59.3VOL 3616.3 3913.3
IMean predicted value = P = C Pi/n
Correlation Mean Mean percentcoefficient3 difference* difference5
0.69 -0.26 -1.940.74 -0.05 -1.320.84 -0.18 -1.540.86 -0.25 -2.400.90 -0.34 -3.430.91 -0.35 -3.340.92 -0.34 -2.860.92 -0.41 -3.330.89 -0.56 -4.460.92 -0.29 -2.950.83 -6.18 -3.460.98 2.00 1.320.83 -2.5 -3.000.90 -297.0 -5.20
2Mean observed value = 0 = C Oi/n
3Correlation coefficient = r =E[(Pi - P)(Oi - -611
~/z(Pi - F)2C(Oi - 0)2
4Mean difference = d = Z: (Pi - OiYn
5Mean percent difference = %d = lOO/nZ(Pi - Oi)/Oi
exi, i = l-97, are the ith percentile values of the variable X.X qmd = Quadratic mean diameter (in).BA = Basal area per acre (ft2).VOL = Total ft3 volume.TS = Trees surviving per acre.HD = Mean height (ft) of dominant and codominant trees.
16

Table E.-Comparison of some observed versus predicted stand and yield table variables immedi-ately following the first thinning
Parameter
Xl6x10
x17
x24
x50
x63
x32
x93
x91
XqmdTSHDVOL
Mean Mean Correlation Mean Mean percentpredicted’ observed2 coefficient3 difference4 difference5
3.99 3.45 0.74 -0.21 24.995.25 4.71 0.80 -0.36 13.705.72 5.50 0.86 -0.08 4.626.10 6.02 0.90 -0.03 1.417.24 7.26 0.95 -0.10 -0.817.80 7.79 0.96 -0.01 -0.348.78 8.68 0.97 -0.11 -1 .49.73 9.56 0.96 -0.17 2.08
10.41 10.21 0.91 -0.19 2.367.48 7.34 0.96 -0.14 2.33
332.2 351.2 0.97 - 18.98 -3.6850.7 50.8 0 .99 -0.11 -0.30
2279.4 2356.1 0 .96 -76.6 -2.94
‘Mean predicted value = ?; = X Pi/n
2Mean observed value = G = C Oi/n
3Correlation coefficient = r =X[(Pi - F)(Oi - G)]
~~(Pi - P)28(Oi - ~)’
4Mean difference = ;i = Z (Pi - Oi)/n
5Mean percent difference = %d = lOO/nX(Pi - Oi)/Oi
6Xi, i = l-97, are the ith percentile values of the variable X.Xqmd = Quadratic mean diameter (in).BA = Basal area per acre (ft2).VOL = Total ft3 volume.TS = Trees surviving per acre.HD = Mean height (ft) of dominant and codominant trees.
Table 16.-Comparison of some observed uersus predicted stand and yield table variables immedi-ately following all thinnings after the first thinning
ParameterMean
predicted1Mean
observed2Correlationcoefficient3
Meandifference4
Mean percentdifference5
Xl6 6.97 7.82 0.87 -0.85 -6.33x10 8.60 8.53 0.93 0.06 2.8x17 9.17 9 .12 0 .95 0.05 1.17x24 9.61 9.56 0.96 0.05 0.50x50 10.89 10.76 0.98 0.13 0.73X63 11.49 11.32 0.98 0.17 1.23X82 12.52 12.34 0.99 0.18 1.36x 9 3 13.48 13.48 0.99 0.00 0.09x37 14.15 14.20 0.95 -0.05 0.07Xwd 11.04 10.93 0.99 0.11 0.91TS 151.0 152.3 0.99 -1.32 -1.56HD 68.1 68.3 0.99 -0.21 -0.29VOL 2926.4 2978.4 0.96 -52.0 -1.77
‘Mean predicted value = I’ = X Pi/n
2Mean observed value = B = C Oiin
3Correlation coefficient = r =B[(Pi - P)(Oi - O,]
v/B(Pi - F)2X(Oi - G)2
4Mean difference = d = C (Pi - Oi)/n
5Mean percent difference = %d = lOO/nZ(Pi - Oi)/Oi
6Xi, i = l-97, are the ith percentile values of the variable X.Xqmd = Quadratic mean diameter (in).BA = Basal area per acre (ft2).VOL = Total ft3 volume.TS = Trees surviving per acre.HD = Mean height (ft) of dominant and codominant trees.
1 7 I

Table 17.-Comparison of some observed versus predicted stand and yield table variables forplantations after a 5-year growth period following thinning
ParameterMean Mean
predicted1 observed2Correlationcoefficient3
Meandifference4
Mean percentdifference5
Xl6
x10
x17
x24
x50
X63
x82
x 9 3
x91X qmdB AT SHDVOL
6.10 6.92 0.91 -0.81 -5 .967.78 7.81 0 .94 -0.03 2.038 .39 8.49 0.96 -0.10 -0.028.88 9.01 0.97 -0.13 -0.79
10.28 10.38 0 .98 -0.09 -0.8810.95 11.00 0.98 -0.05 -0.4512.12 12.08 0.98 -0.04 -0.4013.22 13.24 0.98 -0.02 -0.0314.00 13.97 0.96 -0.02 0.3710.51 10.53 0.99 -0.01 -0.03
102.5 102.5 0.93 -0.88 -0.82204.1 204.1 0.99 -1.87 -0.75
67.3 68.0 0 .96 -0.67 -0.943421.9 3493.9 0.90 -72.0 -2.1
‘Mean predicted value = p = C P(n
2Mean observed value = G = B Oi/n
3Correlation coefficient = r =Z[(Pi - PXOi - O)l
d/x(Pi - F)2Z(Oi - Gj2
4Mean difference = d = B (Pi - Oil/n
5Mean percent difference = %d = lOO/nZ(Pi - Oi)/Oi
aXi, i = l-97, are the ith percentile values of the variable X.Xqmd = Quadratic mean diameter (in).BA = Basal area per acre (ft?.VOL = Total ft3 volume.TS = Trees surviving per acre.HD = Mean height (ft) of dominant and codominant trees.
B- by B-ft spacing) was assumed on lands of site index(base age 25) of 50 and 70 feet. After prediction ofinitial stand conditions at age 10, projections weremade over 2 or 3 year intervals to age 40 for un-thinned stand examples or to age 50 for thinned standexamples. In the thinned stand examples, the site 70plantation was thinned back to 80 square feet of basalarea at ages 15, 22,30, and 40 years. Thinning of thesite 50 plantation was delayed until age 22, when itwas thinned the same as the higher site plantation.
Unthinned Plantation
Survival.-On both sites the survival decreasedless with increasing age (fig. 11). In the early years,survival was highest on the higher site. However, be-cause of intensified competition on the better site, atabout age 17 survival became better on the poorersite. The latter relationship remained for the growthperiod.
Mean Diameter.-The average gain in mean di-ameter for the site index 70 plantation over the siteindex 50 plantation was 2.04 inches by age 40 (fig. 12).
Basal Area .-Basal area of all trees increased withincreasing site index (fig. 13) but increased more
18
rapidly on the high site. Basal area culminated by age40 in the site index 70 plantation but had not culmi-nated in the site index 50 planations.
Total Stem Volume Yield.-Total stem cubic-foot(o.b.) yields did not culminate before age 40 on eithersite, but the high-site volume was on average 2,855cubic feet per acre more than on the low site (fig. 14).
Mean and Periodic Annual Increment. -Total stemcubic-foot (0.b.) volume mean annual increment(MAI) culminated at about age 24 in the site index 70plantation and at about age 27 in the site index 50plantation. The higher site stands peak MA1 wasabout 125 cubic feet per acre per year greater than thepeak MA1 in the lower site stand (fig. 15).
Thinned Plantation
Survival. -In this example, the stand was thinnedbefore the survival crossover occurred, as mentionedin the previous section. After both stands werethinned at least once, there were about 155 fewertrees per acre in the higher site stand than in thelower site stand. This relationship persisted throughage 50, but the magnitude of the difference decreasedover time because the rate of survival was better on

200 1 I I I IIO 15 20 25 30 35
PLANTATION AGE (YEARS)
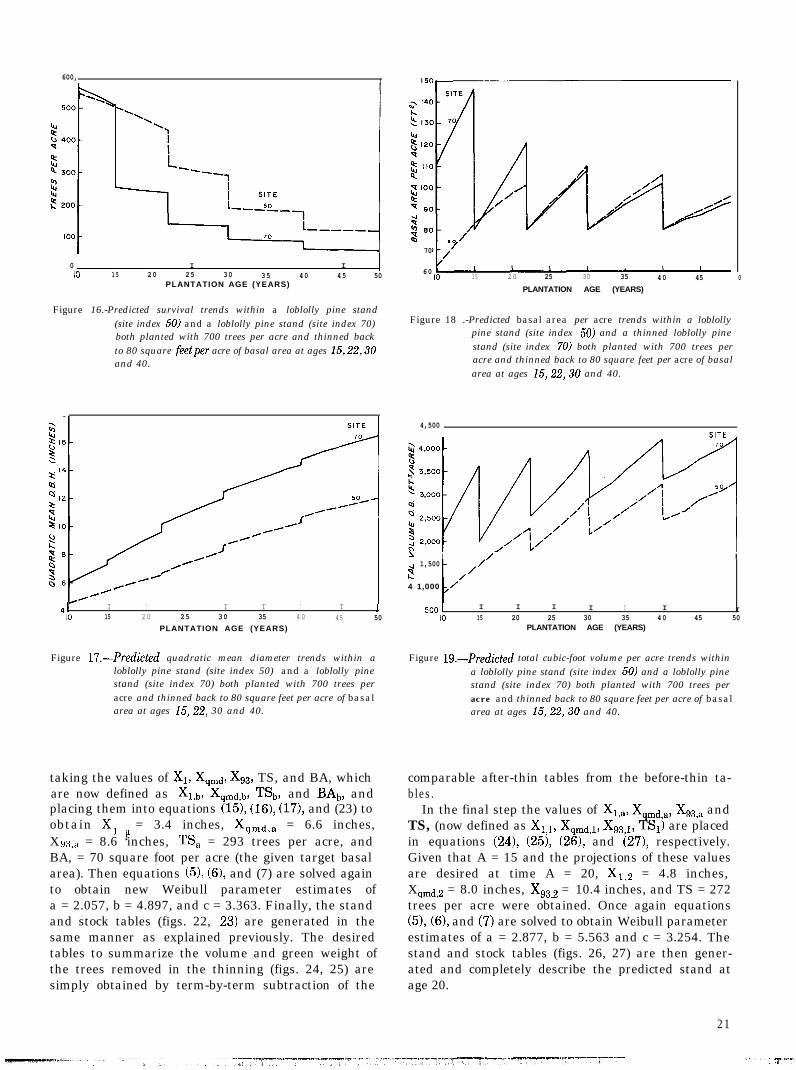
Figure Il.-Predicted survival trends within an unthinned loblollypine stand (site index 50) and an unthinned loblollypine stand (site index 70) both planted with 700 treesper acre.
I” 13 zo 25 30 35 40PLANTATION AGE (YEARS)
Figure 12.-Predicted quadratic mean diameter trends within anunthinned loblolly pine stand (site index 50) and anunthinned loblolly pine stand (site index 70) bothplanted with 700 trees per acre.
I I 180 15 20 25 30 35 40
PLANTATION AGE (YEARS)
Figure 13.-Predicted basal area per acre trends within an un-thinned loblolly pine stand (site index 50) and an un-thinned loblolly pine stand (site index 70) both plantedwith 700 trees per acre.
0 I I I IIO 15 20 25 30 35
PLANTATION AGE (YEARS)
Figure 14.-Predicted total cubic foot volumeper acre trends withinan unthinned loblollypine stand (site index 50) and anunthinned loblolly pine stand (site index 70) bothplanted with 700 trees per acre.
s 250?i= 2 0 0cu5 \ \3 \150-
k
‘\./ ‘-------. \
t--w. \
y1 loo- .’./ _________ - - - - - - - - - --Y=,, ---_-____ - - - - ----__ l-L_
B
___--- - * Y . \ *- - - SlTE70 P n / .i. \:
0 I I I I I10 15 20 25 30 35
PLANTATION AGE (YEARS)
Figure 15.-Predicted mean and periodic annual cubic foot volumeincrement within an unthinned loblollypine stand (siteindex 50) and an unthinned loblolly pine stand (siteindex 70) both planted with 700 trees per acre.

the high site (fig. 16). Notice that in the site index 70plantation after the first thinning and in the siteindex 50 plantation after the second thinning mortal-ity had nearly stabilized.
Mean Stand Diameter.-Quadratic mean diameteraveraged 2.98 inches higher on the high site than onthe low site. The difference was smaller in the earlyyears but consistently increased over time (fig. 17).Since the thinning technique was a modified low thin-ning, as explained earlier, the average diameter in-creased with each thinning. The larger increases oc-curred in the latter thinnings, because spacing andstand clean-up would have then essentially beenachieved, and a more accurate low thinning would bepracticed.
Basal Area .-After each stand had been thinned atleast once, basal area growth was only slightly higherin the high-site stand than in the low-site stand (fig.18). This result was unexpected but not inconsistentwith our data. The fewer larger trees did not greatlycompensate in basal area for the greater number ofsmaller trees in the lower site index stand. There wasessentially no statistical relationship between siteindex and basal area growth after a stand had beenthinned. The linear correlation between these vari-ables was only r = 0.046.
Total Stem Volume Yield.-Total cubic foot (o.b.1standing volume was always higher in the higher siteplantation than in the lower site plantation (fig. 19).This was true even after all thinnings. Not only wasthere 1,060 cubic feet per acre more total volume onthe high site at age 50, but here was 2,571cubic feetper acre more volume removed through all of the thin-nings in the higher site plantation.
UNTHINNED, THINNED PLANTATIONCOMPARISON
In the unthinned plantation (site index 701, the age40 survival was 236 trees per acre as compared to 103trees per acre (before the final thinning) in thethinned plantation at that age. The unthinned planta-tion had almost double the total volume of the thinnedplantation-7,745 cubic feet per acre as compared to4,278. However, the average diameter of the trees inthe thinned plantation (at age 40) was about 2 inchesgreater than those in the unthinned plantation. If oneconsiders the cumulative total volume removed in thefirst three thinnings, the total volume either used oravailable for use before thinning at age 40 in the highsite stand was 3,627 + 4,278 = 7,905 cubic feet peracre. This is about 160 cubic feet per acre more vol-ume than in the site index 70 unthinned stand at age40.
20
An Example
To illustrate the application and utility of the pre-diction system, a relatively simple but realistic exam-ple should be considered. Given an existing unthinnedloblolly pine plantation that is presently 15 years old,an inventory of the stand reveals there are 500 sur-viving trees per acre, and the average height of thedominant and codominant trees is 45 feet. The userdesires full stand and stock table volume output todescribe the present stand. He then wants to thin thestand back to a residual basal area per acre of 70square feet, see what the stand looks like after thethinning, and obtain a projection of what the thinnedstand will look like 5 years later. Stand and stocktable volume output is desired after the thinning andat the end of the projection period. Also, a table com-pletely summarizing the timber removed during thethinning is requested. Board-foot volume using theInternational l/kinch rule is chosen. Furthermore,the same stand and stock table information in termsof green weight is requested. A merchantable top di-ameter of 4 inches is selected for all the output.
The following scenario demonstrates how this sys-tem obtains the desired information.
Since HD = 45 feet is given, equation (8) is solvedfor SI obtaining 61 feet.
Equations (ll), (121, and (13) are solved next givingXi = 2.9 inches, Xqmd = 6.4 inches, and Xs, = 8.4inches.
This information is then used in equations (51, (61,and (71, following the procedure explained on p. 5, 6.This produces Weibull parameter estimates ofa = 1.718, b = 5.010 and c = 3.357.
Given the Weibull parameters and TS, equation (2)is used to distribute TS into l-inch diameter classes.Now assuming each diameter class represents themidpoint diameter (i.e., the quadratic mean diameter)for that class, equation 23, rearranged to estimateBA, is invoked within each class to obtain BA for eachof those diameter classes.
The average height of the trees within each class isobtained from equation (28) in this case.
Given all of this information, equations (301, (31),and (321, with appropriate coefficients from tables 8through 10, are used to obtain cubic-foot volume,board-foot volume, and green-weight estimateswithin each diameter class.
Finally, the stand totals for each output categoryare obtained by summation. Figures 20 and 21 areoutputs from a computer program, COMPUTE P-LOB (Ferguson and Baldwin 19871, which performedthe calculations for this procedure. The tables de-scribe the initial stand before thinning. Note that dueto rounding of fractional to whole numbers, somecolumns of figures do not add to the totals indicated inthe output tables.
Next, the stand is thinned. This is accomplished by
600,I
0 I I10 1 5 20 25 30 35 40 45 50
PLANTATION AGE (YEARS)
Figure 16.-Predicted survival trends within a loblolly pine stand(site index 50) and a loblolly pine stand (site index 70)both planted with 700 trees per acre and thinned backto 80 square feetper acre of basal area at ages 15,22,30and 40.
41 I I I I I I I 110 15 20 25 30 35 40 45 50
PLANTATION AGE (YEARS)
Figure 17.-Predicted quadratic mean diameter trends within aloblolly pine stand (site index 50) and a loblolly pinestand (site index 70) both planted with 700 trees peracre and thinned back to 80 square feet per acre of basalarea at ages 15,22, 30 and 40.
taking the values of X1, Xqmd, Xss, TS, and BA, whichare now defined as Xi,,, Xqmd,b, TSb, and BAb, andplacing them into equations (15), (16), (171, and (23) toobtain X, a = 3.4 inches, Xqmd,a = 6.6 inches,X 93,a = 8.6 ‘inches, TS, = 293 trees per acre, andBA, = 70 square foot per acre (the given target basalarea). Then equations (51, (61, and (7) are solved againto obtain new Weibull parameter estimates ofa = 2.057, b = 4.897, and c = 3.363. Finally, the standand stock tables (figs. 22, 23) are generated in thesame manner as explained previously. The desiredtables to summarize the volume and green weight ofthe trees removed in the thinning (figs. 24, 25) aresimply obtained by term-by-term subtraction of the
70
60 IO 15 20 25 30 35 40 45PLANTATION AGE (YEARS)
Figure 18 .-Predicted basal area per acre trends within a loblollypine stand (site index 50) and a thinned loblolly pinestand (site index 70) both planted with 700 trees peracre and thinned back to 80 square feet per acre of basalarea at ages 15,22,30 and 40.
4,500SITE
I /- I4 1,500
i
/b?
/
4 1,000//
500 1 I I I I I I I I10 15 20 25 30 35 40 45 50
PLANTATION AGE (YEARS)
Figure lg.-Predicted total cubic-foot volume per acre trends withina loblolly pine stand (site index 50) and a loblolly pinestand (site index 70) both planted with 700 trees peracre and thinned back to 80 square feet per acre of basalarea at ages 15,22,30 and 40.
comparable after-thin tables from the before-thin ta-bles.
In the final step the values of Xi,+, Xqmd,+, Xss,+ andTS, (now defined as Xi,i, Xqmd,i, Xsa,i, TSi) are placedin equations (241, (251, (261, and (27), respectively.Given that A = 15 and the projections of these valuesare desired at time A = 20, Xr,s = 4.8 inches,Xqmd,a = 8.0 inches, X,,,, = 10.4 inches, and TS = 272trees per acre were obtained. Once again equations(51, (61, and (7) are solved to obtain Weibull parameterestimates of a = 2.877, b = 5.563 and c = 3.254. Thestand and stock tables (figs. 26, 27) are then gener-ated and completely describe the predicted stand atage 20.
0
21 I

LOBLOLLY PINEBEFORE THINNING INFORMATION
(PER ACRE)
AGE= 15DOMINANT HEIGHT= 45.0 FEETQUADRATIC MEAN DBH= 6.389 INCHES
___^________________-----------------------------------------------------------___________--____-__-----------------------------------------------------------CUBIC FOOT VOLUME OF STEMS INTER.l/$
DBH STEMS BASAL AV. TO AN O.B. TOP DIAMETER OF B.F. VOL.CLASS AREA HT. 0 INCHES 4 INCHES 8 INCHES %-IN. TL)P
------------ ------------ ------------in. no. %: ft. o.b. i.b. o.b. i.b. o.b. i.b. i.b.
-----------------------.-.---------------------------- --------------------------
t15 .7 29
A:: 6::0. 0. 0. 0. 0.
4.5 35 0.5 13.5 39 200. 10:: 12:: 0.
127 24.9 42 397. 449. 327. 0. 0.112 29.9 44 496. 610. 452. 0. 0.65 22.7 46
; 24392. 497. 0.
10.6 48 251. 190. 244. 10:: 7::IO 511 1
2.7 49 65. 50. $. 49: ;;. 29..: 53 16. 12. . 12. . 9. 47.
--------------_---------------------------------- ___L_I____-------___-----------500 110.3 2426. 1805. 2061. 1523. 158. 116. 202.
---------------.-~---------------------.------~--------------------------=======_________--__^______----------------..__________________----------------SI(BASE AGE 25)~ 61 FEET; 93RD PERCENTILE= 8.423WEIBULL PARAMETERS: "A"= 1.71%; "B"= 5.010; "C"= 3.357
Figure 20.-Predicted volume measure (per acre) stand/stock table for an unthinned loblolly pineplantation.
LOBLOLLY PINEBEFORE THINNING INFORMATION
GREEN WEIGHT(POUNDS)(PER ACRE)
AGE= 15DOMINANT HEIGHT- 45.0 FEXTQUADRATIC MEAN DBH= 6.389 INCHES
____________-____-__----------------------------.____________-_____-------------------------------~~~ --_-.- -- . _ _ _ _ _ ____..___ ZlLL- __._.--__ ::TOTAL TOTAL WEIGHT TOTAL WEIGHT WEIGi:T CCCROWN OF OF MERCH STEFI
DBH STEMS BASAL AV. WEIGHT WOODY BOLE 4"CLASS AREA HT. W/FOL. COMPONENT TOP DIA.
---___-------- -------------- we-------------in. no. ::: ft. o.b. o.b. i.b. o.b. i.b. o.b. i.b.
_____-__-_^_ - _____--_________---. . _ _ _._ .--.-em__ - ---- ----------------------------3 15 .7 29 173. 651. 525. 561. 465. 1.
4792. 3959. 4141. 3510. 92;: 774.15912. 13334. 13616. 11705. 8082. 6950.
7 112 29.9 44 11292:31857. 26959. 26889. 23356. 21570. 18775.40535. 34524. 33577. 29387. 3018%. 2646%.
8 65 22.7 46 9494. 32455. 2780%. 26454. 23312. 24997. 22057.9 24 10.6 4% 4839. 15967. 12425. 11029.
1 0: 2.7 4g
1377. 4261. 3287. 2929.11 .7 50 365. 1069. 814. 72%.
____________________-----------------------------------------------------------500 110.3 40977. 147499. 125475. 122249. 106839. 102292. 89711.
==================TE========_===============================~::=:~~========~=~=====SI(BASE AGE 25)~ 61 FEET; 93RD PERCENTILE= 8.423WEIBULL PARAMETERS: "A"= 1.71%; "B"z 5.010; "C"r 3.357
Figure 21.-Predicted weight measure (per acre) standlstock table for an unthinned loblolly pineplantation.
22

LOBLOLLY PINERESIDUAL STAhTD -- AFTER THINNING
(PER ACRE)
AGE= I5DOMINANT HEIGHT= 45.0 FEETQUADRATIC MEAN DBHr 6.613 INCHES
=================r====_E=__Z=================~=:=:=~=~~~~~~~~:~==~:~:=~:~===========CUBIC FOOT VOLUME OF STEMS INTER.1/4
DBH STEMS BASAL AV. TO AN O.B. TOP DIAMETER OF B.F. VOL.CLASS AREA HT. 0 INCHES 4 INCHES 8 INCHES 8-1~. TOP
--u--a------ -----------m -----------_in. no. ::: ft. o.b. i.b. o.b. i.b. o.b. i.b. i.b.
--------------------------------------------------------------~.,.-------------
i 2: 2.0 .2 29 3:: 3. 0 . 0 . 0 . 0. 0. 0.35
1::: 6::0. 0. 0.
2 74 52 14.5 7.1 39 42 144. 0.
7 71 19.0 44 E231.
2%:190. :: E:
3;:315. 387. 286. 0": 0. 0.
9" ;; I;.;
212 .7
;;
52 16. 1
271. 143. 344. 183. 258. 139. 8:'
31:5:'23:
rl 0.
:: 4 I 50 43 40. 12. 51. 16. 33. 12. 12L'I. 9. 47.
------------------------------~----~----------------"--------------------------
_______2~3__69:3_______15_31:___i/411___133e~____~~~:----~~~~-----~~~--~_-_171:__-----__--------_------------------------------------------------------.--------SItBASE AGE 25)= 61 FEET; g3RD PERCENTILE= 8.607WEIBULL PAPAMETERS: "A"= 2.057; "B"= 4.897; "C"= 3.362
Figure 22.-Predicted volume measure (per acre) stand/stock table of a loblolly pine plantationfollowing its first thinning.
LOBLOLLY PINERESIDUAL STAND -- AFTER THINNING
GREEN WEIGHT(POUNDS)(PER Am)
AGE= 15DOMINANT HEIGHT= 45.0 FEETQUADRATIC MEAN DBHz 6.613 INCHES
________________________________________-------------------~-------------------____________________-----------------------------------------------------~-----TOTAL TOTAL WEIGHT TOTAL WEIGHT WEIGHT OFCROWN OF MERCH STEM
DBH STEMS BASAL AV. WEIGHT WOODY BE& 4"CLASS AREA HT. W/FOL. COMPONENT TOP DIA.
::: ft. o.b.-----------^-- -------------- ____-----------
i n . n o . o .b . i.5. 0. b. i . b . o .b . i . b .__------------~__~~~~~~~ ~~~
t 253.2 29 217. 175. 187. 155. I.
2.0 35 2113. 1751. 1832. 1553. 410. 34::5 52 7.1 39 2085. 8358. 7004. 7152. 6148. 4245. 3650.6 74 14.5 42 4832. 18562. 15708. 15668. 13609. 12568. 10940.
25696. 21885. 21286. 18629. 19137. 16779.22469. 19252. 18314. 17306. 1527C'.11375. 10319. 9626. 93'9. 8272.
IO 4 2.2 49 1102. 3408. 2gb6. 2682. 2343.II 1 .7 50 365. 1069. 926. 824. 2E:-737. . 728.
________----------------------------------- ------------------------------------293 63.3 26323. 93873. 79966. 77571. 67895. 65429. 58324.
________________________________________---------------------------------------__________________--____________________---------------------------------------SI(BASE AGE 25)~ 61 FEET; g3RD PERCENTILE= 8.607WEIBULL PARAMETERS: "A"= 2.057; "B"= 4.897; "C"= 3.362
Figure 23.-Predicted weight measure (per acre) standlstock table of a loblolly pine plantationfollowing its first thinning.
23

LOBLOLLY PINESTAND COMPONENT REMOVED BY THINNING
(PER ACRE)
AGE= 15DOMINANT HEIGHT= 45.0 FEETQUADRATIC MEAN DBH- 6.024 INCHES------------_----_-_---------.._--.-__________________________________------~~---------_.-- _ _----__ --__---_-_.. ,___________ - ____ -__- _____ -_- _______ -----__-- __.__
CUBIC FOOT VOLUME OF STEMS INTEi?.1/4DBH STEMS BASAL AV. TO AN O.B. TOP DIAMETER OF B.F. VOL.
CLASS AREA HT. 0 I?!CXS !: fNCHEs 8 INCHES S-IN. TOP------------ --m--------- -----------
in. no. Fz: ft. o.b. i.b. o.b. i.b. o.b. i.b. i.b.--------------------___I_______________ - - _ - --_.-... L__. _. - _ - L -- -------.-----------
3 .5 29 8. 5. 0. 0. 0. 0.4 2.5 35 47. 33. 0. 0. 0. 0.
2131.
1%86. 60.
:: ::0.
224. 187. 137. 0.7 41 11.0 4 4 243. 181. 223. 166. 0. 0. 0.8 20 7.0 4 6 160. 121. 153. 114. 0. 0.9 6 2.7 48 63. 47. 61. 46. $1 20.
10 1 .5 49 13. 10. 13. 10. 8. 6. 3::
Figure 24.-Volume measure (per acre) stand/stock table of the bole wood and bark materialremoved during the first thinning of a loblolly pine plantation.
LOBLOLLY PINESTAND COMPONENT REMOVED BY THINNING
GREEN WEIGHT(POUNDS)(PER ACRE)
AGE= 15DOKINANT HEIGHT- 45.0 FEETQUADRATIC %A:: DE:= 5.024 INCHES
---------------_-----~------ ___-.______.-_______----------------------------------- ----- ------ --------. -._-- -_ _____________ _ __..___---_ - ____..____ - --------------TOTAL TOTAL 'dE:GHT TOTAL WEIGHT WEIGHT OFCRO'JvI.‘ OF OF MERCH STEH
DBH STE% BASAL AV. WEIGHT WOODY BOLE 4 "CLASS AREA HT. W/ FOL. COMPONENT TOP DIA.
in. no. ::: ft. o.b.-------------- -------------- ___-----------o.b. i.b. o.b. i.b. o.b. i.b.
__-----------___---------------------------------------------------------------3 IO .5 23 115. 434. 350. 374. 310.
29 2.5 35 655. 1957.51:: 1.
432.;: 10.4 6.4 39 42 3461. 1864. 5557. 9747. 3837. 9002. 3300.
7 41 11.0 44 4133.8 20 7.0 46 2921.9 6 2.7 48 1210. 2757.10 1 -5 49 275. 597. 65:. 5%.
____________-___I____I__________________________-_-------------------.--------207 41.0 14654. 53626. 45509. 44678. 38944. 35863. 31387.
__________________________ -_-- ___ t==:=::::r------------------___- _------- _ . .._ - _____ -.- _-._--- _. _ __-_ -_------- -_ _-______ ___._ --.__- - --------- -----
Figure 25.-Weight measure (per acre) stand/stock table of the wood and bark material removedduring the first thinning of a loblolly pine plantation.

LOBLOLLY PINENO THINNING THIS YEAR
(PER ACRE)
AGE= 20DOMINANT HEIGHT= 53.5 FEETQUADRATIC MEAN DBH= 8.042 INCHES
------------------------------------------------------------~-------------------------------------------------------------------------------------------------CUBIC FOOT VOLUME OF STEMS INTER.l/4
DBH STEMS BASAL AV. TO AN O.B. TOP DIAMETER OF B.F. VOL.CLASS AREA HT. 0 INCHES 4 INCHES a INCHES &IN. TOP
-L---------- ------------ --------^_--in. no. Fk!: ft. o.b. i.b. o.b. i.b. o.b. i.S. i.b.
---------------------------------__I--c----c-------------------------_________4 .3 39 7. A19 2.6 44 55. 4:: 35: ".
0. 0. 0.
1;::0. 0. 0.
38 7.5 48 174. 129. 142.56 15.0 51 373. 280. 341. 253. t : i:
0.0.
61 21.3 53 418. 529. 398. 0. 0. 0.
1:49 21.6 55 446. 571. 434. 232. 164. 0.29 15.8 56 334. 430. 329. 257. 189. 1111.
1:12 7.9 57 223. 171. 221. 170. 162. 122. 701.; 2.4 58 68. 52. 67. 52. 55. 42. 240.
13 .9 59 27. 21. 27. 21. 24. 18. 103.----------------------------------------------------------------~-----------
_______~'__95:3_____--~~~:---~~~~:---~~~~:---~~~~:----~~~:----~~~:----~~~~~--_____--________----------------------------------------------------------------SI(BASE AGE 25)= 61 FEET; 93RD PERCENTILE= 10.391WEIBULL PARAMETERS: "A"= 2.877; "B"= 5.563; "C"= 3.254
Figure 26.-Predicted volume measure (per acre) stand/stock table of a loblolly pine plantation5 years after its first thinning.
LOBLOLLY PINENO THINNING THIS YEARGREEN WEIGHT(POUNDS)
(PER Am)
AGE= 20DOMINAhT HEIGHT= 53.5 FEETQUADRATIC MEAN DBH= 8.042 INCHES
______--_________----------------------------------------------------------~-~~______-___-______-_-____________________--------------------------------------.TOTAL TOTAL WEIGHT TOTAL WEIGHT WEIGHT OFCROWN OF MERCH STEM
DBH STEMS BASAL AV. WEIGHT WOODY BEE 4"Cm AREA HT. W/FOL. COMPONENT TOP DIA.
::: ft. o.b.------------- --________---- -_------^------
in. no. o.b. i.b. o.b. i.b. 0.5. i.b.
4 4 .3 39 405. 338. 361. 308.5 19 2.6 44 62 3370. 2870. 2998. 2601. 16%: 14%6 3il ?I5 48 10619. --' 9122. 9%5. 8209. 7377. 6492.7 56 15.0 51 2;;:. 22720. 19674. 19813. 17536. 17801. 15789.8 61 21.3 53 33855. 29473. 29114. 25934. 24613.9 49 21.6 55 'B;Y$:
6658:35972. 31473. 30554. 27378. 26614.
10 29 15.8 56 27085. 23764. 22607. 20339. 20010.11347. 10252.3433. 3112.1364. 1241.
________________----------- - --------- ----- -w..__-.--.- -C--_--.--,--C---------- . . . . “.
272 95.3 34954. 154004. 134297. 131093. 117038. 122498. 1095Z'l._______------._ ..v..-^___________. ., ______ =--=~~.---I========ITII :: :=~:---TfTT_-,====================
SI(BASE AGE 25)~ 61 FEET; 93RD PERCENTILE= 10.391WEIBULL DqD""ETERS:* 1 hY.2 “A”= 2.877; "B"= 5.563; "C"= 3.254
Figure 27.-Predicted weight measure (per acre) standlstock table of a loblolly pine plantation5 years after its first thinning.
2 5
Computer Program
A computer program, COMPUTE P-LOB Compre-hensive Outlook For Managed Pinessing simulatedTreatment Experiments-Planted Loblolly Pine, doesall of the required calculations and produces the de-sired yield tables. It is written in FORTRAN 77 and inBASIC. At the time of this publication, compiled ortext versions in FORTRAN are available for DigitalEquipment Corporation PDPll/series computers,Data General MV series computers, IBM and IBMcompatible personal computers, and Hewlett Packard9800 series computers using the FORTRAN software.Compiled and text BASIC versions are available forthe IBM and IBM compatible personal computers.Copies of the program are available from the authors.
A companion publication to this one (Ferguson andBaldwin 1987) is a User’s Manual for the predictionsystem. It completely describes the computer softwareand gives more examples of program uses. A completelisting of the FORTRAN code is given.
LITERATURE CITED
Bailey, R. L.; Abernathy, N. C.; Jones, E. P., Jr. 1981.Diameter distribution models for repeatedlythinned slash pine plantations. In: Barnett, J. P.,ed. Proceedings of the biennial southern silvicul-tural research conference; 1980 November 6-7; At-lanta, GA. Gen. Tech. Rep. SO-34. New Orleans,LA: U.S. Department of Agriculture, Forest Serv-ice; Southern Forest Experiment Station; 115-126.
Bailey, R. L.; Dell, T. R. 1973. Quantifying diameterdistributions with the Weibull function. Forest Sci-ence. 19(2): 97-104.
Bailey, R. L.; Pienaar, L. V.; Shiver, B. D.; Rheney,J. W. 1982. Stand structure and yield of site-prepared slash pine plantations. Research Bulletin291. Athens, GA: Univeristy of Georgia, College ofAgriculture Experiment Station; 83 p.
Baldwin, V. C., Jr. 1982. A procedure to obtain even-aged forest stand structure and volume predictionsusing aerial photographic information. In: Brann,T. B., House, L. O., IV., Lund, H. G., eds. In-PlaceResource Inventories: Principles and Practices, Pro-ceedings of a National Workshop; 1981 August 9-14; Orono, ME. SAF 82-02. Washington, DC: Soci-ety of American Foresters; 308-314.
Baldwin, V. C., Jr. 1987. Green and dry weight equa-tions to predict the aboveground tree components ofplanted loblolly pine in the west gulf region. South-ern Journal of Applied Forestry. ll(4): (in press).
Baldwin, V. C., Jr.; Feduccia, D. P. 1987. Cubic-footvolume, volume-ratio and stem profile equations forplanted loblolly pine in the west gulf region. Publi-cation in process.
26
Brister, G. H.; Clutter, J. L.; Skinner, T. M. 1980. Treevolume and taper functions for site-prepared plan-tations of slash pine. Southern Journal of AppliedForestry. 4(3): 139-142.
Burkhart, H. E.; Sprinz, P. T. 1984. Compatible cubicvolume and basal area projection equations forthinned old-field loblolly pine plantations. ForestScience. 30(l): 86-93.
Cao, Q. V.; Burkhart, H. E.: Lemin, R. C., Jr. 1982.Diameter distributions and yields of thinnedloblolly pine plantations. Publication No. FWS-l-82. Blacksburg, VA: School of Forestry and WildlifeResources, Virginia Polytechnic Institute and StateUniversity; 61 p.
Clutter, J. L.; Harms, W. R.; Brister, G. H.; Rheney,J. W. 1984. Stand structure and yields of site-prepared loblolly pine plantations in the lowerCoastal Plain of the Carolinas, Georgia, and northFlorida. Gen. Tech. Rep. SE-27. Asheville, NC: U.S.Department of Agriculture, Forest Service; South-eastern Forest Experiment Station; 173 p.
Coile, T. S.; Schumacher, F. X. 1964. Soil-site rela-tions, stand structure, and yields of slash andloblolly pine plantations in the Southern UnitedStates. Durham, NC: T. S. Coile, Inc.; 296 p.
Daniels, R. F.; Burkhart, H. E. 1975. Simulation ofindividual tree growth and development in man-aged loblolly pine plantations. Publication No.FWS-5-75. Blacksburg, VA: School of Forestry andWildlife Resources, Virginia Polytechnic Instituteand State University; 69 p.
Dell, T. R.; Feduccia, D. P.; Campbell, T. E.; Mann,W. F., Jr.; Polmer, B. H. 1979. Yields of unthinnedslash pine plantations on cutover sites in the westgulf region. Res. Pap. SO-147. New Orleans, LA:U.S. Department of Agriculture, Forest Service,Southern Forest Experiment Station; 84 p.
Feduccia, D. P.; Dell, T. R.; Mann, W. F., Jr.; Camp-bell, T. E.; Polmer, B. H. 1979. Yields of unthinnedloblolly pine plantations on cutover sites in the westgulf region. Research Paper SO-148. New Orleans,LA: U.S. Department of Agriculture, Forest Serv-ice, Southern Forest Experiment Station; 88 p.
Ferguson, R. F.; Baldwin, V. C., Jr. 1987. Users man-ual for COMPUTE-PLOB-a program for predict-ing growth and yield of loblolly pine plantations.Publication in process.
Freese, F. 1964. Linear regression methods for forestresearch. Res. Pap. FPL-17. Madison, WI: U.S. De-partment of Agriculture, Forest Service, ForestProducts Laboratory; 136 p.
Little, S.N. 1983. Weibull diameter distributions formixed stands of western conifers. Canadian Journalof Forestry Research. 13(l): 85-88.
Matney, T.G.; Sullivan, A. D. 1982. Compatible standand stock tables for thinned and unthinned loblollypine stands. Forest Science. 28(l): 161-171.

Max, T. A.; Burkhart, H. E. 1976. Segmented polyno-mial regression applied to taper equations. ForestScience. 22(3): 283-289.
Milliken, G. A. 1982. Nonlinear statistical models.Arlington, VA: The Institute for Professional Edu-cation; 351 p.
Parresol, B. R. 1983. A volume and taper predictionsystem for bald cypress in Lousiana. Baton Rouge,LA: Louisiana State University, School of Forestryand Wildlife Resources; 135 p. M.S. thesis.
Schumacher, F. X.; Hall, F. D. S. 1933. Logarithmicexpression of timber-tree volume. Journal of Agri-cultural Research. 47(g): 719-734.
Smalley, G. W.; Bailey, R. L. 1974. Yield tables andstand structure for loblolly pine plantations in Ten-nessee, Alabama, and Georgia highlands. Res. Pap.SO-96. New Orleans, LA: U.S. Department of Agri-culture, Forest Service, Southern Forest Experi-ment Station; 81 p.
Strub, M. R.; Feduccia, D. P.; Baldwin, V. C., Jr. 1981.A diameter distribution method useful in compati-cable growth and yield modeling of thinned stands.In: Barnett, J. P. ed., Proceedings of the biennialsouthern silvicultural research conference; 1980November 6-7; Atlanta, GA. Gen. Tech. Rep. SO-34. New Orleans, LA: U.S. Department of Agricul-ture, Forest Service, Southern Forest ExperimentStation; 127-130.
Van Deusen, P. C.; Sullivan, A. D.; Matney, T. G.1981. A prediction system for cubic foot volume ofloblolly pine applicable through much of its range.Southern Journal of Applied Forestry. 5(4): 186-189.
Zanakis, S. H. 1979. A simulation study of some sim-ple estimators for the three-parameter Weibull dis-tribution. Journal of Statistical Computation andSimulation. g(2): 101-116.
27

Baldwin, V. C., Jr. and Feduccia, D. P. 1987. Loblolly pinegrowth and yield prediction for managed west gulf planta-tions. Res. Pap. SO-236. New Orleans, LA: U.S. Departmentof Agriculture, Forest Service, Southern Forest ExperimentStation. 27 p.Complete description, including tables, graphs, computeroutput, of a growth and yield prediction system providingvolume and weight yields in stand and stock table format. Anexample of system use is given along with information aboutthe computer program, COMPUTE P-LOB, that operates-the system.Additional keywords: Pinus tuedu L., volume predictions,weight predictions, unthinned or thinned plantation yields,Weibull distribution, taper curves, site-index prediction, sur-vival prediction, diameter distribution moments, parameterrecovery, problem-free sites.

