lobbying in mergers and acquisitionscicfconf.org/sites/default/files/paper_972.pdf ·...
TRANSCRIPT

1
Lobbying in Mergers and Acquisitions
Peter Roosenboom and Quxian Zhang
This version: Feb, 2015
Please do not cite or circulate.
Abstract: We study the economics of regulatory frictions during firms’ investment
activities, particularly the corporate mergers. Government approvals are a major
source of risks to complete takeover deals. Receiving an adverse antitrust review
opinion leads to -2.84 percentage points decreases in the combined merging firm
values, which is more than half of the synergy perceived at the merger, the combined
announcement return 4.2%. We find that corporate lobbying activities significantly
associate with outcomes of takeovers. Specifically, increasing lobbying spending by
the bidders facilitates deal completion through a lower likelihood of adverse opinions
from the antitrust agencies and reduced time in completing the deal. We interpret the
results as consistent with a “voice” hypothesis, where firms directly influence the
regulatory outcomes. We also show that such effects being well perceived by
investors. One standard deviation increase in lobby spending by the bidders results in
1.8 percentage points in the target announcement abnormal returns. Furthermore, the
evidence that lobbying spending is only positively correlated with non-entrenched
bidders implies that regulatory risk management does not necessarily creating value
for the bidders.
JEL Classification: G32, G34, G38, K21, L41, D72
Keywords: mergers, antitrust, lobbying, corporate governance, investment decision
Roosenboom, [email protected], and Zhang, [email protected], are both from Finance Department, RSM,
Erasmus University, PO Box 1738, 3000 DR Rotterdam, the Netherlands. We are grateful to Dion Bongaerts, Espen
Eckbo, Jarrad Harford, Buihui Qiu, Frederik Schlingemann, Karin Thorburn, Marieke van der Poel, Mathijs van
Dijk, David Yermack, and seminar participants in Erasmus University and Australian National University for
valuable suggestions and comments. All errors are ours.

2
1 Introduction
During recent years, regulatory costs in completing mergers and acquisitions have drawn the
attention of both practioners and researchers. In 2011, AT&T publicly proposed a $39-billion
acquisition of T-Mobile USA, and the presumable merged company would take a 43% share in
the wireless market.1 The deal was blocked by Antitrust Division in the Department of Justice
(DOJ), and AT&T stocks were down by 4% on the formal announcement day by DOJ. In
addition, AT&T eventually paid a reverse breakup fee of up to $4.2 billion to the target, or
almost 10% of its market value then. The case demonstrates the substantial regulatory costs in
big corporate transactions. The U.S. antitrust agencies report that, for all transactions with a
reported value larger than $1 billion in 2011, over 40% has been reviewed in detail by the
antitrust agencies and over 15% has been challenged officially.2 The antitrust review is a form of
regulatory frictions in the corporate takeover market. It may result in direct obstruction of
existing merger activities, as well as deterrence against future merger activities (e.g.,
Seldeslachts, Clougherty, and Barros 2009).While firms may choose an “exit” option by
refraining merger activities or even by flowing to industries or countries with lower regulatory
frictions3, firms may opt for the “voice” channel by directly influencing the decision makers. In
this study, we investigate whether firms actively engage in political activities to mitigate political
costs during their takeovers, and, if so, how such activities influence the governance decision
making process.
A well explored exit channel by firms facing regulatory frictions is regulatory arbitrate, a legal
planning technique by firms to utilize the loopholes in regulations to avoid tax, disclosures, and
other regulatory costs. Firms retain oversea cash holdings to avoid taxation (e.g. Zucman 2014),
relocate headquarters to low tax countries through “invert” mergers, or flow investment to states
or countries with lower regulatory costs (Karolyi and Taboada 2013). In addition to “racing to
efficiency” to optimize the investment activities, firms can also be actively involved in the policy
1 http://money.cnn.com/2011/09/01/technology/att_tmobile_lawsuit/ 2 The statistics are from Hart-Scott-Rodino Annual Report for the Fiscal Year 2011, reported by Federal Trade
Commission and Department of Justice. http://www.ftc.gov/os/2012/06/2011hsrreport.pdf. 3 See the evidence of “regulatory arbitrage” in the banking sector through cross-border mergers in Karolyi and
Taboada (forthcoming).

3
making process to reduce regulatory costs in the current legal environment. In particular, firms
often actively communicate with the government through lobbyists.4
Previous literature has documented that firms collectively lobby for the passage of legislation
(e.g. Alexander, Mazza, and Scholz 2009; Adelino and Dinc 2014; Kerr and Lincoln 2014).
Those studies focus on the aggregate lobbying effort and the passage of one particular law. It is
difficult to establish the casual link between lobbying activity by a specific firm and the
consequence on a favorable legislation change. One exception is Adelino and Dinc (2014) which
finds that firms that have lobbied more before the Stimulus Act, are more likely to receive
Stimulus fund afterwards. We extend the research by exploring corporate lobbying activities
during a more common investment activity – mergers and acquisitions – and consider whether
such proactive corporate political activities can positively influence the deal specific outcomes.
The antitrust agencies, supposedly to be efficient government agencies, should be objective and
closely follow the pre-written Merger Guidelines. Therefore, efficient decision making of the
merger reviews should not be influenced by the lobbying activities by the merging firms. Under
this efficient agency hypothesis, there should be no correlation between corporate lobbying
spending and deal review outcomes. In contrast, there are two common views on the channels
through which corporate lobbying spending may correlate with merger review outcomes. First,
firms may obtain better information of the prospect of regulatory risks via lobbying, and then
selectively announce deals with better chance to clear the antitrust reviews or retract deals with
higher regulatory costs at earlier stage. The government agencies may be objective in reviewing
the mergers but still allow the privileged lobbying parties with better knowledge about potential
regulatory risks. It could be considered as a form of deterrence effects as firms are preemptively
restricting the merger activities in the light of high regulatory risks (exit hypothesis). Second,
firms can gain more favorable government review outcomes directly through voice. This is the
voice hypothesis. By lobbying, firms either provide extra information or reach private deals with
government to alter the government antitrust review toward a favorable direction. Understanding
4 In the merger where Medco successfully acquired its direct rival Express Scripts, the role of lobbying was
highlighted: “… The question was whether Congress would let the FTC do its job, or push them to raise unending
red flags on the deal.... It was no mean feat. There were 80 legislative letters about the deal sent to federal and state
regulators and 30 state attorneys general were involved in the review. And in 2011 and 2012, the companies spent
more than USD 7.5m on federal lobbyists...” (“How Medco won antitrust approval for a deal Wall Street considered
doomed”, http://www.ft.com/cms/s/2/2e0b6ec4-a07d-11e2-88b6-00144feabdc0.html#axzz3IwvBftvL)

4
whether corporate lobbying spending impact government decisions and through which channel
firms try to mitigate regulatory risks via lobbying can be important to evaluate the role of
lobbying in corporate investment activities.
We start the analysis by evaluating the regulatory frictions in mergers and acquisitions. By
focusing on merger antitrust reviews of mergers above $100 million from 2008 to 2012 in the
US, we document a huge economic impact of antitrust regulatory frictions, and present the
evidence that firms actively engage in lobbying to manage the regulatory risks in completing
corporate takeover deals. Almost every economically significant merger is subject to the
approval of antitrust agencies before deal consummation. Antitrust reviews can lead to huge
costs for merging firms. First, the regulatory challenges directly undermine the potential profits
for the merging firms. For large deals, potential challenges from the agencies are rather frequent
as the market power concerns are prominent.5 The challenged deals are either failed or imposed
with a consent decree with the government which lower profits. Moreover, the majority of
regulatory costs lies in deals that are not blocked by the agencies. The investigation process
conducted by agencies when entering a further stage (known as the “Second Request”) is usually
time-consuming and costly. Upon receiving second requests, it takes on average 142 days to
complete or withdrawn the deal, which is tripling the average time to complete for approved
deals. And the conditional failing probability for these Second Request deals is 26.47%,
comparing to 5.83% for all the other deals. The review process by government agencies could
potentially result in huge economic loss to the merging firms and it is a risk that firms need to
manage. Regulatory challenges for the economically significant M&A deals are closely followed
by the stock market. In particular, receiving an adverse opinion (Second Request) from the
antitrust agencies leads to -2.84% return for the bidder and the target combined,6 comparing to
the average combined abnormal announcement return 4.2%. The previous literature has
documented the deterrence effects of regulatory enforcement that lower the merger activities in
the subsequent periods (e.g. Seldeslachts, Clougherty, and Barros 2009; Clougherty and
5 For instance, when two of the largest companies in the industry are involved in the deal, the product market will be
very likely dominated by the merged firm. 6 Aktas, de Bodt, and Roll (2004) document that the European stock market reacts to the European Commission
antitrust agency decisions on business combinations. Consistently, we show that the U.S. stock markets react to the
decisions of the antitrust agencies.

5
Seldeslachts 2012). Our evidence compliments to the previous literature by evaluating the actual
costs of receiving an adverse Second Request.
Next, we investigate whether firms actively manage the regulatory risks. We observe that firms
lobby more intensively facing the uncertain regulatory risks to complete an M&A transaction.
Firms increase lobbying spending by almost doubling the average lobbying intensity, and hire
additionally 0.6 lobbyists in the quarter before the announcement and the announcement quarter.
The positive correlations between the lobbying spending and the merger review outcomes seem
to justify the increased lobbying spending around mergers. The lobbying spending of the bidder
can increase the probability of getting favorable antitrust clearance, decrease the probability of
getting adverse decision from the antitrust agencies and of deal failure, and shorten the days to
complete the transaction. A standard deviation increase in lobbying in the quarter before
announcement decreases the probability to receive adverse opinions (known as “Second
Request”) by 7 percentage points compared to the sample mean 14.2%, decreases the probability
of being officially challenged by the agencies by 7 percentage points compared to the sample
mean 8.7%, and decreases the probability of withdrawn by 5.13 percentage points compared to
the sample mean of 8.3%. Hence we reject the efficient agency hypothesis. The merger review
outcomes are correlated on lobbying spending, especially lobbying spending in the quarter
before public announcements. It suggests that the antitrust agencies either lack sufficient
information or necessary resources or skills, leaving room for merging firms to voice their
opinions, or to strategically exit from merger activities with high regulatory risk prospects.
We also address the potential endogeneity biases. Lobbying spending could be driven by omitted
variables. There are unobservable costs and benefits of lobbying, and the negative correlations
between deal completion risks and lobbying spending could be driven by the omitted
determinants of lobbying. We use an instrument variable that may correlates with lobbying
behavior but are exogenous to the deal characteristics, the busyness of the government. The
busyness of the government is a proxy for the difficulties to communicate with the government.
Such costs should enter into firm lobbying decisions as determinants, but should not influence
the merger review outcome by the agencies. The government agencies are not supposed to issue
negative review opinions (Second Requests and official challenges) depend on how busy they

6
are.7 The effectiveness of lobbying on merger review outcomes is robust to the inclusion of the
IV variables. The results are robust to the IV approach.8
We then test the exit and voice hypotheses using cross-border mergers and small mergers as
benchmarks. We argue that cross-border mergers or mergers with small value, which are not
subject to U.S. antitrust reviews, should not be selectively announced based on the U.S. antitrust
review prospects. And the outcome of the cross-border deals should not be driven by the
lobbying spending in US federal government. If the exit hypothesis is true, we should observe
that bidders on average are less likely to announce domestic mergers versus cross-border
mergers or small mergers when bidder spend more on lobbying. In contrast, the voice hypothesis
predicts no such a negative relation. We construct a risky merger activity measure by calculating
the proportion of the total value of above-100-million domestic mergers in proportion to total
value of all merger activities by a bidder in a quarter. We find that there is no negative
correlation between quarterly lobbying spending and subsequent risky merger activity in the
subsequent quarter. Since decision making for firms to engage a merger may be a two-stage
process, where the first stage is to decide to initiate a merger or not, and the second stage is to
decide to initiate big domestic mergers or not, we also model the regression in a nested logit
model. The results do not support the exit hypothesis.
Finally, we explore the value implication of lobbying for shareholders. Adverse regulatory
decisions bring in significant drops in both the bidder and target shareholder value and lobbying
is negatively associated with such risks. And consistently, the target announcement return indeed
increase by 3.6 percentage points if the bidder increases lobbying spending in the quarter before
announcement by one standard deviation. Considering the fact that the dollar amount of lobbying
spending is in a much smaller scale compare the size of the firm or the deal value, we expect to
see the value adding through lobbying for bidders as well. However, the lobbying spending is not
correlated with announcement return of the bidders. It indicates that although corporate lobbying
7 Since it is a standard practice for firms to strategically withdrawn and refile the merger review filings (HSR filings)
to provide extra time for the antitrust agencies when more time is needed, time constrain is not a driving factor for
issuance of a Second Request. 8 We also employ the distance to Washington D.C. as I.V. and results also hold. However, this IV suffers from weak
instrument problem in our bidder sample.

7
can reduce the regulatory frictions in corporate major investment activities by directly altering
the government decisions, it may not spend in the benefit of the shareholders.
This study adds to the growing literature of regulatory arbitrage in investment activities. The
banking literature demonstrates strong evidence that bank capitals strategically flow to countries
where the regulatory costs are lower (e.g., Houston, Lin, and Ma 2012; Karolyi and Taboada
2013). The corporate finance literature documents that firms avoid tax by holding cash in
offshore accounts and reinvest the cash overseas (Zucman 2014). In addition to that, Adelino and
Dinc (2014) show that firms aggressively lobby for government bailout money. However, they
indicate that it may be in a substitution of future investment. Marceau and Smart (2003) build a
theoretical model that even when firms can exit from currently levied regulation, there still
remains a significant opportunity to voice through lobbying to secure their investment activities.
Consistently, we present the evidence that firms do use lobbying as a voice channel to get
favorable government decisions in their major investment activities.
The results of this paper also add to the growing literature of corporate political activities and
firm value. Previous literature highlights the role of corporate lobbying in legislation, such as tax
rebates (Alexander, Mazza, and Scholz 2009), Stimulus Act funding (Adelino and Dinc 2014),
and high skilled immigration (Kerr and Lincoln 2014). Kerr et al. (2014) conclude that corporate
lobbying is one of the key determinants of economic policies. We add to this literature showing
that the government antitrust review decisions are indeed under the influence of corporate
lobbying. Via lobbying, firms have the opportunity to voice their views under mandatory
regulatory reviews. We utilize the most economically significant corporate transactions –
takeovers – and study the value implication of corporate lobbying under the M&A setting. This
setting allows us to study the effectiveness of lobbying on government decisions on the firm
level, since the government agencies make specific decisions for each transaction. The previous
literature indicates firms collectively lobby for certain legislation and enjoy the economic benefit
after the passage of the favored legislation. Under the M&A setting, we show that lobbying is
associated with more favorable government decisions on merger transactions. The heterogeneous
decisions received by each firm provide better assessment of the effectiveness of lobbying at the
firm level.

8
Our study also contributes to the finance literature by detailed documentation on the US antitrust
review process. It helps to better understand the process and shows the severity of adverse
interim outcomes. The previous literature (Eckbo and Wier 1985; Eckbo 1992) mainly focus on
the officially challenged deals in the 80s and 90s. Up until now, the regulatory environment for
takeovers has changed dramatically. The current regulatory process for antitrust review has been
changed so that deals cannot consummate without government approvals. Most of the challenged
deals end up with consent agreements with the antitrust agencies to eliminate anticompetitive
concerns while letting the deals go forward. Only rarely are the challenged cases trapped in long
and expensive lawsuit fights with the governments or get brutal rejection on the deals, while
most of the officially challenged deals are completed. Thus, the officially challenged deal sample
is only a partial demonstration of the regulatory frictions on mergers. Issuance of Second
Requests significantly prolongs the time to complete mergers. The deterrent value of antitrust
reviews is more revealed in the deals not announced in the face of high regulatory risks. We
collect the detailed dates and outcomes in the antitrust regulatory review process for all
economic significant, domestic, and publically announced M&A deals from 2008 to 2012 and
show a more complete scope of the regulatory risks. The actual impact of antitrust review is
much more complex and broader than the binary outcome of whether the transaction is officially
challenged or not. We provide a thorough picture on the antitrust regulatory process for the
domestic M&As in the US.
Lastly, our study adds to the understanding to the valuation of mergers. It is the first study
documents lobbying activities around M&As. At least in the short run lobbying helps firms to go
through M&A reviews, which implies that lobbying helps to facilitate the review processes. The
target announcement abnormal return is positively associated with lobbying spending which
indicates lobbying by the bidder can increase the target shareholder value significantly.
However, the bidder or the merging firms combined abnormal announcement returns are not
positively correlated with lobbying spending. Corporate lobbying activities relate to the
corporate governance or agency conflicts in the bidding firms, which could correlate to the
motivation of initiating a deal. Lobbying may let value destroying deals succeed more easily and
therefore value destroying for the bidding firm.

9
The organization of the paper is as follows: firstly we briefly introduced the intuitional
background of the merger review process; secondly we describe our data; then we document the
lobbying spending patterns and discuss the determinants lobbying spending; and lastly we show
the results of regressions of merger review outcomes and stock returns on lobbying spending to
evaluate its effectiveness and value implications.
2 Backgrounds of the Antitrust Review on M&As
The completion of a merger normally depends on several regulatory approvals.9 In the U.S., the
economically significant mergers are often required to achieve antitrust clearance before
consummating the deals. Pursuant to the The Hart–Scott–Rodino Antitrust Improvements Act of
1976 (“HSR Act” thereafter), most M&A transactions with the deal value above a size
threshold10 are required to report to two government agencies --- the Bureau of Competition of
the Federal Trade Commission (FTC) or the Antitrust Division in Department of Justice (DOJ).
We generally introduce the procedure of antitrust review on mergers in this section. 11
2.1 Premerger Notification Filings and Waiting Period
Before consummation of merger transactions, both the bidder and the target are required to
report to the antitrust agencies by filling out the premerger Notification and Report form (“HSR
premerger filling” thereafter) which provides information including the identity of the involved
parties, the financial statement, valuation, filings submitted to SEC, and any voluntary
disclosure. The submission of HSR premerger fillings starts a statutory waiting period of 30 days
(15 days in the case of a cash tender offer or a bankruptcy sale) and the merging firms cannot
consummate the deal before the expiration of the waiting period.12 The information in the HSR
premerger filling is not public, while firms often voluntarily disclose to the shareholders the
9 In addition to antitrust clearance, merging firms sometimes need to get approval from industry specific agencies.
For example, mergers involving a telecommunications company often require the permission of transferring
communication licenses from the Federal Communications Commission (FCC). Sometimes, firms also need to get
approvals from foreign antitrust agencies if the parties do business in other countries. But, US antitrust review
applies to almost all the economically significant deals involving a US target. 10 The threshold is adjusted yearly based on GNP growth rate, and ranges between $50 million and $100 million. In
2014, the threshold is $75.9 million. 11 For more information, see Appendix xxx and the documents of guidance and rule on HSR-related issues prepared
by FTC: http://www.ftc.gov/enforcement/premerger-notification-program/hsr-resources 12 If the last day of the waiting period is weekend or a holiday, the expiration day is the next working day.

10
status and date regarding the HSR premerger filling as an assessment of the regulatory risks and
timing of the takeover, especially when a publicly listed target is involved.13
Frequently, firms choose to strategically withdraw the HSR premerger filling and refile it later to
start another waiting period. It can provide additional time for the agencies to review the case
without immediately triggering Second Requests. But this action also lengthens the time to
complete the transaction.
2.2 Early Terminations, Second Requests and clearance of antitrust reviews
If the antitrust agencies have determined not to take any antitrust enforcement action during the
waiting period, the agencies may clear the antitrust review earlier by terminating the Waiting
Period (“Early Termination” thereafter). According to FTC, early termination is granted for most
transactions.
If the agencies decide to more closely review the deal after preliminary review, one of the
agencies may issue a request to the merging firms for additional information or documentary
materials (“Second Request” thereafter). The issuance of a Second Request extends the waiting
period. Firms have to substantially comply with the Second Requests before consummating the
deals. Upon firms certifying the substantial compliance with the Second Requests, the agencies
start a new waiting period for another 30 days (10 days for cash tender offers or bankruptcy
sales).
If firms receive an early termination, or do not receive a Second Request before the expiration
date of the waiting period, they are free to complete the merger transaction (“Waiting-Period
Expiration” thereafter). If the agencies eventually find the M&A transaction to be anti-
competitive, they can officially challenge the merger. The agencies can do so by initiating
injunction proceedings in the court to block the transaction. However, it is often possible to
resolve competitive concerns by consent agreement between the parties, which allows the
beneficial aspects of the deal to go forward while eliminating the competitive threat.
13 It is indicated by the guidelines to premerger filing that though the agencies do not reveal to the public any
information provided in the filings or the fact that a Premerger Notification has been filed, the agencies may
interview or handle requests from interested third parties which is a de facto information leak to the public regarding
the existence of the deals.

11
3 Data and Summary Statistics
3.1 The Merger Sample and the Merger Reviews by Antitrust Agencies
To evaluate the magnitude of the regulatory risks in M&A transactions, we investigate a sample
of economically significant and domestic mergers. We choose a merger sample from the SDC
M&A database and restrict the mergers to the following requirements: (1) the deal value is at
least $100 million and the percentage of shares sought in the deal is at least 50%; (2) the
announcement date is between January 1, 2008 and December 31, 2012; (3) the acquirer and the
target is a publicly traded company that can be matched to CRSP stock information at the time of
the announcement and with at least one year accounting information before the merger
announcement from Compustat; (4) both the acquirer and the target are not in financial or utility
industries; (5) the target nation is located in the U.S.; and (6) we exclude leveraged buyouts,
spinoffs, recapitalizations, self-tenders and exchange offers, repurchases, minority stake
purchases, acquisitions of remaining interest, and privatizations. The sample period starts in
2008 due to the availability of quarterly lobby data. We exclude financial and utility merger
deals since the regulations in financial and utility industries are tighter and the regulatory
approvals for these deals are more complex than other industries14. We focus on domestic M&A
deals so that the US antitrust review can be a major concern in the regulatory approval process.
In total, there are 290 deals that meet all the above requirements.
We collect the dates of submitting filings to regulatory agencies, receiving Second Requests,
receiving Early Terminations, expiration of waiting periods, and other related events of the
antitrust review process from SEC filings. As it is material information regarding the completion
and timing of merger transactions, most merging firms involving a public target merger report at
least one date related to their antitrust reviews.15 We search for keywords including “antitrust”,
“Second Request”, “Early Termination”, “HSR”, in filings S-4, 8K, 424, 425, DEF 14, DEFM
14, DEFR 14, DFAN 14, SC TO, SC 14, their amendments, and press releases. Out of 290
mergers, we find at least one date related to antitrust review for 240 mergers. Other than the 240
mergers, there are 9 mergers where the merging firms explicitly mention they are not required to
14 The M&As in financial or utility industries not only are subject to the investigations of the antitrust agencies, but
also need the approvals from more direct agencies, such as Federal Reserve or Federal Energy Regulatory
Commission. 15 See Appendix A2 for an illustration of the SEC filings on antitrust review procedures.

12
fulfill the HSR premerger fillings16, and two mergers where the antitrust approvals have been
cleared before deal announcements.
Based on the information collected from SEC filings, we create a flow chart of the process
(Figure 1) and report the median days that are taken in each step. We identify the officially
challenged cases by collecting merger information from the Hart-Scott-Rodino Annual Congress
Report from 2008 to 2013, and the antitrust case filings on the websites of the agencies. 17 In the
annual congress reports, the antitrust agencies describe every officially challenged deal during
the year. In total, we are able to find 20 challenged cases in our merger sample. For the
challenged cases, we collect the official final ruling dates as the enforcement dates.
On average, firms file the HSR premerger filling 11.5 days after the public announcement date.
Though there are 4 mergers where the firms file the HSR premerger filling before the public
announcement dates, in all the 240 deals, firms receive Early Terminations, Second Requests, or
Waiting-Period Expiration after the public announcement dates. In 34 cases, we observe firms
strategically withdraw the HSR premerger filling and refile it to start another waiting period. In
most cases, firms explicitly state in the SEC filings that it is to provide extra time for the
agencies to review their cases. After HSR premerger filling, most firms clear the antitrust review
quickly. In 98 mergers, outright approvals are granted soon—firms receive Early Termination in
12 days after HSR premerger filling dates and complete the transaction in 52 days. 108 mergers
have cleared the antitrust review with the natural expiration of waiting periods, and are
completed 29 days after the expiration dates. However, 34 mergers are considered likely to be
anticompetitive and receive Second Requests. In these cases it takes on average 142 days to
finalize the deals. The average days till resolution are almost tripling those of deals that are
granted antitrust approvals. Moreover, conditional on receiving Second Requests, the
probabilities of being officially challenged or withdrawing the transaction are also significantly
higher than others. Although not reported in Figure 1, 21 deals or 61.8% of the Second Request
16 The exemptions include the acquisition of raw lands, or foreign assets, of which the sales in the US are no more
than $50 million. 17 For DOJ: http://www.justice.gov/atr/cases/index.html and for FTC: http://www.ftc.gov/enforcement/cases-
proceedings.
13
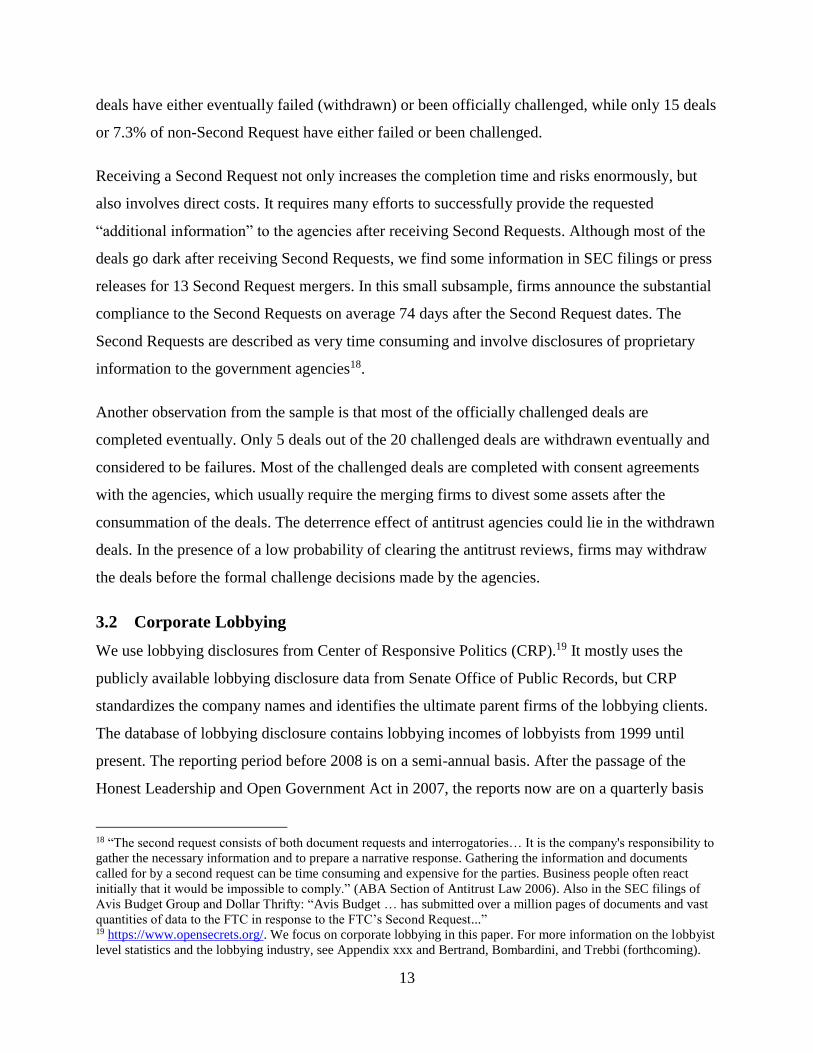
deals have either eventually failed (withdrawn) or been officially challenged, while only 15 deals
or 7.3% of non-Second Request have either failed or been challenged.
Receiving a Second Request not only increases the completion time and risks enormously, but
also involves direct costs. It requires many efforts to successfully provide the requested
“additional information” to the agencies after receiving Second Requests. Although most of the
deals go dark after receiving Second Requests, we find some information in SEC filings or press
releases for 13 Second Request mergers. In this small subsample, firms announce the substantial
compliance to the Second Requests on average 74 days after the Second Request dates. The
Second Requests are described as very time consuming and involve disclosures of proprietary
information to the government agencies18.
Another observation from the sample is that most of the officially challenged deals are
completed eventually. Only 5 deals out of the 20 challenged deals are withdrawn eventually and
considered to be failures. Most of the challenged deals are completed with consent agreements
with the agencies, which usually require the merging firms to divest some assets after the
consummation of the deals. The deterrence effect of antitrust agencies could lie in the withdrawn
deals. In the presence of a low probability of clearing the antitrust reviews, firms may withdraw
the deals before the formal challenge decisions made by the agencies.
3.2 Corporate Lobbying
We use lobbying disclosures from Center of Responsive Politics (CRP).19 It mostly uses the
publicly available lobbying disclosure data from Senate Office of Public Records, but CRP
standardizes the company names and identifies the ultimate parent firms of the lobbying clients.
The database of lobbying disclosure contains lobbying incomes of lobbyists from 1999 until
present. The reporting period before 2008 is on a semi-annual basis. After the passage of the
Honest Leadership and Open Government Act in 2007, the reports now are on a quarterly basis
18 “The second request consists of both document requests and interrogatories… It is the company's responsibility to
gather the necessary information and to prepare a narrative response. Gathering the information and documents
called for by a second request can be time consuming and expensive for the parties. Business people often react
initially that it would be impossible to comply.” (ABA Section of Antitrust Law 2006). Also in the SEC filings of
Avis Budget Group and Dollar Thrifty: “Avis Budget … has submitted over a million pages of documents and vast
quantities of data to the FTC in response to the FTC’s Second Request...” 19 https://www.opensecrets.org/. We focus on corporate lobbying in this paper. For more information on the lobbyist
level statistics and the lobbying industry, see Appendix xxx and Bertrand, Bombardini, and Trebbi (forthcoming).

14
and audited by U.S. Government Accountability Office annually, and the minimum criteria are
lowered. We manually match the client names and their ultimate parent company names to the
Compustat company names. Following Adelino and Dinc (2014), we treat the lobbying spending
for the quarter as zero for firms that we do not find a matched lobbying client in the lobbying
data.
Table 2 shows the summary statistics of corporate quarterly lobbying spending for bidder firms.
75.8% of the bidders in our merger sample have at least lobbied once between 2008 and 201220.
67.9% of them have lobbying experience before the merger announcement. On average, bidders
spend around $434,587 on lobbying per quarter. The amount of lobbying spending is similar to
those in other studies on corporate lobbying (Adelino and Dinc 2014; Chen, Parsley, and Yang
2014). We can observe a clear pattern emerging from the lobbying activities for bidders. For
deals that are in trouble, the lobbying efforts are significantly less for the bidder. In withdrawn
deals, bidders are significantly less experienced in lobbying. And lobbying expenditures are
much less for failed, challenged, or Second Request deals. The high correlations between the
bidder lobbying and regulatory outcomes indicate that lobbying activities may contribute to the
deal outcomes.
4 Consequences of Antitrust Review Outcomes
4.1 Stock Market Reactions to the Merger Review
We focus on the first stage review outcomes (Early Terminations, Second Requests, and Waiting
Period Expiration). We choose these three outcomes as our main focus of interests due to three
reasons. First, the first review outcomes are clearly observed and have more information
available. Second, the adverse review outcome from the first stage is severe enough and highly
correlates with deal failures. The days to resolution and risks to be challenged are more than
doubled. Third, the first stage outcomes all happen within the same fixed time frame. Firms
usually file after the announcement and the waiting period starts shortly after the public
announcement of the merger. Firms normally receive either clearance (Early Terminations, and
Waiting Period Expiration), or adverse feedbacks (Second Requests) by the end of the waiting
20 We combine the semi-annual lobbying data before 2008 together with the quarterly data after 2008 to measure the
lobbying growth and lobbying experience.

15
period. Thus, the first stage outcome reviews provides an ideal setting to compare the stock
market reactions to antitrust review outcomes.
In order to evaluate the potential cost of regulatory challenges in M&As, we calculate the
abnormal returns for the bidder and the target. We calculate the abnormal return in the event
windows using market model. In order to mitigate the announcement effect on the return
analysis, we first choose the abnormal return estimation window for beta estimation to be [-200,-
20] before the announcement dates, and then excluding the observations that could be
overlapping with the deal announcement event window. Although there is no announcement [-
1,+1] event window overlapping with our review outcome [-20,+20] event window, we choose
to drop the days before the fifth days after announcement (+5) so that the cumulative abnormal
returns are not driven by the short term market correction to the overreaction or underreaction to
announcement. Figure 3 presents CARs in the window of [-20,+20] around the review outcome
dates. Consistent with Aktas, de Bodt, and Roll (2004), we find that the stock market reacts
differently among the different kinds of mergesr antitrust review outcomes. Panel A is for the
combined return of the bidder and the target by forming the value-weighted portfolio of the
bidder and the target. There is a sharp drop in combined cumulative abnormal return from 10
days before the Second Request dates. And this downward tendency continues afterwards.
Waiting Period Expiration is basically a non-event as the CAR plot is relatively flat. CAR plot
around Early Termination dates shows a mild upward tendency although it is relatively small
compare to the magnitude of the drop in CAR around Second Requests. In Panel B and C, we
present the CAR plot for the bidder and the target respectively. The bidder shows very similar
pattern, while the target returns for the Second Requested mergers start to drop from day -20.
The observations are confirmed by the statistics in Table 3. In Panel B of Table 3, we can see
that the CAR[-10,+10] around Second Requests is up to -2.84%, significantly negative at the 1%
level. It is more than half of the combined announcement CAR 4.58%. The bidder and the target
also suffer from Second Request events with significantly negative abnormal returns, the target
with larger loss in market value than the bidder. The Combined CARs are not significant around
Early Termination dates and Waiting Period Expiration dates. The bidder and the target have
negative CAR[-10,1] around Waiting Period Expiration but they are only significant at 10% level
and have much smaller magnitude than those of Second Requests.

16
The CARs around antitrust review outcome dates also have implications to the motivation of the
mergers. We calculate the abnormal return of the value-weighted portfolio of rivals. The rivals
are identified following the Text Based Industry Category (TNIC) in Hoberg and Phillips (2010,
2014). According to Betton et al. (2008), collusion theory predicts that the rivals enjoy positive
return at announcement, and negative return at Second Request events since Second Requests
reduce the probability of the merger and thus reduce potential monopoly rents. However, the
rival announcement returns, even for the rivals of the Second Requested mergers, are not
significantly negative. Another market power theory hypothesizes that firms increase pricing
powers through taking over other firms, and rivals suffer from deal announcements and benefit
from Second Requests. However, the rival returns are the contrary to the predictions. Thus we do
not find evidence suggesting the mergers, or even the mergers that subsequently receive Second
Requests, are anti-competitive.
Another observation of CAR is based on Figure 2. By calculating the announcement CAR
separately for different antitrust review outcomes later on, we find that the mergers that
subsequently receive Second Requests have much higher combined announcement CAR. It
indicates that the mergers that receive Second Requests from the antitrust agencies have twice
the perceived synergies at merger announcements for deals get approvals. It is consistent with
Eckbo (1983) that the antitrust agencies select relatively more profitable mergers to scrutinize.
5 Corporate Lobbying Around Mergers
5.1 Corporate Lobbying Patterns
Many news articles have highlight the lobbying activities during corporate takeovers21. Kerr,
Lincoln, and Mishra (2011) indicate that up-front costs of entering the political process are
important in understanding lobbying behaviors. The adverse stock market reactions to Second
Requests implies the substantial costs of failing to manage the antitrust review process. It is not
21 “… the question was whether Congress would let the FTC do its job, or push them to raise unending red flags on
the deal.... It was no mean feat. There were 80 legislative letters about the deal sent to federal and state regulators
and 30 state attorneys general were involved in the review. And in 2011 and 2012, the companies spent more than
USD 7.5m on federal lobbyists...” (“How Medco won antitrust approval for a deal Wall Street considered doomed”
Financial Times, April 8, 2013)

17
surprising if firms increase political activities to gain the political clearance from the antitrust
agencies. Indeed, our sample supports the view that firms actively engage in lobbying activities
during mergers.
First, bidders lobby much more than other firms. Table 2 shows the summary statistics of
corporate quarterly lobbying spending for bidder firms. We also calculate the statistics for all
firms with book value always above $100 million (see Table A2 for the Compustat universe
lobbying statistics.). Since the bidders in our sample are involved in taking over another firm for
over $100 million, the sample of firms with book value at least $100 million should provide a
more meaningful comparison to our bidder sample. 75.8% of the bidders in our merger sample
have at least lobbied once between 2008 and 2012, while in comparison for all firm-quarter
observations, 42.5% of them can be matched with lobbying disclosures, i.e. the probability of an
average firm engaging in lobbying in a quarter is less than half. Only 28.1% of the unique firms
in the panel sample have lobbied at least once between 2008 and 2012. On average, bidders
spend around $434,587 on lobbying per quarter, comparing to $227,577 for an average
Compustat firm-quarter observation. The simple comparison reveals that bidders are also heavy
lobbying dollar spenders.
Bidders not just spend more than other firms, but also increase lobbying in the quarters around
mergers. Figure 4 reports the time-series pattern of lobbying for these bidders. The value on the
vertical axis is the difference lobbying spending comparing to the previous period, standardized
by asset value at quarter 0, the announcement quarter. We observe a significant upward jump of
around $5 per $million assets at the quarter of announcement, and a bigger jump of $12 per
$million assets in the second quarter after announcement. The average number of calendar
quarters for our sample mergers is 2.2. Although the targets also lobby, they on average lobby
much less than the bidders. Only several targets have positive lobbying spending and the
variation in target lobbying is not enough to run analysis. Therefore, we mainly focus on the
bidder lobbying in this study.
The variations in lobbying dollar spending can be induced by changes in firm characteristics. We
run panel tobit regressions with all firm-quarter observations for the firms with book value
always larger than $100 million, excluding financial and utility firms. We also include quarterly

18
and industry fixed effects to eliminate some industry lobbying pattern or time trend in lobbying.
We are interested in the quarter dummies relative to the announcement quarter. Quarter(s) equals
one if the firm is involved in a merger as a bidder in the sth quarter relative to the announcement
quarter. The results are reported in Table 4. Firms that have lower book-to-market ratio, more
heavily levered, are less tangible, are bigger, or are with lower sale growth, are more likely to
lobby. These are consistent with Kerr and Lincoln (2014). More interestingly, firms increase
their lobbying spending significantly around merger announcements. Across all firm-quarter
sample, bidders significantly doubling the average lobbying intensity by increasing almost $14
per $million asset in Quarter(-1) and Quarter(0). In the subsample of active lobbiers, where the
firms have at least lobbied once during the sample period, the bidders spend around $10 per
$million asset extra comparing to other average firms. The pattern persists until 3 quarters after
the announcement. The number of distinct lobbyists hired are also increased when the firms
engage in M&A activities. Bidders hire additional 0.616 lobbyists in the quarter before
announcement. If compared to other active lobbyists, bidders also hire almost 0.5 more lobbyists
from two quarters before the announcement. All these results suggest that bidders increase the
lobbying spending and hire more lobbyists around the announcement quarters.
5.2 Effectiveness of Lobbying on Merger Outcomes
Next we examine whether lobbying spending before announcement and during the mergers
reduce the risks in completing merger transactions. We evaluate the regulatory risks in M&As
using four categorical merger outcome variables. Firstly, we directly proxy for the deal outcomes
by constructing a HSR review outcome variable. It equals zero if the merger receive a Second
Request, 1 for Waiting Period Expiration, and 2 for Early Termination. We also use the simple
Second Request dummy as another proxy of the HSR review outcome. Secondly, we use
Challenge dummy to indicate the mergers that are eventually challenged by the agencies. The
challenged deals normally are completed with consent agreements with the antitrust agencies to
divest assets subsequently, or withdrawn. Finally the Withdrawn dummy indicates the actual
failures of the transaction. Some deals may be withdrawn before being officially challenged.
Therefore, Withdrawn dummy can capture some of the deterrence effects of antitrust reviews.
Summary statistics of Table 2 provides some preliminary implications. Lobbying spending by
bidders are significantly less for the mergers that subsequently get Second Requested,

19
Withdrawn, or Challenged. The differences are robust to all kinds of standardizations. The least
lobbying spending category is the deals that are eventually withdrawn. It could due to lack of
efforts to carry out the transaction, or lack of experience in dealing with government agencies.
We then use probit regressions to test the effectiveness of lobbying on reducing regulatory risks.
From Table 1, we observe that there are several deal characteristics that are significantly
different across the mergers, and could be important determinants for the deal outcome. Since the
bidders can perceive the regulatory risks based on the deal characteristics, we include the deal
characteristics to control for the perceptions. As lobbying spending has significant dependence
on certain firm characteristics, especially the firm size, we also include the firm characteristics as
controls. To control for some unobservable industry patterns and time effects, we also include
industry and year dummies (see Table 4 for the list of independent variables).
We first carry out a multinomial probit regression of the HSR review outcome, with the Waiting
Period Expiration (HSR review outcome=1) is the base case. We then estimate the marginal
effects of lobbying measures on the probability of receiving Second Requests or Early
Terminations. In the results of Model (1) to (4) of Table 5, the average quarterly $ lobbying
spending per $million asset during the merger significantly and negatively correlates with
regulatory risks. Specifically, one standard deviation increase in lobbying, significantly
decreases the probability of receiving Second Requests by 1.9 percentage points comparing to
the sample Second Request mean 14.2%, and increases (not significantly) the probability of
receiving Early Terminations by 4.5 percentage points comparing to the sample mean 40.8%.
The effects are stronger if we use the lobbying measures in the quarter before announcement.
And the results are robust to different styles of lobbying measures. We use the log transformation
of lobbying dollars, and the number of distinct lobbyists hired. Model (5) to Model (8) report the
results under different lobbying measures.
Similarly, the binary probit regression also indicates similar effects of lobbying on merger
outcomes. In Table 6, we present the results of the probit regressions of lobbying expenditure per
$million asset in the quarter before announcement on the binary deal outcomes. The magnitude
of the lobbying measure coefficient is larger when we use the binary Second Request as the
antitrust review outcome measure. Increased bidder lobbying spending is associated with the

20
probability of withdrawing the deal. It could be that the bidder lobbies in the quarter after the
announcement is associated with more willingness to complete the deal. One standard deviation
increase in the average quarterly lobbying intensity by the bidder is associated 3.8 percentage
points less likely to withdraw the deal. This is more than half of the Withdrawn risk (mean
8.7%). The effect of lobbying on the probability of being challenged is slightly higher. The one
standard deviation increase in the quarter before announcement reduces the probability of
challenge by 5.13 percentage points while the average challenge probability is 8.3%.
5.2.1 Endogeneity of the Effectiveness of Lobbying
There could be potential bias due to reverse causality and omitted variables. The reverse
causality arise from the following channel: the bidders may predict the risks lying in the mergers
and lobby more for riskier mergers. If so, lobbying spending should positively correlate with
regulatory risks, and such a bias works against our results. Since we have already found
significantly negative correlation between lobbying spending and regulatory risks, the true
effects of the effectiveness of lobbying may be even larger. Second, lobbying spending can be a
very persistent corporate action (Kerr et al. (2011)), and the correlations we observe are driven
by omitted variables. We use instrument variables to mitigate the bias.
We considered using two different instrument variables, the distance to Washington D.C., and
the number of mergers received by the antitrust agencies outside of the bidder industry. The
second variable can be a valid instrument since the overall busyness of the antitrust agencies can
increase the costs of communicating to them, but the busyness cannot direct influence the review
outcomes as firms can always strategically withdrawn premerger notification and refill again to
start another waiting period. With the possibility to extend the waiting period without triggering
Second Requests, busyness of the agencies should not directly impact the deal outcomes. Table 5
reports the two-stage IV probit using the busyness variable as an IV. We see that the significance
levels increase, and the economic magnitude are almost doubling the effects in probit
regressions.22
22 We also generate very similar results using the distance to D.C. as instrument and results are not tabulated.
However, the distance to D.C. IV suffers from weak instrument problems.

21
5.3 Value Implications
5.3.1 Announcement Returns and Lobbying Spending
Consistent with the reduced regulatory risks, we observe that the target announcement returns is
significantly positively associated with the quarterly lobbying intensity of the bidder. We use the
lobby in the quarter before merger announcement, as previous results indicate that lobbying
spending starts to increase in the quarter before merger announcement. The economic scale is
large. One standard deviation change in the bidder lobbying is positively associated with a 3.6-
percentage-point increase in the target announcement return. It is more than a tenth of the total
target abnormal return in reaction to the merger announcement. However, the acquirer
announcement return is not affected by the lobbying level. It indicates that although lobbying can
reduce the regulatory risks and therefore benefit the target shareholders, the payer of the
lobbying dollars – the bidder – does not enjoy the benefits.
There should be a potential benefit for the bidder that there is less risk for the bidder to be
obliged to pay the breakup fees in the case of merger failure. Such a benefit for the bidder maybe
canceled out by either excessive payment of premium to the target, or the sub-optimal decision
by the bidder manager to initiate the merger. We run a similar regression with the premium as
the dependent variable and we do not find lobbying spending has any impact on premium.
Borisov et al. (2014) suggest that part of the value of lobbying arises from likely unethical
practices. Aggarwal et al. (2012) show that firms with more political donations are more likely to
have characteristics consistent with the existence of a free cash flow problem, and that donations
are negatively correlated with stock returns. It could be the case that bidder lobbying spending
associated with agency problem or unethical practices is also correlates with actions not to
maximize shareholder values by doing a value-destroying takeover, or simply by spending
lobbying money to serve the manager’s own purposes. We interact lobbying spending with
management entrenchment index. The results indicates that for the management entrenched
bidders, the increased lobbying spending can lead to value destroying.
6 Robustness Checks
We also use different standardization for our lobbying measures. If we use the merger deal value
instead of firm size to standardize lobbying expenditures, all the analysis produces very similar

22
results. We also add the rival aggregate lobbying spending standardized by deal value as
additional controls. The original results remain unchanged.
6.1 Antitrust related lobbying
As an additional measure to the overall lobbying spending, we calculate the antitrust related
lobbying spending in robustness checks. We search for keywords “antitrust”, “merger”,
“acquisition”, and “takeover” in the lobbying reports. If a report contains one of the keywords in
the lobbying specific issue area, we consider the lobbying spending in the report as merger
related lobbying spending. However, since there is no rule to require companies to report the
detailed issue in a specific manner, very few lobbying disclosure mentioned these keywords.
Many of the filled details are extremely brief. The merger related lobbying measure can
underestimate the actual lobbying activities for the merger. Some of the characteristics of the
antitrust The chances of lobbying for merger-related issues are much less, with only 2.4%
probability. Our merger-related lobbying spending provides an additional check, with the caveat
that it could tremendously underestimate the actual merger-related lobbying spending
significantly. For those identifiable merger-related lobbying spending, the non-zero mean is
around $538,045, comparable to the $507,241 lobbying spending excluding these merger-related
lobbying. We also find the increase antitrust related lobbying spending cluster for bidders around
merger announcement quarters. However, due to lack of variation, we cannot perform other
analysis based on antitrust related lobbying.
7 Conclusion & Discussions
Antitrust has been one of the most commonly lobbied issues by the firms. Our analysis indicates
that corporate lobbying can leads to more favorable government decisions, which is consistent
with Adelino and Dinc (2014) and Alexander et al. (2009). In particular, we show that the bidder
can lower the risks of receiving adverse antitrust review opinions, increase the probability of
receiving outright approvals, be more likely to complete the transaction successfully, and finish
the deal sooner by spending more on lobbying. The stock market reaction of the target at the
announcement positively recognizes the effect of lobbying on mitigating regulatory risks.
But it is intriguing to find that such lobbying spending praised by the target shareholders does
not always add value to the bidder shareholders. There is a potential benefit for the bidder that

23
there is less risk for the bidder to be obliged to pay the breakup fees in the case of merger failure.
Such a benefit for the bidder is canceled out by either excessive payment of premium to the
target, or the sub-optimal decision by the bidder manager to initiate the merger. It could be the
case that bidder lobbying spending associated with agency problem or unethical practices is also
correlates with actions not to maximize shareholder values by doing a value-destroying takeover,
or simply by spending lobbying money to serve the manager’s own purposes. Future research
could be done to further discuss the channels.
Taken together, our study documents the regulatory risks in the economically most significant
corporate transactions, shows the pattern of firms actively managing regulatory risks in
investment activities, adds to the institutional understanding of merger review process, and
contributes to the knowledge of the benefits and costs of corporate lobbying. Even though under
the M&A setting, firms do get more favorable government decisions by bidder increasing
lobbying, the lobbying-dollar payer—the bidder—does not necessarily enjoy the value creation.

24
Reference
ABA Section of Antitrust Law. 2006. The Merger Review Process: A Step-by-Step Guide to U.S.
and Foreign Merger Review. Edited by Ilene Knable Gotts. 3rd ed. Chicago: American Bar
Association.
Adelino, Manuel, and Serdar I. Dinc. 2014. “Corporate Distress and Lobbying Evidence from the
Stimulus Act.” Journal of Financial Economics, no. forthcoming (July).
Aktas, Nihat, Eric de Bodt, and Richard Roll. 2004. “Market Response to European Regulation
of Business Combinations.” Journal of Financial and Quantitative Analysis 39 (4): 731.
Alexander, Raquel, Stephen W. Mazza, and Susan Scholz. 2009. “Measuring Rates of Return on
Lobbying Expenditures.” The Journal of Law & Politics 25: 401.
Chen, Hui, DC Parsley, and Y Yang. 2014. “Corporate Lobbying and Firm Performance.”
Available at SSRN.
Clougherty, J. a., and J. Seldeslachts. 2012. “The Deterrence Effects of US Merger Policy
Instruments.” Journal of Law, Economics, and Organization 29 (5): 1114–44.
Eckbo, B. Espen. 1992. “Mergers and the Value of Antitrust Deterrence.” The Journal of
Finance 47 (3).
Eckbo, BE, and P Wier. 1985. “Antimerger Policy under the Hart-Scott-Rodino Act: A
Reexamination of the Market Power Hypothesis.” Journal of Law and Economics 28 (1):
119–49.
Houston, JF, Chen Lin, and Y Ma. 2012. “Regulatory Arbitrage and International Bank Flows.”
The Journal of Finance LXVII (5).
Karolyi, GA, and AG Taboada. 2013. “Regulatory Arbitrage and Cross-Border Bank
Acquisitions.” The Journal of Finance Accepted.
Kerr, William R, and William Lincoln. 2014. “The Dynamics of Firm Lobbying.” American
Economic Journal: Economic Policy 6 (343-79): 1–26.
Marceau, Nicolas, and Michael Smart. 2003. “Failure Corporate Lobbying and Commitment in
Capital Taxation.” The American Economic Review 93 (1): 241–51.
Seldeslachts, Jo, Joseph A. Clougherty, and Pedro Pita Barros. 2009. “Settle for Now but Block
for Tomorrow: The Deterrence Effects of Merger Policy Tools.” The Journal of Law and
Economics 52 (3): 607–34.

25
Zucman, Gabriel. 2014. “Taxing across Borders: Tracking Personal Wealth and Corporate
Profits.” Journal of Economic Perspectives 28 (4): 121–48.
26
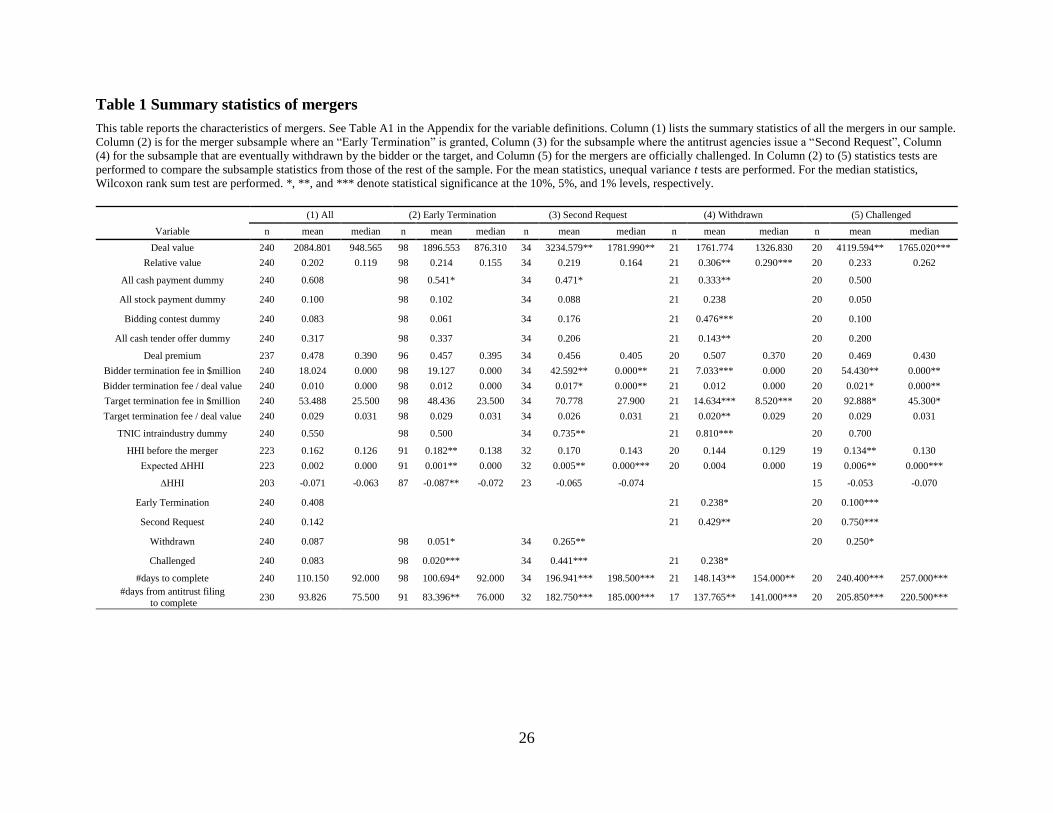
Table 1 Summary statistics of mergers
This table reports the characteristics of mergers. See Table A1 in the Appendix for the variable definitions. Column (1) lists the summary statistics of all the mergers in our sample.
Column (2) is for the merger subsample where an “Early Termination” is granted, Column (3) for the subsample where the antitrust agencies issue a “Second Request”, Column
(4) for the subsample that are eventually withdrawn by the bidder or the target, and Column (5) for the mergers are officially challenged. In Column (2) to (5) statistics tests are
performed to compare the subsample statistics from those of the rest of the sample. For the mean statistics, unequal variance t tests are performed. For the median statistics,
Wilcoxon rank sum test are performed. *, **, and *** denote statistical significance at the 10%, 5%, and 1% levels, respectively.
(1) All (2) Early Termination (3) Second Request (4) Withdrawn (5) Challenged
Variable n mean median n mean median n mean median n mean median n mean median
Deal value 240 2084.801 948.565 98 1896.553 876.310 34 3234.579** 1781.990** 21 1761.774 1326.830 20 4119.594** 1765.020***
Relative value 240 0.202 0.119 98 0.214 0.155 34 0.219 0.164 21 0.306** 0.290*** 20 0.233 0.262
All cash payment dummy 240 0.608 98 0.541* 34 0.471* 21 0.333** 20 0.500
All stock payment dummy 240 0.100 98 0.102 34 0.088 21 0.238 20 0.050
Bidding contest dummy 240 0.083 98 0.061 34 0.176 21 0.476*** 20 0.100
All cash tender offer dummy 240 0.317 98 0.337 34 0.206 21 0.143** 20 0.200
Deal premium 237 0.478 0.390 96 0.457 0.395 34 0.456 0.405 20 0.507 0.370 20 0.469 0.430
Bidder termination fee in $million 240 18.024 0.000 98 19.127 0.000 34 42.592** 0.000** 21 7.033*** 0.000 20 54.430** 0.000**
Bidder termination fee / deal value 240 0.010 0.000 98 0.012 0.000 34 0.017* 0.000** 21 0.012 0.000 20 0.021* 0.000**
Target termination fee in $million 240 53.488 25.500 98 48.436 23.500 34 70.778 27.900 21 14.634*** 8.520*** 20 92.888* 45.300*
Target termination fee / deal value 240 0.029 0.031 98 0.029 0.031 34 0.026 0.031 21 0.020** 0.029 20 0.029 0.031
TNIC intraindustry dummy 240 0.550 98 0.500 34 0.735** 21 0.810*** 20 0.700
HHI before the merger 223 0.162 0.126 91 0.182** 0.138 32 0.170 0.143 20 0.144 0.129 19 0.134** 0.130
Expected ∆HHI 223 0.002 0.000 91 0.001** 0.000 32 0.005** 0.000*** 20 0.004 0.000 19 0.006** 0.000***
∆HHI 203 -0.071 -0.063 87 -0.087** -0.072 23 -0.065 -0.074 15 -0.053 -0.070
Early Termination 240 0.408 21 0.238* 20 0.100***
Second Request 240 0.142 21 0.429** 20 0.750***
Withdrawn 240 0.087 98 0.051* 34 0.265** 20 0.250*
Challenged 240 0.083 98 0.020*** 34 0.441*** 21 0.238*
#days to complete 240 110.150 92.000 98 100.694* 92.000 34 196.941*** 198.500*** 21 148.143** 154.000** 20 240.400*** 257.000***
#days from antitrust filing
to complete 230 93.826 75.500 91 83.396** 76.000 32 182.750*** 185.000*** 17 137.765** 141.000*** 20 205.850*** 220.500***

27
Table 2 Summary Statistics of Lobbying: Bidders lobbying around mergers
This table reports the lobbying activities of bidders. See Table A1 in the Appendix for the variable definitions. Column (1) lists the summary statistics of all the bidders in our
sample. Column (2) is for the merger subsample where an “Early Termination” is granted, Column (3) for the subsample where the antitrust agencies issue a “Second Request”,
Column (4) for the subsample that are eventually withdrawn by the bidder or the target, and Column (5) for the mergers are officially challenged. In Column (2) to (5) statistic tests
are performed to compare the subsample statistics from those of the rest of the sample. For the mean statistics, unequal variance t tests are performed. For the median statistics,
Wilcoxon rank sum test are performed. *, **, and *** denote statistical significance at the 10%, 5%, and 1% levels, respectively.
(1) All (2) Early Termination (3) Second Request (4) Withdrawn (5) Challenged
Variable n mean median n mean median n mean median n mean median n mean median
Lobbying dummies
Active lobbier 240 0.758 98 0.745 34 0.735 21 0.667 20 0.650
Lobby experience before the merger 240 0.679 98 0.663 34 0.618 21 0.429** 20 0.500
Log value of the dollar amount of lobbying
Lobbying in the merger 240 7.469 10.309 98 7.533 10.506 34 5.878* 7.766** 21 3.920*** 0.000*** 20 4.906* 0.000*
Lobbying at the announcement quarter 240 7.524 10.911 98 7.588 11.316 34 5.899 0.000* 21 3.369*** 0.000*** 20 5.348 0.000
Lobbying in the quarter before the announcement 240 7.520 10.597 98 7.825 11.223 34 5.222** 0.000** 21 3.309*** 0.000*** 20 4.693* 0.000
Dollar amount of lobbying standardized by firm size
Lobbying in the merger 240 12.824 4.490 98 14.678 5.462 34 6.666*** 0.340* 21 2.344*** 0.000*** 20 5.831** 0.000**
Lobbying at the announcement quarter 240 12.626 3.367 98 14.054 4.919 34 7.831* 0.000* 21 2.403*** 0.000*** 20 6.797* 0.000*
Lobbying in the quarter before the announcement 240 11.583 3.587 98 12.538 3.991 34 3.930*** 0.000*** 21 2.786*** 0.000*** 20 3.788*** 0.000**

28
Table 3 Cumulative Abnormal Returns at Different Event Dates
This table reports the statistics of cumulative abnormal returns (CARs) at different event dates. Panel A presents three-day-
windows CARs around the merger announcements. Panel B presents the CAR(-5,1) and the CAR(-10,1) around the dates when
the government antitrust review outcomes are determined. There are three mutually exclusive types of events regarding the
antitrust review outcomes. The CAR statistics in Panel B are reported respectively. CARs are calculated using the market model
and are based on the (-200,-20) estimation windows of the announcement dates. The Role columns indicate the CAR statistics on
the row is for the bidder and the target combined (Combined), for the Bidder, for the Target, and for the rival firms of the bidders
(Rivals). The Combined CARs are calculated by forming a value-weighted portfolio of the bidder and the target. The Rivals
CARs are calculated by forming a value-weighted portfolio of the rival firms for each bidder based on TNIC industry in Hoberg
and Phillips (2010, 2014). For the CAR statistics, t tests are performed. *, **, and *** denote statistical significance at the 10%,
5%, and 1% levels, respectively.
Panel A: Announcement Returns
Role n CAR(-1,1) t-stat
Combined 240 4.58% 8.793***
Bidder 240 -0.60% -1.216
Target 240 33.72% 17.826***
Rivals 223 0.13% 1.522
Panel B: Abnormal Returns at Antitrust Review Outcome Dates
Event Type Role n CAR(-5,1) t-stat n CAR(-10,1) t-stat
Early Termination Combined 98 -0.11% -0.2402 98 -0.35% -0.6863
Bidder 98 -0.02% -0.0413 98 -0.26% -0.4627
Target 98 0.21% 0.4689 98 -0.28% -0.5565
Rivals 91 -0.10% -0.3305 91 -0.19% -0.5331
Waiting-Period Expiration Combined 107 -0.08% -0.2159 107 -0.70% -1.5829
Bidder 107 -0.23% -0.564 107 -0.91% -1.7073*
Target 107 -0.31% -0.5313 107 -1.14% -1.6619*
Rivals 99 -0.17% -0.7978 99 0.00% 0.0184
Second Request Combined 34 -1.65% -2.2342** 34 -2.84% -2.7324***
Bidder 34 -1.34% -1.6487 34 -2.91% -2.4369**
Target 34 -2.48% -2.2179** 34 -3.34% -2.0728**
Rivals 32 -0.33% -0.7284 32 -0.82% -2.0526**

29
Table 4 Determinants of bidders’ lobbying, Tobit regressions.
The table reports the panel results of Tobit regressions for firms with quarterly total assets always above $100
million. The dependent variables Lobbying in Model (1) and (2) are the dollar lobbying spending per million dollar
asset. The dependent #Lobbyists Hired variables in Model (3) and (4) are the number of unique lobbyists hired
during the quarter per thousand dollar asset. The independent variables, BM, ROA, Log(Asset), Leverage,
Tangibility, and Sales Growth, are lagged one quarter and follow the definition in Appendix Table A1. The quarter
dummies Quarter(-s) / Quarter(s) indicate the quarter is s quarter before/after the announcement of a merger, during
which period the firm acts as a bidder. Industry dummies are constructed based on 2-digit SIC codes.
Heteroskedasticity-robust standard errors are clustered at the firm level. T-statistics are in parentheses. *, **, and
*** denote statistical significance at the 10%, 5%, and 1% levels, respectively.
(1) (2) (3) (4) Dependent variable Lobbying Lobbying #Lobbyists Hired #Lobbyists Hired
Quarter(-3) 8.689 6.351 0.430 0.427
(1.171) (1.060) (1.309) (1.517)
Quarter(-2) 11.303 8.740 0.492 0.475* (1.574) (1.523) (1.549) (1.772)
Quarter(-1) 13.538** 10.271* 0.616** 0.577** (1.975) (1.862) (1.982) (2.221)
Quarter(0) 13.961* 10.651* 0.506 0.442*
(1.915) (1.764) (1.614) (1.678) Quarter(1) 11.029 9.183* 0.479 0.488*
(1.616) (1.676) (1.592) (1.927) Quarter(2) 11.145 11.330** 0.423 0.509**
(1.603) (1.979) (1.489) (2.245) Quarter(3) 11.370 11.163** 0.461 0.522**
(1.641) (2.021) (1.643) (2.358)
Firm characteristic controls
BM -65.464*** -57.696*** -2.634*** -2.180*** (-5.876) (-5.307) (-4.792) (-4.135)
Log(Asset) 25.224*** 1.139 0.853*** -0.252***
(17.589) (0.723) (10.723) (-3.651)
ROA -196.600* -126.169 -11.196** -9.868* (-1.928) (-1.294) (-2.243) (-1.939)
Leverage -1.605 -29.214** -0.380 -1.807*** (-0.123) (-2.087) (-0.689) (-2.921)
Tangibility -22.656 14.403 -0.877 0.638 (-1.411) (0.904) (-1.282) (0.948)
Sales Growth -2.428 4.371 0.010 0.351
(-0.549) (0.886) (0.055) (1.602) Constant -135.853** 94.596** -4.386 6.275**
(-2.475) (2.037) (-1.443) (2.147)
Firm-quarter Observations 49,286 21,114 49,286 21,114 Industry FE Yes Yes Yes Yes
Time FE Yes Yes Yes Yes Sample All Active Lobbiers All Active Lobbiers
Pseudo R-squared 0.0411 0.0134 0.0490 0.0179

30
Table 5 Effects of lobbying on antitrust review outcomes, multinomial probit.
The table reports the multinomial logit regression results of the effects of lobbying spending on antitrust outcomes. All the coefficient reported are average marginal effects on the probabilities of
receiving Second Requests or Early Termination. The independent variable Lobbying in Model (1) to Model (3) is the quarterly average dollar lobbying spending per million dollar total asset from the
deal announcement quarter to deal resolution quarter. Lobbying(-1) in Model (4) is the dollar lobbying spending per million dollar total in the quarter before deal announcement. Lobbying measures in
Model (5) and (6) are log transformation of the average lobbying from the deal announcement quarter to deal resolution quarter, and the lobbying spending in the quarter before the announcement
quarter, respectively. Lobbying measures in Model (7) and (8) are the average number of distinct lobbyists hired from the deal announcement quarter to deal resolution quarter, and the average
number of distinct lobbyists hired in the quarter before the announcement quarter, respectively. The other independent variables follow the definition in Appendix Table A1. T-statistics are in
parentheses. Heteroskedasticity-robust standard errors clustered at the Fama-French five sectors level are used to calculate the significance levels. *, **, and *** denote statistical significance at the
10%, 5%, and 1% levels, respectively.
(1) (2) (3) (4) (5) (6) (7) (8)
Marginal Probability Second
Request
Early
Terminatio
n
Second
Request
Early
Terminatio
n
Second
Request
Early
Terminatio
n
Second
Request
Early
Terminatio
n
Second
Request
Early
Terminatio
n
Second
Request
Early
Terminatio
n
Second
Request
Early
Terminatio
n
Second
Request
Early
Terminatio
n
Lobbying(-1) -
0.0020** 0.0014
-
0.0143**
*
0.0158***
-
0.00689*
*
0.0168***
(-2.54) (1.33) (-4.96) (2.63) (-2.29) (4.10)
Lobbying -0.0006* 0.0013 -
0.0006** 0.0011
-
0.0005** 0.0014
-
0.0107**
*
0.0109* -0.0131 0.0258**
(-1.71) (1.35) (-2.48) (1.13) (-2.23) (1.18) (-3.36) (1.82) (-1.55) (2.42)
Log(Deal value) 0.0364** -0.0354** 0.0507 -0.0557* 0.0416 -0.0337 0.0400 -0.0329 0.0411 -0.0318 0.0400 -0.0304 0.0306 -0.0106 0.0389 -0.0176
(2.11) (-2.43) (1.23) (-1.82) (0.96) (-1.06) (0.95) (-1.00) (0.95) (-1.00) (0.93) (-0.99) (0.69) (-0.34) (0.81) (-0.52)
Relative value -0.156** 0.0315 -0.248 0.145 -0.249 0.184 -0.235 0.179 -0.258 0.176 -0.247 0.178 -0.214 0.0861 -0.240 0.114
(-2.42) (0.15) (-1.27) (0.70) (-1.30) (1.00) (-1.39) (1.02) (-1.40) (1.05) (-1.39) (1.08) (-1.13) (0.49) (-1.14) (0.58)
All cash 0.0319 -0.312*** 0.0251 -0.287*** 0.0236 -0.241*** 0.0302 -0.256*** 0.00910 -0.238*** 0.0181 -0.245*** 0.00758 -0.218*** 0.0168 -0.230***
(0.35) (-5.04) (0.25) (-4.83) (0.20) (-5.00) (0.27) (-6.61) (0.08) (-5.50) (0.15) (-6.45) (0.07) (-6.98) (0.15) (-7.72)
All stock -0.125** -0.113 -0.0927 -0.108 -0.0655 -0.0840 -0.0589 -0.0933 -0.0800 -0.0825 -0.0942 -0.0658 -0.0725 -0.0833 -0.0696 -0.0861
(-2.29) (-0.76) (-1.18) (-0.92) (-0.72) (-0.60) (-0.66) (-0.62) (-0.90) (-0.57) (-1.15) (-0.48) (-0.93) (-0.58) (-0.84) (-0.59)
Target termination
fee / deal value -4.371** -0.0308 -3.154 -1.590 -2.597 -1.622 -2.929 -1.607 -3.110* -1.402 -3.159* -1.347 -2.599 -2.173 -2.563 -2.027
(-2.13) (-0.01) (-1.31) (-1.05) (-1.31) (-0.74) (-1.64) (-0.73) (-1.77) (-0.55) (-1.67) (-0.59) (-1.21) (-0.97) (-1.20) (-0.95)
Bidder termination
fee / deal value 1.584 3.077* 1.600 3.317** 1.421 3.397*** 1.302 3.365*** 0.979 3.658*** 0.950 3.808*** 1.318 3.620*** 1.401 3.413***
(0.99) (1.77) (0.96) (2.43) (0.94) (3.75) (0.87) (3.87) (0.67) (3.85) (0.67) (4.00) (0.95) (5.06) (0.98) (4.15)
Bidding contest 0.0141 -0.0327 0.0337 -0.0719 0.0800 -0.133 0.0852 -0.147 0.0907 -0.138 0.0948 -0.165 0.0794 -0.131 0.0827 -0.138
(0.18) (-0.34) (0.45) (-0.66) (0.95) (-0.67) (1.01) (-0.67) (1.10) (-0.68) (1.30) (-0.80) (0.96) (-0.67) (1.01) (-0.69)
All cash tender offer -0.0393 0.190*** -0.0328 0.184*** -0.0189 0.131*** -0.0205 0.144*** -0.00671 0.131*** -0.0148 0.143*** 0.00157 0.0986** -0.0142 0.128***
(-0.75) (5.67) (-0.79) (4.69) (-0.41) (4.45) (-0.45) (5.57) (-0.14) (5.83) (-0.30) (6.95) (0.05) (2.47) (-0.31) (7.06)
TNIC intraindustry 0.117*** -0.118 0.109*** -0.0843 0.132*** -0.0460 0.132*** -0.0514 0.125*** -0.0498 0.117*** -0.0409 0.126*** -0.0416 0.129*** -0.0470
(3.96) (-1.58) (4.51) (-1.14) (3.71) (-0.55) (4.05) (-0.59) (3.78) (-0.62) (3.33) (-0.51) (3.35) (-0.52) (3.50) (-0.60)
Target initiation 0.0294 -0.0874** 0.0420 -0.0862** 0.0182 -0.131*** 0.0126 -0.124** 0.0265 -0.129** 0.0195 -0.127** 0.00686 -0.117** 0.0137 -0.116**
(1.08) (-1.97) (0.93) (-2.15) (0.28) (-2.58) (0.21) (-2.52) (0.41) (-2.48) (0.32) (-2.51) (0.11) (-2.22) (0.21) (-2.36)
HHI before the
merger 0.145 0.666** 0.164 0.651** 0.142 0.654** 0.128 0.672** 0.176 0.567* 0.164 0.608*
(1.04) (2.33) (1.14) (2.15) (1.10) (2.27) (0.88) (2.33) (1.20) (1.91) (1.09) (1.92)
Expected ∆HHI -0.0449 -2.593 -0.0546 -2.285 0.229 -2.528 0.385 -2.750 -0.123 -2.215 -0.105 -2.400
(-0.06) (-1.25) (-0.11) (-1.10) (0.37) (-1.34) (0.71) (-1.43) (-0.16) (-1.21) (-0.13) (-1.29)
Lobbying measures Lobbying Lobbying Lobbying Lobbying log(1+
$Lobbying) log(1+$Lobbying) #lobbyists #lobbyists
N 240 240 215 215 215 215 215 215
Bidder controls No Yes Yes Yes Yes Yes Yes Yes
Year Dummy Yes Yes Yes Yes Yes Yes Yes Yes
Industry Dummy Yes Yes Yes Yes Yes Yes Yes Yes

31
Table 6 Effects of lobbying on merger outcomes, binary outcomes
The table reports the binary probit regression results of the effects of lobbying spending on antitrust outcomes. All the coefficient reported are
average marginal effects on the probabilities. The independent variable Lobbying(-1) in Model (1) to Model (3) is the dollar lobbying spending per
million dollar total in the quarter before deal announcement. The other independent variables follow the definition in Appendix Table A1. Model (1)
is a probit model with the Second Request dummy as the dependent variable, Model (2) uses Withdrawn as the dependent variable, and Model (3)
uses Challenge dummy as dependent variable. T-statistics are in parentheses. Heteroskedasticity-robust standard errors are used to calculate the
significance levels *, **, and *** denote statistical significance at the 10%, 5%, and 1% levels, respectively.
(1) (2) (3)
Second Request Withdrawn Challenge
Margin Margin Margin
Lobbying(-1) -0.003** -0.003*** -0.004**
(-2.258) (-3.650) (-2.377)
Deal Characteristics
Log(Deal value) 0.051** 0.036* 0.045**
(2.042) (1.692) (2.377)
Relative value -0.388** -0.239** -0.273**
(-2.080) (-2.243) (-2.173)
All cash -0.021 -0.024 0.006
(-0.341) (-0.632) (0.134)
All stock -0.033 0.021 -0.119*
(-0.499) (0.577) (-1.904)
Target termination fee / deal value -0.381 -3.469*** 1.041
(-0.193) (-2.718) (0.565)
Bidder termination fee / deal value 1.412 0.524 1.079
(1.312) (0.660) (1.298)
Bidding contest 0.113* 0.192*** -0.153*
(1.823) (4.773) (-1.719)
All cash tender offer -0.020 -0.060 -0.018
(-0.353) (-1.579) (-0.476)
TNIC intraindustry 0.081 -0.006 -0.003
(1.273) (-0.163) (-0.077)
HHI before the merger 0.209 -0.207* -0.294*
(0.927) (-1.837) (-1.853)
Expected ∆HHI 4.820 -2.122 7.321**
(1.172) (-0.657) (2.120)
Firm Characteristics
BM 0.437*** 0.165** 0.342***
(2.737) (2.034) (2.694)
Log(Asset) -0.025 -0.040** -0.011
(-0.948) (-2.002) (-0.552)
ROA 0.471 -0.109 0.304
(1.523) (-0.639) (1.236)
Leverage -0.329** -0.080 0.043
(-2.355) (-0.873) (0.485)
Tangibility 0.138 0.043 0.110
(1.091) (0.612) (1.051)
Sale growth 0.000 -0.011 0.000
(0.566) (-1.000) (1.121)
R&D 0.202 0.469* 0.630
(0.363) (1.802) (1.299)
N 220 220 220
Year Dummy Yes Yes Yes
Industry Dummy Yes Yes Yes
.

32
Table 7 Effects of lobbying on antitrust review outcomes, IV approach
The table reports the regression results of the effects of lobbying spending on merger outcomes. The independent variable Lobbying is
the dollar lobbying spending per million dollar asset. The other independent variables follow the definition in Appendix Table A1.
The two-stage IV probit regressions are performed in Model (1), (2), and (3). Model (5) and Model (6) are two-stage IV regressions.
The IV used is the number of mergers received by the antitrust agencies during the fiscal year outside the merger 3-digit NAIC
industry. T-statistics are in parentheses. Heteroskedasticity-robust standard errors are used to calculate the significance levels *, **,
and *** denote statistical significance at the 10%, 5%, and 1% levels, respectively.
(1) (2) (3)
Second Request Withdrawn Challenge
Margin Margin Margin
Lobbying -0.061*** -0.066*** -0.060***
(-10.487) (-2.769) (-9.788)
Deal Characteristics
Log(Deal value) -0.069 -0.014 -0.091
(-0.320) (-0.033) (-0.678)
Relative value -0.069 -0.333 0.102
(-0.051) (-0.141) (0.127)
All cash -0.122 -0.137 -0.115
(-0.606) (-0.587) (-0.578)
All stock 0.021 0.130 0.006
(0.063) (0.329) (0.017)
Target termination fee / deal value -6.122 -13.670 -3.798
(-0.587) (-0.351) (-0.563)
Bidder termination fee / deal value -3.396 -3.493 -4.241
(-0.437) (-0.455) (-0.789)
Bidding contest 0.067 0.487 0.004
(0.203) (0.261) (0.013)
All cash tender offer 0.331* 0.186 0.339**
(1.831) (0.270) (2.011)
TNIC intraindustry -0.171 -0.185 -0.227
(-0.491) (-0.584) (-1.220)
HHI before the merger 0.484 0.023 0.217
(0.479) (0.014) (0.215)
Expected ∆HHI 26.633 20.972 24.988
(1.230) (0.839) (1.264)
Firm Characteristics
BM -0.111 0.059 -0.188
(-0.102) (0.034) (-0.231)
Log(Asset) 0.048 -0.035 0.061
(0.357) (-0.077) (0.668)
ROA 1.091 0.654 1.057
(0.713) (0.365) (0.714)
Leverage -0.227 -0.101 -0.025
(-0.258) (-0.166) (-0.045)
Tangibility 0.041 -0.034 -0.032
(0.068) (-0.065) (-0.065)
Sale growth -0.001* -0.033 -0.001**
(-1.842) (-0.260) (-2.171)
R&D 2.683 3.657 2.557
(1.187) (0.694) (1.246)
N 220 220 220
Year Dummy Yes Yes Yes
Industry Dummy Yes Yes Yes

33
Table 9 Regression of announcement returns on lobbying
The table reports the regression results of the effects of lobbying spending on merger announcement abnormal returns. The dependent variables are
the 3-day-window announcement returns. The independent variables follow the definition in Appendix Table A1. Model (1) and Model (2) use the
bidder announcement returns as dependent variables, Model (3) the target announcement return. T-statistics are in parentheses. Heteroskedasticity-
robust standard errors are used to calculate the significance levels *, **, and *** denote statistical significance at the 10%, 5%, and 1% levels,
respectively.
(1) (2) (3)
Bidder CAR Bidder CAR Target CAR
Lobbying 0.000 0.002* 0.002*
(1.353) (1.938) (1.664)
Lobbying*E index -0.001**
(-2.089)
Deal Characteristics Log(Deal value) -0.005 -0.011** -0.016
(-1.189) (-2.175) (-0.606)
Relative value 0.002 0.025 -0.264***
(0.031) (0.437) (-3.037)
All cash 0.033** 0.040*** 0.030
(2.242) (2.636) (0.616)
All stock -0.009 -0.023 -0.142***
(-0.404) (-1.025) (-3.322)
Target termination fee / deal value -0.081 -0.501 -1.273
(-0.167) (-0.995) (-0.785)
Bidder termination fee / deal value 0.280 0.072 0.724
(0.861) (0.222) (0.819)
Bidding contest 0.029 0.033 -0.079
(1.385) (1.343) (-1.216)
All cash tender offer -0.012 -0.019* 0.014
(-1.320) (-1.821) (0.321)
TNIC intraindustry 0.002 -0.002 0.025
(0.164) (-0.200) (0.625)
HHI before the merger 0.041 0.008 -0.047
(0.719) (0.127) (-0.301)
Expected ∆HHI 0.570 1.303 2.978
(0.470) (0.976) (0.633)
Frim Characteristics Log(Asset) -0.002 -0.004 0.001
(-0.312) (-0.734) (0.046)
ROA 0.114* 0.067 -0.224
(1.962) (0.914) (-1.614)
Leverage 0.056 0.064 0.147**
(1.273) (1.620) (2.014)
E index 0.006
(1.062)
Constant -0.019 0.049 0.514***
(-0.316) (0.767) (3.401)
Observations 240 183 240
Year Dummy Yes Yes Yes Industry Dummy Yes Yes Yes R-squared 0.125 0.194 0.244
Adj R-squared 0.0320 0.0653 0.164

34
Figure 1 Flow chart of antitrust review process
This figure shows the process of the antitrust review process, the number of mergers that are engaged in each step and the number of days to take each step and days till the final
effective or withdrawn dates. All days are median.
240 mergersannounced
Deal Completion
Deal Withdrawn
Filing for HSR(230 with exact
filing dates)
11.5 Days
98 mergers receiving “early
termination”
12 days
34 mergers withdrawing and refiling HSR filings
108 mergers with waiting period
expiring30 days
34 mergers receiving “second
requests”
30 days
29 days
13 mergers announcing
certifying substantial compliance
68 days
5 mergers 78 days
101 mergers 28 days
93 merger 50 days
7 mergers 48 days
25 mergers 147 days
9 mergers 118 days
20 challenged21 withdrawn92 days till resolution
75.5 days till completion
6 challenged4 withdrawn77.5 days till resolution
15 challenged9 withdrawn
142 days till resolution
3 challenged7 withdrawn
29 days till resolution
2 challenged5 withdrawn
52 days till resolution
6 challenged4 withdrawn74 days till resolution

35
Figure 2 Announcement CAR plot
This figure plots the announcement cumulative abnormal returns of the bidder and the target combined. The combined CAR are
calculated by constructing a value-weighted portfolio of the bidder and the target. The sample is divided into three subsamples
according to the antitrust review outcomes released after the deal announcement. The red line represents the deals that later are
Second Requested by the antitrust agencies. The blue line represents the subsample that is with the natural Waiting-Period
Expiration. The green line represents the subsample in which deals later receive quick approval Early Termination.

36
Figure 3 CAR plot around antitrust review outcome dates
This figures plot the cumulative abnormal returns of the bidder and the target around the dates when the government antitrust
review outcomes are decided. Panel A reports CAR for the combined CAR. The combined CARs are calculated by constructing a
value-weighted portfolio of the bidder and the target. Panel B reports CAR for the bidders and Panel C for the targets. The
sample is divided into three subsamples according to the antitrust review outcomes released after the deal announcement. The red
lines represent the deals that are Second Requested by the antitrust agencies. The blue lines represent the subsample that is with
the natural Waiting-Period Expiration. The green lines represent the subsample in which deals receive quick approval Early
Termination.
Panel A The bidder and the target combined returns

37
Panel B Bidder CAR
Panel C Target CAR

38
Figure 4 Changes in Lobbying Spending in Quarters around Merger Announcement.
This graph depicts the lobbying growth of the bidder around the merger announcement quarter. The value on the
vertical axis is the quarterly change in the lobbying amount per $million asset. Zero on the horizontal axis is the
quarter of merger announcements.

39
Appendix
Table A1 Variable Definitions
Variable Variable Sources
Deal Characteristics
Deal value Deal value in $million. SDC
Relative value Relative deal value. Deal value divided
by the market value of the bidder 4
weeks before the announcement date.
All cash All cash payment dummy indicating
100% of the payment in cash.
SDC
All stock All cash payment dummy indicating
100% of the payment in bidder stocks.
SDC
Bidding contest Bidding contest dummy, indicating the
number of entities (including the
acquiror) bidding for a target is larger
than 1.
SDC
Tender offer Tender offer dummy, indicating the
deal is a tender offer
SDC
All cash tender offer All cash tender offer dummy, All cash
* Tender offer
SDC
Deal premium Deal premium comparing to the target
stock price 4 weeks before the
announcement
SDC
Bidder termination fee Bidder termination fee in $million. If
the termination fee is missing, it is
replaced with zero.
SDC
Bidder termination fee / deal value Bidder termination fee divided by deal
value.
SDC
Target termination fee Target termination fee in $million. If
the termination fee is missing, it is
replaced with zero.
SDC
Target termination fee / deal value Target termination fee divided by deal
value.
SDC
TNIC intraindustry Dummy indicating the bidder and the
target are in the same TNIC industry.
See Hoberg and Phillips (2010, 2014)
for more details on TNIC measures.
Hoberg and Phillips (2010, 2014)
2-digit intraindustry Dummy indicating the bidder and the
target are in the same 2-digit SIC
industry.
SDC
4-digit intraindustry Dummy indicating the bidder and the
target are in the same 4-digit SIC
industry.
SDC
HHI before the merger HHI before the merger in the bidder
TNIC industry.
Hoberg and Phillips (2010, 2014)
Expected ∆HHI Expected change in HHI in the bidder
TNIC industry for TNIC intra-industry
mergers, following Eckbo (1985).
2*market share of the
bidder*marketshare of the target
∆HHI Actual change in HHI of the bidder
TNIC industries for completed deals.

40
Variable Variable Sources
Early Termination Early Termination dummy indicating
the merging firms receive an Early
Termination for the antitrust review
waiting period. It is a quick approval
from antitrust agencies.
SEC filings
Second Request Second Request dummy indicating the
merging firms receive a Second
Request for the antitrust review. It
means the antitrust agencies find the
possibility of anticompetitiveness and
will take further steps investigating the
merger.
SEC filings
Withdrawn Withdrawn dummy indicating the
bidder or the target withdraw the
merger and consequently the merger
fails.
SDC
Challenged Challenged HSR Annual Report
#quarters to complete The number of calendar quarters to
complete the merger from the deal
announcement to the deal effective or
withdrawn date.
SDC
#days to complete The number of calendar days to
complete the merger from the deal
announcement to the deal effective or
withdrawn date.
SDC
#days from antitrust filing to complete The number of calendar days to
complete the merger from the antitrust
HSR premerger filling date to the deal
effective or withdrawn date.
SEC filings
#days from antitrust filing to antitrust clearance The number of calendar days to
complete the merger from the antitrust
HSR premerger filling date to the
antitrust review clearance date.
SEC filings
Bidder lobbying activities
Active lobbier Active lobbier dummy indicating if the
firm ever lobbies.
CRP
Lobby experience Lobby experience dummy indicating if
the firm has ever lobbied during the 3
years before the merger announcement.
CRP
Log value of the dollar amount of lobbying
Lobbying in the merger Log transformation of average
quarterly lobbying dollar spending
during the merger. Log($lobby
spending/#quarters +1)
CRP
Lobbying at the announcement Log transformation of lobbying dollar
spending at the announcement quarter
CRP
Lobbying just before the announcement Log transformation of lobbying dollar
spending in the quarter before the
announcement
CRP
Lobbying 2 quarters before the announcement Log transformation of lobbying dollar
spending in the second quarters before
the announcement
CRP
Dollar amount of lobbying standardized by firm size
Lobbying in the merger CRP

41
Variable Variable Sources
Lobbying at the announcement Average quarterly lobbying dollar
spending at the announcement quarter
CRP
Lobbying just before the announcement Lobbying dollar spending in the quarter
before the announcement
CRP
Lobbying 2 quarters before the announcement Lobbying dollar spending in the second
quarters before the announcement
CRP
Firm Characterstics
BM Book-to-Market ratio. ATQ/(ATQ-
CEQQ+PRCCQ*CSHOQ)
Compustat
ROA Retrun on Asset. Profitability.
OIBDPQ/ATQ
Compustat
Log(Asset) (OIBDP-(TXT-TXDITC)-TIE-DVP-
DVC)/AT
Compustat
FCF Free cash flow. (OIBDPQ-(TXTQ-
TXDITCQ)-TIEQ-DVPQ-
DVCQ)/ATQ
Compustat
R&D R&D expenditures. XRDQ/ATQ Compustat
Leverage Leverage ratio. (DLTTQ+DD1Q)/ATQ Compustat
Tangibility Tangibility. PPENTQ/ATQ Compustat
Sales Growth SALEQ/lag(SALEQ)-1 Compustat

42
Appendix A2: An example of corporate filings regarding antitrust review from SEC
EDGAR
On Nov 23, 2009, Green Mountain Coffee Roasters Inc. (“GMCR” or “Parent”) announced a
friendly all-cash acquisition of Diedrich Coffee, Inc. (“Diedrich Coffee” or “Company”). The
deal value is around $290 million.
The following is from SEC filing Form SC TO-T filed by both GMCR and Diedrich Coffee on
Dec 11, 2009:
Pursuant to the requirements of the HSR Act, the Company (“Diedrich Coffee”) filed a
Notification and Report Form with respect to the Offer and the Merger on December 8, 2009
and Parent (“GMCR”), on behalf of itself and the Purchaser, filed a Notification and Report
Form with respect to the Offer and the Merger with the FTC and the DOJ on December 9, 2009.
As a result, the waiting period applicable to the purchase of Shares pursuant to the Offer is
scheduled to expire at 11:59 p.m., Eastern Time, on December 24, 2009.
The following is from SEC filing Form SC TO-T/A filed by both GMCR and Diedrich Coffee on
Dec 24, 2009:
Effective December 24, 2009, following consultation with the FTC staff, Parent voluntarily
withdrew its HSR Act filing. On or before December 29, 2009, Parent expects to re-file its HSR
Act filing. This withdrawal and re-filing is being undertaken in order to provide the FTC with
additional time to review the information submitted by Parent and the Company.
SEC filing Form SC TO-T/A and filed by both GMCR and Diedrich Coffee on Jan 13, 2010 and
a press release issued on the same date:
WATERBURY, Vt. and IRVINE, Calif. – January 13, 2010 – Green Mountain Coffee
Roasters, Inc. (NASDAQ: GMCR) (“GMCR”) and Diedrich Coffee, Inc. (Nasdaq: DDRX)
(“Diedrich Coffee”) today announced that they have each received a request for additional
information (“Second Requests”) from the U.S. Federal Trade Commission (“FTC”) with
respect to the previously announced $35.00 per share cash tender offer by Pebbles Acquisition
Sub, Inc. (the “Purchaser”), a wholly owned subsidiary of GMCR, to purchase all of the
outstanding shares of common stock of Diedrich Coffee.
…
GMCR and Diedrich Coffee expect to promptly respond to their respective Second Requests, and
to continue to work cooperatively with the FTC as it conducts its review of the proposed
transaction. The transaction is expected to be completed in early 2010.
As previously announced, the tender offer is scheduled to expire at midnight, New York City
time, on Friday, February 5, 2010. The Purchaser will extend the tender offer’s expiration time
as necessary to occur concurrently with the HSR waiting period’s expiration time.

43
The following is quoted from SEC filing Form SC TO-T/A filed by both GMCR and Diedrich
Coffee on May 3, 2010 and a press release was issued on the same date:
GMCR also noted that, on Friday, April 30, 2010, GMCR certified to the U.S. Federal Trade
Commission (the “FTC”) that it has substantially complied with the FTC’s request for
additional information under the Hart-Scott-Rodino Antitrust Improvements Act of 1976
(“Second Request”), in connection with GMCR’s offer to purchase all of the outstanding shares
of Diedrich Coffee common stock. As a result, GMCR and Purchaser expect the waiting period
applicable to the purchase of the outstanding shares of Diedrich Coffee common stock pursuant
to the tender offer to expire at 11:59 p.m., New York City time, on Monday, May 10, 2010.
The transaction is completed and effective on May 11, 2010.
Table A3 lobbying spending
Firm-quarter observations for firms with book value always larger than 100 million (2008-2012).
Quarterly lobbying spending
#ob
s Mean Std. Dev p10 p25
Medi
an p75 p90
Lobbying Dummy
279
45 42.5%
Dollar amount of lobbying
279
45
227,577.
191
707,058.
354
0.0
00
0.0
00
0.00
0
105000.
000
581200.
000
log(lobbing/size)
279
45 1.273 1.668
0.0
00
0.0
00
0.00
0 2.716 3.870
Firm lever dummies
#ob
s Mean
Dummy indicating the firm ever lobbies during
the sample period
145
9 28.1%
Dummy indicating the firm starts to lobby
during the sample period
145
9 19.3%

44
Table A4: Merger characteristics in subsamples
Panel A: Distribution of mergers across calendar years
2008 2009 2010 2011 2012
#mergers 41 43 52 52 31
%Challenge 7.3% 14.0% 7.7% 5.8% 9.7%
%Withdrawn 12.2% 7.0% 9.6% 9.6% 3.2%
%Second Request 12.2% 16.3% 15.4% 15.4% 16.1%
%Early Termination 51.2% 32.6% 30.8% 40.4% 54.8%
Panel B: Distribution of mergers across Fama-French 5 sectors
Cnsmr Manuf HiTec Hlth Others
#deals 26 43 92 42 16
%value 9.1% 28.3% 26.1% 26.9% 9.6%
Challenge 11.5% 14.0% 4.3% 9.5% 12.5%
withdrawn 15.4% 4.7% 8.7% 2.4% 25.0%
secondr_dummy 11.5% 25.6% 6.5% 11.9% 50.0%
earlyt_dummy 46.2% 48.8% 41.3% 38.1% 12.5%