load rating of bibb graves concrete arch bridge · load rating of bibb graves concrete arch bridge...
TRANSCRIPT

Research Report for ALDOT Project 930-858
LOAD RATING
OF
BIBB GRAVES CONCRETE ARCH BRIDGE
Submitted to
The Alabama Department of Transportation
Prepared by
Travis H. Le
J. Michael Stallings
October 2014

1. Report No.
ALDOT 930-858
2. Government Accession No. 3. Recipient Catalog No.
4. Title and Subtitle
Load Rating of Bibb Graves Concrete Arch Bridge
5. Report Date
July 2014
6. Performing Organization
Code
7. Author(s)
Travis H. Le, J. Michael Stallings
8. Performing Organization
Report No. ALDOT 930-858
9. Performing Organization Name and Address
Highway Research Center
Department of Civil Engineering
238 Harbert Engineering Center
Auburn, AL 36849
10. Work Unit No. (TRAIS)
11. Contract or Grant No.
12. Sponsoring Agency Name and Address
Highway Research Center
Department of Civil Engineering
238 Harbert Engineering Center
Auburn, AL 36849
13. Type of Report and Period
Covered
Technical Report
14. Sponsoring Agency Code
15. Supplementary Notes
Project performed in cooperation with the Alabama Department of Transportation
16. Abstract
To assess the strength of the Bibb Graves Concrete Arch Bridge, the Alabama Department of Transportation sponsored an
investigation by Auburn University. In one of the spans, the arches are experiencing severe longitudinal cracking from Alkali-Silica
Reactivity (ASR). The significance of ASR on the load carrying capacity of the bridge is unknown for two reasons. First, the effects of
ASR on cross section capacity are not well understood. Second, a load rating for the bridge has never been performed. As an initial step
for planning maintenance activities for the bridge, a load rating is performed in this project. Ratings are provided for the vertical
columns, vertical tension hangers, transverse floor beams, and arch ribs. Rating factors were calculated for components of the bridge
based on the as-designed condition. Ratings were provided for eight standard trucks and the AASHTO lane load. Evaluation of the
impact of ASR on the ratings was outside the scope of the project.
An operating rating factor significantly less than 1.0 was calculated in preliminary ratings of one arch. The low rating was
attributed primarily to slenderness effects calculated using the moment magnifier from AASHTO Standard Specifications for Highway
Bridges (2002). An investigation was conducted to identify a more accurate method for including slenderness effects in the arch rating
calculations. An analysis that combines an elastic second-order analysis for dead loads and a linear analysis for moving live loads was
found to be very practical and sufficiently accurate. This combined analysis approach resulted in significant increases in the arch ratings
beyond those found by using the AASHTO moment magnifier method.
Sensitivity analyses were performed to assess the effects of ASR-expansion on the bridge components’ internal forces and arch
vertical deflection. Effects of changes in concrete strength and modulus of elasticity on member forces, deflection, and ratings were
examined.
Load ratings of the Bibb Graves Concrete Arch Bridge resulted in multiple operating rating factors less than 1.0. The lowest
operating rating based on the as-designed condition is 0.86 for shear in an arch rib. This rating factor was increased to be greater than
1.0 by using a higher concrete compressive strength that was justified by concrete core test results. The final load ratings are controlled
by the positive bending capacity of the transverse floor beams. The controlling operating rating factors are 0.93 and 0.97 for the
standard tri-axle truck and concrete truck, respectively.
17. Key Words Load ratings, Bibb Graves Bridge, SAP2000, load-moment interaction,
slenderness, reinforced concrete, arch
18. Distribution Statement
No restriction.
19. Security Classification (of
this report)
Unclassified
20. Security Classification (of
this page)
Unclassified
21. No. of Pages
253 22. Price
None.

Research Report
ALDOT Research Project 930-858
LOAD RATING
OF
BIBB GRAVES CONCRETE ARCH BRIDGE
Prepared by
Travis H. Le
J. Michael Stallings
Highway Research Center
and
Department of Civil Engineering
at
Auburn University
July 2014
ii
DISCLAIMERS
The contents of this report reflect the views of the authors who are responsible for the facts and
accuracy of the data presented herein. The contents do not necessarily reflect the official views or
policies of Alabama Department of Transportation, Auburn University, or the Highway Research
Center. This report does not constitute a standard, specification, or regulation.
NOT INTENDED FOR CONSTRUCTION, BIDDING, OR PERMIT PURPOSES
J. Michael Stallings, Ph. D.
Research Supervisor
ACKNOWLEDGEMENTS
The authors would like to acknowledge the financial support provided by the Alabama Department
of Transportation that made this project possible. Also, the authors would like to acknowledge the
efforts of many in the Alabama Department of Transportation who provided guidance and
assistance that were essential to ensure that this project concluded in a useful and practical result.

iii
ABSTRACT
To assess the strength of the Bibb Graves Concrete Arch Bridge, the Alabama Department of
Transportation sponsored an investigation by Auburn University. In one of the spans, the arches
are experiencing severe longitudinal cracking from Alkali-Silica Reactivity (ASR). The
significance of ASR on the load carrying capacity of the bridge is unknown for two reasons.
First, the effects of ASR on cross section capacity are not well understood. Second, a load rating
for the bridge has never been performed. As an initial step for planning maintenance activities
for the bridge, a load rating is performed in this project. Ratings are provided for the vertical
columns, vertical tension hangers, transverse floor beams, and arch ribs. Rating factors were
calculated for components of the bridge based on the as-designed condition. Ratings were
provided for eight standard trucks and the AASHTO lane load. Evaluation of the impact of ASR
on the ratings was outside the scope of the project.
An operating rating factor significantly less than 1.0 was calculated in preliminary ratings
of one arch. The low rating was attributed primarily to slenderness effects calculated using the
moment magnifier from AASHTO Standard Specifications for Highway Bridges (2002). An
investigation was conducted to identify a more accurate method for including slenderness effects
in the arch rating calculations. An analysis that combines an elastic second-order analysis for
dead loads and a linear analysis for moving live loads was found to be very practical and
sufficiently accurate. This combined analysis approach resulted in significant increases in the
arch ratings beyond those found by using the AASHTO moment magnifier method.
Sensitivity analyses were performed to assess the effects of ASR-expansion on the bridge
components’ internal forces and arch vertical deflection. Effects of changes in concrete strength
and modulus of elasticity on member forces, deflection, and ratings were examined.
Load ratings of the Bibb Graves Concrete Arch Bridge resulted in multiple operating
rating factors less than 1.0. The lowest operating rating based on the as-designed condition is
0.86 for shear in an arch rib. This rating factor was increased to be greater than 1.0 by using a
higher concrete compressive strength that was justified by concrete core test results. The final
load ratings are controlled by the positive bending capacity of the transverse floor beams. The
controlling operating rating factors are 0.93 and 0.97 for the standard tri-axle truck and concrete
truck, respectively.

iv
TABLE OF CONTENTS
List of Tables ................................................................................................................................ xii
List of Figures .............................................................................................................................. xix
Chapter 1: Introduction .................................................................................................................. 1
1.1 Background ........................................................................................................................ 1
1.2 Motivation .......................................................................................................................... 3
1.3 Report Organization ........................................................................................................... 4
Chapter 2: Bridge Geometry .......................................................................................................... 6
2.1 Naming Convention ........................................................................................................... 6
2.1.1 Span IV, V, and VI .................................................................................................. 7
2.1.2 Span VII ................................................................................................................... 8
2.2 Arches ................................................................................................................................ 8
2.2.1 Span IV, V, and VI .................................................................................................. 8
2.2.2 Span VII ................................................................................................................. 13
2.3 Transverse Floor Beams .................................................................................................. 15
2.4 Columns ........................................................................................................................... 18
2.4.1 Column 2s .............................................................................................................. 18
2.4.2 Column 3s .............................................................................................................. 19
2.5 Hangers ............................................................................................................................ 23
2.6 Transverse Deep Beams .................................................................................................. 24
Chapter 3: Rating Methodology................................................................................................... 26
3.1 Specifications and ALDOT Requirements ...................................................................... 26
3.2 Material Properties ........................................................................................................... 27
3.3 Load Factor Rating Method ............................................................................................. 31
3.4 Member Capacity ............................................................................................................. 32

v
3.4.1 Flexure ................................................................................................................... 33
3.4.1.1 Transverse Floor Beams ........................................................................... 33
3.4.1.2 Transverse Deep Beams ............................................................................ 35
3.4.2 Shear ...................................................................................................................... 36
3.4.2.1 Transverse Deep Beams ............................................................................ 36
3.4.2.2 Transverse Floor Beams ........................................................................... 38
3.4.2.3 Arch Rib .................................................................................................... 39
3.4.3 Tension .................................................................................................................. 40
3.4.4 Axial Load and Bending Moment ......................................................................... 40
3.4.4.1 Load-Moment Interaction Diagram .......................................................... 41
3.4.4.2 Finding the Rating Factor ......................................................................... 43
3.4.4.3 Load-Moment Interaction Diagram for Column 3 .................................... 46
3.5 Transverse Frames and Members Models ....................................................................... 47
3.5.1 Dead Loads ............................................................................................................ 47
3.5.2 Live Loads ............................................................................................................. 49
3.5.2.1 Transverse Load Positions/Cases .............................................................. 50
3.5.2.2 Longitudinal Beam Analysis..................................................................... 52
3.5.3 Beam and Column 2 Modeling .............................................................................. 55
3.5.3.1 Slenderness Effects ................................................................................... 57
3.5.4 Beam and Column 3 Modeling .............................................................................. 57
3.5.4.1 Slenderness Effects ................................................................................... 58
3.5.4.2 Slenderness Calculations .......................................................................... 61
3.5.5 Span VII Beam and Column Models ..................................................................... 62
3.5.5.1 Span VII Beam and Columns 5 and 7 Models ....................................... 62
3.5.5.2 Slenderness Effects ................................................................................... 64

vi
3.5.6 Beam and Hanger Models ..................................................................................... 64
3.5.6.1 Beam and Hanger 1 Model ....................................................................... 65
3.5.7 Transverse Deep Beam Model .............................................................................. 67
3.6 Arches .............................................................................................................................. 68
3.6.1 Dead Loads ............................................................................................................ 68
3.6.2 Live Loads ............................................................................................................. 68
3.6.2.1 Lateral Truck Distribution ........................................................................ 68
3.6.2.2 Moving Load Analyses ............................................................................. 69
3.6.3 Load Factors .......................................................................................................... 70
3.6.4 Spans IV, V, VI, and VII Arch Models ................................................................. 71
3.6.5 Slenderness Check ................................................................................................. 75
3.6.5.1 Slenderness Effects using Combination of Second-Order and Linear
Analyses ................................................................................................................ 77
3.6.5.2 Slenderness Effects and Shear Rating of Span VII ................................... 78
Chapter 4: Slenderness Effects in Reinforced Concrete Arches .................................................. 80
4.1 AASHTO Moment Magnifier Method ............................................................................ 80
4.2 AASHTO LRFD Methods ............................................................................................... 83
4.2.1 Moment Magnifier ................................................................................................. 83
4.3 Advanced Analysis .......................................................................................................... 84
4.4 Elastic Buckling Analysis ................................................................................................ 85
4.5 Elastic Second-Order Analysis ........................................................................................ 87
4.5.1 Long-Term Model ................................................................................................. 89
4.5.2 Transient Model ..................................................................................................... 89
4.5.3 Comparison of the Models .................................................................................... 90
4.6 Results of Elastic Buckling Analyses .............................................................................. 90
vii
4.7 Results of Elastic Second-Order Analyses ...................................................................... 93
4.8 Comparisons of Second-Order Analysis Methods ........................................................ 100
4.9 Slenderness Effects in reinforced concrete arches Summary and conclusion ............... 104
Chapter 5: Rating Results .......................................................................................................... 105
5.1 Span IV Rating Results .................................................................................................. 105
5.1.1 Column 2 ............................................................................................................. 106
5.1.2 Column 3 ............................................................................................................. 107
5.1.3 Hanger 1 .............................................................................................................. 108
5.1.4 Transverse Deep Beam ........................................................................................ 109
5.1.5 Transverse Floor Beams ...................................................................................... 110
5.1.5.1 Transverse Floor Beam at Column 2 ...................................................... 110
5.1.5.2 Transverse Floor Beam at Column 3 ...................................................... 111
5.1.5.3 Transverse Floor Beam at Hanger 1 ....................................................... 111
5.1.6 Arch Rib .............................................................................................................. 112
5.2 Span V Rating Results ................................................................................................... 118
5.2.1 Column 2 ............................................................................................................. 118
5.2.2 Column 3 ............................................................................................................. 119
5.2.3 Hanger 1 .............................................................................................................. 120
5.2.4 Transverse Deep Beam ........................................................................................ 121
5.2.5 Transverse Floor Beams ...................................................................................... 121
5.2.5.1 Transverse Floor Beam at Column 2 ...................................................... 122
5.2.5.2 Transverse Floor Beam at Column 3 ...................................................... 122
5.2.5.3 Transverse Floor Beam at Hanger 1 ....................................................... 122
5.2.6 Arch Rib .............................................................................................................. 123
5.3 Span VI Rating Results .................................................................................................. 129
viii
5.3.1 Column 2 ............................................................................................................. 129
5.3.2 Column 3 ............................................................................................................. 130
5.3.3 Hanger 1 .............................................................................................................. 131
5.3.4 Transverse Deep Beam ........................................................................................ 132
5.3.5 Transverse Floor Beams ...................................................................................... 132
5.3.5.1 Transverse Floor Beam at Column 2 ...................................................... 133
5.3.5.2 Transverse Floor Beam at Column 3 ...................................................... 133
5.3.5.3 Transverse Floor Beam at Hanger 1 ....................................................... 133
5.3.6 Arch Rib .............................................................................................................. 134
5.4 Span VII Rating Results ................................................................................................ 140
5.4.1 Column 4 ............................................................................................................. 140
5.4.2 Column 5 ............................................................................................................. 141
5.4.3 Column 7 ............................................................................................................. 142
5.4.4 Transverse Floor Beams ...................................................................................... 143
5.4.4.1 Transverse Floor Beam Bending Moment Rating .................................. 144
5.4.4.2 Transverse Floor Beam Shear Rating ..................................................... 145
5.4.5 Arch Rib .............................................................................................................. 146
5.5 Summary of Rating Results ........................................................................................... 151
Chapter 6: Sensitivity Analyses ................................................................................................. 152
6.1 Effects of ASR-Expansion on Arch Internal Forces ...................................................... 153
6.1.1 Bending Moment Sign Resulting from ASR-Expansion ..................................... 155
6.1.2 Potential for Transverse Flexural Cracking due to ASR-Expansion Along With
Dead and Live Load Effects ......................................................................................... 157
6.1.3 Potential for Transverse Flexural Cracking due to ASR-Expansion Along With
Dead Load Effects Only ............................................................................................... 159

ix
6.2 Effects of ASR-Expansion on Arch Deflections ........................................................... 161
6.3 Effects of Changes in Concrete Modulus of Elasticity on Arch Internal Forces ........... 164
6.4 Effects of Changes in Concrete Modulus of Elasticity on Arch Deflections ................ 167
6.5 Effects of Changes in Concrete Compressive Strength on Arch Ratings ...................... 173
6.6 Effects of Changes in Concrete Compressive Strength on Transverse Beam Ratings .. 178
6.7 Effects of Changes in Concrete Compressive Strength on Transverse Deep Beam
Ratings ................................................................................................................................. 181
6.8 Sensitivity Analyses Conclusions .................................................................................. 182
Chapter 7: Summary and Conclusion ........................................................................................ 184
7.1 Project Summary ........................................................................................................... 184
7.2 Project Conclusions ....................................................................................................... 185
References ................................................................................................................................... 188
Appendix A: Span IV................................................................................................................. 190
A1: Longitudinal Beam Analysis Results ........................................................................... 190
A2: Transverse Floor Beams .............................................................................................. 191
A2.1: Transverse Floor Beam at Column 2 Ratings .................................................... 192
A2.2: Transverse Floor Beam at Column 3 Ratings .................................................... 193
A3: Column 2 ..................................................................................................................... 194
A4: Column 3 ..................................................................................................................... 194
A5: Hanger 1 ....................................................................................................................... 195
A6: Transverse Deep Beam ................................................................................................ 195
A7: Arch ............................................................................................................................. 196
Appendix B: Span V .................................................................................................................. 199
B1: Longitudinal Beam Analysis Results ........................................................................... 199
B2: Transverse Floor Beams .............................................................................................. 200

x
B2.1: Transverse Floor Beam at Column 2 Ratings .................................................... 200
B2.2: Transverse Floor Beam at Column 3 Ratings .................................................... 201
B3: Column 2 ...................................................................................................................... 203
B4: Column 3 ...................................................................................................................... 203
B5: Hanger 1 ....................................................................................................................... 204
B6: Transverse Deep Beam ................................................................................................ 204
B7: Arch .............................................................................................................................. 205
B7.1: Lateral Truck Distribution ........................................................................................ 206
B8: Beam and Composite Concrete Hanger ....................................................................... 207
Appendix C: Span VI ................................................................................................................. 211
C1: Longitudinal Beam Analysis Results ........................................................................... 211
C2: Transverse Floor Beams .............................................................................................. 211
C2.1: Transverse Floor Beam at Column 2 Ratings .................................................... 213
C2.2: Transverse Floor Beam at Column 3 Ratings .................................................... 214
C3: Column 2 ...................................................................................................................... 215
C4: Column 3 ...................................................................................................................... 215
C5: Hanger 1 ....................................................................................................................... 216
C6: Transverse Deep Beam ................................................................................................ 216
C7: Arch .............................................................................................................................. 217
Appendix D: Span VII ............................................................................................................... 219
D1: Longitudinal Beam Analysis Results ........................................................................... 219
D2: Transverse Floor Beams .............................................................................................. 220
D2.1: Transverse Beam at Column 4 Ratings ............................................................. 221
D2.2: Transverse Beam at Column 5 Ratings ............................................................. 221
D3: Column 3 ..................................................................................................................... 224

xi
D4: Columns 4 - 7 ............................................................................................................... 225
D4.1: Column 5 Ratings – Case B ............................................................................... 226
D4.2: Column 7 Ratings – Case B ............................................................................... 227
D5: Arch ............................................................................................................................. 228
Appendix E: Sensitivity Analyses ............................................................................................. 229
E1: Span V Arch Internal Forces ........................................................................................ 229

xii
List of Tables
Table 1: Span Lengths ................................................................................................................... 6
Table 2: Spans IV through VI - Arch Rise and Span Length ...................................................... 10
Table 3: Arch Rib Section Properties for Span IV ...................................................................... 11
Table 4: Arch Rib Section Properties for Span V ........................................................................ 12
Table 5: Arch Rib Section Properties for Span VI ...................................................................... 12
Table 6: Span VII - Arch Rise and Span Length ......................................................................... 13
Table 7: Arch Rib Section Properties for Span VII ..................................................................... 14
Table 8: Transverse Beam Dimensions ....................................................................................... 17
Table 9: Exterior Column 3s Flange Width Dimensions ............................................................. 22
Table 10: Transverse Deep Beam Dimensions ............................................................................ 25
Table 11: Equivalent Concrete Compressive Strength from Core Samples ................................ 29
Table 12: Material Properties for SAP2000................................................................................. 31
Table 13: Load Factors for LFR Method ..................................................................................... 32
Table 14: Transverse Floor Beam Factored Moment Capacity ................................................... 35
Table 15: Transverse Deep Beam Factored Bending Moment Capacities .................................. 36
Table 16: Transverse Deep Beam Factored Shear Capacity ........................................................ 37
Table 17: Transverse Floor Beams Factored Shear Capacity ...................................................... 39
Table 18: Brackets Dimensional Properties ................................................................................. 48
Table 19: Column 2 Lengths for Modeling ................................................................................. 56
Table 20: Column 3 Lengths for Modeling ................................................................................. 58
Table 21: Column 3s klu/r ............................................................................................................ 60
Table 22: Column 3 Moment Magnifiers .................................................................................... 62
Table 23: Span VII Column Lengths for Modeling ..................................................................... 64
Table 24: Hanger 1 Lengths for Modeling .................................................................................. 66
Table 25: Lateral Truck Distribution Factors for All Arch Models ............................................. 69
Table 26: Load Factors for Arch Loading Associated with LFR Method ................................... 70
Table 27: Impact Factors ............................................................................................................. 71
Table 28: Arch Section Quantity ................................................................................................. 71
Table 29: Arch Properties and klu/r ............................................................................................. 76
Table 30: Modifications on Ig and Ec ........................................................................................... 77
xiii
Table 31: Shear Ratings for Span VII Section A16 using Combination of Second-Order and
Linear Analyses ............................................................................................................................ 79
Table 32: Shear Ratings for Span VII Section A16 using First-Order Analysis ......................... 79
Table 33: Moment Magnifiers δb from using AASHTO (2002) .................................................. 83
Table 34: Moment Magnifiers δb from Elastic Buckling Analyses ............................................. 93
Table 35: Span IV – Factored Axial Loads and Bending Moments ............................................ 96
Table 36: Span V – Factored Axial Loads and Bending Moments ............................................. 97
Table 37: Span VI – Factored Axial Loads and Bending Moments ............................................ 98
Table 38: Span VII – Factored Axial Loads and Bending Moments ........................................... 99
Table 39: Span IV – Values of (M2nd/M1st) ................................................................................ 100
Table 40: Span V – Values of (M2nd/M1st) ................................................................................. 101
Table 41: Span VI – Values of (M2nd/M1st) ................................................................................ 102
Table 42: Span VII – Values of (M2nd/M1st) .............................................................................. 103
Table 43: Span IV - Interior Column 2 Rating Factors ............................................................. 107
Table 44: Span IV - Exterior Column 2 Rating Factors ............................................................ 107
Table 45: Span IV - Interior Column 3 Rating Factors ............................................................. 108
Table 46: Span IV - Exterior Column 3 Rating Factors ............................................................ 108
Table 47: Span IV - Hanger 1 Rating Factors............................................................................ 109
Table 48: Span IV - Transverse Deep Beam Rating Factors ..................................................... 109
Table 49: Span IV - Transverse Floor Beam at Column 2 Rating Factors ................................ 110
Table 50: Span IV - Transverse Floor Beam at Hanger 1 Rating Factors: Part 1 ...................... 111
Table 51: Span IV - Transverse Floor Beam at Hanger 1 Rating Factors: Part 2 ..................... 112
Table 52: Span IV - Arch Section A1 Rating Factors ............................................................... 114
Table 53: Span IV - Arch Section A2 Rating Factors ............................................................... 114
Table 54: Span IV - Arch Section A3 Rating Factors ............................................................... 115
Table 55: Span IV - Arch Section A8 Rating Factors ............................................................... 115
Table 56: Span IV - Arch Section A14 Rating Factors ............................................................. 116
Table 57: Span IV - Arch Section A21 Rating Factors ............................................................. 116
Table 58: Span IV - Arch Section A41 Rating Factors ............................................................. 117
Table 59: Span V - Interior Column 2 Rating Factors ............................................................... 118
Table 60: Span V - Exterior Column 2 Rating Factors .............................................................. 119

xiv
Table 61: Span V - Interior Column 3 Rating Factors ............................................................... 119
Table 62: Span V - Exterior Column 3 Rating Factors .............................................................. 120
Table 63: Span V - Hanger 1 Rating Factors ............................................................................. 120
Table 64: Span V - Transverse Deep Beam Rating Factors ...................................................... 121
Table 65: Span V - Transverse Floor Beam at Column 2 Rating Factors ................................. 122
Table 66: Span V - Transverse Floor Beam at Hanger 1 Rating Factors: Part 1 ....................... 123
Table 67: Span V - Transverse Floor Beam at Hanger 1 Rating Factors: Part 2 ...................... 123
Table 68: Span V - Arch Section A1 Rating Factors ................................................................. 125
Table 69: Span V - Arch Section A2 Rating Factors ................................................................. 125
Table 70: Span V - Arch Section A3 Rating Factors ................................................................. 126
Table 71: Span V - Arch Section A8 Rating Factors ................................................................. 126
Table 72: Span V - Arch Section A14 Rating Factors ............................................................... 127
Table 73: Span V - Arch Section A20 Rating Factors ............................................................... 127
Table 74: Span V - Arch Section A40 Rating Factors ............................................................... 128
Table 75: Span VI - Interior Column 2 Rating Factors ............................................................. 129
Table 76: Span VI - Exterior Column 2 Rating Factors ............................................................ 130
Table 77: Span VI - Interior Column 3 Rating Factors ............................................................. 130
Table 78: Span VI - Exterior Column 3 Rating Factors ............................................................ 131
Table 79: Span VI - Hanger 1 Rating Factors............................................................................ 131
Table 80: Span VI - Transverse Deep Beam Rating Factors ..................................................... 132
Table 81: Span VI - Transverse Floor Beam at Column 2 Rating Factors ................................ 133
Table 82: Span VI - Transverse Floor Beam at Hanger 1 Rating Factors: Part 1 ...................... 134
Table 83: Span VI - Transverse Floor Beam at Hanger 1 Rating Factors: Part 2 ..................... 134
Table 84: Span VI - Arch Section A1 Rating Factors ............................................................... 136
Table 85: Span VI - Arch Section A2 Rating Factors ............................................................... 136
Table 86: Span VI - Arch Section A3 Rating Factors ............................................................... 137
Table 87: Span VI - Arch Section A7 Rating Factors ............................................................... 137
Table 88: Span VI - Arch Section A13 Rating Factors ............................................................. 138
Table 89: Span VI - Arch Section A18 Rating Factors ............................................................. 138
Table 90: Span VI - Arch Section A36 Rating Factors ............................................................. 139
Table 91: Span VII - Interior Column 4 Rating Factors ............................................................ 141

xv
Table 92: Span VII - Exterior Column 4 Rating Factors ........................................................... 141
Table 93: Span VII - Interior Column 5 Rating Factors – Case A ............................................ 142
Table 94: Span VII - Exterior Column 5 Rating Factors – Case A ........................................... 142
Table 95: Span VII - Interior Column 7 Rating Factors – Case A ............................................ 143
Table 96: Span VII - Exterior Column 7 Rating Factors – Case A ........................................... 143
Table 97: Span VII - Transverse Floor Beam at Column 4 Positive Bending Moment Rating
Factors ......................................................................................................................................... 144
Table 98: Span VII - Transverse Floor Beam at Column 5 Negative Bending Moment Rating
Factors – Case A ......................................................................................................................... 145
Table 99: Span VII - Transverse Floor Beam at Column 4 Rating Factors ............................... 145
Table 100: Span VII - Arch Section A1 Rating Factors ............................................................ 147
Table 101: Span VII - Arch Section A10 Rating Factors .......................................................... 147
Table 102: Span VII - Arch Section A14 Rating Factors .......................................................... 148
Table 103: Span VII - Arch Section A16 Rating Factors .......................................................... 148
Table 104: Span VII - Arch Section A18 Rating Factors .......................................................... 149
Table 105: Span VII - Arch Section A22 Rating Factors .......................................................... 149
Table 106: Span VII - Arch Section A30 Rating Factors .......................................................... 150
Table 107: Span VII - Arch Section A35 Rating Factors .......................................................... 150
Table 108: Components with Operating Factor Less Than 1.0 ................................................. 151
Table 109: Effects of ASR-Expansion on Arch Internal Forces on 3,000 psi Model ............... 155
Table 110: Effects of ASR-Expansion on Arch Internal Forces on 4,740 psi Model ............... 155
Table 111: Longitudinal Strains at the Rupture Stress on 3,000 psi Model .............................. 158
Table 112: Longitudinal Strains at the Rupture Stress on 4,740 psi Model .............................. 159
Table 113: Longitudinal Strains at the Rupture Stress on 3,000 psi Model without Live Load 160
Table 114: Longitudinal Strains at the Rupture Stress on 4,740 psi Model without Live Load 161
Table 115: Dead and Live Load Deflection at Point A ............................................................. 162
Table 116: Vertical Deflection at Point A Resulting from ASR-Expansion for 3,000 psi Model
..................................................................................................................................................... 163
Table 117: Vertical Deflection at Point A Resulting from ASR-Expansion for 4,740 psi Model
..................................................................................................................................................... 163
Table 118: Long-Term Ec Used in Arch Models ....................................................................... 165

xvi
Table 119: Span IV - Arch Capacity and Internal Forces at Section A2 ................................... 166
Table 120: Span V - Arch Capacity and Internal Forces at Section A2 .................................... 166
Table 121: Span VI - Arch Capacity and Internal Forces at Section A2 ................................... 167
Table 122: Span VII - Arch Capacity and Internal Forces at Section A16 ................................ 167
Table 123: Span IV – Effects of Changes in Ec on Total Deflection ......................................... 169
Table 124: Span V – Effects of Changes in Ec on Total Deflection .......................................... 170
Table 125: Span VI – Effects of Changes in Ec on Total Deflection ......................................... 171
Table 126: Span VII – Effects of Changes in Ec on Total Deflection ....................................... 172
Table 127: Span IV – Effect of f’c on Arch Ratings .................................................................. 174
Table 128: Span V – Effect of f’c on Arch Ratings ................................................................... 175
Table 129: Span VI – Effect of f’c on Arch Ratings .................................................................. 176
Table 130: Span VII – Effect of f’c on Arch Ratings ................................................................. 177
Table 131: f'c and Ec for Transverse Beam Sensitivity Analysis ............................................... 178
Table 132: Span IV – Transverse Beam at Hanger 1 Sensitivity Analysis Results ................... 179
Table 133: Span V – Transverse Beam at Hanger 1 Sensitivity Analysis Results .................... 180
Table 134: Span VI – Transverse Beam at Hanger 1 Sensitivity Analysis Results ................... 181
Table 135: Span V – Transverse Deep Beam Sensitivity Analysis Results .............................. 182
Table 136: Span VI – Transverse Deep Beam Sensitivity Analysis Results ............................. 182
Table 137A: Wheel Line Load Magnitudes ............................................................................... 190
Table 138A: Transverse Floor Beam Cross Sectional Properties .............................................. 191
Table 139A: Transverse Floor Beam Dead Loads ..................................................................... 191
Table 140A: Span IV - Transverse Floor Beam at Column 2 Rating Factors: Part 1 ................ 192
Table 141A: Span IV - Transverse Floor Beam at Column 2 Rating Factors: Part 2 ................ 192
Table 142A: Span IV - Transverse Floor Beam at Column 3 Rating Factors: Part 1 ................ 193
Table 143A: Span IV - Transverse Floor Beam at Column 3 Rating Factors: Part 2 ................ 193
Table 144A: Column 2 Cross Sectional Properties and Dead Load .......................................... 194
Table 145A: Column 3 Cross Sectional Properties and Dead Load .......................................... 194
Table 146A: Hanger 1 Cross Sectional Properties and Dead Load ........................................... 195
Table 147A: Transverse Deep Beam Cross Sectional Properties .............................................. 195
Table 148A: Transverse Deep Beam Dead Loads ..................................................................... 196
Table 149A: Arch Cross Sectional Properties ........................................................................... 196

xvii
Table 150A: Arch Dead Loads .................................................................................................. 197
Table 151B: Wheel Line Load Magnitudes ............................................................................... 199
Table 152B: Transverse Floor Beam Cross Sectional Properties .............................................. 200
Table 153B: Transverse Floor Beam Dead Loads ..................................................................... 200
Table 154B: Span V - Transverse Floor Beam at Column 2 Rating Factors: Part 1 ................. 201
Table 155B: Span V - Transverse Floor Beam at Column 2 Rating Factors: Part 2 ................. 201
Table 156B: Span V - Transverse Floor Beam at Column 3 Rating Factors: Part 1 ................. 202
Table 157B: Span V - Transverse Floor Beam at Column 3 Rating Factors: Part 2 ................. 202
Table 158B: Column 2 Cross Sectional Properties and Dead Load .......................................... 203
Table 159B: Column 3 Cross Sectional Properties and Dead Load .......................................... 203
Table 160B: Hanger 1 Cross Sectional Properties and Dead Load ........................................... 204
Table 161B: Transverse Deep Beam Cross Sectional Properties .............................................. 204
Table 162B: Transverse Deep Beam Dead Loads ..................................................................... 205
Table 163B: Arch Cross Sectional Properties ........................................................................... 205
Table 164B: Arch Dead Loads .................................................................................................. 207
Table 165B: Composite Concrete Hanger 1 Cross Sectional Properties and Dead Load ......... 209
Table 166B: LFR for Composite Concrete Hanger ................................................................... 210
Table 167C: Wheel Line Load Magnitudes ............................................................................... 211
Table 168C: Transverse Floor Beam Cross Sectional Properties .............................................. 212
Table 169C: Transverse Floor Beam Dead Loads ..................................................................... 212
Table 170C: Span VI - Transverse Floor Beam at Column 2 Rating Factors: Part 1 ................ 213
Table 171C: Span VI - Transverse Floor Beam at Column 2 Rating Factors: Part 2 ................ 213
Table 172C: Span VI - Transverse Floor Beam at Column 3 Rating Factors: Part 1 ................ 214
Table 173C: Span VI - Transverse Floor Beam at Column 3 Rating Factors: Part 2 ................ 214
Table 174C: Column 2 Cross Sectional Properties and Dead Load .......................................... 215
Table 175C: Column 3 Cross Sectional Properties and Dead Load .......................................... 215
Table 176C: Hanger 1 Cross Sectional Properties and Dead Load ........................................... 216
Table 177C: Transverse Deep Beam Cross Sectional Properties .............................................. 216
Table 178C: Transverse Deep Beam Dead Loads ..................................................................... 217
Table 179C: Arch Cross Sectional Properties ........................................................................... 217
Table 180C: Arch Dead Loads .................................................................................................. 218

xviii
Table 181D: Wheel Line Load Magnitudes ............................................................................... 219
Table 182D: Transverse Floor Beam Cross Sectional Properties .............................................. 220
Table 183D: Transverse Floor Beam Dead Loads ..................................................................... 220
Table 184D: Span VII – Transverse Beam at Column 4 Negative Bending Moment Rating
Factors ......................................................................................................................................... 221
Table 185D: Span VII - Transverse Floor Beam at Column 5 Bending Moment Rating Factors –
Case B ......................................................................................................................................... 222
Table 186D: Span VII - Transverse Floor Beam at Column 5 Shear Rating Factors – Case B 222
Table 187D: Span VII - Transverse Floor Beam at Column 5 Bending Moment Rating Factors -
Case A ......................................................................................................................................... 223
Table 188D: Span VII - Transverse Floor Beam at Column 5 Shear Rating Factors – Case A 223
Table 189D: Column 3 Cross Sectional Properties and Dead Load .......................................... 224
Table 190D: Columns 4 - 7 Cross Sectional Properties and Dead Load ................................... 225
Table 191D: Span VII – Interior Column 5 Rating Factors – Case B ....................................... 226
Table 192D: Span VII – Exterior Column 5 Rating Factors – Case B ...................................... 226
Table 193D: Span VII – Interior Column 7 Rating Factors – Case B ....................................... 227
Table 194D: Span VII – Exterior Column 7 Rating Factors – Case B ...................................... 227
Table 195D: Arch Cross Sectional Properties ........................................................................... 228
Table 196D: Arch Dead Loads .................................................................................................. 228
Table 197E: Internal Forces Resulting from Dead Load on 3,000 psi Model ........................... 229
Table 198E: Internal Forces Resulting from Dead Load on 4,740 psi Model ........................... 229
Table 199E: Internal Forces Resulting from Live Load on 3,000 psi Model ............................ 230
Table 200E: Internal Forces Resulting from Live Load on 4,740 psi Model ............................ 230
xix
List of Figures
Figure 1: Bibb Graves Bridge in Wetumpka, Alabama ................................................................. 1
Figure 2: Alabama Map with a Triangular Marker at Wetumpka (Geoscience News and
Information 2005) ........................................................................................................................... 2
Figure 3: Elevation and Plan Views (AHD 1929) ......................................................................... 3
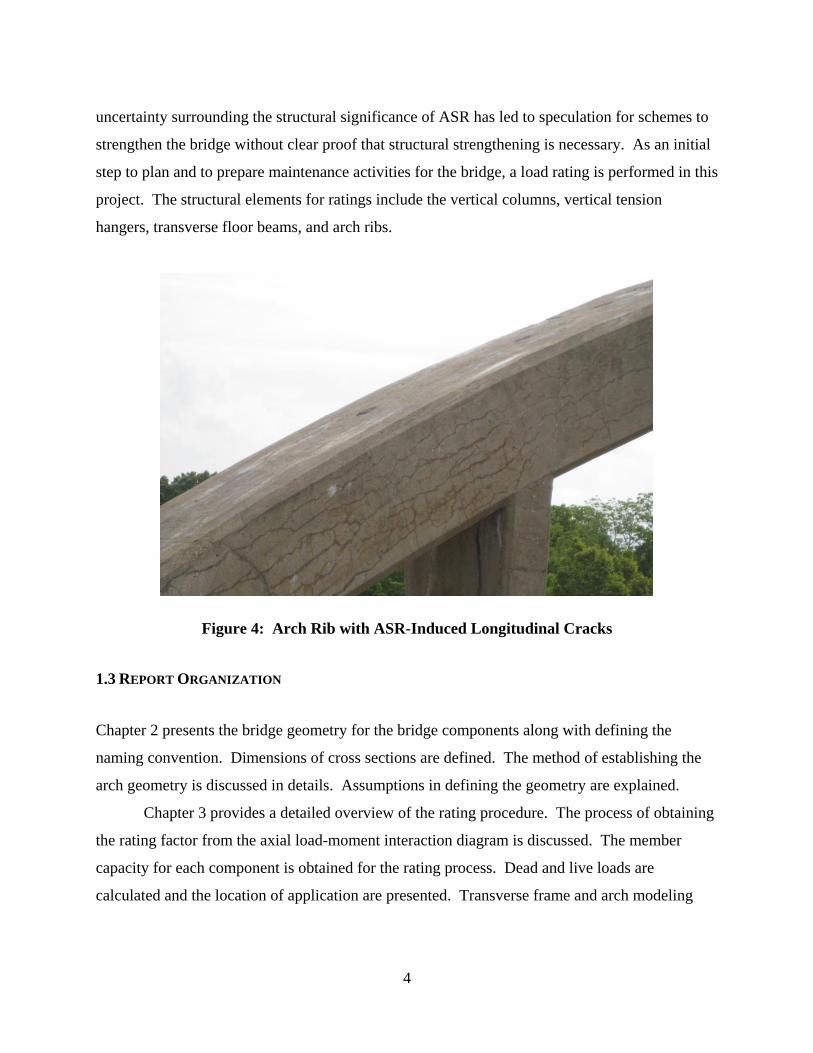
Figure 4: Arch Rib with ASR-Induced Longitudinal Cracks ........................................................ 4
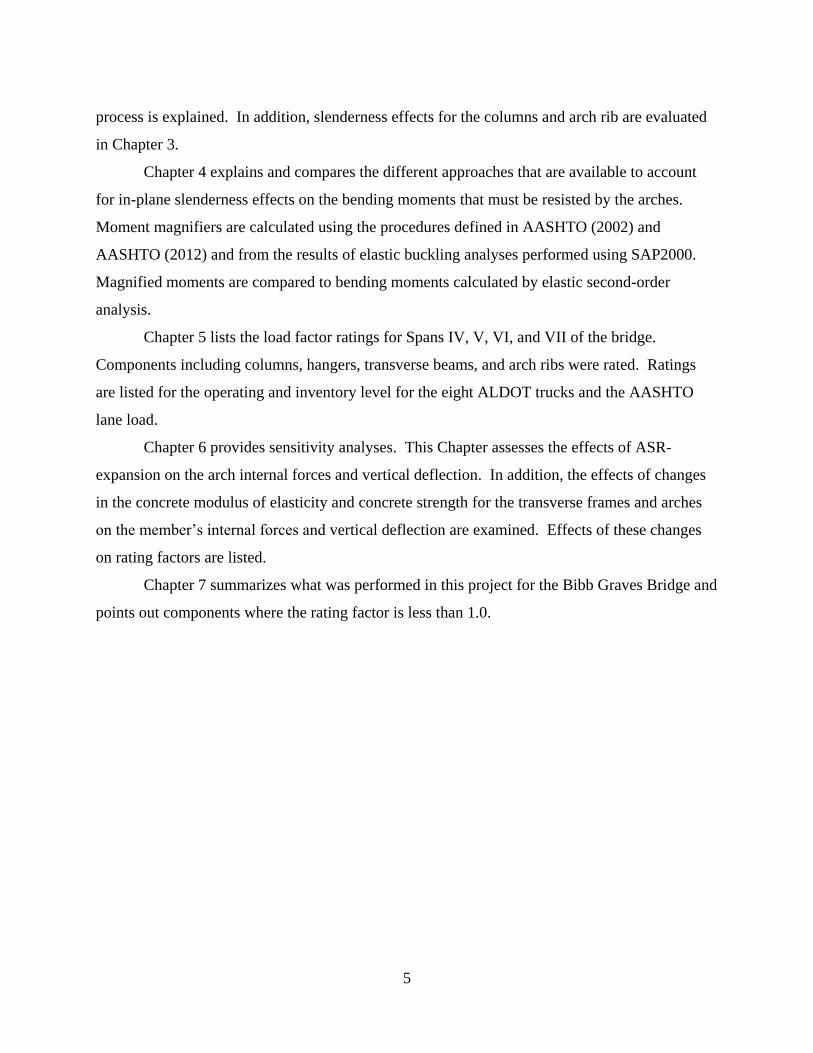
Figure 5: Spans IV, V, and VI East End Naming Convention (SAP 2013) .................................. 7
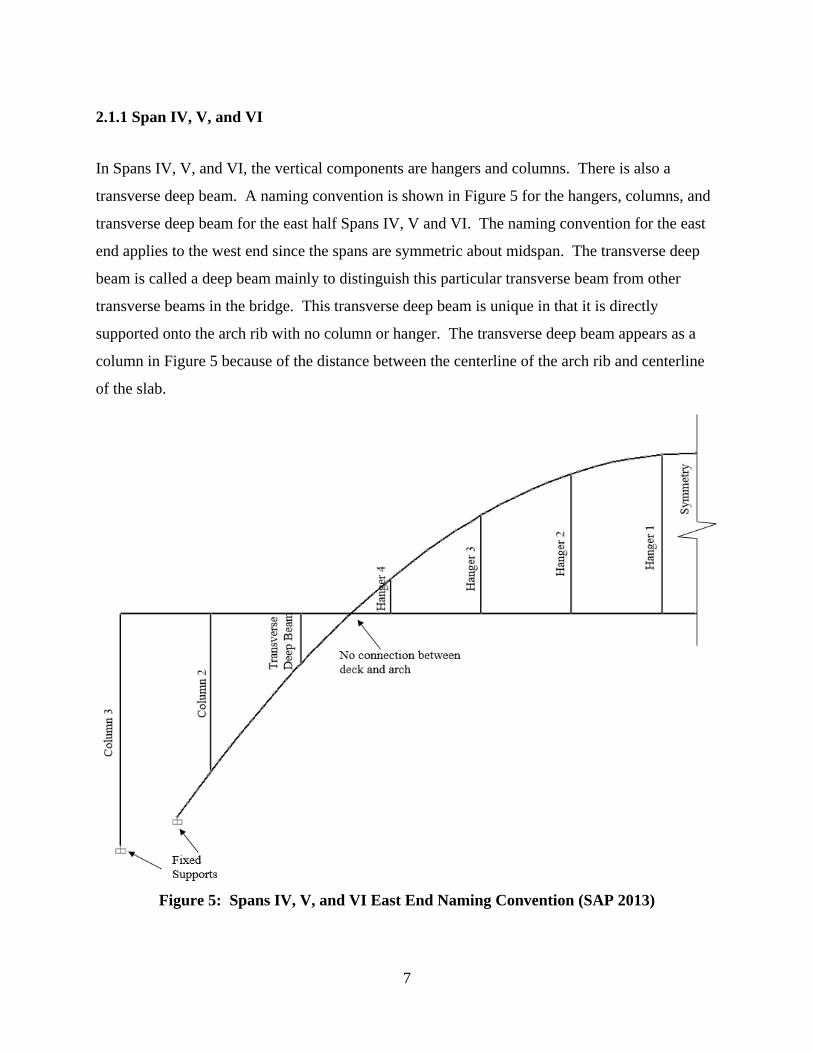
Figure 6: Span VII Naming Convention (SAP 2013) .................................................................... 8
Figure 7: Typical Arch Rib Section for Spans IV – V ................................................................. 11
Figure 8: Typical Arch Rib Section for Span VII ........................................................................ 14
Figure 9: Typical Transverse Beam for all Spans ........................................................................ 15
Figure 10: Typical Transverse Beam Dimensions for Spans IV and V ....................................... 16
Figure 11: Typical Transverse Beam Dimensions for Spans VI and VII .................................... 16
Figure 12: Typical Roadway, Curb, and Bracket Cross Section ................................................. 17
Figure 13: Typical Column 2 Cross Section ................................................................................ 18
Figure 14: Typical Elevation of Column 3 at Pier IV (AHD 1929) ............................................ 20
Figure 15: Column 3 Cross Section ............................................................................................. 21
Figure 16: Elevation of Column 3 with Labels (AHD 1929) ...................................................... 22
Figure 17: Concrete Hangers ....................................................................................................... 23
Figure 18: Hanger Cross Section ................................................................................................. 24
Figure 19: Transverse Deep Beam ............................................................................................... 25
Figure 20: ALDOT Trucks and AASHTO (2002) Lane Load .................................................... 27
Figure 21: Concrete Strengths Used Along Arch (Taylor 1930) ................................................. 28
Figure 22: Positive Bending Moment Cross Section (Spans IV and V) ...................................... 33
Figure 23: Negative Bending Moment Cross Section (Spans IV and V) .................................... 34
Figure 24: Transverse Deep Beam Cross Section ........................................................................ 36
Figure 25: Shear Capacities for Spans IV and V ......................................................................... 38
Figure 26: Load-Moment Interaction User Inputs ....................................................................... 41
Figure 27: Spreadsheet for Plotting Load-Moment Interaction Diagram .................................... 42
Figure 28: Load-Moment Interaction Diagram for Interior Column 2 ........................................ 43
Figure 29: Example Routine for Applied Load Effect Line ........................................................ 45
xx
Figure 30: Routine Finding Intersection of Capacity and Applied Load Effect Lines ................ 45
Figure 31: Axial Load-Interaction Diagram for Exterior Column 2 ............................................ 46
Figure 32: Bracket Section (Left image, AHD 1929) .................................................................. 48
Figure 33: Side Railings on the Bridge ........................................................................................ 48
Figure 34: Axle Weights and Spacings of Standard ALDOT Trucks ......................................... 49
Figure 35: AASHTO (2002) Lane Load ...................................................................................... 50
Figure 36: Live Load Cases 1 - 5 ................................................................................................. 51
Figure 37: Live Load Cases 6 – 8 ................................................................................................ 52
Figure 38: East Longitudinal Beam (AHD 1929) ........................................................................ 53
Figure 39: East Longitudinal Beam Model (SAP 2013) .............................................................. 53
Figure 40: West Longitudinal Beam in Relation to East Longitudinal Beam (AHD 1929) ........ 54
Figure 41: West Longitudinal Beam Model (SAP 2013) ............................................................ 54
Figure 42: Span VII Longitudinal Beam Model (SAP 2013) ...................................................... 55
Figure 43: Beam and Column 2 Model (SAP 2013) ................................................................... 56
Figure 44: Beam and Column 3 Model (SAP 2013) ................................................................... 57
Figure 45: Spreadsheet for Finding δb ......................................................................................... 61
Figure 46: Span VII Beam and Column 5 Model – Case A (SAP 2013) .................................... 63
Figure 47: Span VII Beam and Column 5 Model - Case B (SAP 2013) ..................................... 63
Figure 48: Composite Concrete Hangers ..................................................................................... 65
Figure 49: Steel Hanger Cross Section ........................................................................................ 66
Figure 50: Beam and Steel Hanger 1 Model (SAP 2013) ............................................................ 67
Figure 51: Transverse Deep Beam Model (SAP 2013) ............................................................... 67
Figure 52: Boundary Conditions and Restraints for Half Spans IV, V, and VI (SAP 2013) ...... 72
Figure 53: Deck Slab Showing Slabs at Midspan are Not Connected (SAP 2013) ..................... 74
Figure 54: Boundary Conditions and Restraints for Span VII (SAP 2013) ................................. 75
Figure 55: Critical Truck Location for Buckling of Spans IV, V, and VI ................................... 91
Figure 56: Critical Truck Location for Buckling of Span VII ..................................................... 91
Figure 57: First Mode Buckled Shape for Spans IV, V, and VI .................................................. 92
Figure 58: First Mode Buckled Shape for Span VII .................................................................... 92
Figure 59: Critical Cross Sections for Spans IV, V, and VI ........................................................ 94
Figure 60: Critical Cross Sections for Span VII .......................................................................... 94

xxi
Figure 61: Spans IV, V, and VI East End Naming Convention (SAP 2013) (Duplicate -Figure 5)
..................................................................................................................................................... 106
Figure 62: Span IV – Arch Rib with Rated Sections Labeled (SAP 2013) ............................... 113
Figure 63: Span V - Arch Rib with Rated Sections Labeled (SAP 2013) ................................. 124
Figure 64: Span VI - Arch Rib with Rated Sections Labeled (SAP 2013) ................................ 135
Figure 65: Span VII Naming Convention (SAP 2013) (Duplicate - Figure 6) .......................... 140
Figure 66: Span VII - Arch Rib with Rated Sections Labeled (SAP 2013) .............................. 146
Figure 67: Positive and Negative Bending Distribution Resulting from Uniform Temperature
Increase (SAP 2013) ................................................................................................................... 156
Figure 68: Positive and Negative Bending Distribution Resulting from Dead Load (SAP 2013)
..................................................................................................................................................... 157
Figure 69: Deflection at Arch Center Span (Point A)................................................................ 161
Figure 70: Deflection Plot Resulting from ASR-Expansion for 3,000 psi Model ..................... 164
Figure 71: Span IV - Effects of Changes in Ec on Deflection ................................................... 169
Figure 72: Span V - Effects of Changes in Ec on Deflection ..................................................... 170
Figure 73: Span VI - Effects of Changes in Ec on Deflection ................................................... 171
Figure 74: Span VII - Effects of Changes in Ec on Deflection .................................................. 172
Figure 75: Span IV - Effect of f’c on Arch Operating Ratings ................................................. 174
Figure 76: Span V - Effect of f’c on Arch Operating Ratings .................................................... 175
Figure 77: Span VI - Effect of f’c on Arch Operating Ratings .................................................. 176
Figure 78: Span VII - Effect of f’c on Arch Operating Ratings ................................................. 177
Figure 79A: MathCAD (2014) Sheet Showing Ultimate Creep Coefficient Calculations for Span
IV ................................................................................................................................................ 198
Figure 80B: Lateral Truck Distribution using Beam and Column 2 Model .............................. 206
Figure 81B: Beam and Composite Hanger 1 Model .................................................................. 208
Figure 82B: Composite Hanger Interaction Diagram ................................................................ 209
1
Chapter 1
INTRODUCTION
1.1 BACKGROUND
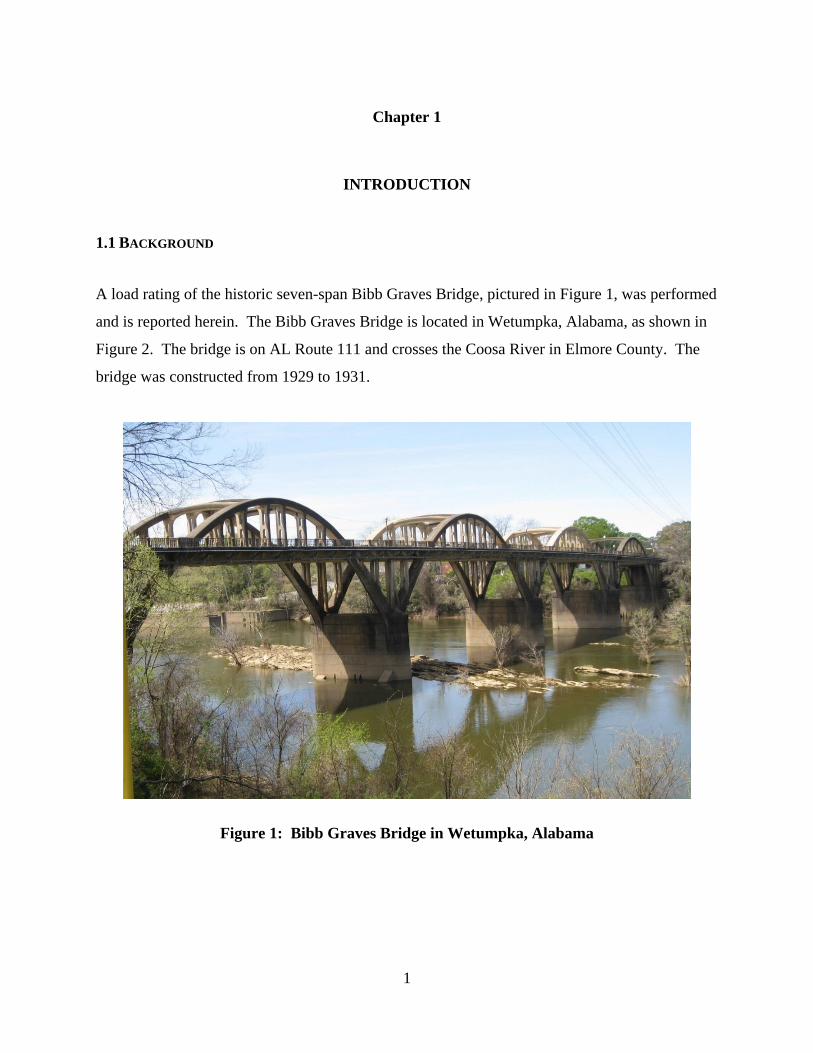
A load rating of the historic seven-span Bibb Graves Bridge, pictured in Figure 1, was performed
and is reported herein. The Bibb Graves Bridge is located in Wetumpka, Alabama, as shown in
Figure 2. The bridge is on AL Route 111 and crosses the Coosa River in Elmore County. The
bridge was constructed from 1929 to 1931.
Figure 1: Bibb Graves Bridge in Wetumpka, Alabama

2
Figure 2: Alabama Map with a Triangular Marker at Wetumpka (Geoscience News and
Information 2005)
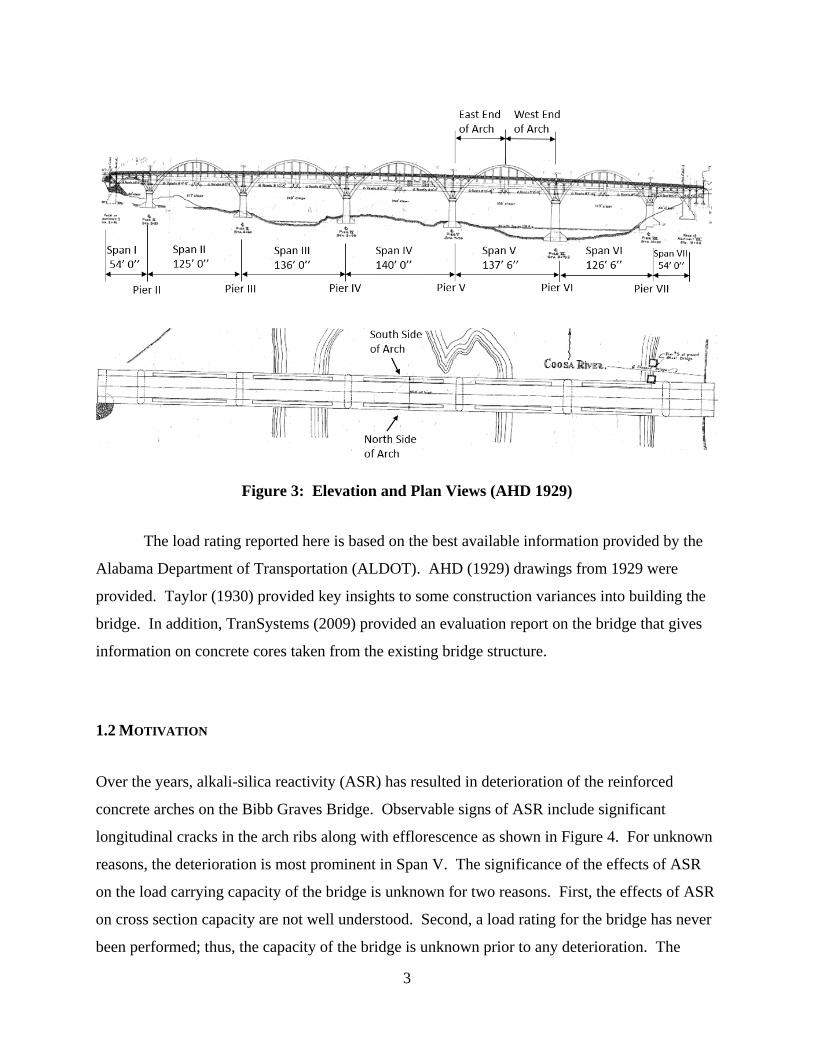
Figure 3 shows an elevation and a plan view of the bridge along with the directional
orientation. It is 44 feet wide by approximately 800 feet long and comprised of seven parabolic
arches. The arches at each end are completely under the deck, with the center five being through
arches. The bridge is essentially symmetrical about the center arch span (Span IV). The center
arch is the longest with a clear span of 132 feet. In each longitudinal direction from the center
span, the clear spans are 128 feet, 117 feet, and 40 feet, respectively. The arches are integral at
the base with massive concrete piers that have average dimensions of ten feet wide by 40 feet
long. The pier names are as labeled in Figure 3. Providing for two travel lanes, the roadway
width is 27 feet. The roadway slab is supported on transverse beams that are connected to the
arches by hangers and columns. As described by Taylor (1930), the roadway slab is suspended
from the through arches above the pier at an elevation of half the height of the arch.
3
Figure 3: Elevation and Plan Views (AHD 1929)
The load rating reported here is based on the best available information provided by the
Alabama Department of Transportation (ALDOT). AHD (1929) drawings from 1929 were
provided. Taylor (1930) provided key insights to some construction variances into building the
bridge. In addition, TranSystems (2009) provided an evaluation report on the bridge that gives
information on concrete cores taken from the existing bridge structure.
1.2 MOTIVATION
Over the years, alkali-silica reactivity (ASR) has resulted in deterioration of the reinforced
concrete arches on the Bibb Graves Bridge. Observable signs of ASR include significant
longitudinal cracks in the arch ribs along with efflorescence as shown in Figure 4. For unknown
reasons, the deterioration is most prominent in Span V. The significance of the effects of ASR
on the load carrying capacity of the bridge is unknown for two reasons. First, the effects of ASR
on cross section capacity are not well understood. Second, a load rating for the bridge has never
been performed; thus, the capacity of the bridge is unknown prior to any deterioration. The
4
uncertainty surrounding the structural significance of ASR has led to speculation for schemes to
strengthen the bridge without clear proof that structural strengthening is necessary. As an initial
step to plan and to prepare maintenance activities for the bridge, a load rating is performed in this
project. The structural elements for ratings include the vertical columns, vertical tension
hangers, transverse floor beams, and arch ribs.
Figure 4: Arch Rib with ASR-Induced Longitudinal Cracks
1.3 REPORT ORGANIZATION
Chapter 2 presents the bridge geometry for the bridge components along with defining the
naming convention. Dimensions of cross sections are defined. The method of establishing the
arch geometry is discussed in details. Assumptions in defining the geometry are explained.
Chapter 3 provides a detailed overview of the rating procedure. The process of obtaining
the rating factor from the axial load-moment interaction diagram is discussed. The member
capacity for each component is obtained for the rating process. Dead and live loads are
calculated and the location of application are presented. Transverse frame and arch modeling
5
process is explained. In addition, slenderness effects for the columns and arch rib are evaluated
in Chapter 3.
Chapter 4 explains and compares the different approaches that are available to account
for in-plane slenderness effects on the bending moments that must be resisted by the arches.
Moment magnifiers are calculated using the procedures defined in AASHTO (2002) and
AASHTO (2012) and from the results of elastic buckling analyses performed using SAP2000.
Magnified moments are compared to bending moments calculated by elastic second-order
analysis.
Chapter 5 lists the load factor ratings for Spans IV, V, VI, and VII of the bridge.
Components including columns, hangers, transverse beams, and arch ribs were rated. Ratings
are listed for the operating and inventory level for the eight ALDOT trucks and the AASHTO
lane load.
Chapter 6 provides sensitivity analyses. This Chapter assesses the effects of ASR-
expansion on the arch internal forces and vertical deflection. In addition, the effects of changes
in the concrete modulus of elasticity and concrete strength for the transverse frames and arches
on the member’s internal forces and vertical deflection are examined. Effects of these changes
on rating factors are listed.
Chapter 7 summarizes what was performed in this project for the Bibb Graves Bridge and
points out components where the rating factor is less than 1.0.

6
Chapter 2
BRIDGE GEOMETRY
The geometry was taken from drawings provided from ALDOT in a PDF file. Full elevation and
plan views of the bridge are shown in Figure 3. The span lengths measured from centerline-to-
centerline of piers are listed in Table 1. Since the bridge is essentially symmetric, ratings are
provided for Spans IV, V, VI, and VII only. The geometry of the bridge was divided up into
columns, hangers, transverse floor beams, transverse deep beams, and arches. Before the
geometry is discussed any further, the naming convention for the spans and various bridge
components is presented.
Table 1: Span Lengths
2.1 NAMING CONVENTION
Names along with identification numbers are assigned to components of interest for referencing
purposes. Spans IV, V, and VI have the same names since the configuration of components is
identical. Span VII’s components have their own names, and the order of the numbering is a
continuation from Span VI’s west end.
Span I 54 ft 0 in.
Span II 125 ft 0 in.
Span III 136 ft 0 in.
Span IV 140 ft 0 in.
Span V 137 ft 6 in.
Span VI 126 ft 6 in.
Span VII 54 ft 0 in.
7
2.1.1 Span IV, V, and VI
In Spans IV, V, and VI, the vertical components are hangers and columns. There is also a
transverse deep beam. A naming convention is shown in Figure 5 for the hangers, columns, and
transverse deep beam for the east half Spans IV, V and VI. The naming convention for the east
end applies to the west end since the spans are symmetric about midspan. The transverse deep
beam is called a deep beam mainly to distinguish this particular transverse beam from other
transverse beams in the bridge. This transverse deep beam is unique in that it is directly
supported onto the arch rib with no column or hanger. The transverse deep beam appears as a
column in Figure 5 because of the distance between the centerline of the arch rib and centerline
of the slab.
Figure 5: Spans IV, V, and VI East End Naming Convention (SAP 2013)
8
2.1.2 Span VII
The convention for naming Span VII, which is comprised of columns only, is shown in Figure 6.
Figure 6: Span VII Naming Convention (SAP 2013)
2.2 ARCHES
2.2.1 Span IV, V, and VI
The geometry of the bridge was defined using the to scale drawings provided by AHD (1929)
and Autodesk, Inc. AutoCAD (2014). The original elevation drawings of each span were saved
as a JPEG file. Each image file was inserted into AutoCAD as an attachment. The base point of
the inserted file was defined to be at the origin of the drawing sheet with a default scale factor of
1.0. Drawing layers were created and defined as necessary for drawing and viewing
enhancements. Two perfectly vertical lines were drawn in for reference for each arch. One line
was a vertical line through the centerline of the east or left pier, and another one was a vertical
line through the arch midspan. Using the linear dimension between these two vertical lines and
the longest true horizontal dimension given, which is between these two vertical lines, a scale

9
factor was inserted to establish the true scale of each drawing.
The deck is sloped in the longitudinal direction. The highest elevation is at midspan of
Span IV, the center span. The lowest elevations are at either abutment. To prevent analysis
result anomalies, the deck of each span was defined to have zero slope, and the deck was located
at the average elevation of the mid-thickness of the deck in that span. These locations are at the
quarter span for Span IV and at midspan for Spans V and VI.
All column and hanger centerlines were offset from the two reference vertical lines using
the transverse beam spacing shown on the drawings. The lengths of the columns and hangers
were bounded by the arch centerline and the mid-thickness of the deck slab. For the column
above the pier, its length was defined to extend from the extrados curve of the arch to the mid-
thickness of the deck slab.
Being thinnest at midspan and thickest at the base, the thickness of the arch varied along
the length. To define the geometry, the arch was discretized at approximately every two feet
along the length, which was conveniently located at each hoop location. Each hoop was drawn
in at its prescribed location with its ends extending to the intrados and extrados curves of the
arch to define the thickness of the cross section at each hoop location. Then, the intrados and
extrados were drawn in as straight lines between each cross section. The arch centerline or mid-
thickness was drawn in for each section at the midpoint of each hoop. All boundary lines were
drawn in with high accuracy and precision as their nodes were either at the center of the
originally marked lines or bounded by the edges of the originally marked lines.
At the base of each arch and near the top of the pier, the cross section height increased
rapidly. This increase resulted from transitions in the extrados and intrados curves of the arch
along circular arcs that provided smooth transitions at the pier supports. To avoid anomalies in
the structural analysis results near the arch base, the arch shape and cross section thickness were
manually adjusted. These adjustments included extrapolating the curved, concave-down shape
of the arch to a point near the top of the pier and neglecting some of the concrete cross section to
provide a smooth increase in the arch cross section height that was consistent with the remainder
of the arch. To maintain uniformity, the arch base sections were discretized at every two feet
using the orientation of the last provided hoop in the elevation drawing. Each cross section
height beyond the last shown hoop was increased by 0.10 feet from the previous one to be
consistent with the rate of increase of the arch sections near the base. These sections were then

10
shifted in the plane to line up with the intrados curve as the main reinforcements followed this
curve more closely than the extrados curve. The arch base ended at the location of the last
extrapolated hoop near the face of the pier.
Once the geometry of each half span was established, the drawing was saved as a DXF
file for ease of import into the structural analysis software SAP2000 version 15 by Computers
and Structures, Inc. With the structural analysis program running, the AutoCAD DXF file was
imported. The global up direction from AutoCAD was selected to the positive Y direction with
the units being kips and feet. Then, each layer of the drawing was selected to be imported as
frame members. The process was repeated until all necessary layers were imported.
The arches are parabolic. Rise and span length information for each span is provided in
Table 2. A cross section of the arch rib for Spans IV – VI is shown in Figure 7. All arch ribs are
4 ft 0 in. wide and are doubly reinforced with eight bars in each layer. All reinforcing bars are
square bars unless noted. The overall height, h; distance from extreme top fiber to centroid of
top bar group, dT; distance from extreme top fiber to centroid of bottom bar group, dB; area of
steel in the top layer, As T; and area of steel in the bottom layer, As B, are shown in Table 3
through Table 5 for Spans IV through VI. Properties are shown for the arch rib section at the
peak, base, and at all hanger and column locations.
Table 2: Spans IV through VI - Arch Rise and Span Length
Span IV Span V Span VI
Arch Rise (ft) 45.58 44.57 40.44
Arch Span (ft) 130.2 128.3 116.5

11
Figure 7: Typical Arch Rib Section for Spans IV – V
Table 3: Arch Rib Section Properties for Span IV
h (in.) dT (in.) dB (in.) As T (in.2) As B (in.2)
Arch Rib at Peak 28.0 3.00 25.0 8.00 8.00
Arch Rib at Hanger 1 28.0 3.00 25.0 8.00 8.00
Arch Rib at Hanger 2 29.0 3.00 26.0 8.00 8.00
Arch Rib at Hanger 3 29.6 3.00 26.6 8.00 8.00
Arch Rib at Hanger 4 30.5 3.13 26.9 10.0 9.00
Arch Rib at Transverse Deep Beam 33.7 3.13 30.6 10.0 10.0
Arch Rib at Column 2 41.4 3.13 38.3 10.0 10.0
Arch Rib at Base 47.8 3.13 44.6 10.0 10.0
h
b = 4’ 0’’
As B
As T
dB
dT

12
Table 4: Arch Rib Section Properties for Span V
h (in.) dT (in.) dB (in.) As T (in.2) As B (in.2)
Arch Rib at Peak 27.0 3.00 24.0 8.00 8.00
Arch Rib at Hanger 1 27.1 3.00 24.1 8.00 8.00
Arch Rib at Hanger 2 28.0 3.00 25.0 8.00 8.00
Arch Rib at Hanger 3 28.3 3.00 25.3 8.00 8.00
Arch Rib at Hanger 4 29.3 3.13 26.2 10.0 9.0
Arch Rib at Transverse Deep Beam 32.4 3.13 29.3 10.0 10.0
Arch Rib at Column 2 40.4 3.13 37.3 10.0 10.0
Arch Rib at Base 46.6 3.13 43.4 10.0 10.0
Table 5: Arch Rib Section Properties for Span VI
h (in.) dT (in.) dB (in.) As T (in.2) As B (in.2)
Arch Rib at Peak 26.0 3.00 23.0 6.28
(round)
6.28
(round)
Arch Rib at Hanger 1 26.8 3.00 23.8 6.28
(round)
6.28
(round)
Arch Rib at Hanger 2 27.4 3.00 24.4 6.28
(round)
6.28
(round)
Arch Rib at Hanger 3 28.2 3.00 25.2 6.28
(round)
6.28
(round)
Arch Rib at Hanger 4 29.0 3.10 26.0 9.00 9.00
Arch Rib at Transverse Deep Beam 32.2 3.10 29.2 9.00 9.00
Arch Rib at Column 2 38.9 3.10 35.9 9.00 9.00
Arch Rib at Base 44.0 3.10 41.0 9.00 9.00

13
2.2.2 Span VII
A full elevation view of Span I was provided in the original drawings. The full geometry of it
was defined in AutoCAD. The deck elevation was defined at the average elevation of the mid-
thickness of the slab, which is at the midspan. In Span VII, the arch was discretized at each hoop
spacing, which is 1 ft 6 in. On the abutment side, the arch ended at the hoop location at which its
centerline was directly below the centerline of the column. The arch base on the pier side ended
at the last extrapolated hoop spacing just before the pier cap. The height of the extrapolated arch
section was based off the rate of increase of the previous section which was 0.20 ft. Then, each
extrapolated hoop was shifted in the plane in such a way that the arch centerline was a smooth
transition from one section to the next that was consistent with the remainder of the arch. Once
the drawing of Span I was imported into SAP2000, it was mirrored about the vertical axis to
match the orientation of Span VII.
The arch in Span VII is parabolic. Rise and span length information is provided in Table
6. A cross section of the arch rib for Span VII is shown in Figure 8. All longitudinal
reinforcement in the arch rib is round bars. The properties of the arch rib at both ends and at all
columns are shown in Table 7 for Span VII.
Table 6: Span VII - Arch Rise and Span Length
Span VII
Arch Rise (ft) 15.79
Arch Span (ft) 39.99

14
Figure 8: Typical Arch Rib Section for Span VII
Table 7: Arch Rib Section Properties for Span VII
h (in.) dT (in.) dB (in.) As T (in.2) As B (in.2)
Arch Rib at East Base 31.1 2.94 28.1 4.81 4.81
Arch Rib at Column 4 20.8 2.94 17.8 4.81 4.81
Arch Rib at Column 5 16.4 2.88 13.5 3.53 4.81
Arch Rib at Column 6 16.8 2.88 13.9 3.53 4.81
Arch Rib at Column 7 17.4 2.94 14.5 3.53 4.81
Arch Rib at West Base 27.4 2.94 24.4 4.81 4.81

15
2.3 TRANSVERSE FLOOR BEAMS
For the part of the arch ribs that are below the roadway, the deck is supported on a beam and
column system. The beam was discretized into three parts shown in Figure 9 because of changes
in geometry. Those parts are roadway, curb, and bracket. The curb and bracket are part of the
sidewalk slabs on either side. The roadway and curbs on either side are part of the transverse
beam length.
Figure 9: Typical Transverse Beam for all Spans
The dimensions of the transverse beam for Spans IV and V are shown in Figure 10. The
dimensions of the transverse beam Spans VI and VII are shown in Figure 11. For all transverse
beams, the width of the transverse beam is 1 ft 6 in., and the width of the bracket is 1 ft 0 in.
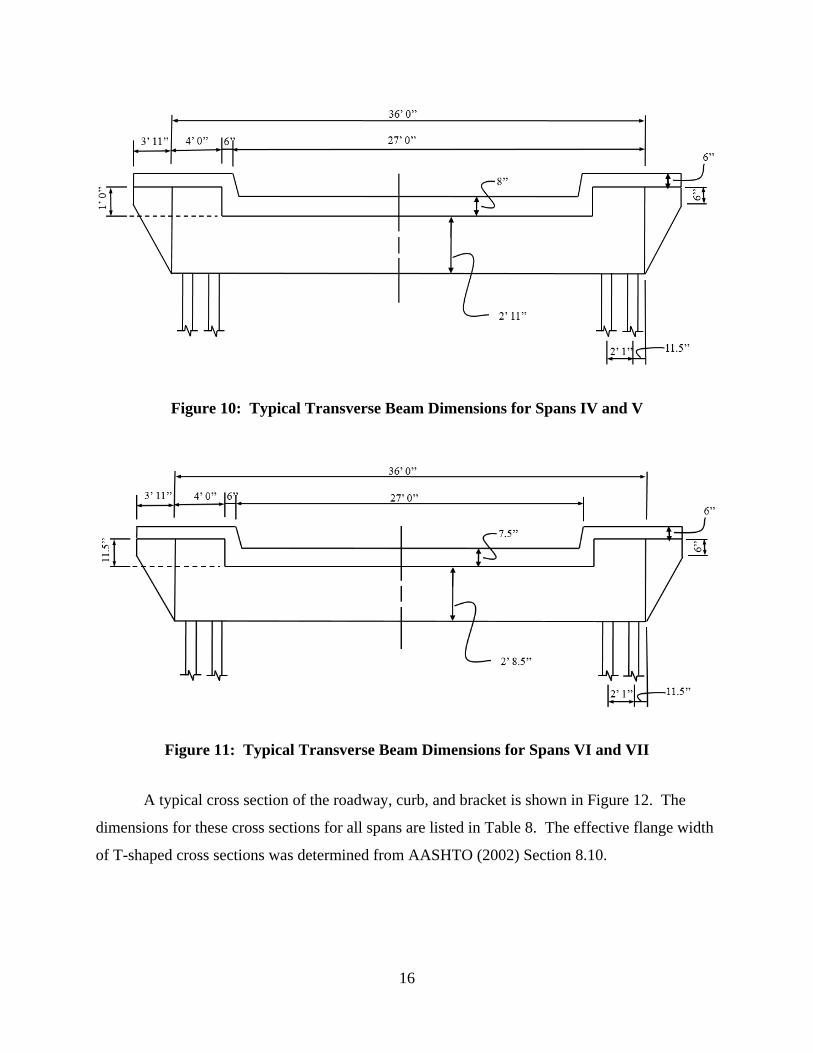
16
Figure 10: Typical Transverse Beam Dimensions for Spans IV and V
Figure 11: Typical Transverse Beam Dimensions for Spans VI and VII
A typical cross section of the roadway, curb, and bracket is shown in Figure 12. The
dimensions for these cross sections for all spans are listed in Table 8. The effective flange width
of T-shaped cross sections was determined from AASHTO (2002) Section 8.10.
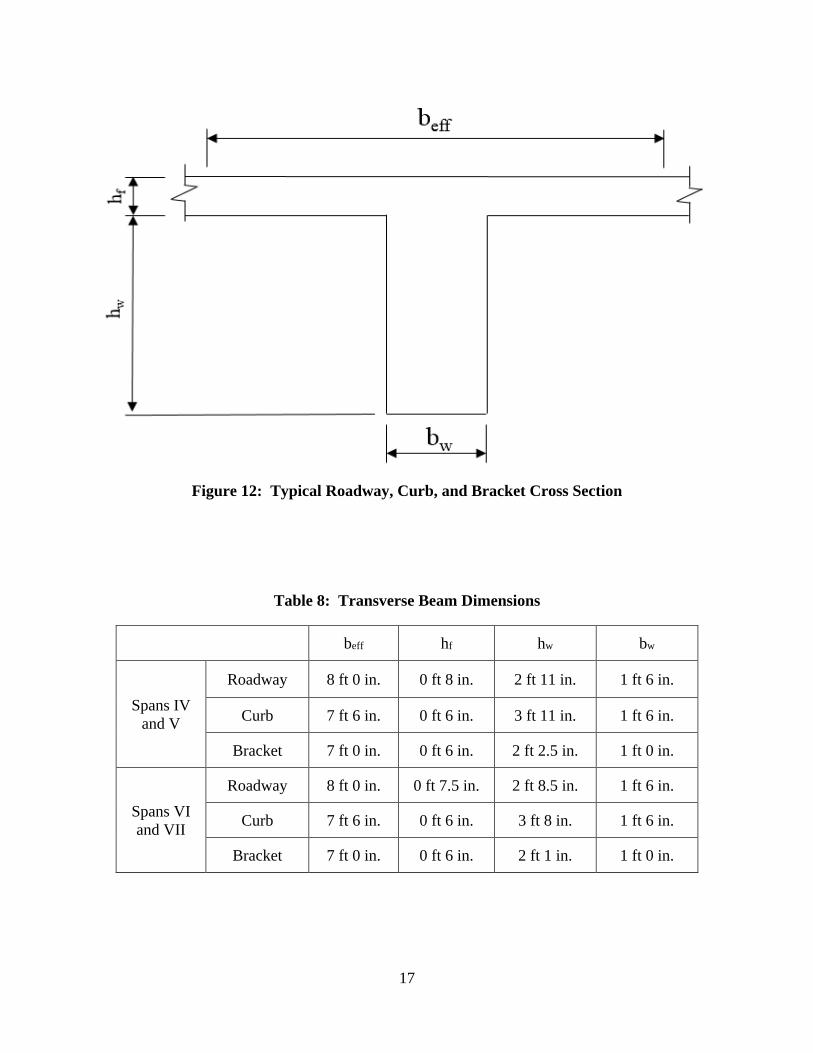
17
Figure 12: Typical Roadway, Curb, and Bracket Cross Section
Table 8: Transverse Beam Dimensions
beff hf hw bw
Spans IV
and V
Roadway 8 ft 0 in. 0 ft 8 in. 2 ft 11 in. 1 ft 6 in.
Curb 7 ft 6 in. 0 ft 6 in. 3 ft 11 in. 1 ft 6 in.
Bracket 7 ft 0 in. 0 ft 6 in. 2 ft 2.5 in. 1 ft 0 in.
Spans VI
and VII
Roadway 8 ft 0 in. 0 ft 7.5 in. 2 ft 8.5 in. 1 ft 6 in.
Curb 7 ft 6 in. 0 ft 6 in. 3 ft 8 in. 1 ft 6 in.
Bracket 7 ft 0 in. 0 ft 6 in. 2 ft 1 in. 1 ft 0 in.

18
2.4 COLUMNS
Two types of column cross section are present in the bridge. All columns not at pier locations
have the same cross section. These columns are labeled column followed by an identification
number other than three in the naming convention. The other column cross section is for
columns over all piers. These columns are all labeled Column 3 in the naming convention.
2.4.1 Column 2s
For all columns except the columns over the piers, the cross section is shown in Figure 13. For
Spans IV, V, and VI, columns not at a pier are called Column 2. Traffic flows parallel to the x-x
axis or weak axis. Each column is 14 in. x 15 in. and reinforced by four 1-in.-square reinforcing
bars. The centerline-to-centerline spacing of the columns is two feet one inch. For Spans IV, V,
and VI, the stirrups are 3/8-in. diameter round bars spaced at 12 in. center-to-center.
Figure 13: Typical Column 2 Cross Section
19
For Span VII, the reinforcing bars consist of round and square bars (AHD 1929). Figure
6 shows the naming convention for Span VII. Column 4 has 1-in. square reinforcing bars.
Columns 5 and 6 have 3/4-in. round diameter bars. Column 7 has 1-in. round diameter bars.
The stirrup spacings are 10 in. and 12 in. center-to-center.
2.4.2 Column 3s
For all columns at a pier, a typical elevation view taken from AHD (1929) is shown in Figure 14.
All columns at a pier are also referred to as Column 3. The Column 3 cross section is shown in
Figure 15. Traffic flows parallel to the x-x axis or weak axis. The interior Column 3 is 14 in. x
18 in. and reinforced by four 1-in.-diameter reinforcing bars. No information is provided about
the stirrup size and spacing. The exterior column is T-shaped with the web facing inward. The
exterior column is intentionally shown without any reinforcement in Figure 15 because no
information is available. For all exterior Column 3s, the web width, web height, and flange
height are as labeled. However, the flange width varies from pier to pier.

20
Figure 14: Typical Elevation of Column 3 at Pier IV (AHD 1929)

21
Figure 15: Column 3 Cross Section
Figure 16 shows that the flange edges of the exterior Column 3 are curved. The flange
width is thinnest at the top and thickest at the base. To define the geometry, the exterior Column
3 was divided into a top and a bottom section at the mid-height of the column. For each section,
the flange width is taken as the average width for that section. The flange width for the exterior
Column 3s for the top and bottom sections is shown in Table 9.
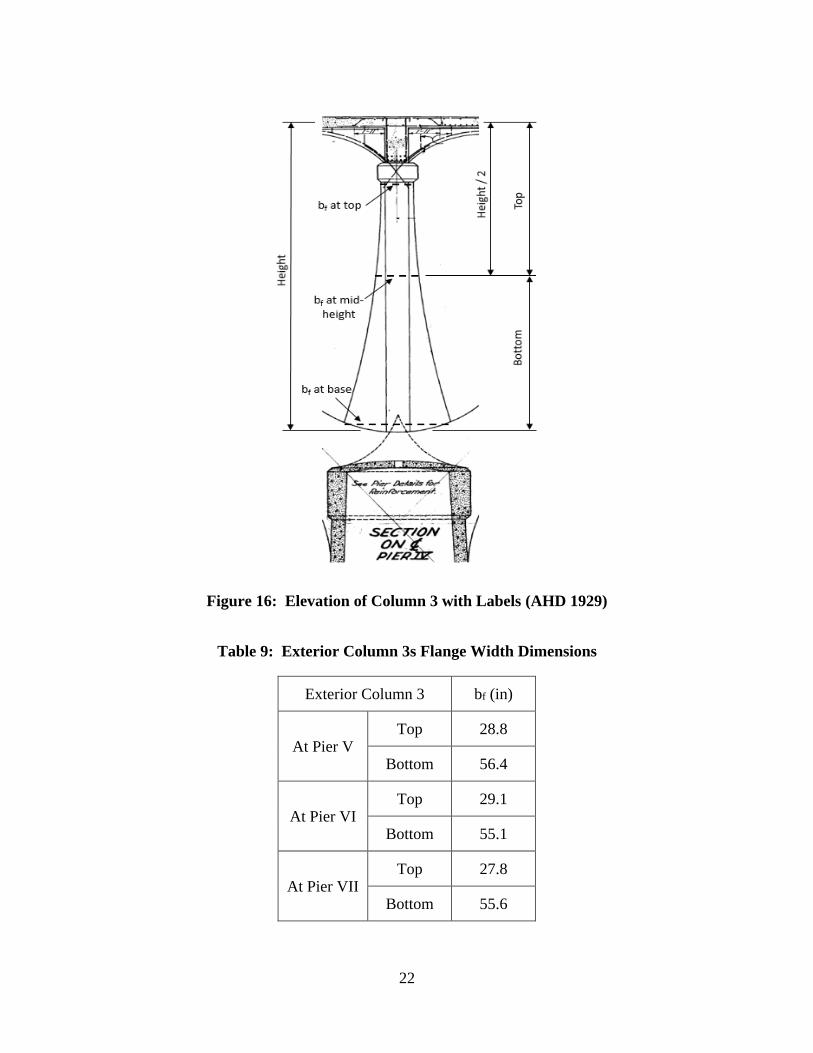
22
Figure 16: Elevation of Column 3 with Labels (AHD 1929)
Table 9: Exterior Column 3s Flange Width Dimensions
Exterior Column 3 bf (in)
At Pier V Top 28.8
Bottom 56.4
At Pier VI Top 29.1
Bottom 55.1
At Pier VII Top 27.8
Bottom 55.6

23
2.5 HANGERS
Each reinforced concrete hanger, as shown in Figure 17, connects the arch rib and transverse
floor beam which supports the deck slab. All hangers consist of a pair of 12 in. by 14 in.
concrete cross sections reinforced with four 1-in.-square reinforcing bars as shown in Figure 18.
Figure 17: Concrete Hangers
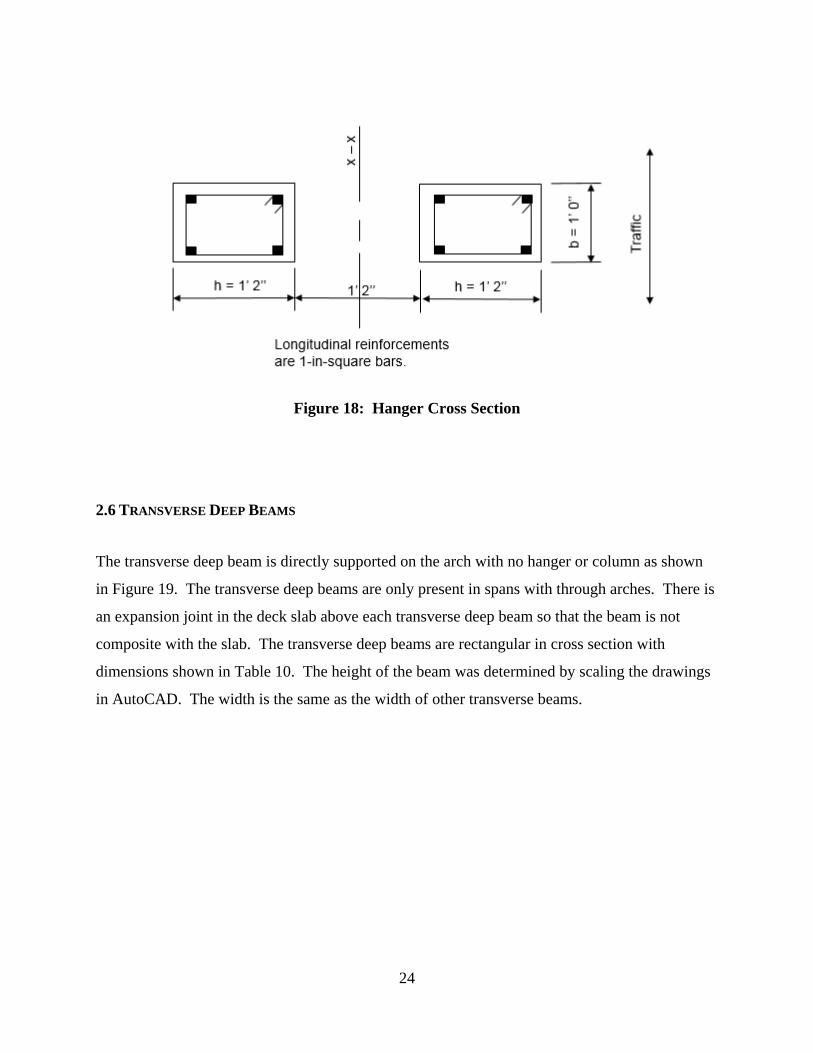
24
Figure 18: Hanger Cross Section
2.6 TRANSVERSE DEEP BEAMS
The transverse deep beam is directly supported on the arch with no hanger or column as shown
in Figure 19. The transverse deep beams are only present in spans with through arches. There is
an expansion joint in the deck slab above each transverse deep beam so that the beam is not
composite with the slab. The transverse deep beams are rectangular in cross section with
dimensions shown in Table 10. The height of the beam was determined by scaling the drawings
in AutoCAD. The width is the same as the width of other transverse beams.
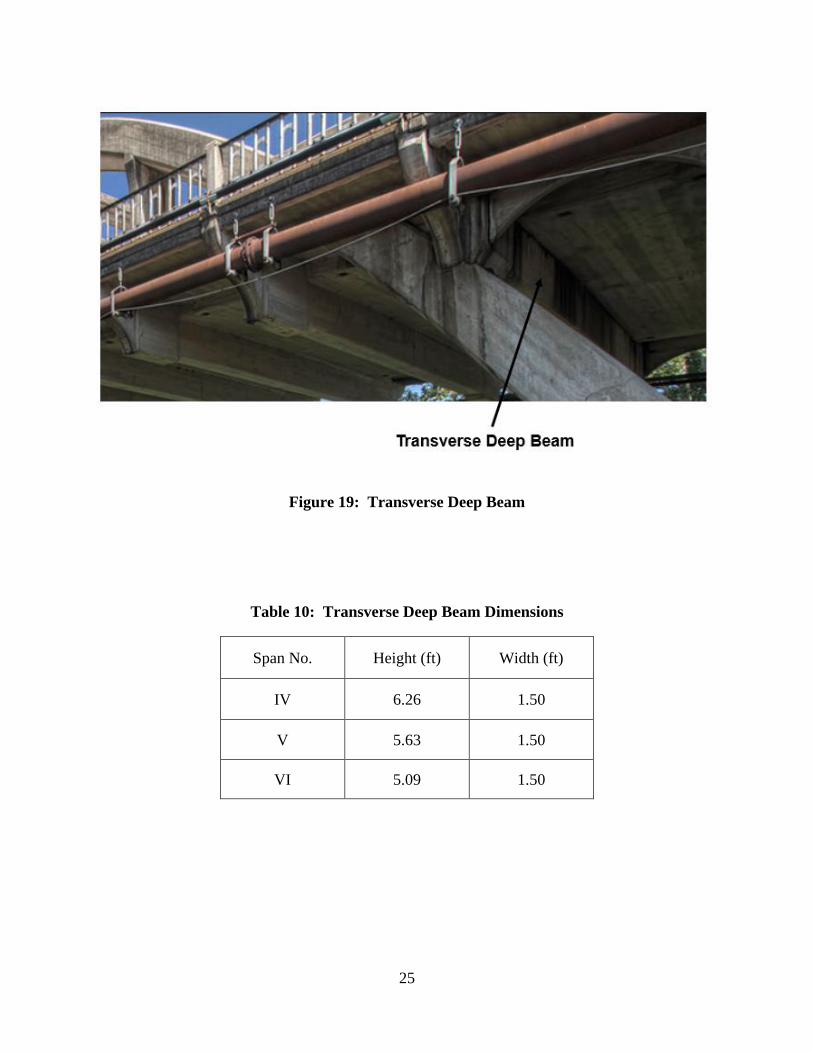
25
Figure 19: Transverse Deep Beam
Table 10: Transverse Deep Beam Dimensions
Span No. Height (ft) Width (ft)
IV 6.26 1.50
V 5.63 1.50
VI 5.09 1.50

26
Chapter 3
RATING METHODOLOGY
The goal of the project is to provide load ratings for the bridge components for the eight ALDOT
trucks and the AASHTO lane load. The specifications and ALDOT requirements for the ratings
are presented in this Chapter along with a description of the rating methodology used. The
process for determining the member capacities is described along with the computer models used
for the transverse frames and arches.
3.1 SPECIFICATIONS AND ALDOT REQUIREMENTS
The load ratings were performed in accordance with the Load Factor Rating (LFR) method
defined in the 2011 second edition of The Manual for Bridge Evaluation or The MBE by the
American Association of State Highway and Transportation Officials’ (AASHTO). AASHTO
(2011) references AASHTO’s 2002 seventeenth edition of the Standard Specifications for
Highway Bridges.
As required by the Alabama Department of Transportation (ALDOT), all structural
analysis was performed with Computer and Structures, Inc. software SAP2000 version 15.
Rating factors were determined for eight standard truck loadings routinely used by ALDOT and
a lane loading prescribed by AASHTO as shown in Figure 20. These trucks are the H-truck,
two-axle, tri-axle, concrete, 18-wheeler, 6-axle, school bus, and HS-truck. In addition, rating
factors were determined for the AASHTO lane load consisting of a uniformly distributed load
with concentrated loads positioned for maximum shear and moment. Additional information
about the truck loadings is provided in Figure 34.
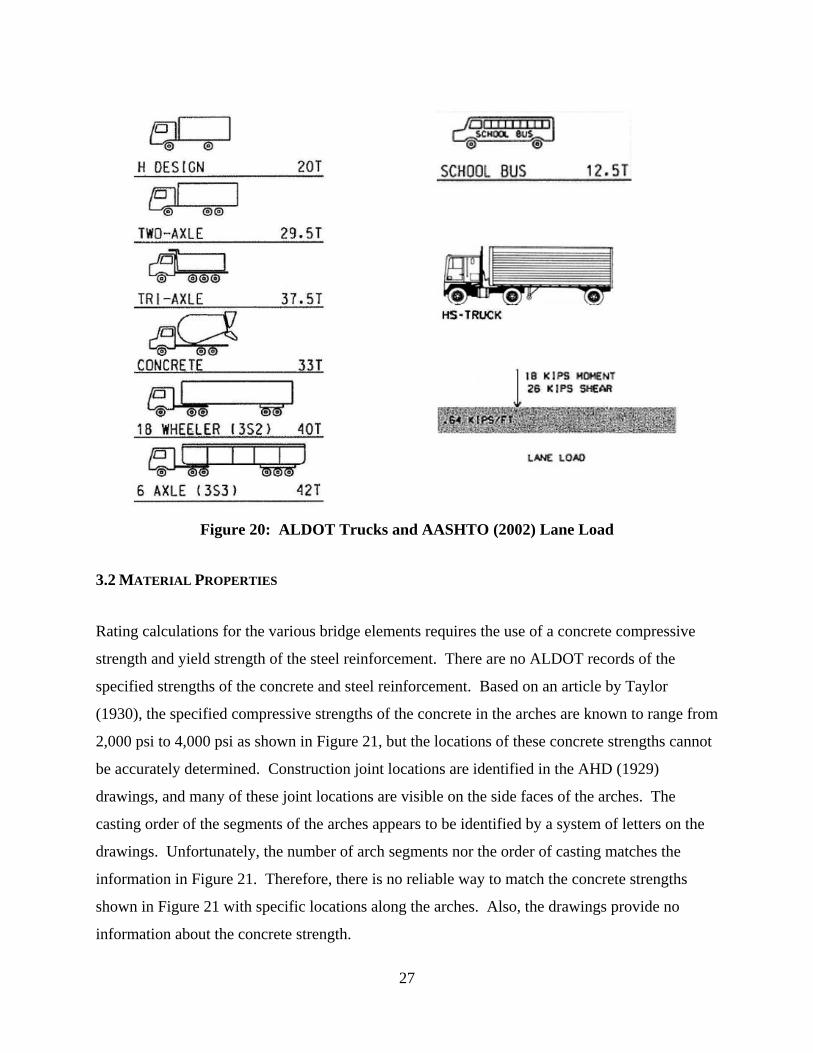
27
Figure 20: ALDOT Trucks and AASHTO (2002) Lane Load
3.2 MATERIAL PROPERTIES
Rating calculations for the various bridge elements requires the use of a concrete compressive
strength and yield strength of the steel reinforcement. There are no ALDOT records of the
specified strengths of the concrete and steel reinforcement. Based on an article by Taylor
(1930), the specified compressive strengths of the concrete in the arches are known to range from
2,000 psi to 4,000 psi as shown in Figure 21, but the locations of these concrete strengths cannot
be accurately determined. Construction joint locations are identified in the AHD (1929)
drawings, and many of these joint locations are visible on the side faces of the arches. The
casting order of the segments of the arches appears to be identified by a system of letters on the
drawings. Unfortunately, the number of arch segments nor the order of casting matches the
information in Figure 21. Therefore, there is no reliable way to match the concrete strengths
shown in Figure 21 with specific locations along the arches. Also, the drawings provide no
information about the concrete strength.
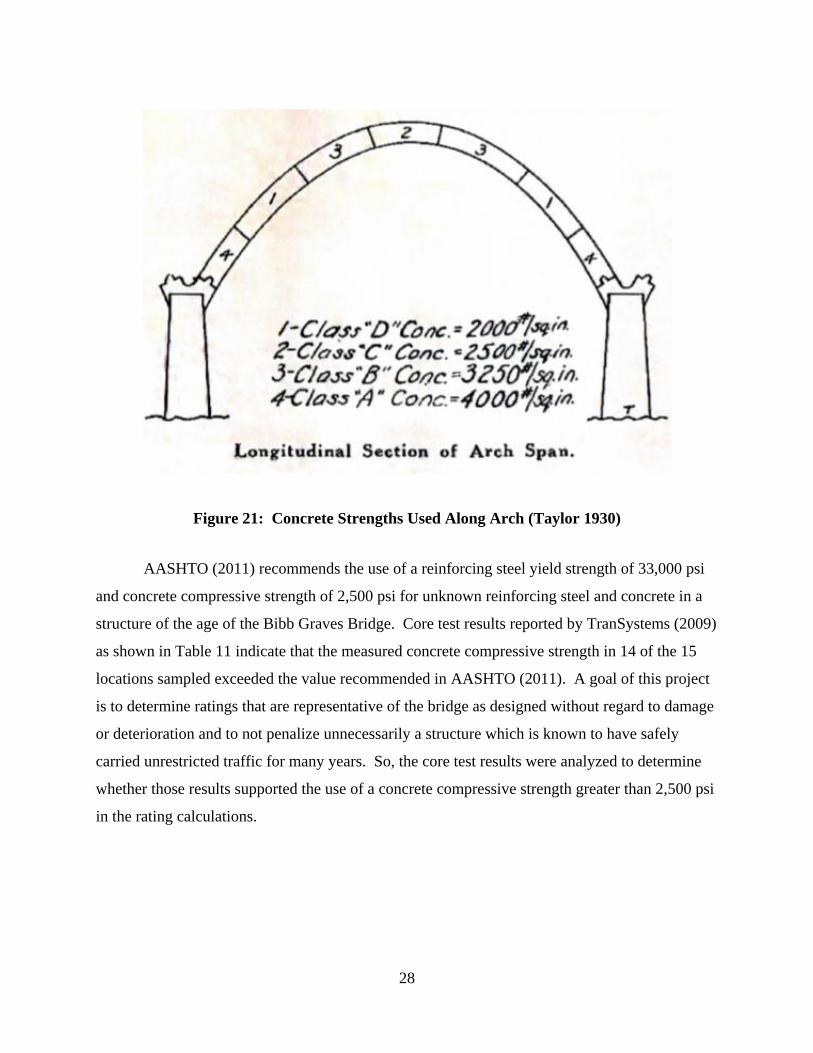
28
Figure 21: Concrete Strengths Used Along Arch (Taylor 1930)
AASHTO (2011) recommends the use of a reinforcing steel yield strength of 33,000 psi
and concrete compressive strength of 2,500 psi for unknown reinforcing steel and concrete in a
structure of the age of the Bibb Graves Bridge. Core test results reported by TranSystems (2009)
as shown in Table 11 indicate that the measured concrete compressive strength in 14 of the 15
locations sampled exceeded the value recommended in AASHTO (2011). A goal of this project
is to determine ratings that are representative of the bridge as designed without regard to damage
or deterioration and to not penalize unnecessarily a structure which is known to have safely
carried unrestricted traffic for many years. So, the core test results were analyzed to determine
whether those results supported the use of a concrete compressive strength greater than 2,500 psi
in the rating calculations.
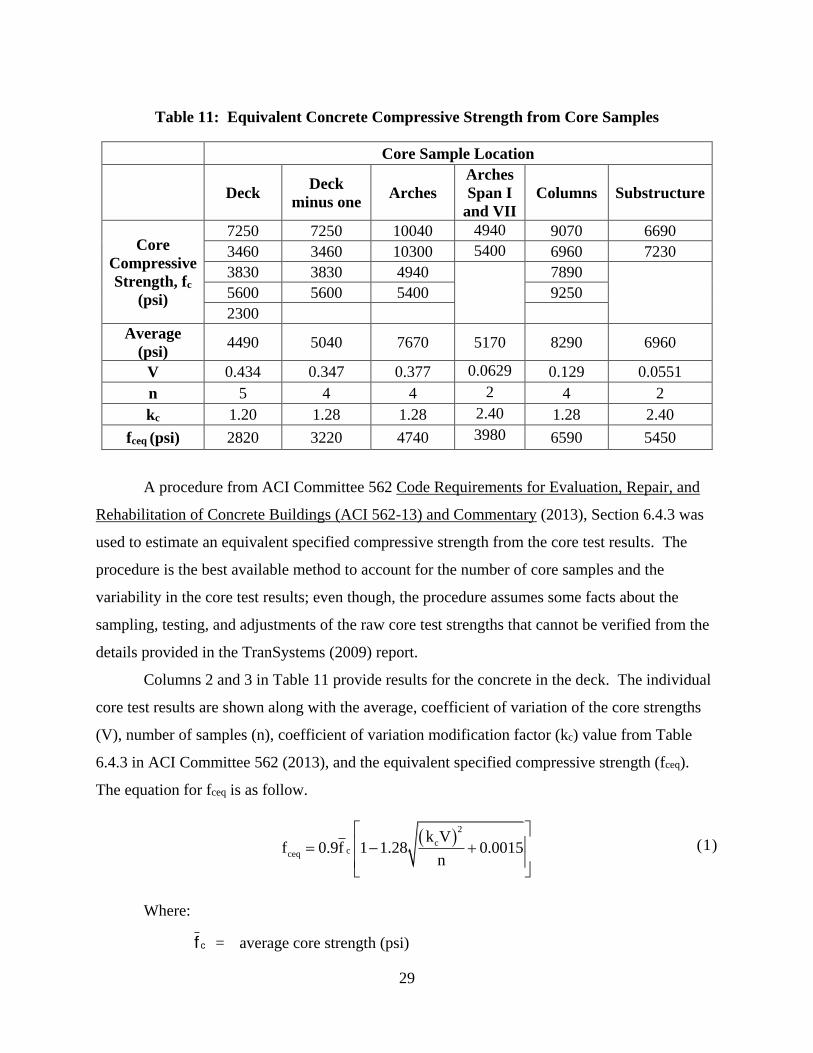
29
2
ccceq
k Vf 0.9f 1 1.28 0.0015
n
Table 11: Equivalent Concrete Compressive Strength from Core Samples
Core Sample Location
Deck Deck
minus one Arches
Arches
Span I
and VII
Columns Substructure
Core
Compressive
Strength, fc
(psi)
7250 7250 10040 4940 9070 6690
3460 3460 10300 5400 6960 7230
3830 3830 4940 7890
5600 5600 5400 9250
2300
Average
(psi) 4490 5040 7670 5170 8290 6960
V 0.434 0.347 0.377 0.0629 0.129 0.0551
n 5 4 4 2 4 2
kc 1.20 1.28 1.28 2.40 1.28 2.40
fceq (psi) 2820 3220 4740 3980 6590 5450
A procedure from ACI Committee 562 Code Requirements for Evaluation, Repair, and
Rehabilitation of Concrete Buildings (ACI 562-13) and Commentary (2013), Section 6.4.3 was
used to estimate an equivalent specified compressive strength from the core test results. The
procedure is the best available method to account for the number of core samples and the
variability in the core test results; even though, the procedure assumes some facts about the
sampling, testing, and adjustments of the raw core test strengths that cannot be verified from the
details provided in the TranSystems (2009) report.
Columns 2 and 3 in Table 11 provide results for the concrete in the deck. The individual
core test results are shown along with the average, coefficient of variation of the core strengths
(V), number of samples (n), coefficient of variation modification factor (kc) value from Table
6.4.3 in ACI Committee 562 (2013), and the equivalent specified compressive strength (fceq).
The equation for fceq is as follow.
(1)
Where:
cf = average core strength (psi)

30
kc = coefficient of variation modification factor
V = coefficient of variation of the core strengths
n = number of cores taken
Locations for five core samples taken from the deck were selected by TranSystems with
the assistance of ground penetrating radar test results. One of the core samples was taken from
Span I in an area of potential deterioration, and the compressive strength determined for that core
was 2,300 psi. The remaining four core samples were taken from areas “which are
representative of the remainder of the bridge deck” (TranSystems 2009, page 19 of 24). The
equivalent specified concrete compressive strength determined from the four deck core samples
of greatest strength is 3,220 psi. Equivalent specified concrete compressive strengths determined
from cores taken from other structural elements are also listed in Table 11, and all exceed the
value of 2,500 psi recommended by AASHTO (2011).
Columns 4 and 5 of Table 11 list core strength results for samples taken from the arches
as reported by TranSystems (2009). Column 4 lists all four of the available core test results.
Each of the core samples was taken from a different arch span as follows: 10,040 from Span II,
10,300 psi from Span V, 4,940 psi from Span VII, and 5,400 psi from Span I. The specific
location of these core samples is not reported by TranSystems (2009), and the concrete that was
sampled cannot be reliably linked to any particular value of specified concrete strength shown in
Figure 21. So, the equivalent specified compressive strength of 4,740 psi in Column 4 of Table
11 provides an indication of the overall quality of the concrete in the arches, but it is not an
accurate prediction of the concrete strength at any specific cross section in the arches.
Section 5.4.5 of this report shows that the shear strength of the arch rib in Span I and
Span 7 potentially controls the bridge rating. So, the core strengths from those spans are
analyzed separately in Column 5 of Table 7. The result is an equivalent specified compressive
strength of 3,980 psi. Because the actual specified concrete strengths are known to vary as
shown by Figure 21, it is impossible to state with a high level of confidence that the equivalent
specified compressive strength of 3,980 psi is representative of the critical cross section in Span I
and Span VII. However, all the core test results in Columns 4 and 5 of Table 7 support the use
of a concrete strength greater than 2,500 psi in the rating calculation.
Load ratings reported here were determined using a concrete compressive strength of
3,000 psi unless otherwise noted. This choice is supported by the analysis of the core test results

31
presented in Table 11. The use of higher compressive strengths can be justified for the current
condition of the structure. Since the deterioration of the structure due to ASR is expected in the
future, having ratings at a lower bound on the concrete strength will be useful. If the ratings are
determined at the upper bound of the concrete strength, an additional evaluation of the structure
will be required after only a small decrease in concrete strength occurs due to ASR.
For structural analysis models built in SAP2000, the material properties for concrete and
steel are listed in Table 12for all cases except those noted.
Table 12: Material Properties for SAP2000
Concrete Reinforcing Steel
Unit Weight
(pcf) f’c (psi) c57000 f '
(psi)
Unit Weight
(pcf) fy (ksi) Es (ksi)
150 3,000 3,122,000 490 33 29,000
3.3 LOAD FACTOR RATING METHOD
The purpose of the project was to provide a load rating of the Bibb Graves Bridge. The load
rating procedure required by AASHTO (2011) Section 6B.4.3 is the Load Factor Rating (LFR)
method. This method provides two ratings; an inventory and an operating rating. Table 13 lists
the load factors associated with each.

32
Table 13: Load Factors for LFR Method
Operating Inventory
A1 1.3 1.3
A2 1.3 2.17
The inventory rating corresponds to design loading cases and always result in a lower
rating factor and a higher factor of safety. The operating rating is used by ALDOT for load
postings. A1 is the factor for dead loads, and A2 is the factor for live loads. According to
AASHTO (2011) Section 6B.4.1, the rating factor is defined as
(2)
Where:
C = the capacity of the member
D = the dead load effect on the member
L = the live load effect on the member
I = the impact fraction to be used with the live load effect
3.4 MEMBER CAPACITY
In order to obtain a rating factor, the capacities of each of the components were assessed. The
general expression of the rating factor is given in Eq. (2). For the transverse floor beams and
transverse deep beams, flexural and shear capacities were determined. For the hangers, tension
capacity was determined. For the columns and arch ribs, which are beam-column members,
capacity was determined for the axial load and bending moment combination. In addition, shear
capacity was determined for the arch ribs.
1
2
C A DRF
A L(1 I)

33
3.4.1 Flexure
Flexural capacity was determined for the transverse floor beams and transverse deep beams as
described below.
3.4.1.1 Transverse Floor Beams
The singly reinforced cross section utilized for positive bending moment for the transverse floor
beams for Spans IV and V, taken at midspan, is shown in Figure 22. The reinforcing bars are 1-
1/8-in.-square bars in the top layer and 1-1/4-in.-square bars in the bottom layer. For Spans VI
and VII, the reinforcement is the same, but the height of the flange is 7-1/2 in. and the height of
the web is 2 ft 8-1/2 in as listed in Table 8. The positive bending moment capacity was used to
rate the transverse floor beams at the hanger and column locations. Table 14 lists the positive
bending moment capacity for all spans.
Figure 22: Positive Bending Moment Cross Section (Spans IV and V)
The doubly reinforced cross section utilized for negative bending moment for the
transverse floor beams for Spans IV and V, taken at the interior face of the interior column, is
shown in Figure 23. For negative bending moment, there is a single layer of tension steel
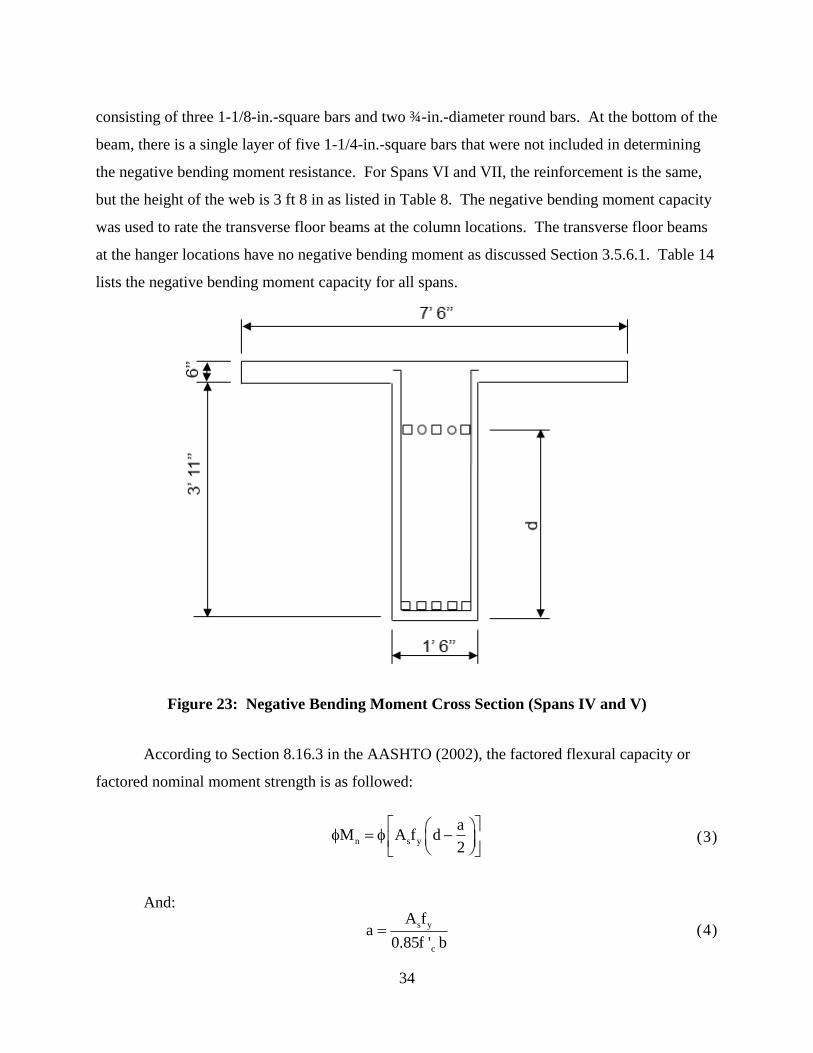
34
consisting of three 1-1/8-in.-square bars and two ¾-in.-diameter round bars. At the bottom of the
beam, there is a single layer of five 1-1/4-in.-square bars that were not included in determining
the negative bending moment resistance. For Spans VI and VII, the reinforcement is the same,
but the height of the web is 3 ft 8 in as listed in Table 8. The negative bending moment capacity
was used to rate the transverse floor beams at the column locations. The transverse floor beams
at the hanger locations have no negative bending moment as discussed Section 3.5.6.1. Table 14
lists the negative bending moment capacity for all spans.
Figure 23: Negative Bending Moment Cross Section (Spans IV and V)
According to Section 8.16.3 in the AASHTO (2002), the factored flexural capacity or
factored nominal moment strength is as followed:
(3)
And:
(4) s y
c
A fa
0.85f ' b
n s y
aM A f d
2
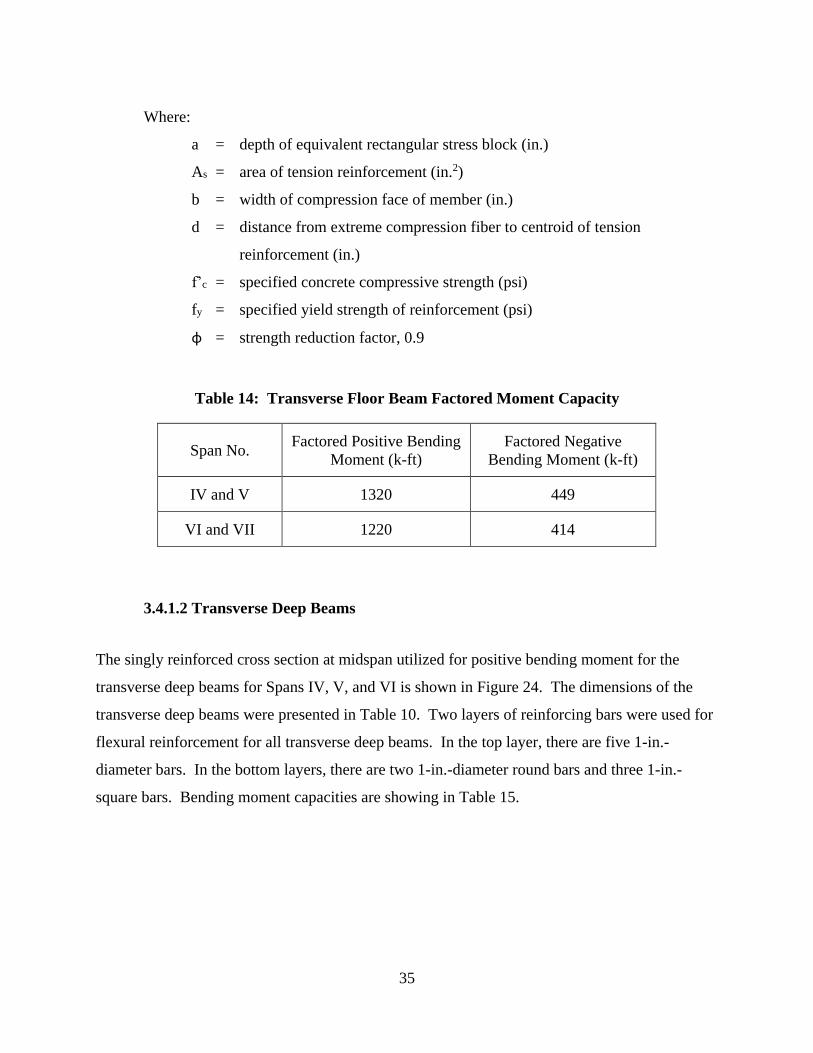
35
Where:
a = depth of equivalent rectangular stress block (in.)
As = area of tension reinforcement (in.2)
b = width of compression face of member (in.)
d = distance from extreme compression fiber to centroid of tension
reinforcement (in.)
f’c = specified concrete compressive strength (psi)
fy = specified yield strength of reinforcement (psi)
φ = strength reduction factor, 0.9
Table 14: Transverse Floor Beam Factored Moment Capacity
Span No. Factored Positive Bending
Moment (k-ft)
Factored Negative
Bending Moment (k-ft)
IV and V 1320 449
VI and VII 1220 414
3.4.1.2 Transverse Deep Beams
The singly reinforced cross section at midspan utilized for positive bending moment for the
transverse deep beams for Spans IV, V, and VI is shown in Figure 24. The dimensions of the
transverse deep beams were presented in Table 10. Two layers of reinforcing bars were used for
flexural reinforcement for all transverse deep beams. In the top layer, there are five 1-in.-
diameter bars. In the bottom layers, there are two 1-in.-diameter round bars and three 1-in.-
square bars. Bending moment capacities are showing in Table 15.

36
Figure 24: Transverse Deep Beam Cross Section
Table 15: Transverse Deep Beam Factored Bending Moment Capacities
3.4.2 Shear
Shear capacity was determined for the transverse deep beams, transverse floor beams, and arch
ribs.
3.4.2.1 Transverse Deep Beams
All transverse deep beams have stirrups that are ¾ inch diameter round bars spaced at 12 in.
center-to-center. Thus, the shear capacity was constant along the length of the transverse deep
beam. All transverse deep beam factored shear capacities are listed in Table 16.
Span No. Factored Bending Moment
Capacity (k-ft)
IV 1430
V 1270
VI 1130

37
Section 8.16.6 of AASHTO (2002) defines the factored nominal shear strength, or shear
capacity, as
(5)
Where the nominal shear strength provided by concrete and steel are defined as
(6)
(7)
Where:
Av = area of shear reinforcement within a distance s (in.2)
bw = web width (in.)
d = distance from extreme compression fiber to centroid of tension
reinforcement (in.)
f’c = specified concrete compressive strength (psi)
fy = specified yield strength of reinforcement (psi)
s = spacing of shear reinforcement (in.)
φ = strength reduction factor, 0.85
According to Section 8.19.3 of AASHTO (2002), the shear strength provided from the
steel reinforcement, Vs, was included into Eq. (5) only if the spacing of the shear reinforcement
did not exceed d/2 or 24 inches.
Table 16: Transverse Deep Beam Factored Shear Capacity
Span No. Factored Shear Capacity (k)
IV 266
V 237
VI 213
n v c sV V V
c c wV 2 f ' b d
v y
s
A f dV
s

38
3.4.2.2 Transverse Floor Beams
All transverse floor beams have stirrups that are ¾-inch-diameter round bars. The typical
sections from the beam drawings provided by AHD (1929) shows that Spans IV and V along
with Spans VI and VII have the same stirrup spacing configuration. However, the spacings
among the two groups, Spans IV and V and Spans VI and VII, are different.
The factored nominal shear strength was calculated using Eq. (5). A plot of the factored
shear capacities for Spans IV and V is shown in Figure 25. The capacities were calculated for all
stirrup spacings and cross section depths throughout half of the beam. The beam is symmetrical
about midspan. The shear capacity along the beam was discretized into three distinct zones for
rating: Zone 1, Zone 2, and Zone 3. Each plateau of shear capacity corresponds to a zone.
Qualitatively, these zones can be seen in Figure 25.
Figure 25: Shear Capacities for Spans IV and V
As shown by the line with triangular markers in Figure 25, the shear capacity increases
slightly at a distance around 145 in. from midspan due to an increase in depth to the tension
reinforcement. The increase in depth results from the top layer of the bottom reinforcement
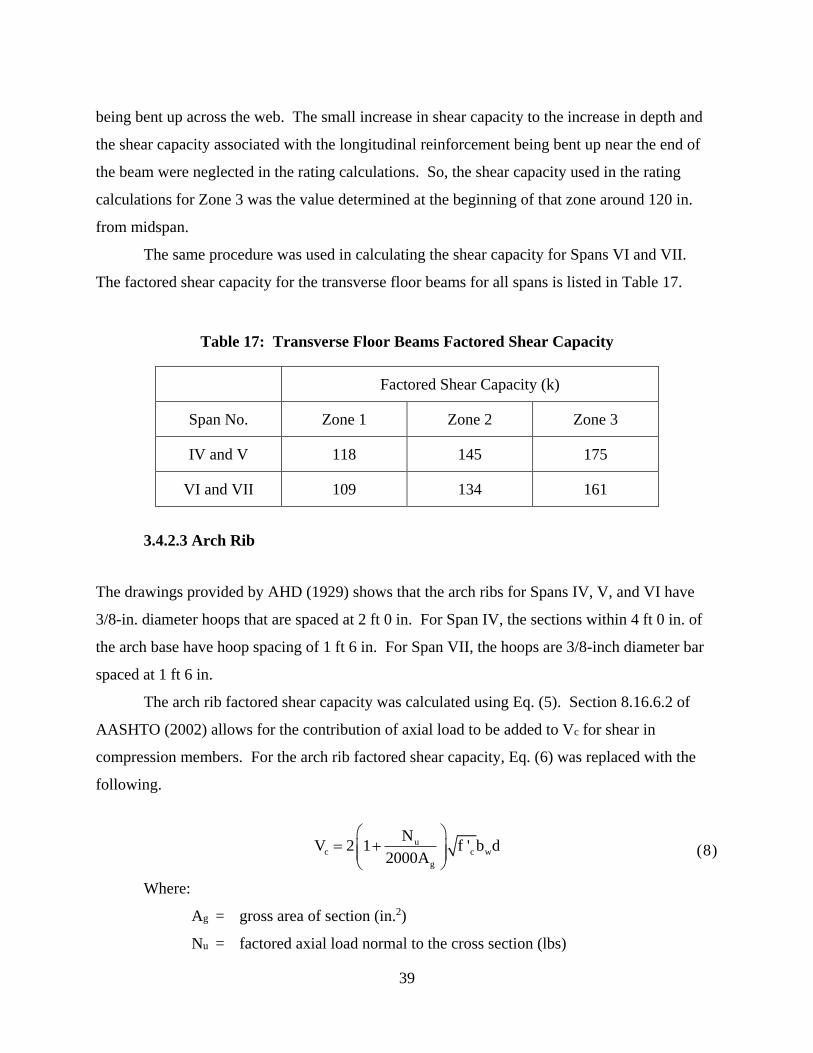
39
being bent up across the web. The small increase in shear capacity to the increase in depth and
the shear capacity associated with the longitudinal reinforcement being bent up near the end of
the beam were neglected in the rating calculations. So, the shear capacity used in the rating
calculations for Zone 3 was the value determined at the beginning of that zone around 120 in.
from midspan.
The same procedure was used in calculating the shear capacity for Spans VI and VII.
The factored shear capacity for the transverse floor beams for all spans is listed in Table 17.
Table 17: Transverse Floor Beams Factored Shear Capacity
Factored Shear Capacity (k)
Span No. Zone 1 Zone 2 Zone 3
IV and V 118 145 175
VI and VII 109 134 161
3.4.2.3 Arch Rib
The drawings provided by AHD (1929) shows that the arch ribs for Spans IV, V, and VI have
3/8-in. diameter hoops that are spaced at 2 ft 0 in. For Span IV, the sections within 4 ft 0 in. of
the arch base have hoop spacing of 1 ft 6 in. For Span VII, the hoops are 3/8-inch diameter bar
spaced at 1 ft 6 in.
The arch rib factored shear capacity was calculated using Eq. (5). Section 8.16.6.2 of
AASHTO (2002) allows for the contribution of axial load to be added to Vc for shear in
compression members. For the arch rib factored shear capacity, Eq. (6) was replaced with the
following.
(8)
Where:
Ag = gross area of section (in.2)
Nu = factored axial load normal to the cross section (lbs)
uc c w
g
NV 2 1 f ' b d
2000A
40
For Spans IV, V, and VI, the arch rib shear ratings did not control, and the axial effects
were only considered from dead loads. However, for arch sections near midspan of Span VII,
the arch rib shear rating did control. To capture the full factored shear capacity for this section
the axial effects were considered from dead and live loads. For all spans, the axial effect from
dead loads were larger than the axial effect from live loads.
3.4.3 Tension
All hangers are reinforced by 1-in. square reinforcing bars as shown in AHD (1929). Each
hanger per pair has four reinforcing bars. The hangers were rated as axial tension members. The
axial tension capacity was found by
(9)
Where φ equals 0.9.
The hangers were rated as axial tension members because the limit state for these hangers
is when the concrete has cracked and the steel reinforcing bars have yielded. As a result, the
axial tension capacity of the hangers was found for each, individual hanger. For Spans IV, V,
and VI, the tension capacity for each hanger is 119 kips.
3.4.4 Axial Load and Bending Moment
The capacity for the beam-column members such as arch ribs and columns were determined
from the axial load-moment interaction diagram, referred to here as load-moment interaction
diagram.
All Column 2s are 14 in. by 15 in. with four 1-in.-square reinforcing bars positioned in
the corners as shown in Figure 13. All Column 3s are as labeled in Figure 15. For all spans, the
arch ribs have eight reinforcing bars in the top layer and eight reinforcing bars in the bottom
layers. The bars are both round and square reinforcing bars ranging from 3/4-in.-diameter round
bars in Span VII to 1-1/4-in-square bars in Span IV. For all spans, Section 2.2 of this report
provides the geometry and reinforcements for the arch rib sections. In addition, the drawings
from AHD (1929) have more details about the bar shapes, sizes, and layout configuration.
n s yP A f
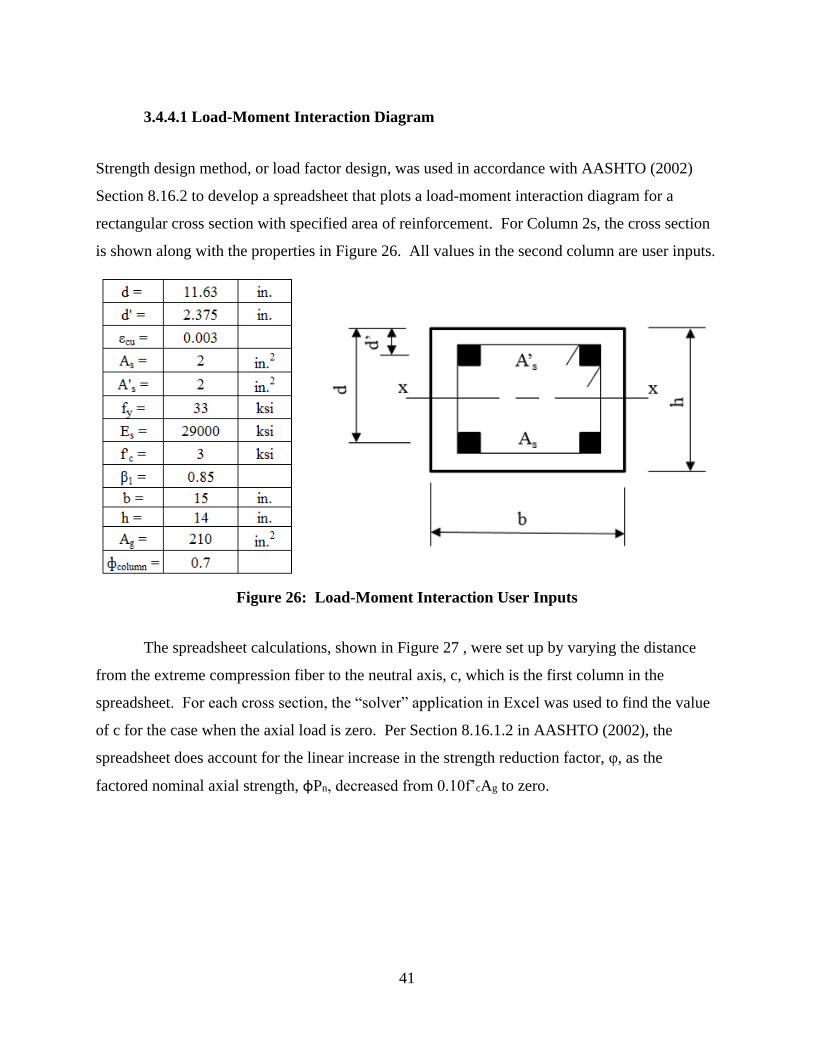
41
3.4.4.1 Load-Moment Interaction Diagram
Strength design method, or load factor design, was used in accordance with AASHTO (2002)
Section 8.16.2 to develop a spreadsheet that plots a load-moment interaction diagram for a
rectangular cross section with specified area of reinforcement. For Column 2s, the cross section
is shown along with the properties in Figure 26. All values in the second column are user inputs.
Figure 26: Load-Moment Interaction User Inputs
The spreadsheet calculations, shown in Figure 27 , were set up by varying the distance
from the extreme compression fiber to the neutral axis, c, which is the first column in the
spreadsheet. For each cross section, the “solver” application in Excel was used to find the value
of c for the case when the axial load is zero. Per Section 8.16.1.2 in AASHTO (2002), the
spreadsheet does account for the linear increase in the strength reduction factor, φ, as the
factored nominal axial strength, φPn, decreased from 0.10f’cAg to zero.
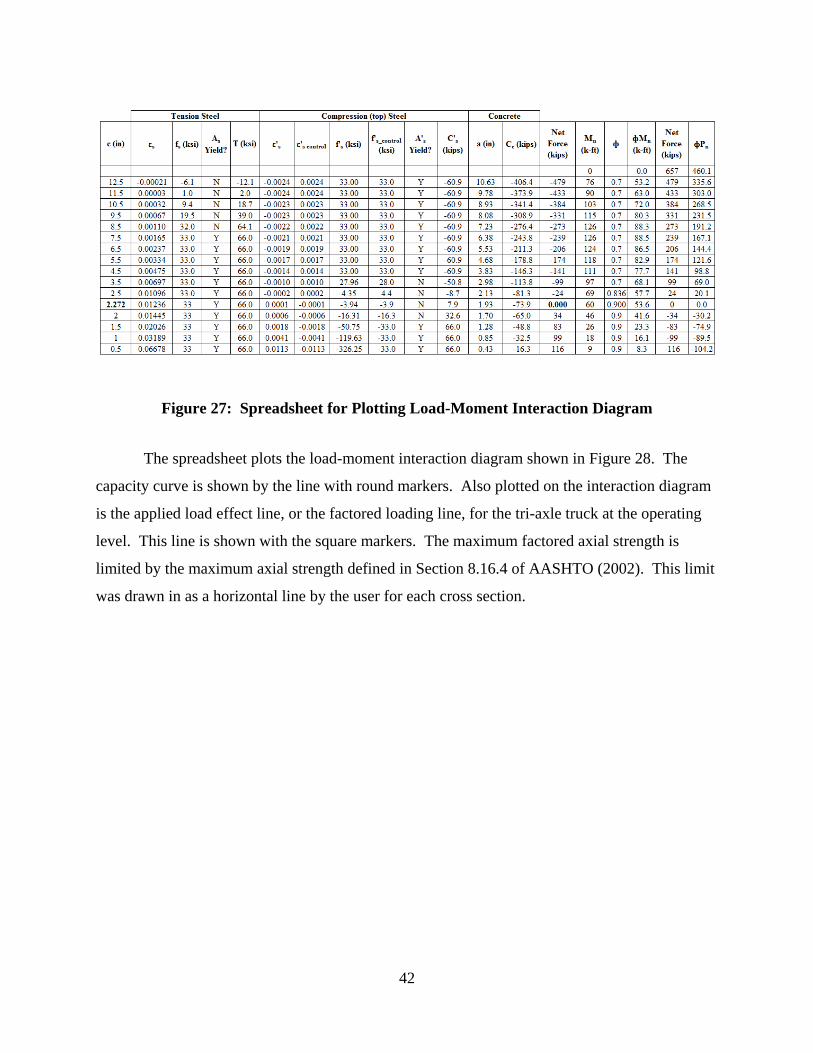
42
Figure 27: Spreadsheet for Plotting Load-Moment Interaction Diagram
The spreadsheet plots the load-moment interaction diagram shown in Figure 28. The
capacity curve is shown by the line with round markers. Also plotted on the interaction diagram
is the applied load effect line, or the factored loading line, for the tri-axle truck at the operating
level. This line is shown with the square markers. The maximum factored axial strength is
limited by the maximum axial strength defined in Section 8.16.4 of AASHTO (2002). This limit
was drawn in as a horizontal line by the user for each cross section.

43
Figure 28: Load-Moment Interaction Diagram for Interior Column 2
3.4.4.2 Finding the Rating Factor
A rating factor can be determined from the load-moment interaction diagram shown in Figure 28
for a given combination of applied axial load and bending moment. To determine the rating
factor, an applied load effect line was plotted on the interaction diagram. The applied load effect
line comes from the bending moment and axial load equations shown below:
Where:
RF = rating factor
-150
-100
-50
0
50
100
150
200
250
300
350
400
450
500
0 10 20 30 40 50 60 70 80 90
фP
n (
k)
фMn (k-ft)
Capacity Curve
Operating Factored Loading
(11)
(10) u 2 LL I 1 DLM RF A M A M
u 2 LL I 1 DLP RF A P A P
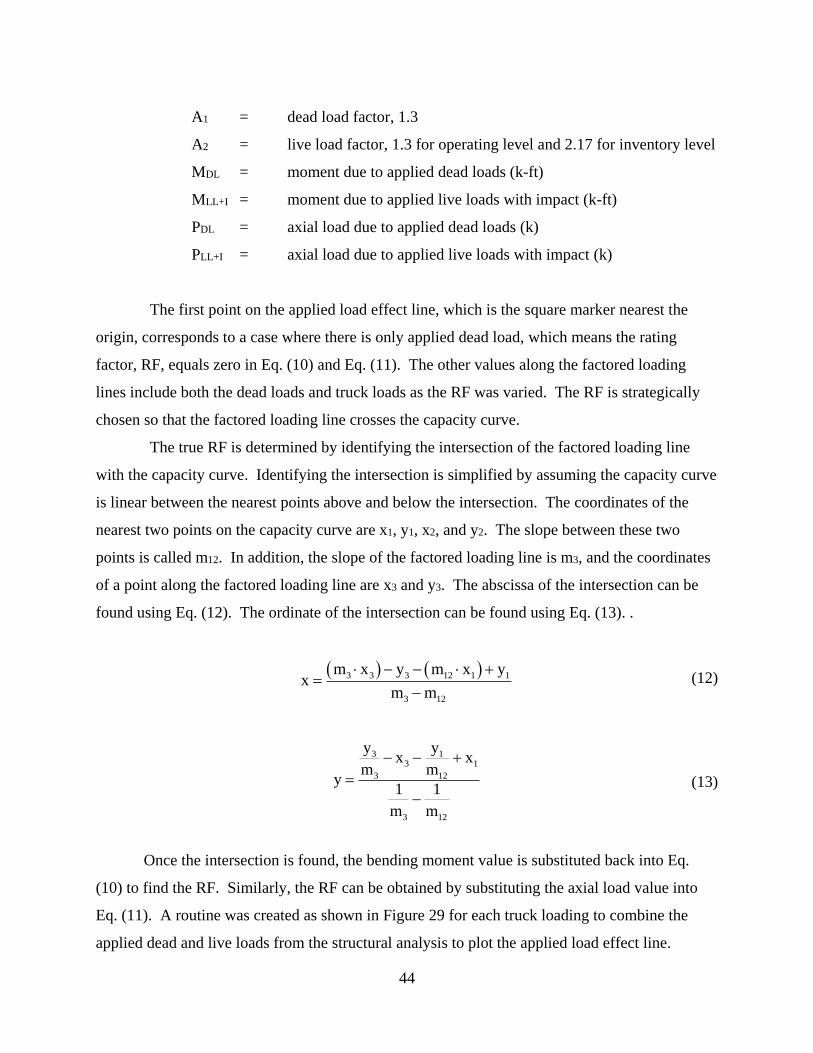
44
A1 = dead load factor, 1.3
A2 = live load factor, 1.3 for operating level and 2.17 for inventory level
MDL = moment due to applied dead loads (k-ft)
MLL+I = moment due to applied live loads with impact (k-ft)
PDL = axial load due to applied dead loads (k)
PLL+I = axial load due to applied live loads with impact (k)
The first point on the applied load effect line, which is the square marker nearest the
origin, corresponds to a case where there is only applied dead load, which means the rating
factor, RF, equals zero in Eq. (10) and Eq. (11). The other values along the factored loading
lines include both the dead loads and truck loads as the RF was varied. The RF is strategically
chosen so that the factored loading line crosses the capacity curve.
The true RF is determined by identifying the intersection of the factored loading line
with the capacity curve. Identifying the intersection is simplified by assuming the capacity curve
is linear between the nearest points above and below the intersection. The coordinates of the
nearest two points on the capacity curve are x1, y1, x2, and y2. The slope between these two
points is called m12. In addition, the slope of the factored loading line is m3, and the coordinates
of a point along the factored loading line are x3 and y3. The abscissa of the intersection can be
found using Eq. (12). The ordinate of the intersection can be found using Eq. (13). .
Once the intersection is found, the bending moment value is substituted back into Eq.
(10) to find the RF. Similarly, the RF can be obtained by substituting the axial load value into
Eq. (11). A routine was created as shown in Figure 29 for each truck loading to combine the
applied dead and live loads from the structural analysis to plot the applied load effect line.
(12)
(13)
3 3 3 12 1 1
3 12
m x y m x yx
m m
3 13 1
3 12
3 12
y yx x
m my
1 1
m m

45
Also, another routine was created to find the intersection of two line segments in a plane
shown in Figure 30. Once the intersection was identified, the RF was calculated for the
particular cross section.
Figure 29: Example Routine for Applied Load Effect Line
Figure 30: Routine Finding Intersection of Capacity and Applied Load Effect Lines
Ratings were provided for the interior and exterior column. An example load-moment
interaction diagram with the factored loading line for an interior Column 2 is shown in Figure
28. An example load-moment interaction diagram with the factored loading line for an exterior
Column 2 is shown in Figure 31. The applied loads resulted in different combinations of axial
load and bending moment for each column. Initially, it was ambiguous as to which load case
would control the rating. Therefore, a rating was provided for the load case combination with
the highest axial load effect and the load case combination with the highest bending moment.
The lower RF controlled the rating for that particular column.
The position of the factored loading line describes the state of loading in the member. In
Figure 28, the factored loading line lies above the horizontal axis, this column is in compression

46
for the applied loadings. In Figure 31, the factored loading line lies above and below the
horizontal axis. This column is in compression under applied dead loads and in tension under
applied live loads. Due to this phenomenon, the exterior columns resulted in lower RFs than the
interior columns.
Figure 31: Axial Load-Interaction Diagram for Exterior Column 2
3.4.4.3 Load-Moment Interaction Diagram for Column 3
A spreadsheet routine was generated to plot the load-moment interaction diagram for the interior
Column 3 with the 1-ft 2-in by 1-ft 6-in cross section as shown in Figure 15. For the exterior
Column 3, which has the geometrically varied T-shaped cross section as illustrated in Figure 14,
a lower bound capacity was used in the rating. The web width of the exterior T-shaped column
-150
-100
-50
0
50
100
150
200
250
300
350
400
450
500
0 10 20 30 40 50 60 70 80 90
фP
n (
k)
фMn (k-ft)
Capacity Curve
Operating Factored Loading

47
is the same as the width of the interior column at 1-ft 6-in. The capacity of the exterior Column
3 was determined by neglecting the flanges and using the load-moment interaction diagram for
the same cross section as the interior Column 3.
3.5 TRANSVERSE FRAMES AND MEMBERS MODELS
Transverse frame models were built in SAP2000 and analyzed to obtain ratings for the transverse
beams, columns, and hangers. Transverse frame models considered are: Beam and Column 2,
Beam and Column 3, Beam and Hanger 1, and Transverse Deep Beam models. The loads placed
on these models included dead loads from the bridge components and live loads from the truck
loadings. The bridge components were discretized into various parts for convenience in the
structural analysis. Appurtenances’ weights such as side railings and pillars were accounted for.
3.5.1 Dead Loads
Dead loads for each transverse beam were resolved into uniformly distributed loads and
concentrated loads. They were calculated based on a tributary width, equal to the spacing of the
transverse beams. Dead loads were discretized into various parts for convenience. As shown in
Figure 9, these parts are: roadway or slab, transverse beam, curb, and bracket. The dead loads
for each part of the transverse beam were applied in the structural analysis models as uniformly
distributed loads over their respective lengths.
The bracket section was simplified into a trapezoidal section. In Figure 32, the image on
the left is the bracket section as shown in the bridge drawings. The image on the right, is the
simplified bracket section used for analyses. Dimensional properties for all brackets are listed in
Table 18. Dimension t1 was scaled from the drawing. Dimensions t2 and Lbracket were obtained
from the drawings.
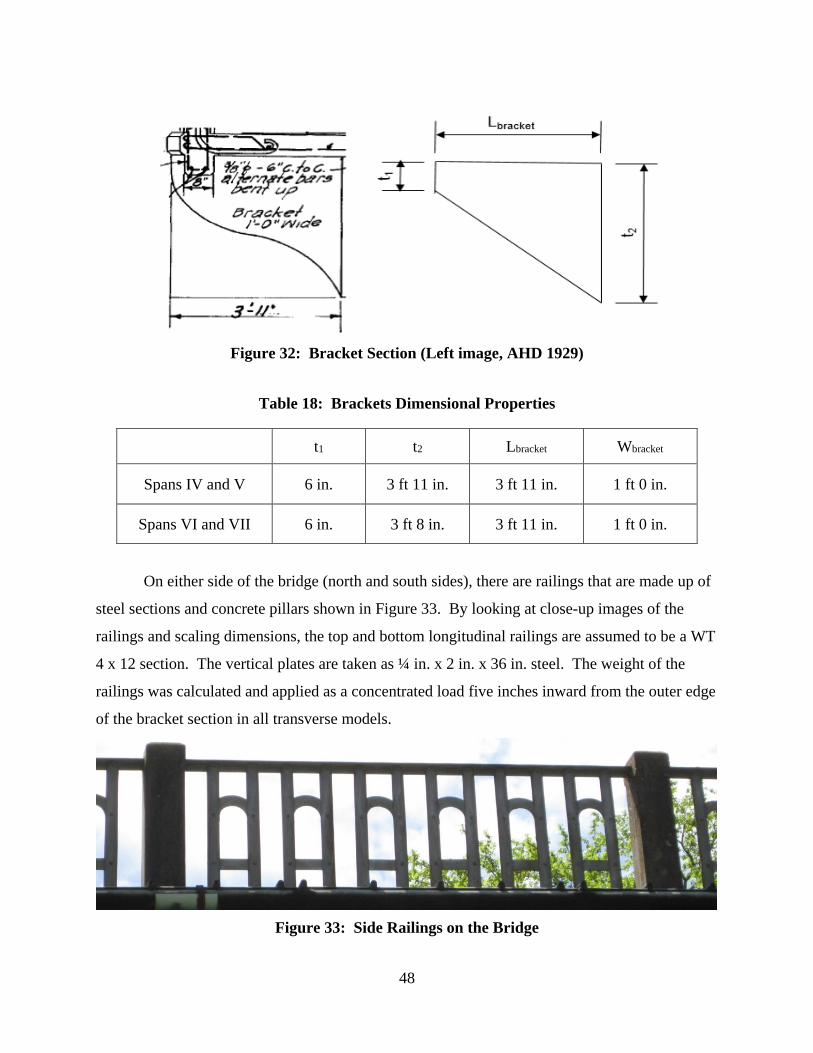
48
Figure 32: Bracket Section (Left image, AHD 1929)
Table 18: Brackets Dimensional Properties
t1 t2 Lbracket Wbracket
Spans IV and V 6 in. 3 ft 11 in. 3 ft 11 in. 1 ft 0 in.
Spans VI and VII 6 in. 3 ft 8 in. 3 ft 11 in. 1 ft 0 in.
On either side of the bridge (north and south sides), there are railings that are made up of
steel sections and concrete pillars shown in Figure 33. By looking at close-up images of the
railings and scaling dimensions, the top and bottom longitudinal railings are assumed to be a WT
4 x 12 section. The vertical plates are taken as ¼ in. x 2 in. x 36 in. steel. The weight of the
railings was calculated and applied as a concentrated load five inches inward from the outer edge
of the bracket section in all transverse models.
Figure 33: Side Railings on the Bridge

49
3.5.2 Live Loads
The live loads are the eight trucks specified by ALDOT and the lane load required by AASHTO
(2002). The magnitude of the axle weights of ALDOT trucks are shown in Figure 34. Simple
graphics of ALDOT trucks are shown in Figure 20. For the lane load shown in Figure 35,
AASHTO (2002) required a uniformly distributed load of 0.640 kip/ft along with concentrated
loads of 18 kips positioned for maximum moment and 26 kips positioned for maximum shear.
Figure 34: Axle Weights and Spacings of Standard ALDOT Trucks
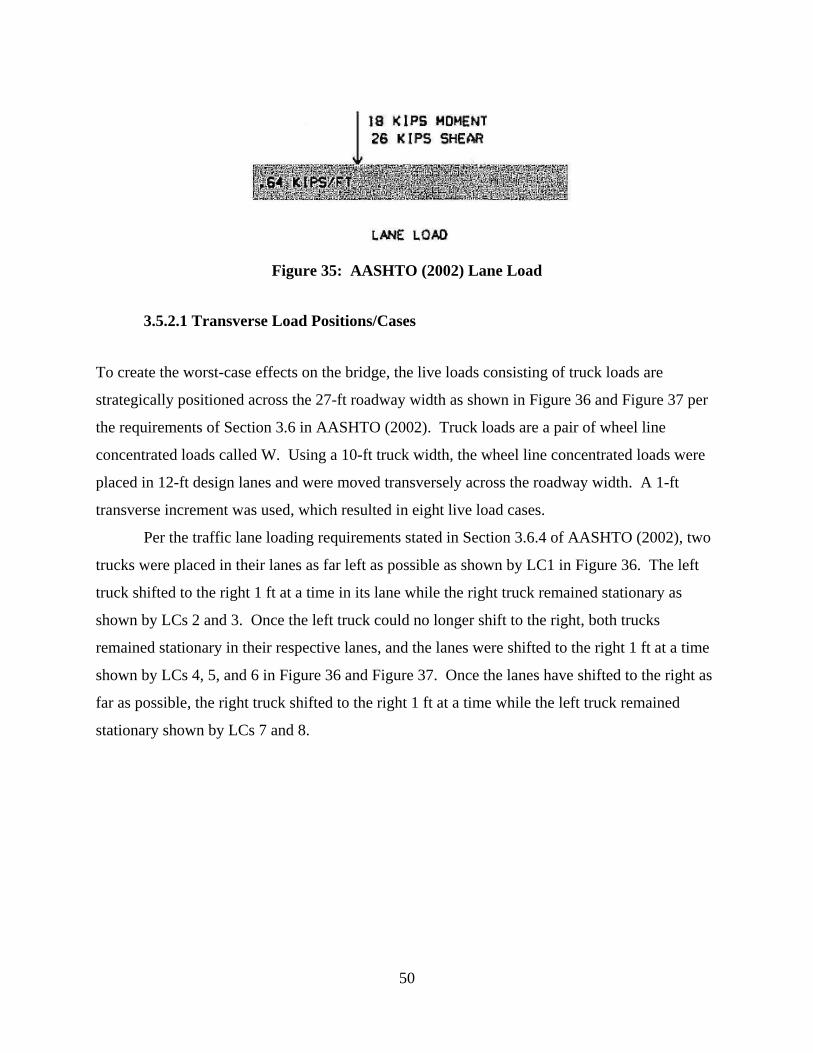
50
Figure 35: AASHTO (2002) Lane Load
3.5.2.1 Transverse Load Positions/Cases
To create the worst-case effects on the bridge, the live loads consisting of truck loads are
strategically positioned across the 27-ft roadway width as shown in Figure 36 and Figure 37 per
the requirements of Section 3.6 in AASHTO (2002). Truck loads are a pair of wheel line
concentrated loads called W. Using a 10-ft truck width, the wheel line concentrated loads were
placed in 12-ft design lanes and were moved transversely across the roadway width. A 1-ft
transverse increment was used, which resulted in eight live load cases.
Per the traffic lane loading requirements stated in Section 3.6.4 of AASHTO (2002), two
trucks were placed in their lanes as far left as possible as shown by LC1 in Figure 36. The left
truck shifted to the right 1 ft at a time in its lane while the right truck remained stationary as
shown by LCs 2 and 3. Once the left truck could no longer shift to the right, both trucks
remained stationary in their respective lanes, and the lanes were shifted to the right 1 ft at a time
shown by LCs 4, 5, and 6 in Figure 36 and Figure 37. Once the lanes have shifted to the right as
far as possible, the right truck shifted to the right 1 ft at a time while the left truck remained
stationary shown by LCs 7 and 8.

51
Figure 36: Live Load Cases 1 - 5

52
Figure 37: Live Load Cases 6 – 8
Of these eight load cases, the first five are unique and generate the worst-case effects on
the left side of the bridge. In Figure 37, LC 6 mirrored LC 3; LC 7 mirrored LC 2; and LC 8
mirrored LC 1. Since the transverse beam is symmetric about midspan, the worst effects on the
left half apply to the right half. The magnitude of these wheel line concentrated loads, W, came
from a longitudinal beam analysis as required by Section 3.23.3.2 of AASHTO (2002).
3.5.2.2 Longitudinal Beam Analysis
For the longitudinal beam analysis, the length of the longitudinal beam was chosen to span
between the expansion joints that encompass the hangers, columns, and transverse deep beam of
interest as shown in Figure 38. For Span V, a longitudinal beam was created from the finger
joint at midspan and extended eastward to the first expansion joint in Span IV.

53
Figure 38: East Longitudinal Beam (AHD 1929)
Using this length of longitudinal beam, a structural analysis model was created as shown
in Figure 39. Locations of transverse beams were represented by simple support reactions. In
Table 3.23.3.1 of AASHTO (2002), for a concrete floor with a spacing of floor beams greater
than 6 ft, the beams between the flooring shall be assumed to act as a simple beam. So, the
bending moments were released at one end of each longitudinal beam span. At midspan of Span
V, there is a finger joint in the bridge deck. Thus, the bending moment was not released at the
simple support at the Hanger 1 shown in Figure 39. Once the longitudinal beam model was
built, each truck was applied to the defined travel path as a moving load with no eccentricity.
Being defined as a moving load, the truck travelled in both directions. A detailed discussion
about moving loads is provided in Section 3.6.2.2.
Figure 39: East Longitudinal Beam Model (SAP 2013)

54
The longitudinal beam model for Span V was extended into the adjacent spans, Spans IV
and VI as shown in Figure 40. The extent of the west longitudinal beam is shown in relation to
the east longitudinal beam. The transverse beam spacings of Spans IV and VI are different.
Since the magnitude of the reactions from the truck loads on the longitudinal beam model is a
function of the transverse beam spacings, another longitudinal beam model was analyzed in the
opposite direction to capture the largest support reaction.
Figure 40: West Longitudinal Beam in Relation to East Longitudinal Beam (AHD 1929)
The west longitudinal beam started at the finger joint at midspan in Span V, the same
start location as the previous model, and extended in the opposite direction, westward. Using
this length of longitudinal beam, another structural analysis model was created as shown in
Figure 41.
Figure 41: West Longitudinal Beam Model (SAP 2013)

55
The reaction envelope for each longitudinal beam model for each truck represented the
worst reaction exerted to the hangers, columns, and transverse deep beam. One-half the
magnitude of the reactions on the longitudinal beam model are the wheel line load, W, on the
transverse beam. On the longitudinal beam for Spans IV, V, and VI, the largest reaction at the
hanger locations is at the Hanger 1 location. For Span VII, the longitudinal beam model is
shown in Figure 42, the largest reaction at the column locations is at the Column 4 location.
Figure 42: Span VII Longitudinal Beam Model (SAP 2013)
The magnitude of these wheel line loads are shown in Appendix A1 for Span IV,
Appendix B1 for Span V, Appendix C1 for Span VI, and Appendix D1 for Span VII.
3.5.3 Beam and Column 2 Modeling
An example Beam and Column 2 model from SAP2000 is shown in Figure 43 for Spans IV, V,
and VI. The columns were modeled as a pair of concrete columns. They were modeled as frame
members. The model was restrained from sidesway to account for the diaphragm action that
exists from the presence of the deck. Sidesway was inhibited by restricting motion in the lateral
direction at the level of the transverse beam and is important since there are unsymmetrical live
loadings. The transverse beam consisted of two sections, roadway and curb, with the bracket
section connecting to the ends as shown in Figure 9.
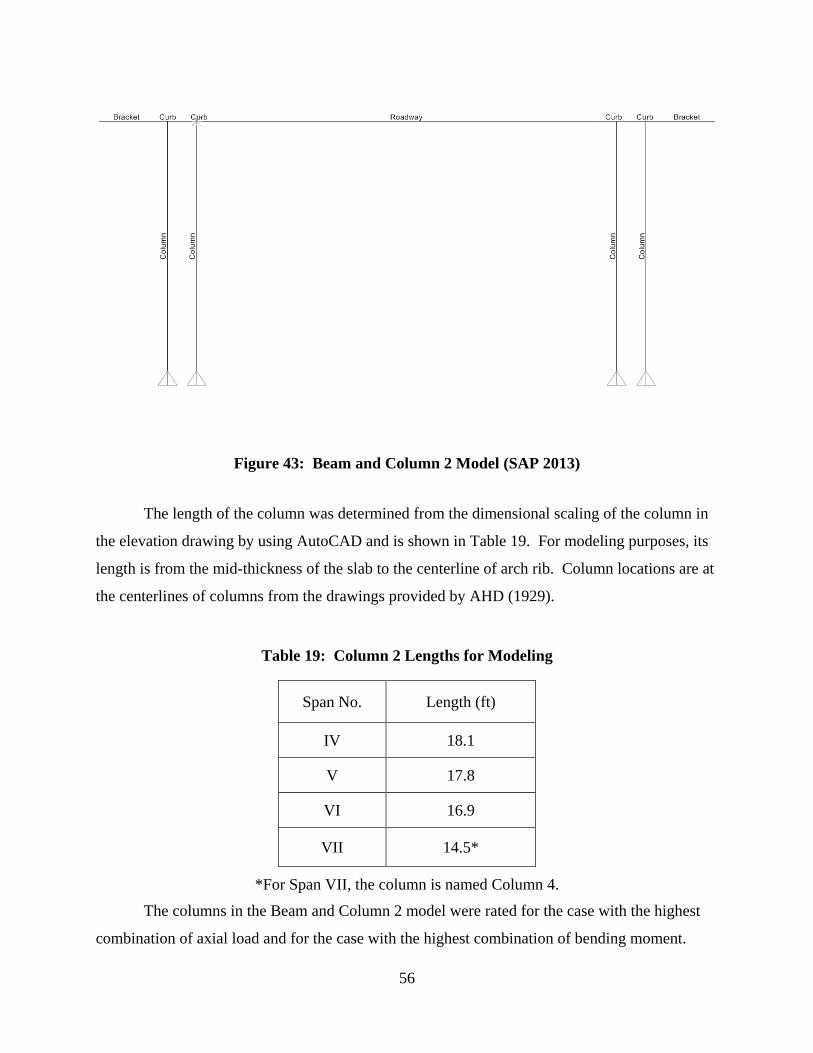
56
Figure 43: Beam and Column 2 Model (SAP 2013)
The length of the column was determined from the dimensional scaling of the column in
the elevation drawing by using AutoCAD and is shown in Table 19. For modeling purposes, its
length is from the mid-thickness of the slab to the centerline of arch rib. Column locations are at
the centerlines of columns from the drawings provided by AHD (1929).
Table 19: Column 2 Lengths for Modeling
Span No. Length (ft)
IV 18.1
V 17.8
VI 16.9
VII 14.5*
*For Span VII, the column is named Column 4.
The columns in the Beam and Column 2 model were rated for the case with the highest
combination of axial load and for the case with the highest combination of bending moment.
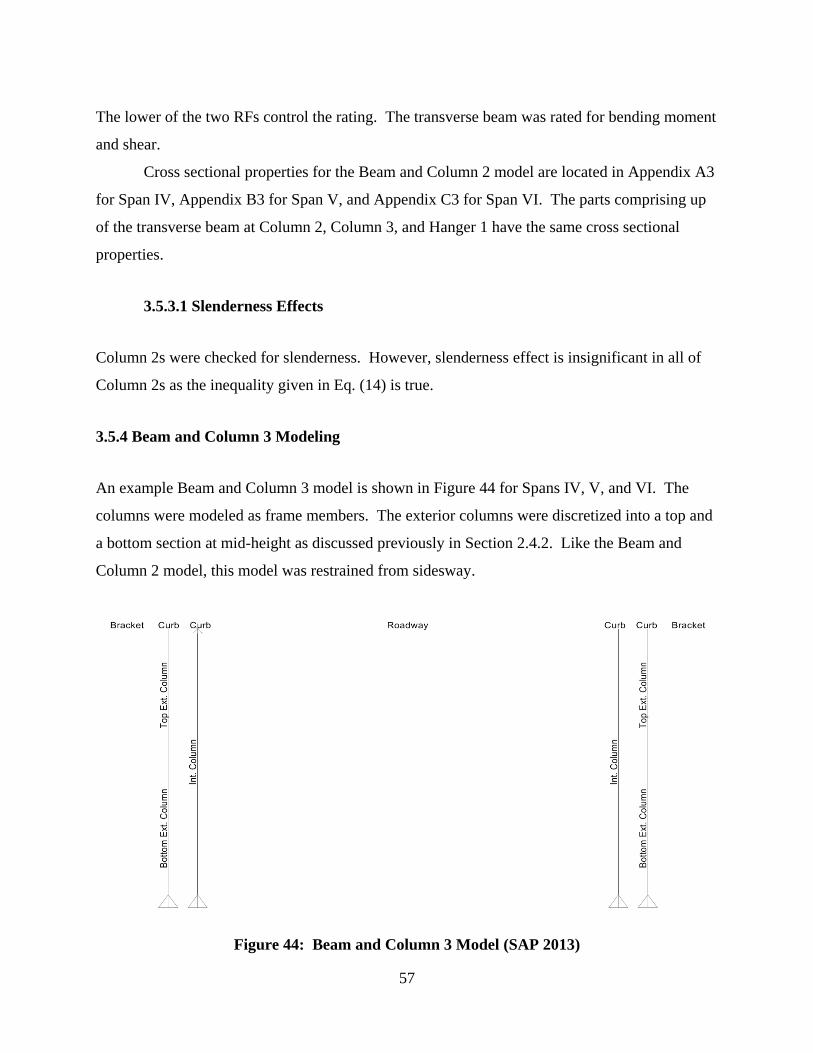
57
The lower of the two RFs control the rating. The transverse beam was rated for bending moment
and shear.
Cross sectional properties for the Beam and Column 2 model are located in Appendix A3
for Span IV, Appendix B3 for Span V, and Appendix C3 for Span VI. The parts comprising up
of the transverse beam at Column 2, Column 3, and Hanger 1 have the same cross sectional
properties.
3.5.3.1 Slenderness Effects
Column 2s were checked for slenderness. However, slenderness effect is insignificant in all of
Column 2s as the inequality given in Eq. (14) is true.
3.5.4 Beam and Column 3 Modeling
An example Beam and Column 3 model is shown in Figure 44 for Spans IV, V, and VI. The
columns were modeled as frame members. The exterior columns were discretized into a top and
a bottom section at mid-height as discussed previously in Section 2.4.2. Like the Beam and
Column 2 model, this model was restrained from sidesway.
Figure 44: Beam and Column 3 Model (SAP 2013)
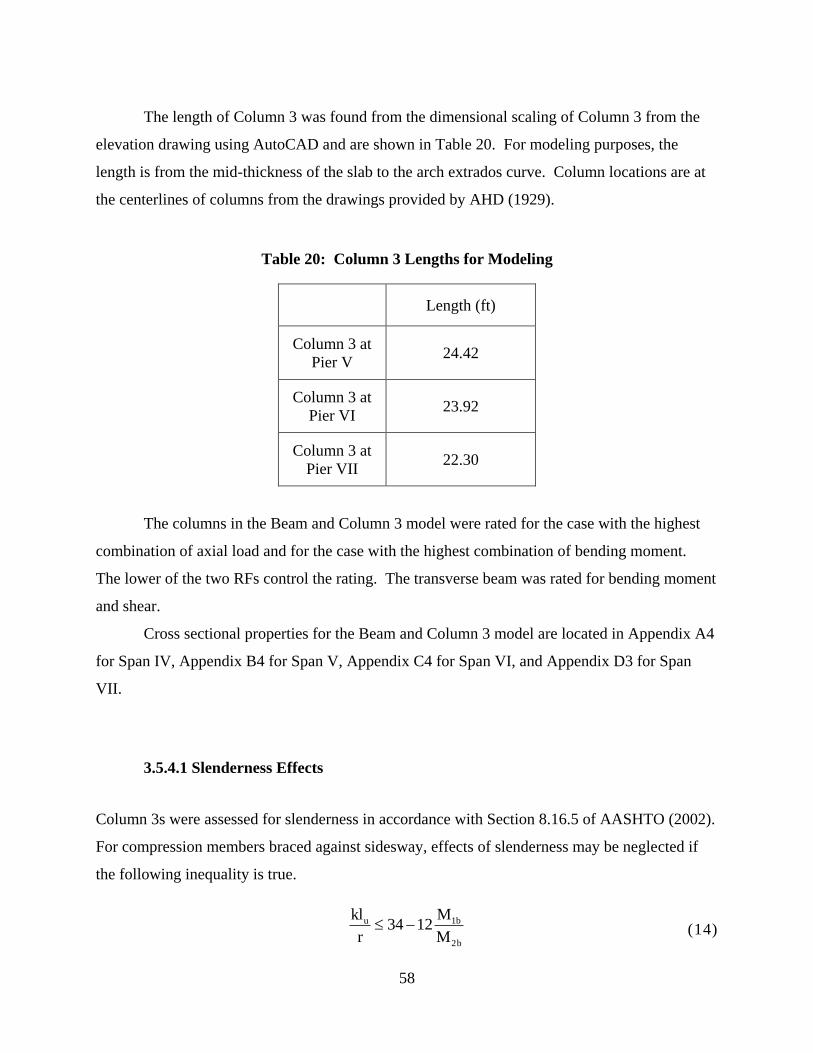
58
The length of Column 3 was found from the dimensional scaling of Column 3 from the
elevation drawing using AutoCAD and are shown in Table 20. For modeling purposes, the
length is from the mid-thickness of the slab to the arch extrados curve. Column locations are at
the centerlines of columns from the drawings provided by AHD (1929).
Table 20: Column 3 Lengths for Modeling
Length (ft)
Column 3 at
Pier V 24.42
Column 3 at
Pier VI 23.92
Column 3 at
Pier VII 22.30
The columns in the Beam and Column 3 model were rated for the case with the highest
combination of axial load and for the case with the highest combination of bending moment.
The lower of the two RFs control the rating. The transverse beam was rated for bending moment
and shear.
Cross sectional properties for the Beam and Column 3 model are located in Appendix A4
for Span IV, Appendix B4 for Span V, Appendix C4 for Span VI, and Appendix D3 for Span
VII.
3.5.4.1 Slenderness Effects
Column 3s were assessed for slenderness in accordance with Section 8.16.5 of AASHTO (2002).
For compression members braced against sidesway, effects of slenderness may be neglected if
the following inequality is true.
(14) u 1b
2b
kl M34 12
r M

59
Where:
k = effective length factor
lu = unsupported length of compression member (ft)
r = radius of gyration; 0.30 times the overall dimension in the direction in
which stability is being considered for rectangular sections (ft)
M1b = value of smaller end moment on compression member from
conventional elastic frame analysis with applied dead load and live
load plus impact (k-ft). It is zero for all columns in this report, since
one end is pinned.
M2b = value of larger end moment on compression member from
conventional elastic frame analysis with applied dead load and live
load plus impact (k-ft)
Column 3 must resist the factored axial load Pu and a magnified factored bending moment, Mc,
given by
(15)
Where:
δb = the braced frame moment magnifier
The braced frame moment magnifier is given by
(16)
Where:
Cm = factor relating the actual moment diagram to an equivalent uniform
moment diagram. It is taken as 1.0 according to Section 8.14.3 (AASHTO
2002)
Pu = factored axial load (kip)
Pc = critical load (kip)
φ = stiffness reduction factor taken as 0.85 according to Section 8.14.3
(AASHTO 2002)
mb
u
c
C1.0
P1
P
c b 2bM M

60
The critical load for Column 3 can be calculated from
(17)
The flexural rigidity, EI, can be calculated from the following equation.
(18)
Where:
βd = absolute value of the ratio of maximum factored dead load moment to
maximum factored total load moment
Ec = modulus of elasticity of concrete (ksi)
Es = modulus of elasticity of steel (ksi)
Ig = moment of inertia of the gross concrete cross section (in4)
Is = moment of inertia of the reinforcement about the centroidal axis of the
gross concrete cross section (in4)
Table 21 lists the klu/r values in determining slenderness effects for all Column 3s.
Slenderness effects were considered for all Column 3s as all of the klu/r values are larger than 46,
which is the maximum that the right hand side of the inequality in Eq. (14) can be.
Table 21: Column 3s klu/r
Column 3 at
Pier V Pier VI Pier VII
Interior Exterior Interior Exterior Interior Exterior
k 1.0 1.0 1.0 1.0 1.0 1.0
lu (ft) 21.0 21.0 19.6 19.6 17.3 17.3
r (ft) 0.35 0.33 0.35 0.33 0.35 0.33
klu/r 60.1 64.3 56.0 60.0 49.4 52.7
c g
s s
d
E IE I
5EI1
2
c 2
u
EIP
kl

61
3.5.4.2 Slenderness Calculations
Column 3 slenderness was calculated based on an iterative procedure. βd and Pu are both a
function of the product of the rating factor and live load factor, A2RF, as shown in the following
equations.
(19)
(20)
Since Pu is a function of A2RF, the moment magnifier, δb, shown in Eq. (16) is also a function of
A2RF. The rating factor is unknown prior to the analysis. A spreadsheet routine was set up like
the one in Figure 45 to find δb corresponding with the final rating factor. A δb was assumed
which yielded a rating factor. Then, the rating factor was substituted into Eq. (19) and (20),
which outputted a δb in the process. The process was repeated until the two δb’s were equal. The
δb’s that yielded the final rating factor are shown in Table 22 for all Column 3s. Since the
product A2RF is the same for the operating and inventory cases, the δb’s value are the same for
these cases.
Figure 45: Spreadsheet for Finding δb
1 DLd
1 DL 2 LL
A M
A M A I M RF
u 2 LL I 1 DLP RF A P A P

62
Table 22: Column 3 Moment Magnifiers
δb
Interior Exterior
Column 3 at
Pier V 2.30 1.11
Column 3 at
Pier VI 2.07 1.11
Column 3 at
Pier VII 1.75 1.08
3.5.5 Span VII Beam and Column Models
For the Beam and Columns 4 and 7 models in Span VII, the cross sectional parts for modeling
them are the same as the parts for the Beam and Column 2 model presented in Section 3.5.3.
For the Beam and Columns 5 and 6 in Span VII, the transverse beams and columns have the
same cross section geometry and reinforcements; thus, only the Beam and Column 5 was
modeled.
The Beam and Column 4 of Span VII was modeled the same in terms of joint restraints
and no frame release as the Beam and Column 2 model presented in Section 3.5.3. However, the
Beam and Columns 5 and 7 of Span VII were modeled slightly different due to an interesting
phenomenon that arises in these two models.
3.5.5.1 Span VII Beam and Columns 5 and 7 Models
Two models were created and utilized for ratings for Beam and Columns 5 and 7 of Span VII.
The first model is called Case A, and the second model is called Case B. Models for Cases A
and B of the Beam and Column 5 model are shown in Figure 46 and Figure 47, respectively.
Case A has a moment release on the exterior columns at the end connecting to the transverse
beam. This is an appropriate way of modeling the exterior columns since they are in tension for
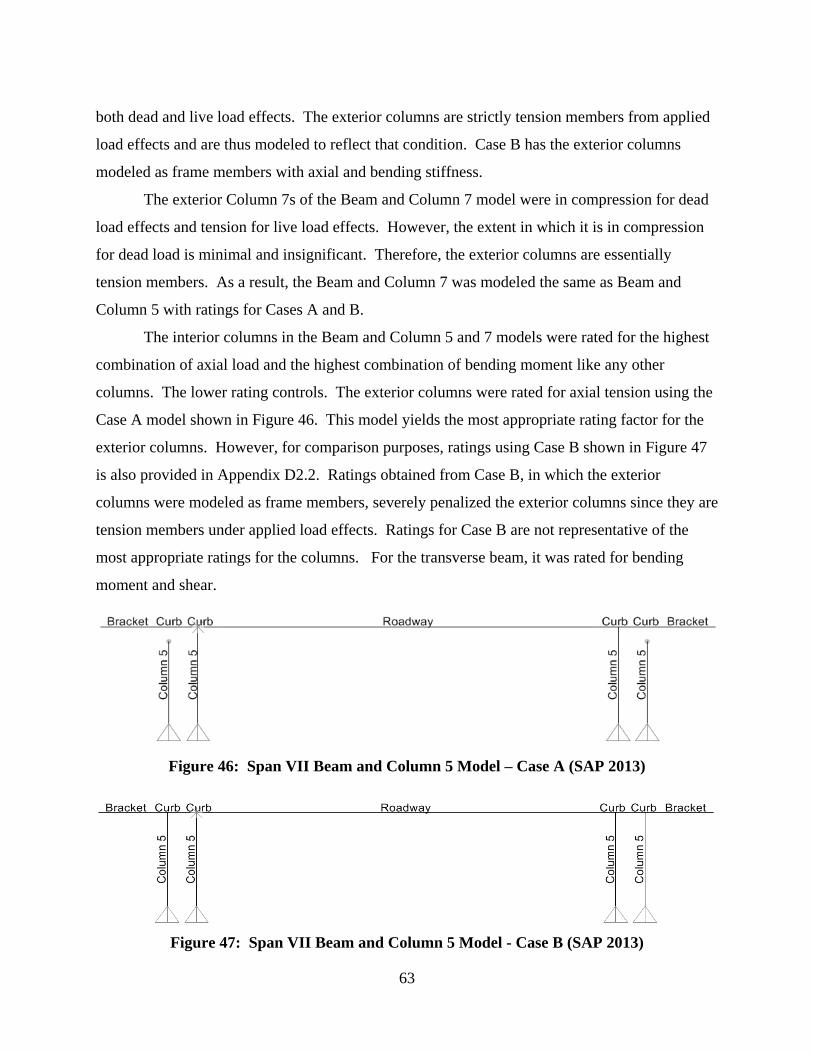
63
both dead and live load effects. The exterior columns are strictly tension members from applied
load effects and are thus modeled to reflect that condition. Case B has the exterior columns
modeled as frame members with axial and bending stiffness.
The exterior Column 7s of the Beam and Column 7 model were in compression for dead
load effects and tension for live load effects. However, the extent in which it is in compression
for dead load is minimal and insignificant. Therefore, the exterior columns are essentially
tension members. As a result, the Beam and Column 7 was modeled the same as Beam and
Column 5 with ratings for Cases A and B.
The interior columns in the Beam and Column 5 and 7 models were rated for the highest
combination of axial load and the highest combination of bending moment like any other
columns. The lower rating controls. The exterior columns were rated for axial tension using the
Case A model shown in Figure 46. This model yields the most appropriate rating factor for the
exterior columns. However, for comparison purposes, ratings using Case B shown in Figure 47
is also provided in Appendix D2.2. Ratings obtained from Case B, in which the exterior
columns were modeled as frame members, severely penalized the exterior columns since they are
tension members under applied load effects. Ratings for Case B are not representative of the
most appropriate ratings for the columns. For the transverse beam, it was rated for bending
moment and shear.
Figure 46: Span VII Beam and Column 5 Model – Case A (SAP 2013)
Figure 47: Span VII Beam and Column 5 Model - Case B (SAP 2013)
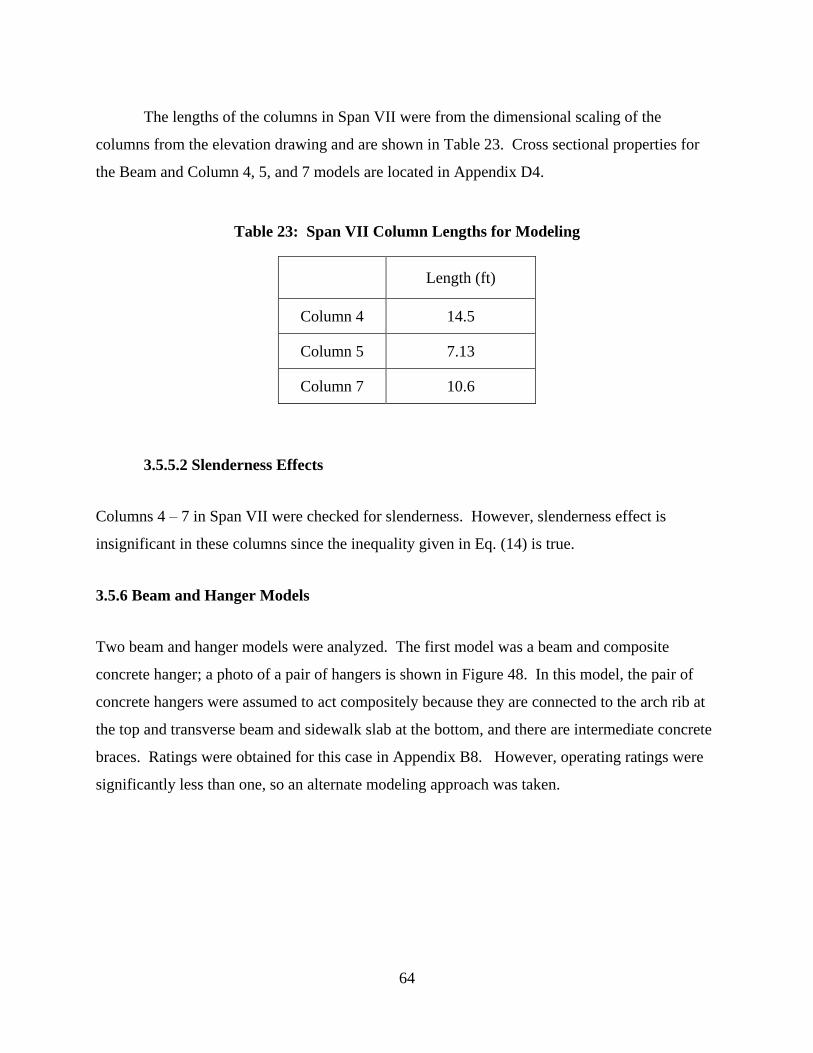
64
The lengths of the columns in Span VII were from the dimensional scaling of the
columns from the elevation drawing and are shown in Table 23. Cross sectional properties for
the Beam and Column 4, 5, and 7 models are located in Appendix D4.
Table 23: Span VII Column Lengths for Modeling
Length (ft)
Column 4 14.5
Column 5 7.13
Column 7 10.6
3.5.5.2 Slenderness Effects
Columns 4 – 7 in Span VII were checked for slenderness. However, slenderness effect is
insignificant in these columns since the inequality given in Eq. (14) is true.
3.5.6 Beam and Hanger Models
Two beam and hanger models were analyzed. The first model was a beam and composite
concrete hanger; a photo of a pair of hangers is shown in Figure 48. In this model, the pair of
concrete hangers were assumed to act compositely because they are connected to the arch rib at
the top and transverse beam and sidewalk slab at the bottom, and there are intermediate concrete
braces. Ratings were obtained for this case in Appendix B8. However, operating ratings were
significantly less than one, so an alternate modeling approach was taken.

65
Figure 48: Composite Concrete Hangers
Rating is based on member capacity. Before the hangers reach their potential capacity,
they will go through a state where the concrete in a compression zone associated with the
bending resistance has crushed and the steel has yielded. Once the concrete crushes, additional
axial tension can be applied and the hangers lose bending moment strength and stiffness. Then,
the once composite concrete hangers will only be left with the tension capacity of the steel
reinforcements. As a result, the rating of the hangers was obtained from a beam and steel hanger
model, also referred to as Beam and Hanger 1 Model.
3.5.6.1 Beam and Hanger 1 Model
In the Beam and Hanger 1 model, the cross sectional area of the steel is four square inches as
shown in Figure 49. The dashed outer lines indicate the cracked concrete while the dashed inner
lines indicating the stirrups.

66
Figure 49: Steel Hanger Cross Section
The hanger with steel reinforcements was modeled as pair of steel hangers per side as
frame members as shown in Figure 50. The hanger lengths for modeling were from the slab
centerline to the arch rib centerline for Hanger 1 and are shown in Table 24. Its location was
defined at the centroid of the hanger group. The steel hangers were assumed to have no flexural
rigidity; thus, bending moment was released at the end connecting to the transverse beam. This
model was restrained from sidesway at the level of the transverse beam. For the beam and steel
hanger model, all hangers were under tension. A rating was determined for the hanger with the
largest axial tension, which are the interior hangers. The transverse beam in the Beam and
Hanger 1 model was rated for bending moment and shear. This model resulted in higher ratings
for the hangers than the beam and composite concrete hanger model and provides a more
appropriate rating.
Table 24: Hanger 1 Lengths for Modeling
Span No. Length (ft)
IV 18.8
V 18.0
VI 16.4
Cross sectional properties for the Beam and Hanger 1 model are located in Appendix A5
for Span IV, Appendix B5 for Span V, and Appendix C5 for Span VI.

67
Figure 50: Beam and Steel Hanger 1 Model (SAP 2013)
3.5.7 Transverse Deep Beam Model
The Transverse Deep Beam model is shown in Figure 51. The beam was assumed to be simply
connected to the arch rib since there was minimal reinforcement for negative moment. The
width of the arch rib is 4 ft. The clear span of the transverse deep beam is 32 ft, from the center-
to-center of arch rib. The length of the transverse deep beam is 36 ft from out-to-out of the arch.
At either end of the transverse deep beam are the bracket sections.
The transverse deep beam was rated for bending moment and shear. Cross sectional
properties for the Transverse Deep Beam models are located in Appendix A6 for Span IV,
Appendix B6 for Span V, and Appendix C6 for Span VI.
Figure 51: Transverse Deep Beam Model (SAP 2013)
68
3.6 ARCHES
Complete 2-D models of each arch span were built and analyzed to obtain ratings for the arch rib
sections. The applied loads placed on the arch models included dead loads from the bridge
components and live loads from the truck loadings.
3.6.1 Dead Loads
For each arch span, the dead loads consisted of dead weights from the arch ribs, hangers,
transverse floor beams, transverse deep beams, columns, brackets, railings, decorative arch
blocks connecting to arch rib at deck elevation, and the arches joining the transverse floor beams
on the underside of the deck. The dead weights resulting from the hangers, transverse deep
beam, and Column 2 were inputted manually. To not double count these dead weights, the
properties for the hangers and Column 2 had a weight property modifier of zero. The dead
weight of the decorative arch block was inputted as a concentrated load. The dead weights of the
arches on the underside of the deck were inputted as uniformly distributed load. For all other
sections, the dead weights were calculated by SAP2000 as self-weight based on the geometric
properties entered in for each section.
3.6.2 Live Loads
The live loads considered are the eight trucks specified by ALDOT and the lane load specified
by AASHTO (2002). The truck’s axle weight and axle spacing were defined for each truck as a
moving load case. More information on moving load is provided in Section 3.6.2.2.
The 0.64 k/ft uniformly distributed load was applied to all of the deck frames. The 18
kips for moment and 26 kips for shear were applied as a concentrated moving loads along the
deck frames.
3.6.2.1 Lateral Truck Distribution
The 2-D arch model represents one side of the arch span. However, the set of wheel line loads
from the trucks can be anywhere transversely across the roadway width. Therefore, an analysis

69
was performed to find the largest proportion of one truck that is supported by one arch. The
largest proportion of the lane load and one truck carried by one arch is shown in Table 25. These
factors apply to all spans. The factors shown in Table 25 were determined by applying the tri-
axle truck’s wheel line loads onto the Beam and Column 2 and Beam and Hanger 1 models and
determining the largest proportion of one truck that gets carried by one side. The procedure for
calculating this proportion using the Beam and Column 2 model is shown in Appendix B7.1.
LC1, shown in Figure 36, was utilized in this analysis because it is the load case that created the
largest proportion of one truck on one side.
Table 25: Lateral Truck Distribution Factors for All Arch Models
Truck Loads Lane Loads
Distribution
Factor 1.160 1.156
3.6.2.2 Moving Load Analyses
The live loads, consisting of eight truck loads and the lane load, were added to the arch models
as moving loads. The moving load analysis allows for the maximum value to be obtained for the
shear, bending moment, and axial load at any cross section along the arch rib. Before the
moving analysis could be applied, a path was defined directly on all of the deck frames from left
to right or from right to left. The arches were analyzed for truck positions at every 6 in. along
the travel path.
Next, the live loads were defined. The axle weights along with the axle spacings were
defined for each truck. Once all axle weights were entered for all trucks, a load case was defined
for each truck. Each load case was defined as a moving load traveling on the previously created
path. For the first-order analysis, the moving loads were selected to be executed using the
unstressed stiffness state. For the second-order analyses, the moving loads were selected to be
executed using the stiffness after the end of the nonlinear dead load analysis. An explanation of
the nonlinear analysis is provided in Section 3.6.5.1.

70
3.6.3 Load Factors
The load factor rating method utilized has load factors for the dead and live loads for the
operating and inventory case as shown in Table 26. The dead load factor is the same for the
operating and inventory case. The live load factors consisted of the A2 factors as listed in Table
13, the live load distribution factor as listed in Table 25, and the impact factor for dynamic
loading in Table 27. The impact fraction equation is Eq. (21). The maximum impact fraction
required by AASHTO (2002) is 0.30. L is the length in feet of the portion of the span that is
loaded to produce the maximum stress in the member and is taken as the horizontal distance
between the pier centerlines.
(21)
Table 26: Load Factors for Arch Loading Associated with LFR Method
Operating Inventory
Span No. Load Type DL Factor LL Factor DL Factor LL Factor
IV
Truck 1.3 1.793 1.3 2.993
Lane 1.3 1.786 1.3 2.982
V
Truck 1.3 1.796 1.3 2.998
Lane 1.3 1.789 1.3 2.987
VI
Truck 1.3 1.808 1.3 3.018
Lane 1.3 1.802 1.3 3.007
VII
Truck 1.3 1.955 1.3 3.263
Lane 1.3 1.948 1.3 3.251
50I
L 125

71
Table 27: Impact Factors
Arch Span No. Impact (1+I)
IV 1.189
V 1.191
VI 1.199
VII 1.296
3.6.4 Spans IV, V, VI, and VII Arch Models
Each arch span geometry was traced in AutoCAD (discussed in Section 2.2.1 for Spans IV, V,
and VI and Sections 2.2.2 for VII) was imported into SAP2000 to allow for modifications and
adjustments to the models to replicate the existing conditions. The number of sections for each
full arch span is shown in Table 28.
Table 28: Arch Section Quantity
Span No. Arch Section Quantity
IV 82
V 80
VI 72
VII 35
The boundary conditions and restraints for half of the arch span are shown in Figure 52.
The arch base and Column 3 base are fixed. To prevent the 2-D model from translating in an
unwanted direction, out-of-plane and in-plane motion were restrained as follows. At the east end
of the deck slab, out-of-plane and in-plane motion were restrained. At the arch midspan and the
deck slab midspan, out-of-plane motion was restrained. All hangers and columns except the

72
Column 3 have moment releases at both ends. The longitudinal deck slab served as a platform
on which the applied truck loads were transmitted into the arch rib by transferring loads through
the hangers and columns. As a result, each segment of the longitudinal deck beam had a moment
release at one end.
Figure 52: Boundary Conditions and Restraints for Half Spans IV, V, and VI (SAP 2013)
The boundary conditions and bending moment releases illustrated in Figure 52 result in
all portions of the model being structurally determinate except the arch. There are two primary
reasons that this approach was taken. First, the hangers are rated as tension members without
flexural capacity, so using pin-pin links to represent the hangers is consistent. Secondly, the
Symmetry
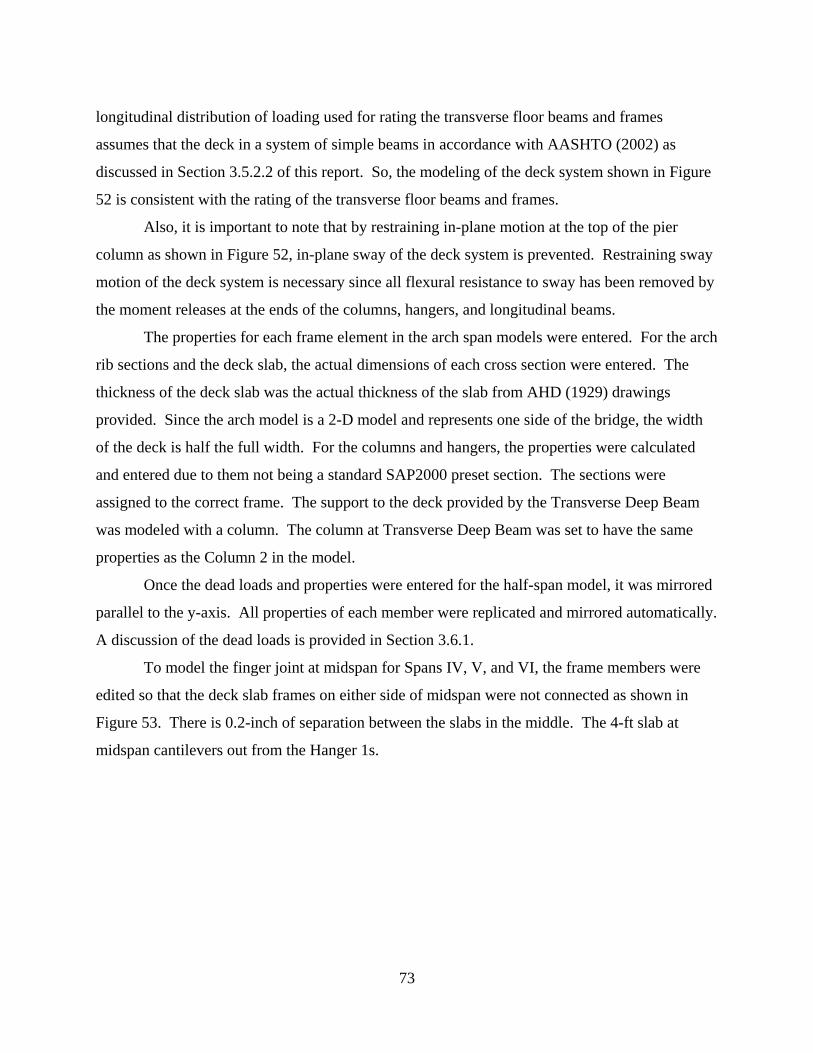
73
longitudinal distribution of loading used for rating the transverse floor beams and frames
assumes that the deck in a system of simple beams in accordance with AASHTO (2002) as
discussed in Section 3.5.2.2 of this report. So, the modeling of the deck system shown in Figure
52 is consistent with the rating of the transverse floor beams and frames.
Also, it is important to note that by restraining in-plane motion at the top of the pier
column as shown in Figure 52, in-plane sway of the deck system is prevented. Restraining sway
motion of the deck system is necessary since all flexural resistance to sway has been removed by
the moment releases at the ends of the columns, hangers, and longitudinal beams.
The properties for each frame element in the arch span models were entered. For the arch
rib sections and the deck slab, the actual dimensions of each cross section were entered. The
thickness of the deck slab was the actual thickness of the slab from AHD (1929) drawings
provided. Since the arch model is a 2-D model and represents one side of the bridge, the width
of the deck is half the full width. For the columns and hangers, the properties were calculated
and entered due to them not being a standard SAP2000 preset section. The sections were
assigned to the correct frame. The support to the deck provided by the Transverse Deep Beam
was modeled with a column. The column at Transverse Deep Beam was set to have the same
properties as the Column 2 in the model.
Once the dead loads and properties were entered for the half-span model, it was mirrored
parallel to the y-axis. All properties of each member were replicated and mirrored automatically.
A discussion of the dead loads is provided in Section 3.6.1.
To model the finger joint at midspan for Spans IV, V, and VI, the frame members were
edited so that the deck slab frames on either side of midspan were not connected as shown in
Figure 53. There is 0.2-inch of separation between the slabs in the middle. The 4-ft slab at
midspan cantilevers out from the Hanger 1s.
74
Figure 53: Deck Slab Showing Slabs at Midspan are Not Connected (SAP 2013)
For Span VII, a full arch geometry was defined using the full elevation drawing provided.
Thus, this model did not need to be mirrored after the import. The boundary conditions for this
model are shown in Figure 54.

75
Figure 54: Boundary Conditions and Restraints for Span VII (SAP 2013)
For all arch spans, the arch sections were rated for shear and the combination of axial
load and bending moment. Cross sectional properties for the arches are provided in Appendix
A7 for Span IV, Appendix B7 for Span V, Appendix C7 for Span VI, and Appendix D5 for Span
VII.
3.6.5 Slenderness Check
Section 8.14.3 in AASHTO (2002) provides a way of checking the slenderness ratio of
compression members to evaluate whether or not is necessary to include slenderness effects
through the calculation and use of a moment magnifier. A decision must be made regarding
whether the compression member is braced or not braced against sidesway to perform the check.
Since relative translation between the ends of the arch ribs is prevented, the arch ribs are
assumed to be braced against sidesway. For members braced against sidesway, slenderness may
be neglected if the inequality of Eq. (14) is true (see Section 3.5.4.1). According to the

76
Commentary to Section 10.10.1 of ACI 318-11, neglecting an increase in bending moments due
to slenderness of up to five percent is acceptable through the use of Eq. (14).
The inequality of Eq. (14) was developed for columns in reinforced concrete frames.
Whether the application of Eq. (14) to arch ribs such as those considered here is technically
appropriate is not clear, even though AASHTO (2002) Section 8.14.3.1 points toward this
equation. In the work reported here, it was assumed that slenderness effects were significant.
For completeness, Table 29 provides a summary of the calculations of (klu/r) values for the arch
ribs of each span.
The effective length factor, k, shown in Table 29 is based on the rise-to-span ratio and
was taken from Table 8.14.3 of AASHTO (2002). The label hqs is the height of the arch rib cross
section at the quarter span and is used in determining the radius of gyration. The length lu is one-
half of the span length of the arch rib. For Spans IV, V, and VI, (klu/r) calculated are 62.00,
64.67, and 58.48, respectively, as shown in Table 29. However, looking at the right expression
in Eq. (14), the largest value that this expression can be is 46. All of the klu/r magnitudes are
larger than 46. For Span VII, the (klu/r) is 33.56, and the right expression in Eq. (14) can be as
small as 22. Therefore, slenderness was considered for all of the concrete arches.
Table 29: Arch Properties and klu/r
Span IV Span V Span VI Span VII
Arch Rise (ft) 45.58 44.57 40.44 15.79
Arch Span (ft) 130.2 128.3 116.5 39.99
Rise/Span 0.35 0.35 0.35 0.39
k 0.72 0.72 0.72 0.72
lu (ft) 65.10 64.13 58.24 19.99
hqs (ft) 2.52 2.38 2.39 1.43
r (ft) 0.76 0.71 0.72 0.43
klu/r 62.00 64.67 58.48 33.56

77
3.6.5.1 Slenderness Effects using Combination of Second-Order and Linear
Analyses
Chapter 4 provides an in-depth discussion of methods that may be used to account for in-plane
slenderness effects for arches. One conclusion from Chapter 4 is that a combined analysis using
second-order analysis for dead loads and a linear analysis for moving live loads is appropriate.
The linear moving load analysis is performed using the structural stiffness matrix found at the
end of the second-order analysis for dead loads. Below is a description of how that combined
analysis was implemented.
In consideration of slenderness, the moment of inertia and concrete modulus of elasticity
were modified to accurately represent the long-term condition of the concrete arches as shown in
Table 30. According to Section 8.14.3.1 in AASHTO (2002), the stiffness reduction factor, φ, is
0.85 for concrete arches. This stiffness reduction factor is applied to the gross moment of inertia
of all sections of the arch rib.
Table 30: Modifications on Ig and Ec
Span No. Stiffness Reduction
Factor Long Term Ec (ksi)
IV 0.85 1517
V 0.85 1517
VI 0.85 1517
VII 0.85 1505
The modulus of elasticity for 3,000 psi concrete is 3,122,000 psi calculated based on the
following equation.
(22) c cE 57000 f '
78
The creep adjusted, long-term concrete modulus of elasticity, Ec_LT, (ACI 209R 1992) was
calculated by
(23)
Where:
νu = the ultimate creep coefficient
The long-term modulus accounts for creep deformations in the arch. For the Bibb Graves
Bridge, the ultimate creep coefficient was calculated to be 1.06 for Spans IV through VI, and
1.07 for Span VII. The ultimate creep coefficient was calculated using the procedure given by
ACI 209R-92 (1992) and is shown for Span IV in Appendix A7 in Figure 79A.
Slenderness was incorporated into the arch models by a nonlinear analysis. A nonlinear
load case for the dead loads was created with the appropriate load factors for P-delta effects plus
large displacements. The load factors are in Table 26. Since this load case is for dead loads, the
initial stiffness was from an unstressed initial condition. For the live loads, load cases were
created for each truck as moving load cases. For these cases, the stiffness was from the stiffness
at the end of the nonlinear dead load case. For the lane loads, slenderness was incorporated in a
similar fashion as for the truck loads.
Due to the redistribution of internal forces and moments, it is possible that the internal
forces and moments decrease at a given cross section relative to the values obtained in a first-
order analysis. To ensure that the nonlinear analysis yielded the largest member forces and
moments, those results were compared to the results from the conventional elastic, linear
analysis. The larger forces and moments from these two analyses were utilized for ratings. This
comparison is similar to checking the inequality in Eq. (16).
3.6.5.2 Slenderness Effects and Shear Rating of Span VII
The slenderness effects for Span VII were included using the combination of second-order and
linear analyses. This is the same method applied to all other spans and is described in Section
3.6.5.1. Using this method yielded a shear rating for Span VII’s arch Section A16 of less than
1.0 for the tri-axle and concrete truck as shown in Table 31. To ensure that the combination of
second-order and linear analyses did not unnecessarily penalize the shear rating, an alternate
rating was determined using results from first-order analysis. Those rating results are show in
cc _ LT
u
EE
1
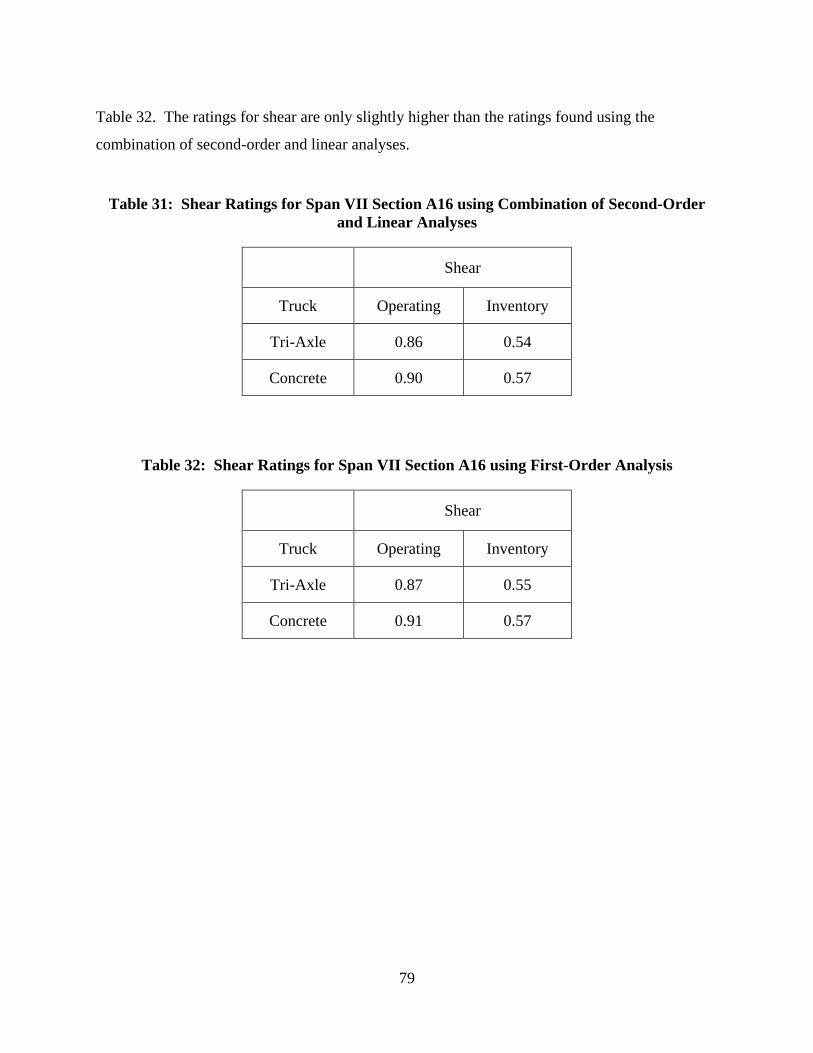
79
Table 32. The ratings for shear are only slightly higher than the ratings found using the
combination of second-order and linear analyses.
Table 31: Shear Ratings for Span VII Section A16 using Combination of Second-Order
and Linear Analyses
Shear
Truck Operating Inventory
Tri-Axle 0.86 0.54
Concrete 0.90 0.57
Table 32: Shear Ratings for Span VII Section A16 using First-Order Analysis
Shear
Truck Operating Inventory
Tri-Axle 0.87 0.55
Concrete 0.91 0.57

80
Chapter 4
SLENDERNESS EFFECTS IN REINFORCED CONCRETE ARCHES
Early in the project, the procedures for rating the various bridge components were developed.
During those initial analyses and preliminary ratings, it was found that moment magnifiers
calculated using AASHTO procedures would be approximately 1.2 for some arch spans. This
increase in bending moment results in significant reductions in the arch ratings. So, a detailed
investigation of the methods available for including slenderness effects in the arch ratings was
carried out. A description of the various methods and comparisons of results are presented in
this chapter. The comparisons indicate that the combination of elastic second-order analysis for
dead load and linear analysis using a reduced stiffness for truck loads is appropriate for use in
calculating the arch ratings.
4.1 AASHTO MOMENT MAGNIFIER METHOD
AASHTO (2002) provides general requirements for reinforced concrete arches in Section 8.14.3.
Slenderness effects in the plane of the arch rib may be accounted for in a load rating using the
approximate moment magnifier method from Section 8.16.5.2 as summarized below. The
equations regarding to slenderness in this section were presented in Section 3.5.4.1 for Column
3s, but are shown here again in the context of arches for convenience.
The arch rib must resist the factored axial load, Pu, and a magnified factored bending
moment, Mc, given by
(24)
Where:
δb = braced frame moment magnifier
M2b = value of the larger factored end moment on the member calculated by
conventional elastic frame analysis with applied dead load and live load
plus impact (k-ft)
c b 2bM M
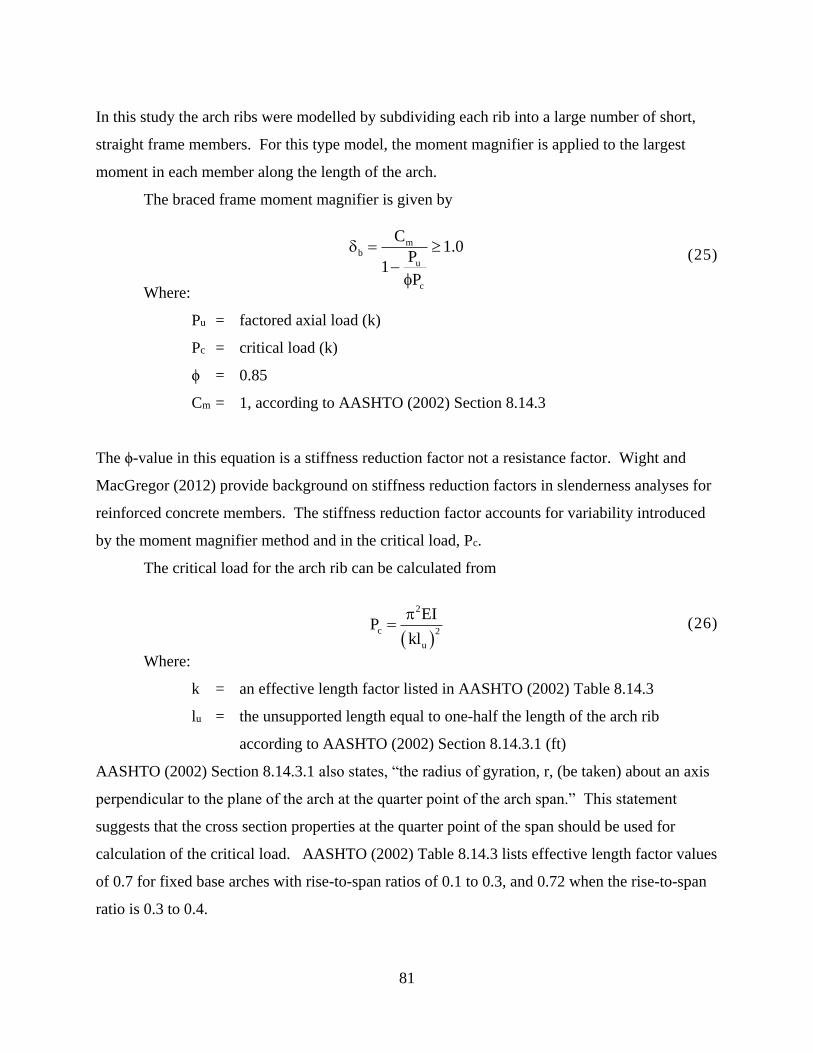
81
In this study the arch ribs were modelled by subdividing each rib into a large number of short,
straight frame members. For this type model, the moment magnifier is applied to the largest
moment in each member along the length of the arch.
The braced frame moment magnifier is given by
(25)
Where:
Pu = factored axial load (k)
Pc = critical load (k)
ϕ = 0.85
Cm = 1, according to AASHTO (2002) Section 8.14.3
The ϕ-value in this equation is a stiffness reduction factor not a resistance factor. Wight and
MacGregor (2012) provide background on stiffness reduction factors in slenderness analyses for
reinforced concrete members. The stiffness reduction factor accounts for variability introduced
by the moment magnifier method and in the critical load, Pc.
The critical load for the arch rib can be calculated from
(26)
Where:
k = an effective length factor listed in AASHTO (2002) Table 8.14.3
lu = the unsupported length equal to one-half the length of the arch rib
according to AASHTO (2002) Section 8.14.3.1 (ft)
AASHTO (2002) Section 8.14.3.1 also states, “the radius of gyration, r, (be taken) about an axis
perpendicular to the plane of the arch at the quarter point of the arch span.” This statement
suggests that the cross section properties at the quarter point of the span should be used for
calculation of the critical load. AASHTO (2002) Table 8.14.3 lists effective length factor values
of 0.7 for fixed base arches with rise-to-span ratios of 0.1 to 0.3, and 0.72 when the rise-to-span
ratio is 0.3 to 0.4.
mb
u
c
C1.0
P1
P
2
c 2
u
EIP
kl

82
Two equations for EI are given in AASHTO (2002) Section 8.16.5.2 as follows.
(27)
Or,
(28)
Where:
βd = absolute value of the ratio of the maximum factored dead load moment to
the maximum factored total load moment
Ec = modulus of elasticity for concrete (ksf)
Es = modulus of elasticity for steel (ksf)
Ig = moment of inertia of the gross concrete cross section (ft4)
Is = moment of inertia of the reinforcement about the centroidal axis of the
gross concrete cross section (ft4)
AASHTO (2002) allows the use of either Eqs. (36) or (34). These equations result in
values of the flexural rigidity, EI, in units of ksf that are significantly reduced from the value
calculated by simply using EcIg. The reduced EI values account for cracking of the member and
creep deformations.
Values of the moment magnifier, δb, were calculated for each of the arch spans and are
listed in Table 33 along with values for Ig, Is, and βd. For all cases, Ec = 3,122 ksi. Values for βd
were determined using factored moments at the quarter point in the span, and the live load
moments were determined for the standard tri-axle truck.
c g
s s
d
E IE I
5EI1
c g
d
E I
2.5EI1
83
Table 33: Moment Magnifiers δb from using AASHTO (2002)
Value at Quarter-Span
Span Loading Ig (in.4) Is (in.4) βd δb
IV Operating 110,600 2650 0.029 1.178
Inventory 110,600 2650 0.018 1.205
V Operating 90,850 2250 0.036 1.209
Inventory 90,850 2250 0.022 1.243
VI Operating 94,360 2100 1.153 1.153
Inventory 94,360 2100 1.179 1.179
VII Operating 19,790 260 0.128 1.039
Inventory 19,790 260 0.081 1.050
4.2 AASHTO LRFD METHODS
AASHTO (2012) provides a moment magnifier procedure and guidance for an advanced, or
refined, analysis for including slenderness effects in reinforced concrete arches.
4.2.1 Moment Magnifier
Moment magnification for arches is addressed in Section 4.5.3.2.2c. This procedure is
essentially as described in the previous section with three differences pointed out here. First, the
stiffness reduction factor, ϕ, in Eq. (25) has the value 0.75 instead of 0.85. Secondly, the
terminology “maximum factored permanent load moment” is used instead of “maximum
factored dead load moment” in the defining the numerator of the ratio βd. And thirdly, the
moment magnifier, δb, is applied only to live load plus impact moments from a standard small
deflection analysis instead of the moments from combined dead load and live load plus impact.

84
The first two differences between the moment magnifier procedures provided in
AASHTO (2002) and AASHTO (2012) are not fundamental differences in approach.
Presumably the change is stiffness reduction factor is related to the overall differences between
the design loads, load factors, and design philosophies. The purpose of dividing the flexural
rigidity, EI, by the factor (1+βd) in Eqs. (27) and (28) is to account for the destabilizing effect of
long-term transverse deflection of a compression member due to creep. Creep occurs over time
as a result of sustained, or permanent, load. Typically the sustained load on a reinforced
concrete arch is the dead load, but AASHTO (2012) require the engineer to make a decision
about what part of the total load is sustained by use of the term “sustained load” instead of “dead
load” in the definition of βd. Additional information is provided later in this chapter regarding
the third difference of applying, or not applying, the moment magnifier to the dead load
moments.
4.3 ADVANCED ANALYSIS
Section 4.5.3.2 of the AASHTO (2012) provides general background on the topic of large
deflection theory. Five primary factors must be considered in an advanced analysis to account
for slenderness effects: (1) the effects of deformation of the structure on the equations of
equilibrium, (2) the effects of deformation and out-of-straightness of the members, (3) time- and
stress-dependent material properties, (4) interaction effects of tensile and compressive axial
forces on member stiffness, and (5) the order of load application. An advanced analysis
accounting for these factors will be a nonlinear analysis, so the analysis must be performed using
factored loads. The five factors identified in the AASHTO (2012) and listed above can be
accounted for with an elastic second-order analysis by making appropriate choices of cross
section and material characteristics.
ACI’s Building Code Requirements for Structural Concrete (ACI 318-11) and
Commentary identifies the dominate effects that must be considered in selecting cross section
properties for use in an elastic second-order analysis to account for slenderness effects: (1)
influence of axial loads, (2) presence of cracked regions along the member length, and (3)
duration of the loads.
85
For reinforced concrete arches, AASHTO (2012) Section 5.14.3.2 provides the following
statement, “The in-plane stability of the arch rib(s) shall be investigated using a modulus of
elasticity and moment of inertia appropriate for the combination of loads and moment in the
rib(s).” Commentary to this section states, “Stability under long-term loads with a reduced
modulus of elasticity may govern the stability.” Commentary to Section 5.14.3.2 also provides
insight regarding the selection of cross section and material properties appropriate for long-term
loading and transient loading. For long-term loading, the transformed cross section properties
and long-term modulus determined by dividing the short-term modulus by one plus the creep
coefficient are appropriate. For transient loading, the cracked section properties including the
effects of factored axial load and the short-term modulus are appropriate. The short-term
modulus, Ec, in units of ksi can be estimated for normalweight concrete from
(29)
Where:
f’c = specified concrete strength (ksi)
4.4 ELASTIC BUCKLING ANALYSIS
Many commercially available structural analysis software packages provide the capability of
performing an elastic buckling analysis of an arch bridge span. The goal of using structural
analysis software to model an arch and perform an elastic buckling analysis is to improve the
accuracy of the critical load estimate beyond that determined from Eq. (26). The improved
accuracy of the critical load will improve the moment magnifier determined from Eq. (25).
Application of an elastic buckling analysis in a bridge rating requires (1) use of proper
cross section and material properties in modelling the structure, (2) use of the appropriate
combination and position(s) of factored dead load and live load plus impact in the analysis, and
(3) calculation of the moment magnifier, δb, from the eigenvalue results. The approach taken
here for addressing these three topics is to replace the buckling load analysis represented by Eq.
(26) with a more advanced buckling load analysis performed using SAP2000.
The curved arch geometry can be modeled with short, straight members the same as for
static load analysis. The thickness of the arches studied here increased from the peak of the arch
at midspan to the base. This change in cross section was modeled by assigning different cross
'
c cE 1,820 f
86
section properties to each member making up the arch model. Some structural analysis software
may require compression members to be subdivided into several pieces to improve the accuracy
of the calculated buckling load depending on the formulation of the member stiffness matrix
used in the software. In arches such as those considered here, that requirement is easily met by
the need to subdivide the arch to model the curved geometry and change in cross section.
Flexural rigidity, EI, calculated from Eqs. (27) or (28) is appropriate for use in elastic
buckling analysis. Here Eq. (28) was used because of the convenience of incorporating it into
the overall modeling and analysis processes. In this project, SAP2000 (2013) was used for all
analyses. SAP2000 allows a multiplier to be input for multiplication by the cross section
moment of inertia. At a given value of βd, EI from Eq. (4.5) becomes a constant multiplier times
the gross cross section moment of inertia times the modulus of elasticity of the concrete.
Here βd was determined as the average of five values, one calculated at each base of the
arch, each quarter-span, and at the peak. Due to the changes in cross section and bending
moments along the arch, an average value for βd is more appropriate than a single value. As an
example, for the Span IV arch, the individual values of βd at each base, quarter-span, and peak
are 0.051, 0.029, and 0.193. There is symmetry in the values at each base and each quarter-span
point because the geometry of the arch is symmetrical. The average value of βd is 0.099 for Span
IV.
The individual values of βd were calculated as the absolute value of the ratio of the
maximum factored dead load moment to the maximum factored total load moment. For the
arches considered here, there were no sustained loads except for the dead load. Live load and
dead load factors were 1.3 as appropriate for load factor for LFR’s operating ratings according to
The MBE (2011). The magnitudes of the moments were determined from a structural analysis of
the arch using the flexural rigidity EcIg appropriate for each subdivision along the length of the
arch. A moving load analysis was performed with the standard tri-axle truck to determine the
maximum live load moment at the five sections of interest for calculation of βd.
The output of an elastic buckling analysis from software such as SAP2000 is the buckled
shapes (eigenvectors) and load multipliers (eigenvalues). A review of the buckled shapes
provides information about the behavior of the structure and is very useful for identifying
modeling errors. The load multipliers provide the buckling load as a multiple of the applied
loading. For example, in a rating analysis, factored dead load and factored truck load plus

87
impact are applied. A buckling analysis is performed for a specific location of the truck loading;
moving load analysis can only be accomplished by performing a buckling analysis for each
possible truck position. Hence, the load multiplier is the factor that must be applied to the
combination of all applied loads to find the total magnitude that causes buckling when the dead
loading and truck loading are in specific locations. The load multiplier is equivalent to (Pc/Pu) in
Eq. (25) for the combination of applied loads and truck position.
The moment magnifier can be calculated from buckling analysis results as
(30)
Where:
LM = the load multiplier
ϕ = stiffness reduction factor, 0.85 for LFR ratings
Since the load multiplier is dependent on the position of the truck loading, δb can take on an
infinite number of values. Here a series buckling analyses was performed where the truck
position was varied to determine the lowest value of the load multiplier. That lowest value was
used to calculate a single value of the moment magnifier δb for use at all cross sections along the
arch. The use of a single value of moment magnifier is consistent with the AASHTO approach.
4.5 ELASTIC SECOND-ORDER ANALYSIS
Elastic second-order analysis has become a popular means of directly determining the internal
forces for use in design of reinforced concrete and steel structures because it makes the
calculation of buckling loads and moment magnifiers unnecessary. Moment magnifier
procedures are approximate second-order analysis procedures. Bending moments determined
from first-order structural analysis are multiplied by a moment magnifier to estimate the bending
moments that include second-order effects.
In classical first-order structural analysis, the geometry and stiffness of the structure is
based on the initial configuration prior to deformation or deflection, and the influence of axial
load on the stiffness of individual members is neglected. An elastic analysis assumes that no
permanent deformation occurs, and this is a fundamental assumption in a first-order analysis. An
elastic second-order analysis assumes that there is no permanent deformation, but includes the
b
11.0
11
LM

88
effects of axial load on the stiffness of the members and enforces equilibrium in the deformed
configuration of the structure. The second-order slenderness effects (P-Δ and P-δ effects) are
captured by such an analysis. A goal of the work presented here is to identify how an elastic
second-order analysis of reinforced concrete arches can be performed to accurately include
slenderness effects in a load rating analysis to avoid the use of a moment magnifier.
Earlier, insights from the AASHTO (2012) Commentary regarding advanced analysis of
reinforced concrete arches were summarized by the following: 1) For long-term loads, the
transformed cross section properties and long-term modulus determined by dividing the short-
term modulus by one plus the creep coefficient are appropriate. 2) For transient loads, the
cracked section properties including the effects of factored axial load and the short-term modulus
are appropriate. These two statements indicate that different modulus and cross section
characteristics are appropriate for dead loads and truck loads. Carrying out a single second-order
structural analysis with changes in the stiffness characteristics after the application of the dead
load and before the application of the live loads is not practical. Performing a dead load analysis
with one set of stiffness characteristics, a live load analysis with a different set of stiffness
characteristics, and then adding the results together is not logical for nonlinear analysis given
that load order effects can be significant.
There are two primary challenges to performing an elastic second-order analysis for use
in the load rating of a concrete arch that carries moving traffic: 1) use of appropriate cross
section and material characteristics to account for the effects of cracking and the long-term
effects of creep while accurately predicting the response to live load, and 2) providing a practical
means of performing moving load analysis so that the maximum forces in each member can be
identified for use in the load rating. The SAP2000 reference manual (CSI 2011) suggests a
combination of second-order analysis and linear moving load analysis for structures with
challenges such as the two listed above. Specifically, a second-order analysis is performed for
the factored dead load, and a linear moving load analysis is performed for the factored truck
loading plus impact using the structural stiffness determined at the end of the dead load analysis.
An investigation of the appropriateness of using that type analysis, referred to here as a
combined analysis, for load rating of reinforced concrete arch bridges is presented later in this
chapter. Since a second-order analysis for the dead load is a part of the combined analysis, the
long-term structural model described below is used in that type analysis.

89
4.5.1 Long-Term Model
A model of the Span IV arch was created for use in elastic second-order analyses that is referred
to here as the long-term model because the modulus of elasticity and cross section characteristics
are as recommended by AASHTO (2012) for long-term loading.
The modulus of elasticity of the concrete is
(31)
Where:
Ec = concrete modulus of elasticity, calculated using Eq. (29)
νu = the ultimate creep coefficient, determined from ACI 209 (1982) as 1.06
The moment of inertia for each cross section along the arch was
(32)
Where:
ϕ = a stiffness reduction factor
Ig = gross section moment of inertia (in.4)
Use of the stiffness reduction factor in Eq. (32) is intended to account for the variability
in cross section rigidity along the arch due to cracking. A value of 0.85 was used here for ratings
by the load factor method because that is the value recommended by AASHTO (2012) for use in
Eq. (25). Future research may identify a more appropriate value of stiffness reduction factor, but
0.85 is reasonable at the current time. The uncracked transformed section moment of inertia
could be used instead of the gross moment of inertia in Eq. (32), but the longitudinal
reinforcement in the arch is relatively light and the difference is small. A βd factor is not used
because the load duration effects resulting from creep are accounted for by using the long-term
modulus given in Eq. (31).
4.5.2 Transient Model
A model of the Span IV arch was created for use in elastic second-order analyses that is referred
to here as the transient model because the modulus of elasticity and cross section characteristics
gI I
c
u
EE
1

90
are as recommended by AASHTO (2012) for transient loading. The properties of this model are
the same as those used in the elastic buckling analyses described previously.
4.5.3 Comparison of the Models
A simple comparison of the long-term model and the transient model is possible by comparing
the flexural rigidity, EI, used for each. Even though the thickness of each arch increases going
from the peak to the base, the ratio (EI/EcIg) remains constant for each arch. For the long-term
model of each arch, the ratio (E/Ec) = 0.485, (I/Ig) = 0.85, and (EI/EcIg) = 0.485. For the transient
models, (E/Ec) = 1, and the ratio (I/Ig) varied based on the value of βd so that (EI/EcIg) = 0.364,
0.364, 0.371 and 0.342 for Spans IV, V, VI, and VII, respectively. Hence, the difference in the
flexural rigidities between the long-term and transient models used for each arch differed by 27
to 35 percent.
4.6 RESULTS OF ELASTIC BUCKLING ANALYSES
Elastic buckling analyses were performed using the transient model of each arch span. The
applied loading included dead load plus the standard tri-axle truck loading as shown in Figure
34. Appropriate factors were used for dead load, live load and impact, and lateral distribution of
loading between the two arches of each span as shown in Table 26. Separate analyses were
performed for operating and inventory rating cases. The live load factors 1.3 and 2.17 were used
for the operating and inventory rating cases, so the load multipliers, LM, determined through the
buckling analyses correspond to a rating factor of one.
Through trial and error the location of the tri-axle truck that created the lowest buckling
load was determined for each span. The critical truck locations are illustrated in Figure 55 and
Figure 56. These truck locations create high axial load in the arch rib at the peak. Figure 55
illustrates the critical truck location for Spans IV, V and VI. These spans are very similar in
geometry except for the overall span length. The spacing of the hangers and columns vary as the
span length changes so that the number of hangers and columns in each span is the same. For
Spans IV, V and VI, the critical truck location is when the center axle of the three rear axles is at
midspan. There is a finger joint in the deck at midspan, so the axle at midspan was positioned
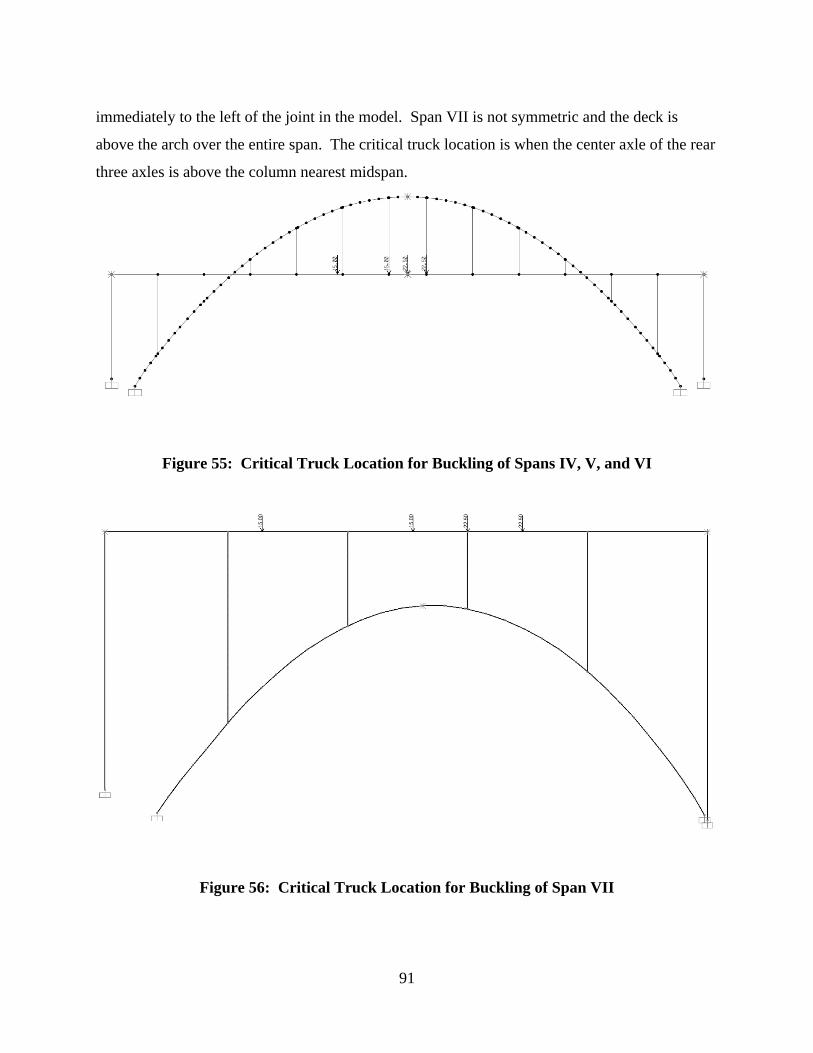
91
immediately to the left of the joint in the model. Span VII is not symmetric and the deck is
above the arch over the entire span. The critical truck location is when the center axle of the rear
three axles is above the column nearest midspan.
Figure 55: Critical Truck Location for Buckling of Spans IV, V, and VI
Figure 56: Critical Truck Location for Buckling of Span VII

92
Buckled shapes for the first (lowest) buckling mode for each arch are illustrated by
Figure 57 and Figure 58. The buckled shapes for Span IV, V and VI appear identical as shown
in Figure 57. The buckled shape of Span VII shown in Figure 58 is also very similar to that of
the other spans.
Figure 57: First Mode Buckled Shape for Spans IV, V, and VI
Figure 58: First Mode Buckled Shape for Span VII

93
Load multiplier values for the first buckling mode are listed in Table 34 along with the
corresponding moment magnifier values determined from Eq. (4.7). Comparison of the moment
magnifiers listed in Table 33 and Table 34 shows that the magnifiers determined through the
elastic buckling analyses are smaller than those determined by the AASHTO procedure. But, the
differences between the moment magnifiers are not huge.
Table 34: Moment Magnifiers δb from Elastic Buckling Analyses
Span Loading βd LM δb
IV Operating 0.099 9.6314 1.139
Inventory 0.099 8.3492 1.164
V Operating 0.098 9.2984 1.145
Inventory 0.098 8.0208 1.172
VI Operating 0.078 11.991 1.109
Inventory 0.078 10.192 1.130
VII Operating 0.170 26.113 1.047
Inventory 0.170 20.162 1.062
4.7 RESULTS OF ELASTIC SECOND-ORDER ANALYSES
Elastic second-order analyses were performed for the purpose of identifying the best way to
account for slenderness effects in the arches. The most convenient for use in load rating is a
combined analysis which includes a second-order analysis for the factored dead load and then
uses the structural stiffness at the end of that analysis in a linear moving load analysis for the
factored truck loading. This is especially true for the project reported here where operating and
inventory ratings are required for eight different standard trucks. So, analyses were performed to
produce comparisons between second-order analyses, the combined analysis, and moment
magnifier procedures. Three specific truck locations were chosen for each arch. These locations
were chosen to maximize the load effects at three specific cross sections as illustrated in Figure
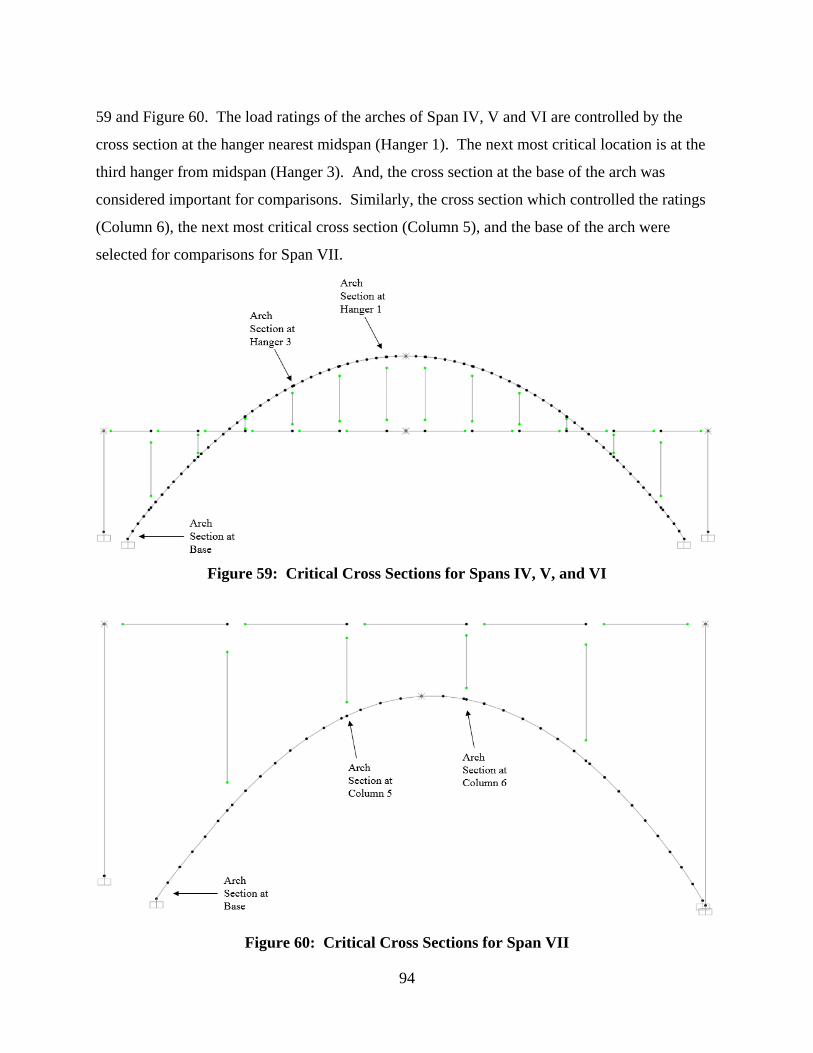
94
59 and Figure 60. The load ratings of the arches of Span IV, V and VI are controlled by the
cross section at the hanger nearest midspan (Hanger 1). The next most critical location is at the
third hanger from midspan (Hanger 3). And, the cross section at the base of the arch was
considered important for comparisons. Similarly, the cross section which controlled the ratings
(Column 6), the next most critical cross section (Column 5), and the base of the arch were
selected for comparisons for Span VII.
Figure 59: Critical Cross Sections for Spans IV, V, and VI
Figure 60: Critical Cross Sections for Span VII
95
Analyses for comparisons were performed using the tri-axle truck loading plus impact
since that truck produced the lowest rating factors of all the eight standard trucks considered in
this project. A first-order analysis was performed using the flexural rigidity EcIg for use with the
moment magnifier procedures. Second-order analyses for full factored dead load plus live load
were performed using both the transient model and the long-term model. And, the combined
analysis was simulated by performing a second-order analysis for the dead load and then using
the stiffness at the end of that analysis to perform a linear analysis for one of the three critical
truck positions described above. Analyses of each type were repeated for each of the three
critical truck locations. A summary of the resulting factored axial loads and bending moments at
the critical cross sections in each span is provided in Table 35 through Table 38. The moment
magnifiers listed in Table 33 and Table 34 were used with the first order analysis to produce
results shown in rows labeled AASHTO (2002), AASHTO (2012), and Buckling Analysis.
Some observations are justified by the results shown in Table 35 through Table 38. The
axial load values are not significantly affected by second-order effects. This is seen by
comparing the axial loads found by the first-order analyses to those found by the second-order
analyses for either the long-term or transient model. This observation is consistent with the
moment magnifier procedures in most structural design codes since the axial loads used in design
are the values from first-order analysis without modification by a magnifier.
The second-order analysis results from the transient model and the long-term model are
very similar. The percent difference between bending moments obtained from these models is
less than 2.2 percent for all cases shown in Table 35 and Table 38. Based on the guidance
provided by the AASHTO (2012) as previously discussed, the transient model is most
appropriate for the live loads and the long-term model is most appropriate for the dead loads and
inclusion of the effects of creep on the shape of the arch. The good agreement between the
results from these two models may or may not occur for other arches. Since it is not possible to
state which model produces the best results for dead load plus live load, the average of the results
from these two models is used as the standard of comparison below. These average second-order
analysis results are the best estimates of the internal forces in the arches including second-order,
slenderness, effects.
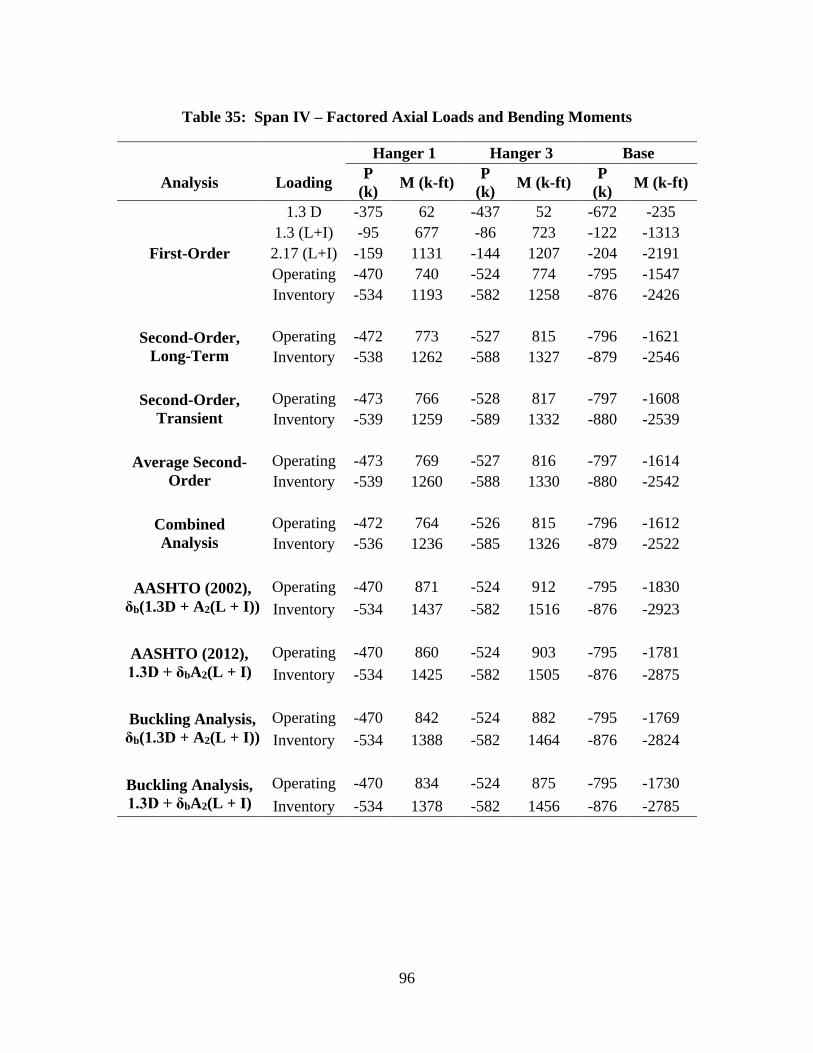
96
Table 35: Span IV – Factored Axial Loads and Bending Moments
Hanger 1 Hanger 3 Base
Analysis Loading P
(k) M (k-ft)
P
(k) M (k-ft)
P
(k) M (k-ft)
First-Order
1.3 D -375 62 -437 52 -672 -235
1.3 (L+I) -95 677 -86 723 -122 -1313
2.17 (L+I) -159 1131 -144 1207 -204 -2191
Operating -470 740 -524 774 -795 -1547
Inventory -534 1193 -582 1258 -876 -2426
Second-Order,
Long-Term
Operating -472 773 -527 815 -796 -1621
Inventory -538 1262 -588 1327 -879 -2546
Second-Order,
Transient
Operating -473 766 -528 817 -797 -1608
Inventory -539 1259 -589 1332 -880 -2539
Average Second-
Order
Operating -473 769 -527 816 -797 -1614
Inventory -539 1260 -588 1330 -880 -2542
Combined
Analysis
Operating -472 764 -526 815 -796 -1612
Inventory -536 1236 -585 1326 -879 -2522
AASHTO (2002),
δb(1.3D + A2(L + I))
Operating -470 871 -524 912 -795 -1830
Inventory -534 1437 -582 1516 -876 -2923
AASHTO (2012),
1.3D + δbA2(L + I)
Operating -470 860 -524 903 -795 -1781
Inventory -534 1425 -582 1505 -876 -2875
Buckling Analysis,
δb(1.3D + A2(L + I))
Operating -470 842 -524 882 -795 -1769
Inventory -534 1388 -582 1464 -876 -2824
Buckling Analysis,
1.3D + δbA2(L + I)
Operating -470 834 -524 875 -795 -1730
Inventory -534 1378 -582 1456 -876 -2785

97
Table 36: Span V – Factored Axial Loads and Bending Moments
Hanger 1 Hanger 3 Base
P M P M P M
Analysis Loading (k) (k-ft) (k) (k-ft) (k) (k-ft)
First-Order
1.3 D -364 68 -429 41 -654 -243
1.3 (L+I) -89 673 -87 699 -122 -1319
2.17 (L+I) -149 1123 -145 1166 -204 -2202
Operating -453 741 -516 740 -776 -1562
Inventory -512 1191 -574 1207 -858 -2445
Second-Order,
Long-Term
Operating -454 778 -519 780 -778 -1623
Inventory -515 1267 -580 1275 -862 -2555
Second-Order,
Transient
Operating -455 772 -520 781 -779 -1610
Inventory -516 1264 -582 1280 -862 -2548
Average Second-
Order
Operating -455 775 -520 780 -779 -1616
Inventory -515 1266 -581 1278 -862 -2552
Combined
Analysis
Operating -454 768 -518 779 -778 -1616
Inventory -515 1238 -578 1274 -861 -2536
AASHTO (2002),
δb(1.3D + A2(L + I))
Operating -453 896 -516 894 -776 -1888
Inventory -512 1481 -574 1498 -858 -3039
AASHTO (2012),
1.3D + δbA2(L + I)
Operating -453 882 -516 886 -776 -1838
Inventory -512 1464 -574 1490 -858 -2980
Buckling Analysis,
δb(1.3D + A2(L + I))
Operating -453 848 -516 847 -776 -1788
Inventory -512 1396 -574 1412 -858 -2865
Buckling Analysis,
1.3D + δbA2(L + I)
Operating -453 839 -516 841 -776 -1753
Inventory -512 1385 -574 1408 -858 -2824
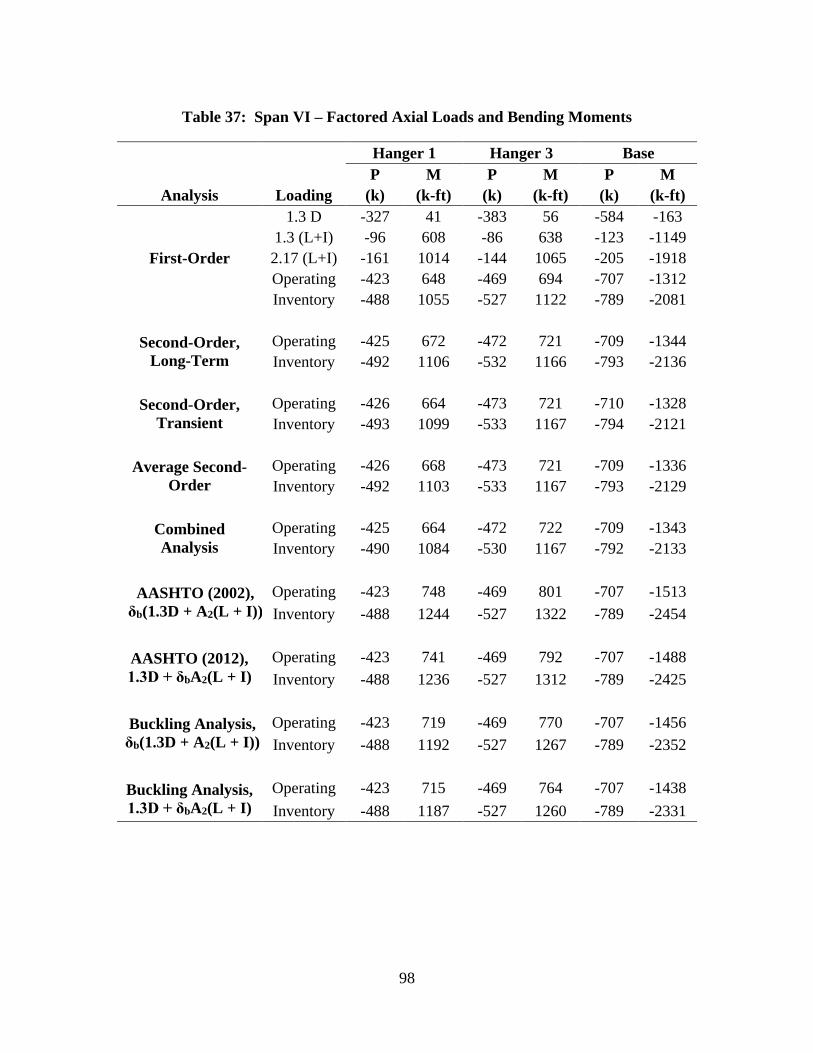
98
Table 37: Span VI – Factored Axial Loads and Bending Moments
Hanger 1 Hanger 3 Base
P M P M P M
Analysis Loading (k) (k-ft) (k) (k-ft) (k) (k-ft)
First-Order
1.3 D -327 41 -383 56 -584 -163
1.3 (L+I) -96 608 -86 638 -123 -1149
2.17 (L+I) -161 1014 -144 1065 -205 -1918
Operating -423 648 -469 694 -707 -1312
Inventory -488 1055 -527 1122 -789 -2081
Second-Order,
Long-Term
Operating -425 672 -472 721 -709 -1344
Inventory -492 1106 -532 1166 -793 -2136
Second-Order,
Transient
Operating -426 664 -473 721 -710 -1328
Inventory -493 1099 -533 1167 -794 -2121
Average Second-
Order
Operating -426 668 -473 721 -709 -1336
Inventory -492 1103 -533 1167 -793 -2129
Combined
Analysis
Operating -425 664 -472 722 -709 -1343
Inventory -490 1084 -530 1167 -792 -2133
AASHTO (2002),
δb(1.3D + A2(L + I))
Operating -423 748 -469 801 -707 -1513
Inventory -488 1244 -527 1322 -789 -2454
AASHTO (2012),
1.3D + δbA2(L + I)
Operating -423 741 -469 792 -707 -1488
Inventory -488 1236 -527 1312 -789 -2425
Buckling Analysis,
δb(1.3D + A2(L + I))
Operating -423 719 -469 770 -707 -1456
Inventory -488 1192 -527 1267 -789 -2352
Buckling Analysis,
1.3D + δbA2(L + I)
Operating -423 715 -469 764 -707 -1438
Inventory -488 1187 -527 1260 -789 -2331
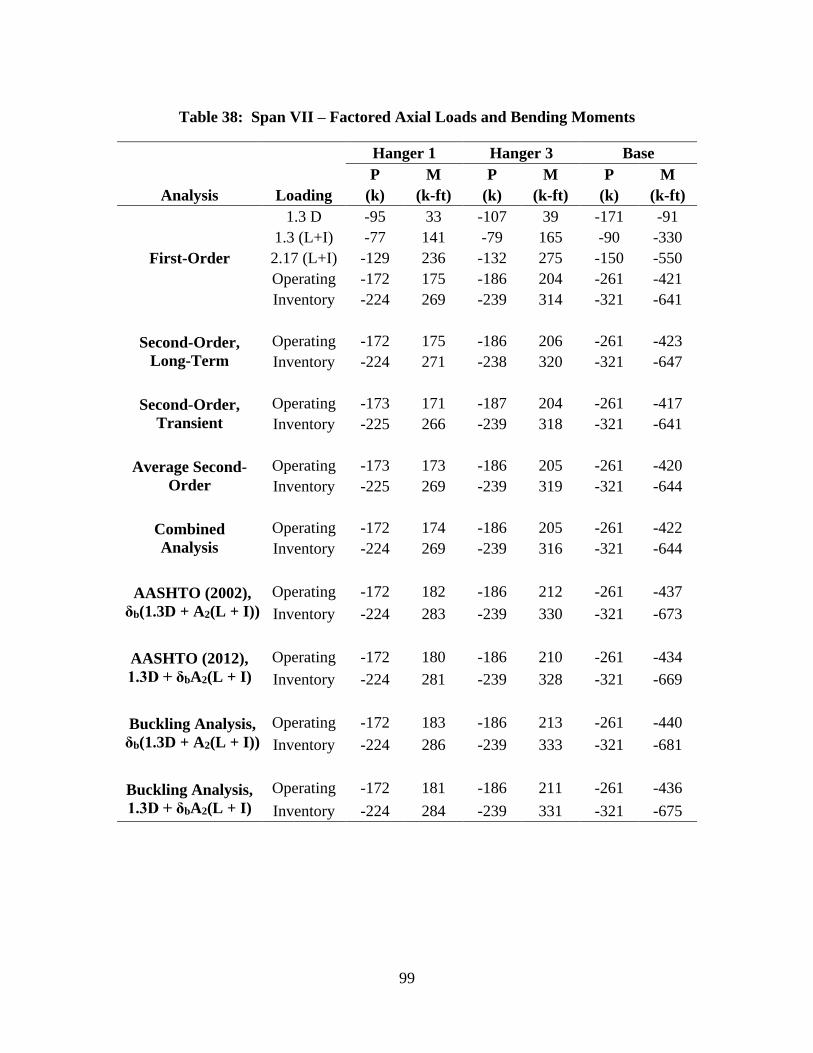
99
Table 38: Span VII – Factored Axial Loads and Bending Moments
Hanger 1 Hanger 3 Base
P M P M P M
Analysis Loading (k) (k-ft) (k) (k-ft) (k) (k-ft)
First-Order
1.3 D -95 33 -107 39 -171 -91
1.3 (L+I) -77 141 -79 165 -90 -330
2.17 (L+I) -129 236 -132 275 -150 -550
Operating -172 175 -186 204 -261 -421
Inventory -224 269 -239 314 -321 -641
Second-Order,
Long-Term
Operating -172 175 -186 206 -261 -423
Inventory -224 271 -238 320 -321 -647
Second-Order,
Transient
Operating -173 171 -187 204 -261 -417
Inventory -225 266 -239 318 -321 -641
Average Second-
Order
Operating -173 173 -186 205 -261 -420
Inventory -225 269 -239 319 -321 -644
Combined
Analysis
Operating -172 174 -186 205 -261 -422
Inventory -224 269 -239 316 -321 -644
AASHTO (2002),
δb(1.3D + A2(L + I))
Operating -172 182 -186 212 -261 -437
Inventory -224 283 -239 330 -321 -673
AASHTO (2012),
1.3D + δbA2(L + I)
Operating -172 180 -186 210 -261 -434
Inventory -224 281 -239 328 -321 -669
Buckling Analysis,
δb(1.3D + A2(L + I))
Operating -172 183 -186 213 -261 -440
Inventory -224 286 -239 333 -321 -681
Buckling Analysis,
1.3D + δbA2(L + I)
Operating -172 181 -186 211 -261 -436
Inventory -224 284 -239 331 -321 -675
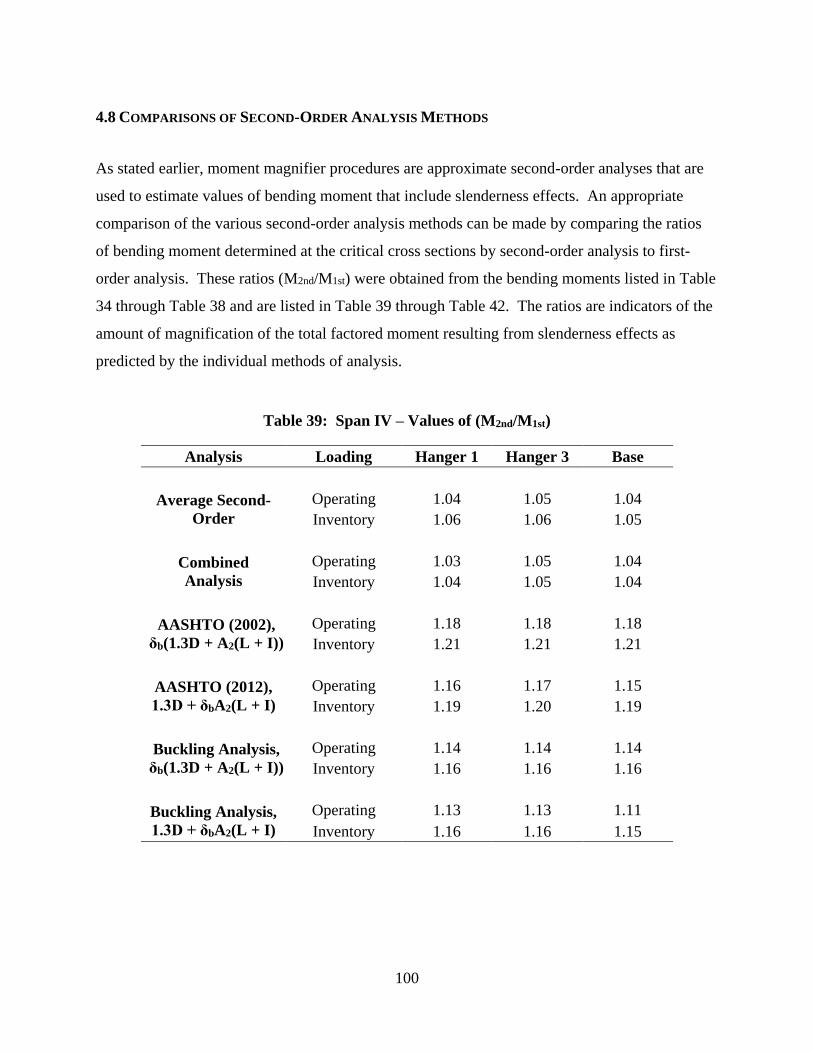
100
4.8 COMPARISONS OF SECOND-ORDER ANALYSIS METHODS
As stated earlier, moment magnifier procedures are approximate second-order analyses that are
used to estimate values of bending moment that include slenderness effects. An appropriate
comparison of the various second-order analysis methods can be made by comparing the ratios
of bending moment determined at the critical cross sections by second-order analysis to first-
order analysis. These ratios (M2nd/M1st) were obtained from the bending moments listed in Table
34 through Table 38 and are listed in Table 39 through Table 42. The ratios are indicators of the
amount of magnification of the total factored moment resulting from slenderness effects as
predicted by the individual methods of analysis.
Table 39: Span IV – Values of (M2nd/M1st)
Analysis Loading Hanger 1 Hanger 3 Base
Average Second-
Order
Operating 1.04 1.05 1.04
Inventory 1.06 1.06 1.05
Combined
Analysis
Operating 1.03 1.05 1.04
Inventory 1.04 1.05 1.04
AASHTO (2002),
δb(1.3D + A2(L + I))
Operating 1.18 1.18 1.18
Inventory 1.21 1.21 1.21
AASHTO (2012),
1.3D + δbA2(L + I)
Operating 1.16 1.17 1.15
Inventory 1.19 1.20 1.19
Buckling Analysis,
δb(1.3D + A2(L + I))
Operating 1.14 1.14 1.14
Inventory 1.16 1.16 1.16
Buckling Analysis,
1.3D + δbA2(L + I)
Operating 1.13 1.13 1.11
Inventory 1.16 1.16 1.15

101
Table 40: Span V – Values of (M2nd/M1st)
Analysis Loading Hanger 1 Hanger 3 Base
Average Second-
Order
Operating 1.05 1.06 1.03
Inventory 1.06 1.06 1.04
Combined
Analysis
Operating 1.04 1.05 1.03
Inventory 1.04 1.06 1.04
AASHTO (2002),
δb(1.3D + A2(L + I))
Operating 1.21 1.21 1.21
Inventory 1.24 1.24 1.24
AASHTO (2012),
1.3D + δbA2(L + I)
Operating 1.19 1.20 1.18
Inventory 1.23 1.24 1.22
Buckling Analysis,
δb(1.3D + A2(L + I))
Operating 1.15 1.15 1.15
Inventory 1.17 1.17 1.17
Buckling Analysis,
1.3D + δbA2(L + I)
Operating 1.13 1.14 1.12
Inventory 1.16 1.17 1.15

102
Table 41: Span VI – Values of (M2nd/M1st)
Analysis Loading Hanger 1 Hanger 3 Base
Average Second-
Order
Operating 1.03 1.04 1.02
Inventory 1.05 1.04 1.02
Combined
Analysis
Operating 1.02 1.04 1.02
Inventory 1.03 1.04 1.03
AASHTO (2002),
δb(1.3D + A2(L + I))
Operating 1.15 1.15 1.15
Inventory 1.18 1.18 1.18
AASHTO (2012),
1.3D + δbA2(L + I)
Operating 1.14 1.14 1.13
Inventory 1.17 1.17 1.16
Buckling Analysis,
δb(1.3D + A2(L + I))
Operating 1.11 1.11 1.11
Inventory 1.13 1.13 1.13
Buckling Analysis,
1.3D + δbA2(L + I)
Operating 1.10 1.10 1.10
Inventory 1.12 1.12 1.12
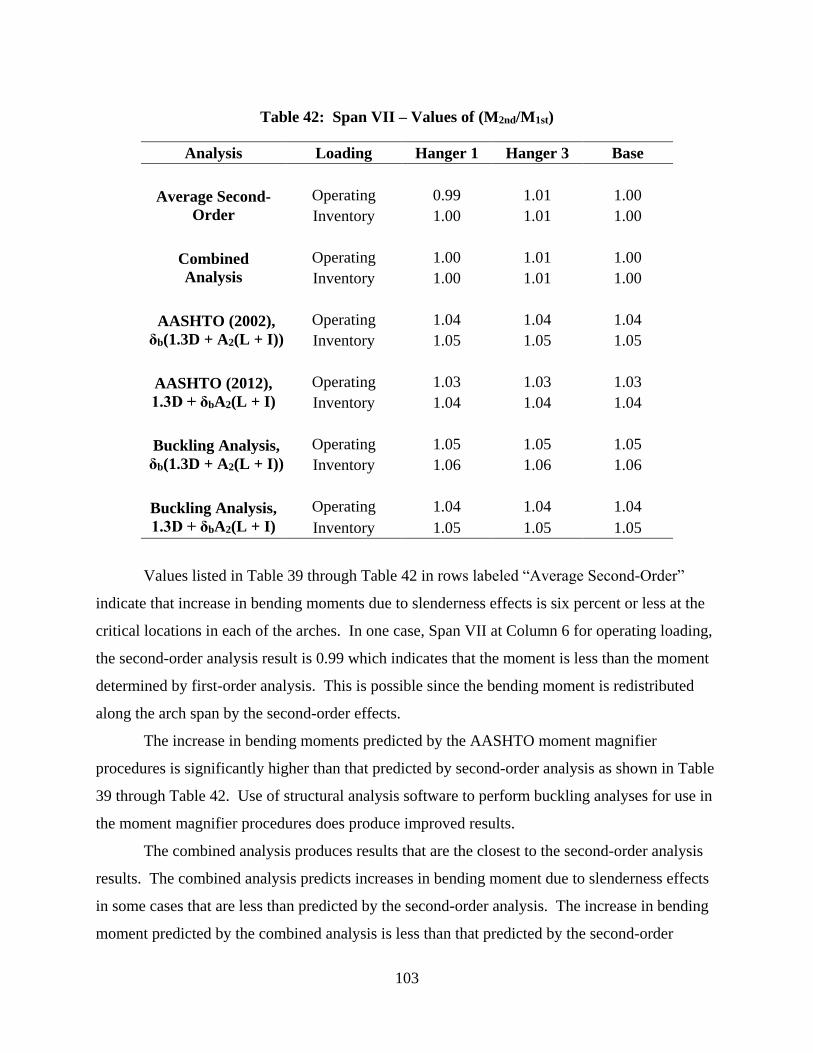
103
Table 42: Span VII – Values of (M2nd/M1st)
Analysis Loading Hanger 1 Hanger 3 Base
Average Second-
Order
Operating 0.99 1.01 1.00
Inventory 1.00 1.01 1.00
Combined
Analysis
Operating 1.00 1.01 1.00
Inventory 1.00 1.01 1.00
AASHTO (2002),
δb(1.3D + A2(L + I))
Operating 1.04 1.04 1.04
Inventory 1.05 1.05 1.05
AASHTO (2012),
1.3D + δbA2(L + I)
Operating 1.03 1.03 1.03
Inventory 1.04 1.04 1.04
Buckling Analysis,
δb(1.3D + A2(L + I))
Operating 1.05 1.05 1.05
Inventory 1.06 1.06 1.06
Buckling Analysis,
1.3D + δbA2(L + I)
Operating 1.04 1.04 1.04
Inventory 1.05 1.05 1.05
Values listed in Table 39 through Table 42 in rows labeled “Average Second-Order”
indicate that increase in bending moments due to slenderness effects is six percent or less at the
critical locations in each of the arches. In one case, Span VII at Column 6 for operating loading,
the second-order analysis result is 0.99 which indicates that the moment is less than the moment
determined by first-order analysis. This is possible since the bending moment is redistributed
along the arch span by the second-order effects.
The increase in bending moments predicted by the AASHTO moment magnifier
procedures is significantly higher than that predicted by second-order analysis as shown in Table
39 through Table 42. Use of structural analysis software to perform buckling analyses for use in
the moment magnifier procedures does produce improved results.
The combined analysis produces results that are the closest to the second-order analysis
results. The combined analysis predicts increases in bending moment due to slenderness effects
in some cases that are less than predicted by the second-order analysis. The increase in bending
moment predicted by the combined analysis is less than that predicted by the second-order

104
analysis because a linear analysis at a reduced stiffness is used for the live load component of the
total loading. The reduction in stiffness associated with the axial load due to live load is not
accounted for in the combined analysis.
The amount by which the combined analysis underestimates the increase in bending
moment due to slenderness effects is acceptably small for use in determining bridge ratings in
light of the potential for error in the comparisons resulting from modeling error, concrete
modulus of elasticity, ultimate creep coefficient, stiffness reduction factor, variations in flexural
rigidity (EI) along the arch, and calculation of the cross section capacities.
4.9 SLENDERNESS EFFECTS IN REINFORCED CONCRETE ARCHES SUMMARY AND CONCLUSION
A summary of procedures available for including slenderness effects in analyses for the load
rating of reinforced concrete arches was presented. These procedures included the use of elastic
second-order analysis, moment magnifiers calculated from elastic buckling analyses, and
moment magnifiers defined by AASHTO (2002) and the AASHTO (2012). When rating factors
for several standard trucks are required for multiple arch spans, the repetition of second-order
analyses to simulate moving truck loading can be impractical. A combined analysis was
investigated where a second-order analysis is performed for the factored dead load and the
resulting structural stiffness is used to perform a linear analysis for truck loading. Since the
analysis for truck loading is linear, moving load analysis procedures commonly available in
structural analysis software can be used to greatly simplify the analysis required for load rating
of the arch. Comparisons of the increase in bending moment resulting from slenderness effects
at critical locations in four different arches were made with results from second-order analyses.
The combined analysis was found to be sufficiently accurate for use in the load rating of
reinforced concrete arch bridges.

105
Chapter 5
RATING RESULTS
This chapter presents the rating results for Spans IV, V, VI, and VII. Ratings are shown for the
operating and inventory case for the eight ALDOT trucks and the AASHTO lane load. The
bridge components for rating include: columns, hangers, transverse deep beams, transverse floor
beams, and arch ribs. For Spans IV, V, and VI, the ratings performed and listed here are for:
Columns 2 and 3, Hanger 1, Transverse Deep Beam, transverse floor beams at Columns 2, 3, and
Hanger 1, and arch rib sections. For Span VII, the ratings performed and listed here are for:
Columns 4, 5, and 7, transverse floor beams at Columns 4 and 5, and arch rib sections.
5.1 SPAN IV RATING RESULTS
The naming convention for Spans IV, V, and VI is shown here again in Figure 61 for
convenience. For Span IV, the ratings are presented for Column 2, Column 3, Hanger 1,
Transverse Deep Beam, transverse floor beams at Column 2, Column 3, and at Hanger 1, and
arch rib sections.

106
Figure 61: Spans IV, V, and VI East End Naming Convention (SAP 2013) (Duplicate -
Figure 5)
5.1.1 Column 2
Ratings are provided for the interior and exterior Column 2s as shown in Table 43 and Table 44,
respectively. Ratings were calculated using the Beam and Column 2 model presented in Section
3.5.3. The interior columns are under axial compression for dead and live loads. The exterior
columns are in tension under live loads. As a result, rating factors for the exterior columns are
lower than the interior columns.
Symmetry

107
Table 43: Span IV - Interior Column 2 Rating Factors
Trucks Rating Factors
Operating Inventory
Tri-Axle 3.06 1.83
H-Truck 4.43 2.66
Two-Axle 4.33 2.60
Concrete 3.47 2.08
18-Wheeler 4.95 2.97
6-Axle 4.22 2.53
School Bus 8.35 5.00
HS-Truck 4.43 2.66
Table 44: Span IV - Exterior Column 2 Rating Factors
5.1.2 Column 3
Ratings are provided for the interior and exterior Column 3s as shown in Table 45 and Table 46,
respectively. Ratings were calculated using the Beam and Column 3 model presented in Section
3.5.4. Unlike Column 2, where the exterior Column 2 was in tension under live loads, both the
interior and exterior Column 3s are under compression for dead and live loads. Rating factors
for the exterior columns are lower than for the interior columns.
Trucks Rating Factors
Operating Inventory
Tri-Axle 2.58 1.55
H-Truck 3.75 2.24
Two-Axle 3.66 2.19
Concrete 2.93 1.75
18-Wheeler 4.18 2.51
6-Axle 3.56 2.13
School Bus 7.05 4.22
HS-Truck 3.75 2.24

108
Table 45: Span IV - Interior Column 3 Rating Factors
Trucks Rating Factors
Operating Inventory
Tri-Axle 2.31 1.38
H-Truck 3.34 2.00
Two-Axle 3.27 1.96
Concrete 2.61 1.57
18-Wheeler 3.73 2.24
6-Axle 3.19 1.91
School Bus 6.29 3.77
HS-Truck 3.34 2.00
Table 46: Span IV - Exterior Column 3 Rating Factors
Trucks Rating Factors
Operating Inventory
Tri-Axle 1.86 1.12
H-Truck 2.69 1.61
Two-Axle 2.63 1.58
Concrete 2.10 1.26
18-Wheeler 3.01 1.80
6-Axle 2.57 1.54
School Bus 5.07 3.04
HS-Truck 2.69 1.61
5.1.3 Hanger 1
Ratings are provided for the hangers as shown in Table 47. Ratings were calculated using the
Beam and Hanger 1 model presented in Section 3.5.6.1. It was decided from the longitudinal
beam analysis that Hanger 1 carries the highest tension axial load from the truck loadings. Thus,
only Hanger 1 was rated for axial tension since all hangers have the same capacity.

109
Table 47: Span IV - Hanger 1 Rating Factors
Trucks Rating Factors
Operating Inventory
Tri-Axle 1.13 0.68
H-Truck 1.60 0.96
Two-Axle 1.50 0.90
Concrete 1.20 0.72
18-Wheeler 1.71 1.03
6-Axle 1.59 0.96
School Bus 3.05 1.83
HS-Truck 1.52 0.91
5.1.4 Transverse Deep Beam
Ratings are provided for the Transverse Deep Beam as shown in Table 48. Ratings were
calculated using the Transverse Deep Beam model presented in Section 3.5.7. The Transverse
Deep Beam was rated for bending moment and shear; and, the bending moment controls the
rating.
Table 48: Span IV - Transverse Deep Beam Rating Factors
Trucks
Rating Factors
Bending Moment Shear
Operating Inventory Operating Inventory
Tri-Axle 1.21 0.72 2.36 1.41
H-Truck 1.75 1.05 3.42 2.05
Two-Axle 1.71 1.03 3.34 2.00
Concrete 1.37 0.82 2.67 1.60
18-Wheeler 1.96 1.17 3.82 2.29
6-Axle 1.67 1.00 3.25 1.95
School Bus 3.30 1.98 6.44 3.86
HS-Truck 1.75 1.05 3.42 2.05

110
5.1.5 Transverse Floor Beams
The transverse floor beams were rated for bending moment and shear. For shear ratings,
transverse floor beams were discretized into three zones. The transverse floor beams at column
locations were rated for positive bending moment, negative bending moment, and shear. The
transverse floor beams at hanger locations were rated for positive bending moment and shear.
Negative bending moment in the hanger is not rated because the hangers are assumed to have no
flexural rigidity. The controlling positive bending moment and shear ratings are at the transverse
floor beam at Hanger 1 location and are shown in Section 5.1.5.3. The controlling negative
bending moment rating is at the transverse floor beam at Column 2 location and is shown in the
following section. For completeness, full rating results are provided for transverse beam at
Columns 2 and 3 are in Appendix A2.1 and A2.2.
5.1.5.1 Transverse Floor Beam at Column 2
The transverse floor beam at Column 2 controls the rating for negative bending moment and is
shown in Table 49. Ratings were calculated using the transverse floor beam model presented in
Section 3.5.3. For completeness, full rating results are provided for the transverse floor beam at
Column 2 in Appendix A2.1.
Table 49: Span IV - Transverse Floor Beam at Column 2 Rating Factors
Trucks
Rating Factors
Negative Moment
Operating Inventory
Tri-Axle 7.44 4.46
H-Truck 10.78 6.46
Two-Axle 10.53 6.31
Concrete 8.43 5.05
18-Wheeler 12.04 7.21
6-Axle 10.25 6.14
School Bus 20.29 12.15
HS-Truck 10.78 6.46
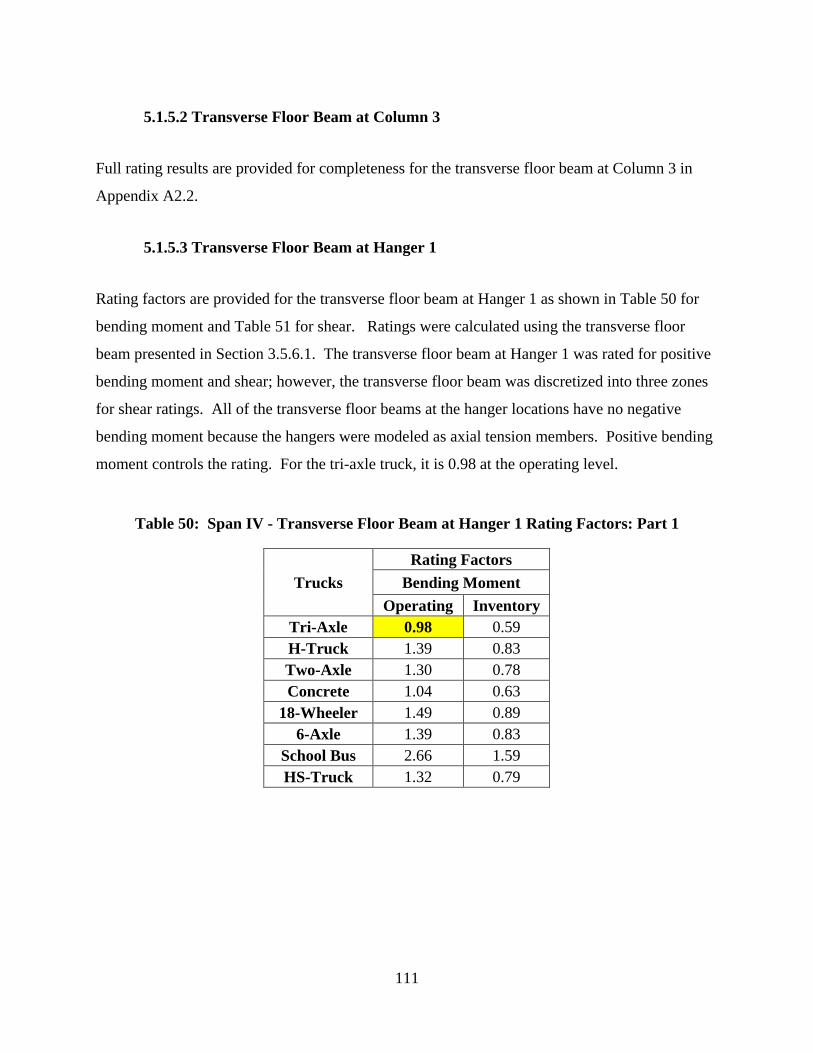
111
5.1.5.2 Transverse Floor Beam at Column 3
Full rating results are provided for completeness for the transverse floor beam at Column 3 in
Appendix A2.2.
5.1.5.3 Transverse Floor Beam at Hanger 1
Rating factors are provided for the transverse floor beam at Hanger 1 as shown in Table 50 for
bending moment and Table 51 for shear. Ratings were calculated using the transverse floor
beam presented in Section 3.5.6.1. The transverse floor beam at Hanger 1 was rated for positive
bending moment and shear; however, the transverse floor beam was discretized into three zones
for shear ratings. All of the transverse floor beams at the hanger locations have no negative
bending moment because the hangers were modeled as axial tension members. Positive bending
moment controls the rating. For the tri-axle truck, it is 0.98 at the operating level.
Table 50: Span IV - Transverse Floor Beam at Hanger 1 Rating Factors: Part 1
Trucks
Rating Factors
Bending Moment
Operating Inventory
Tri-Axle 0.98 0.59
H-Truck 1.39 0.83
Two-Axle 1.30 0.78
Concrete 1.04 0.63
18-Wheeler 1.49 0.89
6-Axle 1.39 0.83
School Bus 2.66 1.59
HS-Truck 1.32 0.79

112
Table 51: Span IV - Transverse Floor Beam at Hanger 1 Rating Factors: Part 2
Trucks
Rating Factors
Vzone1 Vzone2 Vzone3
Operating Inventory Operating Inventory Operating Inventory
Tri-Axle 1.48 0.89 1.05 0.63 1.17 0.70
H-Truck 2.10 1.26 1.49 0.89 1.65 0.99
Two-Axle 1.97 1.18 1.40 0.84 1.55 0.93
Concrete 1.58 0.94 1.12 0.67 1.24 0.74
18-Wheeler 2.25 1.35 1.60 0.96 1.77 1.06
6-Axle 2.10 1.26 1.49 0.89 1.65 0.99
School Bus 4.01 2.40 2.85 1.71 3.17 1.90
HS-Truck 2.00 1.20 1.42 0.85 1.58 0.95
5.1.6 Arch Rib
Rating factors are provided for the arch rib at seven locations as pointed out in Figure 62.
Critical sections were determined by looking at the qualitative and quantitative output diagrams
for the shear, bending moment, and axial load from SAP2000. Ratings were provided for one-
half of the arch rib since the span is symmetrical. Ratings were calculated using the arch rib
model presented in Section 3.6.4. The arch rib sections were rated for shear and the combination
of axial load and bending moment. Ratings for the lane loading are provided in addition to
ratings for the eight standard trucks.
Rating factors for Sections A1, A2, A3, A8, A14, A21, and A41 are shown in Table 52
through Table 58. All operating ratings are greater than 1.0. The combination of axial load and
bending moment controlled the ratings. The lowest rating factor is for the tri-axle truck, and it is
at arch Section A2.
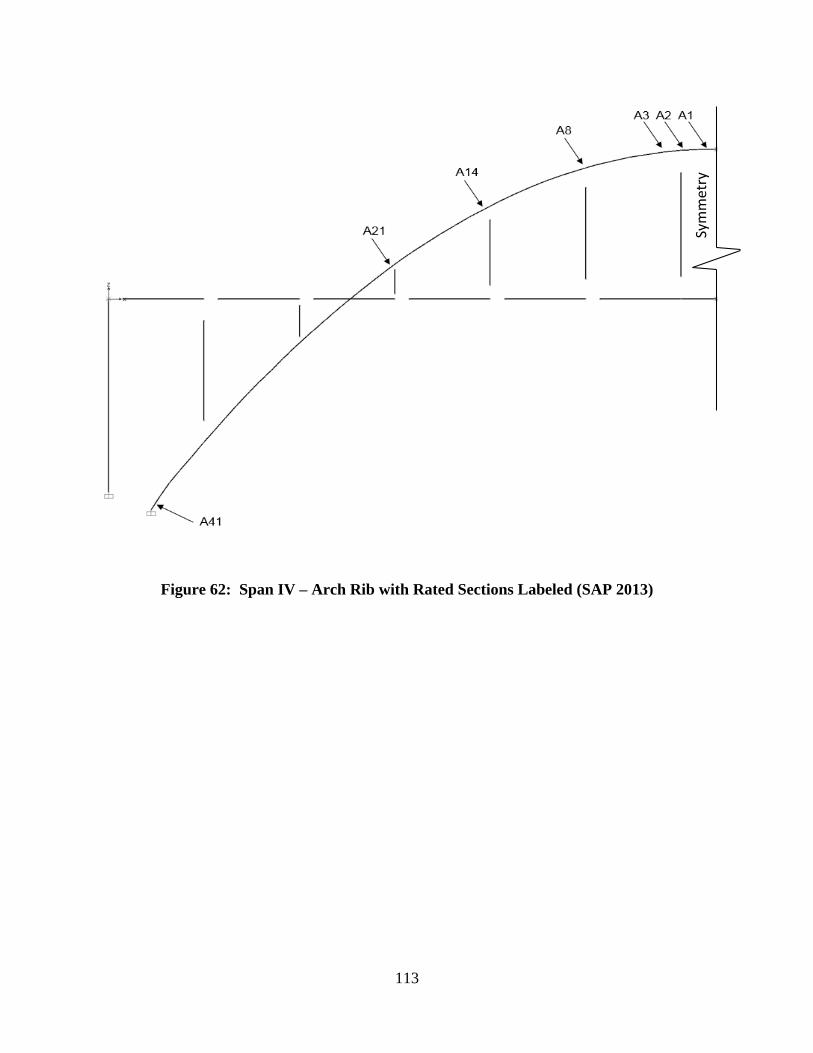
113
Figure 62: Span IV – Arch Rib with Rated Sections Labeled (SAP 2013)
Symmetry

114
Table 52: Span IV - Arch Section A1 Rating Factors
Trucks
Rating Factors
Axial and Moment Shear
Operating Inventory Operating Inventory
Tri-Axle 1.31 0.79 2.06 1.24
H-Truck 1.87 1.12 3.48 2.09
Two-Axle 1.77 1.06 2.69 1.61
Concrete 1.40 0.84 2.30 1.38
18-Wheeler 2.08 1.24 2.78 1.67
6-Axle 1.97 1.18 2.58 1.55
School Bus 3.78 2.27 6.29 3.77
HS-Truck 1.68 1.01 2.33 1.40
HS Lane - M 3.86 2.31 6.75 4.04
HS Lane - V 2.61 1.56 4.77 2.86
Table 53: Span IV - Arch Section A2 Rating Factors
Trucks
Rating Factors
Axial and Moment Shear
Operating Inventory Operating Inventory
Tri-Axle 1.03 0.62 1.14 0.69
H-Truck 1.51 0.91 1.61 0.96
Two-Axle 1.38 0.83 1.44 0.87
Concrete 1.11 0.66 1.21 0.73
18-Wheeler 1.62 0.97 1.52 0.91
6-Axle 1.55 0.93 1.48 0.89
School Bus 3.05 1.83 2.96 1.77
HS-Truck 1.29 0.77 1.26 0.75
HS Lane - M 3.06 1.83 2.36 1.41
HS Lane - V 2.08 1.25 1.76 1.06
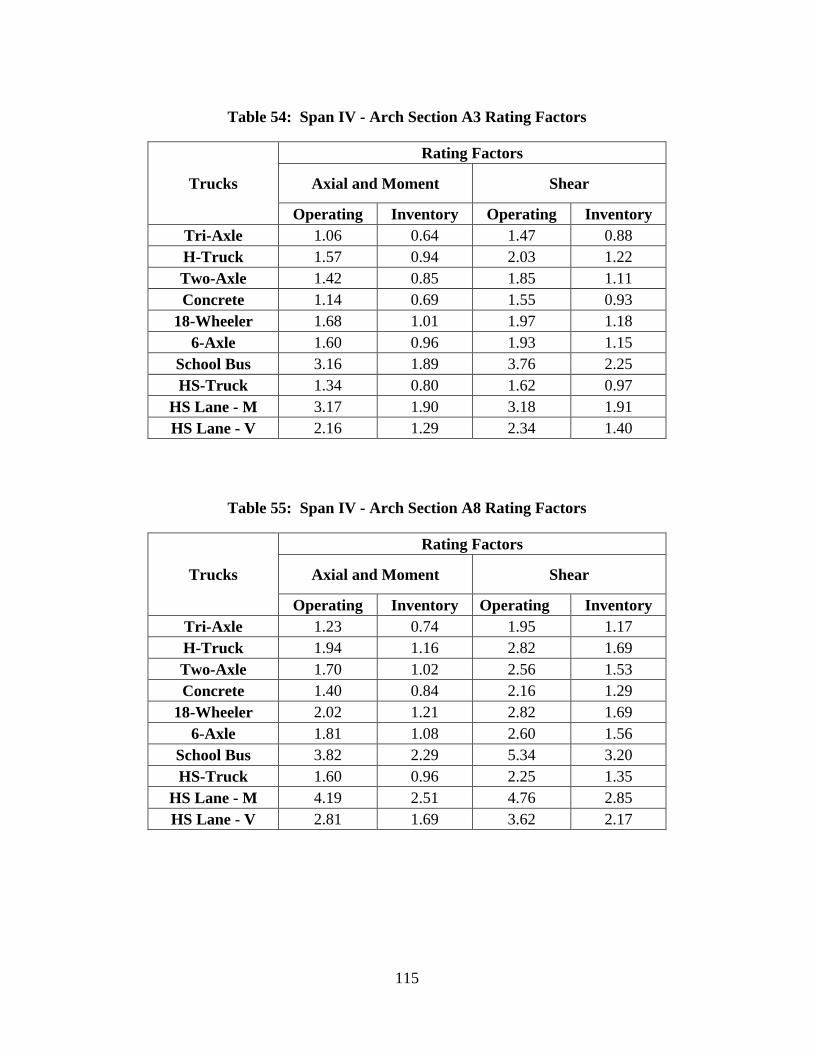
115
Table 54: Span IV - Arch Section A3 Rating Factors
Trucks
Rating Factors
Axial and Moment Shear
Operating Inventory Operating Inventory
Tri-Axle 1.06 0.64 1.47 0.88
H-Truck 1.57 0.94 2.03 1.22
Two-Axle 1.42 0.85 1.85 1.11
Concrete 1.14 0.69 1.55 0.93
18-Wheeler 1.68 1.01 1.97 1.18
6-Axle 1.60 0.96 1.93 1.15
School Bus 3.16 1.89 3.76 2.25
HS-Truck 1.34 0.80 1.62 0.97
HS Lane - M 3.17 1.90 3.18 1.91
HS Lane - V 2.16 1.29 2.34 1.40
Table 55: Span IV - Arch Section A8 Rating Factors
Trucks
Rating Factors
Axial and Moment Shear
Operating Inventory Operating Inventory
Tri-Axle 1.23 0.74 1.95 1.17
H-Truck 1.94 1.16 2.82 1.69
Two-Axle 1.70 1.02 2.56 1.53
Concrete 1.40 0.84 2.16 1.29
18-Wheeler 2.02 1.21 2.82 1.69
6-Axle 1.81 1.08 2.60 1.56
School Bus 3.82 2.29 5.34 3.20
HS-Truck 1.60 0.96 2.25 1.35
HS Lane - M 4.19 2.51 4.76 2.85
HS Lane - V 2.81 1.69 3.62 2.17

116
Table 56: Span IV - Arch Section A14 Rating Factors
Trucks
Rating Factors
Axial and Moment Shear
Operating Inventory Operating Inventory
Tri-Axle 1.12 0.67 2.10 1.26
H-Truck 1.78 1.06 3.37 2.02
Two-Axle 1.54 0.92 2.76 1.65
Concrete 1.27 0.76 2.31 1.38
18-Wheeler 1.81 1.08 3.25 1.95
6-Axle 1.64 0.98 2.99 1.79
School Bus 3.51 2.10 6.41 3.84
HS-Truck 1.43 0.86 2.46 1.47
HS Lane - M 3.92 2.35 5.06 3.03
HS Lane - V 2.61 1.56 3.80 2.28
Table 57: Span IV - Arch Section A21 Rating Factors
Trucks
Rating Factors
Axial and Moment Shear
Operating Inventory Operating Inventory
Tri-Axle 1.46 0.87 2.03 1.22
H-Truck 2.28 1.36 3.28 1.97
Two-Axle 2.03 1.22 2.68 1.60
Concrete 1.65 0.99 2.24 1.34
18-Wheeler 2.48 1.48 3.16 1.89
6-Axle 2.24 1.34 2.89 1.73
School Bus 4.60 2.75 6.25 3.75
HS-Truck 1.95 1.17 2.37 1.42
HS Lane - M 4.90 2.93 5.25 3.14
HS Lane - V 3.29 1.97 3.90 2.34

117
Table 58: Span IV - Arch Section A41 Rating Factors
Trucks
Rating Factors
Axial and Moment Shear
Operating Inventory Operating Inventory
Tri-Axle 1.31 0.78 3.34 2.00
H-Truck 2.33 1.39 5.68 3.41
Two-Axle 1.73 1.04 4.42 2.65
Concrete 1.49 0.89 3.75 2.25
18-Wheeler 1.84 1.10 4.01 2.40
6-Axle 1.80 1.08 3.85 2.30
School Bus 4.31 2.58 10.69 6.40
HS-Truck 1.47 0.88 3.85 2.31
HS Lane - M 7.08 4.24 8.53 5.11
HS Lane - V 4.49 2.69 6.79 4.07

118
5.2 SPAN V RATING RESULTS
For Span V, the ratings are presented for Columns 2 and 3, Hanger 1, Transverse Deep Beam,
transverse floor beams at Column 2 and 3 and at Hanger 1, and arch rib sections.
5.2.1 Column 2
Ratings are provided for the interior and exterior Column 2s as shown in Table 59 and Table 60,
respectively. Ratings were calculated using the Beam and Column 2 model presented in Section
3.5.3. The interior columns are under axial compression for dead and live loads. The exterior
columns are in tension under live loads.
Table 59: Span V - Interior Column 2 Rating Factors
Trucks Rating Factors
Operating Inventory
Tri-Axle 3.05 1.83
H-Truck 4.40 2.64
Two-Axle 4.32 2.59
Concrete 3.46 2.07
18-Wheeler 4.94 2.96
6-Axle 4.21 2.52
School Bus 8.29 4.96
HS-Truck 4.40 2.64

119
Table 60: Span V - Exterior Column 2 Rating Factors
5.2.2 Column 3
Ratings are provided for the interior and exterior Column 3s as shown in Table 61 and Table 62,
respectively. Ratings were calculated using the Beam and Column 3 model presented in Section
3.5.4. Unlike Column 2, where the exterior Column 2 was in tension under live loads, both the
interior and exterior Column 3s are under compression for dead and live loads. Rating factors
for the exterior columns are lower than for the interior columns.
Table 61: Span V - Interior Column 3 Rating Factors
Trucks Rating Factors
Operating Inventory
Tri-Axle 2.47 1.48
H 3.58 2.14
Two-Axle 3.50 2.09
Concrete 2.80 1.68
18-Wheeler 4.00 2.39
6-Axle 3.41 2.05
School Bus 6.74 4.04
HS-Truck 3.58 2.14
Trucks Rating Factors
Operating Inventory
Tri-Axle 2.55 1.53
H-Truck 3.67 2.20
Two-Axle 3.61 2.16
Concrete 2.88 1.73
18-Wheeler 4.12 2.47
6-Axle 3.52 2.11
School Bus 6.92 4.14
HS-Truck 3.67 2.20

120
Table 62: Span V - Exterior Column 3 Rating Factors
Trucks Rating Factors
Operating Inventory
Tri-Axle 1.83 1.10
H 2.64 1.58
Two-Axle 2.58 1.55
Concrete 2.07 1.24
18-Wheeler 2.95 1.77
6-Axle 2.52 1.51
School Bus 4.98 2.98
HS-Truck 2.64 1.58
5.2.3 Hanger 1
Ratings are provided for the hangers as shown in Table 63. Ratings were calculated using the
Beam and Hanger 1 model presented in Section 3.5.6.1. It was decided from the longitudinal
beam analysis that Hanger 1 carries the highest tension axial load from the truck loadings. Thus,
only Hanger 1 was rated for axial tension since all hangers have the same capacity.
Table 63: Span V - Hanger 1 Rating Factors
Trucks Rating Factors
Operating Inventory
Tri-Axle 1.12 0.67
H-Truck 1.59 0.95
Two-Axle 1.49 0.89
Concrete 1.19 0.71
18-Wheeler 1.70 1.02
6-Axle 1.59 0.95
School Bus 3.02 1.81
HS-Truck 1.53 0.91

121
5.2.4 Transverse Deep Beam
Ratings are provided for the Transverse Deep Beam as shown in Table 64. Ratings were
calculated using the Transverse Deep Beam model presented in Section 3.5.7. The Transverse
Deep Beam was rated for bending moment and shear; and, the bending moment controls the
rating.
Table 64: Span V - Transverse Deep Beam Rating Factors
Trucks
Rating Factors
Bending Moment Shear
Operating Inventory Operating Inventory
Tri-Axle 1.06 0.64 2.16 1.30
H-Truck 1.53 0.92 3.12 1.87
Two-Axle 1.50 0.90 3.06 1.83
Concrete 1.20 0.72 2.45 1.47
18-Wheeler 1.72 1.03 3.49 2.09
6-Axle 1.47 0.88 2.98 1.79
School Bus 2.88 1.73 5.86 3.51
HS-Truck 1.53 0.92 3.12 1.87
5.2.5 Transverse Floor Beams
The transverse floor beams were rated for bending moment and shear. For shear ratings,
transverse floor beams were discretized into three zones. The transverse floor beams at column
locations were rated for positive and negative bending moment and shear. The transverse floor
beams at hanger locations were rated for positive bending moment and shear. Negative bending
moment in the hanger is not rated because the hangers are assumed to have no flexural rigidity.
The controlling positive bending moment and shear ratings are at the transverse floor beam at
Hanger 1 location and are shown in Section 5.2.5.3. The controlling negative bending moment
rating is at the transverse floor beam at Column 2 location and is shown in the following section.
For completeness, full rating results are provided for transverse beam at Columns 2 and 3 in
Appendix B2.1 and B2.2.

122
5.2.5.1 Transverse Floor Beam at Column 2
The transverse floor beam at Column 2 controls the rating for negative bending moment for all
transverse floor beams and is shown in Table 65. Ratings were calculated using the transverse
floor beam model presented in Section 3.5.3. For completeness, full rating results are provided
for the transverse floor beam at Column 2 in Appendix B2.1.
Table 65: Span V - Transverse Floor Beam at Column 2 Rating Factors
Trucks
Rating Factors
Negative Moment
Operating Inventory
Tri-Axle 7.30 4.37
H-Truck 10.52 6.30
Two-Axle 10.33 6.19
Concrete 8.26 4.95
18-Wheeler 11.80 7.07
6-Axle 10.07 6.03
School Bus 19.81 11.87
HS-Truck 10.52 6.30
5.2.5.2 Transverse Floor Beam at Column 3
Full rating results are provided for completeness for the transverse floor beam at Column 3 in
Appendix B2.2.
5.2.5.3 Transverse Floor Beam at Hanger 1
The positive bending moment and shear at Hanger 1 location controls the rating for all transverse
floor beams. Full rating results are provided for the transverse floor beam at Hanger 1 as shown
in Table 66 for bending moment and Table 67 for shear. Ratings were calculated using the
transverse floor beam presented in Section 3.5.6.1. For the tri-axle truck, the positive bending
moment operating rating factor is 0.99.

123
Table 66: Span V - Transverse Floor Beam at Hanger 1 Rating Factors: Part 1
Trucks
Rating Factors
Bending Moment
Operating Inventory
Tri-Axle 0.99 0.59
H-Truck 1.39 0.83
Two-Axle 1.31 0.78
Concrete 1.04 0.63
18-Wheeler 1.49 0.89
6-Axle 1.39 0.84
School Bus 2.66 1.59
HS-Truck 1.34 0.80
Table 67: Span V - Transverse Floor Beam at Hanger 1 Rating Factors: Part 2
Trucks
Rating Factors
Vzone1 Vzone2 Vzone3
Operating Inventory Operating Inventory Operating Inventory
Tri-Axle 1.48 0.89 1.06 0.63 1.17 0.70
H-Truck 2.10 1.26 1.49 0.89 1.66 0.99
Two-Axle 1.97 1.18 1.40 0.84 1.55 0.93
Concrete 1.57 0.94 1.12 0.67 1.24 0.74
18-Wheeler 2.25 1.35 1.60 0.96 1.77 1.06
6-Axle 2.10 1.26 1.49 0.89 1.66 0.99
School Bus 4.00 2.40 2.84 1.70 3.16 1.89
HS-Truck 2.02 1.21 1.43 0.86 1.59 0.95
5.2.6 Arch Rib
Rating factors are provided for the arch rib at seven locations as pointed out in Figure 63.
Critical sections were determined by looking at the qualitative and quantitative output diagrams
for the shear, bending moment, and axial load from SAP2000. Ratings were provided for one-
half of the arch rib since the span is symmetrical. Ratings were calculated using the arch rib
model presented in Section 3.6.4. The arch rib sections were rated for shear and the combination

124
of axial load and bending moment. Ratings for the lane loading are provided in addition to
ratings for the eight standard trucks.
Rating factors for Sections A1, A2, A3, A8, A14, A20, and A40 are shown in Table 68
through Table 74. All operating ratings are 1.0 and above except for arch Section A2 where the
combination of axial load and bending moment has an operating rating of 0.96. The combination
of axial load and bending moment controlled the ratings. The tri-axle truck has the lowest rating
factor, and it is at arch Section A2.
Figure 63: Span V - Arch Rib with Rated Sections Labeled (SAP 2013)
Symmetry

125
Table 68: Span V - Arch Section A1 Rating Factors
Trucks
Rating Factors
Axial and Moment Shear
Operating Inventory Operating Inventory
Tri-Axle 1.24 0.74 2.03 1.22
H-Truck 1.75 1.05 3.42 2.05
Two-Axle 1.66 1.00 2.65 1.59
Concrete 1.31 0.79 2.26 1.35
18-Wheeler 1.94 1.16 2.77 1.66
6-Axle 1.84 1.10 2.57 1.54
School Bus 3.53 2.11 6.20 3.71
HS-Truck 1.58 0.95 2.30 1.38
HS Lane - M 3.56 2.13 6.70 4.02
HS Lane - V 2.41 1.45 4.72 2.83
Table 69: Span V - Arch Section A2 Rating Factors
Trucks
Rating Factors
Axial and Moment Shear
Operating Inventory Operating Inventory
Tri-Axle 0.96 0.58 1.06 0.63
H-Truck 1.41 0.85 1.48 0.89
Two-Axle 1.29 0.77 1.34 0.80
Concrete 1.04 0.62 1.12 0.67
18-Wheeler 1.52 0.91 1.42 0.85
6-Axle 1.45 0.87 1.38 0.83
School Bus 2.86 1.71 2.74 1.64
HS-Truck 1.22 0.73 1.17 0.70
HS Lane - M 2.83 1.70 2.17 1.30
HS Lane - V 1.93 1.16 1.63 0.97

126
Table 70: Span V - Arch Section A3 Rating Factors
Trucks
Rating Factors
Axial and Moment Shear
Operating Inventory Operating Inventory
Tri-Axle 1.00 0.60 1.41 0.85
H-Truck 1.46 0.88 1.94 1.16
Two-Axle 1.34 0.80 1.78 1.07
Concrete 1.07 0.64 1.49 0.89
18-Wheeler 1.57 0.94 1.91 1.14
6-Axle 1.50 0.90 1.87 1.12
School Bus 2.97 1.78 3.61 2.16
HS-Truck 1.26 0.75 1.56 0.93
HS Lane - M 2.95 1.77 3.05 1.83
HS Lane - V 2.01 1.20 2.24 1.34
Table 71: Span V - Arch Section A8 Rating Factors
Trucks
Rating Factors
Axial and Moment Shear
Operating Inventory Operating Inventory
Tri-Axle 1.16 0.69 2.01 1.20
H-Truck 1.81 1.08 3.29 1.97
Two-Axle 1.60 0.96 2.63 1.57
Concrete 1.32 0.79 2.22 1.33
18-Wheeler 1.92 1.15 2.87 1.72
6-Axle 1.71 1.02 2.65 1.59
School Bus 3.58 2.14 6.06 3.63
HS-Truck 1.52 0.91 2.32 1.39
HS Lane - M 3.85 2.31 4.86 2.91
HS Lane - V 2.60 1.55 3.68 2.20

127
Table 72: Span V - Arch Section A14 Rating Factors
Trucks
Rating Factors
Axial and Moment Shear
Operating Inventory Operating Inventory
Tri-Axle 1.09 0.65 2.22 1.33
H-Truck 1.73 1.04 3.56 2.13
Two-Axle 1.50 0.90 2.93 1.75
Concrete 1.24 0.74 2.44 1.46
18-Wheeler 1.77 1.06 3.44 2.06
6-Axle 1.60 0.96 3.19 1.91
School Bus 3.42 2.05 6.80 4.07
HS-Truck 1.40 0.84 2.61 1.56
HS Lane - M 3.72 2.23 5.38 3.22
HS Lane - V 2.50 1.50 4.03 2.42
Table 73: Span V - Arch Section A20 Rating Factors
Trucks
Rating Factors
Axial and Moment Shear
Operating Inventory Operating Inventory
Tri-Axle 1.47 0.88 2.07 1.24
H-Truck 2.27 1.36 3.34 2.00
Two-Axle 2.04 1.22 2.74 1.64
Concrete 1.66 1.00 2.28 1.37
18-Wheeler 2.49 1.49 3.22 1.93
6-Axle 2.24 1.34 2.97 1.78
School Bus 4.57 2.74 6.38 3.82
HS-Truck 1.97 1.18 2.43 1.46
HS Lane - M 5.50 3.29 5.35 3.20
HS Lane - V 3.28 1.96 3.97 2.38

128
Table 74: Span V - Arch Section A40 Rating Factors
Trucks
Rating Factors
Axial and Moment Shear
Operating Inventory Operating Inventory
Tri-Axle 1.25 0.75 3.30 1.98
H-Truck 2.23 1.34 5.63 3.37
Two-Axle 1.66 1.00 4.37 2.62
Concrete 1.43 0.85 3.71 2.22
18-Wheeler 1.79 1.07 4.23 2.54
6-Axle 1.74 1.04 4.07 2.44
School Bus 4.16 2.49 10.57 6.33
HS-Truck 1.41 0.85 3.81 2.28
HS Lane - M 6.55 3.92 9.53 5.71
HS Lane - V 4.22 2.53 7.50 4.49

129
5.3 SPAN VI RATING RESULTS
For Span VI, the ratings are presented for Column 2, Column 3, Hanger 1, Transverse Deep
Beam, transverse floor beams at Column 2, at Column 2, and at Hanger 1, and arch rib sections.
5.3.1 Column 2
Ratings are provided for the interior and exterior Column 2s as shown in Table 75 and Table 76,
respectively. Ratings were calculated using the Beam and Column 2 model presented in Section
3.5.3. The interior columns are under axial compression for dead and live loads. The exterior
columns are in tension under live loads.
Table 75: Span VI - Interior Column 2 Rating Factors
Trucks Rating Factors
Operating Inventory
Tri-Axle 2.73 1.64
H-Truck 3.83 2.29
Two-Axle 3.84 2.30
Concrete 3.07 1.84
18-Wheeler 4.39 2.63
6-Axle 3.78 2.26
School Bus 7.20 4.32
HS-Truck 3.83 2.29

130
Table 76: Span VI - Exterior Column 2 Rating Factors
5.3.2 Column 3
Ratings are provided for the interior and exterior Column 3s as shown in Table 77 and Table 78,
respectively. Ratings were calculated using the Beam and Column 3 model presented in Section
3.5.4. Unlike Column 2s, where the exterior columns are in tension under live loads, both the
interior and exterior Column 3s are under compression for dead and live loads. Rating factors
for the exterior columns are lower than for the interior columns.
Table 77: Span VI - Interior Column 3 Rating Factors
Trucks Rating Factors
Operating Inventory
Tri-Axle 2.73 1.64
H-Truck 3.89 2.33
Two-Axle 3.82 2.29
Concrete 3.06 1.83
18-Wheeler 4.37 2.62
6-Axle 3.78 2.27
School Bus 7.33 4.39
HS-Truck 3.89 2.33
Trucks Rating Factors
Operating Inventory
Tri-Axle 1.88 1.13
H-Truck 2.64 1.58
Two-Axle 2.64 1.58
Concrete 2.11 1.27
18-Wheeler 3.02 1.81
6-Axle 2.60 1.56
School Bus 4.96 2.97
HS-Truck 2.64 1.58

131
Table 78: Span VI - Exterior Column 3 Rating Factors
Trucks Rating Factors
Operating Inventory
Tri-Axle 1.89 1.13
H-Truck 2.70 1.62
Two-Axle 2.65 1.59
Concrete 2.12 1.27
18-Wheeler 3.03 1.81
6-Axle 2.62 1.57
School Bus 5.08 3.04
HS-Truck 2.70 1.62
5.3.3 Hanger 1
Ratings are provided for the hangers as shown in Table 79. Ratings were calculated using the
Beam and Hanger 1 model presented in Section 3.5.6.1. It was decided from the longitudinal
beam analysis that Hanger 1 carries the highest tension axial load from the truck loadings. Thus,
only Hanger 1 was rated for axial tension since all hangers have the same capacity.
Table 79: Span VI - Hanger 1 Rating Factors
Trucks Rating Factors
Operating Inventory
Tri-Axle 1.08 0.64
H-Truck 1.51 0.90
Two-Axle 1.41 0.84
Concrete 1.13 0.68
18-Wheeler 1.61 0.96
6-Axle 1.53 0.91
School Bus 2.84 1.70
HS-Truck 1.51 0.90
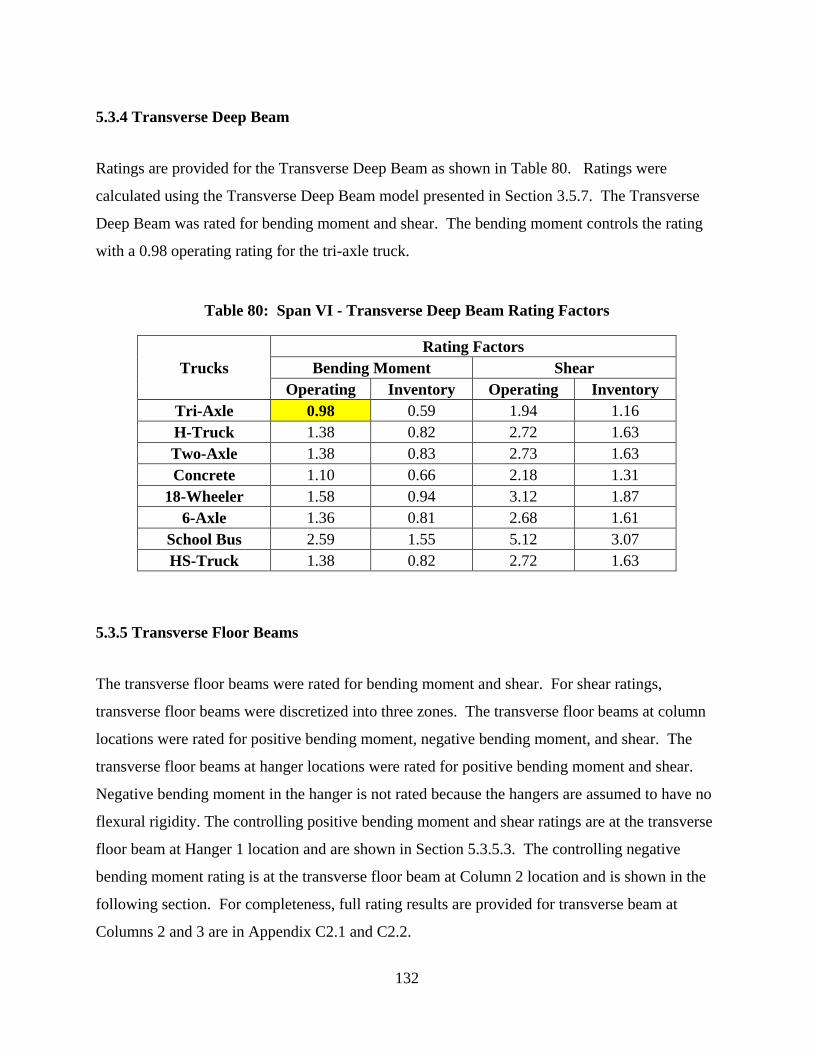
132
5.3.4 Transverse Deep Beam
Ratings are provided for the Transverse Deep Beam as shown in Table 80. Ratings were
calculated using the Transverse Deep Beam model presented in Section 3.5.7. The Transverse
Deep Beam was rated for bending moment and shear. The bending moment controls the rating
with a 0.98 operating rating for the tri-axle truck.
Table 80: Span VI - Transverse Deep Beam Rating Factors
Trucks
Rating Factors
Bending Moment Shear
Operating Inventory Operating Inventory
Tri-Axle 0.98 0.59 1.94 1.16
H-Truck 1.38 0.82 2.72 1.63
Two-Axle 1.38 0.83 2.73 1.63
Concrete 1.10 0.66 2.18 1.31
18-Wheeler 1.58 0.94 3.12 1.87
6-Axle 1.36 0.81 2.68 1.61
School Bus 2.59 1.55 5.12 3.07
HS-Truck 1.38 0.82 2.72 1.63
5.3.5 Transverse Floor Beams
The transverse floor beams were rated for bending moment and shear. For shear ratings,
transverse floor beams were discretized into three zones. The transverse floor beams at column
locations were rated for positive bending moment, negative bending moment, and shear. The
transverse floor beams at hanger locations were rated for positive bending moment and shear.
Negative bending moment in the hanger is not rated because the hangers are assumed to have no
flexural rigidity. The controlling positive bending moment and shear ratings are at the transverse
floor beam at Hanger 1 location and are shown in Section 5.3.5.3. The controlling negative
bending moment rating is at the transverse floor beam at Column 2 location and is shown in the
following section. For completeness, full rating results are provided for transverse beam at
Columns 2 and 3 are in Appendix C2.1 and C2.2.

133
5.3.5.1 Transverse Floor Beam at Column 2
The transverse floor beam at Column 2 controls the rating for negative bending moment for all
transverse floor beams and is shown in Table 81. Ratings were calculated using the transverse
floor beam model presented in Section 3.5.3. For completeness, full rating results are provided
for the transverse floor beam at Column 2 in Appendix C2.1.
Table 81: Span VI - Transverse Floor Beam at Column 2 Rating Factors
Trucks
Rating Factors
Negative Moment
Operating Inventory
Tri-Axle 4.65 2.79
H-Truck 6.52 3.90
Two-Axle 6.53 3.91
Concrete 5.23 3.13
18-Wheeler 7.47 4.47
6-Axle 6.43 3.85
School Bus 12.27 7.35
HS-Truck 6.52 3.90
5.3.5.2 Transverse Floor Beam at Column 3
Full rating results are provided for completeness for the transverse floor beam at Column 3 in
Appendix C2.2.
5.3.5.3 Transverse Floor Beam at Hanger 1
Rating factors are provided for the transverse floor beam at Hanger 1 as shown in Table 82 for
bending moment and Table 83 for shear. Ratings were calculated using the transverse floor
beam presented in Section 3.5.6.1. The transverse floor beam at Hanger 1 was rated for positive
bending moment and shear; however, the transverse floor beam was discretized into three zones
for shear ratings. All of the transverse floor beams at the hanger locations have no negative

134
bending moment because the hangers were modeled as axial tension hangers only. Bending
moment controls the rating. For the tri-axle truck and concrete truck, the bending moment
operating rating factor is 0.93 and 0.97, respectively.
Table 82: Span VI - Transverse Floor Beam at Hanger 1 Rating Factors: Part 1
Trucks
Rating Factors
Bending Moment
Operating Inventory
Tri-Axle 0.93 0.55
H-Truck 1.30 0.78
Two-Axle 1.21 0.73
Concrete 0.97 0.58
18-Wheeler 1.39 0.83
6-Axle 1.31 0.79
School Bus 2.44 1.46
HS-Truck 1.30 0.78
Table 83: Span VI - Transverse Floor Beam at Hanger 1 Rating Factors: Part 2
Trucks
Rating Factors
Vzone1 Vzone2 Vzone3
Operating Inventory Operating Inventory Operating Inventory
Tri-Axle 1.37 0.82 1.05 0.63 1.09 0.65
H-Truck 1.92 1.15 1.47 0.88 1.52 0.91
Two-Axle 1.80 1.08 1.37 0.82 1.43 0.85
Concrete 1.44 0.86 1.10 0.66 1.14 0.68
18-Wheeler 2.05 1.23 1.57 0.94 1.63 0.98
6-Axle 1.95 1.17 1.49 0.89 1.54 0.93
School Bus 3.62 2.17 2.76 1.65 2.87 1.72
HS-Truck 1.92 1.15 1.47 0.88 1.52 0.91
5.3.6 Arch Rib
Rating factors are provided for the arch rib at seven locations as pointed out in Figure 64.
Critical sections were determined by looking at the qualitative and quantitative output diagrams

135
for the shear, bending moment, and axial load from SAP2000. Ratings were provided for one-
half of the arch rib since the span is symmetrical. Ratings were calculated using the arch rib
model presented in Section 3.6.4. The arch rib sections were rated for shear and the combination
of axial load and bending moment. Ratings for the lane loading are provided in addition to
ratings for the eight standard trucks.
Rating factors for Sections A1, A2, A3, A7, A13, A18, and A36 are shown in Table 84
through Table 90, respectively. All operating ratings are 1.0 and above except for arch Sections
A2 and A3 where the combination of axial load and bending moment are 0.96 and 0.99,
respectively, for the tri-axle truck. The combination of axial load and bending moment
controlled the ratings.
Figure 64: Span VI - Arch Rib with Rated Sections Labeled (SAP 2013)
Symmetry
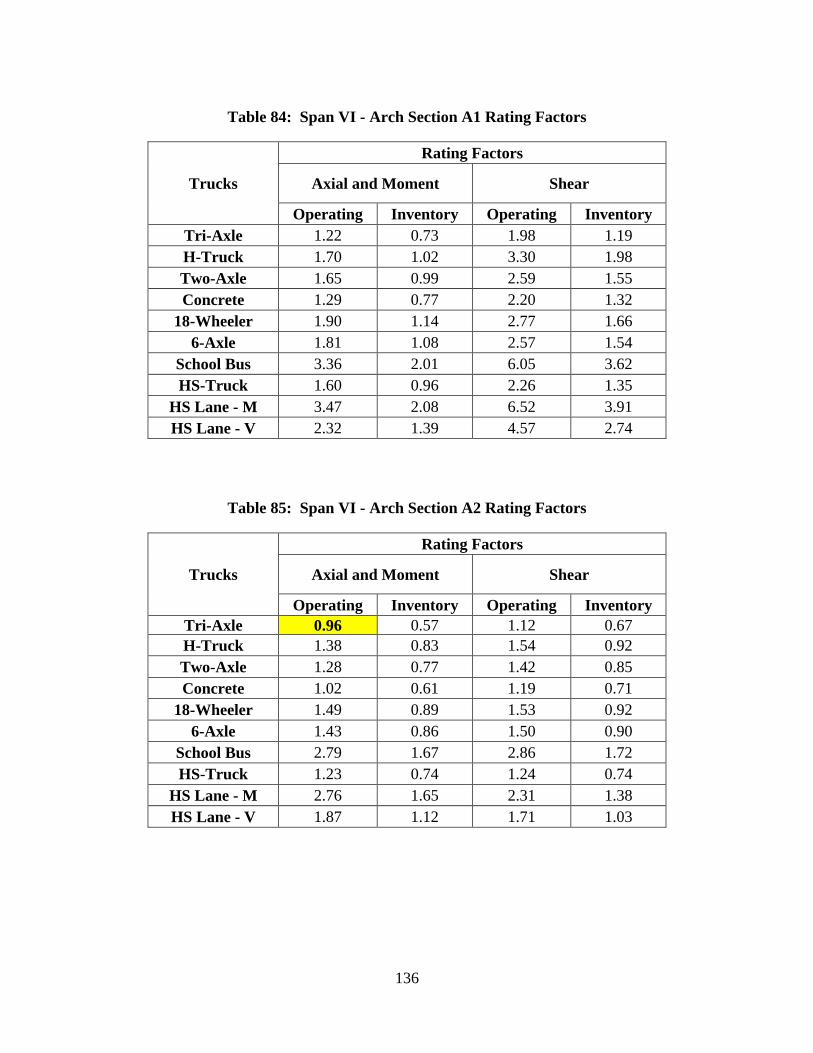
136
Table 84: Span VI - Arch Section A1 Rating Factors
Trucks
Rating Factors
Axial and Moment Shear
Operating Inventory Operating Inventory
Tri-Axle 1.22 0.73 1.98 1.19
H-Truck 1.70 1.02 3.30 1.98
Two-Axle 1.65 0.99 2.59 1.55
Concrete 1.29 0.77 2.20 1.32
18-Wheeler 1.90 1.14 2.77 1.66
6-Axle 1.81 1.08 2.57 1.54
School Bus 3.36 2.01 6.05 3.62
HS-Truck 1.60 0.96 2.26 1.35
HS Lane - M 3.47 2.08 6.52 3.91
HS Lane - V 2.32 1.39 4.57 2.74
Table 85: Span VI - Arch Section A2 Rating Factors
Trucks
Rating Factors
Axial and Moment Shear
Operating Inventory Operating Inventory
Tri-Axle 0.96 0.57 1.12 0.67
H-Truck 1.38 0.83 1.54 0.92
Two-Axle 1.28 0.77 1.42 0.85
Concrete 1.02 0.61 1.19 0.71
18-Wheeler 1.49 0.89 1.53 0.92
6-Axle 1.43 0.86 1.50 0.90
School Bus 2.79 1.67 2.86 1.72
HS-Truck 1.23 0.74 1.24 0.74
HS Lane - M 2.76 1.65 2.31 1.38
HS Lane - V 1.87 1.12 1.71 1.03

137
Table 86: Span VI - Arch Section A3 Rating Factors
Trucks
Rating Factors
Axial and Moment Shear
Operating Inventory Operating Inventory
Tri-Axle 0.99 0.59 1.38 0.83
H-Truck 1.43 0.85 1.85 1.11
Two-Axle 1.32 0.79 1.74 1.04
Concrete 1.05 0.63 1.45 0.87
18-Wheeler 1.54 0.92 1.89 1.13
6-Axle 1.47 0.88 1.86 1.11
School Bus 2.89 1.73 3.47 2.08
HS-Truck 1.26 0.75 1.52 0.91
HS Lane - M 2.89 1.73 2.94 1.76
HS Lane - V 1.95 1.17 2.15 1.29
Table 87: Span VI - Arch Section A7 Rating Factors
Trucks
Rating Factors
Axial and Moment Shear
Operating Inventory Operating Inventory
Tri-Axle 1.10 0.66 1.82 1.09
H-Truck 1.68 1.01 2.41 1.45
Two-Axle 1.53 0.91 2.39 1.43
Concrete 1.25 0.75 2.01 1.20
18-Wheeler 1.84 1.10 2.64 1.58
6-Axle 1.63 0.98 2.44 1.46
School Bus 3.32 1.99 4.59 2.75
HS-Truck 1.44 0.86 2.14 1.28
HS Lane - M 3.67 2.20 4.29 2.57
HS Lane - V 2.44 1.46 3.26 1.95

138
Table 88: Span VI - Arch Section A13 Rating Factors
Trucks
Rating Factors
Axial and Moment Shear
Operating Inventory Operating Inventory
Tri-Axle 1.02 0.61 2.06 1.24
H-Truck 1.57 0.94 3.24 1.94
Two-Axle 1.41 0.84 2.73 1.63
Concrete 1.15 0.69 2.25 1.35
18-Wheeler 1.72 1.03 3.16 1.90
6-Axle 1.53 0.92 3.03 1.81
School Bus 3.13 1.87 6.32 3.79
HS-Truck 1.33 0.80 2.44 1.46
HS Lane - M 3.42 2.05 5.00 3.00
HS Lane - V 2.28 1.36 3.72 2.23
Table 89: Span VI - Arch Section A18 Rating Factors
Trucks
Rating Factors
Axial and Moment Shear
Operating Inventory Operating Inventory
Tri-Axle 1.56 0.93 1.93 1.16
H-Truck 2.36 1.41 3.06 1.83
Two-Axle 2.19 1.31 2.56 1.54
Concrete 1.76 1.05 2.12 1.27
18-Wheeler 2.69 1.61 2.98 1.78
6-Axle 2.40 1.44 2.86 1.72
School Bus 4.73 2.84 5.94 3.56
HS-Truck 2.14 1.28 2.30 1.38
HS Lane - M 4.97 2.98 4.90 2.94
HS Lane - V 3.35 2.01 3.62 2.17

139
Table 90: Span VI - Arch Section A36 Rating Factors
Trucks
Rating Factors
Axial and Moment Shear
Operating Inventory Operating Inventory
Tri-Axle 1.30 0.78 3.14 1.88
H-Truck 2.32 1.39 5.30 3.18
Two-Axle 1.74 1.04 4.18 2.51
Concrete 1.48 0.89 3.52 2.11
18-Wheeler 2.01 1.21 4.10 2.46
6-Axle 1.93 1.16 3.94 2.36
School Bus 4.45 2.67 10.18 6.10
HS-Truck 1.50 0.90 3.70 2.22
HS Lane - M 7.00 4.19 9.18 5.50
HS Lane - V 4.41 2.64 7.16 4.29

140
5.4 SPAN VII RATING RESULTS
For Span VII, the naming convention is presented in Figure 65 for convenience. Columns 4, 5,
6, and 7 have the same cross sectional geometry; however, the reinforcements are different as
discussed in Section 2.4. Since the columns have different reinforcements, they have different
capacities. Therefore, each column was rated. For the columns, the ratings are presented for
Columns 4, 5, and 7. Column 3 in Span VII is the same as Column 3 in Span VI; therefore,
ratings for Column 3 are in the Span VI section. Columns 5 and 6 have the same reinforcing
bars and transverse truck loadings, thus ratings are provided for Column 5 only. In addition,
ratings are provided for the transverse floor beams and arch rib sections.
Figure 65: Span VII Naming Convention (SAP 2013) (Duplicate - Figure 6)
5.4.1 Column 4
Ratings are provided for the interior and exterior Column 4s as shown in Table 91 and Table 92,
respectively. Ratings were calculated using the Beam and Column 4 model presented in Section
3.5.5. The interior columns are under axial compression for dead and live loads. The exterior
columns are in tension under live loads.

141
Table 91: Span VII - Interior Column 4 Rating Factors
Trucks Rating Factors
Operating Inventory
Tri-Axle 2.61 1.56
H-Truck 3.52 2.11
Two-Axle 3.62 2.17
Concrete 2.90 1.74
18-Wheeler 4.14 2.48
6-Axle 3.63 2.17
School Bus 6.63 3.97
HS-Truck 3.52 2.11
Table 92: Span VII - Exterior Column 4 Rating Factors
5.4.2 Column 5
Ratings are provided for the interior and exterior Column 5s using two separate model cases.
Ratings from Case A, shown in Figure 46, are shown in Table 93 for the interior column and
Table 94 for the exterior column. Ratings were calculated using the Beam and Column 5 model
presented in Section 3.5.5.1. The interior columns are under compression for dead and live
loads while the exterior columns are under tension for the same applied loads. Ratings from
Case B, shown in Figure 47, are in Appendix D4.1.
Trucks Rating Factors
Operating Inventory
Tri-Axle 1.63 0.98
H-Truck 2.21 1.32
Two-Axle 2.27 1.36
Concrete 1.81 1.09
18-Wheeler 2.59 1.55
6-Axle 2.27 1.36
School Bus 4.15 2.49
HS-Truck 2.21 1.32

142
Table 93: Span VII - Interior Column 5 Rating Factors – Case A
Trucks Rating Factors
Operating Inventory
Tri-Axle 1.45 0.87
H-Truck 1.94 1.16
Two-Axle 2.01 1.20
Concrete 1.61 0.96
18-Wheeler 2.30 1.38
6-Axle 2.01 1.20
School Bus 3.65 2.19
HS-Truck 1.94 1.16
Table 94: Span VII - Exterior Column 5 Rating Factors – Case A
Trucks Rating Factors
Operating Inventory
Tri-Axle 0.99 0.59
H-Truck 1.32 0.79
Two-Axle 1.37 0.82
Concrete 1.10 0.66
18-Wheeler 1.57 0.94
6-Axle 1.37 0.82
School Bus 2.49 1.49
HS-Truck 1.32 0.79
5.4.3 Column 7
Ratings are provided for the interior and exterior Column 7s using two separate model cases.
Ratings from Case A, shown in Figure 46, are shown in Table 95 for the interior columns and
Table 96 for the exterior columns. Ratings were calculated using the Beam and Column 7 model
presented in Section 3.5.5.1. The interior columns are under compression for dead and live
loads, while the exterior columns are essentially in tension for the same load effects. Ratings
from Case B, shown in Figure 47, are in Appendix D4.1.

143
Table 95: Span VII - Interior Column 7 Rating Factors – Case A
Trucks Rating Factors
Operating Inventory
Tri-Axle 2.02 1.21
H-Truck 2.71 1.62
Two-Axle 2.81 1.68
Concrete 2.25 1.35
18-Wheeler 3.21 1.92
6-Axle 2.81 1.68
School Bus 5.10 3.06
HS-Truck 2.71 1.62
Table 96: Span VII - Exterior Column 7 Rating Factors – Case A
Trucks Rating Factors
Operating Inventory
Tri-Axle 2.59 1.55
H-Truck 3.47 2.08
Two-Axle 3.59 2.15
Concrete 2.87 1.72
18-Wheeler 4.10 2.46
6-Axle 3.59 2.15
School Bus 6.53 3.91
HS-Truck 3.47 2.08
5.4.4 Transverse Floor Beams
The transverse floor beams were rated for positive bending moment, negative bending moment,
and shear. The controlling positive bending moment is at the transverse beam at Column 4
location as shown in the next section. The controlling negative bending moment is at the
transverse beam at Column 5 location as shown in the next section. For shear ratings, transverse
floor beams were discretized into three zones. The controlling shear rating is at the transverse
beam at Column 4 location as shown in Section 5.4.6.

144
5.4.4.1 Transverse Floor Beam Bending Moment Rating
The controlling positive bending moment rating for the transverse floor beam are at the Column
4 locations and are shown in Table 97. The controlling negative bending moment ratings for the
transverse floor beam are at Column 5 locations. Remember that there were two model cases for
the Beam and Column 5. The negative bending moment ratings for the transverse beam using
Case A are shown here in Table 98. For Case B, the ratings are shown in Appendix D2.2 for
results presentation consistency. However, the absolute lowest negative bending moment rating
is 2.13, which is Case B.
For completeness, negative bending moment ratings for the transverse beam at column 4
are provided in Appendix D2.1. The shear ratings for this transverse beam are shown in the next
section because it is the controlling transverse beam for shear ratings. Also, for completeness,
shear and positive bending moment ratings for the transverse floor beam at Column 5 location –
Case A are in Appendix D2.2. None of the transverse beam rating factors at Column 5 are less
than 1.0 for Case A or Case B.
Table 97: Span VII - Transverse Floor Beam at Column 4 Positive Bending Moment
Rating Factors
Trucks
Rating Factors
Positive Moment
Operating Inventory
Tri-Axle 1.64 0.98
H-Truck 2.22 1.33
Two-Axle 2.28 1.36
Concrete 1.82 1.09
18-Wheeler 2.60 1.56
6-Axle 2.28 1.37
School Bus 4.17 2.50
HS-Truck 2.22 1.33

145
Table 98: Span VII - Transverse Floor Beam at Column 5 Negative Bending Moment
Rating Factors – Case A
Trucks
Rating Factors
Negative Moment
Operating Inventory
Tri-Axle 2.49 1.49
H-Truck 3.33 2.00
Two-Axle 3.45 2.07
Concrete 2.76 1.65
18-Wheeler 3.94 2.36
6-Axle 3.45 2.07
School Bus 6.27 3.76
HS-Truck 3.33 2.00
5.4.4.2 Transverse Floor Beam Shear Rating
The transverse floor beam at Column 4 controls the rating for shear and is shown in Table 99.
Ratings were calculated using the transverse floor beam model presented in Section 3.5.5.
Table 99: Span VII - Transverse Floor Beam at Column 4 Rating Factors
Trucks
Rating Factors
Vzone1 Vzone2 Vzone3
Operating Inventory Operating Inventory Operating Inventory
Tri-Axle 2.01 1.20 1.42 0.85 1.48 0.89
H-Truck 2.71 1.62 1.92 1.15 2.00 1.20
Two-Axle 2.79 1.67 1.98 1.18 2.06 1.23
Concrete 2.23 1.34 1.58 0.95 1.65 0.99
18-Wheeler 3.18 1.91 2.26 1.35 2.35 1.41
6-Axle 2.79 1.67 1.98 1.19 2.06 1.24
School Bus 5.10 3.06 3.62 2.17 3.77 2.26
HS-Truck 2.71 1.62 1.92 1.15 2.00 1.20
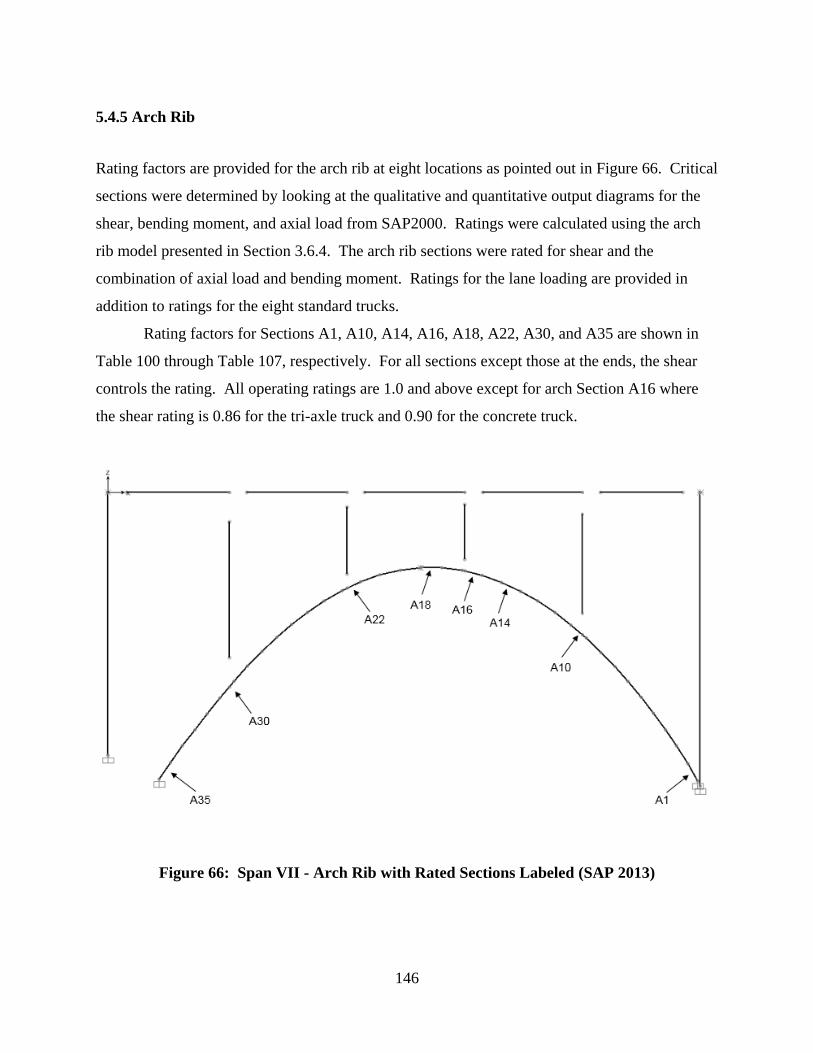
146
5.4.5 Arch Rib
Rating factors are provided for the arch rib at eight locations as pointed out in Figure 66. Critical
sections were determined by looking at the qualitative and quantitative output diagrams for the
shear, bending moment, and axial load from SAP2000. Ratings were calculated using the arch
rib model presented in Section 3.6.4. The arch rib sections were rated for shear and the
combination of axial load and bending moment. Ratings for the lane loading are provided in
addition to ratings for the eight standard trucks.
Rating factors for Sections A1, A10, A14, A16, A18, A22, A30, and A35 are shown in
Table 100 through Table 107, respectively. For all sections except those at the ends, the shear
controls the rating. All operating ratings are 1.0 and above except for arch Section A16 where
the shear rating is 0.86 for the tri-axle truck and 0.90 for the concrete truck.
Figure 66: Span VII - Arch Rib with Rated Sections Labeled (SAP 2013)
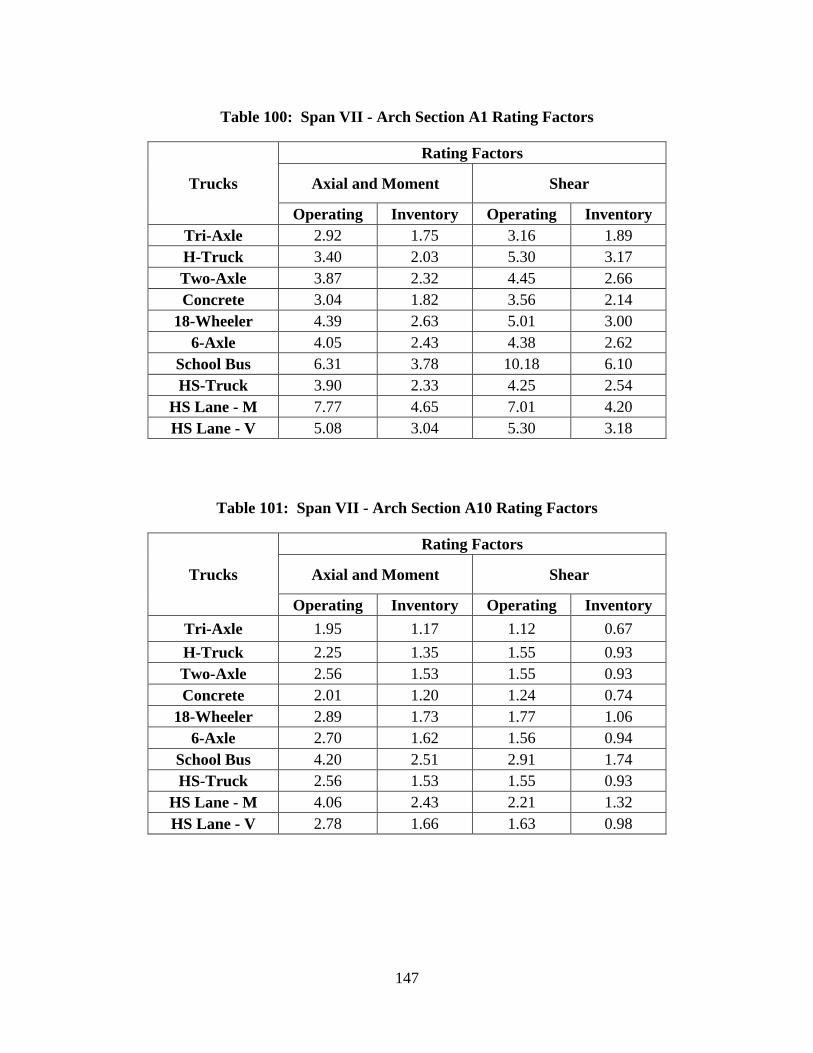
147
Table 100: Span VII - Arch Section A1 Rating Factors
Trucks
Rating Factors
Axial and Moment Shear
Operating Inventory Operating Inventory
Tri-Axle 2.92 1.75 3.16 1.89
H-Truck 3.40 2.03 5.30 3.17
Two-Axle 3.87 2.32 4.45 2.66
Concrete 3.04 1.82 3.56 2.14
18-Wheeler 4.39 2.63 5.01 3.00
6-Axle 4.05 2.43 4.38 2.62
School Bus 6.31 3.78 10.18 6.10
HS-Truck 3.90 2.33 4.25 2.54
HS Lane - M 7.77 4.65 7.01 4.20
HS Lane - V 5.08 3.04 5.30 3.18
Table 101: Span VII - Arch Section A10 Rating Factors
Trucks
Rating Factors
Axial and Moment Shear
Operating Inventory Operating Inventory
Tri-Axle 1.95 1.17 1.12 0.67
H-Truck 2.25 1.35 1.55 0.93
Two-Axle 2.56 1.53 1.55 0.93
Concrete 2.01 1.20 1.24 0.74
18-Wheeler 2.89 1.73 1.77 1.06
6-Axle 2.70 1.62 1.56 0.94
School Bus 4.20 2.51 2.91 1.74
HS-Truck 2.56 1.53 1.55 0.93
HS Lane - M 4.06 2.43 2.21 1.32
HS Lane - V 2.78 1.66 1.63 0.98
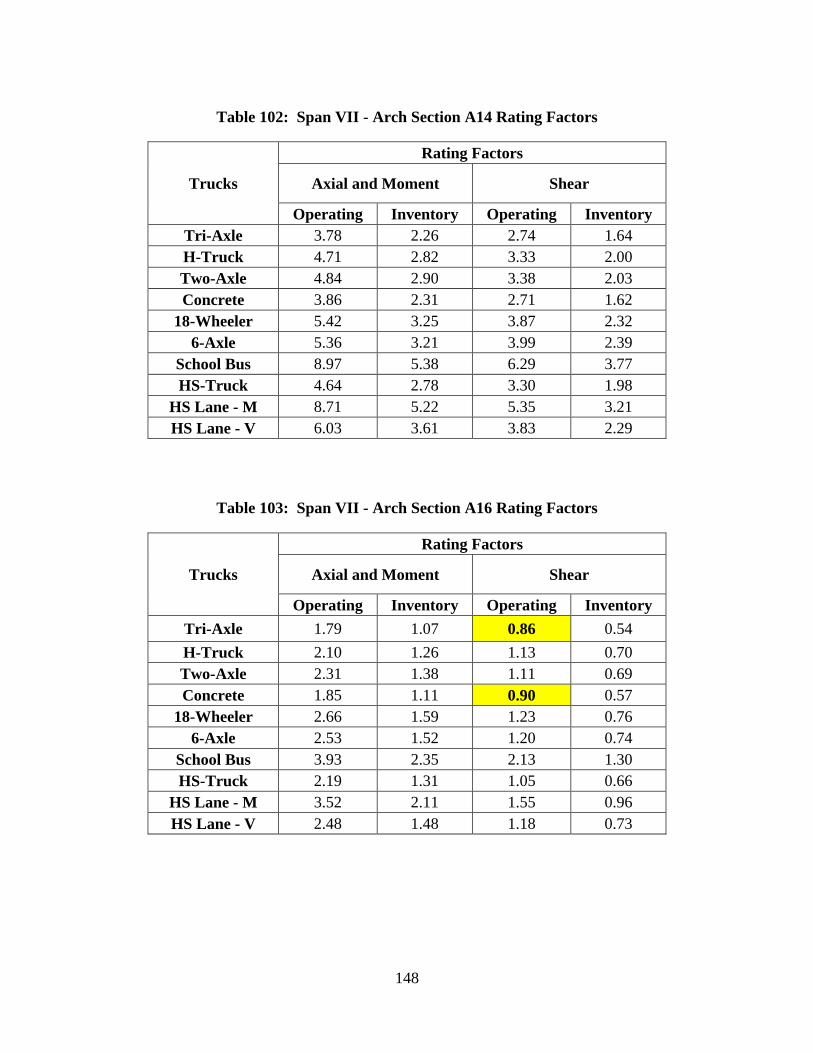
148
Table 102: Span VII - Arch Section A14 Rating Factors
Trucks
Rating Factors
Axial and Moment Shear
Operating Inventory Operating Inventory
Tri-Axle 3.78 2.26 2.74 1.64
H-Truck 4.71 2.82 3.33 2.00
Two-Axle 4.84 2.90 3.38 2.03
Concrete 3.86 2.31 2.71 1.62
18-Wheeler 5.42 3.25 3.87 2.32
6-Axle 5.36 3.21 3.99 2.39
School Bus 8.97 5.38 6.29 3.77
HS-Truck 4.64 2.78 3.30 1.98
HS Lane - M 8.71 5.22 5.35 3.21
HS Lane - V 6.03 3.61 3.83 2.29
Table 103: Span VII - Arch Section A16 Rating Factors
Trucks
Rating Factors
Axial and Moment Shear
Operating Inventory Operating Inventory
Tri-Axle 1.79 1.07 0.86 0.54
H-Truck 2.10 1.26 1.13 0.70
Two-Axle 2.31 1.38 1.11 0.69
Concrete 1.85 1.11 0.90 0.57
18-Wheeler 2.66 1.59 1.23 0.76
6-Axle 2.53 1.52 1.20 0.74
School Bus 3.93 2.35 2.13 1.30
HS-Truck 2.19 1.31 1.05 0.66
HS Lane - M 3.52 2.11 1.55 0.96
HS Lane - V 2.48 1.48 1.18 0.73

149
Table 104: Span VII - Arch Section A18 Rating Factors
Trucks
Rating Factors
Axial and Moment Shear
Operating Inventory Operating Inventory
Tri-Axle 4.08 2.45 1.69 1.01
H-Truck 4.17 2.50 2.16 1.29
Two-Axle 5.27 3.16 2.14 1.28
Concrete 4.20 2.51 1.71 1.02
18-Wheeler 6.08 3.64 2.38 1.43
6-Axle 5.71 3.42 2.43 1.46
School Bus 7.73 4.63 4.16 2.49
HS-Truck 4.52 2.71 2.01 1.21
HS Lane - M 8.17 4.89 3.39 2.03
HS Lane - V 5.39 3.23 2.45 1.47
Table 105: Span VII - Arch Section A22 Rating Factors
Trucks
Rating Factors
Axial and Moment Shear
Operating Inventory Operating Inventory
Tri-Axle 1.45 0.87 1.01 0.60
H-Truck 1.76 1.06 1.37 0.82
Two-Axle 1.88 1.12 1.36 0.81
Concrete 1.49 0.89 1.09 0.65
18-Wheeler 2.13 1.28 1.54 0.92
6-Axle 2.06 1.23 1.41 0.85
School Bus 3.31 1.98 2.62 1.57
HS-Truck 1.83 1.10 1.33 0.79
HS Lane - M 2.99 1.79 1.88 1.13
HS Lane - V 2.09 1.25 1.41 0.84

150
Table 106: Span VII - Arch Section A30 Rating Factors
Trucks
Rating Factors
Axial and Moment Shear
Operating Inventory Operating Inventory
Tri-Axle 7.10 4.25 1.37 0.82
H-Truck 7.99 4.79 1.92 1.15
Two-Axle 9.13 5.47 1.89 1.13
Concrete 7.42 4.44 1.51 0.91
18-Wheeler 6.51 3.90 2.16 1.29
6-Axle 7.24 4.34 1.90 1.14
School Bus 13.55 8.12 3.62 2.17
HS-Truck 8.03 4.81 1.92 1.15
HS Lane - M 12.72 7.62 2.93 1.75
HS Lane - V 9.50 5.69 2.12 1.27
Table 107: Span VII - Arch Section A35 Rating Factors
Trucks
Rating Factors
Axial and Moment Shear
Operating Inventory Operating Inventory
Tri-Axle 2.18 1.30 3.05 1.83
H-Truck 3.02 1.81 4.14 2.48
Two-Axle 3.00 1.79 4.25 2.54
Concrete 2.34 1.40 3.40 2.04
18-Wheeler 3.35 2.00 4.85 2.91
6-Axle 3.01 1.80 4.23 2.54
School Bus 5.68 3.40 7.80 4.67
HS-Truck 3.59 2.15 4.14 2.48
HS Lane - M 5.76 3.45 7.18 4.30
HS Lane - V 3.86 2.31 5.01 3.00

151
5.5 SUMMARY OF RATING RESULTS
A summary of the rating results is shown in Table 108. The limiting components along with the
limit state and truck are shown. The results shown in the column labeled “Operating RF” were
calculated for a concrete compressive strength of 3,000 psi. The results shown in the column
labeled “Higher Operating RF in Ch. 6” are calculated using the concrete compressive strength
shown. The column labeled “Ch. 6 Section” indicates the section number in Chapter 6 where
additional results are presented.
Table 108: Components with Operating Factor Less Than 1.0
Span Component Limit State Truck Operating
RF
Higher
Operating
RF in Ch. 6
Ch. 6
Section
IV Trans. Floor Bm.
at Hanger 1
Positive
Bending Tri-Axle 0.98 No 6.6
V Trans. Floor Bm.
at Hanger 1
Positive
Bending Tri-Axle 0.99 No 6.6
V Arch Rib Section
A2
Axial Compr.
and Moment Tri-Axle 0.96
1.00 for f’c
3,500 psi 6.5
VI Trans. Deep
Beam
Positive
Bending Tri-Axle 0.98 No 6.7
VI Trans. Floor Bm.
at Hanger 1
Positive
Bending Tri-Axle 0.93 No 6.6
VI Trans. Floor Bm.
at Hanger 1
Positive
Bending Concrete 0.97 No
VI Arch Rib Section
A2
Axial Compr.
and Moment Tri-Axle 0.96
1.02 for f’c
4,000 psi 6.5
VI Arch Rib Section
A3
Axial Compr.
and Moment Tri-Axle 0.99
> 1.0 for f’c
4,000 psi
VII Exterior Column
5 - Case A Axial Tension Tri-Axle 0.99 No
VII Arch Rib Section
A16 Shear Tri-Axle 0.86
1.10 for f’c
4,000 psi 6.5
VII Arch Rib Section
A16 Shear Concrete 0.90
> 1.0 for f’c
4,000 psi
152
Chapter 6
SENSITIVITY ANALYSES
Literature cited by Johnson et al. (2014) indicates that without restraint or applied stress, ASR
will result in free expansion of concrete in all directions similar to that caused by a temperature
increase in most common engineering materials. Expansion due to a temperature change in an
indeterminate structure causes both internal forces and displacements. In this chapter, ASR-
expansion in the arch rib of Span V is simulated using a uniform temperature increase for the
purpose of investigating the internal forces and displacements that may result from ASR-
expansion. Specifically, three questions are addressed: 1) Do the internal forces resulting from
expansion add to or counteract those resulting from gravity loads? 2) What magnitudes of
expansion are required to produce transverse flexural cracking at critical sections along the arch?
And, 3) what magnitudes of deflection of the arch may result from expansion? Analyses that
address these questions are presented in Section 6.1 and 6.2.
As illustrated by the compressive strengths of core samples listed in Table 11 and the
discussion of that table, there is significant variation in the strength of the concrete in the arches.
A compressive strength of 3,000 psi, and the corresponding modulus of elasticity from Eq. (22),
was used in the analysis and ratings of all arch ribs. Rating factors less than one were calculated
for the arch ribs of Spans V, VI and VII. The effects of assuming different values for the
concrete compressive strength on the internal forces due to dead load and live loads, and the
resulting rating factors and arch deflections, are investigated in Sections 6.3, 6.4 and 6.5. Values
of compressive strength above 3,000 psi are assumed because higher values of compressive
strength may be justified by the core test results of Table 11 or by additional sampling and
testing. Higher compressive strengths result in rating factors greater than one for all the arch ribs
as shown in Table 108. Values of compressive strength below 3,000 psi are assumed because
deterioration due to ASR may result in reductions in cross section capacity. The effects of ASR-
expansion on cross section capacity are not well understood, so it is not clear that simple
reductions in compressive strength accurately reflect the reductions in cross section capacity that

153
may result from ASR. But, results for reductions in compressive strength are presented for
future reference.
As summarized in Table 108, some of the transverse floor beams and transverse deep
beams have rating factors less than one when the concrete compressive strength is assumed to be
3,000 psi. Since ASR may cause reductions in these cross section capacities in the future,
concrete strengths below 3,000 psi are used to calculate rating factors in Section 6.6 and 6.7.
These results illustrate that the beam ratings are controlled by flexure and are not sensitive to the
concrete strength.
The live load utilized for all sensitivity analyses reported in this chapter is the tri-axle
truck. From the LFR results shown in Chapter 5, the tri-axle truck is the controlling truck out of
the eight standard trucks used in this project.
6.1 EFFECTS OF ASR-EXPANSION ON ARCH INTERNAL FORCES
The ASR-expansion of the arch rib of Span V was simulated by applying a uniform
temperature increase to the arch rib. According to crack mappings provided by Johnson et al.
(2014), ASR-cracks are present only in the arch sections above the deck. As a result, the
uniform temperature increase used to model the ASR-expansion was only applied to sections
above the deck. The model used for this analysis was the linear model, in which E = Ec and I =
Ig. Doing so, the effects of ASR-expansion were evaluated without being confounded by
slenderness and creep effects. In addition, the model did not include the LFR’s dead and live
load factors since these analyses were used to estimate the serviceability effects of ASR-
expansion on arch deflection and the potential for transverse flexural cracking. The lateral truck
distribution factor, 1.160, and impact factor, 1.191, for Span V shown in Table 25 and Table 27,
respectively, were included for live load cases.
The amount of ASR-expansion in the arch ribs was estimated from data and information
reported by Johnson et al. (2014) in an earlier investigation of ASR in the Bibb Graves Bridge.
Johnson reported that the first observations of ASR damage in the Bibb Graves Bridge were in
1956. He also reported transverse strain measurements made on the arches of Span 4 and Span 5
that indicate an average ASR-expansion of approximately 200 microstrain/year. By assuming

154
this rate of expansion has been constant since the 1950’s, the total ASR-expansion to date is on
the order of 10,000 microstrain (0.010 in./in.). This magnitude of total expansion is very large
and is probably an overestimate of the actual amount. But, it is impossible to estimate the
amount of total expansion with a high degree of confidence.
The uniform temperature increase required to produce a longitudinal free expansion of
10,000 microstrain in the arch model is 1,440oF. This temperature change was calculated from
the following equation.
(33)
Where:
εl = longitudinal strain (in./in.)
αt = coefficient of thermal expansion, 6.95 x 10⁻⁶ in./in./ ̊ F for concrete made
with Alabama river gravel (Johnson’s Master’s Thesis 2014)
The effects of ASR-expansion on arch internal forces were assessed at three critical
locations determined from the ratings in the previous Chapter. These arch sections are A2, A14,
and A40 for Span V. These arch sections are at Hanger 1, Hanger 3, and base, respectively.
These sections are shown in Figure 63. At each section, the bending moment, axial load, and
shear were compared for various levels of ASR-expansion that will be used later. The
comparisons were made for concrete strengths of 3,000 psi and 4,740 psi. The latter concrete
strength is equal to the equivalent specified concrete strength shown in Table 11 determined
from all core samples taken from the arch ribs.
Table 109 and Table 110 list the internal forces corresponding to the uniform temperature
change for each section associated with four levels of longitudinal strain. For both concrete
strengths, the bending moment, axial compression, and shear increase as the longitudinal strain
increases.
lc
t
T

155
Table 109: Effects of ASR-Expansion on Arch Internal Forces on 3,000 psi Model
Longitudinal Strain
(με) Section
Internal Force
M (k-ft) P (k) V (k)
10,000
A2 -1190 -100. 5.70
A14 -498 -87.7 -49.0
A40 3280 -52.2 85.8
3,447
A2 -409 -34.6 1.96
A14 -172 -30.2 -16.9
A40 1130 -18.0 29.6
1,814
A2 -215 -18.2 1.03
A14 -90.0 -15.9 -8.88
A40 594 -9.47 15.6
1,223
A2 -145 -12.3 0.690
A14 -61.0 -10.7 -5.99
A40 401 -6.38 10.5
Table 110: Effects of ASR-Expansion on Arch Internal Forces on 4,740 psi Model
Longitudinal Strain
(με) Section
Internal Force
M (k-ft) P (k) V (k)
10,000
A2 -1490 -126 7.10
A14 -627 -110. -61.6
A40 4120 -65.6 108
1,897
A2 -283 -23.9 1.40
A14 -119 -20.9 -11.7
A40 781 -12.4 20.5
1,807
A2 -269 -22.8 1.29
A14 -113 -19.9 -11.1
A40 744 -11.9 19.5
1,341
A2 -200. -16.9 -0.960
A14 -84.0 -14.8 -8.26
A40 552 -8.80 14.5
6.1.1 Bending Moment Sign Resulting from ASR-Expansion
When the uniform temperature increase simulating the ASR-expansion was applied to the model,
it resulted in positive and negative bending distributed along the arch as shown in Figure 67.
From the arch center to approximately the arch rib location between Hangers 3 and 4, the
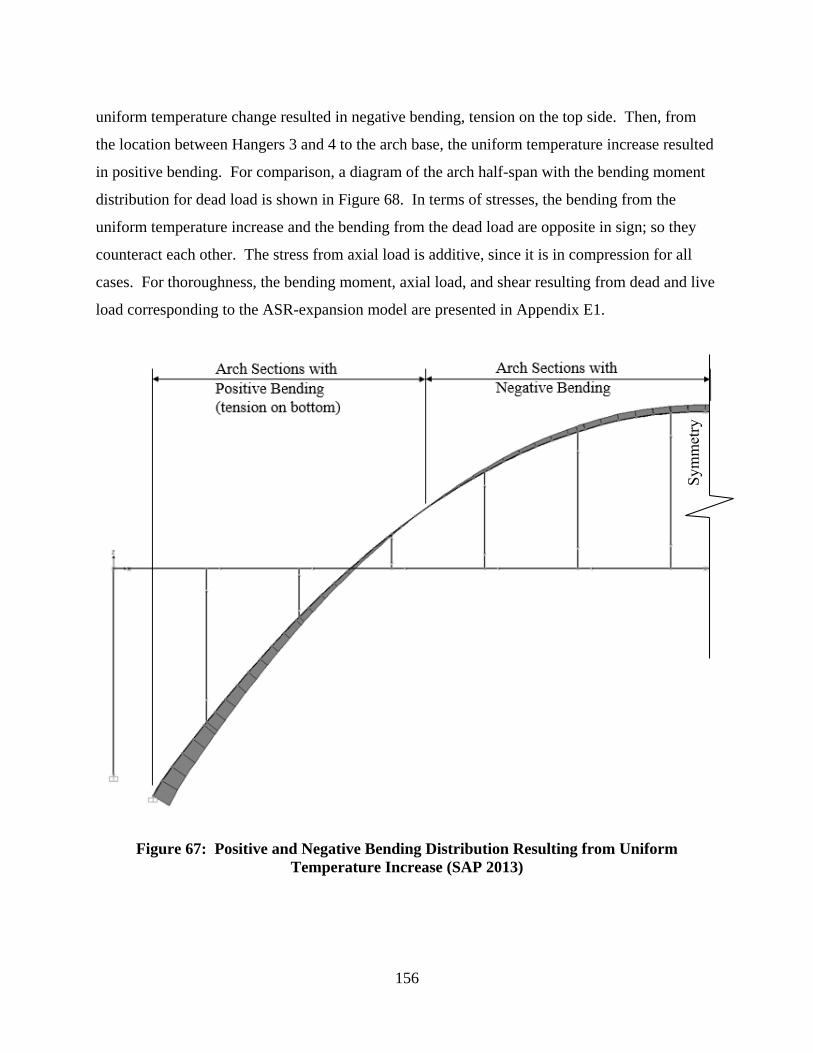
156
uniform temperature change resulted in negative bending, tension on the top side. Then, from
the location between Hangers 3 and 4 to the arch base, the uniform temperature increase resulted
in positive bending. For comparison, a diagram of the arch half-span with the bending moment
distribution for dead load is shown in Figure 68. In terms of stresses, the bending from the
uniform temperature increase and the bending from the dead load are opposite in sign; so they
counteract each other. The stress from axial load is additive, since it is in compression for all
cases. For thoroughness, the bending moment, axial load, and shear resulting from dead and live
load corresponding to the ASR-expansion model are presented in Appendix E1.
Figure 67: Positive and Negative Bending Distribution Resulting from Uniform
Temperature Increase (SAP 2013)
Sy
mm
etry
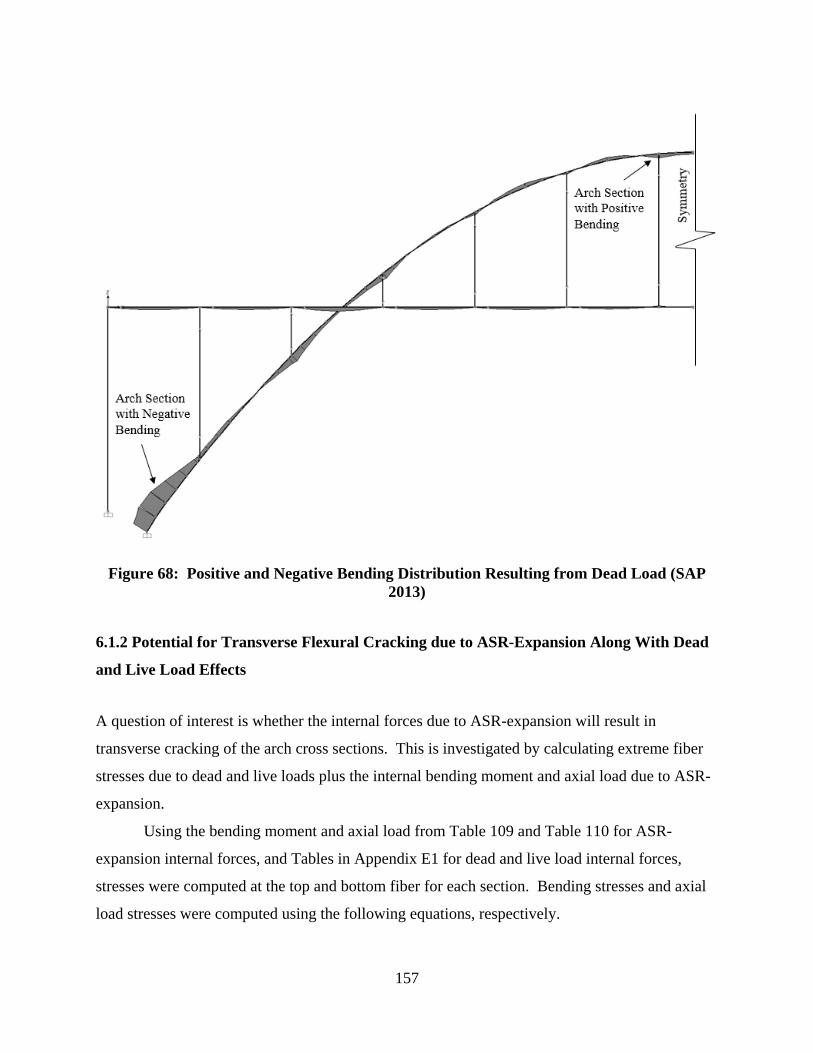
157
Figure 68: Positive and Negative Bending Distribution Resulting from Dead Load (SAP
2013)
6.1.2 Potential for Transverse Flexural Cracking due to ASR-Expansion Along With Dead
and Live Load Effects
A question of interest is whether the internal forces due to ASR-expansion will result in
transverse cracking of the arch cross sections. This is investigated by calculating extreme fiber
stresses due to dead and live loads plus the internal bending moment and axial load due to ASR-
expansion.
Using the bending moment and axial load from Table 109 and Table 110 for ASR-
expansion internal forces, and Tables in Appendix E1 for dead and live load internal forces,
stresses were computed at the top and bottom fiber for each section. Bending stresses and axial
load stresses were computed using the following equations, respectively.
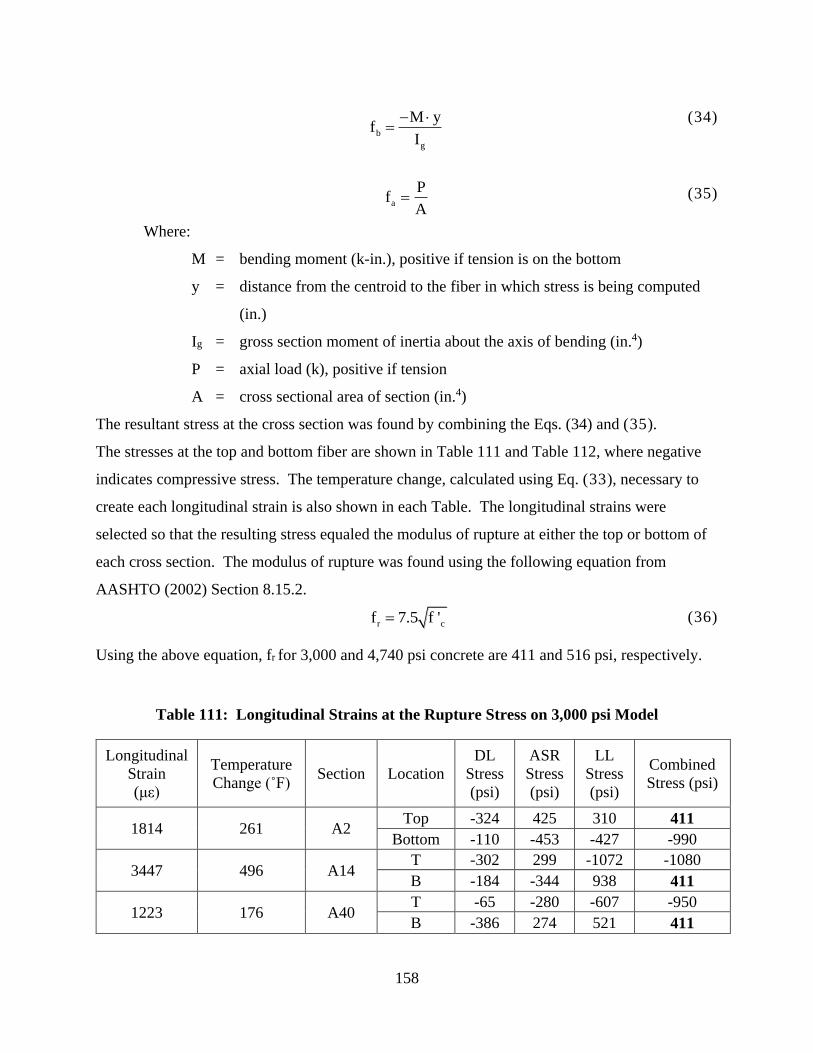
158
(34)
(35)
Where:
M = bending moment (k-in.), positive if tension is on the bottom
y = distance from the centroid to the fiber in which stress is being computed
(in.)
Ig = gross section moment of inertia about the axis of bending (in.4)
P = axial load (k), positive if tension
A = cross sectional area of section (in.4)
The resultant stress at the cross section was found by combining the Eqs. (34) and (35).
The stresses at the top and bottom fiber are shown in Table 111 and Table 112, where negative
indicates compressive stress. The temperature change, calculated using Eq. (33), necessary to
create each longitudinal strain is also shown in each Table. The longitudinal strains were
selected so that the resulting stress equaled the modulus of rupture at either the top or bottom of
each cross section. The modulus of rupture was found using the following equation from
AASHTO (2002) Section 8.15.2.
(36)
Using the above equation, fr for 3,000 and 4,740 psi concrete are 411 and 516 psi, respectively.
Table 111: Longitudinal Strains at the Rupture Stress on 3,000 psi Model
Longitudinal
Strain
(με)
Temperature
Change (˚F) Section Location
DL
Stress
(psi)
ASR
Stress
(psi)
LL
Stress
(psi)
Combined
Stress (psi)
1814 261 A2 Top -324 425 310 411
Bottom -110 -453 -427 -990
3447 496 A14 T -302 299 -1072 -1080
B -184 -344 938 411
1223 176 A40 T -65 -280 -607 -950
B -386 274 521 411
b
g
M yf
I
a
Pf
A
r cf 7.5 f '
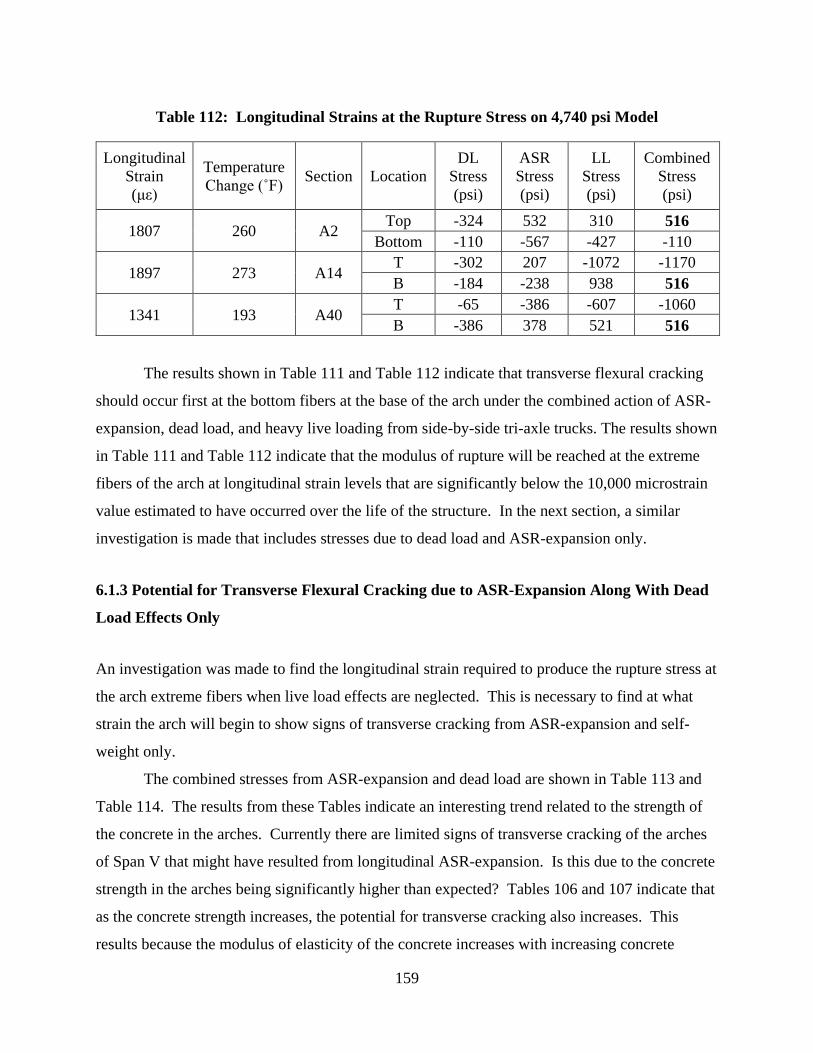
159
Table 112: Longitudinal Strains at the Rupture Stress on 4,740 psi Model
Longitudinal
Strain
(με)
Temperature
Change (˚F) Section Location
DL
Stress
(psi)
ASR
Stress
(psi)
LL
Stress
(psi)
Combined
Stress
(psi)
1807 260 A2 Top -324 532 310 516
Bottom -110 -567 -427 -110
1897 273 A14 T -302 207 -1072 -1170
B -184 -238 938 516
1341 193 A40 T -65 -386 -607 -1060
B -386 378 521 516
The results shown in Table 111 and Table 112 indicate that transverse flexural cracking
should occur first at the bottom fibers at the base of the arch under the combined action of ASR-
expansion, dead load, and heavy live loading from side-by-side tri-axle trucks. The results shown
in Table 111 and Table 112 indicate that the modulus of rupture will be reached at the extreme
fibers of the arch at longitudinal strain levels that are significantly below the 10,000 microstrain
value estimated to have occurred over the life of the structure. In the next section, a similar
investigation is made that includes stresses due to dead load and ASR-expansion only.
6.1.3 Potential for Transverse Flexural Cracking due to ASR-Expansion Along With Dead
Load Effects Only
An investigation was made to find the longitudinal strain required to produce the rupture stress at
the arch extreme fibers when live load effects are neglected. This is necessary to find at what
strain the arch will begin to show signs of transverse cracking from ASR-expansion and self-
weight only.
The combined stresses from ASR-expansion and dead load are shown in Table 113 and
Table 114. The results from these Tables indicate an interesting trend related to the strength of
the concrete in the arches. Currently there are limited signs of transverse cracking of the arches
of Span V that might have resulted from longitudinal ASR-expansion. Is this due to the concrete
strength in the arches being significantly higher than expected? Tables 106 and 107 indicate that
as the concrete strength increases, the potential for transverse cracking also increases. This
results because the modulus of elasticity of the concrete increases with increasing concrete

160
strength, and the forces due to ASR-expansion increase. Overall, the longitudinal strain levels
due to ASR that are required to produce the rupture stress at the extreme fibers of the arch are
higher when the live load stresses are not included, but the longitudinal strain levels are less than
the 10,000 microstrain estimated to have occurred over the life of the structure. Since transverse
cracking has not occurred, it is likely that the 10,000 microstrain is an overestimate of the total
ASR-expansion or that ASR-expansion is not correctly modeled as a uniform increase in
temperature. Table 111 through Table 114 show that transverse flexural cracking should be
expected at the top surface of the arch at A2 (Hanger 1) and the bottom at A40 (Base). This is
true with or without including the effects of live load. Future inspections of the arches should
include observations regarding the presence or absence of transverse cracking at these two
locations.
Table 113: Longitudinal Strains at the Rupture Stress on 3,000 psi Model without Live
Load
Longitudinal
Strain (με)
Temperature
Change (˚F) Section Location
DL
Stress
(psi)
ASR
Stress
(psi)
Combined
Stress (psi)
3141 452 A2 Top -324 735 411
Bottom -110 -784 -894
8208 1181 A14 T -302 712 411
B -184 -818 -1002
3551 511 A40 T -65.0 -813 -878
B -386 797 411

161
Table 114: Longitudinal Strains at the Rupture Stress on 4,740 psi Model without Live
Load
Longitudinal
Strain (με)
Temperature
Change (˚F) Section Location
DL
Stress
(psi)
ASR
Stress
(psi)
Combined
Stress
(psi)
2856 411 A2 Top -324 841 516
Bottom -110. -896 -1006
7492 1078 A14 T -302 817 516
B -184 -939 -1120
3204 461 A40 T -65.0 -922 -987
B -386 903 516
6.2 EFFECTS OF ASR-EXPANSION ON ARCH DEFLECTIONS
Vertical deflection at the center point of the arch span, Point A in Figure 69, was calculated for
four values of longitudinal strain. The deflection was calculated for the arch model with 3,000
psi concrete and the model with 4,740 psi concrete. The vertical deflection due to ASR-
expansion was the maximum at Point A, and it was upward. In this Chapter, all references to
deflection are to vertical deflection.
Figure 69: Deflection at Arch Center Span (Point A)
Table 115 lists the dead and live load deflection at Point A for the 3,000 psi and the 4,740
psi models. This Table shows that the deflection at Point A using the short term Ec, from Eq.

162
(22), is equaled to or less than 0.10 inch and 0.41 inch for the dead and live load, respectively.
These deflections are rather small when compared with the deflection resulting from ASR-
expansion.
Table 115: Dead and Live Load Deflection at Point A
Property Deflection (in.)
f'c (psi) Ec (ksi) Dead Load Live Load
3000 3122 -0.10 -0.41
4740 3924 -0.08 -0.33
For various longitudinal strains, Table 116 and Table 117 list the deflection at Point A
resulting from ASR-expansion only for the 3,000 psi and 4,740 psi concrete models,
respectively. Column 2 of each Table lists the deflection in inches resulting from different levels
of ASR-expansion. Based on the longitudinal strain of 10,000 microstrain, the arch center at
Point A has deflected 9.4 inches upward over the past 50 years. The deflection from ASR-
expansion is significantly larger than the deflection resulting from dead and live load, shown in
Table 115.
Column 3 of Table 116 and Table 117 display the number of years it takes to develop the
deflection corresponding to the given longitudinal strains. Column 3 is calculated by taking the
longitudinal strain and dividing it by the longitudinal strain rate per year presented in Section
6.1. Column 4 is the number of years it takes to develop one inch of deflection resulting from
ASR-expansion. This is found by taking Column 3 and dividing by Column 2.
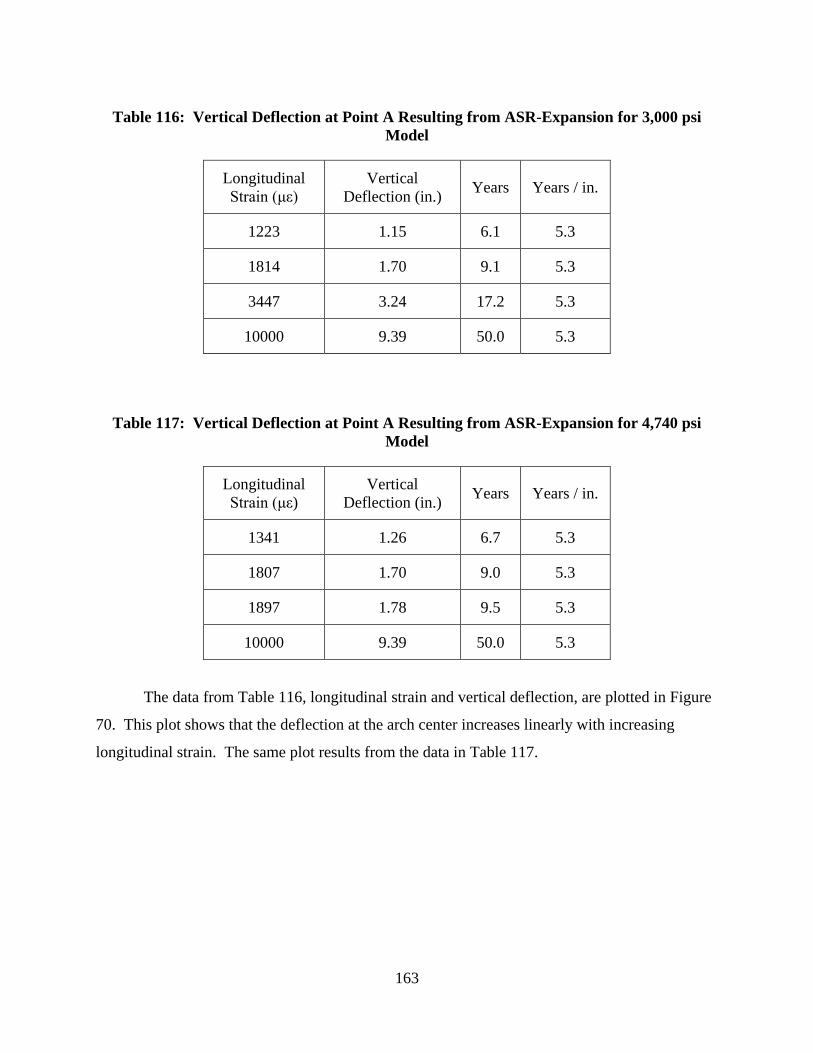
163
Table 116: Vertical Deflection at Point A Resulting from ASR-Expansion for 3,000 psi
Model
Longitudinal
Strain (με)
Vertical
Deflection (in.) Years Years / in.
1223 1.15 6.1 5.3
1814 1.70 9.1 5.3
3447 3.24 17.2 5.3
10000 9.39 50.0 5.3
Table 117: Vertical Deflection at Point A Resulting from ASR-Expansion for 4,740 psi
Model
Longitudinal
Strain (με)
Vertical
Deflection (in.) Years Years / in.
1341 1.26 6.7 5.3
1807 1.70 9.0 5.3
1897 1.78 9.5 5.3
10000 9.39 50.0 5.3
The data from Table 116, longitudinal strain and vertical deflection, are plotted in Figure
70. This plot shows that the deflection at the arch center increases linearly with increasing
longitudinal strain. The same plot results from the data in Table 117.
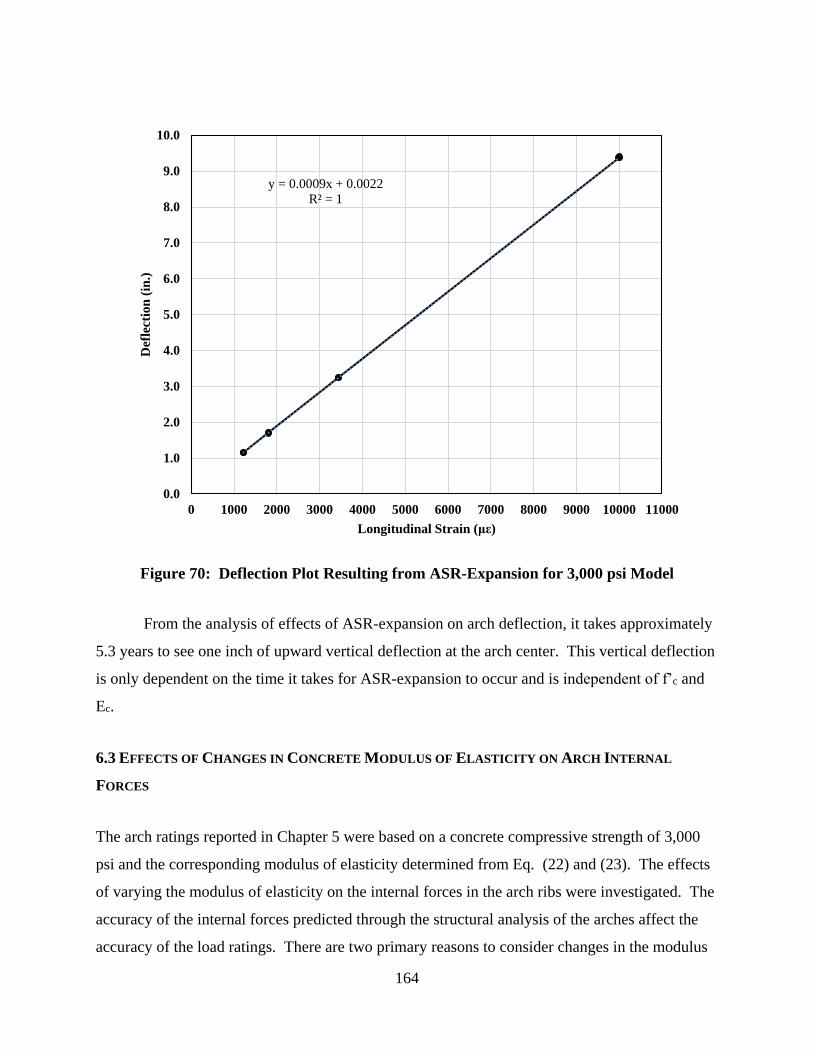
164
Figure 70: Deflection Plot Resulting from ASR-Expansion for 3,000 psi Model
From the analysis of effects of ASR-expansion on arch deflection, it takes approximately
5.3 years to see one inch of upward vertical deflection at the arch center. This vertical deflection
is only dependent on the time it takes for ASR-expansion to occur and is independent of f’c and
Ec.
6.3 EFFECTS OF CHANGES IN CONCRETE MODULUS OF ELASTICITY ON ARCH INTERNAL
FORCES
The arch ratings reported in Chapter 5 were based on a concrete compressive strength of 3,000
psi and the corresponding modulus of elasticity determined from Eq. (22) and (23). The effects
of varying the modulus of elasticity on the internal forces in the arch ribs were investigated. The
accuracy of the internal forces predicted through the structural analysis of the arches affect the
accuracy of the load ratings. There are two primary reasons to consider changes in the modulus
y = 0.0009x + 0.0022
R² = 1
0.0
1.0
2.0
3.0
4.0
5.0
6.0
7.0
8.0
9.0
10.0
0 1000 2000 3000 4000 5000 6000 7000 8000 9000 10000 11000
Def
lect
ion
(in
.)
Longitudinal Strain (με)
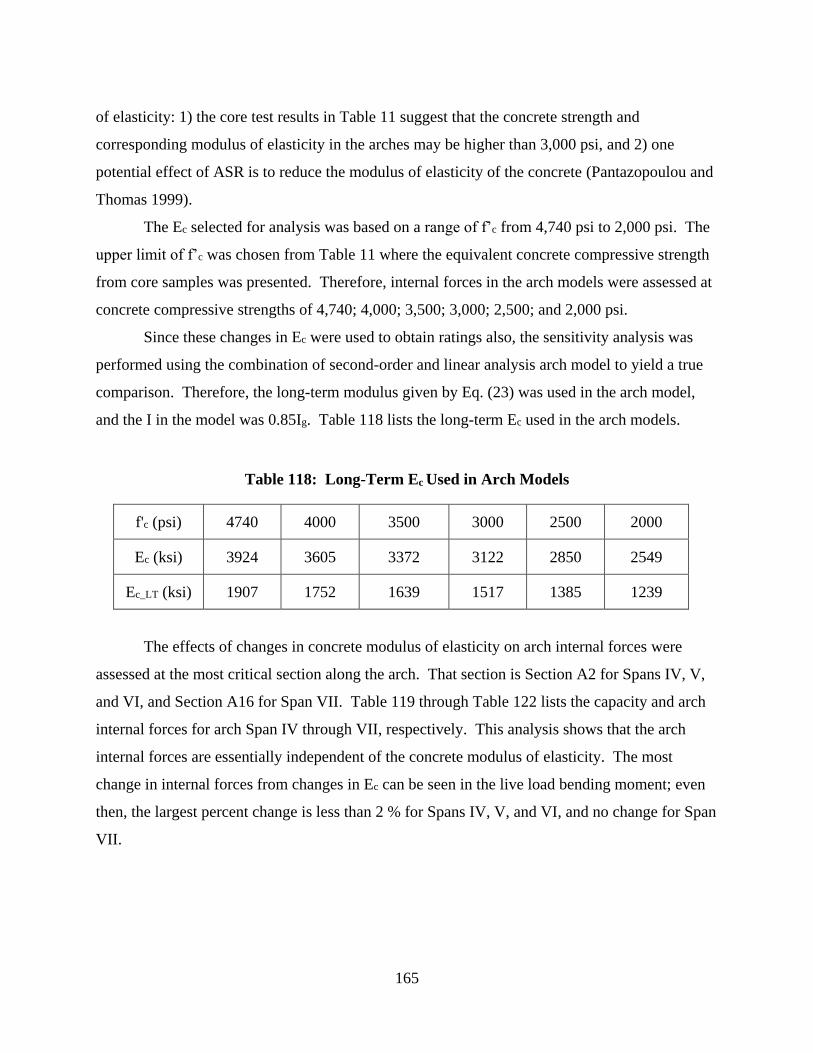
165
of elasticity: 1) the core test results in Table 11 suggest that the concrete strength and
corresponding modulus of elasticity in the arches may be higher than 3,000 psi, and 2) one
potential effect of ASR is to reduce the modulus of elasticity of the concrete (Pantazopoulou and
Thomas 1999).
The Ec selected for analysis was based on a range of f’c from 4,740 psi to 2,000 psi. The
upper limit of f’c was chosen from Table 11 where the equivalent concrete compressive strength
from core samples was presented. Therefore, internal forces in the arch models were assessed at
concrete compressive strengths of 4,740; 4,000; 3,500; 3,000; 2,500; and 2,000 psi.
Since these changes in Ec were used to obtain ratings also, the sensitivity analysis was
performed using the combination of second-order and linear analysis arch model to yield a true
comparison. Therefore, the long-term modulus given by Eq. (23) was used in the arch model,
and the I in the model was 0.85Ig. Table 118 lists the long-term Ec used in the arch models.
Table 118: Long-Term Ec Used in Arch Models
f'c (psi) 4740 4000 3500 3000 2500 2000
Ec (ksi) 3924 3605 3372 3122 2850 2549
Ec_LT (ksi) 1907 1752 1639 1517 1385 1239
The effects of changes in concrete modulus of elasticity on arch internal forces were
assessed at the most critical section along the arch. That section is Section A2 for Spans IV, V,
and VI, and Section A16 for Span VII. Table 119 through Table 122 lists the capacity and arch
internal forces for arch Span IV through VII, respectively. This analysis shows that the arch
internal forces are essentially independent of the concrete modulus of elasticity. The most
change in internal forces from changes in Ec can be seen in the live load bending moment; even
then, the largest percent change is less than 2 % for Spans IV, V, and VI, and no change for Span
VII.
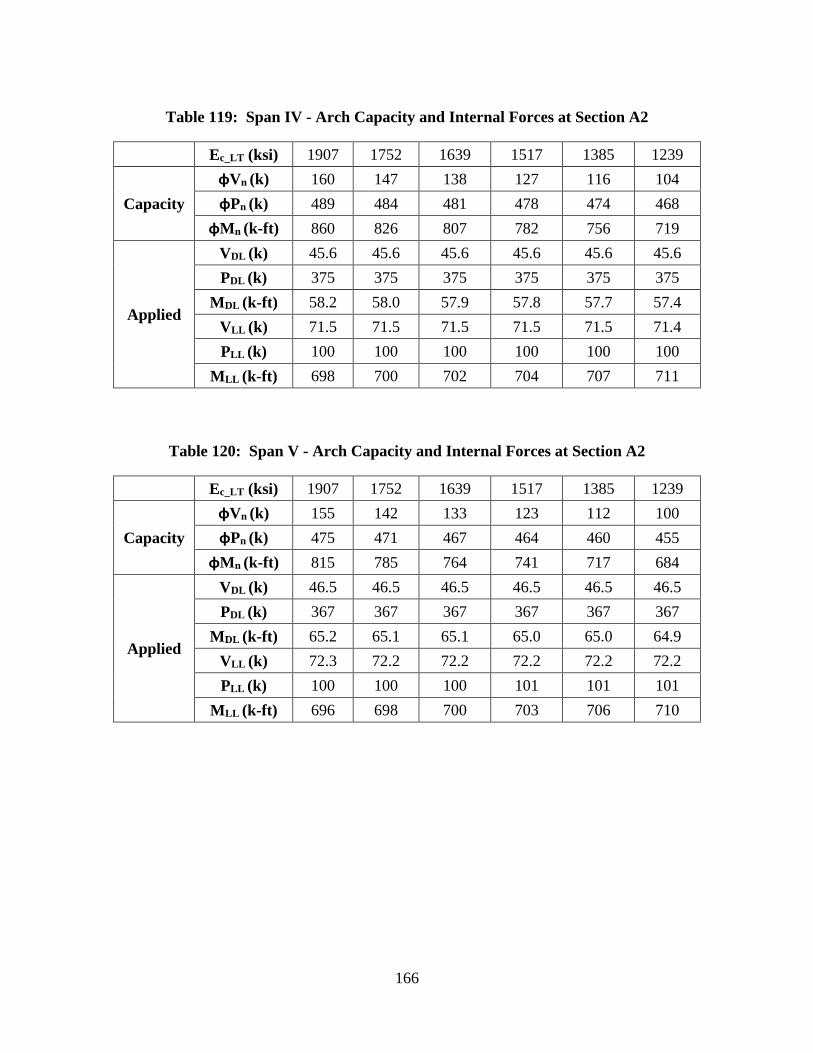
166
Table 119: Span IV - Arch Capacity and Internal Forces at Section A2
Ec_LT (ksi) 1907 1752 1639 1517 1385 1239
Capacity
φVn (k) 160 147 138 127 116 104
φPn (k) 489 484 481 478 474 468
φMn (k-ft) 860 826 807 782 756 719
Applied
VDL (k) 45.6 45.6 45.6 45.6 45.6 45.6
PDL (k) 375 375 375 375 375 375
MDL (k-ft) 58.2 58.0 57.9 57.8 57.7 57.4
VLL (k) 71.5 71.5 71.5 71.5 71.5 71.4
PLL (k) 100 100 100 100 100 100
MLL (k-ft) 698 700 702 704 707 711
Table 120: Span V - Arch Capacity and Internal Forces at Section A2
Ec_LT (ksi) 1907 1752 1639 1517 1385 1239
Capacity
φVn (k) 155 142 133 123 112 100
φPn (k) 475 471 467 464 460 455
φMn (k-ft) 815 785 764 741 717 684
Applied
VDL (k) 46.5 46.5 46.5 46.5 46.5 46.5
PDL (k) 367 367 367 367 367 367
MDL (k-ft) 65.2 65.1 65.1 65.0 65.0 64.9
VLL (k) 72.3 72.2 72.2 72.2 72.2 72.2
PLL (k) 100 100 100 101 101 101
MLL (k-ft) 696 698 700 703 706 710

167
Table 121: Span VI - Arch Capacity and Internal Forces at Section A2
Ec_LT (ksi) 1907 1752 1639 1517 1385 1239
Capacity
φVn (k) 150 138 129 120 109 98
φPn (k) 435 431 428 424 420 416
φMn (k-ft) 698 675 656 636 611 585
Applied
VDL (k) 38.5 38.5 38.5 38.5 38.5 38.5
PDL (k) 327 327 327 327 327 327
MDL (k-ft) 37.1 37.0 37.0 36.8 36.7 36.5
VLL (k) 72.2 72.2 72.2 72.2 72.2 72.1
PLL (k) 101 101 101 102 102 102
MLL (k-ft) 622 623 624 626 628 631
Table 122: Span VII - Arch Capacity and Internal Forces at Section A16
Ec_LT (ksi) 1907 1752 1639 1517 1385 1239
Capacity
φVn (k) 86.3 79.3 74.2 68.7 62.7 56.1
φPn (k) 222 214 208 202 196 189
φMn (k-ft) 266 251 242 230 219 206
Applied
VDL (k) 28.9 28.9 28.9 28.9 28.9 28.9
PDL (k) 94.9 94.9 94.9 94.9 94.9 94.9
MDL (k-ft) 32.6 32.6 32.6 32.6 32.6 32.6
VLL (k) 46.0 46.0 46.0 46.0 46.0 46.0
PLL (k) 79.6 79.6 79.6 79.6 79.6 79.6
MLL (k-ft) 147 147 147 147 147 147
The changes in concrete modulus of elasticity did not affect the arch internal forces
significantly; however, it did affect the dead and live load deflection as expected. This is
presented in the next section.
6.4 EFFECTS OF CHANGES IN CONCRETE MODULUS OF ELASTICITY ON ARCH DEFLECTIONS
The effects of changes in concrete modulus of elasticity on arch deflections were analyzed at the
same levels of f’c and long-term Ec from the previous section. The arch models utilized were the
168
same arch models from the previous section. Deflections were obtained at the single location for
Spans IV through VII, where the combined effect of dead and live load deflection was the
largest. That location is on the arch rib at the Hanger 3 location for Spans IV, V, and VI, and at
Column 5 for Span VII. Drawings with these vertical components pointed out are in Figure 61
and Figure 65, respectively.
Figure 71 through Figure 74 shows the deflection plot of the dead and live loads for
Spans IV through Span VII, respectively, as the long-term modulus of elasticity is varied.
Accompanying these plots are Table 123 through Table 126 that list the magnitudes of the dead
and live load deflection along with the total deflection.
The plots show that as the long-term Ec decreases from 1,907 ksi to 1,239 ksi,
corresponding to a decrease in f’c from 4,740 psi to 2,000 psi the dead and live load defection
increases. However, the live load deflection is more sensitive to the decrease in long-term Ec.
When comparing the smallest long-term Ec, 1,239 ksi, the largest total deflection is seen in Span
V on the arch rib at Hanger 3 with a downward displacement of 3.19 in. On the other hand, the
smallest total deflection is seen in Span VII on the arch rib at Column 5 with a downward
displacement of 0.34 in.

169
Figure 71: Span IV - Effects of Changes in Ec on Deflection
Table 123: Span IV – Effects of Changes in Ec on Total Deflection
f'c (psi) 4740 4000 3500 3000 2500 2000
Ec LT (ksi) 1907 1752 1639 1517 1385 1239
Arch
Deflection
at Hanger 3
DL (in.) -0.18 -0.20 -0.21 -0.23 -0.25 -0.28
LL (in.) -1.74 -1.91 -2.05 -2.22 -2.45 -2.77
Δtotal (in.) -1.93 -2.11 -2.26 -2.45 -2.70 -3.05
-3.00
-2.50
-2.00
-1.50
-1.00
-0.50
0.00
15002000250030003500400045005000D
efle
ctio
n (
in.)
f'c (psi)
DL Deflection
LL Deflection
1858 1752 1639 1517 1385 1239
Ec LT (ksi)

170
Figure 72: Span V - Effects of Changes in Ec on Deflection
Table 124: Span V – Effects of Changes in Ec on Total Deflection
f'c (psi) 4740 4000 3500 3000 2500 2000
Ec LT (ksi) 1907 1752 1639 1517 1385 1239
Arch
Deflection
at Hanger 3
DL (in.) -0.17 -0.19 -0.20 -0.22 -0.24 -0.27
LL (in.) -1.84 -2.02 -2.16 -2.35 -2.59 -2.92
Δtotal (in.) -2.02 -2.21 -2.37 -2.57 -2.83 -3.19
-3.50
-3.00
-2.50
-2.00
-1.50
-1.00
-0.50
0.00
15002000250030003500400045005000
Def
lect
ion
(in
.)
f'c (psi)
DL Deflection
LL Deflection
1858 1752 1639 1517 1385 1239
Ec LT (ksi)

171
Figure 73: Span VI - Effects of Changes in Ec on Deflection
Table 125: Span VI – Effects of Changes in Ec on Total Deflection
f'c (psi) 4740 4000 3500 3000 2500 2000
Ec LT (ksi) 1907 1752 1639 1517 1385 1239
Arch
Deflection
at Hanger 3
DL (in.) -0.16 -0.18 -0.19 -0.21 -0.23 -0.25
LL (in.) -1.46 -1.59 -1.71 -1.85 -2.04 -2.29
Δtotal (in.) -1.62 -1.77 -1.90 -2.06 -2.27 -2.55
-2.50
-2.00
-1.50
-1.00
-0.50
0.00
15002000250030003500400045005000D
efle
ctio
n (
in.)
f'c (psi)
DL Deflection
LL Deflection
1858 1752 1639 1517 1385 1239
Ec LT (ksi)

172
Figure 74: Span VII - Effects of Changes in Ec on Deflection
Table 126: Span VII – Effects of Changes in Ec on Total Deflection
f'c (psi) 4740 4000 3500 3000 2500 2000
Ec LT (ksi) 1907 1752 1639 1517 1385 1239
Arch
Deflection at
Column 5
DL (in.) -0.03 -0.04 -0.04 -0.04 -0.05 -0.05
LL (in.) -0.19 -0.21 -0.22 -0.24 -0.26 -0.29
Δtotal (in.) -0.22 -0.24 -0.26 -0.28 -0.31 -0.34
-0.35
-0.30
-0.25
-0.20
-0.15
-0.10
-0.05
0.00
15002000250030003500400045005000
Def
lect
ion
(in
.)
f'c (psi)
DL Deflection
LL Deflection
1858 1752 1639 1517 1385 1239
Ec LT (ksi)

173
6.5 EFFECTS OF CHANGES IN CONCRETE COMPRESSIVE STRENGTH ON ARCH RATINGS
The effects of changes in concrete compressive strength on arch ratings were analyzed at a range
of f’c from 4,740 psi to 2,000 psi. The upper limit of f’c was chosen from Table 11 where the
equivalent concrete compressive strength from core samples was presented for the arch.
Therefore, effects of changes in f’c on arch ratings were assessed at concrete strengths of 4,740;
4,000; 3,500; 3,000; 2,500; and 2,000 psi.
The model utilized for analyzing the effects of f’c on arch ratings was the combination of
second-order and linear analysis arch model. This model was used to obtain the ratings reported
in Chapter 5 of this report. The modulus of elasticity used was the long-term Ec, and the I in the
model was 0.85Ig. Table 118 lists the f’c and long-term Ec used in this sensitivity analysis.
Arch ratings were obtained at the most critical location on the arch for the tri-axle truck.
For Spans IV through VI, the most critical arch section is A2. For Span VII, it is A16. Drawings
with these sections pointed out are in Figure 62, Figure 63, Figure 64, and Figure 66 for Spans
IV, V, VI, and VII, respectively.
Figure 75 through Figure 78 are the plots of operating rating factor as a function of f’c for
shear and combined axial load and bending moment for Spans IV through VII, respectively.
Accompanying theses plots are Table 127 through Table 130 that show both the operating and
inventory rating factors for each level of concrete compressive strength analyzed.
For Spans IV through VII, as the concrete compressive strength decreases from 4,740 psi
to 2,000 psi, the rating factors decrease also. However, the shear rating factors are more
sensitive to the decrease in f’c than the combination of axial load and bending moment rating
factors.
At the 3,000 psi f’c level, Spans V and VI have an operating rating factor for combined
axial load and bending moment of 0.96. At the same f’c, Span VII has an operating shear rating
of 0.86. However, this sensitivity analysis shows that at f’c of 4,000 psi, all the arch ratings are
above 1.0.

174
Figure 75: Span IV - Effect of f’c on Arch Operating Ratings
Table 127: Span IV – Effect of f’c on Arch Ratings
f’c (psi) 4740 4000 3500 3000 2500 2000
LFR Oper. Inv. Oper. Inv. Oper. Inv. Oper. Inv. Oper. Inv. Oper. Inv.
P and M 1.15 0.69 1.10 0.66 1.07 0.64 1.03 0.62 0.99 0.59 0.93 0.56
V 1.60 0.96 1.42 0.85 1.29 0.77 1.14 0.69 0.99 0.59 0.82 0.49
0.00
0.20
0.40
0.60
0.80
1.00
1.20
1.40
1.60
1.80
15002000250030003500400045005000
Op
era
tin
g R
ati
ng
Fa
cto
r
f'c (psi)
P and M Rating Factors
V Rating Factors
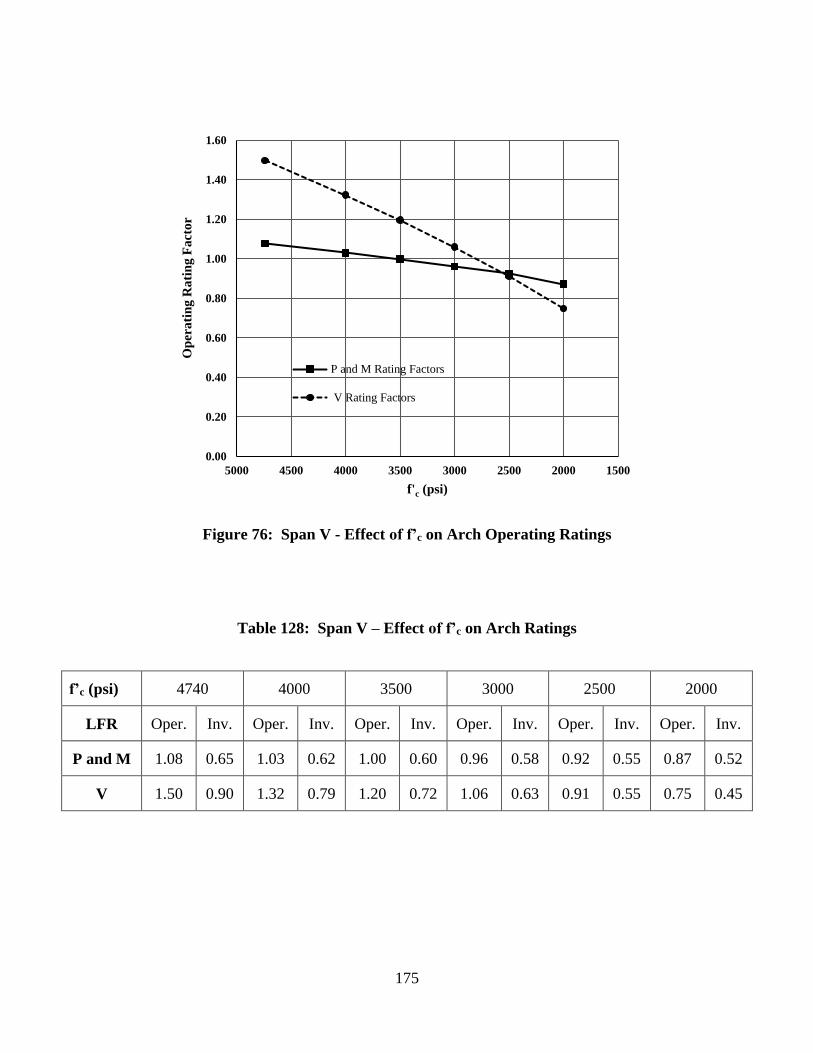
175
Figure 76: Span V - Effect of f’c on Arch Operating Ratings
Table 128: Span V – Effect of f’c on Arch Ratings
f’c (psi) 4740 4000 3500 3000 2500 2000
LFR Oper. Inv. Oper. Inv. Oper. Inv. Oper. Inv. Oper. Inv. Oper. Inv.
P and M 1.08 0.65 1.03 0.62 1.00 0.60 0.96 0.58 0.92 0.55 0.87 0.52
V 1.50 0.90 1.32 0.79 1.20 0.72 1.06 0.63 0.91 0.55 0.75 0.45
0.00
0.20
0.40
0.60
0.80
1.00
1.20
1.40
1.60
15002000250030003500400045005000
Op
era
tin
g R
ati
ng
Fa
cto
r
f'c (psi)
P and M Rating Factors
V Rating Factors
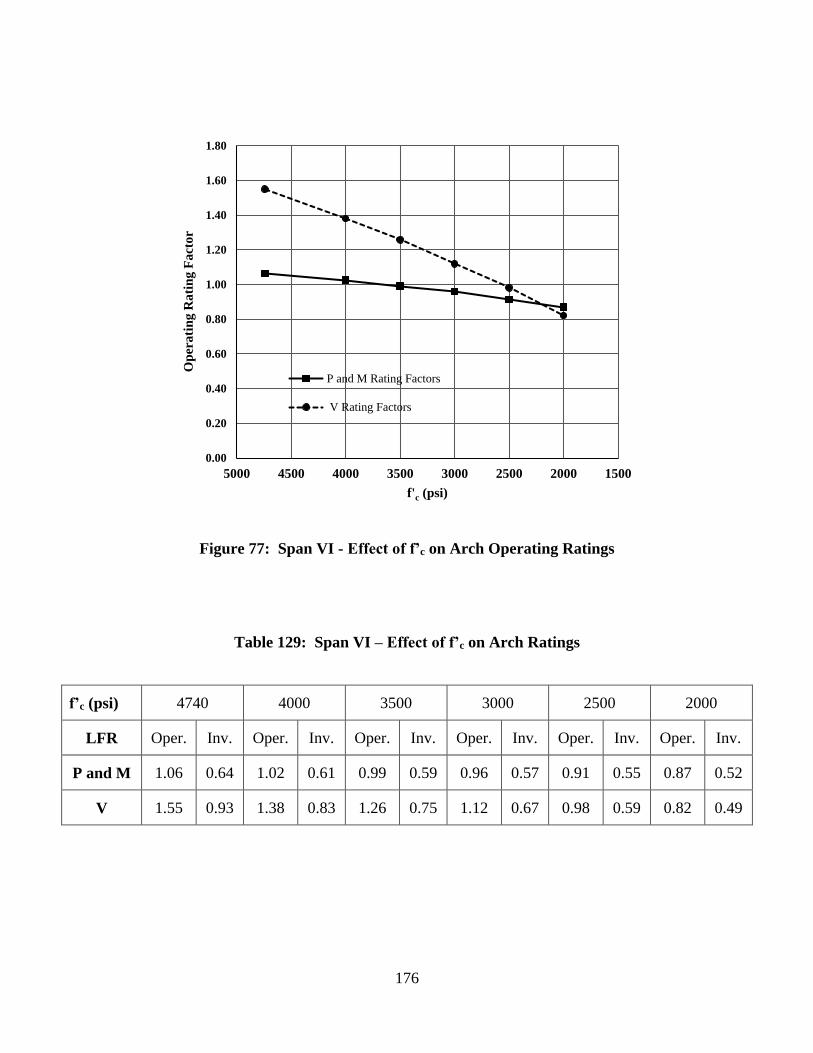
176
Figure 77: Span VI - Effect of f’c on Arch Operating Ratings
Table 129: Span VI – Effect of f’c on Arch Ratings
f’c (psi) 4740 4000 3500 3000 2500 2000
LFR Oper. Inv. Oper. Inv. Oper. Inv. Oper. Inv. Oper. Inv. Oper. Inv.
P and M 1.06 0.64 1.02 0.61 0.99 0.59 0.96 0.57 0.91 0.55 0.87 0.52
V 1.55 0.93 1.38 0.83 1.26 0.75 1.12 0.67 0.98 0.59 0.82 0.49
0.00
0.20
0.40
0.60
0.80
1.00
1.20
1.40
1.60
1.80
15002000250030003500400045005000
Op
era
tin
g R
ati
ng
Fa
cto
r
f'c (psi)
P and M Rating Factors
V Rating Factors
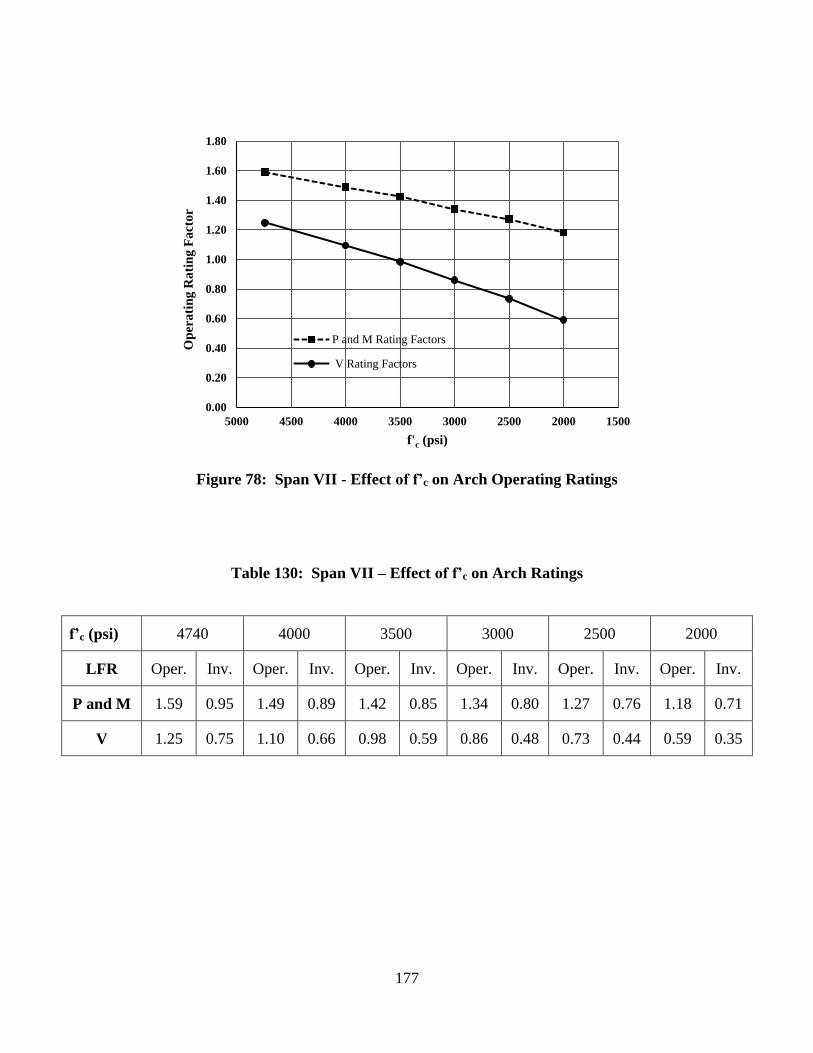
177
Figure 78: Span VII - Effect of f’c on Arch Operating Ratings
Table 130: Span VII – Effect of f’c on Arch Ratings
f’c (psi) 4740 4000 3500 3000 2500 2000
LFR Oper. Inv. Oper. Inv. Oper. Inv. Oper. Inv. Oper. Inv. Oper. Inv.
P and M 1.59 0.95 1.49 0.89 1.42 0.85 1.34 0.80 1.27 0.76 1.18 0.71
V 1.25 0.75 1.10 0.66 0.98 0.59 0.86 0.48 0.73 0.44 0.59 0.35
0.00
0.20
0.40
0.60
0.80
1.00
1.20
1.40
1.60
1.80
15002000250030003500400045005000
Op
era
tin
g R
ati
ng
Fa
cto
r
f'c (psi)
P and M Rating Factors
V Rating Factors

178
6.6 EFFECTS OF CHANGES IN CONCRETE COMPRESSIVE STRENGTH ON TRANSVERSE BEAM
RATINGS
The effects of changes in concrete compressive strength on transverse beam ratings were
analyzed at f’c intervals of 3,000, 2,500, and 2,000 psi. The corresponding Ec’s are listed in
Table 131. The analysis was performed on transverse beams with an operating rating of 1.15 or
less for the tri-axle truck for either the shear or bending moment. This included transverse
beams at Hanger 1 for Spans IV, V, and VI. The models used to perform the sensitivity analysis
are the transverse frame models that were used to obtain the ratings in Chapter 5.
Table 131: f'c and Ec for Transverse Beam Sensitivity Analysis
f'c (psi) 3000 2500 2000
Ec (ksi) 3122 2850 2549
For Spans IV through VI, Table 132 through Table 134 show the bending moment and
shear capacities, internal forces from dead and live loads, along with the rating factors for the
three levels of f’c for the transverse beams at Hanger 1. As f’c decreases, the bending moment
capacity along with the bending moments from applied load effects decrease at approximately
the same rate. As a result, the bending moment ratings are not greatly affected by changes in f’c
for the transverse beams at Hanger 1 for Spans IV through VI. In addition as f’c decreases, the
shear capacities in the three zones decrease, however, the shear from applied load effects are
unaffected by changes in f’c. As a result, the shear rating factors decrease when the f’c decreases
for the transverse beams at Hanger 1 for Spans IV through VI.
Table 132 through Table 134 show that bending moment controls the ratings of the
transverse beams. Also, the ratings are essentially unchanged over the range of concrete
strengths considered. These trends would also be true for modest increase in concrete strength.
Therefore, it is unlikely that additional information about the concrete strength that might be
obtained through core testing will result in significant improvements in the transverse beam
ratings.
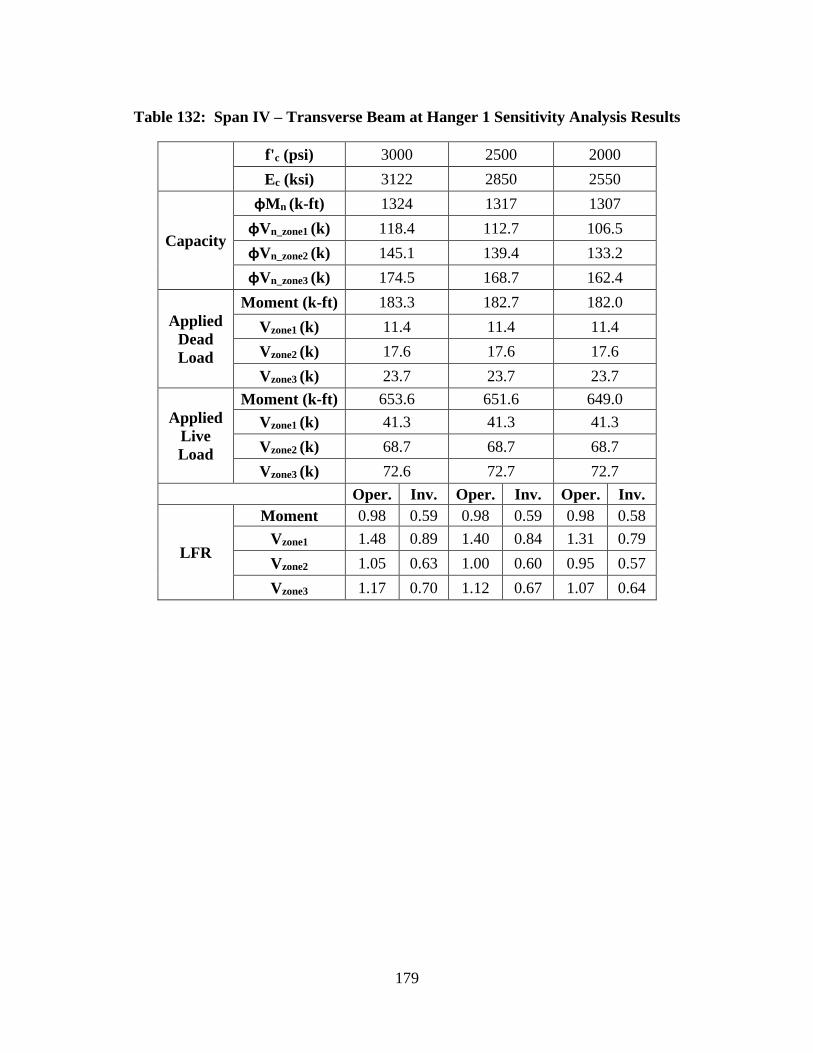
179
Table 132: Span IV – Transverse Beam at Hanger 1 Sensitivity Analysis Results
f'c (psi) 3000 2500 2000
Ec (ksi) 3122 2850 2550
Capacity
φMn (k-ft) 1324 1317 1307
φVn_zone1 (k) 118.4 112.7 106.5
φVn_zone2 (k) 145.1 139.4 133.2
φVn_zone3 (k) 174.5 168.7 162.4
Applied
Dead
Load
Moment (k-ft) 183.3 182.7 182.0
Vzone1 (k) 11.4 11.4 11.4
Vzone2 (k) 17.6 17.6 17.6
Vzone3 (k) 23.7 23.7 23.7
Applied
Live
Load
Moment (k-ft) 653.6 651.6 649.0
Vzone1 (k) 41.3 41.3 41.3
Vzone2 (k) 68.7 68.7 68.7
Vzone3 (k) 72.6 72.7 72.7
Oper. Inv. Oper. Inv. Oper. Inv.
LFR
Moment 0.98 0.59 0.98 0.59 0.98 0.58
Vzone1 1.48 0.89 1.40 0.84 1.31 0.79
Vzone2 1.05 0.63 1.00 0.60 0.95 0.57
Vzone3 1.17 0.70 1.12 0.67 1.07 0.64
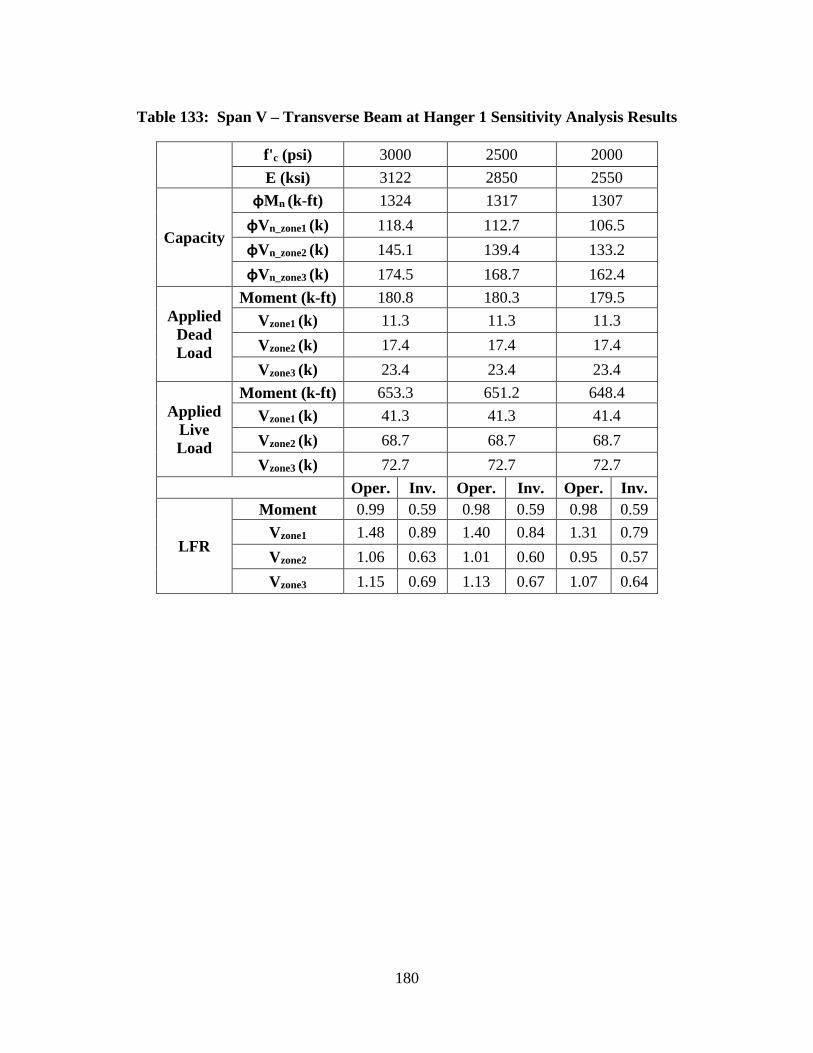
180
Table 133: Span V – Transverse Beam at Hanger 1 Sensitivity Analysis Results
f'c (psi) 3000 2500 2000
E (ksi) 3122 2850 2550
Capacity
φMn (k-ft) 1324 1317 1307
φVn_zone1 (k) 118.4 112.7 106.5
φVn_zone2 (k) 145.1 139.4 133.2
φVn_zone3 (k) 174.5 168.7 162.4
Applied
Dead
Load
Moment (k-ft) 180.8 180.3 179.5
Vzone1 (k) 11.3 11.3 11.3
Vzone2 (k) 17.4 17.4 17.4
Vzone3 (k) 23.4 23.4 23.4
Applied
Live
Load
Moment (k-ft) 653.3 651.2 648.4
Vzone1 (k) 41.3 41.3 41.4
Vzone2 (k) 68.7 68.7 68.7
Vzone3 (k) 72.7 72.7 72.7
Oper. Inv. Oper. Inv. Oper. Inv.
LFR
Moment 0.99 0.59 0.98 0.59 0.98 0.59
Vzone1 1.48 0.89 1.40 0.84 1.31 0.79
Vzone2 1.06 0.63 1.01 0.60 0.95 0.57
Vzone3 1.15 0.69 1.13 0.67 1.07 0.64

181
Table 134: Span VI – Transverse Beam at Hanger 1 Sensitivity Analysis Results
f'c (psi) 3000 2500 2000
E (ksi) 3122 2850 2550
Capacity
φMn (k-ft) 1219 1212 1202
φVn_zone1 (k) 109.2 104.0 98.2
φVn_zone2 (k) 133.9 128.7 122.9
φVn_zone3 (k) 161.2 155.9 150.0
Applied
Dead
Load
Moment (k-ft) 157.2 156.5 155.6
Vzone1 (k) 10.0 10.0 10.0
Vzone2 (k) 14.6 14.6 14.6
Vzone3 (k) 20.7 20.7 20.7
Applied
Live
Load
Moment (k-ft) 648.6 645.9 642.4
Vzone1 (k) 41.5 41.5 41.5
Vzone2 (k) 65.0 65.0 65.0
Vzone3 (k) 73.0 73.0 73.0
Oper. Inv. Oper. Inv. Oper. Inv.
LFR
Moment 0.93 0.55 0.92 0.55 0.92 0.55
Vzone1 1.37 0.82 1.30 0.78 1.21 0.73
Vzone2 1.05 0.63 1.00 0.60 0.95 0.57
Vzone3 1.09 0.65 1.05 0.63 1.00 0.60
6.7 EFFECTS OF CHANGES IN CONCRETE COMPRESSIVE STRENGTH ON TRANSVERSE DEEP
BEAM RATINGS
The effects of changes in concrete compressive strength on transverse deep beam ratings were
analyzed at the same f’c values of 3,000, 2,500, and 2,000 psi from the previous section. The
analysis was performed on transverse deep beams with an operating rating of 1.15 or less for the
tri-axle truck for bending moment. This included Transverse Deep Beam of Spans V and VI.
The models used to perform the sensitivity analysis are the transverse deep beam models that
were used to obtain the ratings in Chapter 5.
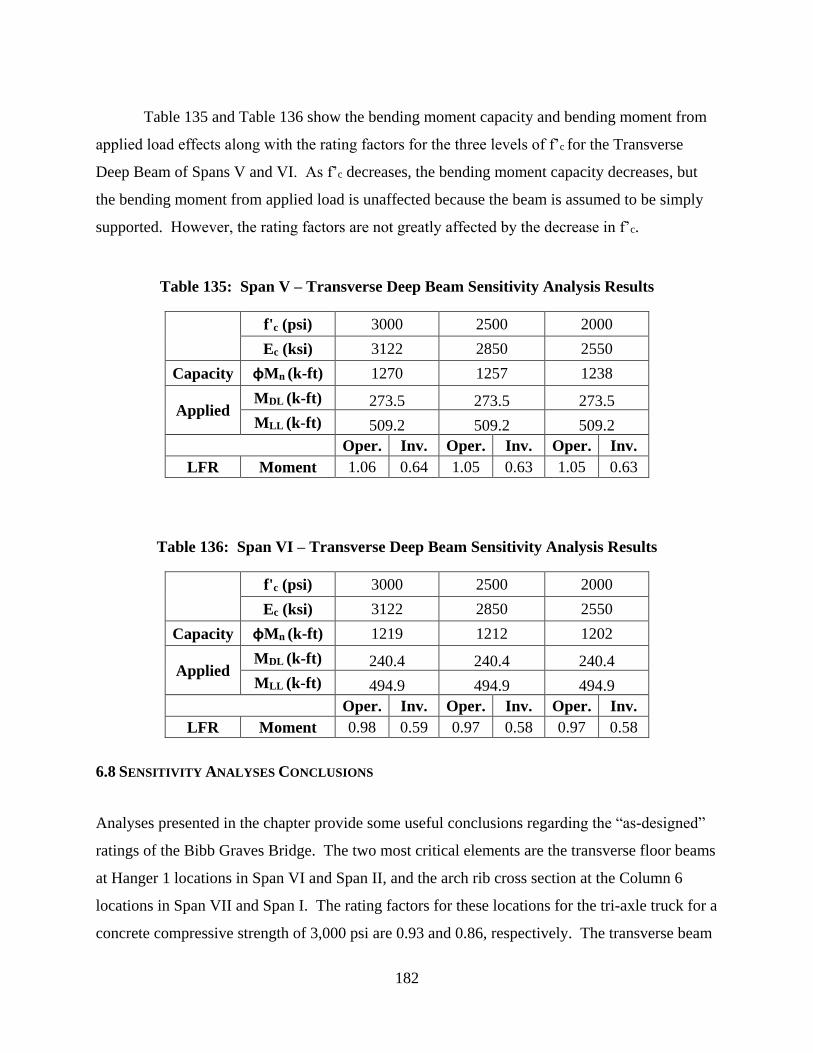
182
Table 135 and Table 136 show the bending moment capacity and bending moment from
applied load effects along with the rating factors for the three levels of f’c for the Transverse
Deep Beam of Spans V and VI. As f’c decreases, the bending moment capacity decreases, but
the bending moment from applied load is unaffected because the beam is assumed to be simply
supported. However, the rating factors are not greatly affected by the decrease in f’c.
Table 135: Span V – Transverse Deep Beam Sensitivity Analysis Results
f'c (psi) 3000 2500 2000
Ec (ksi) 3122 2850 2550
Capacity φMn (k-ft) 1270 1257 1238
Applied MDL (k-ft) 273.5 273.5 273.5
MLL (k-ft) 509.2 509.2 509.2
Oper. Inv. Oper. Inv. Oper. Inv.
LFR Moment 1.06 0.64 1.05 0.63 1.05 0.63
Table 136: Span VI – Transverse Deep Beam Sensitivity Analysis Results
f'c (psi) 3000 2500 2000
Ec (ksi) 3122 2850 2550
Capacity φMn (k-ft) 1219 1212 1202
Applied MDL (k-ft) 240.4 240.4 240.4
MLL (k-ft) 494.9 494.9 494.9
Oper. Inv. Oper. Inv. Oper. Inv.
LFR Moment 0.98 0.59 0.97 0.58 0.97 0.58
6.8 SENSITIVITY ANALYSES CONCLUSIONS
Analyses presented in the chapter provide some useful conclusions regarding the “as-designed”
ratings of the Bibb Graves Bridge. The two most critical elements are the transverse floor beams
at Hanger 1 locations in Span VI and Span II, and the arch rib cross section at the Column 6
locations in Span VII and Span I. The rating factors for these locations for the tri-axle truck for a
concrete compressive strength of 3,000 psi are 0.93 and 0.86, respectively. The transverse beam

183
ratings are controlled by flexure and are not significantly affected by changes in concrete
compressive strength. So, additional information that may be gained from core testing of the
concrete in those beams is not likely to significantly improve the rating factor beyond 0.93. The
rating factor of 0.86 for the arch rib of Span VII and Span I is controlled by shear. Results
presented in Table 130 show that this rating factor can be increased to 0.93 by the use of a
concrete compressive strength of approximately 3,300 psi. The use of 3,300 psi appears
reasonable for an “as-designed” rating based on the core test results of Table 11. So, the rating
factors listed in Table 82 for the transverse floor beam at Hanger 1 locations in Span VI (and
Span II) are recommended for use as the controlling ratings of the bridge.
ASR-expansion was simulated using a uniform temperature increase in the portions of the
arch rib above the roadway deck in Span V. Based on those analyses the following conclusions
are made. Transverse flexural cracking on the top surface of the arch rib at the Hanger 1
locations and on the bottom surface of the arch rib at the base of the arch was predicted to result
from large magnitudes of ASR-expansion. Upward vertical deflection at the peak of the arch of
Span V was predicted to increase at a rate of approximately one inch in 5 or 6 years due to
expansion. If ASR-expansion is creating internal forces in the arch ribs similar to those resulting
from a uniform temperature increase, it may be possible to monitor the resulting deflections to
gain insight about the changing condition of the bridge. Also, the locations where transverse
flexural cracking was predicted to occur should be monitored for signs of distress as part of
future bridge inspections.
Applied bending moments, shears, and axial forces at cross sections in the arch ribs were
found to be only mildly affected by changes in concrete modulus of elasticity. If future ASR-
expansion causes moderate reductions in the modulus of elasticity of the arch rib concrete, the
applied forces used in the ratings reported here will not change significantly. But, the cross
section capacities may be significantly reduced by ASR. The reductions in cross section
capacity may not be accurately predicted by simple reductions in the assumed concrete
compressive strength. Predictions of the loss in cross section capacity due to ASR were outside
the scope of this project but are worthy of future study.
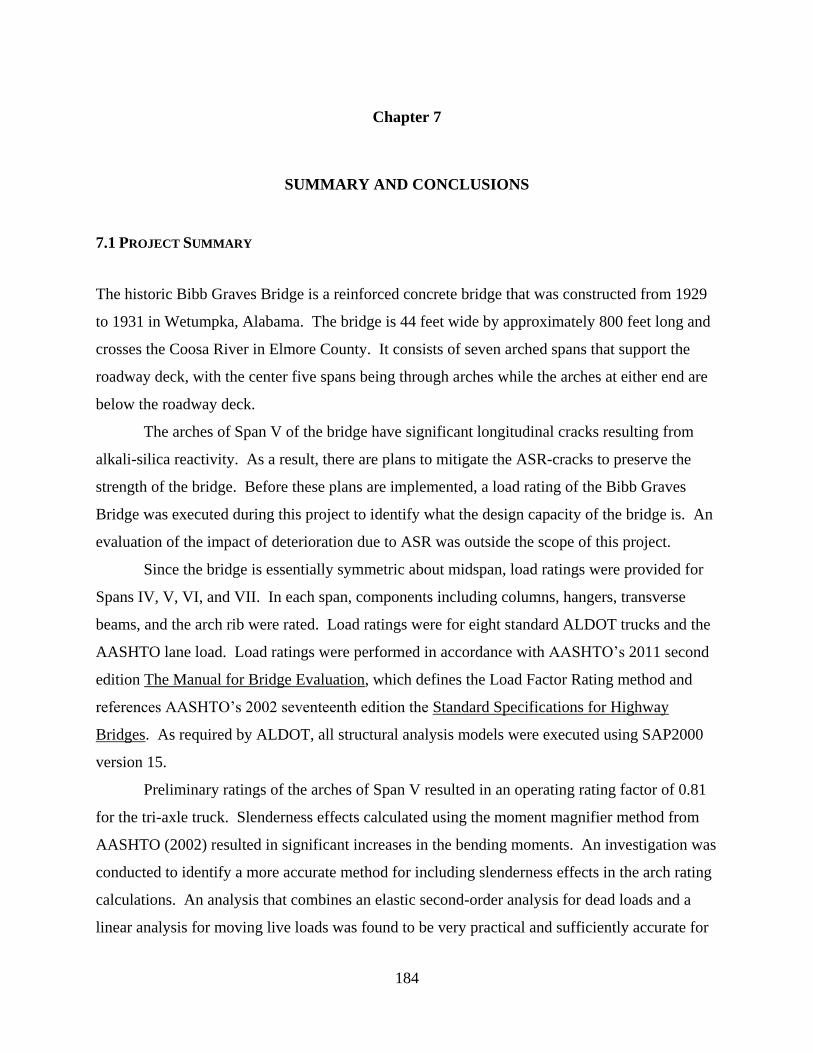
184
Chapter 7
SUMMARY AND CONCLUSIONS
7.1 PROJECT SUMMARY
The historic Bibb Graves Bridge is a reinforced concrete bridge that was constructed from 1929
to 1931 in Wetumpka, Alabama. The bridge is 44 feet wide by approximately 800 feet long and
crosses the Coosa River in Elmore County. It consists of seven arched spans that support the
roadway deck, with the center five spans being through arches while the arches at either end are
below the roadway deck.
The arches of Span V of the bridge have significant longitudinal cracks resulting from
alkali-silica reactivity. As a result, there are plans to mitigate the ASR-cracks to preserve the
strength of the bridge. Before these plans are implemented, a load rating of the Bibb Graves
Bridge was executed during this project to identify what the design capacity of the bridge is. An
evaluation of the impact of deterioration due to ASR was outside the scope of this project.
Since the bridge is essentially symmetric about midspan, load ratings were provided for
Spans IV, V, VI, and VII. In each span, components including columns, hangers, transverse
beams, and the arch rib were rated. Load ratings were for eight standard ALDOT trucks and the
AASHTO lane load. Load ratings were performed in accordance with AASHTO’s 2011 second
edition The Manual for Bridge Evaluation, which defines the Load Factor Rating method and
references AASHTO’s 2002 seventeenth edition the Standard Specifications for Highway
Bridges. As required by ALDOT, all structural analysis models were executed using SAP2000
version 15.
Preliminary ratings of the arches of Span V resulted in an operating rating factor of 0.81
for the tri-axle truck. Slenderness effects calculated using the moment magnifier method from
AASHTO (2002) resulted in significant increases in the bending moments. An investigation was
conducted to identify a more accurate method for including slenderness effects in the arch rating
calculations. An analysis that combines an elastic second-order analysis for dead loads and a
linear analysis for moving live loads was found to be very practical and sufficiently accurate for

185
determining the load ratings of the arches. Using this combined analysis approach resulted in
significant increases in the arch ratings beyond those calculated using the AASHTO moment
magnifier method. The resulting operating rating factor for the Span V arches increased from
0.81 to 0.96 for a concrete compressive strength of 3,000 psi.
In addition to the bridge ratings, a series of analyses was performed to estimate the
effects of ASR-expansion on the internal forces and deflections of the arches of Span V. ASR-
expansion was simulated as a uniform thermal expansion in the portion of the arch rib that is
above the deck since that is the area where the arches exhibit the most significant ASR-induced
longitudinal cracking. The annual amount of longitudinal ASR-expansion was estimated from
field measurements of transverse ASR strain reported by Johnson et al. (2014).
The effects of changes in concrete compressive strength and modulus of elasticity on arch
internal forces, ratings and deflections were examined. And, the effects of changes in concrete
compressive strength on transverse beam ratings were examined.
7.2 PROJECT CONCLUSIONS
From the eight standard ALDOT trucks for ratings, the tri-axle truck controls all ratings for all
rated components. Presented below by span are components of the bridge where load postings
may be necessary if load ratings are based on the 3,000 psi concrete compressive strength. All
critical ratings mentioned below are for the tri-axle truck except as noted. Based on the
symmetry of the bridge, the conclusions stated below for Span V also apply to Span III,
conclusions for Span VI apply to Span II, and conclusions for Span VII apply to Span I.
For Span IV, all operating rating factors for the rated components are 1.0 and above
except for the transverse beam at the midspan hanger, Hanger 1, location where the rating factor
is 0.98 for bending moment.
For Span V, all operating rating factors for the rated components are 1.0 and above
except for two components. The first component is the arch rib at the midspan hanger, Section
A2, which has a rating factor of 0.96 for combined axial load and bending moment. The second
component is the transverse beam at the midspan hanger, Hanger 1, location where the rating
factor is 0.99 for bending moment.
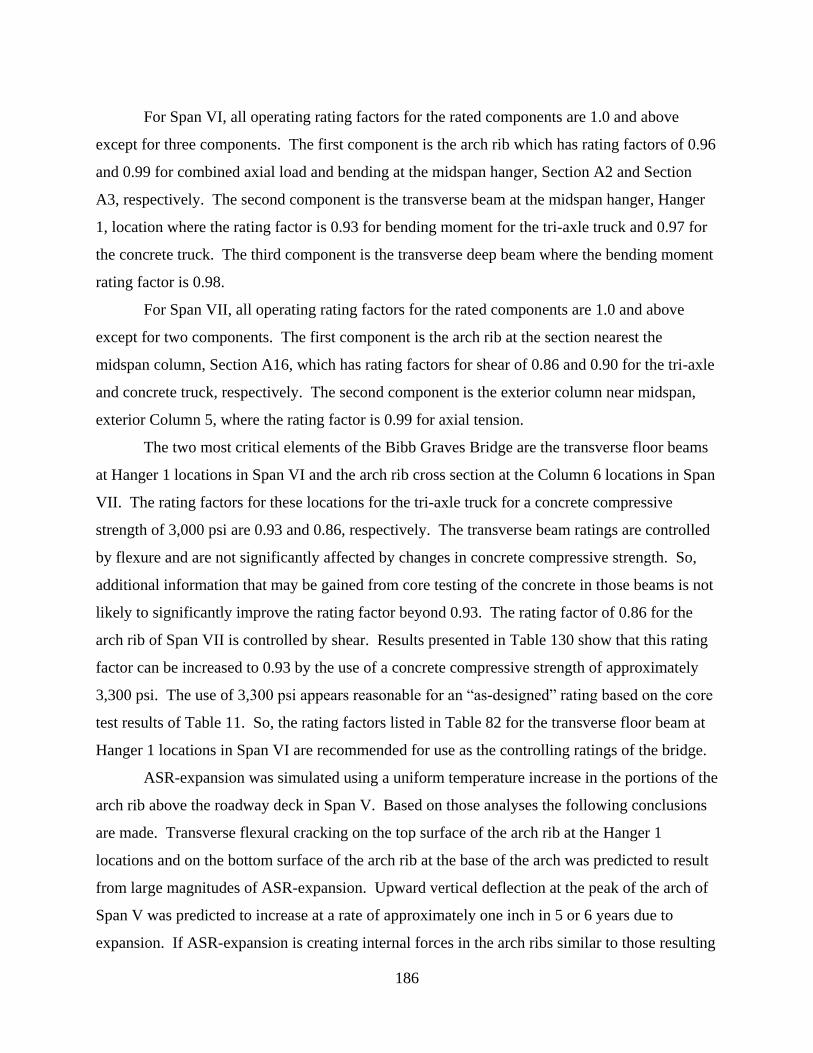
186
For Span VI, all operating rating factors for the rated components are 1.0 and above
except for three components. The first component is the arch rib which has rating factors of 0.96
and 0.99 for combined axial load and bending at the midspan hanger, Section A2 and Section
A3, respectively. The second component is the transverse beam at the midspan hanger, Hanger
1, location where the rating factor is 0.93 for bending moment for the tri-axle truck and 0.97 for
the concrete truck. The third component is the transverse deep beam where the bending moment
rating factor is 0.98.
For Span VII, all operating rating factors for the rated components are 1.0 and above
except for two components. The first component is the arch rib at the section nearest the
midspan column, Section A16, which has rating factors for shear of 0.86 and 0.90 for the tri-axle
and concrete truck, respectively. The second component is the exterior column near midspan,
exterior Column 5, where the rating factor is 0.99 for axial tension.
The two most critical elements of the Bibb Graves Bridge are the transverse floor beams
at Hanger 1 locations in Span VI and the arch rib cross section at the Column 6 locations in Span
VII. The rating factors for these locations for the tri-axle truck for a concrete compressive
strength of 3,000 psi are 0.93 and 0.86, respectively. The transverse beam ratings are controlled
by flexure and are not significantly affected by changes in concrete compressive strength. So,
additional information that may be gained from core testing of the concrete in those beams is not
likely to significantly improve the rating factor beyond 0.93. The rating factor of 0.86 for the
arch rib of Span VII is controlled by shear. Results presented in Table 130 show that this rating
factor can be increased to 0.93 by the use of a concrete compressive strength of approximately
3,300 psi. The use of 3,300 psi appears reasonable for an “as-designed” rating based on the core
test results of Table 11. So, the rating factors listed in Table 82 for the transverse floor beam at
Hanger 1 locations in Span VI are recommended for use as the controlling ratings of the bridge.
ASR-expansion was simulated using a uniform temperature increase in the portions of the
arch rib above the roadway deck in Span V. Based on those analyses the following conclusions
are made. Transverse flexural cracking on the top surface of the arch rib at the Hanger 1
locations and on the bottom surface of the arch rib at the base of the arch was predicted to result
from large magnitudes of ASR-expansion. Upward vertical deflection at the peak of the arch of
Span V was predicted to increase at a rate of approximately one inch in 5 or 6 years due to
expansion. If ASR-expansion is creating internal forces in the arch ribs similar to those resulting

187
from a uniform temperature increase, it may be possible to monitor the resulting deflections to
gain insight about the changing condition of the bridge. Also, the locations where transverse
flexural cracking was predicted to occur should be monitored for signs of distress as part of
future bridge inspections.
Applied bending moments, shears, and axial forces at cross sections in the arch ribs were
found to be only mildly affected by changes in concrete modulus of elasticity. If future ASR-
expansion causes moderate reductions in the modulus of elasticity of the arch rib concrete, the
applied forces used in the ratings reported here will not change significantly. But, the cross
section capacities may be significantly reduced by ASR. The reductions in cross section
capacity may not be accurately predicted by simple reductions in the assumed concrete
compressive strength. Predictions of the loss in cross section capacity due to ASR were outside
the scope of this project but are worthy of future study.

188
References
AASHTO. 2002. Standard Specifications for Highway Bridges. American Association of State
Highway and Transportation Officials, 17th Edition, Washington, DC. 829 pages.
AASHTO. 2011. The Manual for Bridge Evaluation. American Association of State Highway
and Transportation Officials, 2nd Edition, Washington, DC.
AASHTO. 2012. AASHTO LRFD Bridge Design Specifications. American Association of State
Highway and Transportation Officials, Washington, DC.
ACI Committee 209. 1992. Prediction of Creep, Shrinkage and Temperature Effects in
Concrete Structures. ACI209R-92. American Concrete Institute, Farmington Hills, MI.
ACI Committee 318. 2011. Building Code Requirements for Structural Concrete (ACI 318-11)
and Commentary. American Concrete Institute (ACI), Farmington Hills, MI.
ACI Committee 562. 2013. Code Requirements for Evaluation, Repair, and Rehabilitation of
Concrete Buildings (ACI 562-13) and Commentary. American Concrete Institute (ACI),
Farmington Hills, MI.
ACI Manual of Concrete Practice. 2013. Part 1 – ACI 117-10 to 225R-99. American Concrete
Institute (ACI), Farmington Hills, MI.
AHD. 1928 – 1929. “Plan and Profile of Proposed State Bridge: Over Coosa River - Elmore
County at Wetumpka State Aid Project S-327.” State of Alabama Highway Department
of Alabama (AHD).
AISC. 2005. Steel Construction Manual. American Institute of Steel Construction, 13th Edition,
United States of America.
AutoCAD. 2014. AutoCAD 2014 – English. Autodesk, Inc.
CSI Analysis Reference Manual. 2011. For SAP2000, ETABS, SAFE and CSiBridge.
Computers and Structures, Inc. California.
Geoscience News and Information. 2005. “Map of Alabama Cities – Alabama Road Map.”
Geology.com. Accessed April 26, 2014. http://geology.com/cities-map/alabama.shtml
Johnson, D. K., R. L. Warnock, A. K. Schindler, R. W. Barnes. 2014. Effectiveness of Silane in
Mitigating Alkali-Silica Reaction in the Bibb Graves Bridge. FHWA/ALDOT 930-802.
Alabama Department of Transportation. 243p.
Mathcad 14. 2014. Mathcad 14. PTC Inc. Massachusetts.
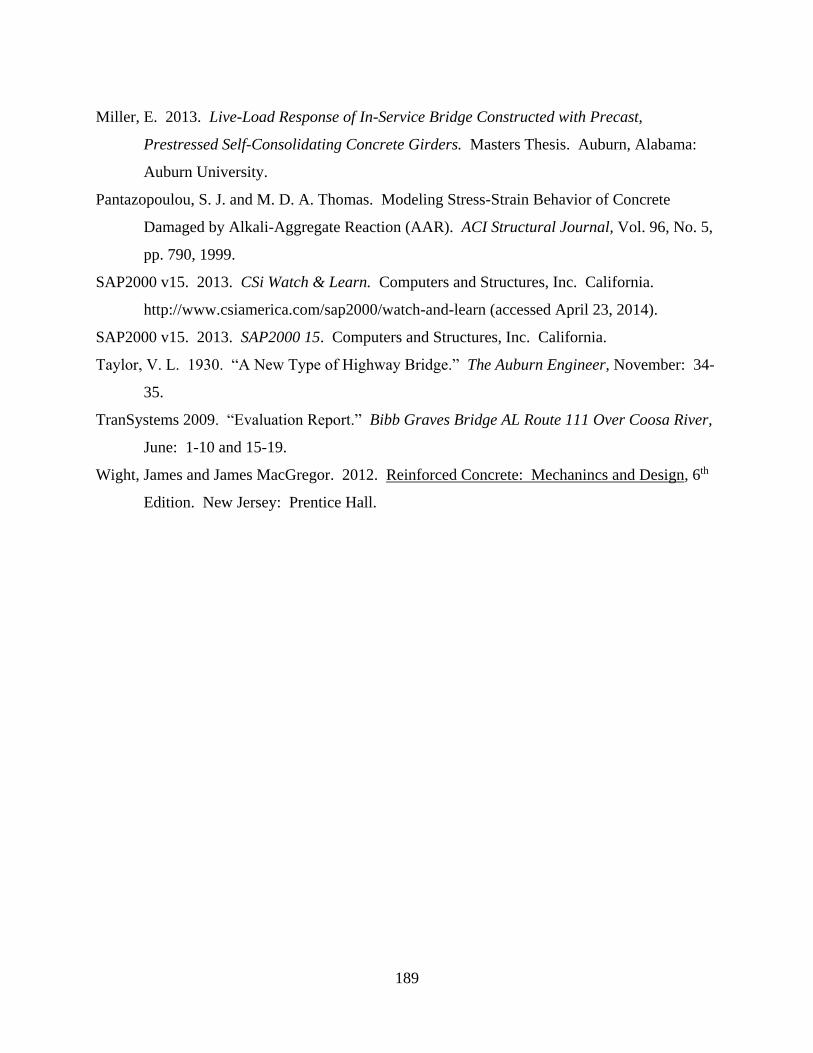
189
Miller, E. 2013. Live-Load Response of In-Service Bridge Constructed with Precast,
Prestressed Self-Consolidating Concrete Girders. Masters Thesis. Auburn, Alabama:
Auburn University.
Pantazopoulou, S. J. and M. D. A. Thomas. Modeling Stress-Strain Behavior of Concrete
Damaged by Alkali-Aggregate Reaction (AAR). ACI Structural Journal, Vol. 96, No. 5,
pp. 790, 1999.
SAP2000 v15. 2013. CSi Watch & Learn. Computers and Structures, Inc. California.
http://www.csiamerica.com/sap2000/watch-and-learn (accessed April 23, 2014).
SAP2000 v15. 2013. SAP2000 15. Computers and Structures, Inc. California.
Taylor, V. L. 1930. “A New Type of Highway Bridge.” The Auburn Engineer, November: 34-
35.
TranSystems 2009. “Evaluation Report.” Bibb Graves Bridge AL Route 111 Over Coosa River,
June: 1-10 and 15-19.
Wight, James and James MacGregor. 2012. Reinforced Concrete: Mechanincs and Design, 6th
Edition. New Jersey: Prentice Hall.
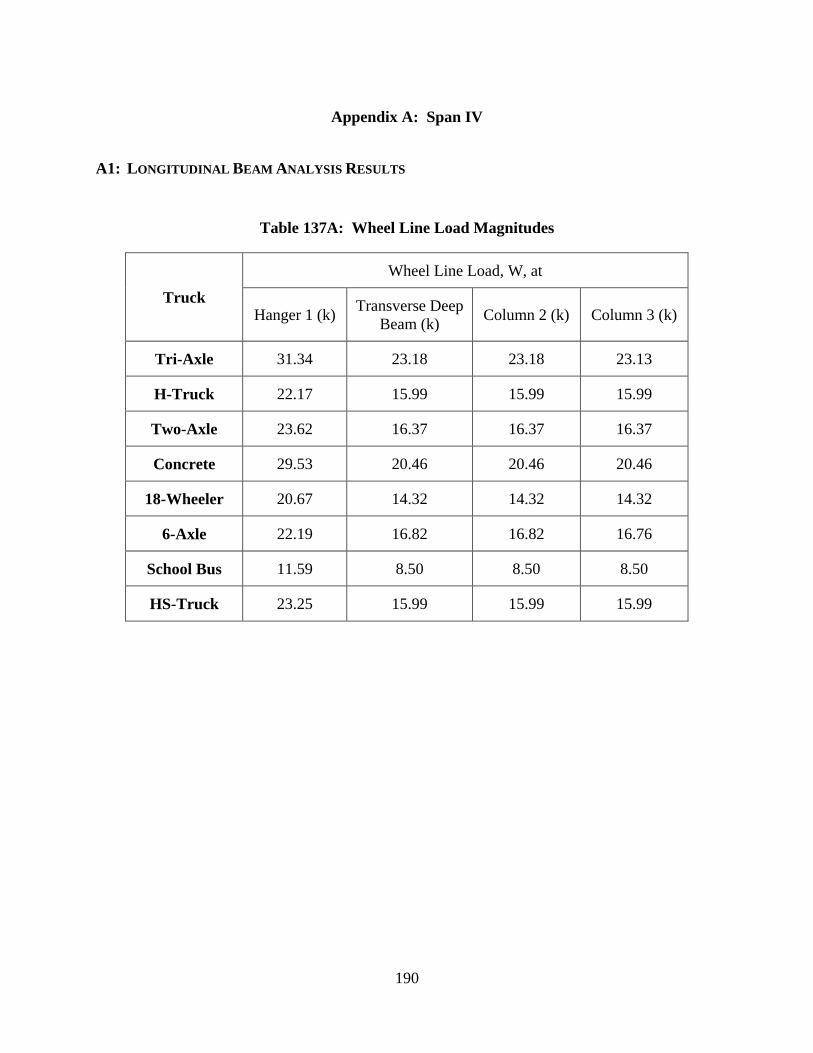
190
Appendix A: Span IV
A1: LONGITUDINAL BEAM ANALYSIS RESULTS
Table 137A: Wheel Line Load Magnitudes
Truck
Wheel Line Load, W, at
Hanger 1 (k) Transverse Deep
Beam (k) Column 2 (k) Column 3 (k)
Tri-Axle 31.34 23.18 23.18 23.13
H-Truck 22.17 15.99 15.99 15.99
Two-Axle 23.62 16.37 16.37 16.37
Concrete 29.53 20.46 20.46 20.46
18-Wheeler 20.67 14.32 14.32 14.32
6-Axle 22.19 16.82 16.82 16.76
School Bus 11.59 8.50 8.50 8.50
HS-Truck 23.25 15.99 15.99 15.99

191
A2: TRANSVERSE FLOOR BEAMS
Cross sectional properties listed within this section applies to all transverse floor frames for Span
IV unless specified differently in the following sections.
Table 138A: Transverse Floor Beam Cross Sectional Properties
Roadway Curb Bracket
Ag (ft2) 9.708 9.625 5.708
Ix (ft4) 11.01 18.75 3.453
Iy (ft4) 29.27 18.68 14.48
Table 139A: Transverse Floor Beam Dead Loads
Wslab (k/ft) 1.100
Wtrans. beam (k/ft) 0.656
Welev. beam (k/ft) 0.225
Wsidewalk (k/ft) 0.825
Wbracket (k/ft) 0.331
Prail tot (k) 0.702

192
A2.1: Transverse Floor Beam at Column 2 Ratings
Transverse floor beam at Column 2 rating results are listed in Table 140A and Table 141A.
Table 140A: Span IV - Transverse Floor Beam at Column 2 Rating Factors: Part 1
Trucks
Rating Factors
Positive Moment Negative Moment
Operating Inventory Operating Inventory
Tri-Axle 1.51 0.90 7.44 4.46
H-Truck 2.19 1.31 10.78 6.46
Two-Axle 2.14 1.28 10.53 6.31
Concrete 1.71 1.02 8.43 5.05
18-Wheeler 2.44 1.46 12.04 7.21
6-Axle 2.08 1.25 10.25 6.14
School Bus 4.12 2.47 20.29 12.15
HS-Truck 2.19 1.31 10.78 6.46
Table 141A: Span IV - Transverse Floor Beam at Column 2 Rating Factors: Part 2
Trucks
Rating Factors
Vzone1 Vzone2 Vzone3
Operating Inventory Operating Inventory Operating Inventory
Tri-Axle 2.00 1.20 1.42 0.85 1.58 0.95
H-Truck 2.90 1.74 2.06 1.24 2.29 1.37
Two-Axle 2.84 1.70 2.02 1.21 2.24 1.34
Concrete 2.27 1.36 1.61 0.97 1.79 1.07
18-Wheeler 3.24 1.94 2.30 1.38 2.56 1.53
6-Axle 2.76 1.65 1.96 1.18 2.18 1.31
School Bus 5.46 3.27 3.88 2.33 4.31 2.58
HS-Truck 2.90 1.74 2.06 1.24 2.29 1.37
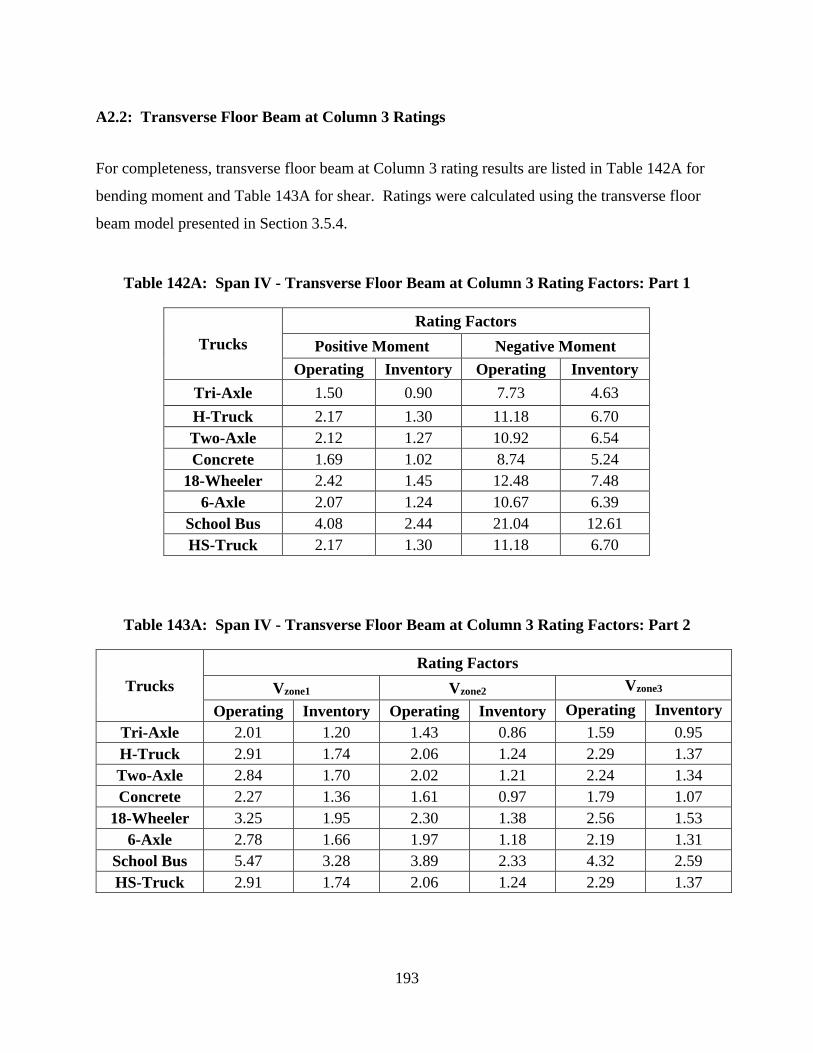
193
A2.2: Transverse Floor Beam at Column 3 Ratings
For completeness, transverse floor beam at Column 3 rating results are listed in Table 142A for
bending moment and Table 143A for shear. Ratings were calculated using the transverse floor
beam model presented in Section 3.5.4.
Table 142A: Span IV - Transverse Floor Beam at Column 3 Rating Factors: Part 1
Trucks
Rating Factors
Positive Moment Negative Moment
Operating Inventory Operating Inventory
Tri-Axle 1.50 0.90 7.73 4.63
H-Truck 2.17 1.30 11.18 6.70
Two-Axle 2.12 1.27 10.92 6.54
Concrete 1.69 1.02 8.74 5.24
18-Wheeler 2.42 1.45 12.48 7.48
6-Axle 2.07 1.24 10.67 6.39
School Bus 4.08 2.44 21.04 12.61
HS-Truck 2.17 1.30 11.18 6.70
Table 143A: Span IV - Transverse Floor Beam at Column 3 Rating Factors: Part 2
Trucks
Rating Factors
Vzone1 Vzone2 Vzone3
Operating Inventory Operating Inventory Operating Inventory
Tri-Axle 2.01 1.20 1.43 0.86 1.59 0.95
H-Truck 2.91 1.74 2.06 1.24 2.29 1.37
Two-Axle 2.84 1.70 2.02 1.21 2.24 1.34
Concrete 2.27 1.36 1.61 0.97 1.79 1.07
18-Wheeler 3.25 1.95 2.30 1.38 2.56 1.53
6-Axle 2.78 1.66 1.97 1.18 2.19 1.31
School Bus 5.47 3.28 3.89 2.33 4.32 2.59
HS-Truck 2.91 1.74 2.06 1.24 2.29 1.37

194
A3: COLUMN 2
Table 144A: Column 2 Cross Sectional Properties and Dead Load
Ag (ft2) 1.458
Ix (ft4) 0.165
Iy (ft4) 0.190
Pcolumn 2 (k) 3.955
Properties and load listed for Column 2 are for each interior and exterior column.
A4: COLUMN 3
Table 145A: Column 3 Cross Sectional Properties and Dead Load
Exterior
Interior Top Bottom
Ag (ft2) 1.750 2.400 3.742
Ix (ft4) 0.198 0.305 0.401
Iy (ft4) 0.328 0.860 5.234
Pcolumn 3 (k) 6.410 4.396 6.853

195
A5: HANGER 1
Table 146A: Hanger 1 Cross Sectional Properties and Dead Load
As (ft2) 0.0278
Ix (ft4) 0.00414
Iy (ft4) 0.00255
Phanger 1 (k) 3.280
Properties and load listed for Hanger 1 are for each interior and exterior hanger.
A6: TRANSVERSE DEEP BEAM
Table 147A: Transverse Deep Beam Cross Sectional Properties
Ag (ft2) 9.390
Ix (ft4) 30.66
Iy (ft4) 1.761
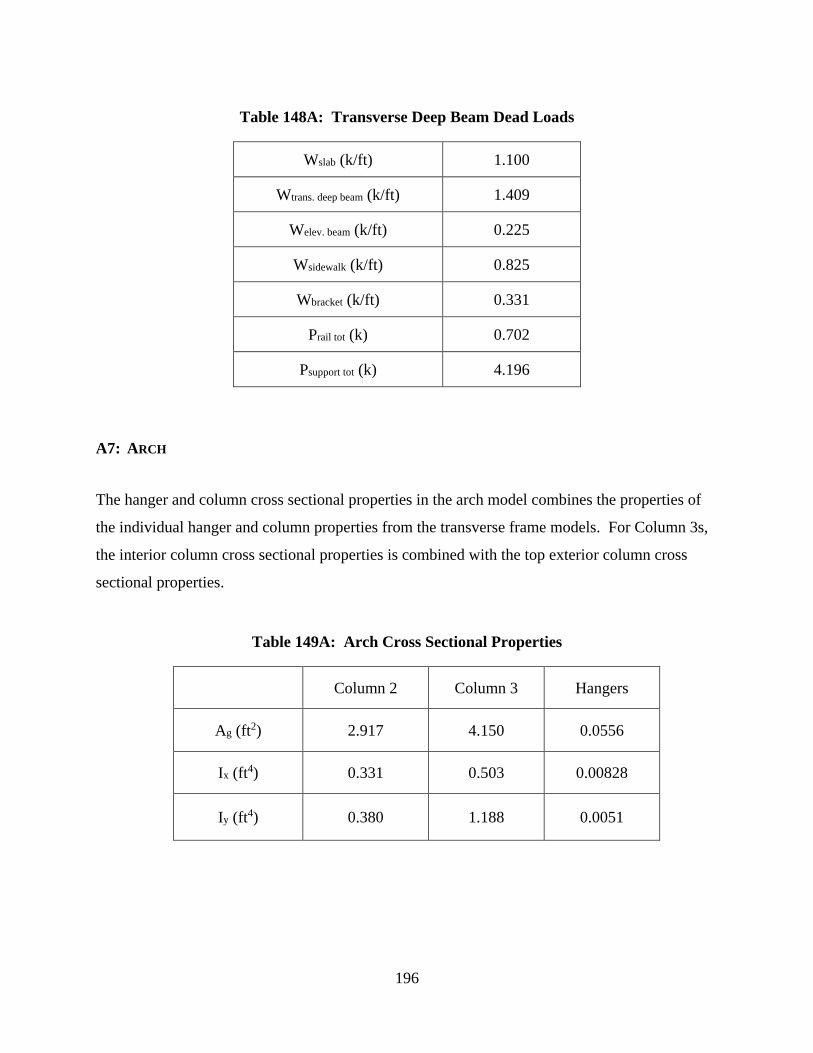
196
Table 148A: Transverse Deep Beam Dead Loads
Wslab (k/ft) 1.100
Wtrans. deep beam (k/ft) 1.409
Welev. beam (k/ft) 0.225
Wsidewalk (k/ft) 0.825
Wbracket (k/ft) 0.331
Prail tot (k) 0.702
Psupport tot (k) 4.196
A7: ARCH
The hanger and column cross sectional properties in the arch model combines the properties of
the individual hanger and column properties from the transverse frame models. For Column 3s,
the interior column cross sectional properties is combined with the top exterior column cross
sectional properties.
Table 149A: Arch Cross Sectional Properties
Column 2 Column 3 Hangers
Ag (ft2) 2.917 4.150 0.0556
Ix (ft4) 0.331 0.503 0.00828
Iy (ft4) 0.380 1.188 0.0051
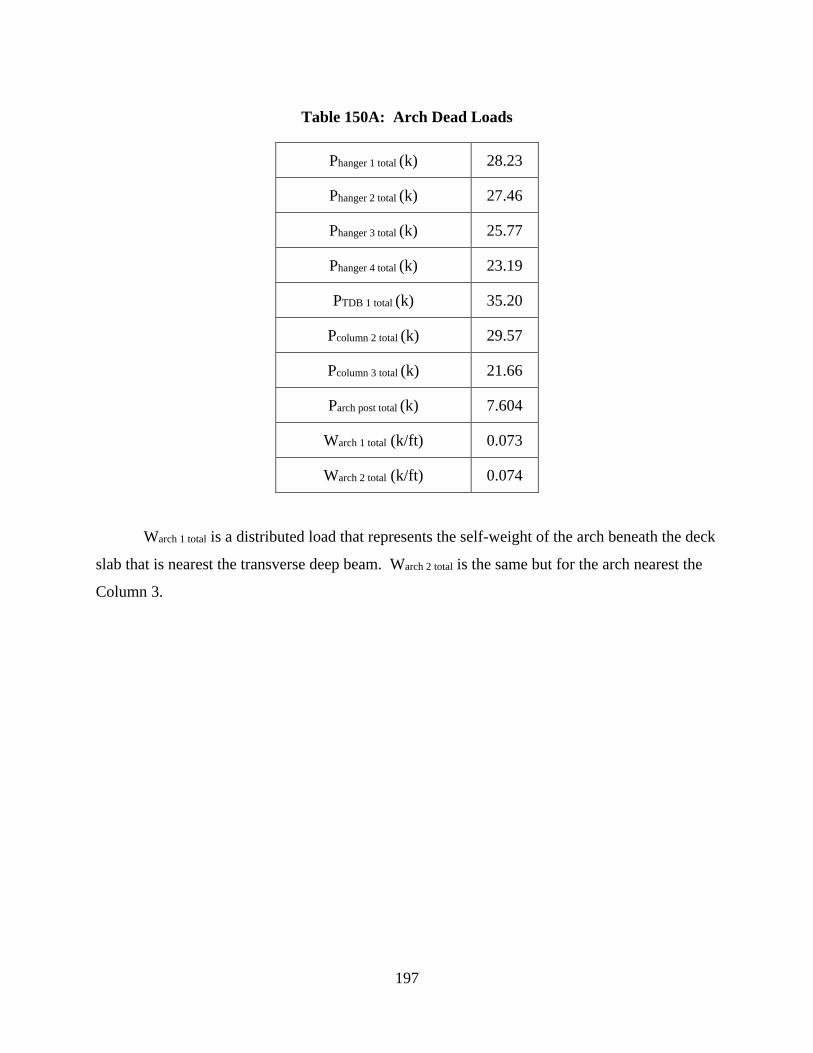
197
Table 150A: Arch Dead Loads
Warch 1 total is a distributed load that represents the self-weight of the arch beneath the deck
slab that is nearest the transverse deep beam. Warch 2 total is the same but for the arch nearest the
Column 3.
Phanger 1 total (k) 28.23
Phanger 2 total (k) 27.46
Phanger 3 total (k) 25.77
Phanger 4 total (k) 23.19
PTDB 1 total (k) 35.20
Pcolumn 2 total (k) 29.57
Pcolumn 3 total (k) 21.66
Parch post total (k) 7.604
Warch 1 total (k/ft) 0.073
Warch 2 total (k/ft) 0.074
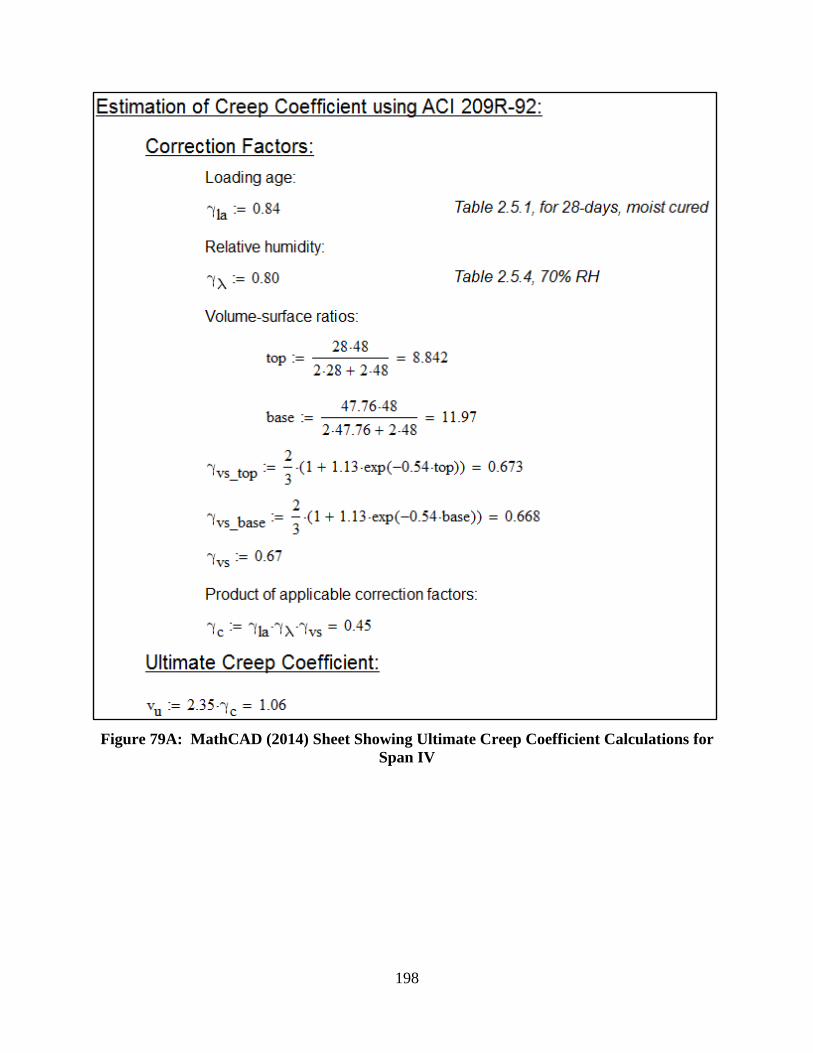
198
Figure 79A: MathCAD (2014) Sheet Showing Ultimate Creep Coefficient Calculations for
Span IV

199
Appendix B: Span V
B1: LONGITUDINAL BEAM ANALYSIS RESULTS
Table 151B: Wheel Line Load Magnitudes
Truck
Wheel Line Load, W, at
Hanger 1 (k) Transverse Deep
Beam (k) Column 2 (k) Column 3 (k)
Tri-Axle 31.37 23.05 23.05 23.13
H-Truck 22.21 15.99 15.99 15.99
Two-Axle 23.69 16.30 16.30 16.37
Concrete 29.62 20.37 20.37 20.46
18-Wheeler 20.73 14.26 14.26 14.32
6-Axle 22.19 16.71 16.71 16.76
School Bus 11.65 8.50 8.50 8.50
HS-Truck 23.08 15.99 15.99 15.99
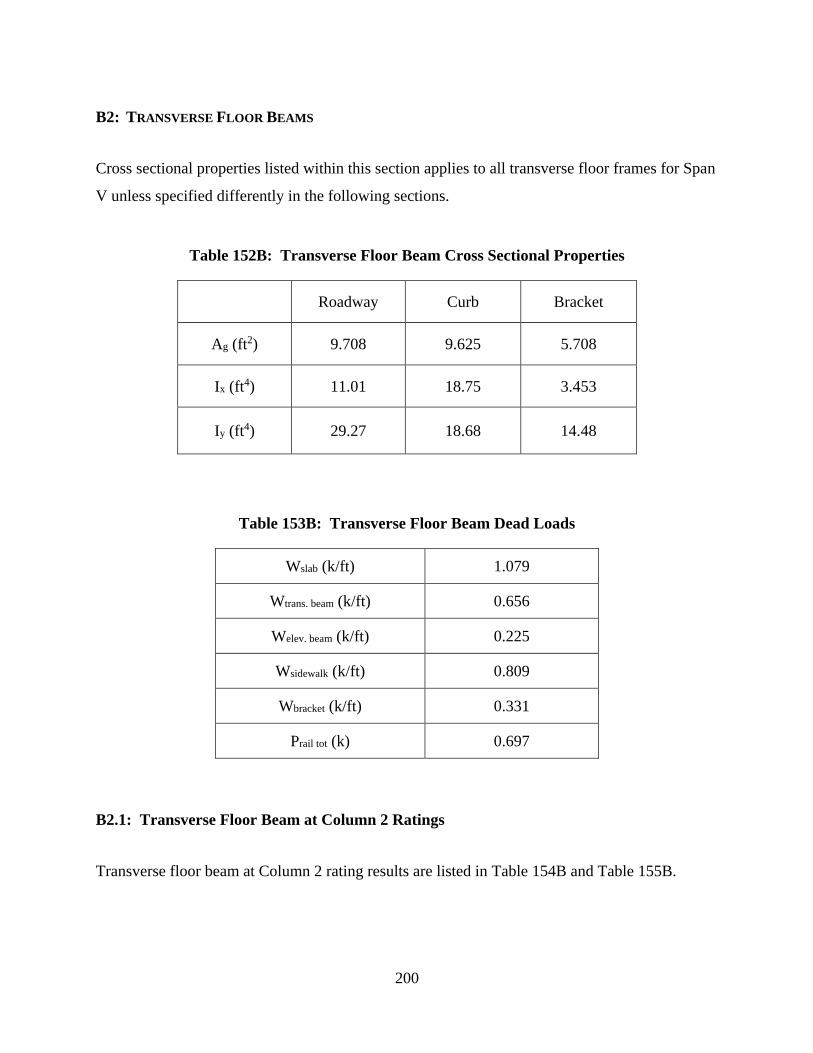
200
B2: TRANSVERSE FLOOR BEAMS
Cross sectional properties listed within this section applies to all transverse floor frames for Span
V unless specified differently in the following sections.
Table 152B: Transverse Floor Beam Cross Sectional Properties
Roadway Curb Bracket
Ag (ft2) 9.708 9.625 5.708
Ix (ft4) 11.01 18.75 3.453
Iy (ft4) 29.27 18.68 14.48
Table 153B: Transverse Floor Beam Dead Loads
Wslab (k/ft) 1.079
Wtrans. beam (k/ft) 0.656
Welev. beam (k/ft) 0.225
Wsidewalk (k/ft) 0.809
Wbracket (k/ft) 0.331
Prail tot (k) 0.697
B2.1: Transverse Floor Beam at Column 2 Ratings
Transverse floor beam at Column 2 rating results are listed in Table 154B and Table 155B.

201
Table 154B: Span V - Transverse Floor Beam at Column 2 Rating Factors: Part 1
Trucks
Rating Factors
Positive Moment Negative Moment
Operating Inventory Operating Inventory
Tri-Axle 1.52 0.91 7.30 4.37
H-Truck 2.20 1.32 10.52 6.30
Two-Axle 2.16 1.29 10.33 6.19
Concrete 1.73 1.03 8.26 4.95
18-Wheeler 2.46 1.48 11.80 7.07
6-Axle 2.10 1.26 10.07 6.03
School Bus 4.14 2.48 19.81 11.87
HS-Truck 2.20 1.32 10.52 6.30
Table 155B: Span V - Transverse Floor Beam at Column 2 Rating Factors: Part 2
Trucks
Rating Factors
Vzone1 Vzone2 Vzone3
Operating Inventory Operating Inventory Operating Inventory
Tri-Axle 2.02 1.21 1.43 0.86 1.59 0.95
H-Truck 2.91 1.74 2.07 1.24 2.30 1.38
Two-Axle 2.85 1.71 2.03 1.22 2.25 1.35
Concrete 2.28 1.37 1.62 0.97 1.80 1.08
18-Wheeler 3.26 1.95 2.32 1.39 2.58 1.54
6-Axle 2.78 1.67 1.98 1.19 2.20 1.32
School Bus 5.47 3.28 3.89 2.33 4.32 2.59
HS-Truck 2.91 1.74 2.07 1.24 2.30 1.38
B2.2: Transverse Floor Beam at Column 3 Ratings
For completeness, transverse floor beam at Column 3 rating results are listed in Table 156B for
bending moment and Table 157B for shear. Ratings were calculated using the transverse floor
beam model presented in Section 3.5.4.

202
Table 156B: Span V - Transverse Floor Beam at Column 3 Rating Factors: Part 1
Trucks
Rating Factors
Positive Moment Negative Moment
Operating Inventory Operating Inventory
Tri-Axle 1.51 0.90 7.45 4.46
H-Truck 2.18 1.31 10.77 6.45
Two-Axle 2.13 1.28 10.52 6.30
Concrete 1.70 1.02 8.42 5.04
18-Wheeler 2.44 1.46 12.03 7.20
6-Axle 2.08 1.25 10.28 6.16
School Bus 4.11 2.46 20.27 12.14
HS-Truck 2.18 1.31 10.77 6.45
Table 157B: Span V - Transverse Floor Beam at Column 3 Rating Factors: Part 2
Trucks
Rating Factors
Vzone1 Vzone2 Vzone3
Operating Inventory Operating Inventory Operating Inventory
Tri-Axle 2.01 1.21 1.43 0.86 1.59 0.95
H-Truck 2.91 1.75 2.07 1.24 2.30 1.38
Two-Axle 2.85 1.71 2.02 1.21 2.25 1.35
Concrete 2.28 1.36 1.62 0.97 1.80 1.08
18-Wheeler 3.25 1.95 2.31 1.38 2.57 1.54
6-Axle 2.78 1.67 1.97 1.18 2.19 1.31
School Bus 5.48 3.29 3.89 2.33 4.33 2.59
HS-Truck 2.91 1.75 2.07 1.24 2.30 1.38
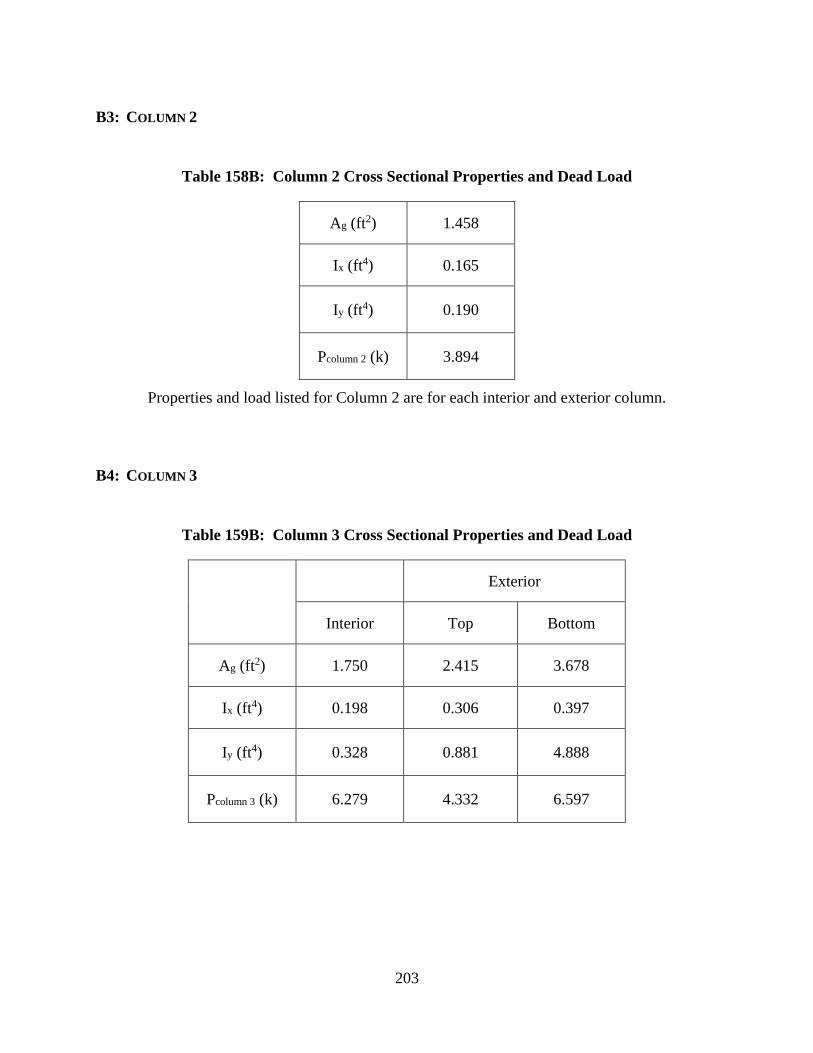
203
B3: COLUMN 2
Table 158B: Column 2 Cross Sectional Properties and Dead Load
Ag (ft2) 1.458
Ix (ft4) 0.165
Iy (ft4) 0.190
Pcolumn 2 (k) 3.894
Properties and load listed for Column 2 are for each interior and exterior column.
B4: COLUMN 3
Table 159B: Column 3 Cross Sectional Properties and Dead Load
Exterior
Interior Top Bottom
Ag (ft2) 1.750 2.415 3.678
Ix (ft4) 0.198 0.306 0.397
Iy (ft4) 0.328 0.881 4.888
Pcolumn 3 (k) 6.279 4.332 6.597
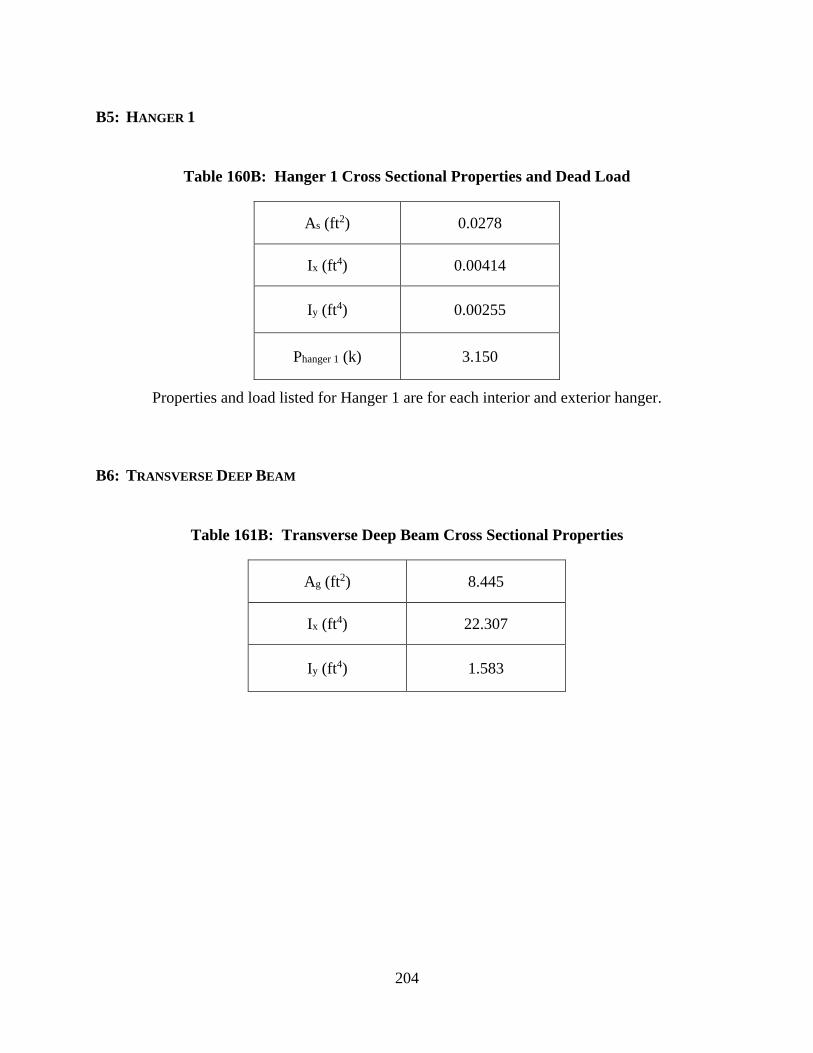
204
B5: HANGER 1
Table 160B: Hanger 1 Cross Sectional Properties and Dead Load
As (ft2) 0.0278
Ix (ft4) 0.00414
Iy (ft4) 0.00255
Phanger 1 (k) 3.150
Properties and load listed for Hanger 1 are for each interior and exterior hanger.
B6: TRANSVERSE DEEP BEAM
Table 161B: Transverse Deep Beam Cross Sectional Properties
Ag (ft2) 8.445
Ix (ft4) 22.307
Iy (ft4) 1.583

205
Table 162B: Transverse Deep Beam Dead Loads
Wslab (k/ft) 1.079
Wtrans. deep beam (k/ft) 1.267
Welev. beam (k/ft) 0.225
Wsidewalk (k/ft) 0.809
Wbracket (k/ft) 0.331
Prail tot (k) 0.697
Psupport tot (k) 4.196
B7: ARCH
The hanger and column cross sectional properties in the arch model combines the properties of
the individual hanger and column properties from the transverse frame models. For Column 3s,
the interior column cross sectional properties is combined with the top exterior column cross
sectional properties.
Table 163B: Arch Cross Sectional Properties
Column 2 Column 3 Hangers
Ag (ft2) 2.917 4.165 0.0556
Ix (ft4) 0.331 0.504 0.00828
Iy (ft4) 0.380 1.209 0.00510

206
B7.1: LATERAL TRUCK DISTRIBUTION
The largest proportion that gets carried by one side of the arch depends on the transverse position
of the trucks. Analysis was performed using the Beam and Column 2 model shown in Figure
80B to find that largest proportion.
Figure 80B: Lateral Truck Distribution using Beam and Column 2 Model
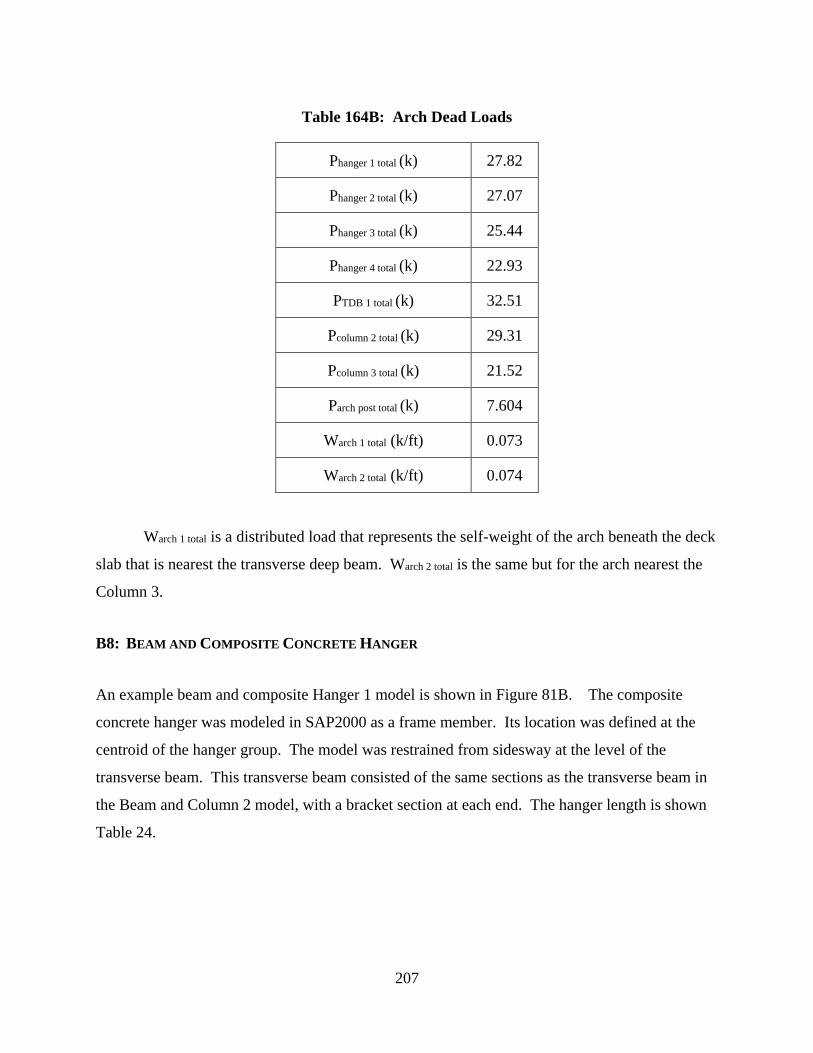
207
Table 164B: Arch Dead Loads
Warch 1 total is a distributed load that represents the self-weight of the arch beneath the deck
slab that is nearest the transverse deep beam. Warch 2 total is the same but for the arch nearest the
Column 3.
B8: BEAM AND COMPOSITE CONCRETE HANGER
An example beam and composite Hanger 1 model is shown in Figure 81B. The composite
concrete hanger was modeled in SAP2000 as a frame member. Its location was defined at the
centroid of the hanger group. The model was restrained from sidesway at the level of the
transverse beam. This transverse beam consisted of the same sections as the transverse beam in
the Beam and Column 2 model, with a bracket section at each end. The hanger length is shown
Table 24.
Phanger 1 total (k) 27.82
Phanger 2 total (k) 27.07
Phanger 3 total (k) 25.44
Phanger 4 total (k) 22.93
PTDB 1 total (k) 32.51
Pcolumn 2 total (k) 29.31
Pcolumn 3 total (k) 21.52
Parch post total (k) 7.604
Warch 1 total (k/ft) 0.073
Warch 2 total (k/ft) 0.074

208
Figure 81B: Beam and Composite Hanger 1 Model
These composite concrete hangers have no flexural rigidity under dead loads. The
properties of these hangers are listed in Table 165B. In accordance with Taylor (1930), the
roadway slabs were casted before the steel reinforcements were encapsulated in concrete to
allow normal elongation of the bars under dead loads. Thus, the interaction diagram shown in
Figure 82B was adjusted to reflect this condition. The dead load strain in each of the composite
concrete hangers was calculated using the applied axial load acting on the total area of steel in
the hanger. This dead load strain was added to the live load steel strains in tension and
subtracted from the live load steel strains in compression. To reflect this in the factored loading
line, shown in Figure 82B, there was no moment resulting from dead loads. Therefore, the first
point of the factored loading line was from axial tension only. However, there was moment
under live loads. All parts of the factored loading line was below the horizontal axis meaning the
composite concrete hangers are in the tension.
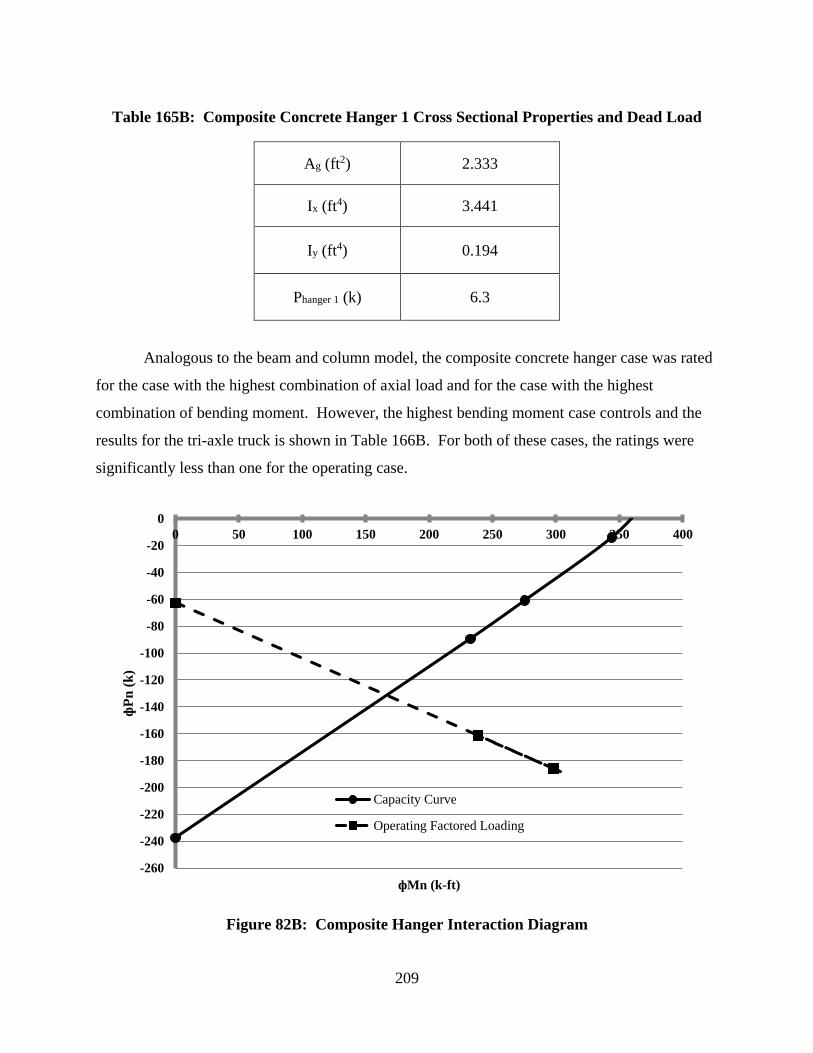
209
Table 165B: Composite Concrete Hanger 1 Cross Sectional Properties and Dead Load
Ag (ft2) 2.333
Ix (ft4) 3.441
Iy (ft4) 0.194
Phanger 1 (k) 6.3
Analogous to the beam and column model, the composite concrete hanger case was rated
for the case with the highest combination of axial load and for the case with the highest
combination of bending moment. However, the highest bending moment case controls and the
results for the tri-axle truck is shown in Table 166B. For both of these cases, the ratings were
significantly less than one for the operating case.
Figure 82B: Composite Hanger Interaction Diagram
-260
-240
-220
-200
-180
-160
-140
-120
-100
-80
-60
-40
-20
0
0 50 100 150 200 250 300 350 400
фP
n (
k)
фMn (k-ft)
Capacity Curve
Operating Factored Loading

210
Table 166B: LFR for Composite Concrete Hanger
ALDOT Posting
Vehicle
Axial and Moment
Operating Inventory
Tri-Axle 0.55 0.33
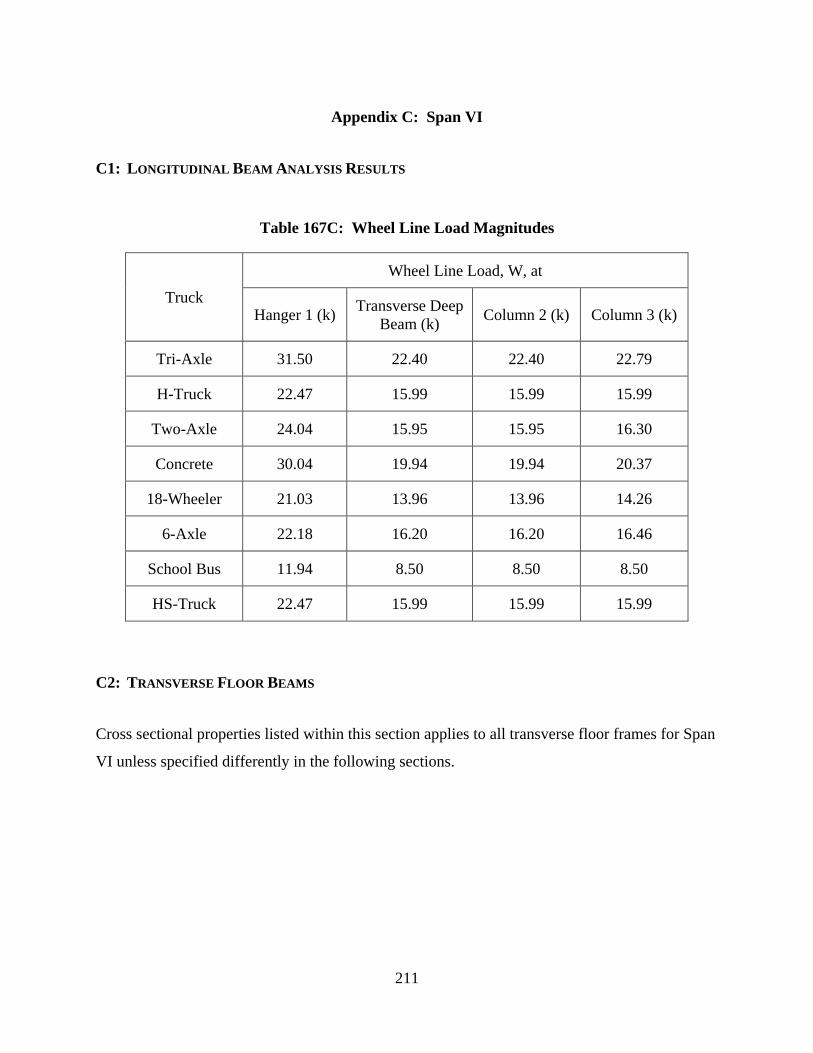
211
Appendix C: Span VI
C1: LONGITUDINAL BEAM ANALYSIS RESULTS
Table 167C: Wheel Line Load Magnitudes
Truck
Wheel Line Load, W, at
Hanger 1 (k) Transverse Deep
Beam (k) Column 2 (k) Column 3 (k)
Tri-Axle 31.50 22.40 22.40 22.79
H-Truck 22.47 15.99 15.99 15.99
Two-Axle 24.04 15.95 15.95 16.30
Concrete 30.04 19.94 19.94 20.37
18-Wheeler 21.03 13.96 13.96 14.26
6-Axle 22.18 16.20 16.20 16.46
School Bus 11.94 8.50 8.50 8.50
HS-Truck 22.47 15.99 15.99 15.99
C2: TRANSVERSE FLOOR BEAMS
Cross sectional properties listed within this section applies to all transverse floor frames for Span
VI unless specified differently in the following sections.
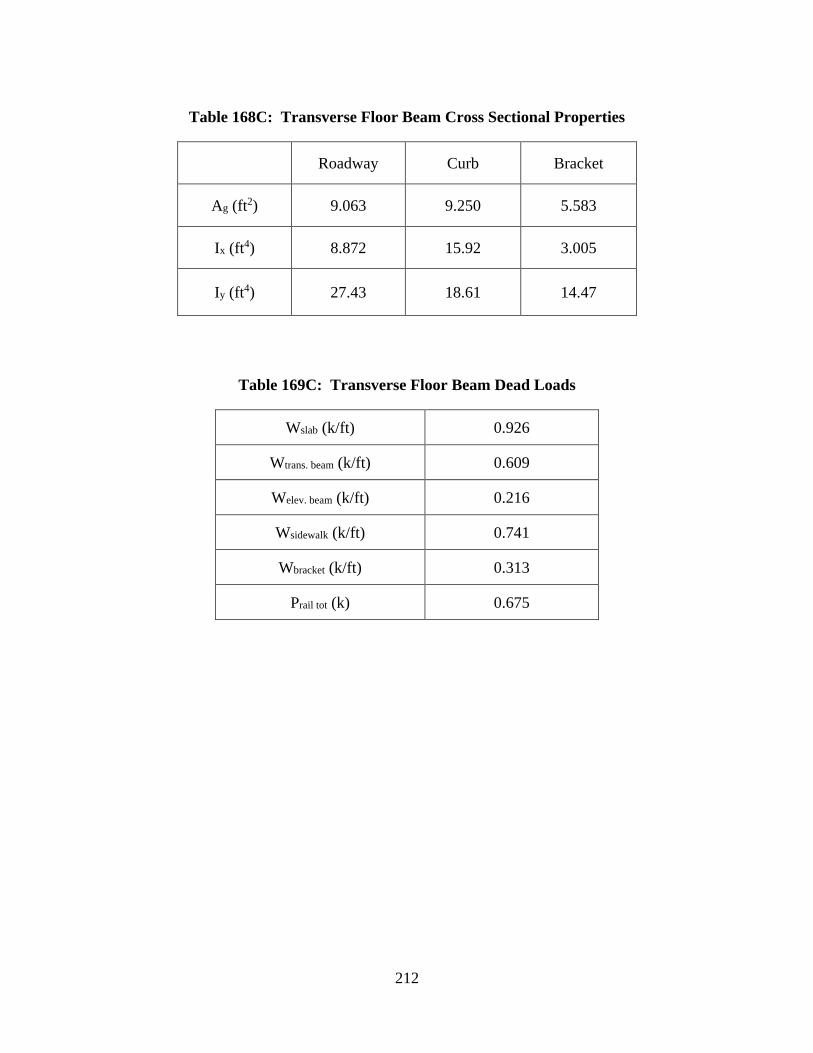
212
Table 168C: Transverse Floor Beam Cross Sectional Properties
Roadway Curb Bracket
Ag (ft2) 9.063 9.250 5.583
Ix (ft4) 8.872 15.92 3.005
Iy (ft4) 27.43 18.61 14.47
Table 169C: Transverse Floor Beam Dead Loads
Wslab (k/ft) 0.926
Wtrans. beam (k/ft) 0.609
Welev. beam (k/ft) 0.216
Wsidewalk (k/ft) 0.741
Wbracket (k/ft) 0.313
Prail tot (k) 0.675

213
C2.1: Transverse Floor Beam at Column 2 Ratings
Transverse floor beam at Column 2 rating results are listed in Table 170C and Table 171C.
Table 170C: Span VI - Transverse Floor Beam at Column 2 Rating Factors: Part 1
Trucks
Rating Factors
Positive Moment Negative Moment
Operating Inventory Operating Inventory
Tri-Axle 1.52 0.91 4.65 2.79
H-Truck 2.13 1.28 6.52 3.90
Two-Axle 2.14 1.28 6.53 3.91
Concrete 1.71 1.03 5.23 3.13
18-Wheeler 2.45 1.47 7.47 4.47
6-Axle 2.11 1.26 6.43 3.85
School Bus 4.02 2.41 12.27 7.35
HS-Truck 2.13 1.28 6.52 3.90
Table 171C: Span VI - Transverse Floor Beam at Column 2 Rating Factors: Part 2
Trucks
Rating Factors
Vzone1 Vzone2 Vzone3
Operating Inventory Operating Inventory Operating Inventory
Tri-Axle 1.92 1.15 1.47 0.88 1.53 0.91
H-Truck 2.69 1.61 2.06 1.23 2.14 1.28
Two-Axle 2.70 1.62 2.06 1.24 2.14 1.28
Concrete 2.16 1.29 1.65 0.99 1.72 1.03
18-Wheeler 3.09 1.85 2.36 1.41 2.45 1.47
6-Axle 2.66 1.59 2.03 1.22 2.11 1.27
School Bus 5.07 3.04 3.88 2.32 4.03 2.41
HS-Truck 2.69 1.61 2.06 1.23 2.14 1.28

214
C2.2: Transverse Floor Beam at Column 3 Ratings
For completeness, transverse floor beam at Column 3 rating results are listed in Table 172C for
bending moment and Table 173C for shear. Ratings were calculated using the transverse floor
beam model presented in Section 3.5.4.
Table 172C: Span VI - Transverse Floor Beam at Column 3 Rating Factors: Part 1
Trucks
Rating Factors
Positive Moment Negative Moment
Operating Inventory Operating Inventory
Tri-Axle 1.44 0.86 6.23 3.73
H-Truck 2.05 1.23 8.87 5.31
Two-Axle 2.01 1.20 8.70 5.21
Concrete 1.61 0.96 6.96 4.17
18-Wheeler 2.30 1.38 9.95 5.96
6-Axle 1.99 1.19 8.62 5.16
School Bus 3.86 2.31 16.70 10.00
HS-Truck 2.05 1.23 8.87 5.31
Table 173C: Span VI - Transverse Floor Beam at Column 3 Rating Factors: Part 2
Trucks
Rating Factors
Vzone1 Vzone2 Vzone3
Operating Inventory Operating Inventory Operating Inventory
Tri-Axle 1.90 1.14 1.45 0.87 1.50 0.90
H-Truck 2.70 1.62 2.06 1.23 2.14 1.28
Two-Axle 2.65 1.59 2.02 1.21 2.10 1.26
Concrete 2.12 1.27 1.62 0.97 1.68 1.01
18-Wheeler 3.03 1.82 2.31 1.38 2.40 1.44
6-Axle 2.63 1.57 2.00 1.20 2.08 1.25
School Bus 5.09 3.05 3.88 2.32 4.03 2.42
HS-Truck 2.70 1.62 2.06 1.23 2.14 1.28
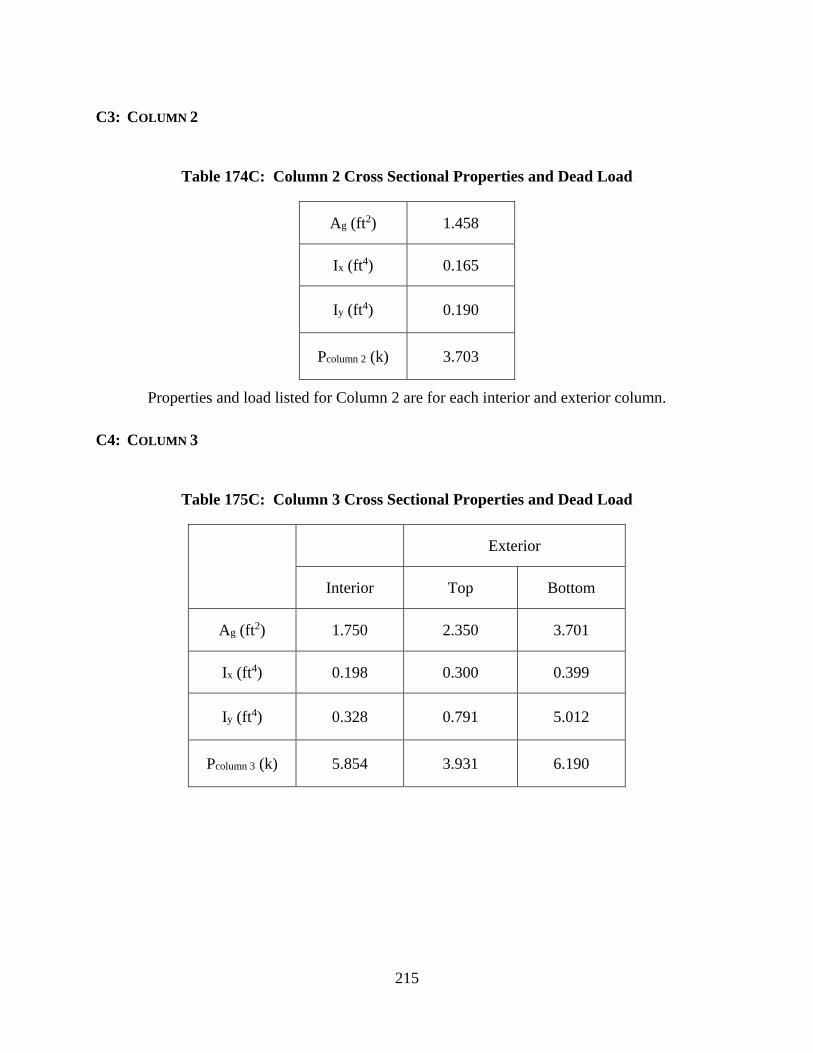
215
C3: COLUMN 2
Table 174C: Column 2 Cross Sectional Properties and Dead Load
Ag (ft2) 1.458
Ix (ft4) 0.165
Iy (ft4) 0.190
Pcolumn 2 (k) 3.703
Properties and load listed for Column 2 are for each interior and exterior column.
C4: COLUMN 3
Table 175C: Column 3 Cross Sectional Properties and Dead Load
Exterior
Interior Top Bottom
Ag (ft2) 1.750 2.350 3.701
Ix (ft4) 0.198 0.300 0.399
Iy (ft4) 0.328 0.791 5.012
Pcolumn 3 (k) 5.854 3.931 6.190

216
C5: HANGER 1
Table 176C: Hanger 1 Cross Sectional Properties and Dead Load
As (ft2) 0.0278
Ix (ft4) 0.00414
Iy (ft4) 0.00255
Phanger 1 (k) 2.870
Properties and load listed for Hanger 1 are for each interior and exterior hanger.
C6: TRANSVERSE DEEP BEAM
Table 177C: Transverse Deep Beam Cross Sectional Properties
Ag (ft2) 7.635
Ix (ft4) 16.484
Iy (ft4) 1.432

217
Table 178C: Transverse Deep Beam Dead Loads
Wslab (k/ft) 0.926
Wtrans. deep beam (k/ft) 1.145
Welev. beam (k/ft) 0.216
Wsidewalk (k/ft) 0.741
Wbracket (k/ft) 0.313
Prail tot (k) 0.675
Psupport tot (k) 4.196
C7: ARCH
The hanger and column cross sectional properties in the arch model combines the properties of
the individual hanger and column properties from the transverse frame models. For Column 3s,
the interior column cross sectional properties is combined with the top exterior column cross
sectional properties.
Table 179C: Arch Cross Sectional Properties
Column 2 Column 3 Hangers
Ag (ft2) 2.917 4.100 0.0556
Ix (ft4) 0.331 0.498 0.00828
Iy (ft4) 0.380 1.119 0.00510

218
Table 180C: Arch Dead Loads
Warch 1 total is a distributed load that represents the self-weight of the arch beneath the deck
slab that is nearest the transverse deep beam. Warch 2 total is the same but for the arch nearest the
Column 3.
Phanger 1 total (k) 25.70
Phanger 2 total (k) 24.98
Phanger 3 total (k) 23.42
Phanger 4 total (k) 21.09
PTDB 1 total (k) 29.61
Pcolumn 2 total (k) 27.37
Pcolumn 3 total (k) 19.96
Parch post total (k) 7.604
Warch 1 total (k/ft) 0.073
Warch 2 total (k/ft) 0.074
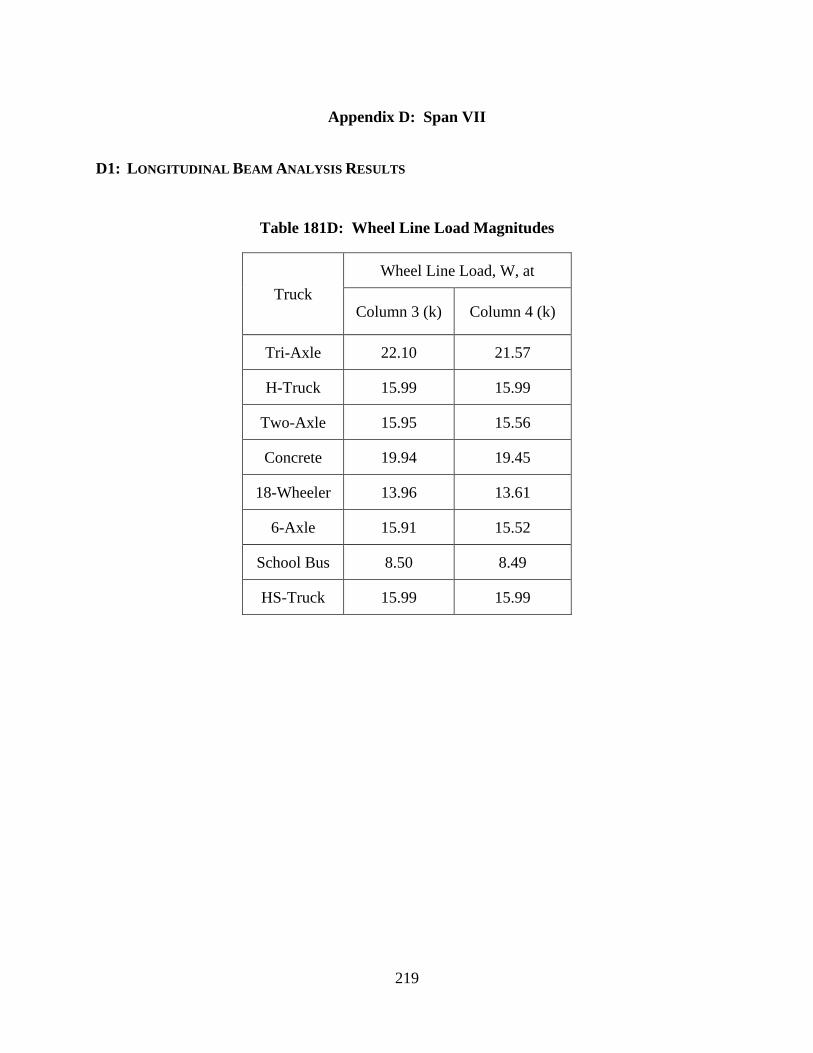
219
Appendix D: Span VII
D1: LONGITUDINAL BEAM ANALYSIS RESULTS
Table 181D: Wheel Line Load Magnitudes
Truck
Wheel Line Load, W, at
Column 3 (k) Column 4 (k)
Tri-Axle 22.10 21.57
H-Truck 15.99 15.99
Two-Axle 15.95 15.56
Concrete 19.94 19.45
18-Wheeler 13.96 13.61
6-Axle 15.91 15.52
School Bus 8.50 8.49
HS-Truck 15.99 15.99
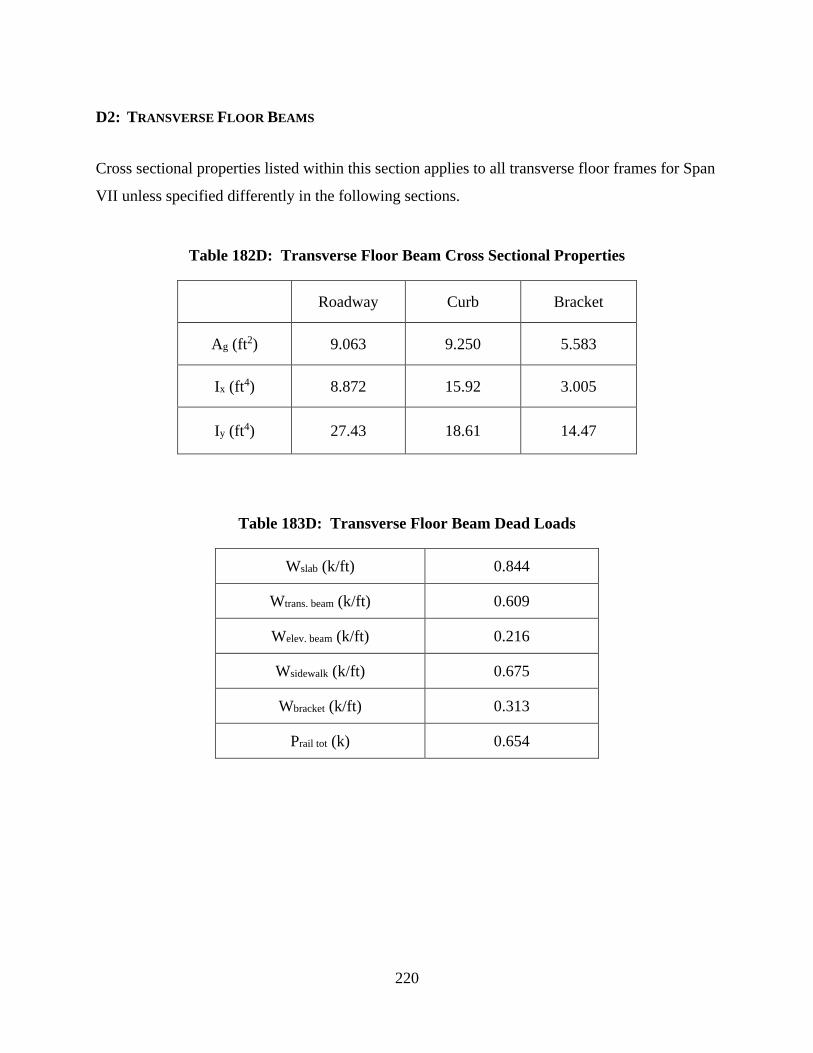
220
D2: TRANSVERSE FLOOR BEAMS
Cross sectional properties listed within this section applies to all transverse floor frames for Span
VII unless specified differently in the following sections.
Table 182D: Transverse Floor Beam Cross Sectional Properties
Roadway Curb Bracket
Ag (ft2) 9.063 9.250 5.583
Ix (ft4) 8.872 15.92 3.005
Iy (ft4) 27.43 18.61 14.47
Table 183D: Transverse Floor Beam Dead Loads
Wslab (k/ft) 0.844
Wtrans. beam (k/ft) 0.609
Welev. beam (k/ft) 0.216
Wsidewalk (k/ft) 0.675
Wbracket (k/ft) 0.313
Prail tot (k) 0.654

221
D2.1: Transverse Beam at Column 4 Ratings
Negative bending moment ratings for the transverse beam at Column 4 location are listed in
Table 184D.
Table 184D: Span VII – Transverse Beam at Column 4 Negative Bending Moment Rating
Factors
Trucks
Rating Factors
Negative Moment
Operating Inventory
Tri-Axle 4.03 2.41
H-Truck 5.43 3.26
Two-Axle 5.58 3.35
Concrete 4.47 2.68
18-Wheeler 6.38 3.82
6-Axle 5.60 3.35
School Bus 10.23 6.13
HS-Truck 5.43 3.26
D2.2: Transverse Beam at Column 5 Ratings
Bending moment ratings for the transverse beam at Column 5 location Case B are listed in Table
185D. For completeness, the shear ratings for the same transverse beam are listed in Table
186D.
In addition, bending moment rating factors for the transverse beam at Column 5 location
– Case A are listed in Table 187D. Shear rating factors for the same beam are shown in Table
188D.
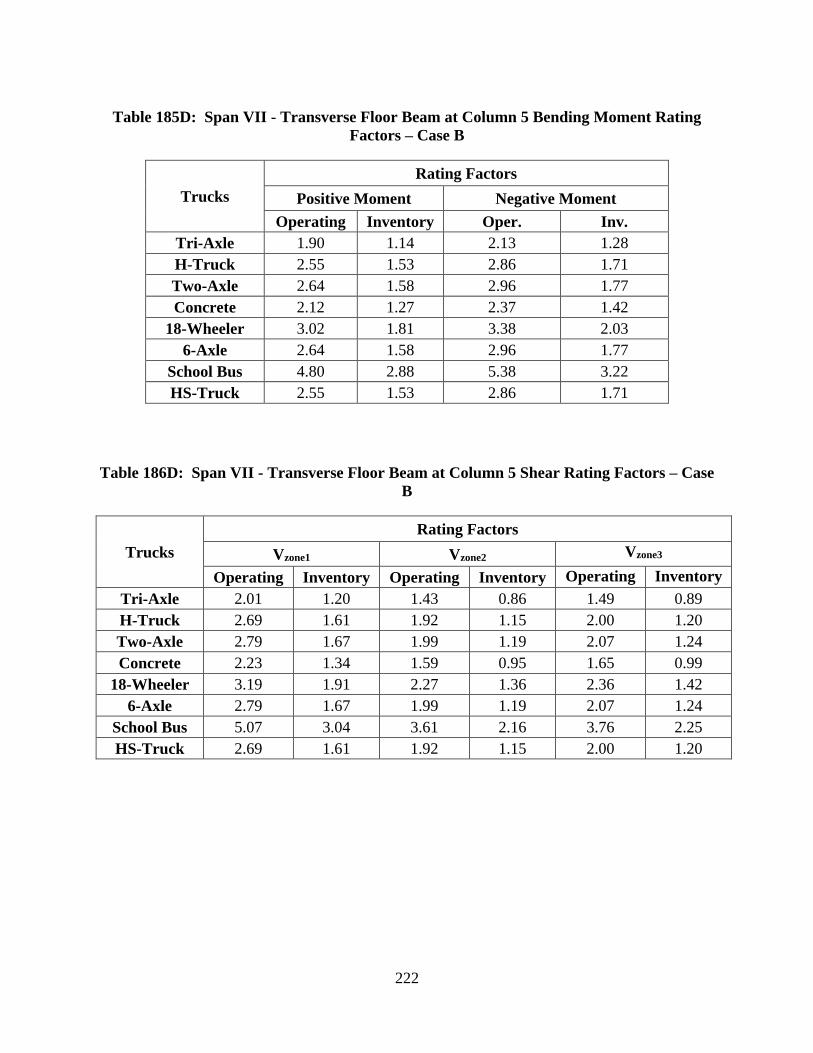
222
Table 185D: Span VII - Transverse Floor Beam at Column 5 Bending Moment Rating
Factors – Case B
Trucks
Rating Factors
Positive Moment Negative Moment
Operating Inventory Oper. Inv.
Tri-Axle 1.90 1.14 2.13 1.28
H-Truck 2.55 1.53 2.86 1.71
Two-Axle 2.64 1.58 2.96 1.77
Concrete 2.12 1.27 2.37 1.42
18-Wheeler 3.02 1.81 3.38 2.03
6-Axle 2.64 1.58 2.96 1.77
School Bus 4.80 2.88 5.38 3.22
HS-Truck 2.55 1.53 2.86 1.71
Table 186D: Span VII - Transverse Floor Beam at Column 5 Shear Rating Factors – Case
B
Trucks
Rating Factors
Vzone1 Vzone2 Vzone3
Operating Inventory Operating Inventory Operating Inventory
Tri-Axle 2.01 1.20 1.43 0.86 1.49 0.89
H-Truck 2.69 1.61 1.92 1.15 2.00 1.20
Two-Axle 2.79 1.67 1.99 1.19 2.07 1.24
Concrete 2.23 1.34 1.59 0.95 1.65 0.99
18-Wheeler 3.19 1.91 2.27 1.36 2.36 1.42
6-Axle 2.79 1.67 1.99 1.19 2.07 1.24
School Bus 5.07 3.04 3.61 2.16 3.76 2.25
HS-Truck 2.69 1.61 1.92 1.15 2.00 1.20

223
Table 187D: Span VII - Transverse Floor Beam at Column 5 Bending Moment Rating
Factors - Case A
Trucks
Rating Factors
Positive Moment Negative Moment
Operating Inventory Operating Inventory
Tri-Axle 1.83 1.09 2.49 1.49
H-Truck 2.45 1.47 3.33 2.00
Two-Axle 2.54 1.52 3.45 2.07
Concrete 2.03 1.22 2.76 1.65
18-Wheeler 2.90 1.74 3.94 2.36
6-Axle 2.54 1.52 3.45 2.07
School Bus 4.61 2.76 6.27 3.76
HS-Truck 2.45 1.47 3.33 2.00
Table 188D: Span VII - Transverse Floor Beam at Column 5 Shear Rating Factors – Case
A
Trucks
Rating Factors
Vzone1 Vzone2 Vzone3
Operating Inventory Operating Inventory Operating Inventory
Tri-Axle 2.01 1.21 1.43 0.86 1.49 0.89
H-Truck 2.70 1.62 1.92 1.15 2.00 1.20
Two-Axle 2.80 1.67 1.99 1.19 2.07 1.24
Concrete 2.24 1.34 1.59 0.95 1.66 0.99
18-Wheeler 3.20 1.91 2.27 1.36 2.36 1.42
6-Axle 2.80 1.68 1.99 1.19 2.07 1.24
School Bus 5.08 3.04 3.61 2.16 3.76 2.25
HS-Truck 2.70 1.62 1.92 1.15 2.00 1.20
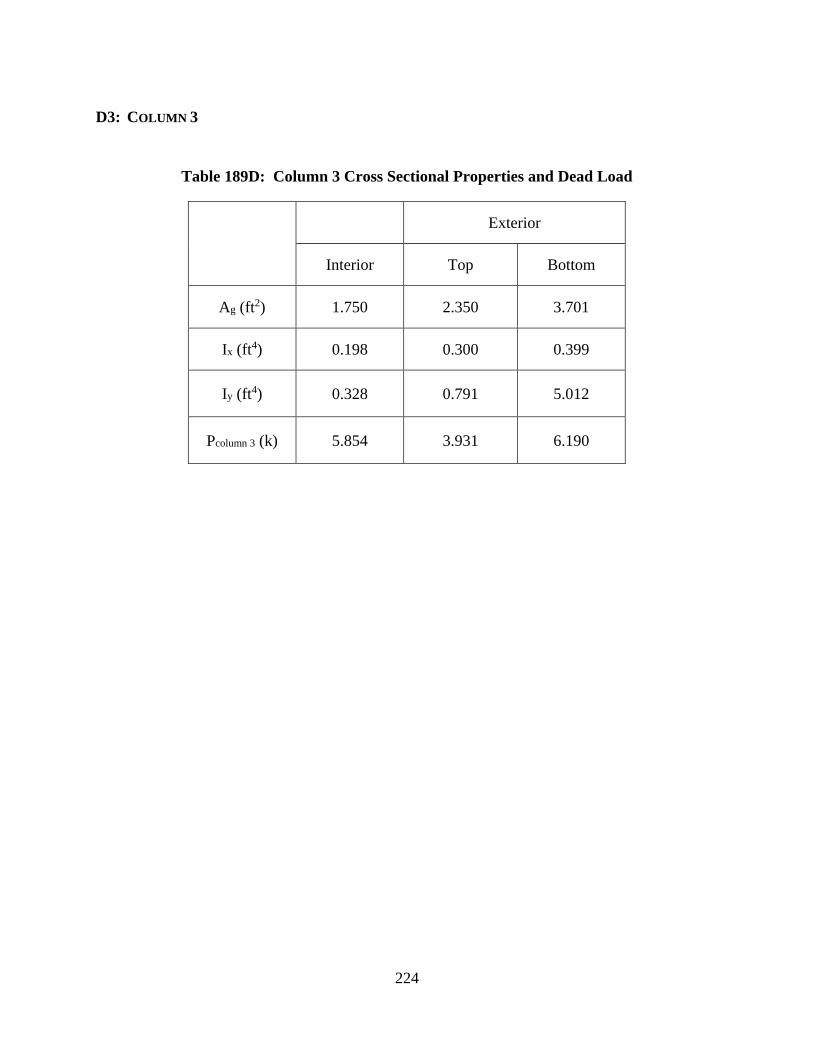
224
D3: COLUMN 3
Table 189D: Column 3 Cross Sectional Properties and Dead Load
Exterior
Interior Top Bottom
Ag (ft2) 1.750 2.350 3.701
Ix (ft4) 0.198 0.300 0.399
Iy (ft4) 0.328 0.791 5.012
Pcolumn 3 (k) 5.854 3.931 6.190

225
D4: COLUMNS 4 - 7
Table 190D: Columns 4 - 7 Cross Sectional Properties and Dead Load
Ag (ft2) 1.458
Ix (ft4) 0.165
Iy (ft4) 0.190
Pcolumn 4 (k) 3.163
Pcolumn 5 (k) 1.560
Pcolumn 6 (k) 1.278
Pcolumn 7 (k) 2.321
Properties and load listed for Columns 4 – 7 are for each interior and exterior column.
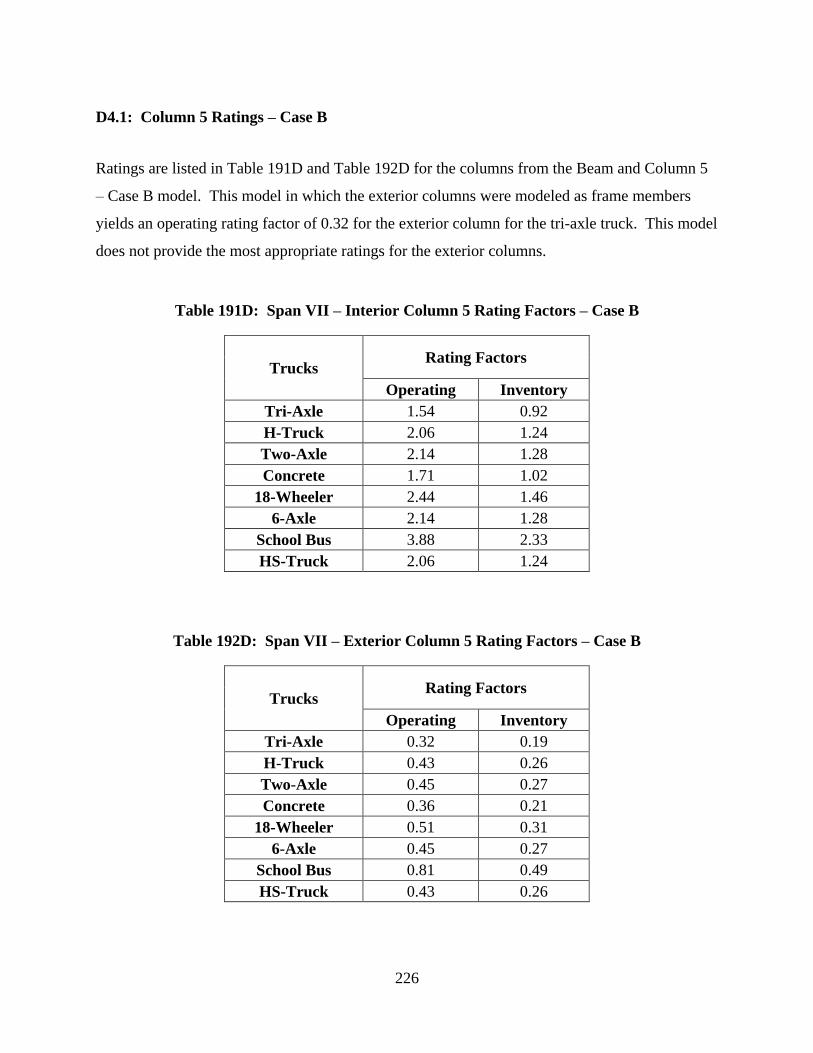
226
D4.1: Column 5 Ratings – Case B
Ratings are listed in Table 191D and Table 192D for the columns from the Beam and Column 5
– Case B model. This model in which the exterior columns were modeled as frame members
yields an operating rating factor of 0.32 for the exterior column for the tri-axle truck. This model
does not provide the most appropriate ratings for the exterior columns.
Table 191D: Span VII – Interior Column 5 Rating Factors – Case B
Trucks Rating Factors
Operating Inventory
Tri-Axle 1.54 0.92
H-Truck 2.06 1.24
Two-Axle 2.14 1.28
Concrete 1.71 1.02
18-Wheeler 2.44 1.46
6-Axle 2.14 1.28
School Bus 3.88 2.33
HS-Truck 2.06 1.24
Table 192D: Span VII – Exterior Column 5 Rating Factors – Case B
Trucks Rating Factors
Operating Inventory
Tri-Axle 0.32 0.19
H-Truck 0.43 0.26
Two-Axle 0.45 0.27
Concrete 0.36 0.21
18-Wheeler 0.51 0.31
6-Axle 0.45 0.27
School Bus 0.81 0.49
HS-Truck 0.43 0.26

227
D4.2: Column 7 Ratings – Case B
Ratings are listed in Table 193D and Table 194D for the columns from the Beam and Column 7
– Case B model. This model in which the exterior columns were modeled as frame members
yields an operating rating factor of 0.95 for the exterior column for the tri-axle truck. This model
does not provide the most appropriate ratings for the exterior columns.
Table 193D: Span VII – Interior Column 7 Rating Factors – Case B
Trucks Rating Factors
Operating Inventory
Tri-Axle 2.11 1.26
H-Truck 2.83 1.69
Two-Axle 2.93 1.76
Concrete 2.34 1.40
18-Wheeler 3.35 2.01
6-Axle 2.93 1.76
School Bus 5.32 3.19
HS-Truck 2.83 1.69
Table 194D: Span VII – Exterior Column 7 Rating Factors – Case B
Trucks Rating Factors
Operating Inventory
Tri-Axle 0.95 0.57
H-Truck 1.27 0.76
Two-Axle 1.31 0.79
Concrete 1.05 0.63
18-Wheeler 1.50 0.90
6-Axle 1.32 0.79
School Bus 2.39 1.43
HS-Truck 1.27 0.76

228
D5: ARCH
The hanger and column cross sectional properties in the arch model combines the
properties of the individual hanger and column properties from the transverse frame models. For
Column 3s, the interior column cross sectional properties is combined with the top exterior
column cross sectional properties.
Table 195D: Arch Cross Sectional Properties
Column 3 Column 4 - 8
Ag (ft2) 4.100 2.917
Ix (ft4) 0.498 0.331
Iy (ft4) 1.119 0.380
Table 196D: Arch Dead Loads
Warch total is a distributed load that represents the self-weight of the arch beneath the deck
slab that is present along the length of Span VII.
Pcolumn 3 total (k) 19.39
Pcolumn 4 total (k) 19.39
Pcolumn 5 total (k) 19.39
Pcolumn 6 total (k) 19.39
Pcolumn 7 total (k) 19.39
Pcolumn 8 total (k) 19.39
Warch total (k/ft) 0.074
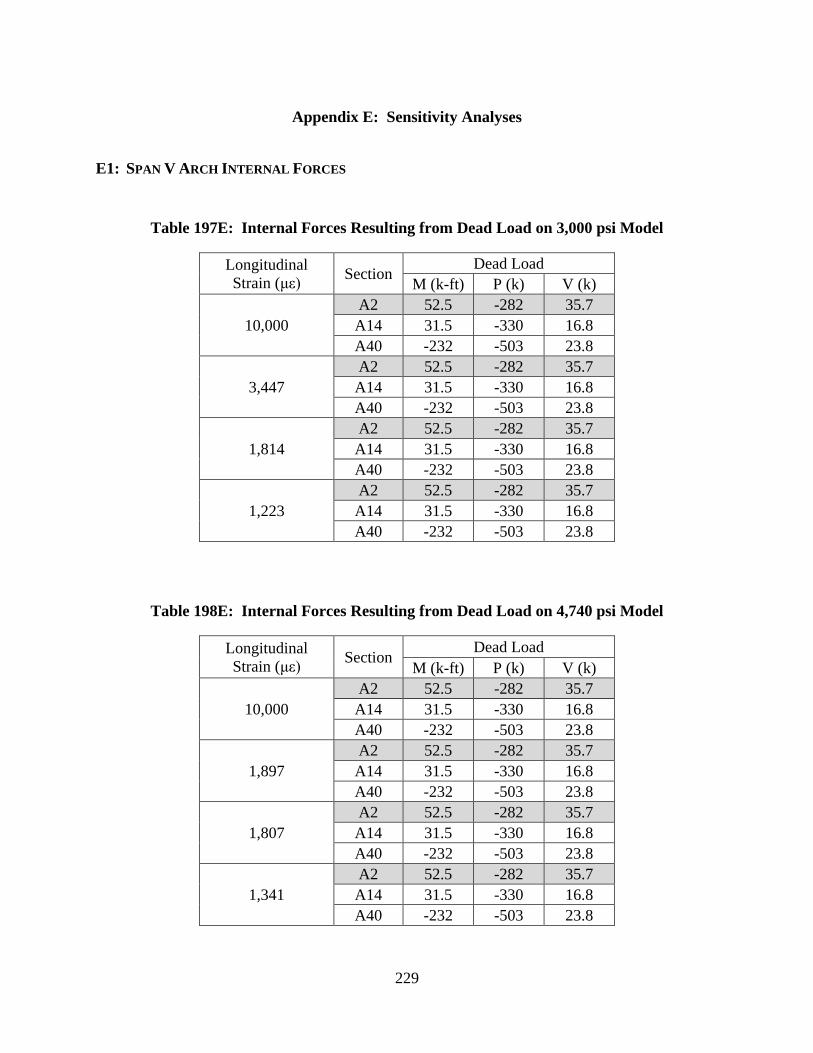
229
Appendix E: Sensitivity Analyses
E1: SPAN V ARCH INTERNAL FORCES
Table 197E: Internal Forces Resulting from Dead Load on 3,000 psi Model
Longitudinal
Strain (με) Section
Dead Load
M (k-ft) P (k) V (k)
10,000
A2 52.5 -282 35.7
A14 31.5 -330 16.8
A40 -232 -503 23.8
3,447
A2 52.5 -282 35.7
A14 31.5 -330 16.8
A40 -232 -503 23.8
1,814
A2 52.5 -282 35.7
A14 31.5 -330 16.8
A40 -232 -503 23.8
1,223
A2 52.5 -282 35.7
A14 31.5 -330 16.8
A40 -232 -503 23.8
Table 198E: Internal Forces Resulting from Dead Load on 4,740 psi Model
Longitudinal
Strain (με) Section
Dead Load
M (k-ft) P (k) V (k)
10,000
A2 52.5 -282 35.7
A14 31.5 -330 16.8
A40 -232 -503 23.8
1,897
A2 52.5 -282 35.7
A14 31.5 -330 16.8
A40 -232 -503 23.8
1,807
A2 52.5 -282 35.7
A14 31.5 -330 16.8
A40 -232 -503 23.8
1,341
A2 52.5 -282 35.7
A14 31.5 -330 16.8
A40 -232 -503 23.8
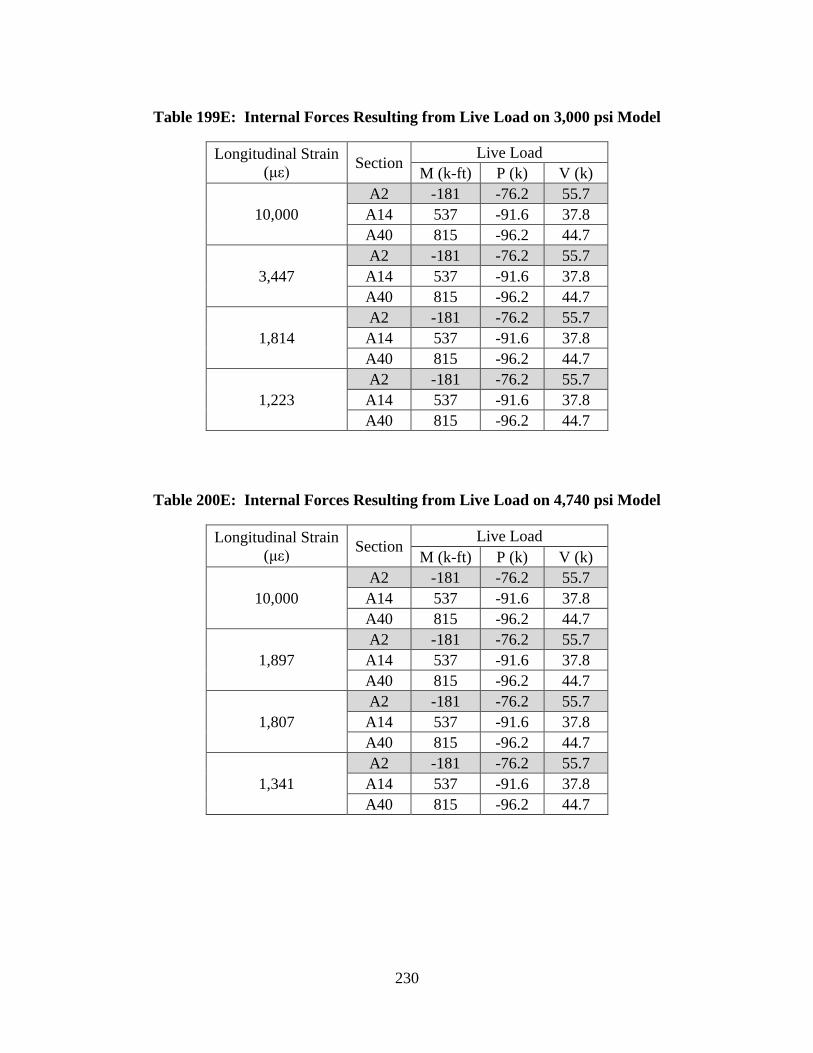
230
Table 199E: Internal Forces Resulting from Live Load on 3,000 psi Model
Longitudinal Strain
(με) Section
Live Load
M (k-ft) P (k) V (k)
10,000
A2 -181 -76.2 55.7
A14 537 -91.6 37.8
A40 815 -96.2 44.7
3,447
A2 -181 -76.2 55.7
A14 537 -91.6 37.8
A40 815 -96.2 44.7
1,814
A2 -181 -76.2 55.7
A14 537 -91.6 37.8
A40 815 -96.2 44.7
1,223
A2 -181 -76.2 55.7
A14 537 -91.6 37.8
A40 815 -96.2 44.7
Table 200E: Internal Forces Resulting from Live Load on 4,740 psi Model
Longitudinal Strain
(με) Section
Live Load
M (k-ft) P (k) V (k)
10,000
A2 -181 -76.2 55.7
A14 537 -91.6 37.8
A40 815 -96.2 44.7
1,897
A2 -181 -76.2 55.7
A14 537 -91.6 37.8
A40 815 -96.2 44.7
1,807
A2 -181 -76.2 55.7
A14 537 -91.6 37.8
A40 815 -96.2 44.7
1,341
A2 -181 -76.2 55.7
A14 537 -91.6 37.8
A40 815 -96.2 44.7