lo-mw demonstration of the gas suspension absorption ... library/research/coal/major...lo-mw...
TRANSCRIPT

Tennessee Valley Authority Technology Advancements
lo-MW Demonstration of the Gas Suspension Absorption Process at TVA’s Center for Emissions Research
Final Report March 1995
Tennessee Valley Authority AirPol, Inc.
U. S. Department of Energy

lo-MW DEUONSTRATION
OF THE GAS SUSPENSION ABSORPTION PROCESS AT
TVA’S CENTER FOR MISSIONS RESEARCH
FINAL REPORT
Tennessee Valley Authority
AirPol Inc.
U.S. Department of Energy
Prepared by
Tennessee Valley Authority
Technology Advancements
1101 Hark& Street
Chattanooga, Tennessee 37402
March 1995

LEGAL NOTICE
This report was prepared by the Tennessee Valley Authority (TVA) as an
account of work co-sponsored by the TVA; AirPol Inc; and the U.S.
Department of Energy (DOE). Neither TVA, AirPol, DOE, Radian, nor any
person acting on their behalf: (a) makes any warranty or representation,
express or implied, as to the accuracy, completeness, usefulness or
reliability of any information, apparatus, product, method, or process
discussed in this report; (b) assume8 any liability of responsibility with
respect to the use of, or for damage resulting from the use of, any
information, apparatus, product, method, or process discussed in this
report; or (c) represents that the use of any information, apparatus,
method, or process discussed in this report would not infringe privately
owned rights.
Reference herein to any specific commercial product, process method, or
service by trade name, trademark, manufacturer, or otherwise does not
constitute of imply an endorsement or recommendation by TVA, AirPol, DOE,
Radian, or any person acting on their behalf. The views and opinions of
the authors expressed herein do not necessarily state or reflect those of
TVA, AirPol, DOE, or Radian.
ABSTRACT
The Tennessee Valley Authority (TVA) in cooperation with AirPol Inc., and
the U.S. Department of Energy (DOE), has recently completed a successful
17-month test program with the AirPol Gas Suspension Absorption (GSA) flue
gas desulfurisation (FGD) process at TVA's Center for Emissions Research
(CER). This project was selected by DOE for funding in the third round of
the Clean coal Technology Program. This lo-HW demonstration of the GSA
FGD system at the CBR was the first application of this technology in the
U.S.
The GSA test program, which was cofunded two-thirds by TVA and one-third
by DOE/AirPol, was completed over a 17-month period from November 1, 1992
to March 31, 1993. This test program demonstrated that the GSA FGD
technology could achieve high SO2 removal efficiencies (90+ percent) for
a 2.7 percent sulfur (as-fired) coal application, while maintaining
particulate emissions below the New Source Performance Standards (NSPS),
i.e., 0.03 lb/MBtu, in a four-field electrostatic precipitator. The
reliability and operability of this system was also demonstrated in a
2B-day, 24 hour/day, continuous run during which the GSA unit
simultaneously achieved high SO2 removal efficiencies (90+ percent) and
maintained particulate emissions below the NSPS. Also, the air toxics
removal capabilities of the GSA system were determined in a series of
tests.
A l-MW pulsejet baghouse (PJBH) pilot plant was also tested in conjunction
with this GSA test program. This PJBH testing was initially cofunded by
TVA and the Electric Power Research Institute, who were later joined by
AirPol and DOE in sponsoring this PJBH testing. A 14-day PJBH
demonstration run was also completed to confirm the reliability of this
system.

ACKNOWLEDGEMENTS
The planning of the lO+W Gas Suspension Absorption test program was a
cooperative effort of various people in several organizations, both inside
and outside TVA. The major TVA participants were: T. A. Burnett, A. T.
Hagood, T. M. Little, and E. J. Puschaver. Other people and organizations
involved in the planning of this test program were: F. E. Hsu of AirPol;
s. K. Merchant of the U.S. Department of Energy; L. R. Lepovitz of Radian
Corporation; R. Merritt of Southern Research Institute; and R. F. Altman
of the Electric Power Research Institute.
The execution of the test program was the result of efforts by K. H.
Schuppert, E. J. Puschaver, T. M. Little, B. F. Smith, L. R. Lepovitz, and
the entire onsite staff at TVA's Center for Emissions Research. The data
review and analysis were primarily the result of efforts by T. A. Burnett,
S. R. Hunter, and T. H. Little, of TVA; and L. R. Lepovitz of Radian
Corporation.
This report was principally prepared by T. A. Burnett of TVA and L. R.
Lepovitz of Radian Corporation.

CONTENTS
Executive Summary ...................... S-l
Introduction ........................ l-l
CER System Description ................... 2-l
Facility Location .................... 2-l Coal Compositions .................... 2-3 CER GSA Process Description. ............... 2-4 PJBH Pilot Plant ..................... 2-13 Lime Composition ..................... 2-15
TestPlan..........................3- 1
Factorial Tests ..................... 3-l Major Variables and Levels ............... 3-4 Other Variables .................... 3-13
28-Day GSA Demonstration Run ............... 3-13 14-Day PJBH Demonstration Run .............. 3-14
Results...........................4- 1
SO2 Removal Performance . . . . . . . . .......... 4-1 Factorial Tests . . . . . . . . . . .......... 4-l Lime Utilization . . . . . . . . . . .......... 4-24 Comparison with Previous SD Results .......... 4-26 28-Day GSA Demonstration Run . . . . .......... 4-28 14-Day PJBH Demonstretion Run . . . .......... 4-33
ESP Particulate Control Performance . . .......... 4-41 Factorial Tests . . . . . . . . . . .......... 4-41 Comparison with Previous SD Results .......... 4-48 28-Day GSA Demonstration Run . . . . .......... 4-52 14-Day PJBH Demonstration Run . . . .......... 4-56
ESP Operation . . . . . . . . . . . . _ .......... 4-64 Factorial Tests . . . . . . . . . . .......... 4-64 28-Day GSA Demonstration Run . . . . .......... 4-64 14-Day PJBH Demonstration Run . . . .......... 4-74

CONTENTS
Major Operating and Maintenance Experience ......... 5-l
Factorial Testing .................... 5-l Recycle Feeder BOX ................... 5-l Fly Ash Injection System ................ 5-3 ESPDeposits......................5- 4 ESP Secondary Current Levels .............. 5-5 Reactor Deposits .................... 5-6 Two-Fluid Nozzle .................... 5-7 Recycle Screw Deposits ................. 5-9 Level Indication in Recycle Feeder BOX ......... 5-10
GSA Demonstration Run ................... 5-10 High Ca/S Level .................... 5-10 Boiler-Related Problems ................ 5-12 ESP Solids Deposits .................. 5-13 Double-Dump Valve ................... 5-17 PJBH Operation ..................... 5-18 GSA System Inspection ................. 5-19
PJBH Demonstration Run .................. 5-20 Low A/C Level ..................... 5-20 Two-Fluid Nozzle .................... 5-21 First Field Rappers .................. 5-23
Conclusions .......... ., .............. 6-1
References ......................... 7-l

FIGURES
S-l
s-2
s-3
s-4
s-5
S-6
2-1
2-2
2-3
2-4
3-1
4-1
4-2
4-3
4-4
4-5
4-6
4-7
GSA Demonstration Plant Flow Diagram ......... S-3
DOE/AirPol/TVA Test Program ............. S-7
Results from Preliminary AirPol GSA Test Program . . s-9
Overall System SO2 Removal Results from the AirPol GSA Demonstration ............. s-13
Cross-Sectional Area of Larger GSA Particles .... s-15
ESP Performance Results from the AirPol GSA Demonstration ................. s-17
Plan View of the CER Relative to the Powerplant ... 2-2
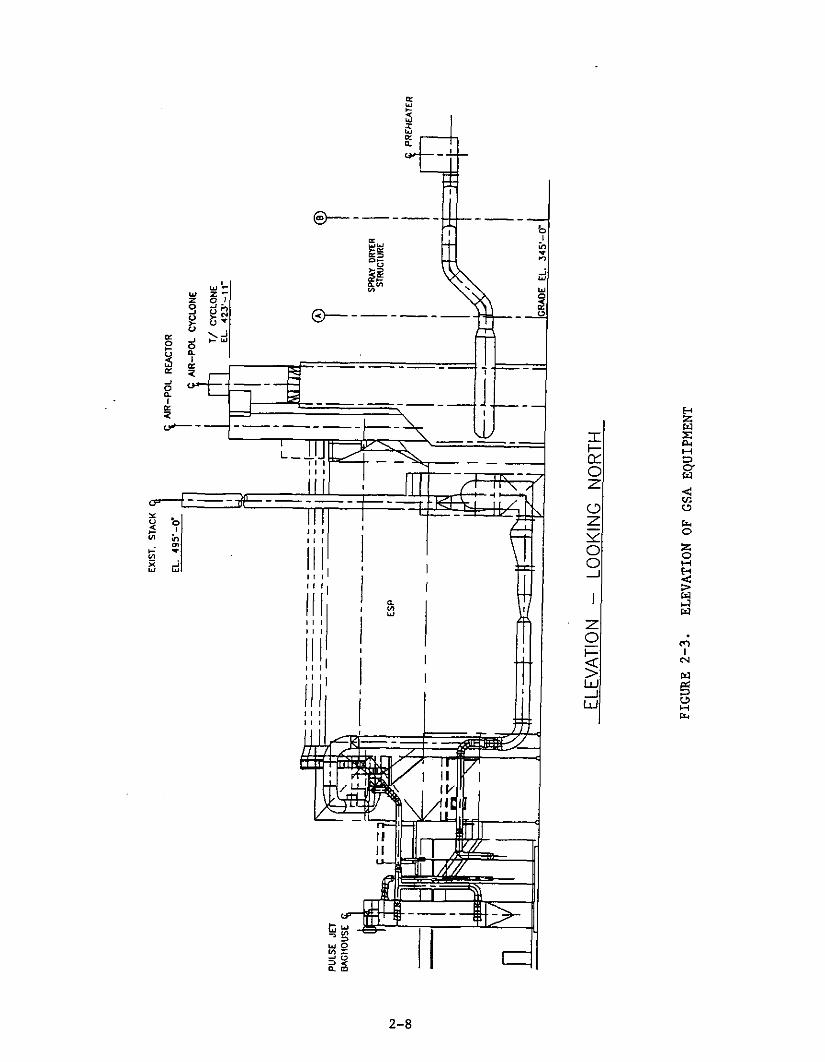
Plan View of the GSA Equipment ........... 2-7
Elevation View of the GSA Equipment ......... 2-8
GSA Demonstration Plant Flow Diagram ......... 2-10
DOE/AirPol/TVA T@st Program ............. 3-2
AirPol GSA SO2 Removal Results 2-AP Series - Baseline Chloride Tests ....... 4-9
AirPol GSA SO2 Removal Results 3-AP Series - Baseline Chloride Tests ....... 4-11
AirPol GSA SO2 Removal Results 2-AP Series - 8OF Approach Tests ......... 4-13
AirPol GSA SO2 Removal Results 2-AP Series - lB°F Approach Tests ........ 4-14
AirPol GSA SO2 Removal Results 2-AP Series - 2S°F Approach Tests ........ 4-15
AirPol GSA SO2 Removal Results 2-AP Series - lS°F Approach/Chloride Spiking Tests ................... 4-16
AirPol GSA SO2 Removal Results 2-AP Series - 2S°F Approach/Chloride Spiking Tests ................... 4-17

Page
AirPol GSA SO2 Removal Results 3-AP Series - Baseline Tests . . . . . . . . . . . . 4-18
AirPol GSA SO2 Removal Results 2-AP Series - Chloride Spiking Tests . . . . . . . . 4-21
AirPol GSA SO2 Removal Results 2-AP Series - lB°F Approach Tests . . . . . . . . 4-22
AirPol GSA SO2 Removal Results 2-AP Series - 20OF Approach Tests . . . . . . . . 4-23
AirPol GSA SO2 Removal Results 3-AP Series - Baseline vs. Chloride Spiking Tests . . . . . . . . . . . . . . . . . . . . ...4-25
Comparison of Spray Dryer and AirPol SO2 Removal Performance . . . . . . . . . . . . . 4-27
2B-Day Demonstration Run Average Daily Stiochiometry . . . . . . . . . . . . 4-32
14-Day PJBH Demonstration Run Averaging Daily Stoichiometry . . . . . . . . . . . 4-36
14-Day PJBH Demonstration Run Total System SO2 Removal . . . . . . . . . . . . 4-38
14-Day PJBH Demonstration Run Total System Lime Utilisation . . . . . . . . . . . 4-40
Comparison of Calculated and Measured Reactor Lime Utilisations - 1-PJ Series Tests . . . . . . . 4-42
AirPol GSA ESP Performance Results ESP Particulate Emissions vs. SCA . . . . . . . . . 4-47
AirPol GSA ESP Performance Results Particulate Collection Efficiency vs. SCA . . . . . 4-49
Comparison of Spray Dryer and AirPol ESP Particulate Control Performance . . . . . . . . 4-50
Comparison of Spray Dryer and AirPol ESP Particulate Collection Efficiency . . . . . . . 4-51
2B-Day Demonstration Run ESP Performance Results: ESP Particulate Removal . . . . . . . . . 4-54
4-B
4-9
4-10
4-11
4-12
4-13
4-14
4-15
4-16
4-17
4-18
4-19
4-20
4-21
4-22
4-23

Figures (Continued)
4-24
4-25
4-26
4-27
4-28
4-29
4-30
4-31
4-32
4-33
5-l
5-2
Z&Day Demonstration Run ESP Performance Results: BSP Particulate Emissions ........ 4-55
14-Day PJBH Demonstration Run ESP Performance ESP Particulate Removal .............. 4-58
14-Day PJBH Demonstration Run ESP Performance ESP Particulate Emissions ............. 4-59
14-Day PJBH Demonstration Run ESP and PJBH Particulate Removal ................ 4-62
14-Day PJBH Demonstration Run ESP and PJBH Particulate Emissions ............... 4-63
Z&Day Demonstration Run ESP Performance Average Secondary Currents ............. 4-71
Z&Day Demonstration Run ESP Performance Average Secondary Voltages ............. 4-72
28-Day Demonstration Run ESP Performance Average Daily Secondary Currents .......... 4-73
14-Day PJBH Demonstration Run ESP Performance Average Secondary Currents ............. 4-76
14-Day PJBH Demonstration Run ESP Performance Average Daily Secondary Currents .......... 4-77
28-Day Demonstration Run ESP Performance Average Daily Secondary Currents .......... 5-15
Daily Average ESP Emission Rate ........... 5-16

TABLES
Major Process Variables and Variable Levels in the Factorial Test Plan ............ s-11
Typical Coal and Ash Compositions for the High Sulfur Coals ................. 2-4
Proximate Coal Analyses for the High-Sulfur Coals ................. 2-5
Typical Lime Composition .............. 2-16
Major Process Variables and Levels for the GSA Factorial Testing ........... 3-5
Finalised Basic and Replicate Tests ......... 4-2
AirPol GSA/ESP SO2 Removal Results Summary 2-AP Series - Baseline Tests ............ 4-4
AirPol GSA/ESP SO2 Removal Results Summary 3-AP Series - Baseline Tests ............ 4-5
AirPol GSAfESP SO2 Removal Results Summary 2-AP Series - Chloride Spiking Tests ........ 4-6
AirPol GSA/ESP SO2 Removal Results Swmnary 3-AP Series - Chloride Spiking Tests ........ 4-7
AirPol GSA/ESP SO2 Removal Results Summary DR Series - 28-Day Demonstration Run ........ 4-30
AirPol GSA/ESP SO2 Removal Results Sumnary PJ Series - 14-Day Demonstration Run ........ 4-35
AirPol GSA/PJBH SO2 Removal Results Summary PJ Series - 14-Day Demonstration Run ........ 4-39
AirPol GSAjESP Particulate Results Sumnary 2-AP Series - Baseline Tests ............ 4-43
AirPol GSA/ESP Particulate Results Summary 3-AP Series - Baseline Tests ............ 4-44
AirPol GSA/ESP Particulate Results Summary 2-AP Series - Chloride Spiking Tests ........ 4-45
AirPol GSA/ESP Particulate Results Summary 3-AP Series - Chloride Spiking Tests ........ 4-46
S-l
2-1
2-2
2-3
3-1
4-1
4-2
4-3
4-4
4-5
4-6
4-7
4-a
4-9
4-10
4-11
4-12

Tables (Continued)
4-13
4-14
4-15
4-16
4-17
4-18
4-19
4-20
4-21
AirPol GSA/ESP Particulate Results Sumnary DR Series - 2S-Day Demonstration Run . . . . . . . . 4-53
AitPol GSA/ESP Particulate Control Performance Results Summary: PJ Series - 14-Day Demonstration Run . , . . . . . . . . . . . . . . . 4-57
AirPol GSA/PJBH Particulate Control Performance Results Summary: PJ Series - 14-Day Demonstration Run . . . . . . . . . . . . . . . . . 4-61
Average AirPol ESP Secondary Currents and Voltages: 2-AP Series - Baseline Tests . . . . . . 4-65
Average AirPol ESP Secondary Currents and Voltages: 3-AP Series - Baseline Tests . . . . . . 4-66
Average AirPol ESP Secondary Currents and Voltages: 2-AP Series - Chloride Spiking Tests. . . 4-67
Average AirPol ESP Secondary Currents and Voltages: 3-AP Series - Chloride Spiking Tests. . . 4-68
Average AirPol ESP Secondary Currents and Voltages: l-DR SLries . . . . . . . . . . . . . . . 4-69
Average AirPol ESP Secondary Currents and Voltages: l-PJ Series . . . . . . . . . . . . . . . 4-75

List of Abbreviations
actual cubic feet per minute air-to-cloth ratio atmospheric fluidised bed combustion
British thermal units
calcium-to-sulfur ratio carbon dioxide Center for Emissions Research continuous wet-bulb monitor cubic feet
degrees (Fahrenheit) Department of Energy diameter
Electric Power Research Institute electrostatic precipitator
feet flue gas desulfurisation
Gas Suspension Absorption grains per actual cubic foot g==
horsepower hydrogen chloride
inches induced draft
kilovolt
milliamp million
New Source Performance Standards
pounds pounds per square inch gauge pulsejet baghouso
revolutions per minute
acfm A/C AFBC
Btu
lx/s
CO2 CER CNBH ftJ
OF DOE dia.
EPRI ESP
ft FGD
GSA gr/acf g
hp HCl
in. ID
kV
mA M
NSPS
lb Psig PJBH
=pm

List of Abbreviations
second Shawnee Fossil Plant slaked lime specific collection area spray dryer square feet square meter stainless steel standard cubic feet per minute sulfur dioxide sulfur trioxide
Technology Advancements Tennessee Valley Authority transformer/rectifier
Abbreviation
set SHF WOW2 SCA SD ft2 Ii2 ss scfm
SD2 SD3
TA TVA T/R
-.
EXECUTIVE SUMMARY
AS part of the U.S. Department of Energy's (DOE) Clean Coal Technology
Program, AirPol Inc., a U.S. subsidiary of the Danish company, FLS miljo
a/s, installed a lo-MW Gas Suspension Absorption (GSA) demonstration plant
at the Tennessee Valley Authority's (TVA's) Center for Emissions Research
(CER). The CER is located at TVA's coal-fired Shawnee Fossil Plant near
Paducah, Kentucky. The l7-month test program, which began on November 1,
1992 and was completed on March 31, 1993, was funded two-thirds by TVA and
one-third by DOE/AirPol.
AirPol requested that TVA act as the host site and provide operating,
maintenance, and technical support for this demonstration project because
of TVA's background and experience with other dry, lime-based flue gas
desulfurization (FGD) systems at the CER and the availability of the
existing infrastructure at this facility (l-3). TVA's Technology
Advancements (TA) staff accepted AirPol',s proposal and agreed to
participate in this demonstration project for several reasons. The most
important reasons were that the GSA process was very similar to other dry,
lime-based FGD technologies that TA had evaluated and found to be both
technically and economically attractive and second, the GSA process
appeared to fulfil1 the electric utility industry's need for an FGD
technology that was not a "chemical plant".
The GSA technology was developed by FLS miljo a/s in Europe for removing
acid gases from the flue gas generated by many industrial processes. It
is being used at several municipal waste incinerator plants in Europe to
remove hydrogen chloride (HCl), sulfur dioxide (SO2). and some air toxic6
materials from the flue gas. In this first application of this technology
in the U.S., the GSA FGD system is treating a lo-MW slipstream of flue gas
resulting from the combustion of a high-sulfur (2.7 percent, as-fired
basis) eastern bituminous coal.
The major objectives of the demonstration were to: (1) optimize the GSA
process operating variables; (2) determine the calcium-to-sulfur ratio
(Ca/S) required for various SO2 removal efficiencies; (3) demonstrate
90 percent or greater SO2 removal efficiency in the GSA/electrostatic
precipitator (ESP) system; (4) determine the impact of the GSA process on
the operability and performance of an ESP; (5) evaluate the performance of
a l-MU pulsejet baghouse (PJBH) used in conjunction with a slipstream from
the GSA system; (7) evaluate the air ‘toxics removal capabilities of the
GSA system vith the ESP and with the PJBH; (8) compare the SO2 removal
efficiency achieved in the GSA/ESP system with that in the GSA/PJBH system;
(9) complete a 28-day, around-the-clock demonstration run; (10) compare
the GSA performance with that of the conventional spray dryer (SD) process;
(11) evaluate equipment erosion and corrosion at various locations in the
GSA/ESP system; and (12) compare the relative economics of the GSA process
with other competing technologies, including the SD process.
PROCESS DESCRIPTION
A simplified GSA process flow diagram, as installed at TVA’s CER, is shown
in Figure S-l. The SO2-laden flue gas from the boiler air preheater
passes through a preheater/precooler and then to the GSA reactor where it
enters the bottom of the reactor and flows upward through a venturi-type
section before entering the cylindrical section of the reactor. A
freshly-slaked lime slurry is injected into the cylindrical section of the
reactor through a single, two-fluid nozzle and the resulting atomized
slurry also flows upward, co-currently with the flue gas. The quantity of
lime slurry used is based on the SO2 content of the inlet flue gas and
the required SO2 removal efficiency. Trim water is added to the lime
slurry to cool the flue gas to the design approach-to-adiabatic-saturation
temperature (hereafter referred to as the approach-to-saturation
temperature) in the reactor. The freshly-slaked lime slurry atomized into
the reactor coats the surface of the dry recycle solids entrained in the
flue gas. This results in the dispersion of the fresh lime slurry over a
very large surface area and enhances the mass and heat transfer in the
reactor. The resulting thin layer of lime slurry absorbs the SO2 and
HCl, as well as the sulfur trioxide (SO31 and carbon dioxide (CO2),
from the flue gas and these absorbed acid gases then react with the slaked
lime (Ca(OH)2) to form a mixture of reaction products; i.e., calcium
s-2

s-3

sulfite, sulfate, carbonate, and chloride. The primary overall reactions
in the GSA system are:
C=vw, (=q) + so2 (9) eCaS.03 * l/2 Ii20 (8) + l/2 H20 (g)
C=(OH)2 (=q) + SO3 (9) + H20 (=q)-CaSOq * 2H20 (8)
C=(OH)2 (aq) + CO2 (gl-CaCO3(s) + H20 (g)
Ca(OH)2 (aq) + 2HCl (g) + 4H20 (aq)dCaC12 * 6H20 (e)
These reactions are thought to take place primarily in the thin layer of
fresh lime slurry coating the dry recycle solids. (The reaction products
are show" in the fully hydrated form, even though a mixture of hydration
levels would be expected.)
simultaneously, the sensible heat in the hot flue gas evaporates most of
the water from this slurry, thus, cooling and humidifying the flue gas
while producing dry solids. The resulting dry solids are entrained in the
flue gas along with fly ash from the boiler and flow up through the reactor
and exit out the top into a cyclone-type mechanical collector. The cyclone
removes most of the particles from the flue gas (90+ percent) and nearly
all of these solids are recycled to the reactor to provide the fluidizing
bed material. The flue gas from the cyclone then passes to a lo-MW, four-
field ESP for final particulate removal. The flue gas from the ESP is
reheated, passed to a" induced draft fan, and discharged to the atmosphere
through a stack. (The reheat system at the CER is required because of the
constrained site; most GSA installations will probably not be required to
have a reheat system.)
Host of the solids collected in the cyclone are fed back to the reactor
via a recycle feeder box that provides temporary, in-process storage. The
solids are pulled from the recycle feeder box by screw conveyors, which
feed the solids back to the inlet of the reactor, thereby maintaining a
high concentration of solids in the reactor. The recycle solids provide
the surface area that is covered by the injected lime slurry. The high
s-4

concentration of solids is also thought to continuously clean the inner
surface of the reactor.
The solids collected in the ESP are moved by mechanical conveyors and a
bucket elevator into a by-product storage silo. Also, some of the cyclone
catch is moved by this bucket elevator to the storage silo. At the CER,
for TVA’s convenience, these dry by-product solids are reslurried and the
resulting slurry is pumped to the existing ash pond for final disposal.
In a commercial GSA installation, these dry by-product solids would be
mixed with lesser amounts of water (20-30 percent by weight) and laid down
in an onsite landfill. Since this by-product material contains ““reacted
lime and fly ash, water is the only remaining reactant thought to be needed
for the material to undergo a pozzolanic reaction and “set up” into a low-
grade concrete.
The lime slurry is prepared from a high-calcium, pebble lime in a
conventional, paste-type slaker. The resulting lime slurry is pumped to a
storage tank and then to the process feed tank. The slurry is pumped from
the feed tank to the single, two-fluid nozzle in the bottom of the
cylindrical section of the reactor as needed in the process. The flow of
the lime slurry is controlled by the continuous measurement of the flue
gas SO2 content either upstream of the reactor or downstream of the dust
collector. Also, trim water is mixed with the lime slurry that is pumped
to the nozzle to lower the flue gas temperature to the requited operating
temperature in the reactor, which is typically 145-155OF. (These flue
gas temperatures correspond to an approach-to-saturation temperature of
18-280F at the reactor outlet.)
The PJBH pilot plant, which was installed at the CER (see Figure S-l) as
part of a joint TVA/Electric Power Research Institute (EPRI) program,
treats a l-MW slipstream of flue gas from the main GSA/ESP plant. The
flue gas slipstream for the PJBH can be removed from either the ESP inlet
or outlet and the treated flue gas is returned to the main GSA plant
ductwork downstream of the ESP. The solids collected in the PJBH are
pneumatically conveyed to the by-product storage silo in the GSA/ESP
process for disposal with the other GSA by-product material.
s-5

GSA TEST PROGRAM
The 13 month GSA test program was composed of five parts as shown in
Figure S-2. The first part was the preliminary or startup tests, which
were completed in November and December 1992. The second part was the
factorial tests, which were completed between January and August 1993.
The third part was the air toxics testing, which was completed between
mid-September and mid-October 1993. The fourth part was the 28-day GSA
demonstration run, which was completed in late October and November 1993.
The fifth and final part was the 14-day PJBH demonstration run. This PJBH
run was originally scheduled to be run simultaneously with the final two
weeks of the 28-day GSA demonstration run in November 1993, but could not
be completed until Match 1994. Only the factorial tests and the two
demonstration runs are discussed in any detail in this report.
Preliminary Testing
The purpose of the preliminary tests was to investigate the operating
limits of the lo-MU GSA system as installed at the CER. The results from
several of these preliminary tests were very interesting. The discussion
of these tests is basically limited to those tests and results that
impacted the selection of variable levels for the factorial test plan.
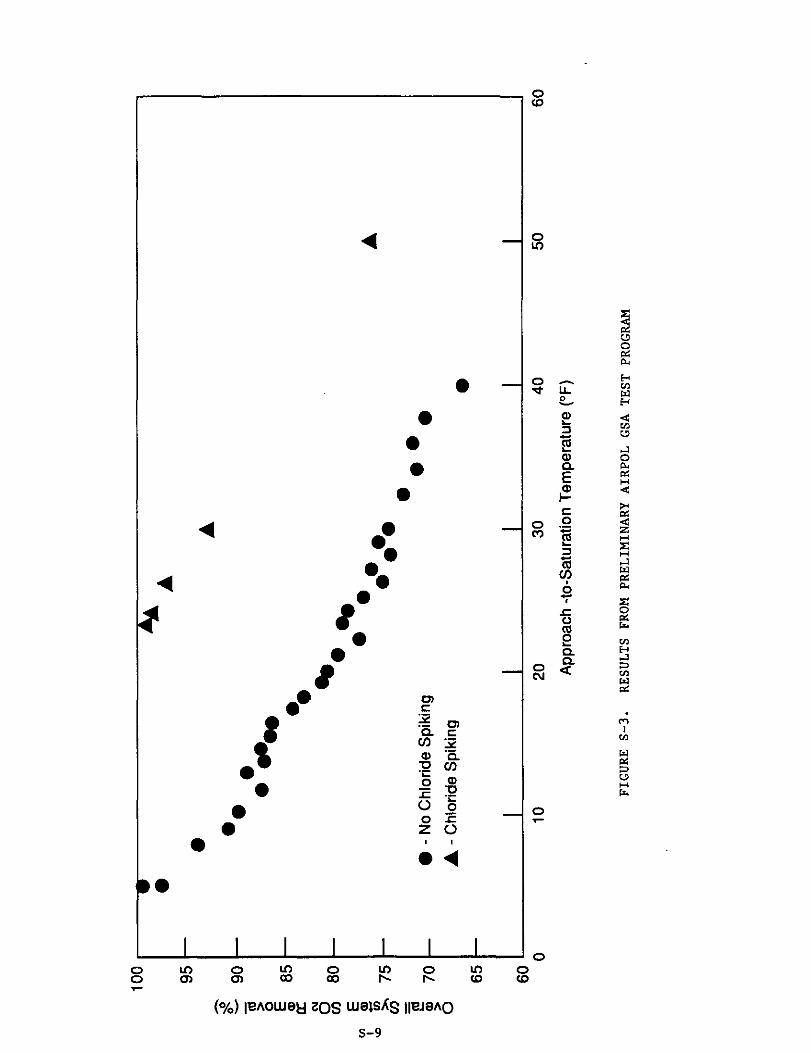
During one of the preliminary tests, the approach-to-saturation temperature
in the reactor was gradually decreased over the cour.se of several days and
the overall system (reactor/cyclone and ESP) SO2 removal efficiency was
monitored. The overall system SO2 removal efficiency increased from
about 65 percent to more than 99 percent as the approach-to-saturation
temperature decreased from 40 to 5OF, as shown in Figure S-3. The other
test conditions, which remained constant throughout the test, were:
320°F inlet flue gas temperature, 1.40 moles Ca(OH)2/mole inlet SO2
for the Ca/S level, and essentially no chloride in the system. Even
though this test was run at a very close approach-to-saturation temperature
(5OF) on the final day, there was no indication of plugging in the
system and the moisture level in the reactor/cyclone by-product material
was very low (cl.0 percent).
S-6

s-7

A second, extended, preliminary test was run at the same conditions as the
previous test, except that in this test, calcium chloride was added to the
GSA system to simulate the combustion of a high-chloride (0.30 percent)
coal. In keeping with the purposes of these preliminary GSA tests, the
simulated coal chloride level was set at this unusually high level
(0.30 percent) to cover most of the expected range for this variable.
Again, the approach-to-saturation temperature was gradually decreased with
all other conditions held constant and the overall system SO2 removal
efficiency was monitored. The results from this second test are also
shown in Figure S-3. The overall system SO2 removal efficiency in this
test increased from about 75 percent at the high approach-to-saturation
temperature condition (40°F) to about 100 percent at the lowest approech-
to-saturation temperature tested (23oF). In addition, there was no
indication of plugging and the moisture level in the reactor/cyclone
solids remained very low (< 1.0 percent).
Another series of startup tests involved evaluating the SO2 removal
efficiency as a function of the recycle screw speed, which is an indirect
measure of the recycle rate in the system. The initial design range for
the recycle screw speed was 10 to 22 rpm and the results from these tests
indicated that the overall system SO2 removal efficiency increased as
the recycle screw speed was increased over this range. Therefore, the
system was modified to double the maximum recycle screw speed to 45 rpm,
which was the upper level for this variable in the factorial test program.
Factorial Testing
Most of the GSA test results discussed in this report were obtained from
the statistically-designed test plan that was completed in August 1993.
This test plan was a half-factorial design with a full set of replicates
to reduce the effects of variability in the data on the results. This
design also allowed the PJBH to treat the flue gas from the ESP inlet
during the basic tests and from the ESP outlet during the replicate tests.
The primary purpose of this factorial test program was to determine the
S-8
8 8
8 3 0
. . 0 b.
I I I I I I

effect of the process design variables on the SO2 removal efficiency in
the reactor/cyclone, the ESP, and the overall system.
Based on the results from the preliminary testing, the major process
design variables were determined, levels for each of these variables were
defined, and the test plan was prepared. The major process design
variables were: approach-to-saturation temperature, Ca/S level, inlet fly
ash loading, coal chloride level, flue gas flow rate, and recycle screw
speed. Two levels were determined for nearly all of the variables and
these variables and levels are shown in Table S-l. The exception was the
approach-to-saturation temperature where three levels were defined (8, 18,
and 28oF), but the lowest approach-to-saturation temperature (8OF) was
only run for those tests at the lower coal chloride level. The maximum
Ca/S level tested was only 1.30 moles Ca(OH)2/mole inlet S02, even
though higher levels were technically feasible. This lower maximum Ca/S
level was selected because the relative economics of these dry, lime-based
processes for a high-sulfur coal application dictate that the Ca/S level
be minimized.
sQ2 Removal Efficiency - The overall system SO2 removal efficiencies
during these factorial tests ranged from slightly more than 60 percent to
nearly 95 percent, depending on the specific test conditions. The higher
SO2 removal efficiency levels were achieved at the closer apptoach-to-
saturation temperatures (8 and 18OF), the higher Ca/S level (1.30 moles
Ca(OH)2/mole inlet SO2), and the higher coal chloride level
(0.12 percent) for the 18OF approach-to-saturation temperature level.
The data from the factorial tests completed at these conditions are shown
in Figure S-4. The slight scatter in the data in this figure is due to
the variation in the levels for the other major variables in these tests
(i.e., flue gas flow rate, recycle screw speed, etc.). The lower SO2
removal efficiency levels were achieved at the opposite conditions, i.e.,
the highest approach-to-saturation temperature (28OF), the lover Ca/S
level (1.00 mole Ca(OH)2/mole inlet SO2), and the lower coal chloride
level (0.02-0.04 percent).
Most of the SO2 removal in the GSA system occurs in the reactor/cyclone,
with only about 2-5 percentage points of the overall system SO2 removal
s-10
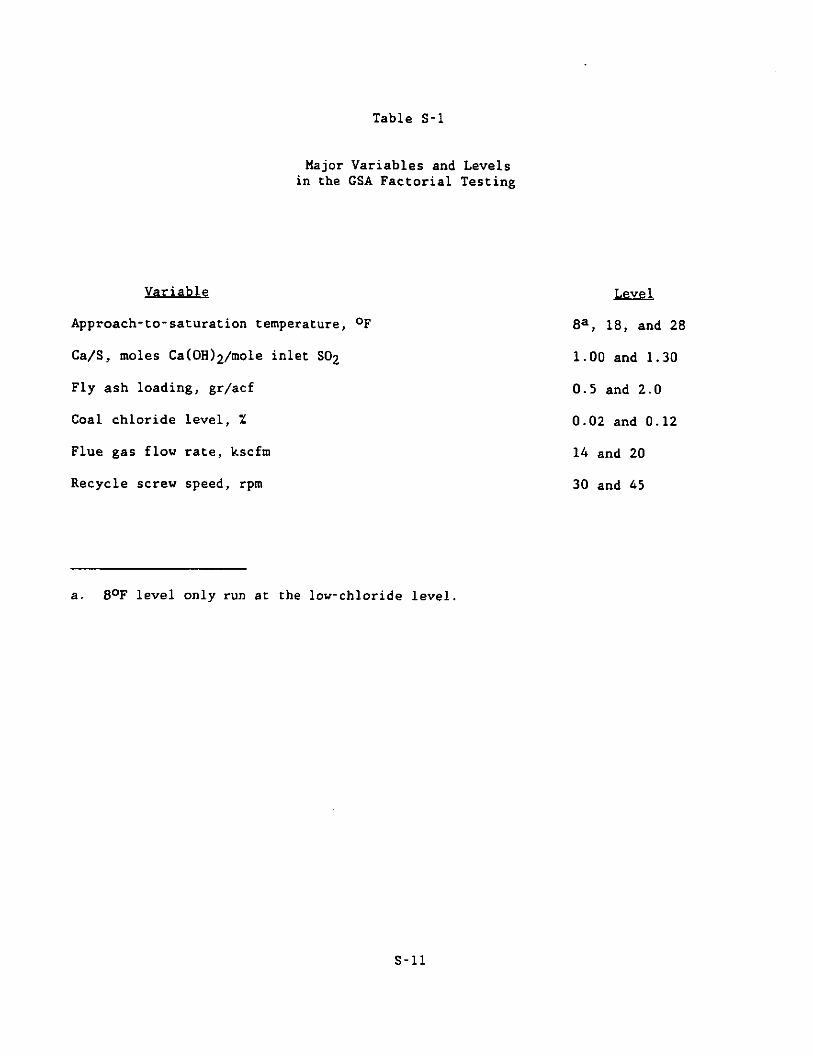
Table S-l
Major Variables and Levels in the GSA Factorial Testing
Variable
Approach-to-saturation temperature, OF
G/S, moles Ca(OH)2/mole inlet SO2
Fly ash loading, gr/acf
Coal chloride level, %
Flue gas flow rate, kscfm
Recycle screw speed, rpm
J&y&
8*, 18, and 28
1.00 and 1.30
0.5 and 2.0
0.02 and 0.12
14 and 20
30 and 45
a. 8°F level only run at the low-chloride level.
s-11

occurring in the ESP. This is substantially less SO2 removal in the ESP
than in the previous SD/ESP testing at the CER. The lower SO2 removal
efficiency in the ESP in the GSA system is hypothesized to be due to both
the very low moisture level in the particulates and the lower grain
loading entering the ESP.
These overall system SO2 removal efficiency results from the factorial
tests were similar to those achieved in the previous testing of SD/ESP
system. In general, the major variables had the expected effects. First,
increasing the Ca/S level, increasing the coal chloride level, or lowering
the approach-to-saturation temperature, each had a significant positive
effect on the SO2 removal efficiency in the GSA system. The recycle
feed rate, as measured by the recycle screw speed, and the flue gas flow
rate, individually, have a minor effect on the SO2 removal efficiency in
the GSA system. These two variables have opposite effects on the SO2
removal efficiency, i.e., increasing the recycle screw speed or decreasing
the flue gas flow rate results in higher SO2 removal efficiencies. The
inlet fly ash loading also had a minor, negative effect on SO2 removal
efficiency over the range tested.
The overall system SO2 removal efficiency data from these factorial
tests werzmodeled. The result of this modeling was a linear equation
that predicted the overall system SO2 removal efficiency based on the
major variable levels. The coefficient of determination for this model
is 0.93, indicating that this model is very good at explaining the
variability in the test data. The mean square error term for this model
was +/- 2.5 percentage points meaning that the 95 percent confidence bands
lie within +/- 5.0 percentage points of the model predictions.
The resulting projected overall system SO2 removal efficiencies as a
function of the Ca/S level and the approach-to-saturation temperature are
shown in Figure S-4, along with the data from some of the ,factorial tests.
These data indicate a good match between the model predictions and the
test data.
tierability - One of the most surprising results of this testing was the
ability of the GSA system to operate at close approach-to-saturation
s-12

\ \
1
‘8, u *
\ * s \ \ . \ \ \ \ \ , \ \ \ \ l
\ *
\
\ \ ‘,, \
4, A
I I I I I I I 8 s 8 I? i2
(%) p3lOum~ 10s lJJe1sAs IlW0AO
s-13

temperatures without incurring any operating problems. This is even more
impressive given the very low flue gas residence time in the reactor/
cyclone. During the factorial testing, the GSA system was able to operate
at an approach-to-saturation temperature of 8OF at the low coal chloride
level and an approach-to-saturation temperature of 18OF at the higher
coal chloride level. No operating problems were encountered in the
factorial tests completed at either condition. In fact, the moisture
level in the by-product solids remained below 1.0 percent in all of these
factorial tests, even at the higher coal chloride level.
The analysis of the solids from the GSA system appeared to support the
theory that the dry recycle solids are coated with a thin layer of fresh
lime slurry on each pass through the reactor. Figure S-5 shows a photo-
micrograph of the cross-section of one of the large particles removed from
the recycle stream. This photograph shows a central core surrounded by a
series of rings similar to tree rings. Spectral analysis of these layers
determined that the central core of this particle is fly ash, while the
surrounding rings are composed of calcium-sulfur compounds.
Lime Utilization - The lime utilization in the GSA system, which is
calculated by dividing the overall system SO2 removal efficiency by the
Ca/S level, was relatively high, ranging from 60 to 80 percent depending
on the specific test conditions. The highest lime utilization rates were
achieved in those tests completed at the lower Ca/S level (1.00 mole
Ca(OH)2/mole inlet SO21, lower approach-to-saturation temperature
(18OF), and higher coal chloride level (0.12 percent). These calculated
lime utilization rates were also compared with the lime utilization rates
determined in the laboratory by analysis of the recycle solids and the ESP
solids. In general, the calculated reactor/cyclone lime utilization rate
matched the laboratory-determined rate for the recycle solids quite well.
Since the calculated values were based on the average test results, while
the laboratory analyses reflected an average value for a much shorter
period of time, some variability would be expected in a comparison of
these two values.
Cvclone Performance - Although the particulate removal efficiency in the
cyclone was not determined during this testing, the removal efficiency was
s-14

Figure s-5. Cross-Sectional Area of Larger GSA Particles.
s-15

estimated to be very high (>90 percent). The basis for this estimate is
the relatively modest grain loadings at the ESP inlet, relative to the
grain loading in the reactor itself. The cyclone achieved this high
removal efficiency presumably because of the number of relatively large
particles in the flue gas stream.
The main purposes of the cyclone in the GSA system were to: (1) provide
the dry recycle material for the reactor and (2) reduce the inlet grain
loading to the ESP. Previous work at the CER had shown that high removal
efficiencies in the ESP might not be good enough to achieve the emission
standards, if the ESP inlet grain loading was too high. By reducing the
ESP inlet grain loading to 3-5 gr/acf, the cyclone allowed the ESP to meet
the emission rate standards, as discussed further below.
ESP Performance - The ESP installed at the CER is a relatively modern,
four-field unit with 10 in. plate spacing, similar in design to several
full-scale ESPs installed on the TVA power system. This unit has 23 ft
high plates with 8 parallel gas passages. The specific collection area
(SCA) of this ESP is about 440 ft2/kacfm under the cooled, humidified
flue gas conditions downstream of the reactor/cyclone. (For the untreated
flue gas at 300°F, i.e., in a fly-ash-only application, the SCA of this
ESP is about 360 ft2/kacfm.)
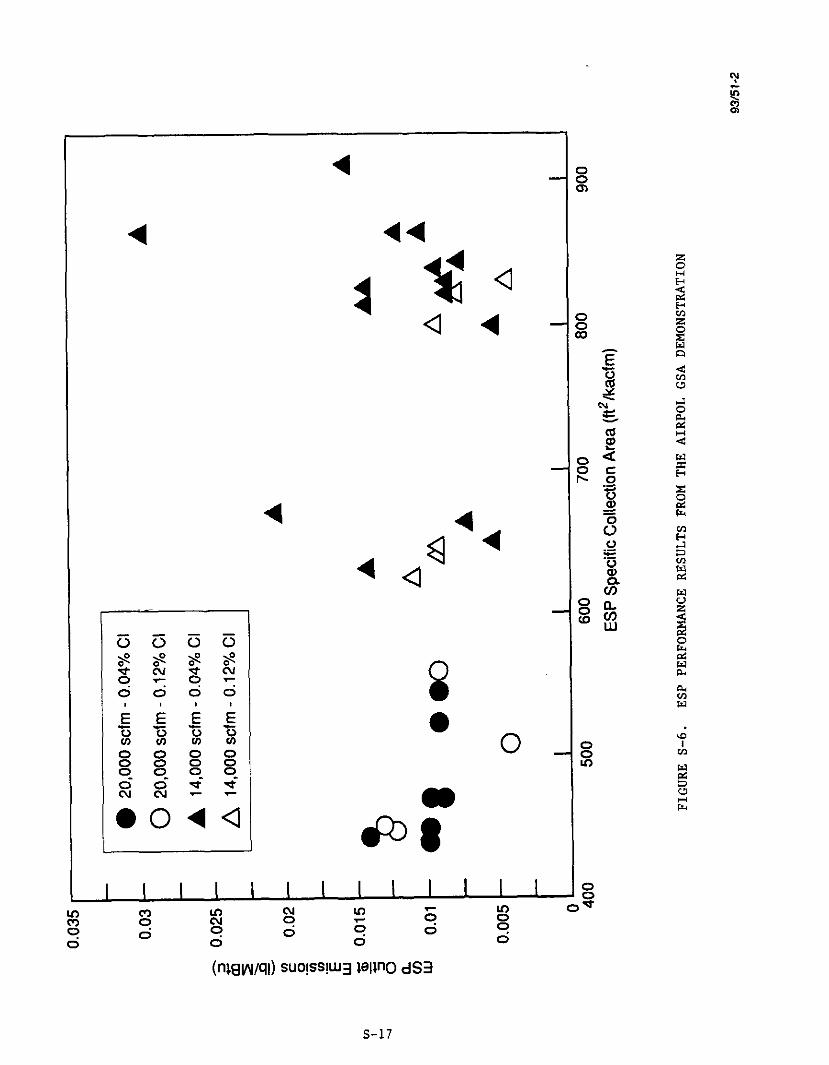
The particulate performance of the ESP was determined for each of the
factorial tests. The most important result of this particulate testing
was that the emission rate from the ESP was well below the New Source
Performance Standards (NSPS) for particulates, i.e., 0.03 lb/million
British thermal units (MBtu), at all of the test conditions evaluated, as
shown in Figure S-6. In fact, with the exception of two tests, the
emission rate was in the range of 0.005 to 0.015 lb/MBtu. The particulate
removal efficiency in the ESP was above 99.9 percent for most of these
tests and the outlet grain loadings were below 0.005 gr/acf.
One surprising result of this testing was that there was no significant
improvement in the ESP performance at the relatively low flue gas flow
rates encountered when the GSA system was operating at the lower flue gas
flow rate and the PJBH was operating and pulling flue gas from the ESP
S-16
4 :
44
a *b ’ a a 4 --I
a
4
8 0
0
0044
I I I I I I I I I I I I I -Ei % 2 Ki ol ? z Fi 0*
9 9 d 9 0 9 d 9 0 0 0 0
Owruqi) SUO!SS!“‘3 wwo &El
s-17

inlet. For some of these tests with both the GSA system operating at the
low flue gas flow rate (14,000 scfm) and the l-MW PJBH pilot plant
operating and pulling 5,000 acfm of flue gas from the ESP inlet, the SCA
in the ESP was effectively doubled and approached 900 ft2/kacfm. The
flue gas velocity in the ESP also dropped below 2.0 ftfsec in these
tests. However, the emission rats remained in the same range as in the
other tests, i.e., 0.010 lb/MBtu, as previously shown in Figure S-b.
Thus, significantly increasing the effective SCA in the ESP had no major
effect on the emission rate over the SCA range tested.
Comparison with SD Results - The overall system SO2 removal efficiency
in the GSA system was comparable to the performance previously achieved in
the lo-MW SD testing at similar test conditions. The SO2 removal
efficiencies in the reactor/cyclone were higher than that achieved in the
SD vessel, but the SO2 removal efficiency in the ESP was lower in the
GSA testing than for the comparable SD testing. The net effect was that
the overall system SO2 removal efficiencies for the two FGD systems were
essentially the same.
The ESP performance in the GSA testing was also comparable to that
achieved in the previous SD testing. The particulate removal efficiencies
were typically 99.9+ percent in both systems. nowever, the lower ESP inlet
grain loadings in the GSA tests resulted in a slightly lower emission rate.
PJBH Performance - Although not part of the original GSA project, TVA and
EPRI cofunded the installation of a l-MW PJBH pilot plant at the CER to be
operated in conjunction with the existing GSA demonstration. Later, DOE
and AirPol joined in sponsoring this PJBH pilot plant program. This PJBH
contained 48 bags arranged in three concentric rings. The bags used in
this testing were fabricated from a low-cost, acrylic material because of
the low temperature application. The PJBH pilot plant was started up in
January 1992 and operated during the factorial test program, the air
toxics tests, and the 14-day PJBH demonstration run.
During the basic factorial tests, the PJBH operated with the full
complement of 48 bags and was treating flue gas from the BSP inlet, which
contained the full particulate loading (3-5 gr/acf) from the GSA reactor/
S-18

cyclone. The inlet flue gas flow rate was about 5,000 acfm, which corresponds to an air-to-cloth ratio (A/C) of 4.0 acfm/ft2 in the PJBH.
The cleaning of the bags in the PJBH was pressure-drop-initiated during this testing, with the cleaning cycle begun whenever the tubesheet pressure drop reached 6 in. of water. The cleaning continued until the tubesheet
pressure drop had declined to 4.5 in. of vater.
During the replicate factorial testing, the PJBH was pulling flue gas from the ESP outlet. The inlet flue gas flow rate was again 5,000 acfm, but
the A/C was 12.0 acfm/ft2 for these tests since about two-thirds of the
bags had been removed from the PJBH prior to this replicate factorial
testing. This dramatic increase in the A/C was possible because the inlet
grain loading to the PJBH was typically only 0.02 gr/acf or less. The PJBH was again operated in the pressure-drop-initiated cleaning mode.
During the factorial tests, the SO2 removal efficiency in the PJBH was
typically about 3-5 percentage points higher than that achieved in the
ESP at the same test conditions. Thus, as expected, the reactor/cyclone/
PJBH system achieved a higher overall system SO2 removal efficiency than the reactor/cyclone/ESP system. This higher SO2 removal efficiency in
the PJBH system was not unexpected given the intimate contact as the SO2-
laden flue gas passed through the filtercake and the bags before being
discharged to the stack. The approach-to-saturation temperature was also
lover in the PJBH, which would be a major contributor to the higher SO2
removal efficiency in the PJBH.
However, it should be noted that most of the SO2 removal still occurred
in,the reactor/cyclone and the PJBH SO2 removal efficiency, based on the inlet SO2 to the reactor, contributed less than 8 percentage points to the overall system SO2 removal efficiency during this testing. This
PJBH SO2 removal efficiency is lower than that generally seen in a SD
application, probably because of the low moisture levels in the particles.
During the replicate factorial testing, the PJBH was pulling flue gas from the ESP outlet and the inlet SO2 concentration was very low. Thus, although the SO2 removal efficiency across the PJBH may have been high,
s-19

the PJBH contribution to the overall system (reactor/cyclone/ESP/PJBH)
SO2 removal efficiency was very low at only 2-4 percentage points.
The particulate removal efficiencies in the PJBH were 99.9+ percent for
all of the tests completed with the full dust loading from the GSA reactor/
cyclone. The emission rate for all of these tests was well below the NSPS
for particulates and was typically in the range of 0.010 lb/MBtu. The
filtercake on the bags was relatively easy to dislodge and no problems
with cleaning the bags were encountered.
The particulate removal efficiencies in the replicate factorial tests with
the PJBH pulling flue gas from the ESP outlet were "only" 90-95 percent.
However, since the inlet grain loading was very low, this "low" particulate
removal efficiency was not unexpected and the outlet grain loadings from
the PJBH were extremely low. The emission rates from the PJBH for these
tests were more than an order of magnitude below the NSPS for particulates.
These results would seem to confirm that a high A/C PJBH can be installed
downstream of an existing, high-efficiency ESP as a relatively low-cost,
final-stage, particulate cleanup device. For some retrofit applications
where the existing ESP is relatively small and the inlet grain loading to
the PJBH may be higher, additional testing would need to be completed.
(There was not sufficient test time available to evaluate the number of energized ESP fields as a major variable.)
28-Dav GSA Demonstration Run
A long-term, 28-day GSA demonstration run was successfully completed in
late November 1993. The purpose of this run was to demonstrate that the GSA system (reactor/cyclone/ESP), as installed at the CER, could operate
reliably and continuously, 24 hours/day, seven days/week for a four-week period, while simultaneously achieving 90+ percent SO2 removal and maintaining the ESP emissions below the NSPS for particulates. There was
one interruption during this run when the boiler came off-line for 40 hours to repair a tubeleak. However, since this outage was not caused by the GSA system, the run was simply extended for 40 hours to compensate for the lost test time.
s-20
The overall system SO2 removal efficiency averaged slightly more than
90 percent during the entire 28-day demonstration run. There was only one 24-hour period when the SO2 removal was below this target level and this was due to a lime slurry flovmeter calibration problem. The specific test conditions for this demonstration run were selected based on the results
from the factorial testing that had been completed earlier. An overall system SO2 removal efficiency setpoint of 91 percent was input to the
computer control system and the Ca/S level was adjusted by the control
system to maintain this setpoint. The most surprising result of this run
was that the average Ca/S level required to achieve the SO2 removal
setpoint (1.45 moles Ca(OH)2/mole inlet SO21 was higher than that
expected based on the previous factorial testing.
The ESP performance was relatively good throughout the 28-day demonstration
run and the emission rate remained well below the NSPS. However, there
was an abrupt step increase in the emission rate, from 0.007 to 0.015 lb/
MBtu, about halfway through the run. This step increase in the emission
rate coincided with a problem with the double-dump valve and screw conveyor that remove the solids from the ESP first field hopper. This mechanical problem was resolved without bringing the ESP off-line, but the
increased dust loading entering the second field of the ESP and the
overflow from the first field hopper led to a buildup of solids in the
second field. This solids buildup caused the average secondary current
level in the second field to plummet and to remain at very low levels for
the remainder of the run. This dramatic decline in the average secondary
current in the second field also coincided with the step increase in the
emission rate from the ESP. As previously noted, however, the emission rate only increased to about one-half of the NSPS for particulates.
The GSA system operated reliably during the entire 28-day demonstration run, even though the test conditions included an lE°F approach-to-
saturation temperature and the higher coal chloride level. There were no
plugging or solids handling problems due to damp solids. In fact, the
moisture level in the by-product solids remained at about 0.5 percent.
The reactor and ESP were inspected at the end of this demonstration run.
The reactor had some deposits on the walls, but most of the deposits were
s-21

of no significance. There were some heavier-than-normal deposits on the
wall above the nozzle elevation, however. No suitable explanation for
these deposits was determined, although the suspicion was that the nozzle
may need to be changed out more frequently. There were also solid
deposits in the ESP. Those ESP deposits of most concern were on the
hopper ridges between the first and second field hoppers and betveen the
second and third field hoppers. Because of the high angle of repose for
the GSA material at these test conditions Andy the unusual, site-specific
design of the ESP hoppers in the first and second fields at the CER, these
deposits ate thought to have caused the low average secondary current
levels in the first and second fields of the ESP during the final two
weeks of the GSA demonstration run.
14-Dav PJBH Demonstration Run
A long-term, 14-day PJBH demonstration run was successfully completed in
March 1994. This run was originally planned to coincide with the last two weeks of the 28-day GSA demonstration run in November, but a problem with
the PJBH prevented its operation. The purpose of this 14-day run was to
demonstrate that the GSA system (reactor/cyclone/P.JBH), as installed at
the CER, could operate reliably and continuously, 24 hour/day, seven days/
week for a two-week period, vhile simultaneously achieving 90+ percent
SO2 removal and maintaining the PJBH outlet emissions below the NSPS for
particulates. There was one interruption during this demonstration run when the boiler was unable to fire the design coal and was witched to the
low-sulfur compliance coal. The PJBH demonstration run was suspended
until the higher sulfur coal was again available. However, since this
outage was not caused by the GSA system or the PJBH, the demonstration run
was simply extended to compensate for the lost test time.
The overall system (reactor/cyclone/PJBH) SO2 removal efficiency averaged more than 96 percent during the entire 14-day PJBH demonstration
run. The specific design test conditions for this run were the same as
those used in the previous GSA demonstration run, except that the fly ash addition rate was reduced slightly from about 1.5 to 1.0 gr/acf. An
overall system (reactor/cyclone/ESP) SO2 removal efficiency setpoint of
s-22

91 percent was input to the computer control system to be consistent with
the previous GSA demonstration run. The Ca/S level was adjusted by the
control system to maintain this SO2 removal setpoint. The average Ca/S level during this run ranged from about 1.34 to 1.43 moles Ca(OH)2/mole inlet S02, which was lower than that required in the 28-day GSA
demonstration run.
The PJBH particulate removal efficiency was very good during this run,
averaging 99.99+ percent. The emission rate was about one order of
magnitude below the NSPS for particulates at 0.001 to 0.003 lb/XBtu.
CONCLUSIONS
The completion of the 13-month GSA test program at the 10-&W scale at
TVA’s CER indicated the following:
1.
2.
3.
4.
The GSA/ESP process can achieve high SO2 removal efficiencies
(90+ percent) at modest Ca/S levels (1.30 moles Ca(OH)2/mole inlet
SO2) and a close approach-to-saturation temperature (80~) when
treating flue gas resulting from the combustion of a 2.1 percent sultuur (as-fired), low-chloride (0.02-0.04 percent) coal;
The GSA/ESP process can also achieve high SO2 removal efficiencies
(90+ percent) at a modest Ca/S level (1.30 moles Ca(OH)2/mole inlet
SO2) and a higher approach-to-saturation temperature (180~) with
slightly higher levels of chlorine in the coal (0.12 percent);
Most of the SO2 removal efficiency occurs in the reactor/cyclone with relatively low SO2 removals (2-S percentage points) in the ESP.
The enhanced mass and heat transfer characteristics of the GSA
reactor allows high SO2 removal efficiencies to be achieved at a very low flue gas residence time in the reactor/cyclone. The GSA reactor also operates at a high flue gas velocity (20-25 ft/sec). Thus, the GSA reactor is only one-third to one-fourth the size of the
conventional SD vessel;
S-23

5.
6.
7.
8.
9.
The expected enhancing effect of chlorine on the SO2 removal
efficiency in the GSAjESP process was documented over the narrow
range tested. Even modest coal chloride levels (0.12 percent), which
are typical of many coals, can provide this enhanced SO2 removal
effect;
The SO2 removal efficiencies achieved in the GSAfESP system are
essentially the same as those achieved at comparable conditions
during the previous testing of the SD/ESP system at the CER;
The GSA/ESP process has very low particulate emission rates, i.e.,
well below the NSPS for particulates, when a four-field ESP with an
SCA > 440 ft2/kacfm is used;
The SO2 removal efficiency in the GSA/PJBH system was typically
about 3-5 percentage points higher than that achieved in the GSA/ESP
system at the same test conditions; and
The GSA system produces a by-product material containing very low
moisture levels. This material contains both fly ash and unreacted
lime and thus, with the addition of water, undergoes a possolanic
reaction and can be disposed of in a landfill.
FUTURE ACTIVITIES
The planned future activities are to continue the development of the GSA
process at TVA's CER. This work is being funded by TVA. Some of these
planned activities include:
1. Continue to monitor and evaluate the performance of the ESP to ensure
that the GSA process will not have an adverse impact on this
particulate control device; '
2. Conduct tests at lower SCA by deenergising one or more fields in the
ESP to determine the resulting effect on particulate emissions;
S-24

3. Evaluate the effect of other limes on the performance of the GSA
system;
4. Evaluate the effect of higher coal chloride levels on the performance
of the GSA/ESP system; and
5. Evaluate the potential for using the by-product material from the atmospheric fluidized bed combustion unit as a source of lime to
displace some of the fresh lime feed to the system.
S-25

Section 1
INTRODUCTION
The Tennessee Valley Authority (TVA) has had an active research and development program in the flue gas desulfurization (FGD) area for many
years at the Center for Emissions Research (CER), formerly the Shawnee
Test Facility (1-z). Initially, this FGD development program focused
primarily on wet-scrubbing technologies, particularly the wet limestone
scrubbing technology in the mid-to-late 1970's. Later, TVA's efforts
evolved into the development of other, potentially more cost-effective
technologies in the dry scrubbing area. In the early-to-mid 1980's these
efforts focused on developing the spray dryer (SD) technology for medium- to high-sulfur coal applications with the installation of two small, l-MU
SD/baghouse pilot plants. The final l-MU SD test program involved the
installation of a relatively small electrostatic precipitator (ESP)
downstream of the SD for particulate control.
In the mid-1980's, TVA installed a larger lo-MW SD/ESP at the CER in
cooperation with the Electric Power Research Institute (EPRI) and Ontario
Hydro. This plant was designed and constructed with the express purpose
of testing this technology for potential application to existing coal-
fired utility boilers, which had an ESP for particulate control. (A new coal-fired boiler with a SD FGD system would typically have a baghouse for
particulate control because of the higher sulfur dioxide (SO21 removal
in the baghouse.) The results of this lo-MU SD/ESP testing have been
previously reported (2,3).
Another dry, lime-based, FGD system was tested at CER for about one year
following the completion of the lo-MU SD/ESP test program. During this
year of other testing, the detailed design for the lo-MU Gas Suspension
Absorption (GSA) demonstration plant was completed and the equipment was
procured and installed at the CER. The dry, lime-based, GSA FGD system
was started up in November 1992 for a planned one-year test program. This test program was cofunded two-thirds by TVA and one-third by the U.S.

Department of Energy (DOE) and AirPol Inc., a U.S. subsidiary of the
Danish company, FLS miljo a/S. The DOE funding for this project was
provided under the Clean Coal Technology Program. This project had been
selected by DOE in the third round of the Clean Coal Technology Program in
December 1989.
AirPol requested that TVA act a8 the host site for this project because of
TVA's background and experience with dry, lime-based, FGD systems at the
CER and the availability of the existing infrastructure at this facility.
With the existing infrastructure, AirPol only needed to install their
reactor, cyclone, recycle loop, and some ductwork to have a complete lo-MW
demonstration plant. Thus, the CER provided a very low cost facility to
test the GSA technology.
TVA’S Technology Advancements (TA) staff accepted AirPol's proposal and
agreed to participate and cofund this project for several reasons. The
most important reasons were that the GSA process: (1) is very similar to
other dry, lime-based, FGD technologies that TA had evaluated and found to
be both technically and economically attractive and (2) appears to fulfil1
the U.S. electric utility industry's need for an FGD technology that is
not a "chemical plant." For nearly two decades, electric utility
personnel have been looking for an FGD technology that did not require
chemical analyses for either routine operation or understanding the
erosion/corrosion problems in the system. The routine operation and
maintenance of the GSA system requires neither chemical analyses nor an
understanding of chemistry.
The GSA technology was developed by FLS miljo a/s in Europe for removing
acid gases from the flue gas generated by many industrial processes. It
has been installed at several municipal incinerator applications in Europe
to remove hydrogen chloride (IiCl), SO2, and hazardous air pollutants
from flue gas. The testing at the CER was the first application of this
technology in the U.S. In this application, the GSA system was treating a
lo-NW slipsteam of flue gas resulting from the combustion of a high-sulfur
(2.7 percent, as-fired basis), Western Kentucky bituminous coal. The GSA
system was expected to remove more than 90 percent of the SO2 from the
1-2

flue gas, while achieving a relatively high utilization of the reagent
lime.
Later, in collaboration with the EPRI, TVA installed a 1-MW pulsejet
baghouse (PJBH) at the CER. This PJBH was designed to treat 5,000 acfm of
flue gas, vhich could be removed from either the ESP inlet or the ESP
outlet. The flue gas treated in the PJBH was returned to the main flue
gas duct downstream of the ESP. DOE and AirPol agreed to cosponsor this
PJBH test program and it was incorporated into the GSA test program in
early 1993.
The major objectives of the GSA demonstration were to: (1) optimize the process design variables; (2) determine the lime stoichiometry required
for various SO2 removal efficiencies; (3) demonstrate 90+ percent SO2
removal efficiency in the GSA/ESP system; (4) evaluate the effect of
retrofitting the GSA process on the particulate performance of an existing
ESP; (5) evaluate the SO2 and particulate removal performance of a l-MW
PJBH treating a flue gas slipstream from the GSA system; (6) evaluate the hazardous air pollutants, or air toxics, removal capabilities of the GSA
system with the ESP and with the PJBH; (7) compare the overall system SO2
removal efficiency achieved with an ESP and vith the PJBH; (8) complete a
28-day, azound-the-clock, GSA/ESP demonstration run; (9) complete a 14-day,
around-the-clock, GSA/PJBH demonstration run; (10) compare the performance of the GSA system with that of the SD process, which had previously been
tested at the CER; and (11) evaluate equipment erosion/corrosion at various
locations in the overall system.
l-3

Section 2
CER SYSTEM DESCRIPTION
A general description of the Shawnee Fossil Plant and the CER is included
in this section. Also included in this section is a process description
for the GSA FGD system, including a general overview of the process
chemistry.
FACILITY LOCATION
The Shawnee Fossil Plant (SHF) is located on the Kentucky bank of the Ohio
River about 10 miles northvest of Paducah, Kentucky. The plant originally consisted of 10 identical, front-fired, Babcock 6 Wilcox units, each vith
a nameplate rating of 175 MW. The boilers were built in the early 1950’s. In the mid-to-late 1980’s, the Unit 10 boiler was replaced by an
atmospheric fluidized bed combustion (AFBC) boiler.
Each of the nine remaining units burns pulverized coal to produce about
1.0 million (M) lb/hr of steam at 1,800 psig and 1,OOO’F at full load.
The coal consumption rate for each unit at full load is about 60 tons/hr. Units l-8 at the SHF are fired with a low-sulfur (1.2 lb S02/MBtu),
compliance coal, while Unit 9 burns a high-sulfur (4.0-5.0 lb S02/MBtu)
coal to supply flue gas for the CER.
The CER is located adjacent to Units 9 and 10, about 250 ft north of the
main power plant. A plan view of the CER in relation to the power plant
is shown in Figure 2-l. All utilities for the CER are obtained from the
power plant. The flue gas slipstream for the CER is removed from the “A”
duct of Unit 9, downstream of the boiler mechanical collectors. (Unit 9 has two parallel flue gas ducts, the “A” side and the “B” side. ) The flue
gas temperature at this point ranges from 270-290-F depending on both the boiler load and the ambient weather conditions and is at a pressure of
about -18 in. of water because the flue gas take-off point is upstream of
both the induced draft (ID) fan and the reverse-air baghouse for Unit 9.

-
2-7
& %2 2 y ‘z de SF \ 2;: cl 7 >d 5
@------- _
2-8

during the previous SD/ESP testing, a number of the 304 stainless steel (SS)
tubes developed leaks and had to be plugged. (Most of these plugged tubes
were in the third bank.) The 304 SS tubes failed due to stress corrosion
cracking. This heat exchanger is about 16 ft long, 8 ft wide, and 6 ft. high.
From the preheatet/precooler, the S02-laden flue gas passes directly to the
inlet of the GSA reactor.
GSA Process Description
In the GSA FGD process, which is shown in Figure 2-4, the flue gas from the
preheater/precooler passes through the inlet ductwork to the GSA reactor,
where the flue gas enters the bottom of the reactor and flows upward through
a venturi-type section into the cylindrical body of the reactor. The purpose
of the venturi section is to boost the flue gas velocity at the bottom of the
reactor. The increased velocity is required to suspend the bed of circulating
solids. Some large particles do fall down through this venturi section and
into the bottom of the inlet elbow. There is small clean-out valve installed
in the inlet elbow, below the venturi section, to allow the removal of any
oversized solids that are sufficiently large to fall out of the reactor.
Above the venturi section, the reactor is a simple cylindrical vessel with no
internal parts. The inlet duct and reactor are constructed from carbon steel.
A freshly-slaked lime slurry is injected into the reactor through a single,
two-fluid nozzle, which is installed in the venturi section of the reactor.
The resulting atomized slurry from the two-fluid nozzle also flows upward,
co-currently with the flue gas in the reactor. The quantity of lime slurry
fed to the nozzle is controlled based on the SO2 content of the inlet flue
gas and the SO2 removal efficiency that is required. Trim water is added
to the lime slurry to cool the flue gas to the design approach-to-adiabatic-
saturation temperature (hereafter referred to as the approach-to-saturation
temperature).
Dry recycle solids are reinjected into the reactor via a simple chute from
the recycle feeder box. The recycle screws remove the dry solids from the
recycle feeder box and these solids fall by gravity, entering the reactor
just above the venturi section. Upon entering the reactor, these solids ate
reentrained by the flue gas flowing up through the reactor and form a
2-9

2-10

circulating bed of small particles. The fresh lime slurry, which is atomised
into this circulating bed of solids, coats the surface of these solids with a
thin layer of lime slurry.
This thin layer of freshly-slaked lime slurry coating the recycle solids
provides a large surface area in the reactor for the absorption of the acid
gases, i.e., SO2, sulfur trioxide ($03). carbon dioxide (CO2), and HCl
from the flue gas. Once absorbed into tht thin slurry layer, these acid
gases then react with the slaked lime (Ca(OH)2) to generate a mixture of
reaction products; i.e., calcium sulfite, sulfate, carbonate, and chloride.
Thus, the primary overall reactions occurring in the GSA reactor are:
Ca(OH)2 (aq) + SO2 (g) 4 CaS03*1/2 H20 (6) + l/Z H20 (g)
C=(OS)2 (=q) + SO3 (9) + H20 (aq) 4 CaSOq*ZH20 (s)
C=(OH)2 (=q) + CO2 (9) 4 CaC03 (8) + H20 (9)
Ca(OH)2 (aq) + 2HCl (9) + 4H20 (eq) + CaC12=6HZO (6)
These reactions are thought to take place primarily in the thin layer of
fresh lime slurry coating the dry recycle solids. (The reaction products are
shown in the fully hydrated form, even though a mixture of hydration levels
would be expected.)
Simultaneously, the sensible heat in the hot flue gas evaporates most of the
water from this thin layer of lime slurry coating the particles. The
evaporation of the water cools and humidifies the flue gas. Essentially all
of the moisture in the lime slurry is evaporated, leaving only soms residual
surface moisture. The resulting "dry" solids are entrained in the flus gas
along with the fly ash from the boiler and pass up through the reactor. The
dry solids exit from the top of the reactor along with the flue gas and enter
a cyclone-type mechanical collector. The cyclone, which is constructed of
carbon steel, removes most of the particles from the flue gas (90+ percent).
The solids removed in the cyclone fall by gravity through a chute connecting
the base of the cyclone with the recycle feeder box. This recycle feeder box
2-11

provides in-process storage and was originally designed to have a solids
residence time of about three minutes. Recycle screws are installed in the
bottom of the recycle feeder box to pull the solids into the chute that feeds
the solids back into the reactor. Nearly all of these solids that are
collected in the cyclone are recycled to the reactor to provide the
circulating bed of solids. Some of the solids from the top of the recycle
feeder box ate removed by an overflow screw and are fed to the by-product
disposal system.
The flue gas from the cyclone passes to the ESP inlet. The existing ESP is
an ABB-Flakt design that is typical of the newer ESPs in the utility industry
in general and within TVA in particular. The ESP has four fields containing
13,528 ft2 of collecting plate area arranged such that the ESP has eight
parallel gas passages. These collector plates are fabricated from Corten and
the plate spacing is 10 in. At the design ESP inlet flue gas flow rate of
30,300 acfm at 145-F, this plate area corresponds to a specific collection
area (SCA) of 446 ft2/kacfm and a face velocity of 3.3 ft/sec. For fly-
ash-only testing, the higher flue gas flow rate (because of the higher flue
gas temperature) decreases the SCA to about 360 ft2/kacfm and increases the
face velocity to about 3.8 ft/sec. The aspect ratio for this ESP is 1.60.
The ESP housing, which is constructed of carbon steel (ASTM A588, grade A),
contains room for a fifth field; however, this fifth field is currently empty
with no plates, wires, hopper, or associated equipment installed.
The charging electrodes are spiral SS wires mounted in a rigid frame. Both
the discharge electrodes and the plates are rapped by tumbling hammers
installed on rotating shafts. A microprocessor-based system controls the
voltage to the transformer/rectifier (T/R) sets and also the rapping sequence
and frequency. All four T/B sets (one for each field) are identical and are
rated at 50 kilovolts (kV) and 200 milliamps (mAI.
From the ESP, the flue gas passes to a reheater, the ID fan, and the CER
stack. The reheater is also a shell-and-tube heat exchanger with about
560 ft2 of tube area. The tubes are fabricated from 316 SS while the rest
of the heat exchanger is constructed from carbon steel. The reheater is
approximately 8 ft long by 6 ft wide and uses steam from the boiler to boost
the flue gas temperature to ZOO’F. (A reheat system may or may not be needed
2-12

in a commercial GSA application, but is required at the CER to provide plume
buoyancy at this congested site.)
The ID fan is rated at 44,600 acfm and has a 400-hp motor. It is constructed
of 316L SS and is installed downstream of the reheater to protect it from
corrosion damage. The flue gas flow rate is controlled using a louver-type
damper installed upstream of the ID fan. The flue gas from the ID fan is
discharged into the base of the 150 ft CER stack.
The lime slurry is prepared from a high-calcium pebble lime in a paste-type
slaker (i.e., the grit is removed from the slurry). Two different high-
calcium limes were used during the testing, one from Mississippi Lime Company
and one from Tenn Luttrell Company. The lime slurry is pumped first to a
storage tank and then to a lime feed tank from which it is metered to the
two-fluid nozzle in the bottom of the cylindrical section of the reactor.
During the factorial testing of the GSA system, the lime slurry flow rate was
controlled by the continuous measurement of the flue gas SO2 concentration
upstream of the reactor. (The lime slurry flow rate could also be controlled
to maintain a specific SO2 level in the flue gas downstream of the ESP.)
Also, trim water is mixed with lime slurry to lower the flue gas temperature
at the cyclone outlet to the required operating temperature, which is
typically 145-155OF. These temperatures correspond to an approach-to-
saturation temperature in the reactor of 18-280F.
PJBH Pilot Plant
The l-MU PJBH pilot plant, which was installed adjacent to the ESP at the CER
(see Figure 2-21, treated a 5,000 acfm slipstream of flue gas from the main
GSA/ESP plant. The flue gas slipstream for the PJBH could be removed from
either the ESP inlet (the “in-parallel” mode) or the ESP outlet (the “in-
series” mode) through an 18 in. dia., insulated duct. The flue gas entered
the bottom of the PJBH, passed through the bags, and was discharged from the
top of the PJBH back to the GSA/ESP ductwork downstream of the ESP.
The PJBH had 48 bags arranged in three concentric rings. The acrylic bags
installed for the GSA factorial testing were fabricated from Draylon T, which
2-13

was a relatively low-cost material suitable for this low temperature
application. The bogs were oval-shaped in cross-section, 20 ft. in length
and 15-l/2 in. in circumference, and were supported by standard 14-wire
carbon steel cages. The cages were coated to prevent rusting due to the
expected low-temperature operation.
With the full complement of bags and the PJBW pulling flue gas from the ESP
inlet with the full particulate loading, the air-to-cloth ratio (A/C) was
approximately 4.0 acfmlft2. During the "in-series" testing with the PJBH
pulling flue gas from the ESP outlet with the resulting very low particulate
loading, only one-third of the bags were installed and the PJBH operated at
an A/C Of 12.0 aCfm/ft2.
The solids, which were collected on the outside of the bags in the PJBH, were
periodically dislodged by a high-volume, low-pressure flow of ambient air
distributed by a rotating manifold. This rotating manifold was equipped with
three nozzles that were aligned with each ring of bags and was located above
the bags in the "clean" outlet gas plenum. The manifold continuously rotated
at 1 rpn. The pulses of cleaning air were supplied through the manifold from
a reservoir that was pressurised to about 9 psi by a dedicated positive
displacement blower. The low-pressure air was discharged from the reservoir
into the manifold through a diaphragm valve and then subsequently injected
through the nozzles into the bags to dislodge the filtercake. These solids
fell into the PJBH hopper and were removed through a rotary valve at the base
of the hopper. From the rotary valve, the solids dropped into a pneumatic
conveying system, which moved the solids to the by-product disposal area in
the GSA/ESP process.
The cleaning of the bags in the PJBH was pressure-drop-initiated during this
GSA testing with the cleaning cycle begun whenever the tubesheet pressure
drop reached 6 in. of water. The bag cleaning cycle continued until the
tubesheet pressure drop had decreased to 4-112 in. of water.
As previously discussed, the PJBH pilot plant was installed at the same time
as the GSA equipment. HOWeVe+, the PJBH pilot plant was not started up until
late December 1992. The objective of the l-M? PJBH project at CER was to
evaluate the performance of this type of fabric filter with the GSA/ESP
2-14

system. The test program involved the evaluation of the PJBH performance in
two configurations: (1) as a stand-alone particulate control device, which
could be compared with the performance of an ESP and (2) as a retrofit device
installed in series with an ESP as the final stage in the particulate control
system. The latter arrangement was sowewhat analogous to the EPRI-patented
technology called the Compact Hybrid Particulate Collector (COHPAC).
LIME COMPOSITION
Most of the testing was completed using a high-calcium pebble lime supplied
by Mississippi Lime Company. A typical composition for this lime is shown in
Table 2-3. The bulk density for this pebble lime averaged about 57 lb/ft3
and the surface area ranged from 0.5 to 3.0 m2/g.
2-15

Table 2-3
TYPICAL LIME COMPOSITION
Comoonent
cao WJ Cac.03
Acid insolubles
93.2
1.0
1.0
4.8
2-16

Section 3
GSA TEST PROGRAU
The overall test program for the GSA process consisted of five major phases:
(1) the preliminary or startup tests, (2) the factorial tests, (3) the air
toxics tests, (4) the 28-day GSA demonstration run and (5) the 14-day PJBH
demonstration run. The GSA system was started up in Novsmber 1992 and the
final task was completed in March 1994. A timeline for the GSA test program
is shown in Figure 3-1. (The blank areas in this test program were reserved
for tests that were not part of the GSA test program and are not discussed
in this report.)
The purpose of the preliminary tests, which were completed in November and
December 1992, was to investigate the limits of the lo-MW GSA system as
installed at the CER. During these tests, the major process variables were
evaluated at the extremes of the ranges planned for the later factorial
test program. Some of these initial variable levels were based on TVA's
previous experience with other dry, lime-based, FGD systems. These
preliminary or startup tests were the subject of a separate report that was
prepared by AirPol (2) and will not be discussed further. Similarly, the
air toxics tests, which were completed in 8eptember and October 1993, were
also the subject of a separate report (5) that was prepared by the air
toxic6 contractor, Energy and Environmental Research Corporation, and also
will not be discussed in this report.
The three remaining test phases: the factorial testing, the 28-day GSA
demonstration run, and the 14-day PJBH demonstration run are discussed in
more detail in the following sections.
FACTORIAL TESTS
The GSA factorial testing was completed during the period from January to
early August 1993, as shown in Figure 3-1. The purpose of this
statistically-designed factorial test program was to determine the effect


of the major process variables on the SO2 removal efficiency in the
reactor/cyclone, the ESP, the PJBH, and the overall system. In these
factorial tests, the major process design variables were the independent
variables and the SO2 removal efficiency, lime utilisation, and ESP
performance were all dependent variables.
Given the large number of major process design variables and the limited
amount of test time available, only two levels for most of the variables
were included in the original test plan design. These two variable levels
were selected to covet the range of primary interest for a utility FGD
application. To further reduce the length of the factorial test plan, but
still retain the quality control on the test results, a half-factorial
design with a full set of replicate tests was used for the GSA testing.
With the inclusion of the PJBH testing into the overall GSA test program,
this half-factorial design with a full set of replicate tests provided an
additional advantage. The PJBH could be tested at each test condition in
each of the two operating modes, i.e., in-series and in-parallel with the
ESP. The basic factorial tests were completed vith the PJBH operating in
the “in-parallel” mode, i.e., pulling flue gas from the ESP inlet. This
operating mode allowed a comparison of the ESP and the PJBH performance at
the same test condition on the same day. The replicate factorial tests
were completed with the PJBH operating in the “in-series” mode, i.e.,
pulling flue gas from the ESP outlet. This arrangement allowed the PJBH
performance to be determined at each test condition as a final-stage,
particulate control device. Since the reactor/cyclone would be operating
at the same conditions for both the basic and the replicate tests and
essentially all of the SO2 removal was occurring in the reactor/cyclone
portion of the GSA system, this test plan design allowed the quality
control on the SO2 removal data, i.e., two separate tests completed at
each condition, and yet also provided the opportunity for both PJBH
operating scenarios to be evaluated at each of the test conditions.
A total of 63 tests were completed during the factorial test program.
These tests, each of which was designed to be run for 48 hours, were run
during the period from January to August 1993.
3-3

Maior Variables and Levels
Based on TVA’s previous experience with other dry, lime-based, FGD systems
and the results from the preliminary GSA testing, the major process design
variables in the GSA FGD system were determined to be: (1) inlet flue gas
temperature, (2) approach-to-saturation temperature, (3) calcium-to-sulfur
ratio (Ca/S), (4) inlet fly ash loading, (5) coal chloride level, (6) flue
gas flow rate, and (7) recycle screw speed. However, only one level for
the inlet flue gas temperature variable (32OOF) was used in the factorial
testing because of the limited test time available. Also, the results from
the previous vork with other dry, lime-based FGD system had indicated that
this variable, although important, was not as important as some of the
other major process variables.
Two levels were selected for all but one of the other major process
variables. This exception was the approach-to-saturation temperature where
three levels were defined, but the lowest approach-to-saturation temperature
level (8OF) was only evaluated for those tests at the lover coal chloride
level because of concerns about the operability of the system at the
combined high chloride/close approach condition, based on the results from
the preliminary testing.
The major process variables and the selected levels for each variable are
shown in Table 3-1. The reasons for selecting each of these variables and
levels for the GSA test program are discussed in more detail below.
Auoroach-to-Saturation TemDerature - This variable has two major effects in
these dry, lime-based, FGD processes. First, the approach-to-saturation
temperature level determines the magnitude of the driving force for the
evaporation of water from the lime slurry that is injected into the flue
gas in the reactor. The presence of liquid water on the solids is required
for SO2 removal to occur at a rapid rate. At a high approach-to-
saturation temperature, there is a large driving force for the evaporation
of water in the reactor, particularly tovard evaporating the last vestiges
of moisture in the circulating solids. Consequently, the thin layer of
lime slurry dries very quickly and the entrained solids have low residual
3-4

Table 3-l
MAJOR VARIABLES AND LEVELS FOR THE GSA FACTORIAL TESTING
Yariablp m
Approach-to-saturation temperature, OF
Ca/S, moles Ca(OH)2/mole inlet SO2
Fly ash loading, gr/acf
Coal chloride level, 7.
Flue gas flow rate, kscfm
Recycle screw speed, rpm
8, 18, 2aa
1.00 and 1.30
0.50 and 2.0
0.02 and 0.12
14 and 20
30 and 45
a. S°F condition only run at the low coal chloride level.
3-5

moisture levels. Since the SO3 removal in these dry, lime-based FGD
systems requires the presence of liquid water to absorb the 802 as the
first step in the overall removal of the SO2 from the flue gas, too high
an evaporation rate results in a low SOP removal efficiency in the
system. Conversely, a close approach-to-saturation temperature in the
reactor leads to a slower evaporation rate for the water and a higher
overall system SO2 removal efficiency. This effect of the approach-to-
saturation temperature variable on the SO3 removal efficiency in the GSA
system is very important and is also one reason that three levels of this
variable were selected for the GSA test program.
Second, in combination with the inlet flue gasp temperature, this variable
determines how much water can be injected into and evaporated by the flue
gas. At the closer approach-to-saturation temperatures, more water has to
be added to the flue gas to reach the desired reactor outlet temperature.
The higher water injection rate at the closer approach-to-saturation
temperatures is thought to spread the fresh lime slurry over more of the
dry recycle particles, which in theory would increase the total wetted
surface area available for the absorption, reaction, and removal"of the
acid gases in the reactor. HOWeVer, this effect on the overall system
SO3 removal is expected to be of less importance than the previously
discussed effect of this variable on the evaporation rate of the water from
the lime slurry.
Although it is desirable to operate at a very close approach-to-saturation
temperature to maximise the overall system SO2 removal efficiency, this
must be balanced by the need to maintain the operability of the system. At
very close approach-to-saturation temperatures, the potential for wet
operation in the reactor increases, such that the system is on the edge of
operability and even minor problems could push the system over the brink
and into an upset condition. Therefore, these dry, lime-based, FGD systems
are typically operated sufficiently above the minimum approach-to-saturation
temperature to provide a built-in safety margin to minimise the possibility
of a minor problem sending the system into an upset mode and shutting the
system down. For example, during the previous SD/ESP testing, the boiler
soot-blowing was found to be one of these minor problems that could upset
the system when it was operating at a very low approach-to-saturation
temperatures.
3-6

The design operating level for the approach-to-saturation temperature in
these dry, lime-based FGD systems is expected to be 18-F for a high-sulfur
(4.0-5.0 lb S02/MBtu) coal application. This coal sulfur level requires
a high SO2 removal efficiency (90+ percent), which will necessitate a low
approach-to-saturation temperature in the reactor. This 18OF approach-to-
saturation temperature level maximises the overall system SO2 removal
efficiency while maintaining some margin of safety. For a low-sulfur coal
application where more modest SO2 removal efficiencies (70 percent) are
typically required, the “normal” approach-to-saturation temperature may be
somevhat higher at 25-35OF to provide an additional margin of safety.
Therefore, the second level for this variable, 28-F, was also included in
the test plan to gather GSA performance data at this more conservative
condition. The third level for this variable, 8OF, was included after
the completion of the preliminary testing, which indicated that this level
was technically feasible at the low coal chloride level. However, this low
approach-to-saturation temperature condition was only run for the
low-chloride tests. Given the current state-of-the-art in dry scrubbing
technology and the utility concerns about upset conditions, the primary
objective of the test program was to demonstrate that the GSA FGD system
could operate reliably at an approach-to-saturation temperature of 18-F.
The approach-to-saturation temperature level in the reactor also has an
effect on the ESP performance since this variable (in combination with the
flue gas vet-bulb temperature) determines the flue gas temperature at the
ESP inlet. The flue gas temperature is an important determinant of the
resistivity of the solids entering the ESP, which in turn has an effect on
the particulate control performance of the system. (The chemical
composition of the solids, which is discussed below, is another important
determinant of the resistivity of the particulates.) Based on the past
work at the CER with other dry, lime-based, FGD systems, the resistivity of
the FGD solids can vary significantly with even seemingly minor changes in
the flue gas temperature at the ESP inlet.
Ca/S Level - The fresh lime stoichiometry or Ca/S level is probably the
most important determinant of the overall system SO2 removal efficiency
in these dry, lime-based FGD systems. The Ca/S level is defined as the
3-7

moles of fresh lime injected per mole of SO2 entering the system. With
all of the other variables held constant, a higher Ca/S level in the system
will achieve a higher overall system SO2 removal efficiency. HOWeVer )
since the consumption of fresh lime is one of the major operating costs in
these dry, lime-based, FGD systems, the Ca/S level must be held as low as
possible to minimise the resulting process operating costs.
Since there are no “real” technical constraints on the Ca/S level at normal
boiler operating conditions and this variable is thought to be a major
determinant of SO2, removal in the system, a wide range of this variable
could have been tested to determine its effect on the overall system SO2
removal efficiency. However, given the limited test fime available, only
two levels of the Ca/S variable could be tested. Since the results from
previous economic evaluations had indicated that Ca/S levels substantially
above 1.30 moles Ca(OH)2/mole inlet SO2 may result in high operating
costs for a high-sulfur coal application, the decision was made to evaluate
this variable at the levels of 1.00 and 1.30 moles Ca(OH)2/mole inlet
SO2 during this initial factorial testing. The other major reason for
selecting these two levels for the Ca/S variable was that these two Ca/S
levels had been evaluated in the previous SD/ESP testing at the CER. By
selecting two of the same levels for this variable in the GSA test program,
direct cp-parisons between the performance of the GSA process and the
SD/ESP technology would be possible, which was one of the major goals of
the GSA test program.
The Ca/S level also has an effect on the performance of the ESP since this
variable helps to determine the chemical composition of the solids entering
the ESP. The chemical composition of the solids is a major determinant of
the,resisitivity of these solids. The resistivity of the solids, if
outside the narrow “ideal” range, can cause increased ESP emissions.
Flv Ash Level - The fly ash level in the inlet flue gas was varied at two
levels: 0.5 gr/acf, which is the normal level in the flue gas received at
the CER, and 2.0 gr/acf, which is more typical of the level for a
pulverized-coal-fired boiler. The boilers at the SHF, which were built in
the 1950’s, had multiclone-type collectors installed to reduce the fly ash
loading in the flue gas. These multiclones reduce the fly ash loading from
the more typical level of 2.0 gt/acf to only 0.5 gr/acf at the CER.
3-a

The capability to reinject the fly ash collected in the multiclones back
into the flue gas entering the CER was installed before the GSA testing
began. The decision was made to use this capability in the GSA testing to
determine if the inlet fly ash loading had an effect on the system
performance.
The fly ash level in the inlet flue gas was not expected to have a
significant effect on the SO2 removal performance in the GSA system since
the fly ash contains very little or no alkalinity. Any effect of this
variable on the GSA performance was expected to be due to the displacement
effect of the fly ash, i.e., the higher levels of fly ash collected in the
GSA system would reduce the amount of FGD by-product material that could be
recycled to the reactor and potentially be reused.
Coal Chloride Level - The coal chloride level was also expected to be an
important variable in the GSA FGD system based on the previous testing of
other dry, lime-based, FGD systems at the CER. The coal chloride level
determines the amount of HCl in the flue gas, which is almost completely
removed in these dry, lime-based, FGD systems. The absorbed HCl reacts
with the Ca(OH)Z to form calcium chloride. The level of calcium chloride
in the GSA system is important because of its effect on the water
evaporation rate in the reactor and on the moisture level in the “dry”
solids.
The calcium chloride, which is an ionic salt when dissolved in the lime
slurry, depresses the vapor pressure of the water and thereby slows the
evaporation rate of the water in the reactor. Thus, the slurry solids
retpain wetter longer, retaining a surface layer of liquid water, vhich is
necessary for the absorption of the acid gases. This increases the reaction
time available in the system and boosts the SO2 removal efficiency. In
addition, calcium chloride is a hygroscopic material, i.e., it has the
ability to adsorb moisture from the humid flue gas, thereby maintaining a
layer of residual surface moisture on the solids. This residual surface
moisture may allow additional SO2 removal even though the solids are
“dry” .
3-9

However, this ability to both slow the water evaporation rate and retain
higher residual moisture levels on the surface of the solids also offers
the increased potential for plugging and other operational problems in the
system. Thus, the higher chloride levels offer a double-edged sword, the
potential for higher SO2 removal efficiencies, but also an increased
potential for plugging. The increased moisture level with the higher
chloride levels in the system were one reason that in this first round of
factorial testing, the lowest approach-to-saturation temperature (S°F)
was not attempted at the higher coal chloride level.
Based on previous work at the CER, the chloride in the GSA system can come
from either the HCl in the flue gas or through the injection of a calcium
chloride solution. The coal chloride levels selected for evaluation in the
original GSA test plan were 0.02 and 0.12 percent since the first high-
sulfur coal burned during the test program contained a very low chloride
level (0.02 percent). Thus, this low level became the baseline coal
chloride level. With the later coal switch very early in the factorial
test program, the baseline coal chloride level increased slightly to 0.04
percent, but the higher level of 0.12 percent was retained. The higher
coal chloride level (0.12 percent) was achieved by spiking the trim water
that was added to the lime slurry with a 32 percent calcium chloride
solution to simulate the combustion of a higher chloride coal.
There were two reasons that the 0.12 percent coal chloride level was chosen
as the second level for this variable. First, the statistical analysis of
the data is easier when equal increments between the variable levels are
selected and the future plans included tests at the 0.20-0.22 percent coal
chloride level to cover the range of interest for this variable. Al though
some Illinois-basin coals contain higher chloride levels, the trend in the
utility industry is to burn coals with lower chloride levels because of the
concerns about increased boiler corrosion with the higher chloride coals.
In some cases, the maximum chloride level allowed in the coal is specified
as less than 0.3 percent and the trend in the utility industry appears to
be for further reductions of this level in the future. Second, this higher
coal chloride level (0.12 percent) was selected in an attempt to match, as
closely as possible, one of the coal chloride levels that had been used in
the previous SD/ESP FGD testing at the CER. The coal chloride levels in
3-10

the SD testing had been 0.10, 0.20, and 0.30 percent. This would facilitate
the comparison of the results achieved at the CER between these two FGD
systems.
During the previous SD/ESP testing, it was also found that increasing the
coal chloride level from 0.02 to 0.10 percent provided a significant boost
in the overall system SO2 removal efficiency, as much as 10 percentage
points for some test conditions. Further increasing the coal chloride
level from 0.10 to 0.20 percent resulted in a more modest increase in the
overall system SO2 removal efficiency of about 5 percentage points, again
depending on the other test conditions. Further increases in the coal
chloride level above 0.20 percent did not seem to provide any further
meaningful increase in overall system SO2 removal efficiency in the SD/ESP
system.
The coal chloride level can also have an effect on the ESP performance in
these dry, lime-based, FGD systems. There were two effects noted in the
previous SD/ESP testing. First, the presence of higher chloride levels
will slightly change the chemical composition of the solids entering the
ESP, which may change the resistivity of the solids. For example, the
presence of chlorides will increase the SO2 removal efficiency in the
system, which will increase the sulfite levels and decrease the unreacted
lime in the solids entering the ESP. This reduction in the unreacted lime
should increase the resistivity in the solids. Second, the presence of the
hygroscopic calcium chloride may lead to more sticky particles because of
the resulting surface moisture. This increase in the cohesivity may reduce
reentrainment losses and lower ESP emissions. It may also lead to solids
deposits in the ESP.
Flue Gas Flow Rate - The decision was made to look at two levels of the
flue gas flow rate: the design value of 20,000 scfm at the system inlet
and a lower level of 14,000 scfm. The Purpose of evaluating these two
levels was to simulate both the full-load condition with the design value
and also the reduced load condition with the 14,000 scfm flue gas flow
rate. The original intention was to simulate a 50-60 percent load
3-11

condition for the lower flue gas flow rate, but the minimum setting on the
louver damper upstream of the CER ID fan prevented operation at this lower
flue gas flow rate and the 14,000 scfm value was selected as the minimum
level.
The ultimate effect of changing the flue gas flow rate would be to vary the
flue gas residence time in the reactor/cyclone. At the design flue gas
flow rate, the flue gas residence time in the reactor/cyclone is only about
4 sec. At the reduced flue gas flow rate condition, this flue gas
residence time is increased to about 5.5 sec. The change in the flue gas
flow rate would also affect both the SCA and the face velocity in the ESP.
At the lower flue gas flow rate, the SCA is higher and the face velocity is
lower, both of which should enhance the ESP performance.
Recvcle Screw Soeed - The recycle screw speed was used as an indirect
measure of the recycle rate in the GSA system. The higher recycle screw
speed (45 rpm) provided a 50 percent increase in the recycle rate over that
achieved at the lower recycle screw speed (30 rpm). The higher recycle
rate, in theory, should provide more solids in the reactor. These higher
solids levels would provide more surface area for mass and heat transfer
between the injected slurry coating these recycle solids and the flue gas.
However, the higher solids level in the reactor will also increase the
pressure drop in the system and the optimum recycle screw speed will be
determined by this tradeoff between the increased SO2 removal efficiency
and the pressure drop losses.
Originally, when the GSA system was installed, the design maximum recycle
screw speed was about 22 rpm. However, during the preliminary testing it
was found that increasing the recycle screw speed up to the maximum level
of 22 rpm increased the SO2 removal efficiency in the system. Therefore,
the decision was made to modify the recycle screw motor to allow the recycle
screw speed to be increased to a maximum rate of 45 rpm and the tvo values
of 30 and 45 rpm were selected for the test program. (This change reduced
the solids residence time in the recycle feeder box, which had important
implications on the operability of the system at some test conditions, as
discussed later in Section 5.)
3-12
@her Variables
There were several other, unintended variables that were introduced into
the GSA test program. The first was the coal supply, and the second was
the high-calcium, pebble lime.
m - The bituminous coal being burned in the boiler became an unintended
variable in this GSA test program when the existing contract for the coal
supply expired and a new, low-bid supplier was selected. The same coal
specification was used during the procurement to try to minimize the impact
of the coal switch, but subtle changes in the coal composition (e.g. sulfur,
chloride, or ash) may have an effect on the GSA system performance.
Unfortunately, there were two of these coal supply changes incurred during
the factorial test program. Thus, three different coals were burned,
although only a very few tests were completed with two of these coals and
their impact on the results should be very minor, if detectable.
The preliminary tests and the first two months of the factorial testing,
encompassing only about 15 of the basic factorial tests, were completed
with the Peabody Martwick coal. The remainder of the basic factorial tests
and most of the replicate factorial tests were completed with the Emerald
Energy Pleasant Valley coal. There were approximately 12 of the replicate
factorial tests completed while the boiler burned a Warrior coal, however.
Lime - The lime supply contract expired early in the factorial test program
and a new supplier was selected during the competitive bid process. Thus,
the high-calcium lime became the second unintended variable in the GSA test
program. However, after several months of testing with this apparently
similar high-calcium, pebble lime and the completion of most of the basic
factorial tests, problems were noted with this lime and the contract was
returned to the original lime supplier. This lime supply was continued
throughout the replicate factorial testing (and the two demonstration runs).
28-DAY GSA DEMONSTRATION RIJN
As part of the Clean Coal Technology Program, one of the requirements was
to complete a long-term demonstration run with the GSA/ESP system. Through
3-13

negotiations between AirPol and DOE, the long-term GSA/ESP demonstration
run for this project was specified to be 28 days of around-the-clock,
continous operation. This demonstration run was to be completed at the end
of the factorial testing after the “optimum” test conditions had been
determined. Thus, the specific test conditions were not defined until
later in the test program. These test conditions were later defined to
be: 3200F inlet flue gas temperature; 18OF approach-to-saturation
temperature; 2.0 gr/acf fly ash level; 0.12 percent coal chloride level;
20,000 scfm flue gas flow rate; 30 rpm recycle screw speed; and 91 percent
overall system (reactor/cyclone/ESP) SO2 removal efficiency. The Ca/S
level was allowed to fluctuate to achieve this overall system SO2 removal
efficiency setpoint.
The three major objectives of this 28-day GSA demonstration run were to:
(1) achieve an average overall system (reacror/cyclone/ESP) SO2 removal
efficiency of 90+ percent during the entire 28-day run, (2) maintain the
particulate emissions from the ESP below the New Source Performance
Standards (NSPS) for particulates, and (3) demonstrate the reliability and
operability of the GSA/ESP system by remaining on-line for the entire
28-day period.
14-DAY PJBH DEUQNSTBATION RUN
After the PJBH project was incorporated into the overall GSA test program,
a further objective of the GSA demonstration run was included. This
objective was to complete a 14-day PJBH demonstration run during the final
two weeks of the GSA demonstration run. However, because of problems that
were encountered during the initial attempt in November 1993, the 14-day
PJBH demonstration run had to be postponed until March 1994. This
demonstration run was completed at the same test conditions as previously
used in the 28-day GSA/ESP demonstration run.
3-14

Section 4
BESOLTS
The SO2 removal and ESP particulate control results from the 10-&W GSA
clean Coal Technology demonstration project are discussed in this
section. These discussions are organised according to the specific test
series. The four test series that will be discussed are the two factoria
test series (the basic and replicate tests), the 2S-day GSA demonstration
run, and the 14-day PJBH demonstration run.
SO2 REMOVAL PERFORMANCE
Factorial Tests
The tests from the statistically-designed factorial test plan were
performed in two parts: the'basic series of tests and the replicate series
of tests. These factorial tests were designated as either the 2-AP or
3-AP series depending on the orientation and operational status of the
l-MW PJBH, which was tested concurrently with the GSA/ESP system. The
test designation 2-AP was used to denote when either the PJBH was not
operating or was operating in series with the ESP (i.e., withdrawing a
slipstream of flue gas from downstream of the ESP). All of the replicate
series of factorial tests were designed to be completed with the PJBH
operating in series with the ESP. However, some of the basic tests were
also completed with the PJBH off-line and were designated as 2-AP series
tests. The test designation 3-AP was used when the PJBH was operated in
parallel with the ESP (i.e., withdrawing a slipstream of flue gas from
upstream of the ESP). Most of the basic factorial tests were completed
with the PJBH operating in this mode.
A total of 78 tests were performed during the factorial test phase. Not
all of these tests, however, were part of the original factorial test
plan. As an example, several tests were added during the factorial test
phase to further evaluate the performance of the PJBH. Table 4-1 lists
only these 2-AP and 3-AP series tests that were conducted at operating

TABLE 4-1
FINALIZED BASIC AND REPLICATE TESTS
Basic Test Numbers
Planned Actual
2-AP-01
2-AP-04 2-AP-05 2-AP-08 2-AP-03
2-AP-01 3-AP-62 2-AF-04 3-AP-29 3-AP-08 2-AP-03 3-AP-03 3-A&'-O2 2-AP-07 2-AP-06
2-AP-07 z-AP-06
2-AP-09
2-AP-16 2-AP-11
2-AP-10 2-AP-17
2-AP-09 3-AP-12 2-AP-16 2-AP-11 3-AP-11 2-AP-10 2-AP-17
2-AP-18 2-AP-19
2-AP-20
2-AP-21 2-AP-22
2-AP-23 2-AP-24
2-AP-25
3-AP-18 2-AF-19 3-AP-19 2-AP-57 3-AP-20 3-AP-13 3-AF'-20 3-AP-21 2-AF-22 3-AP-22 3-AP-23 2-AP-24 3-AP-24 2-AP-25
Reulicate Test Numbers
Planned
2-AF'-71
2-AP-74 2-AP-75 2-AP-78 2-AP-73
Actual
2-AF-71
2-AP-74 2-AP-75 2-AP-78 2-AP-73
2-AP-77 2-AP-76
2-AP-77 2-AP-92
2-AP-79
2-AP-72 2-AP-81
2-AP-80 2-AP-82
2-AP-79
2-AF- 72 2-AP-81
2-AP-80 2-AP-82
2-AP-88 2-AP-89
2-m-88 2-AP-97
2-AP-86 ; 2-AP-86
2-M-87 2-AP-90
2-AP-83 2-AP-84
2-AP-85
2-AP-87 2-AP-90
2-AF-83 2-AP-84
2-AF-85
4-2

conditions specified in the original factorial test plan. These tests
typically consisted of 12 to 24 hours of operation to reach steady-state
conditions, followed by 24 to 48 hours of testing from which the test
averages were developed. The data from 10 test segments will not be
reported due to problems encountered during these tests (2-AP-05, 2-AP-10,
2-AP-14 (file 2), 2-AP-15 (files 1 & 2), 2-AP-16, 2-m-93, 3-AP-15,
3-AP-60, and 3-AP-61). The problems encountered during these tests
include equipment operation which interfered with the GSA system achieving
steady-state conditions, calibration problems with process monitoring
equipment, and/or an insufficient amount of test data to develop
representative test averages for the specific operating conditions.
The SO2 removal results for the tests conducted at the baseline chloride
levels (0.02-0.04 weight percent coal chloride) are presented in Table 4-2
for the 2-AP series tests and in Table 4-3 for the 3-AP series tests.
Similarly, the SO2 removal results are presented in Tables 4-4 and 4-5
for the chloride spiking tests (0.12 weight percent coal chloride
equivalent) for the Z-AP and 3-AP series, respectively.
As shown in all of these tables, the majority of the SO2 removal occurs
in the reactor/cyclone portion of the GSA FGD system. The ESP
contribution to the total system (reactor/cyclone/ESP) SO2 removal
ranged from only 1 to I percent. This result was somewhat surprising
given our previous experience with other dry, lime-based FGD systems where
the ESP provided substantial amounts of SO2 removal.
There are at least three possible explanations for the fact that most of
the SO2 removal in the GSA FGD system occurs in the reactor/cyclone.
First, because of the enhanced heat transfer in the GSA reactor, the
solids entrained in the flue gas leaving the reactor have very low
residual moisture levels. The moisture level in these solids typically
ranged from 0.2 to 0.6 percent, depending on the major variable levels.
In no tests did the residual moisture level reach 1.0 percent. At these
low moisture levels, the SO2 removal reaction rate, which is a strong
function of the liquid water level, is very slow and thus, the SO2
removal in the ESP is very low.
4-3

, , I
2 * *
I
-
0 :: 0 0 c d
8 c d
* - r
i :: :: :: ? : :: : 7 x 4 ::
1
R : A R A A
-
[ :: ,., E
- ! s I 3 1 - 3 2 I
- 9 :
I I l I :i 2 : I
- = - - - -

I I 9 9 9 I*! c! 0 -
- -I-
- - 3 3 .
I

l

--E = aal-4 6, OS:0 E’
c$* Y’ CI;
F: v rsi s$a”:
E 1
p! s
2
9 %
-
-
- 1 - 8 9 d -
-
a

Second, because of the enhanced mass transfer in the GSA reactor, a high
SO2 removal efficiency is achieved in the reactor/cyclone and the SO2
concentration in the flue gas entering the ESP is dramatically reduced.
Since the ESP does not provide intimate contact between the particles
collected on the plates and the SO2 in the flue gas flowing past the
plates, the potential for additional SO2 removal in the ESP is reduced.
Third, the cyclone installed between the reactor and the ESP removes most
of the alkaline particulate matter from the flue gas before it can reach
the ESP and thus, the internal lime stoichiometry in the ESP is
significantly lower than that in the reactor/cyclone. Without the
presence of these alkaline solids, the SO2 removal in the ESP is reduced
to low levels.
Effect of Lime Stoichiometrv and Anroach-to-Saturation Temuerature -
The SO2 removal performance results from all of the Z-AP series tests
conducted at baseline chloride levels (0.04 weight percent coal chloride)
are presented in Figure 4-l. In the figure, the average total system
(reactor/cyclone/ESP) SO2 removal is plotted for each test as a function
of the fresh lime stoichiometry with different symbols used to denote the
three levels of approach temperature; 8, 18 and 28OF. Linear regression
curves for each approach temperature are also plotted in the figure.
As shown in Figure 4-1, the total system SO2 removal increases as the
fresh lime stoichiometry is increased from 1.0 to 1.3 moles Ca(OIi)2/mole
inlet SO2 and the approach temperature is decreased from 28 to 8OF.
The average total system SO2 removal ranged from a low of approximately
62 percent at a 1.0 stoichiometry and a 28OF approach to a high of 92
percent at a 1.3 stoichiometry and an 8'F approach temperature. Based
on the linear regression lines, the SO2 removal increases approximately
9 to 13 percentage points as the stoichiometry is increased from 1.0 to
1.3. The increase in SO2 removal as the approach temperature is reduced
from 28 to lS°F is about 6 to 10 percentage points at the same fresh
lime stoichiometry. A decrease in the approach temperature from 18 to
8OF results in a further increase in SO2 removal of about 5 to 6
percentage points at the same fresh lime stoichiometry.
4-8

8
I I I I
s s e is (96) 1e~0u-w zos wol
4-9

Figure 4-2 provides a similar plot of the data from the 3-AP series
tests. In the figure, only the tests conducted at the lower flue gas flow
rate of 14,000 scfm are plotted. Because only the 3-AP series tests at
14,000 scfm are plotted, the SO2 removal performance is higher in these
tests compared to the 2-AF' series results presented in Figure 4-l. This
higher SO2 removal performance is presumably due to the increased flue
gas residence time in the GSA reactor/cyclone at the lower flue gas flow
rate. Unlike the prior figure, the increase in SO2 removal is greater
when the approach temperature is decreased from 18 to 8OF (10 percentage
paints) compared to the increase when reducing the approach temperature
from 28 to lS°F (2 to 5 percentage points). This result would support
the theory that the increased residence time in the reactor/cyclone allows
more reaction time since the lower approach temperature corresponds to a
reduced driving force for the evaporation of water and thus, liquid water
would be present longer in the reactor/cyclone.
These figures show that the fresh lime stoichiometry and the approach
temperature in the reactor/cyclone are two of the most important variables
for determining the SO2 removal efficiency in the GSA FGD system. These
results were not unexpected based on our previous experience with the SD
FGD syste”,. Since the fresh lime stoichiometry determines the ratio of
the two reactants (Ca(OH)2 and SO2), one would anticipate that this
variable would be extremely important and have a major effect on the total
system SO2 removal efficiency. Thus, the higher SO2 removal efficiency
at the higher lime stoichiometry was expected.
The effect of the approach temperature on SO2 removal efficiency is
somewhat less straight forward. One of the keys to rapid absorption and
reaction of the SO2 in these dry scrubbing FGD systems is the presence
of liquid water to facilitate the reaction between lime and SO2. The
approach temperature defines both how much liquid water can be injected
into the flue gas and also the driving force for the evaporation of the
water. At a close approach temperature, more water is injected into the
flue gas and also the driving force for evaporating the last water is
dramatically reduced. Thus, the liquid water is present in the solids
longer and the SO2 removal efficiency is increased.
4-10

I
I :<
I :
\ \
; s & &j
% E
-73 -0
0 8 3 z i? % 52
(x4 wow3 zos wol
4-11
These results confirm that the GSA FGD is capable of achieving high SO2
removal efficiencies ( 90 percent) at the relatively modest lime
stoichiometry of 1.30 moles Ca(OH)2/mole inlet SO2 and with little or
no chloride in the system. These factorial test results confirmed that
high SO2 removals are feasible, which was one of the major objectives of
this test program. Prior to the start of the factorial testing there was
some question whether the GSA FGD system could achieve 90 percent SO2
removal at the lower lime stoichiometries included in the factorial test
plan.
Effect of Flue Gas Flow Rate - The flue gas flow rate fhrough the GSA
system was also found to be a significant variable affecting the SO2
removal performance. Figures 4-3, 4-4 and 4-5 present the results from
the 2-AP series tests conducted at baseline chloride levels. In each
figure, the average total SO2 removal is plotted for each test as a
function of fresh lime stoichiometry. The distinction is made in each
figure for tests conducted at the two flue gas flow rate levels, 14,000
and 20,000 scfm. Linear regression lines are plotted for each flue gas
flow rate. Figure 4-3 plots data for tests conducted at an E°F approach
temperature, while in Figures 4-4 and 4-5 the data for tests conducted at
an 18 and 28OF approach temperatures, respectively, are plotted.
.-
In all three figures, the SO2 removal performance in the GSA system is
lower at the higher flue gas flow rate, i.e., 20,000 scfm. The decrease
in performance ranges from approximately 2 to 8 percentage points based on
the linear regression lines. The lower SO2 removal performance at the
design flue gas flow rate (20,000 scfm) was also observed in the 2-AP
series tests conducted with calcium chloride spiking. Figures 4-6 and 4-7
provide similar plots of the average total system SO2 removal as a
function of fresh lime stoichiometry for tests conducted at an 18 and
2E°F approach temperature, respectively. Similar to the baseline
chloride tests, the SO2 removal in the GSA system decreased from
approximately 2 to 9 percentage points as the flue gas flow rate increased
from 14,000 to 20,000 8Cfrn.
This same effect was also observed in the 3-AP series tests. Figure 4-8
plots the average total system SO2 removal in the GSA system as a
4-12

a
I I I I
E .- -I %r rv)
22 LL
8 L? s i? z % b:
NJ ieA0u-w 10s iew
4-13

8 g 2 i? i3 00 In NJ ieAouw zos iw
4-14

is s3 E t2 (%I ieA0u-w 10s iwu
- 3r +rn 2 LL
-z- $6
4-15

g E2 e iii (%I wowd zos lwi
- fsG) al ii
- -z
iFi 6
4-16

if .- J
E2r &r/l
F LL
z 2 s i? $ z: 0
t-36) wouw zos iwoi
4-17

I I I I I I I I I I I I 1: I ~ I ~
~~
1: Ii I I I I
(%) ieA0u.w 10s iw
4-18

function of the fresh lime stoichiometry for the 3-AP series tests
conducted at baseline chloride levels. In the figure, the tests conducted
at an 18 and 2@F approach temperature and at flue gas flow rates of
14,000 and 20,000 scfm are plotted. Only the regression lines are plotted
for the test data at a flue gas flow rate of 14,000 scfm in order to more
readily distinguish the data points from the tests conducted at 20,000
scfm. All three tests conducted at the higher flue gas flow rate resulted
in decreased SO2 removal performance. Based on the linear regression
lines, the decrease in SO2 removal was approximately 10 percentage
points.
The increase in SO2 removal in the GSA system at the lower flue gas flow
rate is presumably due to the increased residence time in the GSA reactor/
cyclone. The flue gas residence time increases from approximately 3.9
set * at a flue gas flow rate of 20,000 scfm to 5.5 sec. at 14,000 acfm.
Although this is only a 1.6 sec. differential, it represents a 41 percent
increase in the flue gas residence time. The effect of residence time in
the GSA reactor/cyclone, especially at these low residence times, may be
more significant compared to other dry scrubbing technologies such as the
SD FGD system because the cyclone downstream of the reactor removes over
90 percent of the solids/sorbent from the flue gas stream, thus minimizing
the potential for further reaction of the sorbent with the flue gas SO2
in the downstream ductwork and particulate control device.
The design flue gas flow rate through the system represents a trade-off
between several factors. The higher flue gas flow rate condition results
in a smaller reactor vessel size, which substantially reduces the capital
cost for the system. Furthermore, if the design flue gas flow rate is
reduced too far, at low boiler load conditions the flue gas velocity in
the reactor may be too low to entrain the reinjected solids. HOWVJer,
this higher design flue gas flow rate results in a lower SO2 removal
efficiency in the system.
The lower flue gas flow rate of 14,000 scfm was specifically included in
the factorial testing to evaluate the effect of lower boiler loads on the
performance of GSA system. Based on the results of this factorial
testing, it would appear that the SO2 removal efficiency would increase
4-19

at lower boiler loads, although there are several other variables that may
have an Fmpact on the SO2 removal efficiency at reduced boiler loads.
However, because of time constraints, these other variables were not
evaluated in this test program.
Effect of Chloride Soikinq - Similar to prior dry scrubbing studies,
calcium chloride spiking to simulate a higher coal chloride level was
found to have a beneficial effect on SO2 removal in the GSA system in
this testing. Figure 4-9 presents the data from the 2-AP series tests
conducted with calcium chloride spiking to simulate scrubbing flue gas
resulting from the combustion of a 0.12 weight percent chloride coal. In
this figure, the average total system SO2 removal efficiency is plotted
as a function of fresh lime stoichiometry for tests conducted at an 18 and
2S°F approach temperature. The average total system SO2 removal ranged
from a low of approximately 65 percent at a 1.0 stoichiometry and a 2S°F
approach to a high of 94 percent at a 1.3 stoichiometry and an lB°F
approach temperature. Based on the linear regression lines, the SO2
removal increases approximately 12 percentage points as the lime
stoichiometry is increased from 1.0 to 1.3 moles Ca(OH)2/mole inlet
so2. The increase in SO2 removal as the approach temperature is
reduced from 28 to 18°F is about 10 percentage points. No chloride
spiking tests were completed below an lS°F approach temperature because
of the potential for solids build-up/plugging problems.
The baseline chloride results for the 2-AP series tests are compared with
the chloride spiking test results in Figures 4-10 and 4-11. Figure 4-10
presents the data at an lS°F approach temperature and Figure 4-11
presents the 2S°F approach test results. The distinction is made in the
figures for tests conducted at the flue gas flow rates of 14,000 and
20,000 scfm. Compared to the baseline chloride results, the higher
chloride level improves SO2 removal in the GSA system by about 4 to 10
percentage points at a stoichiometric ratio of 1.0 moles Ca(OH)2/mole
inlet SO2. At a stoichiometric ratio of 1.3 moles Ca(OH)2/mcle inlet
so2 I the increase in SO2 removal is comparable, ranging from about 4
to 9 percentage points.
4-20

8
;I ;I ~ I ~ I :I ~ I
I : I
I I I I I I I I I I I I' I 1;
I, I I
Pd ieA~~w zos iwi
4-21

8 g z E tz @A ieA0u.w zos iwi
4-22

W wouatl 10s iw
4-23

An increase in SO2 removal with calcium chloride addition was also
observed in the 3-AP series tests. Figure 4-12 presents the data for
tests conducted at an 18 and 2S°F approach temperature. Only the
regression lines are plotted for the baseline chloride test data in order
to more readily distinguish the data points from the chloride spiking
tests. The tests conducted at a 1.0 stoichiometry exhibited approximately
12 to 13 percentage point increase in total system average SO2 removal.
The one test conducted at a 1.3 stoichiometry, however, did not show any
improvement. This latter result is somewhat unexpected and a suitable
explanation for this test result is not available.
Effect of Other ODerational Variables - The other operational variables,
such as recycle screw speed and inlet fly ash loading, also had an effect
on the total system SO2 removal efficiency. The influence of these
variables, however, was much less than the effect of lime stoichiometry,
approach temperature, coal chloride level, and flue gas flow rate
(residence time).
The total system (reactor/cyclone/ESP) calculated lime utilizationa based
on the process data ranged from 50 to 84 percent during the factorial
tests. The lime utilization in the GSA system is calculated by dividing
the total system SO2 removal by the fresh lime stoichiometry. The
lowest lime utilization rates, as expected, were for tests conducted at
the higher approach temperature (26'F) and higher fresh lime
stoichiometry (1.30 moles Ca(OH)2/mole inlet SO2). Decreasing the
approach temperature and/or the fresh lime stoichiometry improved the lime
utilization in the GSA system. Calcium chloride spiking also improved the
lime utilization compared to tests conducted at the same operating
conditions at the baseline (0.02-0.04 weight percent) coal chloride levels.
The lime utilization was also determined analytically for three sample
locations; the recycle feeder box solid samples, the solids from the first
field ESP hopper, and a composite from ESP fields 2 through 4. Typically,
the measured calcium utilization for the reactor recycle solids would
4-24

I I I I
4-25

either be lower or fall in between the measured calcium utilization values
for the ESP solids. The highest calcium utilization values were typically
measured for the solids from ESP hoppers 2 through 4. This result is to
be expected due to the additional SO2 removal that occurs in the ESP.
I, Corn arisen w't
Prior to conducting the AirPol GSA demonstration, approximately five years
of research and development were conducted at the CER evaluating a 10-&W
SD/ESP system. A comparison of the SD/ESP SO2 removal results and the
AirPol GSA SO2 removal results at essentially identical test conditions
is presented in Figure 4-13. In this figure, the total system SO2
removal is plotted as a function of fresh lime stoichiometry, which is
defined in the same terms for both systems, i.e., moles Ca(OH)2/mole
inlet S02. The results plotted in this figure are for tests that were
conducted at a 320°F inlet flue gas temperature, an 18OF approach
temperature, a flue gas flow rate of approximately 20,000 scfm at the
inlet venturi, and at a baseline (0.02-0.04 percent) coal chloride level.
The SD/ESP results plotted in this figure are from tests 5-F-03, -50, -53,
-65, -68, -69, -70, and -71, which were completed near the end of the SD
test program when the boiler was burning the same Martwick coal used in
the first part of the GSA test program.
Also plotted in this figure is a regression line based on the SD/ESP
removal efficiency model developed by TVA from the expanded data base.
(This model was reported in an April 18, 1991 internal TVA memorandum
entitled, "Preliminary Results of the Remodeling of the Chloride
Evaluation Data" and reflects the model projections for a coal chloride
level of 0.04 percent.) However, since this model was developed from SD
tests with a higher coal chloride level, these model projections are
somewhat less accurate than the actual test data from the SD tests. The
individual SD test results plotted in Figure 4-13 are slightly lower than
the regression model because other data at different test conditions were
included when developing the model.
Based on the data in the figure, the GSA system SO2 removal performance
appears to be lower than the SD/ESP results at a fresh lime stoichiometry
4-26

The fluctuation in fresh lime stoichicmetry is illustrated more clearly in
Figure 4-14, which plots the average daily lime stoichiometry during the
GSA demonstration run. As shown in this figure, the average daily lime
stoichiometry ranged from 1.4 to 1.6 mole5 Ca(OIi)2/mole inlet SO2. For
the last three days of the GSA demonstration run, the lime stoichiometry
was fixed at the values of 1.40 and 1.45 moles Ca(OI3)2/mole inlet SO2,
respectively.
The GSA demonstration run test conditions were selected based on the
results from the previous factorial test program to achieve greater than
90 percent total system SO2 removal at a reasonable, 1.3 moles Ca(OH)2/
mole inlet SO2 lime stoichiometry. These SO2 performance results were
obtained in test 2-AP-06, which was conducted in March, and tests 2-AP-91
and 2-AP-92, which were conducted in June. However, during the GSA
demonstration run, fresh lime stoichiometries greater than 1.4 moles
Ca(OEI)2/mole inlet SO2 were required to achieve over 90 percent total
system SO2 ramoval.
There are several possible explanations for this discrepancy between the
previous factorial test results and this demonstration run regarding the
lime stoichiometry required to achieve greater than 90 percent SO2
removal. Pert of this discrepancy is probably due to Unit 9 firing a
higher sulfur coal during some of the GSA demonstration run test segments.
Approximately one week into the demonstration run on October 31, the
supply of Andalex coal was exhausted and the unit was switched to a higher
sulfur Warrior coal. The unit continued to burn this higher eulfur coal
until November 9. The unit also briefly burned this same higher sulfur
coal again on November 11, 18, and 22. Based on data from prior tests, an
increase in the inlet SO2 concentration resulting from the combustion of
this higher sulfur coal would cause a decrease in the SO2 removal
performance (or require a higher lime stoichiometry to achieve the same
SO2 removal performance). Thus, the higher lime stoichiometries during
these periods, i.e., 1.5-1.6 moles Ca(OH)2/mole inlet SO2, were not
completely unexpected and these high lime stoichiometries are not a major
concern. Also, som@ of the demonstration test segments were conducted
at lower solids chloride levels compared to the factorial tests. Late in
4-31

I I I I I I o! - (“! zo\ ,ouJ,&))e; qsa~~&J) xpLuo~!o~s c
4-32

the demonstration run, it was discovered that the fly ash loading in the
flue gas entering the GSA reactor may have been higher than originally
planned. The sourc?e of this excess ash may have been the higher ash
levels in the flue gas from the boiler. This higher ash level would
dilute both the chloride and the alkalinity levels in the GSA system and
therefore lead to a higher lime stoichiometry to achieve the SO2 removal
set point.
,14-Dav PJBH Demonstration Run
As mentioned in the previous discussion, the original plan was for the
1-M? PJBH pilot plant to be operated for two weeks in parallel with the
ESP during the 28-day GSA demonstration run. However, due to the failure
of the PJBH bag fabric, the PJBH was not operated during this time
period. Therefore, the original GSA demonstration run conditions were
repeated, beginning in February, with the PJBH in operation to evaluate
PJBH performance over a longer period of time at one set of operating
conditions.
The operating conditions for the 14-day PJBH demonstration run were a
total system (reactor/cyclone/ESP) SO2 removal efficiency set point of
91 percent, 18OF approach temperature, 20,000 scfm flue gas flow rate
at the inlet venturi, 320°F inlet flue gas temperature, 30 rpm recycle
screw speed, and calcium chloride spiking to simulate scrubbing flue gas
from a boiler firing a 0.12 weight percent chlorine coal. One difference
in the operating conditions for the PJBH demonstration run compared to the
prior, 28-day GSA demonstration run, was a lower fly ash injection rate.
During the 28-day GSA demonstration run, the fly ash injection rate was
set to achieve an increase of 1.5 grfacf in the inlet particulate
concentration to the GSA reactor. This injection rate in combination with
the fly ash already prosent in the flue gas was designed to achieve the
desired total particulate concentration of 2.0 gr/acf. Since the
particulate concentration from Unit 9 is higher while firing the Andalex
coal (approximately 1.0 gr/acf vs. 0.5 gr/acf with the previous coals),
the fly ash injection rate set point was reduced to 1.0 gr/acf for the
PJBH demonstration run.
4-33

All of the PJBH demonstration run test segments were conducted while Unit
9 fired the low-chloride (0.04% Cl) Andalex coal. Mississippi pebble lime
was used for all the tests and the lime slurry solids concentration set
point was 25 percent. The ESP w@s operated with all four fields in
service and the baffle was in place in the fourth field ESP hopper during
all test segments.
The PJBH demonstration run was dividod into 4 test segments to keep the
data files manageable. The length of these test segments varied from 4 to
5 days. One segment of the demonstration run was completed in February
and three test segments were completed during the month of March. A
summary of the average operating conditions and SO2 removal performance
is presented in Table 4-7 for all of the PJBH demonstration run test
segments.
A plot of the average daily fresh lime stoichiometry during the PJBH
demonstration run is presented in Figure 4-15. As shown in the figure,
there were two periods when the average lime stoichiometry was
significantly higher than the overall demonstration run average of 1.40
moles Ca(OH)2/mole inlet S02. The first period was from February 28
through March 1. The high lime stoichiometry during this period was due
to a lime slurry flow meter calibration problem. Based on a flow meter
calibration on March 1, the lime slurry flow meter was indicating 4
percent higher than the actual lime slurry flow rate. Therefore, the
reported lime stoichiometry was 4 percent higher than.the actual lime
stoichiometry for some period prior to the March 1 calibration. Based on
the data, the reported lime stoichiometry for February 28 may have also
been influenced by the lime slurry flow meter calibration.
The second period in which the fresh lime stoichiometry was significantly
higher than the overall test average was after the pilot plant outage from
March 8 to March 10. When the PJBH demonstration run resumed on March 12,
the fresh lime stoichiometry was very high, averaging over 1.7 moles
Ca(OH)2/mole inlet S02. The high lime stoichiometry required to
achieve the 91 percent SO2 removal set paint is probably due to the low
chloride concentration in the recycle and ESP solids during the first part
4-34

4-35

(‘J! ZOS WJ/Z(HOkl q-J4 SWJ) ~WJJWW’lS
4-36

of this test segment. Several of the recycle and ESP solid samples on
March 12 had shown very low levels of chloride. The reactor and ESP
solids chloride levels did not reach steady state until approximately
mid-day on Harch 13. Therefore, the data from March 12 was not used in
developing the test segment averages.
Also influencing the fresh lime stoichiometry was the wet-bulb temperature
used during the PJBH demonstration run. There were several periods during
the demonstration run when the approach temperature control wae switched
between the manual wet-bulb measurements and the continuous wet-bulb
monitor (CWBM). This switching was due to problems with the CWBH in which
the two measurements deviated by more than 3OF. Test data in which an
inaccurate wet-bulb temperature was used for approach temperature control
wee removed prior to developing the reported test results.
Figure 4-16 provides a plot of the average total system SO2 removal for
each PJBH demonstration run test segment. The total system So2 removal
for both the GSA/ESP and the GSA/PJBH configurations are plotted in the
figure. The GSA/ESP total system SO2 removal efficiency averaged 91.2
percent during the PJBH demonstration run. The GSA/PJBH total system
SO2 removal efficiency, which is also presented in Table 4-8, was
significantly higher and averaged 97.7 percent. Since the GSA/PJBH
configuration provides much higher SO2 removal efficiency performance
compared to the GSA/ESP, the lime stoichiometry required to achieve 91
percent overall SO2 removal efficiency would be lower than the average
of 1.40 moles Ca(OH)2/mole inlet SO2 for the GSA/ESP configuration.
The average total system lime utilization data for both the GSA/ESP and
GSA/PJBH configurations are presented in Figure 4-17. The GSA/ESP total
system lime utilization averaged 66.1 percent during the 14-day PJBH
demonstration run. The GSA/PJBH total system lime utilization was 4.4
percentage points higher, due to the higher SO2 removal a.cross the PJBH,
and averaged 70.5 percent. Therefore, the GSAjPJBH configuration would be
more cost effective in terms of reagent utilization in comparison to the
GSA/ESP configuration.
4-37

7 0
. . j : / i.. ! : 1. \
. : :
th 1 0
I
(%) leAouatl 10s wsk wu
4-38

I 4-39

: i’
,:;
..: : *.i
,:’ ::
..: j
,:’ :
4-40

Figure 4-18 presents the calculated reactor lime utilization and the
measured reactor recycle solids calcium utilization for each PJBH
demonstration run test segment. As shown in the figure, the calculated
and measured utilizations are almost identical for all four test segments.
This very good agreement helps to validate the reported SO2 removal
results for these test segments.
ESP PARTICUL.ATE CONTROL PERFOPXANCE
Factorial Tests
The ESP particulate control results for the tests conducted at baseline
chloride levels are presented in Table 4-9 for the 2-AP series tests and
in Table 4-10 for the 3-AP series tests. Similarly, the particulate
control results are presented in Tables 4-11 and 4-12 for the chloride
spiking tests for the Z-AP and 3-AP series, respectively.
The ESP particulate removal results for all of the 2-AP and 3-AP series
tests are plotted in Figure 4-19. In the figure, the ESP emissions in
lb/MBtu are plotted as a function of ESP specific collection area (SCA).
The baseline chloride and calcium chloride spiking test data are separated
in this figure. In addition, linear regression lines for each data set
are plotted in the figure. The outlet emissions typically range from
0.005 to 0.015 lb/MBtu and they do not appear to decrease with increasing
SCA for the baseline tests, as would normally be expected. This result
could be explained if the ESP emissions were dominated by non-ideal
effects, such as sneakage, rapping reentrainment, low-resistivity
reentrainment, etc., that were limiting the ESP performance. However, for
the chloride spiking tests, there does appear to be a slight decrease in
emissions with increasing SCA. If the emissions from baseline test
conditions are limited by non-ideal effects, chloride spiking may help to
overcome this limitation by making the collected solids more cohesive and
improving their ability to stick to the collection plates and other
particles and thus, not be reantrained.
4-41

4-42

- 11


I Fi G i?4 $2 2 3 s s x 1s 8 0’ d d 2 1 d d x I
I 9 9 9 9 I 0 .-a--* 2, -33 I
I 9 wed ,22333 9 9 z, I ‘?
, I

i
P
-
t
23/o : 5:: :
: c
4-46
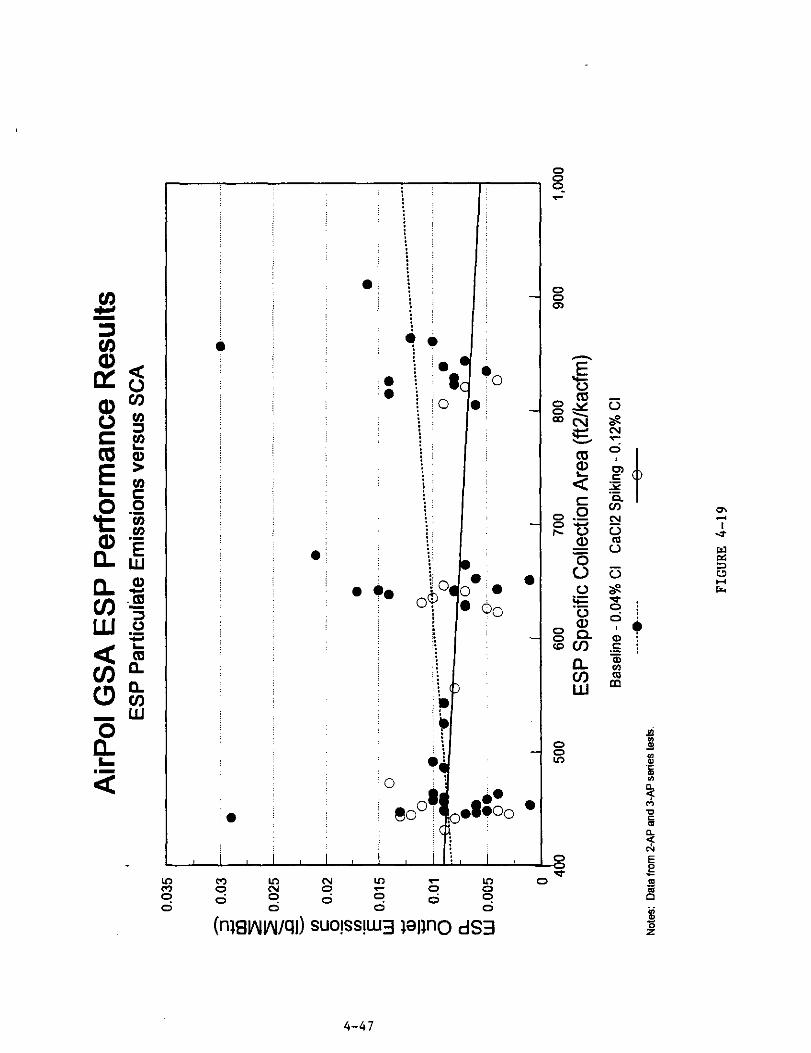
a
0:
::
l +e
:0
)
1.1 !O
r: d 5 d O-www/ql) ww~3 vwo ds3
4-47

Similar to Figure 4-19, Figure 4-20 plots the ESP particulate collection
efficiency as a function of ESP SCA for all of the 2-AP and 3-AP series
test*. The particulate collection efficiency is typically above 99.9
percent. Also, similar to the particulate emissions, the ESP efficiency
does not improve with increasing SCA at baseline conditions but does
appear to improve slightly with calcium chloride spiking.
ComDarison with Previous lo-MW SD Results
Figures 4-21 and 4-22 compare the ESP particulate control performance of
the AirPol GSA FGD system with that achieved in the prior SD FGD system
testing. Figure 4-21 plots the ESP particulate emissions as a function of
SCA for both baseline and chloride spiking tests. Similar particulate
emissions are observed for both FGD systems at SCAs ranging from 400 to
500 ft2jkacfm. Figure 4-22, which plots the ESP particulate removal as
a function of SCA, also shows that the ESP particulate removal for both
FGD systems is approximately the same at SCAB of 400 to 500 ft2/kacfm.
These figures show the deterioration in particulate control performance at
SCAs below 400 ft2/kacfm for the SD FGD system. liowever, no low SCA
tests were completed with the GSA system for comparison. It may be
important to determine whether a similar deterioration will be observed
with the GSA FGD system, since most FGD retrofit applications involving
ESPs would be in the 200 to 400 ft2/kacfm SCA size range. There were,
however, indications during the GSA demonstration run, which is discussed
later, that the ESP performance may deteriorate at lower SCA levels.
The major difference between these two technologies is that the GSA system
has a cyclone installed immediately downstream of the GSA reactor to
reduce the inlet grain loading entering the ESP. The inlet grain loadings
entering the ESP during the GSA testing ranged from 3-5 grfacf vs. the
b-10 gr/acf that were typical during the SD testing. These lower inlet
grain loadings in the GSA system mean that the ESP can achieve the
required emission regulations with a lower particulate removal efficiency
than would be required with the SD system, which is another advantage for
the GSA FGD technology.
4-48

i
:; b
, 0;
‘b 0 bi 0 /:
. . i _ : : . . .
,i 0 b
, :: ‘*A l
f+$
0 i It :
j
‘+
I I I I
(%) k.mplJ.J~ uoyoallo~ apql3!gJed
4-49

0
4-50

l
4-51

However, the cyclone in the GSA system removes the larger particles; thus,
a higher proportion of the particles entering the ESP are the smaller,
more difficult to renwve particles. This larger proportion of smaller
particles may contribute to the lower secondary current levels in the
first field of the ESP (i.e., current suppression) that were noted in the
GSA t@Sting. There were lower secondary currents in the first field of
the ESP noted during the SD testing, but not to the low levels seen in the
GSA testing. This higher proportion of smaller particles in the GSA FGD
system may also have contributed to the relative insensitivity of the
particulate emissions to significant increases in the ESP SCA above 400
ft2/kacfm, since these smaller particles are more prone to reentrainment
and other non-ideal effects.
28-Dav GSA Demonstration Run
A summary of the ESP particulate control results for the 28-day GSA
demonstration run is presented in Table 4-13. Based on these results,
there was a significant decrease in the ESP particulate control performance
during this 28-day demonstration run. This decrease in performance is more
clearly illustrated in Figures 4-23 and 4-24. In Figure 4-23, the ESP
particulate collection efficiency is plotted for each test segment.
Included in this figure are both the test averages and the individual mass
loading test results. The average ESP particulate collection efficiency
was greater than 99.95 percent through the first five test segments
(l-DR-01 through 3-DR-04). The last three test segments, l-DR-05 through
l-DR-07, exhibited poorer performance with the particulate collection
efficiency averaging approximately 99.90 percent. Effectively, the
particulate penetration doubled (0.05 versus 0.10 percent penetration)
during these last three test segments.
Figure 4-24 presents the ESP particulate emissions for each test segment.
Similar to Figure 4-23, both the test averages and individual test data are
presented. Concurrent with the poorer ESP particulate removal efficiency,
an increase in ESP particulate emissions was also observed for the last
three test segments as the ESP emission increased from about 0.006 to
0.015 lb/MBtu. However, even the higher emission rates (0.015 lb/MBtu)
are about one-half the NSPS for particulates.
4-52

$;r 8-Z- wwggfr

0
: 00
00
00 1
i 0
t 00
0 0
/
j
0
8 % ? % cq %
(%) hJ&lJJ~ UO!J3allO=) C3)el”&d dS=J
%
4-54

2 0 6
5 8 In 6
6 z
&W’J,~l~ S’JO!~!W Iin0 dSi
4-55

The poorer ESP particulate control performance during the last three test
segments appears to be due to a decrease in the power levels in all 4 ESP
fields. The reduction in power levels in the first two fields was due to
solids build-ups on the hopper ridges between fields 1 and 2 and between
fields 2 end 3. The reduction in power levels in fields 3 and 4 were due
to the increased particulate loading entering these fields. A more
complete discussion of the ESP operation during the GSA demonstration run
is presented later in this section.
14-Dav PJBH Demonstration Run
Similar to the 28-day GSA demonstration run, the ESP particulate
collection efficiency deteriorated over time during the 14-day PJBH
demonstration run. A summary of the ESP particulate control results for
the 14-day PJBH demonstration run is presented in Table 4-14. This
deterioration in the ESP performance is shown in Figures 4-25 and 4-26.
In Figure 4-25, the ESP particulate removal is plotted for each test
segment. Both the test segment averages and the individual removal
efficiencies from each mass loading run are plotted in the figure. The
average ESP particulate removal efficiency decreased from 99.96 percent in
the first test segment (l-PJ-01) to 99.89 percent in the last test segment
(l-PJ-04). As would be expected with this decrease in the particulate
removal efficiency, the ESP particulate emissions also increased over time
during the PJBH demonstration run as shown in Figure 4-26. The average
particulate emissions increased steadily from 0.006 to 0.017 lb/MBtu
during the demonstration run. Both of these figures indicate that the ESP
particulate control performance was still deteriorating at the conclusion
of the PJBH demonstration run.
The reason for the deterioration in ESP particulate control performance
over time during this demonstration run is not clear. In the previous
28-day GSA demonstration run, the deterioration in particulate control
performance was attributed to solids build-ups on the hopper ridges
between fields 1 and 2 and fields 2 and 3, which electrically shorted out
fields 1 and 2. However, significant solids buildups on the hopper ridges
did not occur during the PJBH demonstration run. The ESP was inspected on
4-56


qo+ 0 ~
0
t
, I
(%I ~~ua!Y43 uO!W’llO3 WW!l-led dS3
4-58

0 :o
0
0 00
:~
0 0
hawu4~) =‘O!SS!W wvo dS3
4-59

narch 9, between test segments l-PJ-03 and l-PJ-04, and again on March
25. Although some solids build-up was observed on the hopper ridges
during these inspections, it did not extend up into the plates and wires
where the field would be shorted out.
During the March 9 ESP inspection, however, the emitter wires in the first
field were found to be heavily coated with solids. Some of the wires had
solids build-ups that were 314 in. thick. The cause of these build-ups
was that the wires were not being rapped in the first field due to the
failure of the coupling between the rapper drive motor and the rappers.
Apparently the first field wires had not been rapped since February 1,
when the rapper drive motor had failed and was subsequently replaced.
However, even after the first field rappers were repaired, the ESP
particulate control performance continued to deteriorate. Therefore, it
does not appear that the build-up on the first field wires was influencing
the ESP particulate control performance.
Contrary to the ESP particulate control performance, the PJBH, which was
operating in the in-parallel mode, did not exhibit a decrease in
performance during the PJBH demonstration run. Based on the data in Table
4-15, the particulate removal efficiency and outlet emissions averaged
99.99 percent and 0.0017 lb/MBtu, respectively. This particulate emission
rate is more than an order of magnitude below the NSPS for particulates.
Figures 4-27 and 4-28 compare the ESP and PJBH particulate control
performance during the PJBH demonstration run. In Figure 4-27, the
average ESP and PJBH particulate removal efficiencies for each test
segment are plotted. Figure 4-28 shows the average ESP and PJBH outlet
particulate emissions for each test segment. As shown in each figure, the
PJBH particulate control performance was superior to that of the ESP. In
addition, the PJBH particulate control performance did not deteriorate
over time during the 14-day PJBH demonstration run.
4-60

m
4-61

ii $ : E : Ls*
2 : 2
r:
4-62

s OL 5% .- .- - .E aE I *w coal ci6 03 EiS aI>
4-63

ESP OPERATION
JQctosial Tests
The average secondary voltage and current levels for the tests conducted
at the baseline chloride level (0.04 weight percent coal chloride) are
presented in Table 4-16 for the 2-AP series tests and in Table 4-17 foe
the 3-AP series tests. Similarly, the average secondary voltage and
current are presented in Tables 4-18 and 4-19 for the chloride spiking
tests (0.12 weight percent coal chloride equivalent) for the 2-AP and 3-AP
series, respectively.
The changes in some of the variable levels during the factorial tests
resulted in changes in the ESP operation. Specifically, the secondary
current levels in field 1 and sometimes in fields 2 and 3 would be
suppressed depending on the test conditions. The current suppression in
the ESP was greater during the tests conducted at the 20,000 scfm flue gas
flow rate and at the 2S°F approach temperature compared to similar tests
conducted at the 14,000 scfm flow rate and a lower approach temperature.
The current suppression is thought to be due to changes in both particle
size distribution and particle resistivity due to the higher approach
temperature. These changes were the" aggravated at the higher gas
velocity at the higher flue gas flow rate. The changes in the levels for
the other variable did not have as significant effect on the secondary
current suppression. In addition, the degree of secondary current
suppression in the first field did not appear to influence either the ESP
particulate removal efficiency or emission rate.
28-Dav GSA Demonstration Run
As mentioned previously, the ESP particulate removal performance seemed to
deteriorate over time during the Z&day GSA demonstration run. The reason
for the poorer performance is thought to be due to a decrease in power
levels in all four ESP fields. The most significant decrease in the power
levels was noted in the first two ESP fields. Table 4-20 sumrnarizes the
average secondary current and voltage levels for each field for each
4-64


d d d d

fs,a % 3.2 I. E gk;w
-.4 -2 z!s$!iz uz o- VU

4-68


demonstration run test segment. Figures 4-29 and 4-30 illustrate the
decrease in power levels. In Figure 4-29, the average secondary current
level for each ESP field is plotted for each test segment. Similarly, the
average secondary voltage level for each ESP field for each test segment
is presented in Figure 4-30. In both figures, the power levels seem to
decline in the first field over the first week of the test and then
"reset" to a higher level. The hypothesis to explain the higher power
levels noted in the first field after test segment l-DR-02 is that this
increase was due to the cleaning of the first field and the hopper ridges
during the short November l-3 outage for the boiler tube leak.
The power levels then resumed the deterioration until there was a
significant drop in power levels in field 1 during test segment l-DR-04
and in field 2 during test segment 3-DR-04. Although the power levels
decreased during test segment 3-DR-04, the ESP particulate control
performance for this test segment was equivalent to the prior four test
5egme*t5. This is because the mass loading tests, which were used to
determine the performance levels were conducted on November 9, while the
secondary current and voltage were decreasing in the second field. This
is illustrated in Figure 4-31, which shows a daily plot of the secondary
current for each field. As shown in this figure, the secondary current in
field 2 was dropping during the day on November 9. There was also a
slight drop in the secondary current level observed in field 3 on November
9. However, a more significant drop in secondary current levels was
observed in field 3 on November 10. Also shown in the figure is a slight
drop in average secondary current for field 4 on November 10. The
secondary current in fields 3 and 4 were lower after November 10 and
remained at the lower levels for the remainder of the demonstration run.
The reason for the drop in power levels in the ESP fields appears to be
due to a solids build-up shorting out the first two fields. Solids
build-ups were observed on the ridge beams between the first and second
field and the second and third field hoppers. These build-ups, which were
observed during an ESP inspection on November 29, extended up into the
4-70

;* t
I I I i
!$ +
.:’ I
/ I :I :
f.4 . . . . . . /’ . . ..-
4-71

: ,; :; : : I! : ~ , i.: :
4 i I*.<’
: I ;. . .
~ ~..(
q;: ~ ‘..i \ :. I 1 *.,. ,; ..~
: : : li’+ i; : . I i ,~ :, :
: : : : : : i&; : ~
; +ji ;
4-72

:E.. g q:::+
~ F ..* ,~ :rnq ?jy ~ ;x y 8 .? w
ix ** _ :& &-”
/A
:g “+ ~ :m .*.) j ijy-’ __ .J ._._._ $ $“‘; /m ~ g _.___..__..__. ~ I& ___..._____._. “’ qh, ~ j/J ap ~
p ; : .
!g I
0 Ki E z 8 54 0 (vu) Jura&n=) h&“maS
4-73

plates and wires approximately 6 to 8 inches. The reduction in power
levels in fields 3 and 4 was' probably due to the increase in particulate
loading resulting from the poorer particulate collection perforxnance in
fields 1 and 2.
14-Dav PJBH Demonstration Run
The average secondary currents and voltages for each test segment during
the PJBH demonstration run are presented in Table 4-21. As previously
noted, the solids build-up on the first field wires due to failure of the
rapper drive may have affected the first field secondary current during
the first three test segments. Figures 4-32 and 4-33 present the average
secondary current levels for each field during the PJBH demonstration
run. In Figure 4-32, the average secondary current levels are plotted for
each test segment. The figure shows a significant increase in the average
first field secondary current during the last test segment (l-PJ-04),
compared to the prior test segments when the first field wires were not
being rapped. Figure 4-33, which plots the average daily secondary
currents during the PJBH demonstration run, also shows a significant
increase in the first field current for the last test segment, l-PJ-04.
However, there was a sharp decrease in the first field secondary current
on the last day of the PJBH demonstration run, for an as yet unexplained
reason. Also observed during the PJBH demonstration run was a decrease in
the second field secondary current level from February 27 to March 3. No
explanation was found for this decrease in secondary current in the second
field.
4-74

4-75

F !:I ;ij ::, ii: i:l: Ii
;jl : ,i /; : I i I \
i;
:. q :I :g !1 $ ;a ‘*. i ;a :: :a :. :a I
.:I :!I :4
b
I J
;g 1
;! !! -! I I I
4-76

k +
lui’
I) I .:( ii3 /i. I t:. ( -:I\
Ii 1; Ii I i
* ;
#a.
#(‘& ~
g ..& ~
k
$
‘-‘!r __.__.______._ !
-- . . ..___
)k
“7
.@
*
k
m-.; .___...__........ .._...-i
*WY ~
+ i;
‘i) 4 ~
E 2 5: 5 E 0 L-4
(ijtu) @mt) hepuo3as
4-77

MAJOR OPERATING AND MAINTENANCE EXPERIENCES
The operating and maintenance experiences were limited to a few minor
problems. The GSA system as installed at the CER was remarkably trouble-
free and there were no major problems encountered during the testing.
Therefore, attention was focused on a number of minor problems, which are
discussed in more detail below. These minor problems are addressed by the
test phase in which they were first noted.
FACTORIAL TESTING
Each of the factorial tests was typically run at a specified set of test
conditions for only two days. A number of minor problems were noted during
these short-term tests as discussed below.
Recvcle Feeder Box
One of the mire important of these minor problems involved the recycle
feeder box. The recycle feeder box, which provided in-process storage of
the dry solids collected by the cyclone, periodically emptied rapidly
during a test, causing a sudden increase in the pressure drop in the GSA
system. In the early part of the factorial test plan, this pressure drop
spike typically tripped the ID fan. (This ID fan trip was a safety feature
to protect the ESP and other equipment from high-negative static pressure
transients.)
A specific set of test conditions was typically associated with this
recycle feeder box problem. The specific test conditions included: high
flue gas flow rate (20,000 scfm), high fly ash loading (2.0 gr/acf), high
coal chloride level (0.12 percent), and high recycle screw speed (45 rpm).
All four of those specific conditions had to be present in the test for the
problem to occur. Thus, this problem could be avoided by not running a
test at these specific variable levels.

A materials handling consultant was brought in to inspect the system and
determine the cause of this problem. The cause was found to be the
relatively long pipe from the recycle feeder box to the reactor, which
allowed a syphon to form under these specific test conditions. The syphon
was surprisingly powerful with a negative pressure exceeding -50 in H20
developing fin this long pipe prior to the rapid emptying of the recycle
feeder box.
The consultant suggested that the permanent solution to this syphon problem
would be to install a taller recycle feeder box or relocate the feeder
box. This design change would be relatively simple to include in a new
install&tion, but expensive to implement at the CER. This design change
would have two positive effects. First, the taller recycle feeder box
would shorten the length of the pipe carrying the dry solids back to the
reactor. According to the consultant, the length of the return line to the
reactor influences the magnitude of the syphon effect, i.e., the shorter
the length of the return line, the smaller the syphon effect. Second, the
taller recycle feeder box would increase the residence time in the recycle
feeder box for the solids from the cyclone to doaerate.
When the solids in the recycle feeder box contained substantial amounts of
the spherical fly ash particles and also calcium chloride, which added a
surface layer of moisture on the particles, the recycle solids tended to
flow easily out of the recycle feeder box under the negative pressure in
the reactor. If the recycle feeder box residence time was increased to
three minutes by making the box taller, the recycle solids would have more
time to settle and deaerate. Without this air entrained in the recycle
solids, the particles would be less likely to be pulled out of the recycle
feeder box.
The recycle feeder box installed at the CER originally had a three-minute
residence time based on the design recycle screw speed of lo-22 rpm.
However, after the startup testing demonstrated that increasing the recycle
screw speed from 10 to 22 rpm increased the overall system SO2 removal
efficiency, the decision was made to double the maximum speed of these
screws to 45 rpm and to test the recycle screw speed at two levels: 30 and
5-2

45 rpm. At the 45 rpm recycle screw speed, the solids residence time in
the feeder box was only about one minute and the solids did not have
sufficient time to deaerate.
A nwre cost-effective solution for the CER installation was to install vent
lines from the recycle feeder box to the cyclone to break this syphon
before it could cause the recycle feeder box to empty. Also, a small
observation port above the recycle screws in the feeder box was left open
to help equalize the pressure in the system. These vent lines were
installed using 1 in. rubber hcss that connected the cyclone, the top of
the recycle feeder box, and the discharge end of the recycle feeder box.
Unfortunately, these vent lines tended to plug on occasion. This plugging
of the vent lines was thought to occur when the recycle feeder box was
filled completely. The solids then backed up into the cyclone and entered
the top of the vent line connecting tho recycle feeder box with the
cyclone, plugging the line. This plugged vent line went undetected until
the test conditions that generated the "syphon effect" were run and the
recycle feeder box emptied rapidly, causing a pressure drop spike that
tripped the ID fan.
A change in the operating procedures was also initiated to reduce the
chance of the syphcn effect causing an ID fan trip. The computer control
system was reprogrammed to decrease the flue gas flow rate by 500 scfm
whenever the static pressure at the ESP outlet approached the ID fan trip
point. (A lower flue gas flow rate reduced the pressure drop in the
system.) There were several factorial tests completed at the lower-than-
planned flue gas flow rate because the computer control system had reduced
the flue gas flow rate to prevent an ID fan trip. Even after this
modification was made, however, the ID fan tripped on a high negative
pressure on occasion.
Flv Ash Iniection System
The fly ash loading in the flue gas entering the reactor "88 somewhat
higher than planned during essentially all of the factorial testing.
During an inspection of the fly ash injection system in late June, the
rotary valve below the fly ash silo was found to be badly wcrn and fly ash
5-3

was apparently slipping past the valve, even when the valve was not
operating. After this inspection, a new abrasion-resistant rotary valve
was ordered, but could not be delivered and installed until after most of
the factorial tests had been completed. Material balance calculations for
some of the previously completed factorial tests indicated that the acid
insoluble levels in the recycle solids product were consistent with a fly
ash injection rate that was nearly double the planned rate. This
uncertainty in the actual fly ash level for these factorial tests may have
contributed to the variability in the test data.
These significantly higher-than-planned fly ash injection rates may have
also contributed to the "syphon effect" problem encountered in the factorial
testing by increasing the concentration of the spherical fly ash particles
in the recycle solids. After the new abrasion-resistant, rotary valve was
installed below the fly ash silo, no tests were completed at the appropriate
conditions to determine if the resulting lower fly ash injection rate
"solved" the syphon problem.
Several calibration checks for the new, abrasion-resistant rotary valve in
November and December 1993 indicated that this rotary valve was metering
the correct amount of fly ash into the flue gas. Thus, both the GSA and
PJBH demonstration runs, which were completed after the installation of the
new rotary valve, are thought to have been run at the planned fly ash
injection rate.
ESP Dewsits
There were solids buildups in the ESP during the GSA factorial testing.
These solids deposits seemed to be correlated with tests, which had both
the high coal chloride (0.12 percent) and the close approach-to-saturation
temperature (l@F) levels. The GSA solids produced under these test
conditions seemed to have a high angle of repose. An inspection of the ESP
following the completion of a test at these conditions typically showed
solids deposits on nearly all of the horizontal surfaces in the ESP. Even
the grating in the walkways between the first and second fields of the ESP
had a significant buildup of solids. These deposits also occurred on the
5-4

hopper ridges below and slightly behind the first and second fields of the
ESP. These solids deposits on the hopper ridges reduced the clearance
between the plates and wires and these solids deposits and affected the
electrical characteristics of these two fields.
There were also solid buildups on the walls in the ESP hoppers, particularly
in the first field. These buildups were thickest in the corners of the
hopper. On some occassions these deposits in the first field hopper
corners "grew" into the collector plate area, effectively shorting out the
field. This hopper was thought to be heated and well-insulated, but did
not have rappers to dislodge these solids deposits. Later, after the
completion of the GSA test program, the first field hopper heaters were
found to have been disconnected. The insulation on the first field hopper
was also found to be inadequate. (These deficiencies were thought to be
the result of the modifications that were made to the first field hopper in
early 1992.)
The major problem with these solids deposits in the hopper and on the
hopper ridges was that these deposits appeared to be "growing" toward the
collector plates and wires in the first field. These solids deposits,
which may have contributed to the extremely low secondary current levels in
the first field, were typically seen after completing high-chloride
factorial tests at a close approach-to-saturation temperature. (See the
discussion of the low secondary current levels below.) Normally these
deposits were removed during the ESP inspections, but "grew" back during
the next chloride-spiking test that was run at the close apprcach-to-
saturation temperature condition. These solids deposits in the first field
were not a significant problem in the factorial tests since there was no
apparent correlation between the first field secondary current level and
the emission rate from the ESP. Furthermore, these deposits could be
periodically removed during outages before they reached significant levels.
The average secondary current level in the first field of the ESP ranged
from extremely low to the full-current level of 195 mA. These low average
secondary current levels seemed to be correlated with a high flue gas flow
5-5

rate (20,000 scfm) and either the high approach-to-saturation temperature
(2B°F) or the high coal chloride level (0.12 percent).
These low secondary current levels in the first field could be due to
either space-charge effects or a low-resistivity problem (or both). The
apparent correlation between the coal chloride level and the current level
would be indicative of a low-resistivity effect. The high angle of repose
for the GSA solids during the chloride-spiking tests completed at a close
approach-to-saturation temperature is indicative of the deliquescent nature
of calcium chloride and the production of "sticky" particles that are
likely to clump into larger particles. Thus, this result implies that the
low secondary current levels for these tests may not be due to space-charge
effects, which are caused by small particles.
The high approach-to-saturation temperature tests could result in either a
resistivity problem or the production of small particles and thus, a space-
charge problem. The high approach-to-saturation temperature would reduce
the surface moisture level on the particles, lowering the cohesivity of
these solids, and thereby preventing the agglomeration of the small
particles.
Reactor DeDosits
There were solids deposits on the reactor walls on occasion, particularly
on the south wall of the reactor above the nozzle elevation. These solids
deposits were typically not removed after the inspection of the reactor
since these deposits were relatively minor and were thought to reach a
steady-state level. This steady-state level occurred when the deposits
built up and then fell off when sufficiently large, only to gradually
rebuild with continued operation. These solids deposits did not seem to
cause any operating problems.
On infrequent occasions, however, larger solids deposits were noted on the
reactor wall. For the most part, these deposits did not cause operating
problems. These larger solids deposits on the reactor wall occasionally
broke free and fell through the venturi section at the bottom of the
5-6

reactor. These larger solids would deposit on the turning vanes at the
inlet elbow. These turning vanes were located above the double-dump valve
and if the solids were sufficiently large, the turning vanes could be
blocked. This resulting bridge over the top of the double-dump valve would
prevent the removal of the solids from the system. This bridging had been
more of a problem early in the factorial testing when the original, small
(6 in. dia.) rotary valve had been installed at this location. Because of
this problem, a larger double-dump valve was installed and the frequency of
these bridging problems declined substantially. However, these incidents
still occurred periodically.
One possible remedy for this problem would be to install a delumper above
this double-dump valve to reduce the size of any solids entering the valve.
The inclusion of this delumper would be a prudent decision for a commercial
installation to ensure the reliability of the GSA system. These delumpers
are frequently used in the cone bottoms of SD FGD systems to prevent the
oversize material from plugging the discharge in the cone bottom of the
SD.
On several occasions the solids deposits on the reactor walls were more
substantial. In nearly all of these incidents, a problem with either the
two-fluid nozzle or its alignment was found to be the cause of these
deposits. These deposits were typically not the direct cause for the
system to shut down, but rather these solids deposits were found during a
later inspection of the reactor. (The most extensive deposits were found
during the reactor inspection after the completion of the Z&day GSA
demonstration run, which had been successfully completed with no major
apparent operating problems.) However, a severe nozzle or alignment
problem, which happened infrequently, eventually resulted in a high
pressure drop in the system that brought the system off-line.
Two-Fluid Nozzle
There were also deposits found on both the outside and inside of the
two-fluid nozzle. These deposits became more extensive as the length of
time between nozzle changeouts increased. The deposits on the outside of
the nozzle appeared to be an inverted cone-like extension of the nozzle,
5-7

growing upward and outward into the reactor. However, no major operating
problems were associated with these deposits. These deposits were probably
due to a gradual buildup of material over time due to the interaction of
the hot flue gas and lime slurry at the outside edge of the nozzle cone.
The deposits on the inside of the nozzle were located on the perforated
plate separating the lower chamber where the atomizing air entered the
nozzle and the upper chamber where the fresh lime slurry and trim water
were introduced into the nozzle. On occasion some of the holes in the
plate were plugged by these deposits. These solids appeared to be calcium
carbonate deposits resulting from the pH change in the trim water when it
was mixed with the lime slurry. The trim water was filtered river water
and probably contained dissolved calcium carbonate, which then precipitated
in the nozzle with the pH increase due to the lime slurry.
The nozzle and lance were typically changed out every two weeks during the
factorial testing at the CER. (The lance is the piping internal to the
reactor through which the feed slurry flows to reach the nozzle.) The
slurry and trim water lines to the lance had quick-disconnect-type
connections to facilitate the nozzle/lance changeout. The replacement
nozzle and lance assembly was inserted as soon es the original assembly was
removed to minimize the length of time without slurry being injected into
the reactor. The total time for this changeout was typically about five
minutes and was accomplished without shutting the GSA system down. The
assembly that was removed from the reactor was then cleaned and inspected
in preparation for its next use. The nozzles were cleaned with a weak acid
solution end the average cleaning time was about 4 hours. The deposits
inside and outside the nozzle were not difficult to remove.
Initially, the two-fluid nozzle was changed out relatively frequently, on a
daily basis during the startup tests and then weekly during the initial
factorial tests. Later, the time interval between changeouts was gradually
stretched until it was being changed out every two weeks. There were
attempts to increase the time interval between changeouts to four weeks,
but the deposition of solids in and on the nozzle made this too long of a
time period, and the changeout frequency reverted back to every two weeks.
The basis for trying to decrease the frequency of the nozzle changeout was
5-a
that no SO2 removal occurs during the short period of time that the nozzle
was being changed out. Without the lime slurry injection, the approach-to-
saturation temperature in the reactor quickly increased to 150-ZOOoF and
the SO2 removal efficiency in the GSA system decreased to near zero.
Although the changeout time was estimated at only five minutes, if a high
SO2 removal efficiency is required, possibly because the unit is burning
a high-sulfur coal, the SO2 emissions during frequent changeouts of the
nozzle assembly could be a significant contributor to the total SO2
emissions during the averaging period, particularly for those units having
short averaging periods.
The other reason for reducing the frequency of the nozzle assembly
changeout was to reduce the operating and maintenance requirements for the
process. one of the major factors that utilities use in evaluating
alternative SO2 control technologies is the operating and maintenance
labor required. Thus, longer intervals between nozzle assembly changeouts
might be a substantial advantage for the GSA process.
The stainless steel washers used in the two-fluid nozzle have shown
relatively good service life. Only one of these washers had been worn to
the point that it failed. The one washer that failed had an elongated
orifice (about 11/16 in. dia. vs. a normal 7/16 in. die) that is thought to
have resulted in "poor" atomization and led to the deposition of solids in
the reactor, which led to the shutdown of the system. Normally these
washers are replaced every 500-600 hours. However, it should also be noted
that these washers are not exposed to an erosive environment since the
washers were only used to atcmiae the de-gritted, dilute lime slurry.
Recvcle Screw Deoasits
Solids buildups have been noted on the recycle screws in the recycle feeder
box on a relatively infrequent basis. This material had to be chipped off
the recycle screws and also the troughs that the screws turned through.
Both the recycle feeder box and the troughs for the recycle screws were
heated so that condensation was not thought to be the cause of these
5-9

deposits. Instead, these deposits w@re thought to be a gradual buildup
over time, which could be removed during regularly scheduled maintenance
outages. (The opening of the observation port to minimize the potential
syphon effect may have aggrevated this problem by allowing ambient air to
enter the recycle feeder box above these recycle screws.)
Level Indication in Recvcle Feeder Box
The design of the GSA system at the CER included weigh cells to determine
the solids levels in the recycle feeder box. These weigh cells were not
satisfactory for determining the solids level in the recycle feeder box.
Even though the CER was a research and development facility and had
instrument mechanics readily available to regularly calibrate these weigh
cells, the weigh cells were unreliable for process control purposes. The
weigh cell readings, if used at all, were used primarily for trend-following
rather than as an absolute value. A reliable level indicator for the
recycle feeder box would be needed for a commercial GSA installation. A
nuclear-type level indicator would probably be the most reliable and would
"shoot" downward through the height of the recycle feeder box.
GSA DEMONSTRATION RDN
Several operating and maintenance problems occurred during the ZB-day GSA
demonstration run. Since this run we8 significantly longer than any of the
previous factorial tests, one would expect some problems to occur that were
not apparent in the shorter tests. Each of these problems is discussed in
more detail below.
Hish Ca/S Level
During the 2S-day GSA demonstration run, a higher-than-expected Ca/S level
was required to achieve the average 91 percent overall system SO2 removal
efficiency. For the initial week of the demonstration run while the boiler
was burning the design coal, the average CafS level required to achieve the
91 percent overall system So2 removal efficiency setpoint ranged from
1.40-1.45 moles Ca(OH)2/mole inlet SO2. Based on the previous factorial
5-10
tests, the expactation had been that the Ca/S level would be in the range
of 1.30-1.35 moles Ca(OIi)2/mole inlet S02. When the results showed that
a higher CafS level was needed, TVA checked a long list of possible causes
for the higher-than-expected Ca/S level, but no problems with the system
were found.
When no equipaent problems were found, various other reasons for the
higher-than-expected CafS were evaluated. Because this "problem" occurred
at the end of the test program, no definitive explanation for this result
was detenained. However, four possible reasons, acting alone or in
concert, were thought to be the reason for this "problem". First, in the
previous factorial testing, the Ca/S level was controlled at a setpoint.
In this demonstration run, the control system was focused on the overall
system SO2 removal efficiency setpoint. The SO2 removal efficiency
tended to fluctuate because of a number Of factors (e.g., changes in the
inlet flue gas SO2 concentration) and in the SO2 control mode, the Cal.5
level was continually changing to maintain the setpoint. This tended to
cause the Ca/S level to overcompensate on average and be above that level
found to be needed in the previous factorial testing. This "over-shoot" is
more pronounced in a higher sulfur coal application where a high SO2
removal efficiency is required because of the flattening of the Ca/S effect
on so2 removal, i.e., at already high Ca/S levels, a larger increase in
the Ca/S level is required to generate a" incremental increase in the
overall system so2 removal.
Second, the recycle screw speed was reduced from 45 to 30 rpn in the
d@monstration run to eliminate any potential for operating problems, i.e.,
the "sypho" effect" (see earlier discussion). The other test conditions
for the 2S-day GSA demonstration run included the high flue gas flow rate
(20,000 SCfrn), high fly ash loading (2.0 gr/acf), and high coal chloride
(0.12 percent) level. If the recycle screw speed had been set at 45 rpo,
the GSA system might have achieved a slightly higher overall system SO2
removal efficiency, but would have been susceptible to the syphon effect.
Since the primary emphasis in this run was to keep the GSA system on-line
continuously for the full 2S-day period, the decision was made to be
conservative and use the lower recycle screw speed. (The preliminary
5-11

analysis of the factorial test results had indicated that the recycle screw
speed had a very minor effect, if any, on the overall system SO2 removal
efficiency.)
Third, the fly ash loading at the system inlet was somewhat higher in this
GSA demonstration run with the Andalex coal. During the previous testing
with the other coals, the fly ash loading at the system inlet had been
about 0.5 gr/acf. This level (0.5 gr/acf) was the basis for the addition
of 1.5 grjacf of fly ash during this run. However, with the Andalex coal,
the fly ash loading at the system inlet was later determined to be somewhat
higher at about 1.0 gr/acf. When the additional fly ash was injected at
the rate of 1.5 gr/acf, the total fly ash loading in the flue gas at the
reactor inlet was higher than planned. These higher fly ash loadings would
displace some of the recycle material and thereby reduce the overall system
SO2 removal efficiency. (However, this reduction in SO2 removal was
expected to be relatively minor, based on the preliminary analysis of the
factorial test results.)
Fourth, the high overall system SO2 removal efficiencies that were
achieved at a somewhat lower Ca/S level in the factorial testing were not
absolute. These results were subject to the normal variability in the test
data. This meant that even though one was repeating a test condition, the
overall system SO2 removal efficiency could vary around a median value.
If the factorial test results had been at the high end of this variability
range, some of the apparent increase in the Ca/S level to achieve the
overall system SO2 removal efficiency during the demonstration run could
be due to this variability.
Boiler-Related Problems
During the first week of this 2S-day GSA demonstration run, there was an
interruption in the supply of the Unit 9 coal. The planned deliveries of
the high-sulfur (2.7 percent) Andalex coal were delayed because of problems
at the mine. On October 31, the boiler was switched to the higher sulfur
(3.5 percent) Warrior coal that is normally burned in Unit 10 at Shawnee.
However, this "problem" allowed the system to demonstrate its flexibility
by treating the flue gas resulting from the combustion of the higher sulfur
5-12

coal and still maintain the 90+ percent SO2 removal efficiency setpoint
1 (although at a higher Ca/S level). The boiler continued burning the higher
sulfur Warrior coal for about one week. Thus, several test segments were
completed while the bailer was burning this Warrior coal.
Shortly after the higher sulfur Warrior coal was loaded into Unit 9, the
unit was shut down to repair a tubeleak. The unit and the GSA system were
shut down on Wovember 1. Since this forced outage was due to a boiler
problem and was unrelated to the GSA system, the lost test time was added
to the end of the run. The boiler and the GSA system were both back
on-line on November 3. This boiler outage caused a two-day delay in the
completion of the 2S-day demonstration run.
ESP Solids Denosits
The presence of solids deposits on the hopper ridges in both the first and
second ESP fields did appear to result in a degradation of the ESP
performance during the 2S-day GSA demonstration run. In this longer-term
run, the ESP performance seemed to decline slightly over time in the first
week and then improved when the boiler came off-line and the hopper ridges
were cleaned. Once back on-line, the ESP performance resumed its gradual
decline. About two weeks into the run, a mechanical problem prevented the
removal of solids from the first field hopper and forced the temporary
shutdown of the first field. This shutdown resulted in a high inlet grain
loading to the second field. Shortly after this mechanical problem, the
average secondary current in the second field plurmneted to an extremely low
level. (The first field secondary current was already at a low level.)
The emission rate doubled from about 0.007 to 0.015 lb/MBtu at about the
same time that the average secondary current level in the ESP second field
declined.
Although the average secondary current levels in the first and second fields
dropped to extremely low levels, the third and fourth field continued to
operate at or near the full-current level. One potential explanation for
this apparently inconsistent result is the site-specific design of the ESP
that is installed at the CBR. The ridge between the first and second field
hoppers is located below and slightly behind the plates in the first field.
Similarly, the ridge between the second and third field hoppers is located
5-13

below and slightly behind the plates in the second field. The relatively
close clearance between these hopper ridges and the plates and wires in
these two fields make them particularly susceptible to the effect of the
solids deposits. The more "typical" design for the third and fourth field
hoppers and fields, i.e., with the hopper ridges below and further behind
the plates and wires, provided more clearance. This larger clearance
in these fields apparently resulted in essentially no impact on these fields
from solids deposits on the hopper ridges, even after both the first and
second fields had "shorted out" and were operating at extremely low
secondary current levels.
The emission rates from the ESP seemed to correlate with the daily average
secondary current level in the second field of the ESP. The average daily
secondary current in the second field of the ESP, which is shown in Figure
5-1, remained at relatively high levels through the first two weeks of the
demonstration run and the emission rates remained at very low levels
(0.004-0.009 lb/MStu) during this time period. However, once the average
secondary current level in the second field dropped precipitously and
remained at very low levels, the emission rate ramped up to the range of
0.015 lb/MStu and remained at this level for the remainder of the run, as
shown in Figure 5-2.
.-.
The dramatic decline in the average secondary current level occurred during
the period from Novemb@r lo-14 and the first mass loading run on November
13 showed a large step change in the emission rate over the previous data
from November 9. (No mass loading data are available for the period of
November 10-12.) During the last two weeks of the run the emission rate
appeared to reach a steady-state level of about 0.015 lb/MStu. Although
these average emission rates show some fluctuation, given the much wider
range of the individual data points, all of these average values are
essentially the same.
The lower secondary current in the second field of the ESP may have
appeared sooner, except that the boiler went down to repair a tubeleak late
on November 1 and the hopper ridges were cleaned on November 2. This
cleaning was initially thought to have delayed the onset of the decrease in
the secondary current in the second field of the ESP and the "poor" ESP
performance.
5-14

.f
A-
A
&
L 8 8 ? E 8 O-
(vu) weun3 ihpuoaes
*I 3% Ll m': $4 .- ; u..
4 u 3is ii;
a' $
t
5-i5

I 8 -z I 1 l I I 0 0 --z; I 1 l I I ,a I I I 1 ,b I I : 2
g: ,m
--L if !g
0 2 I 1 0 --2 E
s
z z
I I z I I z ; I 0 1 I I 0 --Q, i
I , a % I E I a -I- I g I 0 a 1 A I m-v) :
0 % 0 P
: ,~!::: ,:, ::.:::;“:T ::I:,:~.::::::_:::-: :~:~:~:~:~~:_:::::~.:.-~.,~:~~.~,~~~~:~~ ::_,:,:::~/_::::::~::,: :~$:: :y:-s-$$::<T:<i _:<3:;::;;:, :-~-::::::,::::_-i:::~~-::::i::-:::li~::’-ili::,:6’:,-“l’:-::_:::::-‘:::~:::i:i:~i:iiil:ii~~~~~~~~~~::;,;,, .,:%A::.: ‘.:,::::.,:.,.:.:_,_;:i::~,::::,::;::;:::.:~:::i~~i:cI)::;~: :~:,:;:,~,:,:~~::,,: .I.,: ~:, ,,:, ~:~:~..:~:,:,,.:.,.~:,:,:.:.::,:,:.:~:...:.:.:~I:~:::~:~,.:~.:,~:.:.~i:l~:,:.~~~,:.:.~.~.:.~,.,:,:, ,;,:,,.:,:.~.,.:,;,~.:.~~~:.:~:;::::~~,.;~::i::;,~;~~~:~~.:.;.;,~.,~,~~.~~~~~~~
c) + :~:~:.,~:~::.:.:.:~::.:::,:,:,.i.,, ,,,, ~:~::~::~,,~, ,,.,..,.,,, I::i--il~~ii,;‘,:ii:::~~~~~~~~~~~~~:;:::::ii:i:~:li--:ii:lii”i:iii-~i:iiiti:l:i-iiiiii:ii~~,i~~~ii~~---~-:i::i’:iiiiii::::~ii~i::~ii:~ii~~~~iiii’ii:i-:ii:jif.i!”.B
..:~~~~i-::::c_:i:~i::~i--i:~:iii:-:~i:i~-i:::~-iiEii$ii::~~iiiii’if::‘:i_:i:-::‘::~:~, -ii:‘i::l~ii:i-:il:i~~~~:~~~~~~:~~~~~~~~:~~~~:~~:~:~~~~~~:~~~~~~~~~~ In :-:i,::i::,-:::--i,~::::iiii-~iiii::_:iiii.iiiiii”oi:i~~~~~~~~,~i~_:i:,:::::::::-::i--~:xi;i::i--:;:::-i::-::i::i:::-: i_::ii--:,-:i;i::i~i-~::~~i;i~::i ~_:~~~~~ ~~~~j~,::~ ~~:-i~,:i::,:_:--:::-i-i~~::-i:-l:ii:”.::i: --i:i:i:;:ii-::i:~iiii~~~~:~~~~:~:~~:~~~~~~~~~~~~~~~~~~~:~:-~:::- Zi i:i-i:i:~iliiii:iiii~i::iii-~iiii:iiiiii-ii::i:i~ii-i::iiii::~-:-:~li- i,-iiiiii‘i~.~iii.i~~~:-;i:i:iii~~~ii’:iiiliii:“: p! -
: -5
: IA
I 0 1 a 1 l I I 5 I 0 -3s I I 0 8 , :
0 tt I I I I I I
0 s z?l In 0 lo 0 zi 9 9 5 z 8 d 0 0 d 6 d
naawm ‘eaetl UO~IW~
5-16

The solids deposits on the hopper ridges in the back of the first and
second fields of the ESP may have been partially due to problems with the
first field double-dump valve. The first problem with this valve occurred
on October 29 when the rubber liner tore and a portion of this liner fell
into the valve throat, blocking the flow of solids from the hopper. The
blockage was removed without bringing the system down. Although no effect
was noted on the secondary voltage and current in the first field, the
solids in the hopper could have built up and contributed to the deposits on
the hopper ridge. Fortunately, the boiler came down with a tubeleak on
November 1 and this outage provided an opportunity to clean out the solids
deposits on the hopper ridges.
The screw conveyor that removes the solids from the first field hopper
failed and could not be reset on November 12. Since solids could not be
removed from the first field hopper during this period, the first field was
deenargized while the screw conveyor was repaired. A backing plate from
the first field double-dump valve was found to have fallen into the screw
conveyor and bound up the screw. This backing plate was removed and the
screw conveyor was returned to service.
However, with the first field deenergized, the inlet grain loading entering
the second field would have increased dramatically. This higher inlet
grain loading could have filled the second field hopper and led to solids
deposits on the hopper ridge below and behind the second field of the ESP.
The fact that this incident occurred in the same time frame that the
secondary current in the second field of the ESP dropped precipitously may
not be coincidental. No mass loading runs were completed around the ESP
on this day because of these problems and there is no data to confirm that
these problems were a contributor to the increased ESP emissions. However,
after the repairs had been made, the emission rate data f,rom the following
day, November 13, indicated that a "large" step change had occurred with
the emission rates substantially higher than the emission rates reported
immediately prior to the double-dump valve and screw conveyor problems.
The emission rates seemed to improve somewhat over the next 5 days.
5-17

PJBH CDeratiOn
The original plan was to start up the PJBH on Monday, November 7, and keep
it on-line during the final two weeks of the 2S-day GSA demonstration run.
The PJBH, which would be operating in the "in-parallel" mode, started up
and began operating as scheduled. However, after about 30 hours of
operation, the opacity in the CBR stack suddenly increased to unacceptable
levels and the tubesheet pressure dop in the PJBH dropped to a very low
level (less than 2 in. of water). The PJBH was taken off-line and remained
down for the remainder of the GSA demonstration run.
There we8 also a failure of the damper control motor et this time, which
confused the resolution of the PJBH problem. This motor failure turned out
to be unrelated to the cause of the high opacity, but had to be resolved
before the cause of the bag leaks could be discovered.
Eventually, the PJBH was opened up and inspected. The cause of the opacity
problem was readily apparent once the PJBH was opened up. The hopper was
full of solids, but more importantly the ends of a number of the acrylic
bags were missing. The inspection of these bags indicated that there was
scorch damage on those bags above where the fabric was missing. Thus, flue
gas from the ESP inlet containing 3-4 gr/acf of particulate8 was passing
through the PJBH into the CER stack. Since no spare bags were available, a
new set of acrylic bags was ordered and the PJBH demonstration run had to
be postponed until March 1994.
several of the damaged bags were sent to a consultant for failure analysis
and the operating data from the PJBH was analyzed in detail. Based on the
PJBH data and bag analyses, the tentative conclusion was that the bags had
been damaged by a small, smoldering-type fire in the PJBH hopper. There
were several observations that supported this unlikely conclusion. First,
several large, "football-size" lumps of solids were found in the PJBH
hopper, possibly indicating the presence of a fire. Second, a thermocouple
installed in the PJBH hopper had recorded a brief, high-temperature spike
(>l,OOO°F), which is indicative of a smoldaring-type fire moving past the
thermocouple. Third, the scorch damage on the bags was consistent with the
presence of a fire. Fourth, the flue gas temperature in the PJBH outlet
5-1s
duct, which is normally below that of the inlet flue gas (because of heat
losses in the PJBH and air inleakage), increased above the inlet flue gas
temperature at essentially the same time that the opacity in the CER stack
increased and the tubeshset pressure drop decreased.
This smoldering-type fire in the PJBH hopper "88 thought to be due to a
unique sat of circumstances that were unlikely to bo repeated. The "fuel"
for this smcldering fire was presumed to be the unburned carbon in the fly
ash that was present in the hopper. (The fly ash from Unit 9 contains high
levels of unburned carbon.) The PJBH had previously been operatad in the
fly-ash-only, "in-parallel" mode during the air toxic8 testing in mid-to-
late October and then had been taken off-line. Apparently these carbon-
laden fly ash particles had formed a bridge over the rotary valve in PJBH
hopper and remained in the hopper "drying out" during the two-week outage
prior to the restart of the PJBH on November 7.
With the heating up of the PJBH and the presence of oxygen from air
inleakage through the rotary valve in the bottom of the hopper, the dry
carbon on the flyash was assumed to undergo spontaneous combustion near the
bottom of the hopper. This "fire" gradually moved up through the material
in the hopper, forming the "football-size" lumps of solids and passing by
the thenaccouple. Once the fire reached the top of the solids in the
hopper, the concentration of unburned carbon decreased rapidly since these
top layers were laid down during the GSA demonstration run. Hcwever ,
before the fire had exhausted all of the fuel, the ends of about one-third
of the bags were burned. This would appear to indicate that the ends of
some of the bags had been buried in the solids in the PJBH hopper or were
very close to the surface, if not actually buried.
GSA svstem Insnection
After the 2S-day GSA demonstration run was successfully completed, the
system was shut down and inspected. The inspection of the GSA reactor
revealed solids buildup in the bottom section of the GSA reactor. The
buildup was located on the reactor walls approximately 6 ft above the
nosrle~and extended upward for about 7 ft. The buildup consisted of
"fingers" of material that pointed downward and inward toward the nozzle.
s-19

some of these fingers extended about one foot inward from the reactor wall.
The buildup was heaviest on the south and west walls of the reactor. In
addition to this heavier buildup, there was a light scaling on the bottom
lo-15 ft of the reactor wall that was about l/4 to l/2 in. thick.
some of the buildup had obviously fallen off the wall and was lying on the
turning vanes in the reactor inlet elbow. This material was very hard and
was removed after the inspection. Apparently some of these "fingers" had
broken off and then built back up during the run.
The BSP inspection revealed that in addition to the solids buildups on the
hopper ridges, which extended up into the space occupied by the first and
second field plates and wires, there were buildups on all of the horizontal
surfaces. Even the catwalks between some of the fields had up to one ft of
material built up. All of the discharge wires and collector plates in the
first two fields had a light scale of material. The collector plates in
the third and fourth fields had a heavier coating of solids. This was
probably due to the higher particulate loading entering these fields with
the very low secondary current levels in the first two fields during the
last two weeks of the demonstration run.
PJBH DEMONSTRATION RUN
Several operating and maintenance problems were encountered during the
14-day PJBH demonstration run, which had not been encountered previously.
The only problem of signficance was a lower-than-planned A/C level in the
PJBH during the last week of the run.
Low A/C Level
The PJBH demonstration run was interrupted during the second week because
of a coal supply problem. When additional supplies of the Andalex coal
became available, the GSA/PJBH system was restarted. The A/C in the PJBH
after the restart began at the design level of 4.0 acfm/ft2, but gradually
began to decline. After several days, the A/C had declined about 10 percent
to a level of 3.6 acfm/ft2.
s-20

The lower-than-planned A/C level "as found to be due to a high pressure
drop in the PJBH pilot plant system. Even with the louvor-type damper
upstream of PJBH ID fan in the fully-open position, the flue gas flow rate
decreased below the design level for the run. The suspicion "as that there
were deposits in the flue gas ductwork either in the inlet or the outlet
ductwork that caused this higher pressure drop in the PJBH system.
To overcome this problem, the setpaint to initiate the cleaning of the PJBB
was decreased from 5 in. to 4 in. of water. The cut-off for the cleaning
cycle was decreased from 4 in. to 3 in. of water. This reduction in the
tubesheet pressure drop allowed a return to the higher design flue gas flow
rate for the final day of the PJBH run.
Two-Fluid Nozzle
The suspected plugging in the PJBH ductwork "as thought to be due to the
upset condition that occurred after the boiler was switched to the low-
sulfur compliance coal. The GSA systsm initially rsmained on-line after
the coal switch. However, at the low-sulfur coal conditions, the ratio of
fly-ash-to-lime increased dramatically and operating problems were
encountered, which resulted in an upset condition in the reactor, and the
GSA system "as shut down. This upset condition may have resulted in damp
solids being deposited in the PJBH ductwork where they remained unnoticed
until the restart of the PJBH.
One other minor problem that "as noted during the PJBH demonstration run
"as that the alignment of the two-fluid nozzle in the reactor must be
checked periodically and adjusted, a8 necessary. During this PJBH run, a
problem was noted with both the clamps holding the lance and a worn gasket.
Fortunately, these problems were discovered and corrected during the low-
sulfur coal outage in the middle of this run.
5-21

First-Field Raiders
During the low-sulfur coal outage, the system was inspected and relatively
thick deposits were noted on the wires in the first field. The rapper
system for these emitter wires had apparently failed in early February
because of a sheared pin. This pin was replaced and the rappers were
reengaged to clean these wires. This repair led to a significant increase
in the average secondary current level in the first field.
s-22

Section 6
CONCLUSIONS AND RECOMMENDATIONS
The lo-MU GSA system at the CER Successfully achieved all of the major
objectives of the planned test program including:
1.
2.
3.
4.
5.
The GSA/ESP process demonstrated high SO2 removal efficiencies
(SO-90 percent) at modest Cc/S levels (1.30 moles Ca(OH)2/mole inlet
SO2) and a close approach-to-saturation temperature (SOP) when
treating flue gas resulting from the combustion of a 2.1 percent
sulfur, low-chloride (0.02-0.04 percent) coal during the factorial
tests;
The GSA/ESP process demonstrated high SO2 removal efficiencies
(90+ percent) at a modest Ca/S level (1.30 moles Ca(OH)2/mole inlet
SO2) and a higher approach-to-saturation temperature (lB°F] with
slightly higher levels of chlorine in the coal (0.12 percent) during
the factorial tests;
The GSAjESP process had very low particulate emission rates, i.e.,
well below the NSPS for particulates, when a four-field ESP with an
SCA > 440 ft2/kacfm was used for particulate control;
The GSA/PJBH had a very low particulate emission rate, i.e., well
below the NSPS when operating at an A/C level of 4.0 acfm/ft2.
A 2S-day, continuous, GSA demonstration run was successfully
completed. During this run the GSA/ESP system averaged 90+ percent
SO2 removal efficiency, even when the boiler was switched to a
higher sulfur coal. The ESP emission rate remained below the NSPS for
particulate6 (0.03 lb/XBtu) throughout the run, although the
particulate emissions increased somewhat after about two weeks of
operation, but then steadied out at about 0.015 lb/MBtu, i.e.,
one-half the NSPS level. The GSA/ESP system also demonstrated its

reliability by remaining on-line, achieving both the, SO2 and
particulate removal requirements during the entire 28-day period that
the boiler was operating.
6. A 14-day, continuous, PJBH demonstration run was successfully
completed. During this run the GSA/PJBH system average 96+ percent
SO2 removal efficiency. [The SO2 rsmoval efficiency in the
GSA/ESP system averaged 91 percent during this run.) The PJBH
emission rate was about one order of magnitude below the NSPS for
particulate during this run. The GSA/PJBH demonstrated its
reliability by remaining on-line, achieving both the SO2 and
particulate removal requirements during the entire 14-day period that
the boiler was burning the design coal.
In addition to these conclusions related to the major objectives of the GSA
program, several other conclusions were apparent during the GSA testing at
the CER.
1.
2.
3.
4.
Most of the SO2 removal efficiency occurs in the reactor/cyclone
with relatively low SO2 removals (2-8 percentage points) in the
particulate control device. The SO2 removal efficiency was lower in
the ESP than in the PJBH, as was expected.
The enhanced mass and heat transfer characteristics of the reactor
allow these high SO2 removal efficiencies to be achieved at a very
low flue gas residence time without incurring operating problems. The
reactor also operates at a high flue gas velocity (20-25 ft/sec).
The expected enhancing effect of chlorine on the SO2 removal
efficiency in the GSA/ESP process was documented. Even modest coal
chloride levels (0.12 percent), which are typical of many coals, can
provide this effect;
The SO2 removal efficiency in the GSA/PJBH system was typically
about 3-5 percentage points higher than that achieved in the GSA/ESP
system at the same test conditions;
6-2

1 5. The GSA system produces a by-product material containing very low
moisture levels. This material contains both fly ash and unreacted
lime and thus, with the addition of water, undergoes a pozzolanic
reaction and can be disposed of in a landfill.
6. The GSA system has no wet/dry interface and the entire system is
fabricated from carbon steel rather than high-cost alloy material; and
6-3

SECTION 7
RBFEBENCES
(1) T. A. Burnett. "Sumnary of the Tennessee Valley Authority Flue Gas
Deaulfurization Research and Developnent Program (1969 to 1991),"
Tennessee Valley Authority, Chattanooga, Tennessee (1991).
(2) I,. R. Humphries, et.al., "lo-MW Spray Dryer/ESP Pilot Plant Test
Program -- High-Sulfur Coal Test Phase (Phase III)," Tennessee Valley
Authority, Chattanooga, Tennessee (1988).
(3) T. A. Burnett, et.al., "IO-MW Spray Dryer/ESP Pilot Plant Test
Program -- Medium-Sulfur Coal Basic Evaluations (Phase IV),"
Tennessee Valley Authority, Chattanooga, Tennessee (1990).
(4) F. E. Hsu, Draft Report prepared for the U.S. Department of Energy,
AirPol, Inc., Teterboro, New Jersey (1994).
(5) G. A. England, et.al., "Air Toxics Removals for the AitPol GSA
Process," Environmental and Energy Research Corporation, Windsor,
Ontario (1994).