lkq second quarter 2016 earnings call presentation
TRANSCRIPT

LKQ Blue0 | 85 | 180
LKQ Green176 | 186 | 31
Keystone Gold255 | 188 | 31
KeyKool SecondaryBlue137 | 173 | 219
KeyKoolTertiary Blue216 | 232 | 241
PicKYourPart Oraange211 | 77 | 30
HDTruck Red210 | 35 | 42
LKQ Silver132 | 137 | 140
LKQ Gray62 | 70 | 70
Second Quarter 2016 Earnings CallJuly 28, 2016
Rob Wagman – President & Chief Executive OfficerNick Zarcone – Executive Vice President & Chief Financial Officer
Joe Boutross – Director, Investor Relations
LKQ Blue0 | 85 | 180
LKQ Green176 | 186 | 31
Keystone Gold255 | 188 | 31
KeyKool SecondaryBlue137 | 173 | 219
KeyKoolTertiary Blue216 | 232 | 241
PicKYourPart Oraange211 | 77 | 30
HDTruck Red210 | 35 | 42
LKQ Silver132 | 137 | 140
LKQ Gray62 | 70 | 70
1
Forward Looking Statements
Statements and information included in this presentation that are not purely historical are forward-looking statements within the meaning of the Private Securities Litigation Reform Act of 1995 and aremade pursuant to the “safe harbor” provisions of such Act.
Forward-looking statements include, but are not limited to statements regarding our expectations,intentions, beliefs and strategies regarding the future and are subject to a number of risks anduncertainties. Actual results may differ materially from our forward-looking information.
All forward-looking statements we make are based on information available to us at the time thestatements are made, and we assume no obligation to update any forward-looking statements, exceptas may be required by law. The risks and uncertainties that could cause actual results to differ fromthe results predicted or implied by our forward-looking statements include risks and uncertaintiesincluded under the captions “Risk Factors” and “Management’s Discussion and Analysis of FinancialCondition and Results of Operations” in our Annual Report on Form 10-K for the year ended December31, 2015 and in our subsequent Quarterly Reports on Form 10-Q. These reports are available on ourinvestor relations website at lkqcorp.com and on the SEC website at sec.gov.

LKQ Blue0 | 85 | 180
LKQ Green176 | 186 | 31
Keystone Gold255 | 188 | 31
KeyKool SecondaryBlue137 | 173 | 219
KeyKoolTertiary Blue216 | 232 | 241
PicKYourPart Oraange211 | 77 | 30
HDTruck Red210 | 35 | 42
LKQ Silver132 | 137 | 140
LKQ Gray62 | 70 | 70
2
Mission Statement
To be the leading global value-addeddistributor of vehicle parts and accessories
by offering our customers the mostcomprehensive, available and cost effective
selection of part solutions while buildingstrong partnerships with our employees and
the communities in which we operate.

LKQ Blue0 | 85 | 180
LKQ Green176 | 186 | 31
Keystone Gold255 | 188 | 31
KeyKool SecondaryBlue137 | 173 | 219
KeyKoolTertiary Blue216 | 232 | 241
PicKYourPart Oraange211 | 77 | 30
HDTruck Red210 | 35 | 42
LKQ Silver132 | 137 | 140
LKQ Gray62 | 70 | 70
3
Revenue*
$4,400
$4,200
$4,000
$3,800
$3,600
$3,400
$3,200
$3,000YTD 2015 YTD 2016
$3,612
$4,372
Consolidated Results
Q2 2016
* Revenue in millions
• Organic growth of parts and services revenue of 5.4%• Net income $140.7 million Q2 2016 vs. $119.7 million Q2 2015 • Segment EBITDA Margin** 13.0% Q2 2016 vs. 12.7% Q2 2015
33.3%
Revenue*
$2,600
$2,400
$2,200
$2,000
$1,800
$1,600Q2 2015 Q2 2016
$1,838
$2,451
21.0%
** Refer to Segment EBITDA reconciliation on page 31
Q2 2015 Q2 2016
$0.60
$0.55
$0.50
$0.45
$0.40
$0.35
$0.30Diluted EPS Adjusted
Diluted EPS
$0.39$0.41
$0.46
$0.55
YTD 2016
YTD 2015 YTD 2016
$1.00
$0.95
$0.90
$0.85
$0.80
$0.75
$0.70
$0.65Diluted EPS Adjusted
Diluted EPS
$0.74
$0.79$0.81
$0.97
• Organic growth of parts and services revenue of 5.8%• Net income $248.5 million YTD 2016 vs. $226.8 million YTD 2015 • Segment EBITDA Margin** 12.7% YTD 2016 vs. 12.6% YTD 2015
34.1%17.9% 22.8%
9.5%
LKQ Blue0 | 85 | 180
LKQ Green176 | 186 | 31
Keystone Gold255 | 188 | 31
KeyKool SecondaryBlue137 | 173 | 219
KeyKoolTertiary Blue216 | 232 | 241
PicKYourPart Oraange211 | 77 | 30
HDTruck Red210 | 35 | 42
LKQ Silver132 | 137 | 140
LKQ Gray62 | 70 | 70
4
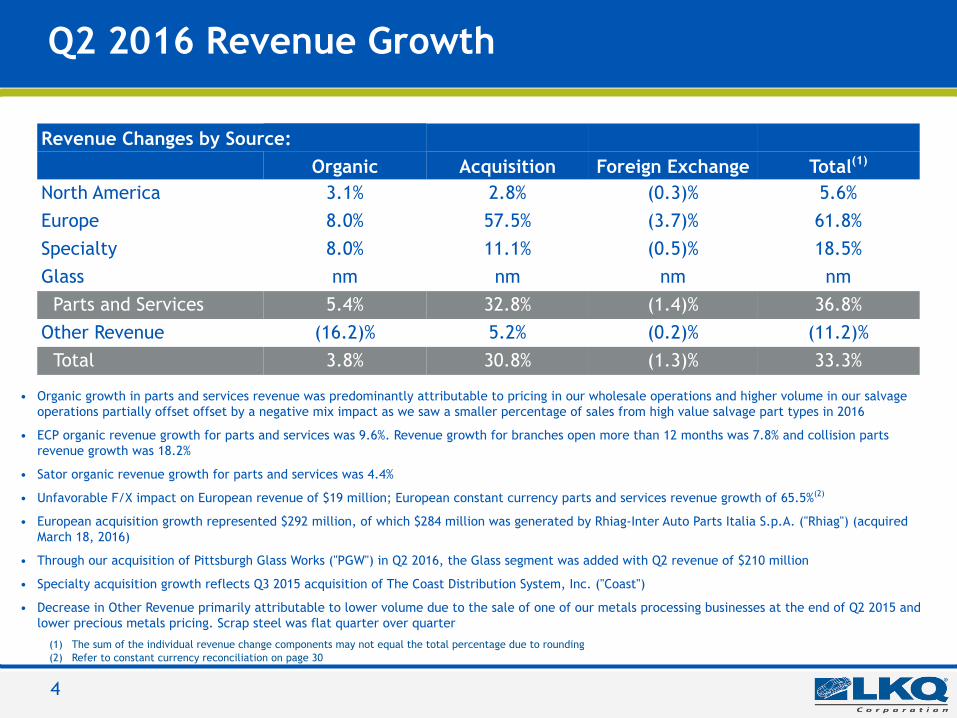
Q2 2016 Revenue Growth
• Organic growth in parts and services revenue was predominantly attributable to pricing in our wholesale operations and higher volume in our salvageoperations partially offset offset by a negative mix impact as we saw a smaller percentage of sales from high value salvage part types in 2016
• ECP organic revenue growth for parts and services was 9.6%. Revenue growth for branches open more than 12 months was 7.8% and collision partsrevenue growth was 18.2%
• Sator organic revenue growth for parts and services was 4.4%
• Unfavorable F/X impact on European revenue of $19 million; European constant currency parts and services revenue growth of 65.5%(2)
• European acquisition growth represented $292 million, of which $284 million was generated by Rhiag-Inter Auto Parts Italia S.p.A. ("Rhiag") (acquiredMarch 18, 2016)
• Through our acquisition of Pittsburgh Glass Works ("PGW") in Q2 2016, the Glass segment was added with Q2 revenue of $210 million
• Specialty acquisition growth reflects Q3 2015 acquisition of The Coast Distribution System, Inc. ("Coast")
• Decrease in Other Revenue primarily attributable to lower volume due to the sale of one of our metals processing businesses at the end of Q2 2015 andlower precious metals pricing. Scrap steel was flat quarter over quarter
(1) The sum of the individual revenue change components may not equal the total percentage due to rounding
Revenue Changes by Source:Organic Acquisition Foreign Exchange Total(1)
North America 3.1% 2.8% (0.3)% 5.6%Europe 8.0% 57.5% (3.7)% 61.8%Specialty 8.0% 11.1% (0.5)% 18.5%Glass nm nm nm nm
Parts and Services 5.4% 32.8% (1.4)% 36.8%Other Revenue (16.2)% 5.2% (0.2)% (11.2)%
Total 3.8% 30.8% (1.3)% 33.3%
(2) Refer to constant currency reconciliation on page 30

LKQ Blue0 | 85 | 180
LKQ Green176 | 186 | 31
Keystone Gold255 | 188 | 31
KeyKool SecondaryBlue137 | 173 | 219
KeyKoolTertiary Blue216 | 232 | 241
PicKYourPart Oraange211 | 77 | 30
HDTruck Red210 | 35 | 42
LKQ Silver132 | 137 | 140
LKQ Gray62 | 70 | 70
5
YTD 2016 Revenue Growth
• Organic growth in parts and services revenue was attributable to similar changes in volume and price. Sales volumes increased in our wholesaleoperations resulting from improved fill rates and in-stock rates while prices increased in our wholesale operations, primarily in our salvageoperations, as a result of shifting our salvage vehicle purchasing to higher quality vehicles
• ECP organic revenue growth for parts and services was 8.5%. Revenue growth for branches open more than 12 months was 6.8% and collision partsrevenue growth was 16.8%
• Sator organic revenue growth for parts and services was 5.2%
• Unfavorable F/X impact on European revenue of $41 million; European constant currency parts and services revenue growth of 41.7%(2)
• European acquisition growth represented $340 million, of which $318 million was generated by Rhiag (acquired March 18, 2016)
• Through our acquisition of PGW in Q2 2016, the glass segment was added with Q2 revenue of $210 million
• Specialty acquisition growth reflects Q3 2015 acquisition of Coast
• Decrease in Other Revenue primarily attributable to lower volume due to the sale of one of our metals processing businesses at the end of Q2 2015and lower precious metals pricing. Scrap steel prices were 17% lower YOY in YTD 2016
(1) The sum of the individual revenue change components may not equal the total percentage due to rounding
Revenue Changes by Source:Organic Acquisition Foreign Exchange Total(1)
North America 4.0% 3.0% (0.5)% 6.4%Europe 7.5% 34.2% (4.1)% 37.6%Specialty 9.3% 10.3% (0.6)% 19.0%Glass nm nm nm nm
Parts and Services 5.8% 19.7% (1.6)% 23.9%Other Revenue (20.6)% 5.2% (0.2)% (15.6)%
Total 3.9% 18.6% (1.5)% 21.0%
(2) Refer to constant currency reconciliation on page 30

LKQ Blue0 | 85 | 180
LKQ Green176 | 186 | 31
Keystone Gold255 | 188 | 31
KeyKool SecondaryBlue137 | 173 | 219
KeyKoolTertiary Blue216 | 232 | 241
PicKYourPart Oraange211 | 77 | 30
HDTruck Red210 | 35 | 42
LKQ Silver132 | 137 | 140
LKQ Gray62 | 70 | 70
6
Q2 2016 Operating Highlights
Europe• In early Q2, we issued €500 million of 8 year senior notes priced at 3. 875% (previously announced)
• ECP opened 7 new branches in Q2 including further expansion into Northern Ireland. During Q2, ECP’s Ecommerce platform introduced expandedordering capabilities for our customers, incorporating available stock via hub & central facilities into local collection abilities
• ECP's new national distribution center (Tamworth 2) continues to progress on plan. While we are only able to use a small portion, we recognized rent& other property costs during Q2 with costs of approximately £2.2 million ($3.2 million)
• Britain’s referendum resulted in a vote for the country to leave the European Union. The Pound Sterling fell against the dollar approximately 10% andthe Euro was weaker by approximately 2% from the day the referendum was passed on June 23rd to quarter end. The timetable and exact impact isunclear. We anticipate it will have unfavorable currency translation impact in the second half of the year
Specialty• Continued strong organic year-over-year growth throughout Q2 largely due to expansion of delivery routes / days as we integrate Coast business into
our delivery fleet, coupled with expanded warehouse service levels and inventory throughout the country
• New automotive & RV unit sales continue favorable year-over-year growth trends, further fueling organic revenue
• Six additional Coast distribution centers were integrated as of June 30, 2016, and only 4 of the 17 original Coast warehouses are in operation
• Oregon Distribution Center closed June 2016, as our Washington State Distribution Center became fully operational in Q1
North America• Roadnet routing software installed in 80% of North American fleet representing over 3,400 vehicles. Currently tracking over 285,000 miles & 42,000 deliveries
daily. On target to be fully installed & utilized by year-end
• Increased outbound calls from 17.2 per day/per sales rep to 18 in Q2, a 4.7% increase over Q1
• Initiative started to review all of our cross-docks to improve turnaround time & minimize damaged product (70% of our product flows through a cross dock)
Glass• On April 21, 2016, LKQ acquired PGW, a leading global distributor and manufacturer of automotive glass products. The acquisition will expand our
addressable market in North America and globally

LKQ Blue0 | 85 | 180
LKQ Green176 | 186 | 31
Keystone Gold255 | 188 | 31
KeyKool SecondaryBlue137 | 173 | 219
KeyKoolTertiary Blue216 | 232 | 241
PicKYourPart Oraange211 | 77 | 30
HDTruck Red210 | 35 | 42
LKQ Silver132 | 137 | 140
LKQ Gray62 | 70 | 70
7
Inventory
• We believe aftermarket inventory levels are sufficient to achieve our growth targets
• Inventory purchases for Rhiag totaled $242M and $263M for Q2 and YTD periods
• Total procurement reflects $167 million glass inventory purchases made between April 21 and June 30,2016 as a result of our April 2016 acquisition of PGW. The amount includes purchases of raw materialsused in PGW's manufacturing and fabrication of automotive glass products as well as purchases ofaftermarket and refurbished automotive replacement glass and assemblies.
• Compared to the the prior year period, we increased our purchases of lower cost self service and"crush only" cars. Prices for these vehicles have come down in certain markets due to the decline inthe prices of scrap and other metals allowing us to purchase higher quality vehicles at favorable prices
• Average cost per vehicle in our full service salvage operations was $1,996, which is a 2.7% increaseYOY
Inventory Procurement: Q2 YTD($ in millions, Cars purchased in 000s) 2016 2015 % Change 2016 2015 % ChangeTotal procurement $1,232 $698 76.5% $2,054 $1,389 47.9%Wholesale salvage cars and trucks 72 75 (2.9)% 144 145 (0.7)%
Europe Wholesale salvage cars and trucks 6 5 20.0% 12 11 9.1%
Self service and "crush only" cars 138 131 5.3% 263 231 13.9%

LKQ Blue0 | 85 | 180
LKQ Green176 | 186 | 31
Keystone Gold255 | 188 | 31
KeyKool SecondaryBlue137 | 173 | 219
KeyKoolTertiary Blue216 | 232 | 241
PicKYourPart Oraange211 | 77 | 30
HDTruck Red210 | 35 | 42
LKQ Silver132 | 137 | 140
LKQ Gray62 | 70 | 70
8
Acquisition Activity
Europe• In Q1, we acquired Rhiag which expands LKQ's geographic presence in continental Europe. Additionally,
we acquired a small distributor in the Netherlands in Q2. The vast majority of the acquired TTMrevenue in Europe relates to Rhiag.
Glass• On April 21, 2016, LKQ acquired PGW, a leading global distributor and manufacturer of automotive
glass products. PGW’s business comprises wholesale and retail distribution services, automotive glassmanufacturing, and retailer alliance partnerships. The acquisition will expand our addressable marketin North America and globally. LKQ created a new reportable segment subsequent to the acquisition(Glass Segment).
* Approximate TTM Revenue as of acquisition date
Number of Q2Acquisitions
TTMRevenue*
Number of YTDAcquisitions
TTMRevenue*
North America — — — —
Europe 1 $4.0 million 3 $1.0 billionSpecialty — — — —
Glass 1 $1.1 billion 1 $1.1 billionTotal 2 $1.1 billion 4 $2.1 billion

LKQ Blue0 | 85 | 180
LKQ Green176 | 186 | 31
Keystone Gold255 | 188 | 31
KeyKool SecondaryBlue137 | 173 | 219
KeyKoolTertiary Blue216 | 232 | 241
PicKYourPart Oraange211 | 77 | 30
HDTruck Red210 | 35 | 42
LKQ Silver132 | 137 | 140
LKQ Gray62 | 70 | 70
Financial Results
LKQ Blue0 | 85 | 180
LKQ Green176 | 186 | 31
Keystone Gold255 | 188 | 31
KeyKool SecondaryBlue137 | 173 | 219
KeyKoolTertiary Blue216 | 232 | 241
PicKYourPart Oraange211 | 77 | 30
HDTruck Red210 | 35 | 42
LKQ Silver132 | 137 | 140
LKQ Gray62 | 70 | 70
10
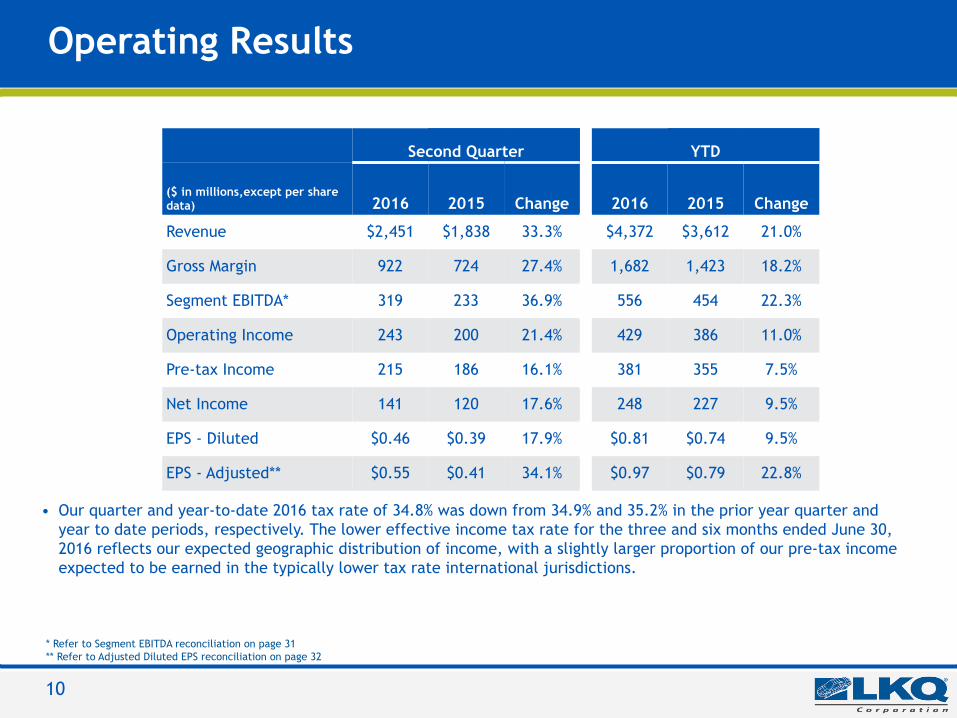
Operating Results
• Our quarter and year-to-date 2016 tax rate of 34.8% was down from 34.9% and 35.2% in the prior year quarter andyear to date periods, respectively. The lower effective income tax rate for the three and six months ended June 30,2016 reflects our expected geographic distribution of income, with a slightly larger proportion of our pre-tax incomeexpected to be earned in the typically lower tax rate international jurisdictions.
Second Quarter YTD
($ in millions,except per sharedata) 2016 2015 Change 2016 2015 Change
Revenue $2,451 $1,838 33.3% $4,372 $3,612 21.0%
Gross Margin 922 724 27.4% 1,682 1,423 18.2%
Segment EBITDA* 319 233 36.9% 556 454 22.3%
Operating Income 243 200 21.4% 429 386 11.0%
Pre-tax Income 215 186 16.1% 381 355 7.5%
Net Income 141 120 17.6% 248 227 9.5%
EPS - Diluted $0.46 $0.39 17.9% $0.81 $0.74 9.5%
EPS - Adjusted** $0.55 $0.41 34.1% $0.97 $0.79 22.8%
* Refer to Segment EBITDA reconciliation on page 31** Refer to Adjusted Diluted EPS reconciliation on page 32

LKQ Blue0 | 85 | 180
LKQ Green176 | 186 | 31
Keystone Gold255 | 188 | 31
KeyKool SecondaryBlue137 | 173 | 219
KeyKoolTertiary Blue216 | 232 | 241
PicKYourPart Oraange211 | 77 | 30
HDTruck Red210 | 35 | 42
LKQ Silver132 | 137 | 140
LKQ Gray62 | 70 | 70
11
(as a % of Revenue)Q2
2016Q2
2015ChangeF/(U) QTD Commentary
Revenue 100.0% 100.0% —%
Gross Margin 37.6% 39.4% (1.8)%Reflects unfavorability of 1.8% and 0.7% from our PGW and Rhiag acquisitions, respectively. The 1.8%reduction in gross margin for PGW also reflects a one-time inventory step-up adjustment recorded uponacquisition, which reduced consolidated gross margin for the quarter by 0.4%. Excluding the acquisitions, thegross margin our historical North American, European and Specialty businesses collectively increased 70 bps
Facility and WarehouseExpenses 7.3% 7.4% 0.1%
The change in facilities and warehouse expense reflects a decrease of 0.5% and 0.3% from our acquisitions ofPGW and Rhiag, respectively, which have lower facility and warehouse expenses as a percentage of revenuethan our other operations. These decreases are offset by an increase in Europe for the facility costsassociated with the partly operational Tamworth, England distribution facility and an increase in NorthAmerica due to the realignment of plant manager responsibilities from SG&A to facilities and warehouseexpense as part of organizational changes.
Distribution Expenses 7.5% 8.2% 0.7% The change in distribution expense reflects a positive impact of 0.3% from both our acquisition of PGWand Rhiag, which have lower distribution expenses as a percentage of revenue than our other operations.
Selling, General andAdministrative Expenses 10.4% 11.2% 0.8%
The change reflects a 0.6% decrease in expense from our acquisition of PGW, which has lower selling,general and administrative expenses as a percentage of revenue than our other operations and adecrease of in expense from our North America operations due to the realignment previously discussed
Restructuring andAcquisition RelatedExpenses
0.4% 0.1% (0.3)% Restructuring costs primarily related to integration activities in Specialty and Wholesale North Americasegments; acquisition costs mostly related to completed acquisitions of Rhiag and PGW
Depreciation andAmortization
2.1% 1.6% (0.5)% The increase in depreciation expense was a result of increased levels of property, plant and equipment tosupport our acquisition and organic related growth
Operating Income 9.9% 10.9% (1.0)%
Segment EBITDA* 13.0% 12.7% 0.3% Includes 50 bps benefit related to non-cash expense for the PGW inventory step-up and depreciationcapitalized in COGS
Q2 2016 Consolidated Margins
Note: In the table above, the sum of the individual percentages may not equal the total due to rounding* Refer to segment EBITDA reconciliation on page 31. Segment EBITDA is a measure of segment profitability. Refer to individual segment slides for drivers of Segment EBITDA.

LKQ Blue0 | 85 | 180
LKQ Green176 | 186 | 31
Keystone Gold255 | 188 | 31
KeyKool SecondaryBlue137 | 173 | 219
KeyKoolTertiary Blue216 | 232 | 241
PicKYourPart Oraange211 | 77 | 30
HDTruck Red210 | 35 | 42
LKQ Silver132 | 137 | 140
LKQ Gray62 | 70 | 70
12
(as a % of Revenue)
YTD2016
YTD2015
ChangeF/(U) YTD Commentary
Revenue 100.0% 100.0% —%
Gross Margin 38.5% 39.4% (0.9)%
Reflects unfavorability of 1.0% and 0.4% from our PGW and Rhiag acquisitions, respectively. The 1.0% decreasein gross margin related to PGW includes the impact of a one-time inventory step-up adjustment recordedupon acquisition, which reduced consolidated gross margin for the quarter by 0.2%. This negative impact waspartially offset by an increase in gross margin of 0.5% related to our North America segment, primarily in ourself service operations
Facility and WarehouseExpenses 7.7% 7.4% (0.3)%
The majority of the increase relates to (i) realignment of plant manager responsibilities from SG&A tofacilities and warehouse expense in North America as part of organizational changes and the (ii) facility costsrelated to our new Tamworth distribution center in Europe, partially offset by decreases from our acquisitionsof PGW and Rhiag, respectively, which have lower operating expenses as a percentage of revenue than ourother operations
Distribution Expenses 7.7% 8.1% 0.4% The decrease primarily relates to improvements of 0.2% and 0.1% from our acquisitions of Rhiag and PGW,respectively, which have lower distribution expenses than our other operations.
Selling, General andAdministrative Expenses 10.8% 11.3% 0.5%
The decrease relates to an improvement of 0.3% from our acquisition of PGW, which has lower selling,general, and administrative expenses than our prior year consolidated selling, general and administrativeexpenses. The remaining improvement comes from our North America segment as a result of the realignmentdiscussed above
Restructuring andAcquisition RelatedExpenses
0.5% 0.2% (0.3)% Restructuring costs primarily related to integration activities in Specialty and Wholesale North Americasegments; acquisition costs mostly related to completed acquisitions of Rhiag and PGW
Depreciation andAmortization 1.9% 1.6% (0.3)%
The increase in depreciation expense was a result of increased levels of property, plant and equipment tosupport our acquisition and organic related growth, partially offset by a decline attributable to the impact offoreign exchange rates
Operating Income 9.8% 10.7% (0.9)%
Segment EBITDA* 12.7% 12.6% 0.1% Includes 30 bps benefit related to non-cash expense for the PGW inventory step-up and depreciationcapitalized in COGS and 10 bps benefit on non-operating income
YTD 2016 Consolidated Margins
Note: In the table above, the sum of the individual percentages may not equal the total due to rounding* Refer to segment EBITDA reconciliation on page 31. Segment EBITDA is a measure of segment profitability. Refer to individual segment slides for drivers of Segment EBITDA

LKQ Blue0 | 85 | 180
LKQ Green176 | 186 | 31
Keystone Gold255 | 188 | 31
KeyKool SecondaryBlue137 | 173 | 219
KeyKoolTertiary Blue216 | 232 | 241
PicKYourPart Oraange211 | 77 | 30
HDTruck Red210 | 35 | 42
LKQ Silver132 | 137 | 140
LKQ Gray62 | 70 | 70
13
Components of Quarterly Revenue
• A large portion of change in margins on aconsolidated basis is attributable to change inrevenue mix
• North America historically has highest Grossmargins and EBITDA margins
• Increase in QTD revenue as a % of consolidatedrevenue for our European businesses reflectsthe acquisition of Rhiag
• The Glass revenue relates to revenue from ouracquisition of PGW in Q2 2016
• Other Revenue continues to become a lowerpercentage of total revenue as we grow ourother lines of business
NA Europe
Specialty Glass
Other Revenue
100.0%
80.0%
60.0%
40.0%
20.0%
0.0%
Q2 2016 Q2 2015 YTD 2016 YTD 2015
39.3%49.6%
44.6%50.7%
33.6%
27.7%31.3%
27.5%
13.7%15.4% 14.3%
14.5%
8.6% 4.8%4.8% 7.3% 5.0% 7.3%
$1.84B $3.61B$2.45B $4.37B

LKQ Blue0 | 85 | 180
LKQ Green176 | 186 | 31
Keystone Gold255 | 188 | 31
KeyKool SecondaryBlue137 | 173 | 219
KeyKoolTertiary Blue216 | 232 | 241
PicKYourPart Oraange211 | 77 | 30
HDTruck Red210 | 35 | 42
LKQ Silver132 | 137 | 140
LKQ Gray62 | 70 | 70
14
North America – Q2 2016 Results
North America Segment EBITDA Margin Bridge
Gross Margin
Segment EBITDA Margin
% of Revenue
($ in millions) 2016 2015 Change 2016 2015
Total Revenue $1,081 $1,045 3.4%
Gross Margin $477 $443 7.5% 44.1% 42.4%
Operating Expenses $314 $306 2.6% 29.1% 29.4%
Segment EBITDA* $164 $139 18.0% 15.2% 13.3%
Note: In the table above, the sum of the individual percentages may not equal the total due to rounding
15.5%
14.5%
13.5%
12.5%
11.5%
10.5%
Q2 2015 Gross Margin Fuel FacilityExpenses
Freight Other Q2 2016
13.3%
1.7% 0.2% 0.2%
(0.3)%
0.1% 15.2%
44.0%
42.0%
40.0%
Q1-15
Q2-15
Q3-15
Q4-15
Q1-16
Q2-16
42.7%
42.4% 42.2%
43.2%42.7%
44.1%
15.5%
14.7%
13.9%
13.1%
12.3%
11.5%
Q1-15
Q2-15
Q3-15
Q4-15
Q1-16
Q2-16
14.3%
13.3%
12.4%
12.8%
13.6%
15.2%
*Refer to segment EBITDA reconciliation on page 31

LKQ Blue0 | 85 | 180
LKQ Green176 | 186 | 31
Keystone Gold255 | 188 | 31
KeyKool SecondaryBlue137 | 173 | 219
KeyKoolTertiary Blue216 | 232 | 241
PicKYourPart Oraange211 | 77 | 30
HDTruck Red210 | 35 | 42
LKQ Silver132 | 137 | 140
LKQ Gray62 | 70 | 70
15
North America – YTD 2016 Results
North America Segment EBITDA Margin Bridge
% of Revenue
($ in millions) 2016 2015 Change 2016 2015
Total Revenue $2,168 $2,091 3.7%
Gross Margin $941 $890 5.8% 43.4% 42.6%
Operating Expenses $634 $604 5.0% 29.3% 28.9%
Segment EBITDA* $311 $288 8.0% 14.4% 13.8%
16.0%15.0%14.0%13.0%12.0%11.0%10.0%
YTD 2015 Gross Margin PersonnelExpenses
Freight Fuel Other YTD 2016
13.8%0.8%
(0.4)% (0.2)%
0.2% 0.2% 14.4%
*Refer to segment EBITDA reconciliation on page 31
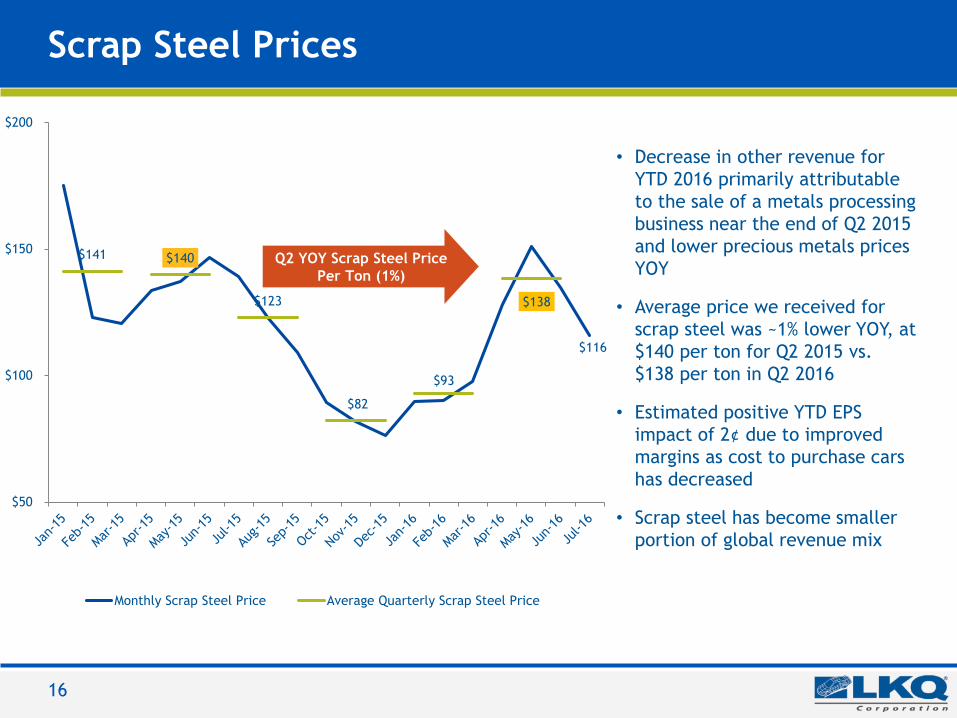
Scrap Steel Prices
• Decrease in other revenue for
YTD 2016 primarily attributable
to the sale of a metals processing
business near the end of Q2 2015
and lower precious metals prices
YOY
• Average price we received for
scrap steel was ~1% lower YOY, at
$140 per ton for Q2 2015 vs.
$138 per ton in Q2 2016
• Estimated positive YTD EPS
impact of 2¢ due to improved
margins as cost to purchase cars
has decreased
• Scrap steel has become smaller
portion of global revenue mix
16
Q2 YOY Scrap Steel Price
Per Ton (1%)
$116
$141 $140
$123
$82
$93
$138
$50
$100
$150
$200
Monthly Scrap Steel Price Average Quarterly Scrap Steel Price

LKQ Blue0 | 85 | 180
LKQ Green176 | 186 | 31
Keystone Gold255 | 188 | 31
KeyKool SecondaryBlue137 | 173 | 219
KeyKoolTertiary Blue216 | 232 | 241
PicKYourPart Oraange211 | 77 | 30
HDTruck Red210 | 35 | 42
LKQ Silver132 | 137 | 140
LKQ Gray62 | 70 | 70
17
Europe – Q2 2016 Results
Europe Segment EBITDA Margin Bridge
Gross Margin
Segment EBITDA Margin
% of Revenue
($ in millions) 2016 2015 Change 2016 2015
Total Revenue $824 $510 61.6%
Gross Margin $308 $193 59.6% 37.4% 37.9%
Operating Expenses $218 $138 57.7% 26.5% 27.1%
Segment EBITDA* $90 $54 66.8% 10.9% 10.6%
ECP Branches 206 194 12
Sator Branches 87 71 16
Note: In the table above, the sum of the individual percentages may not equal the total due to rounding
14.0%
13.0%
12.0%
11.0%
10.0%
9.0%
8.0%
Q2 2015 GrossMargin
RhiagExpenses
SG&AExpenses
F&WExpenses
Other Q2 2016
10.6%
(0.5)%
1.7%0.4%
(1.4)%
0.1% 10.9%
40.0%
38.0%
36.0%
34.0%
Q1-15
Q2-15
Q3-15
Q4-15
Q1-16
Q2-16
37.0%
37.9%38.3%
38.9%
38.1%37.4%
12.0%
10.0%
8.0%
6.0%
Q1-15
Q2-15
Q3-15
Q4-15
Q1-16
Q2-16
9.5%
10.6%
10.3%9.7%
10.5%10.9%
*Refer to segment EBITDA reconciliation on page 31

LKQ Blue0 | 85 | 180
LKQ Green176 | 186 | 31
Keystone Gold255 | 188 | 31
KeyKool SecondaryBlue137 | 173 | 219
KeyKoolTertiary Blue216 | 232 | 241
PicKYourPart Oraange211 | 77 | 30
HDTruck Red210 | 35 | 42
LKQ Silver132 | 137 | 140
LKQ Gray62 | 70 | 70
18
Europe – YTD 2016 Results
Europe Segment EBITDA Margin Bridge
% of Revenue
($ in millions) 2016 2015 Change 2016 2015Total Revenue $1,371 $997 37.5%
Gross Margin $517 $374 38.3% 37.7% 37.6%
Operating Expenses $371 $270 36.9% 27.0% 27.2%
Segment EBITDA* $147 $100 46.8% 10.8% 10.1%
ECP Branches 206 194 12
Sator Branches 87 71 16
Note: In the table above, the sum of the individual percentages may not equal the total due to rounding
12.0%
11.0%
10.0%
9.0%
8.0%
7.0%
YTD 2015 GrossMargin
RhiagOperatingExpenses
F&WExpenses
Other YTD 2016
10.1% 0.1%
1.1%
(0.9)%
0.4% 10.8%
*Refer to segment EBITDA reconciliation on page 31

Foreign Exchange
• £ down 6% Q2 2016 vs. Q2 2015
– UK referendum to leave the EU
had a minor impact on Q2 2016
average rate as sharp decline in
GBP occurred late in the quarter
• € up 2% Q2 2016 vs. Q2 2015
• Translation impact of stronger
dollar on Europe revenue growth:
– Q2: $(19) million
– YTD: $(41) million
• Europe constant currency parts
and services revenue growth**:
– Q2: 65.5%
– YTD: 41.7%
• Estimated currency impact on
EPS growth*:
– Q2: 1¢ negative impact
– YTD: 1.5¢ negative impact
19
* Reflects the combined impact of all currencies on consolidated EPS growth (all segments); charts and revenue figures above include reflect only GBP and EUR currencies related
to Europe segment
$1.33
$1.11
$1.52$1.53
$1.13$1.11
$1.55
$1.11
$1.52
$1.09
$1.43
$1.10
$1.44
$1.13
$0.95
$1.05
$1.15
$1.25
$1.35
$1.45
$1.55
$1.65
Monthly $/£ Monthly $/€ Quarterly Average
** Refer to constant current reconciliation on page 30

LKQ Blue0 | 85 | 180
LKQ Green176 | 186 | 31
Keystone Gold255 | 188 | 31
KeyKool SecondaryBlue137 | 173 | 219
KeyKoolTertiary Blue216 | 232 | 241
PicKYourPart Oraange211 | 77 | 30
HDTruck Red210 | 35 | 42
LKQ Silver132 | 137 | 140
LKQ Gray62 | 70 | 70
20
Specialty – Q2 2016 Results
Specialty Segment EBITDA Margin Bridge
Gross Margin
Segment EBITDA Margin
% of Revenue
($ in millions) 2016 2015 Change 2016 2015
Total Revenue $337 $284 18.5%
Gross Margin $98 $87 12.4% 29.2% 30.8%
Operating Expenses $57 $47 20.9% 17.0% 16.7%
Segment EBITDA* $42 $40 4.0% 12.4% 14.1%
Note: In the table above, the sum of the individual percentages may not equal the total due to rounding
16.0%
14.0%
12.0%
10.0%
8.0%
Q2 2015 GrossMargin
F&WExpense
SG&A Distribution Other Q2 2016
14.1%
(1.6)%(0.9)%
0.4% 0.2% 0.2% 12.4%
32.0%
30.0%
28.0%
26.0%
Q1-15
Q2-15
Q3-15
Q4-15
Q1-16
Q2-16
30.1%
30.8%
27.9% 27.7%
30.3%
29.2%
15.0%
10.0%
5.0%
Q1-15
Q2-15
Q3-15
Q4-15
Q1-16
Q2-16
10.5%
14.1%
9.2%
6.1%
11.0%
12.4%
*Refer to segment EBITDA reconciliation on page 31

LKQ Blue0 | 85 | 180
LKQ Green176 | 186 | 31
Keystone Gold255 | 188 | 31
KeyKool SecondaryBlue137 | 173 | 219
KeyKoolTertiary Blue216 | 232 | 241
PicKYourPart Oraange211 | 77 | 30
HDTruck Red210 | 35 | 42
LKQ Silver132 | 137 | 140
LKQ Gray62 | 70 | 70
21
Specialty – YTD 2016 Results
Specialty Segment EBITDA Margin Bridge
% of Revenue
($ in millions) 2016 2015 Change 2016 2015Total Revenue $625 $526 19.0%
Gross Margin $186 $160 16.0% 29.7% 30.5%
Operating Expenses $113 $94 19.6% 18.1% 18.0%
Segment EBITDA* $74 $66 12.1% 11.8% 12.5%
Note: In the table above, the sum of the individual percentages may not equal the total due to rounding
14.0%
13.0%
12.0%
11.0%
10.0%
9.0%
YTD 2015 GrossMargin
F&WExpenses
SG&A Other YTD 2016
12.5%
(0.8)%
(0.8)%
0.7% 0.2% 11.8%
*Refer to segment EBITDA reconciliation on page 31

LKQ Blue0 | 85 | 180
LKQ Green176 | 186 | 31
Keystone Gold255 | 188 | 31
KeyKool SecondaryBlue137 | 173 | 219
KeyKoolTertiary Blue216 | 232 | 241
PicKYourPart Oraange211 | 77 | 30
HDTruck Red210 | 35 | 42
LKQ Silver132 | 137 | 140
LKQ Gray62 | 70 | 70
22
Glass – Q2 2016 Results
% of Revenue
($ in millions) 2016 2016
Total Revenue $210
Gross Margin* $39 18.4%
Operating Expenses $27 12.9%
Segment EBITDA** $23 11.1%
**Refer to segment EBITDA reconciliation on page 31
*Includes a $10 million one time inventor step-up adjustment recorded upon acquisition **
LKQ Blue0 | 85 | 180
LKQ Green176 | 186 | 31
Keystone Gold255 | 188 | 31
KeyKool SecondaryBlue137 | 173 | 219
KeyKoolTertiary Blue216 | 232 | 241
PicKYourPart Oraange211 | 77 | 30
HDTruck Red210 | 35 | 42
LKQ Silver132 | 137 | 140
LKQ Gray62 | 70 | 70
23
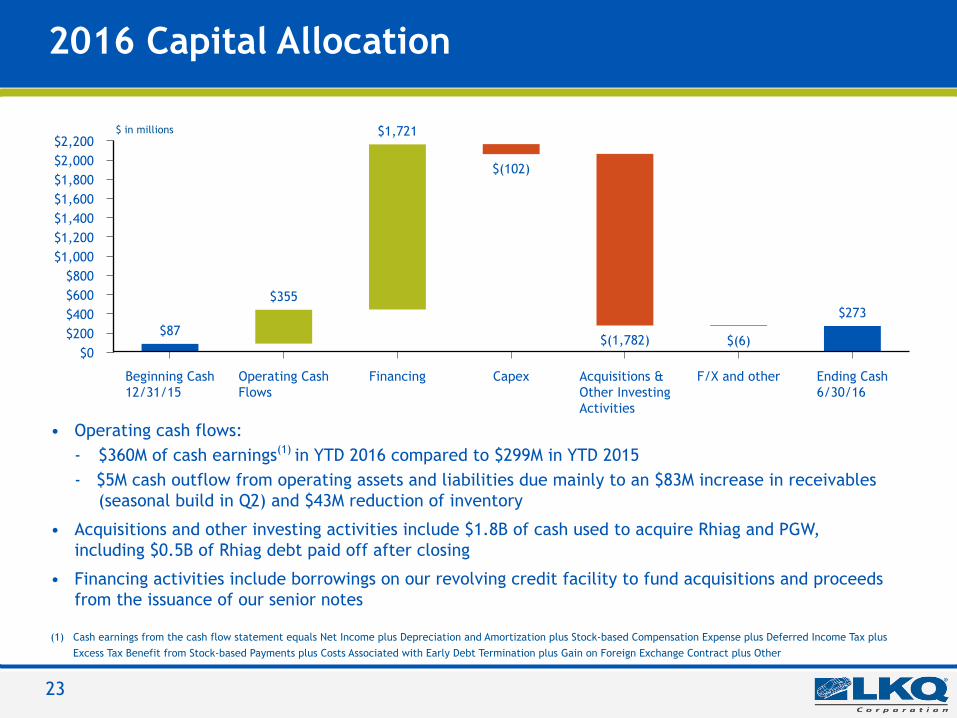
2016 Capital Allocation
• Operating cash flows:- $360M of cash earnings(1) in YTD 2016 compared to $299M in YTD 2015- $5M cash outflow from operating assets and liabilities due mainly to an $83M increase in receivables
(seasonal build in Q2) and $43M reduction of inventory
• Acquisitions and other investing activities include $1.8B of cash used to acquire Rhiag and PGW,including $0.5B of Rhiag debt paid off after closing
• Financing activities include borrowings on our revolving credit facility to fund acquisitions and proceedsfrom the issuance of our senior notes
(1) Cash earnings from the cash flow statement equals Net Income plus Depreciation and Amortization plus Stock-based Compensation Expense plus Deferred Income Tax plusExcess Tax Benefit from Stock-based Payments plus Costs Associated with Early Debt Termination plus Gain on Foreign Exchange Contract plus Other
$2,200$2,000$1,800$1,600$1,400$1,200$1,000
$800$600$400$200
$0
Beginning Cash12/31/15
Operating CashFlows
Financing Capex Acquisitions &Other InvestingActivities
F/X and other Ending Cash6/30/16
$87
$355
$1,721
$(102)
$(1,782) $(6)
$273
$ in millions

LKQ Blue0 | 85 | 180
LKQ Green176 | 186 | 31
Keystone Gold255 | 188 | 31
KeyKool SecondaryBlue137 | 173 | 219
KeyKoolTertiary Blue216 | 232 | 241
PicKYourPart Oraange211 | 77 | 30
HDTruck Red210 | 35 | 42
LKQ Silver132 | 137 | 140
LKQ Gray62 | 70 | 70
24
Leverage & Liquidity
Effective borrowing rate for Q2 2016 was 3.1%
RevolverAvailability(1)
($ in millions )
(*) Net leverage per bank covenants is defined as Net Debt/EBITDA. See the definitions of Net Debt and EBITDA in the credit agreement filed with the SEC for further details
Net Debt Cash & equivalents
Net Debt/ EBITDA(*)
$3,600
$3,200
$2,800
$2,400
$2,000
$1,600
$1,200
$800
$400
$0
8.0x
6.0x
4.0x
2.0x
0.0x
December 31, 2015 June 30, 2016
$1,513
$3,097
$87$1,600
$273
$3,370
Borrowings under credit facilities Letters of credit
Revolver Availability
$4,000
$3,500
$3,000
$2,500
$2,000
$1,500
$1,000
$500
$0
December 31, 2015 June 30, 2016
$891
$2,043$66
$72
$1,304
$2,261
$1,085
$3,200
1.7x
2.8x
(1) Revolver availability includes our term loans and revolving credit facilities
($ in millions )

LKQ Blue0 | 85 | 180
LKQ Green176 | 186 | 31
Keystone Gold255 | 188 | 31
KeyKool SecondaryBlue137 | 173 | 219
KeyKoolTertiary Blue216 | 232 | 241
PicKYourPart Oraange211 | 77 | 30
HDTruck Red210 | 35 | 42
LKQ Silver132 | 137 | 140
LKQ Gray62 | 70 | 70
25
Key Return Metrics
Return on Equity
15.0%
12.0%
9.0%
6.0%
3.0%
0.0%
2011 2012 2013 2014 2015 TTM Q22016
13.7%14.4% 14.5%
14.9%14.5% 14.2%
14.0%
12.0%
10.0%
8.0%
6.0%
4.0%
2.0%
0.0%
2011 2012 2013 2014 2015 TTM Q22016
10.9%10.5%
10.9% 10.8% 10.9% 10.7%
Return on Invested Capital*
(*) Amortization of intangibles has been excluded from the calculation of Return of Invested Capital

LKQ Blue0 | 85 | 180
LKQ Green176 | 186 | 31
Keystone Gold255 | 188 | 31
KeyKool SecondaryBlue137 | 173 | 219
KeyKoolTertiary Blue216 | 232 | 241
PicKYourPart Oraange211 | 77 | 30
HDTruck Red210 | 35 | 42
LKQ Silver132 | 137 | 140
LKQ Gray62 | 70 | 70
26
Guidance 2016 (effective only on the date issued: July 28, 2016)
(1) Guidance for 2016 is based on current conditions and excludes the impact of restructuring and acquisition related expenses, losses on debt extinguishment and amortizationexpense related to acquired intangibles. In addition, it excludes gains or losses (including changes in fair value of contingent consideration liabilities) and capital spendingrelated to acquisitions or divestitures. Our forecasted results for our U.K. and other international operations were calculated using current foreign exchange rates for theremainder of the year
Full year 2015 actual figures for Adjusted Net Income and Adjusted Diluted EPS were calculated using the same methodology as the 2016 guidance. Organic revenue guidancerefers only to parts and services revenue. LKQ updated its guidance on July 28, 2016, and it is only effective on the date of issuance. It is LKQ’s policy to comment on itsannual guidance only when the company issues its quarterly press releases with financial results. LKQ has no obligation to update this guidance.
($ in millions excluding EPS)
Full Year 2015Actual
Full Year 2016Guidance(1)
Organic Revenue Growth, for parts and services 7.0% 5.5%-7.0%
Adjusted Net Income $459 $555-$580
Adjusted Diluted EPS $1.49 $1.79-$1.87
Cash Flow from Operations $530 $585-$635
Capital Expenditures $170 $200-$225
Note: Guidance includes the projected results of Rhiag and PGW from the respective acquisition dates through year-end.

LKQ Blue0 | 85 | 180
LKQ Green176 | 186 | 31
Keystone Gold255 | 188 | 31
KeyKool SecondaryBlue137 | 173 | 219
KeyKoolTertiary Blue216 | 232 | 241
PicKYourPart Oraange211 | 77 | 30
HDTruck Red210 | 35 | 42
LKQ Silver132 | 137 | 140
LKQ Gray62 | 70 | 70
27
Q2 2016 Key Takeaways
• Solid organic revenue growth of 5.4% and 5.8% for parts and services in Q2 and YTD2016, respectively
• Constant currency* revenue growth of 38.2% and 25.5% for parts and services in Q2and YTD 2016, respectively
• Net Income improvement of 17.6% and 9.5% for Q2 and YTD, respectively
• Segment EBITDA** margin improvement for Q2 and YTD periods primarily due toincreases in gross margin
• Q2 Diluted EPS*** of $0.46 vs. $0.39, a 17.9% increase
• Q2 Adjusted Diluted EPS*** of $0.55 vs. $0.41, a 34.1% increase
(*) Refer to segment Constant Currency reconciliation on page 30(**) Refer to segment Segment EBITDA reconciliation on page 31(***) Refer to EPS reconciliation on page 32

LKQ Blue0 | 85 | 180
LKQ Green176 | 186 | 31
Keystone Gold255 | 188 | 31
KeyKool SecondaryBlue137 | 173 | 219
KeyKoolTertiary Blue216 | 232 | 241
PicKYourPart Oraange211 | 77 | 30
HDTruck Red210 | 35 | 42
LKQ Silver132 | 137 | 140
LKQ Gray62 | 70 | 70
28
Consistent Business Model and Strategy
Niche andFragmented
Markets
Industry LeadingManagement
High Fulfillment
Rates
Synergy andLeverage
Opportunities
SustainableGrowth and
Margin Expansion
Attractive Adjacent Markets

LKQ Blue0 | 85 | 180
LKQ Green176 | 186 | 31
Keystone Gold255 | 188 | 31
KeyKool SecondaryBlue137 | 173 | 219
KeyKoolTertiary Blue216 | 232 | 241
PicKYourPart Oraange211 | 77 | 30
HDTruck Red210 | 35 | 42
LKQ Silver132 | 137 | 140
LKQ Gray62 | 70 | 70
29
Appendix - Non-GAAP Financial Measures
The financial data contained in the presentation materials includes earnings before interest, taxes, depreciation andamortization ("EBITDA") and provides a reconciliation of net income to EBITDA. The financial data contained in thepresentation materials also includes adjusted net income and adjusted diluted earnings per share ("EPS") and providesa reconciliation of net income and diluted EPS to adjusted net income and adjusted diluted EPS. The Company definesadjusted net income and adjusted diluted EPS as net income and diluted EPS adjusted to eliminate the impact ofrestructuring and acquisition related expenses, loss on debt extinguishment, amortization expense related to acquiredintangibles, the change in fair value of contingent consideration liabilities, other acquisition related gains and lossesand the tax effect of these adjustments. EBITDA, adjusted net income and adjusted diluted EPS are not measures offinancial performance under generally accepted accounting principles in the United States.
We have presented EBITDA, adjusted net income and adjusted diluted EPS information solely as supplemental disclosuresbecause we believe they offer investors, securities analysts and other interested parties useful information regardingour results of operations because they assist in analyzing our performance and the value of our business. EBITDA providesinsight into our profitability trends, and allows management and investors to analyze our operating results with andwithout the impact of depreciation, amortization, interest and income tax expense. We believe EBITDA is used bysecurities analysts, investors and other interested parties in evaluating companies, many of which present EBITDA whenreporting their results. EBITDA should not be construed as an alternative to operating income, net income or net cashprovided by (used in) operating activities, as determined in accordance with accounting principles generally acceptedin the United States. Adjusted net income and adjusted diluted EPS are presented as supplemental measures of ourperformance that management believes are useful for evaluating and comparing our operating activities across reportingperiods. Adjusted net income and adjusted diluted EPS should not be construed as alternatives to net income or dilutedEPS as determined in accordance with accounting principles generally accepted in the United States. Not all companiesthat report EBITDA, adjusted net income and adjusted diluted EPS information calculate these measures in the samemanner as we do and, accordingly, our calculations are not necessarily comparable to similarly named measures ofother companies and may not be appropriate measures for performance relative to other companies.
LKQ Blue0 | 85 | 180
LKQ Green176 | 186 | 31
Keystone Gold255 | 188 | 31
KeyKool SecondaryBlue137 | 173 | 219
KeyKoolTertiary Blue216 | 232 | 241
PicKYourPart Oraange211 | 77 | 30
HDTruck Red210 | 35 | 42
LKQ Silver132 | 137 | 140
LKQ Gray62 | 70 | 70
30
Appendix 1- Constant Currency Reconciliation
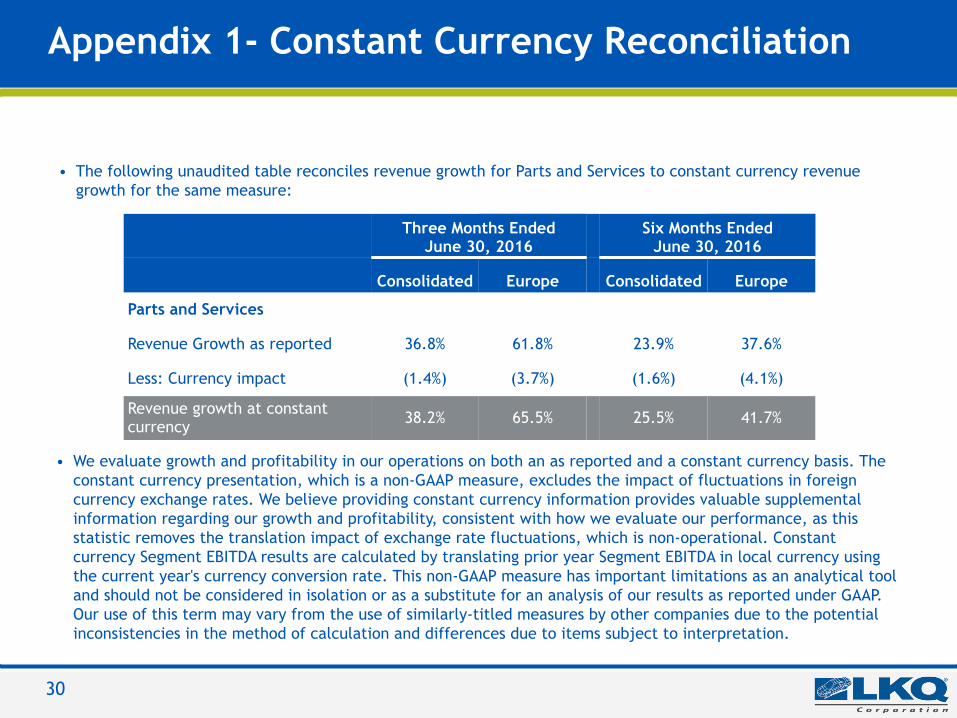
• The following unaudited table reconciles revenue growth for Parts and Services to constant currency revenuegrowth for the same measure:
• We evaluate growth and profitability in our operations on both an as reported and a constant currency basis. Theconstant currency presentation, which is a non-GAAP measure, excludes the impact of fluctuations in foreigncurrency exchange rates. We believe providing constant currency information provides valuable supplementalinformation regarding our growth and profitability, consistent with how we evaluate our performance, as thisstatistic removes the translation impact of exchange rate fluctuations, which is non-operational. Constantcurrency Segment EBITDA results are calculated by translating prior year Segment EBITDA in local currency usingthe current year's currency conversion rate. This non-GAAP measure has important limitations as an analytical tooland should not be considered in isolation or as a substitute for an analysis of our results as reported under GAAP.Our use of this term may vary from the use of similarly-titled measures by other companies due to the potentialinconsistencies in the method of calculation and differences due to items subject to interpretation.
Three Months EndedJune 30, 2016
Six Months EndedJune 30, 2016
Consolidated Europe Consolidated Europe
Parts and Services
Revenue Growth as reported 36.8% 61.8% 23.9% 37.6%
Less: Currency impact (1.4%) (3.7%) (1.6%) (4.1%)
Revenue growth at constantcurrency 38.2% 65.5% 25.5% 41.7%

LKQ Blue0 | 85 | 180
LKQ Green176 | 186 | 31
Keystone Gold255 | 188 | 31
KeyKool SecondaryBlue137 | 173 | 219
KeyKoolTertiary Blue216 | 232 | 241
PicKYourPart Oraange211 | 77 | 30
HDTruck Red210 | 35 | 42
LKQ Silver132 | 137 | 140
LKQ Gray62 | 70 | 70
31
Appendix 2- EBITDA and Segment EBITDAReconciliation
* Loss on debt extinguishment is considered a component of interest in calculating EBITDA** The sum of the individual components may not equal the total due to rounding.
QTD** YTD**
(in millions) Q2 2016% of
revenue Q2 2015% of
revenue Q2 2016% of
revenue Q2 2015% of
revenueSegment EBITDA
North America $ 163.8 15.2% $ 138.9 13.3% $ 311.2 14.4% $ 288.3 13.8%
Europe 90.0 10.9% 53.9 10.6% 147.5 10.8% 100.5 10.1%
Specialty 41.8 12.4% 40.2 14.1% 73.5 11.8% 65.6 12.5%
Glass 23.3 11.1% — nm 23.3 11.1% — nm
Total Segment EBITDA $ 318.9 13.0% $ 233.0 12.7% 555.5 12.7% $ 454.3 12.6%
Deduct:
Restructuring and acquisition related expenses 9.1 1.7 23.9 8.2
Inventory step-up adjustment- acquisition related 10.2 — 10.2 —
Change in fair value of contingent consideration liabilities — 0.1 0.1 0.3
Add:
Equity in earnings of unconsolidated subsidiaries 0.1 (1.2) (0.2) (3.1)
Gains on foreign exchange contracts- acquisition related — — 18.3 —
EBITDA $ 299.7 12.2% $ 230.1 12.5% $ 539.4 12.3% $ 442.8 12.3%
Depreciation and Amortization 57.7 31.0 90.9 61.7
Interest Expense, Net 26.4 14.6 41.0 29.5
Loss on debt extinguishment* — — 26.7 —
Provision for Income Taxes 74.9 64.7 132.4 124.8
Net Income $ 140.7 $ 119.7 $ 248.5 $ 226.8

LKQ Blue0 | 85 | 180
LKQ Green176 | 186 | 31
Keystone Gold255 | 188 | 31
KeyKool SecondaryBlue137 | 173 | 219
KeyKoolTertiary Blue216 | 232 | 241
PicKYourPart Oraange211 | 77 | 30
HDTruck Red210 | 35 | 42
LKQ Silver132 | 137 | 140
LKQ Gray62 | 70 | 70
32
Appendix 3- Adjusted Net Income and EPSReconciliation*
QTD YTD
(in millions, except per share data) Q2 2016* Q2 2015* Q2 2016* Q2 2015*
Net Income $140.7 $119.7 $248.5 $226.8
Adjustments:
Restructuring and acquisition related expenses 9.1 1.7 23.9 8.2Loss of debt extinguishment — — 26.7 —Amortization of acquired intangibles 24.3 8.2 33.2 16.5Inventory step-up adjustment- acquisition related 10.2 — 10.2 —
Change in fair value of contingent consideration liabilities — 0.1 0.1 0.3Gains on foreign exchange contracts- acquisition related — — (18.3) —Tax effect of adjustments (15.1) (3.5) (26.3) (8.7)
Adjusted net income $169.2 $126.3 $297.9 $243.1
Weighted average diluted common shares outstanding308,898 307,247 308,634 307,105
Diluted earnings per share $0.46 $0.39 $0.81 $0.74
Adjusted diluted earnings per share $0.55 $0.41 $0.97 $0.79
*The sum of the individual components may not equal the total due to rounding.

LKQ Blue0 | 85 | 180
LKQ Green176 | 186 | 31
Keystone Gold255 | 188 | 31
KeyKool SecondaryBlue137 | 173 | 219
KeyKoolTertiary Blue216 | 232 | 241
PicKYourPart Oraange211 | 77 | 30
HDTruck Red210 | 35 | 42
LKQ Silver132 | 137 | 140
LKQ Gray62 | 70 | 70
33
Appendix 4- Adjusted Net Income and EPSReconciliation*
(in millions, except per share data) 2015** 2014** 2013** 2012** 2011**
Net Income $423.2 $381.5 $311.6 $261.2 $210.3
Adjustments:
Restructuring and acquisition related expenses 19.5 14.8 10.2 2.8 7.6
Loss on debt extinguishment — 0.3 2.8 — 5.3
Change in fair value of contingent considerationliabilities 0.5 (1.9) 2.5 1.6 (1.4)
Amortization of acquired intangibles 33.8 34.5 13.8 9.5 7.9
Tax effect of adjustments (18.4) (17.2) (9.4) (4.5) (7.8)
Adjusted net income $458.6 $412.0 $331.5 $270.7 $221.9
Weighted average diluted common sharesoutstanding 307,496 306,045 304,131 300,693 296,750
Diluted earnings per share $1.38 $1.25 $1.02 $0.87 $0.71
Adjusted diluted earnings per share $1.49 $1.35 $1.09 $0.90 $0.75
**The sum of the individual components may not equal the total due to rounding.*Reflects the revision to Adjusted EPS to exclude amortization of acquired intangibles. Prior years information is presented for comparability.

LKQ Blue0 | 85 | 180
LKQ Green176 | 186 | 31
Keystone Gold255 | 188 | 31
KeyKool SecondaryBlue137 | 173 | 219
KeyKoolTertiary Blue216 | 232 | 241
PicKYourPart Oraange211 | 77 | 30
HDTruck Red210 | 35 | 42
LKQ Silver132 | 137 | 140
LKQ Gray62 | 70 | 70
34
Appendix 5- 2015 Quarterly Adjusted Net Income and EPSReconciliation*
(in millions, except per share data) Q4** Q3** Q2** Q1**
Net Income $95.1 $101.3 $119.7 $107.1
Adjustments:
Restructuring and acquisition related expenses 6.8 4.6 1.7 6.5
Change in fair value of contingent considerationliabilities 0.1 0.1 0.1 0.2
Amortization of acquired intangibles 9.1 8.2 8.2 8.2
Tax effect of adjustments (5.4) (4.4) (3.5) (5.2)
Adjusted net income $105.6 $109.9 $126.3 $116.8
Weighted average diluted common sharesoutstanding 308,028 307,728 307,247 306,691
Diluted earnings per share $0.31 $0.33 $0.39 $0.35
Adjusted diluted earnings per share $0.34 $0.36 $0.41 $0.38
**The sum of the individual components may not equal the total due to rounding.*Reflects the revision to Adjusted EPS to exclude amortization of acquired intangibles.

LKQ Blue0 | 85 | 180
LKQ Green176 | 186 | 31
Keystone Gold255 | 188 | 31
KeyKool SecondaryBlue137 | 173 | 219
KeyKoolTertiary Blue216 | 232 | 241
PicKYourPart Oraange211 | 77 | 30
HDTruck Red210 | 35 | 42
LKQ Silver132 | 137 | 140
LKQ Gray62 | 70 | 70
35
Appendix 6- Forecasted EPS reconciliation*
(in millions, except per share data) Minimum Guidance Maximum GuidanceNet Income $478.0 $503.0
Adjustments:
Restructuring and acquisition related expenses 24.0 24.0Loss of debt extinguishment 27.0 27.0Amortization of acquired intangibles 75.0 75.0Inventory step-up adjustment - acquisition related 10.0 10.0Gains on foreign exchange contracts - acquisition related (18.0) (18.0)Tax effect of adjustments (41.0) (41.0)
Adjusted net income $555.0 $580.0
Weighted average diluted common shares outstanding310 310
Diluted earnings per share $1.54 $1.63
Adjusted diluted earnings per share $1.79 $1.87
*The sum of the individual components may not equal the total due to rounding.
Refer to the discussion of Adjusted Net Income and Adjusted Diluted Earnings per Share for details on the calculation of thesemeasures. With the exception of net income and amortization of acquired intangibles, we have not forecasted amounts for the2016 fiscal year beyond what was incurred as of June 30, 2016.