lj/) - professor robert b. laughlin, department of physics...
TRANSCRIPT
~UNCLASS\F\ED\
UCRL-12263 Nuclear Reactors For Ram
Jet Propulsion, C-90 M-3679 (38th·Ed.)
This document cgntains~page:=;, 1ngl\uHns pp. 1 .. u. This is co:f'zs-of 164 Series~.
UNIVERSITY OF CALIFORNIA
Lawz:ence Radiation Laboratory
Livermore, California
AEC Contract No. W-7405-eng-48
SPECIAL REREVIEW FINAL
DETERMINATION Class: U,
Reviewers
KAw ReD
Class.
u. Lt.
TORY IIC TEST OPERATIONS
(Title: Unclassified)
Charles Barnett
March 12, 1965
CLASSIFICATION CANCELLED Date If- "J,...~~t....l
~tZ!V\---' R. B. Martin, USAEC ORO Research & Technical Support Div.
~----------NOTICE-----------. This report was prepared· ··as· an account of work· sponsored by the United States Government. Neither the United States nor the United States. Atomic Energy Commission, nor any of their .employees, nor any of their contractors, subcontractor.s, or their employees, makes any warranty, express or tmplied, or assumes any legal liability or responsibility for the accuracy, com.pleteness or usefulness of any Information, apparatus, produci or process disclosed, or represents that Its use
1 would not Infringe privately O'\'ned rights.
/ &ESTRICTED DATA: . • ~ /,r, lJ/) /~ I ;(-/// ·, I i)r-, '1./t ////
TP.. is doc~. tnent 9t;mHi?ins rest )::c~:.:Od d~t:a2 ' d f. /·/a . th 'A. t1 . E ,f,/!l.fJ"7A: ,;;:.-A
, ~f:i,. e 1~e m /e · , om1c 2vl'J~'Y e.~:..
A~~5~Its tran~]nHtal o~t -~i<:J:sclosure I ~~/ii..~-1;; /?eontenis~inl any m ··.e'P to~n un-
'!J' :'4'/Z:.:~~~ i -~ ~:tf x 'dr ~ytetdrized./j. :b/·on is pr ed.
GROUP 1. eluded fr Automatic Downgrading and Declassification.
-i- . . / .
.• ~. •. :~~~~~~ ..; 1 1\JN O.E IHIS DOCUMENT IS UNLIMITED
,<-~ . 66-----------------------------

SECRET
,' 1 I,/
~{!l/1 . ~....:.;
-...:!
/ /;>)-. I
Print,ed in USA. Charge $0.75. ';Afailable from the U. S. At61nic Energy Commission, I?,iy}pi~n of Technical lnfoqn~tio~ Ext:e':lsion, P .. 0. Bmyiool, Oak Ridge, Tenn ... Pl.1e1r/~~ d1rect to the same a99;_1~ss mqu1r1es cover1. nvt.·he procurement of other class1fle~;f~ C reports. . . l;fjj/ . ~, /
' 1/1/~ I!!JIJ!l .. '~$

~ ~~
TORY IIC TEST OPERATIONS*
Charles Barnett
Lawrence Radiation Laboratory, University of California • I II
Livermore, California
March 12, 1965
INTRODUCTION
This paper discusses the Tory IIC test program that led to sucessful test of the
Tory IIC reactor at design conditions on May 20, 1964. Included are: (1) discussion of
the facility qualification test program, (2) description of low power tests, and (3) de-
scription of the high power runs and a brief discussion of results derived from them.
TEST FACILITY CHECKOUT
A large test facility such as the Pluto facility requires considerable qualification
testing both of components and the integrated whole. An attempt is made here to give
some idea of the number and naturE;?. of the tests that were required and to discuss some
of the problems which the tests revealed. A very brief description of the test facility
is included.
Description of Facility
' '
The Pluto test facility is located at the Atomic Energy Commission's Nevada Test
Site. The Pluto site is approximately 8 square miles iri area and consists of essentially
three groups of facilities: the control area, the disassembly building, and the test area.
The control area consists of the test control building, the data reduction building,
a warehouse, and a shop. In close proximity is the hot critical test facility which was
deactivated before the beginning of Tory IIC tests. e . * Work done under the auspices of the U. S. Atomic Energy Commission.

)/ ,t}T The disassembly building contains a large disassembly bay and two smaller dis·
assembly shops used for the remote ,dismantling and inspection of the radioactive or
"hot" reactors. It also contains an assembly bay.
The test area consists of the test bunker, air heating facility, air storage farm,
and compressor building. The heating facility includes four heaters containing approxi
mately 2 million pounds of l-in. -diam steel balls, which are preheated to raise the ,, '' '
test air temperature to about 1 oooo·F. The heated air is supplied to the test vehicle at
a flow rate up to 2000 lbfsec. The 'air storage farm is composed of approximately 25
miles of 10-in. oil well casing. It holds 1.2 million pourids of air at 3600 psia, which
is sufficient for a 5-min test run. The c.ompressor building houses three compressors
which can pump up the air farm in 5 days.
In addition, there is a railroad connecting the disassembly building with the test
bunker. A check station located between the control building and the disassembly build-
ing is used for limiting access to the test area during a test and is also used as a con
trol point for health physics and other aspects of safety .
. Figures 1 and 2 show the te'st facility layout.
Facility Qualification Testing
The facility testing program began on November 17, 1962, and ended ort March 5,
1964. Eighty-two major tests were performed during this period. Facility construction
was not complete when the testing began. In fact, much of the early testing was in sup-
port of the construction program.
It is convenient to break the tests into four groups: (1) air supply cleanup tests,
(2) facility component qualification tests, (3) test vehicle qualification tests, (4) operator
training tests.
.e
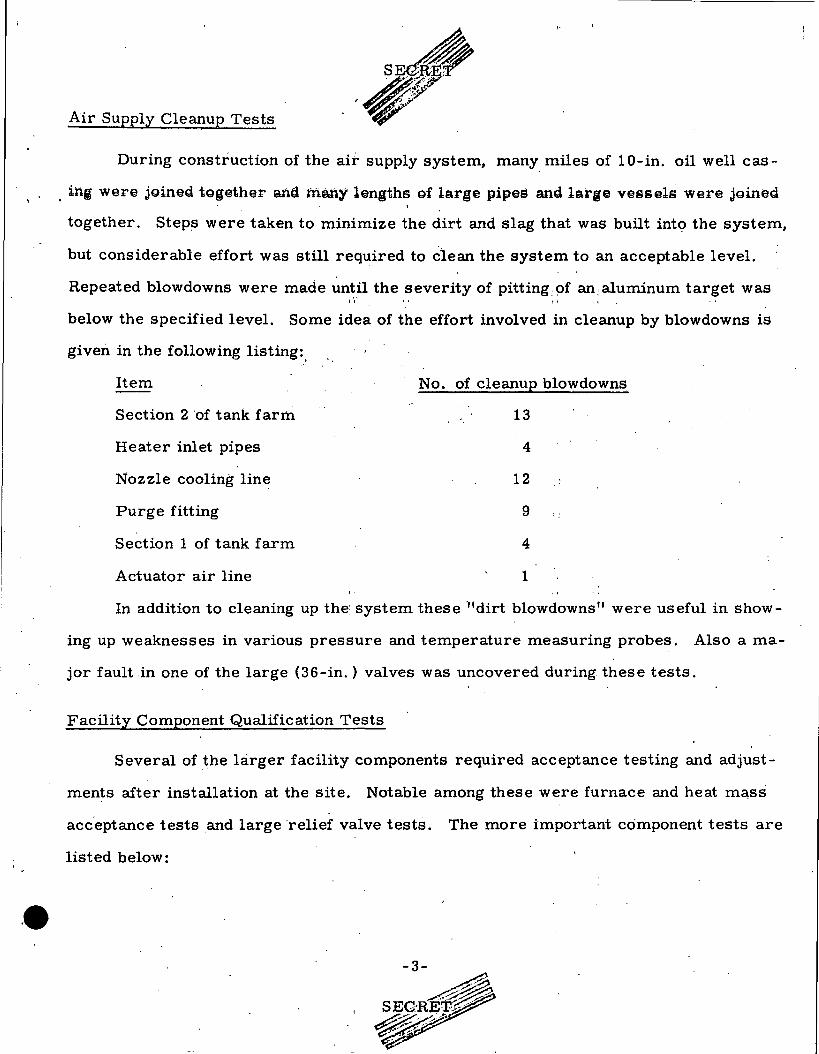
Air Supply Cleanup Tests
During construction of the air supply system, many miles of 10-in. oil well cas-
. ing were joined together an(;l mafiy lengths of large pipes and la:qJ&~ vessels were joined
together. Steps were taken to minimize the dirt and slag that was built into the system,
but considerable effort was still required to C'l.ean the system to an acceptable level.
Repeated blowdowns were made until the severity of pitting:9f an: aluminum target was 1'1' '' II II
below the specified level. Some idea of the effort involved in cleanup by blowdowns is
given in the following listing:.
Item
Section 2 ·of tank farm
Heater inlet pipes
Nozzle cooling lin~
Purge fitting
Section 1 of tank farm
Actuator air line
No. of cleanup blowdowns
13
4
12
9
4
1
In addition to cleaning up the: system these '~~dirt blowdowns" were useful in show-
ing up weaknesses in various pressure and temperature measuring probes. Also a rna-
jor fault in one of the large (36-in.) valves was uncovered during these tests.
Facility Component Qualification Tests
Several of the larger facility components required acceptance testing and adjust
ments after instapation at the site. Notable among these were furnace and heat mass
acc.eptance tests and large ·relief valve tests. The more important component tests are
listed below:

I I I
I Test
Large relief valves
Low pressure blowers
HCi\!At~r Md hea.t m1.11 performance
Post-facility-repair hot blowdown
No. of tests
7
1
10
1 ':
The facility tests listed above were made by blowing the supply air through a by-
pass outlet; air was not blown through the test vehicle.
These facility component tests exposed many minor weaknesses in equipment which
were readily corrected. One major problem was exposed which required a three-month
delay in schedule for repair. An inspection of the large hot a~r piping expansion joints
conducted during the heater performance tests showed that extensive cracking had oc-
curred. Removal of all heat insulation and further inspection showed the problem to be ser-
ious. The solution, of the problem cop.sisted of redesign of a portion of the piping so that
some joints could J:>e eliminated and a "beefing up" of those joints which remained. During
the piping and joint -repair, the heat mass liners were also modified to prevent w.arping.
Test Vehicle Qualification Tests
In the later stages of facility qualification, attention was shifted to qualifying the
test vehicle. The test vehicle consisted of a railroad flatcar on .which was mounted the.
ducting that contained the reactor core and control rod actuators (see. Fig. 3). Several
blowdowns through the test vehicle were made before installing the core in the ducting.
The general purpose of these tests was to make certain that all test vehicle components
would survive blowdowns and perform properly. '
Reactor behavior was simulated electronically during several of these runs. The
simulator moved the control rods in the same fashion that would be required in a power
run. Some of the blowdowns were made with an orifice plate .mounted in the duct to sim-
ulate core pressure drop.
1.4:.. I !
;'/
~~~ ~~JAGRET ~~
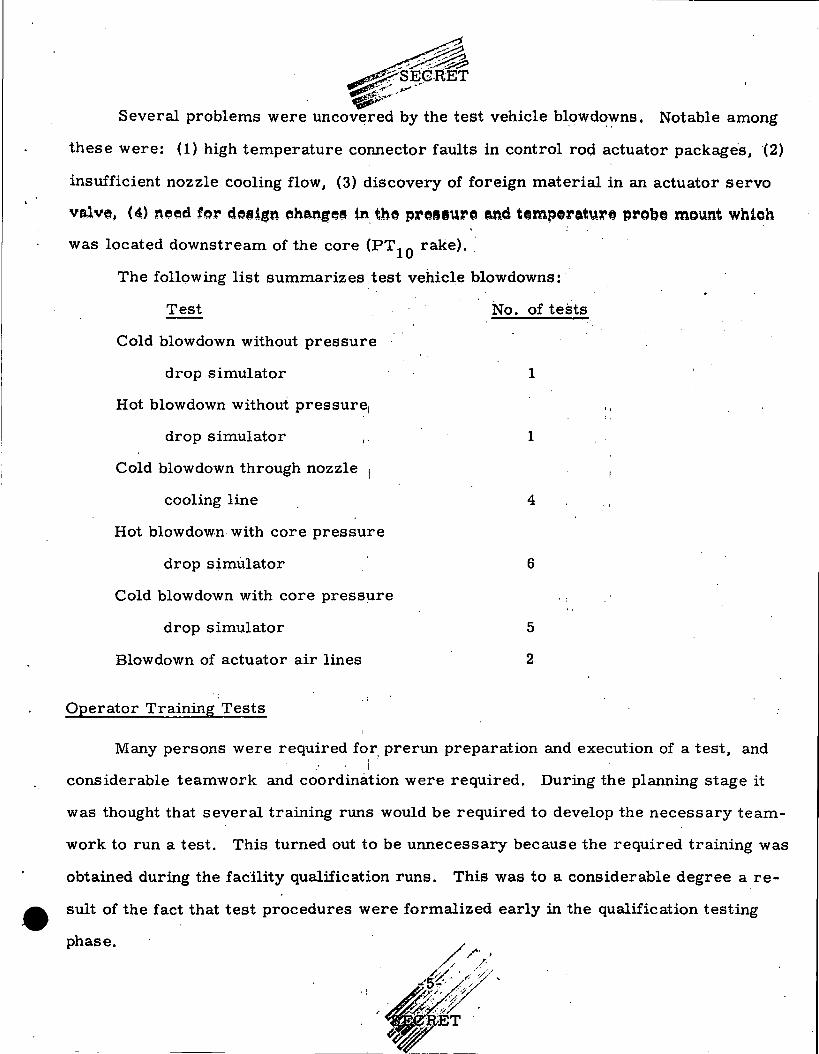
Several problems were uncovered by the test vehicle blowd~~ns. Notable among
these were: (1) high temperature connector faults in control rod actuator package·s, (2)
insufficient nozzle cooling flow, (3) discovery of foreign material in an actuator servo
valve, (4) n~~6 tor der~!sn e~han~~~ »'1. tba proeeuro and temperAturt.t probo mount which . .
was located downstream of the core (PT 10 rake) .. ·
The following list summarizes test vehicle blowdowns: ·
Test No. of tests
Cold blowdown without pressure
drop simulator 1
Hot blowdown without pressure,
drop simulator I' 1
Cold blowdown through nozzle
cooling line 4
Hot blowdown with core pressure
drop simulator 6
Cold blowdown with core pressure
drop simulator 5
Blowdown of actuator air lines 2
Operator Training Tests
Many persons were required for, prerun preparation and execution of a test, and . i
considerable teamwork and coordination were required. During the planning stage it
was thought that several training runs would be required to develop the necessary team-
work to run a test. This turned out to be unnecessary because the required training was
obtained during the fac'ility qualification runs. This was to a considerable degree a re
sult of the fact that test procedures were formalized early in the qualification testing
phase.

Not all tests
·from their names.
. ,.. '
11 11 ,, /
j -
-. i S~T .
are listed abov~. an~ all the reasons ~or any given test are clear
Almost .all tests had multiple purposes. For example, many of the
blowdowns served as dynamic checks of the m~in airflow control ami temperature valves
and as calibration runs for the air mass flow rate meters.
PRELIMINARY REACTOR RUNS
1: .. Mter shipment of the reactor to the Nevada Test Site 'and before high pow·er oper-
ation, five major tests were perfor·med. This section discusses briefly the purpose
and achievements of these tests.
Subcritical Experiment (March 23, 1964) ·
., '
During the test planning phase, it was known that extensiv~ checkouts of integrated I i 'I
subsystems would have to be made after the reactor and test vehicle were connected to
the test bunker. In particular, extensive testing of the reactor power control system
would be necessary. This would r~quire ganged motion of all the operational control
rods. The reactor core was equipped wi~h 12 auxiliary h~<;l-in~ertable and 6 .auxiliary
electrically actuated rods for extrc;t shutdown margin. The purpose of the subcritical
experiment was to verify that all operational rods could be withdrawn if all auxiliary
rods were inserted without causing dangerous increase in multiplication. If this were
the case, then it would be unnecessary to .evacuate personnel from the test bunker area
during control system checkout, and other important checkout work could continue si-
multaneously.
It had already been established in critical experiments conducted at Livermore
that the multiplicati9n was acceptaQle (M ::::: 15) with all operational rods out, the 6 L-
ring rods in and the 12 N-ring hand-inserted rods in. ("L" means rods on innermost
available radius. "N" means third available radius.) Nevertheless, it was felt that a
verification in the field would be desirable. It would make possible a shakedown of

r-----------------------------------------------------
J-.1 ~-·
criticality approach procedures under safe conditions and establish that no core con-
figuration changes had occurred during shipment from Livermore to Nevada.
The subcritical experiment was treated as a criticBJ experimentj i. e., personnel
were evacuated from the test area and all operations were conducted from the control
building. The experiment verified the Livermore results, so it was possible to con-
duct control system checkouts as planned. This test had two significant by-products: I : "
the first complete checkout was m~de of t.he nuclear counting sy~tein, . and valuable
operat'or training was obtained.
Cold Critical Experiment (March 24, 1964)
The objectives of the first field critical experiment ~were as follows: . ' 1. Verify the critical shim bank position required for room temperature criti-
: . I
cality. This had been previously established in the Livermore critical experiment.
2. Position the BF 3 detectors, fission detectors, an~ low-level ion chambers ,. .
relative to the· reactor so that propE;!r range overlap between detectors is obtained. , I 1 I ,• ''
3. Determine the open loop r-eactivity-power transfer::func±tion by vernier rod
oscillation tests.
4. Close the reactor power control loop on low log ion chamber current for the
first time.
5. Calibrate neutron detectors in terms of nuclear power ~sing fission foils and
a previously calibrated ion chambe.t.
6. Gain valuable operating experience with the reactor and associated systems
before the approach to high power operation.
Except for a minor qualification concerning objective 3 above, all objectives were
achieved and the measurements agreed well with expected values. The power calibra
e tion according to the fission foils was within l Oo/o of that indicated by the previously cali-
-7-
-~-----

brated ion chamber.
~'., SEGRE~_,
II 1.1
''
~~ The low log c ~r power controllo<;>p was closed without inci-
dent, and the response to power demand behaved better than could be expected. The
operational aspects of the test went smoothly, indicating adequate training of the oper
ating crew.
Objective 3, transfer function determination, was very nearly completed; a few
points at the higher frequencies wer;e missed. To obtain ea~h point an oscillat~ng volt-/' .. '' ,,
age was superimposed on the direct. demand voltage which hRlds tpe vernier rod at its
center position. Before the oscillating voltage is applied, the direct voltage component
from the oscillator must" be balanced against the existing ·direct demand voltage. Just
as the oscillator was turned on to obtain data at one' of the h~gher frequencies, the reac-
tor scrammed on a low period signal. Study of data showed that ithe vernier rod had
made a small outward step because the voltages had not beeQ., exactly balanced. It was
decided that enough data had been obtained to verify that the system would be stable
under closed loop control, so the transfer function test was terminated.
Although it had not been plann~d to do so, the power loop was closed on the high
range ion chambe:r;-s as well as on tl:le low-range ion chambe~s. This was possible be
cause the high range detectors wer~ somewhat more sensitive than had been cal,culated.
This maneuver eliminated one entire run which had been planned:.
· i • I
Hot Zero-Power Tests (April 9 and 23, '1964)
The general objective of these tests was to study the dynamic behavior of the core ; ; I
and test vehicle under flow conditi~ns approaching those characteristic of a high power
run. Special temperature, pressure, and vibration transducers were installed for the
test. Possible axial and radial dynamic motion of the core relative to the pressure ves
sel were of particular concern. Also of special interest was the behavior of the con
trol rod actuators under dynami~ flow conditions. Although the reactor was not brought
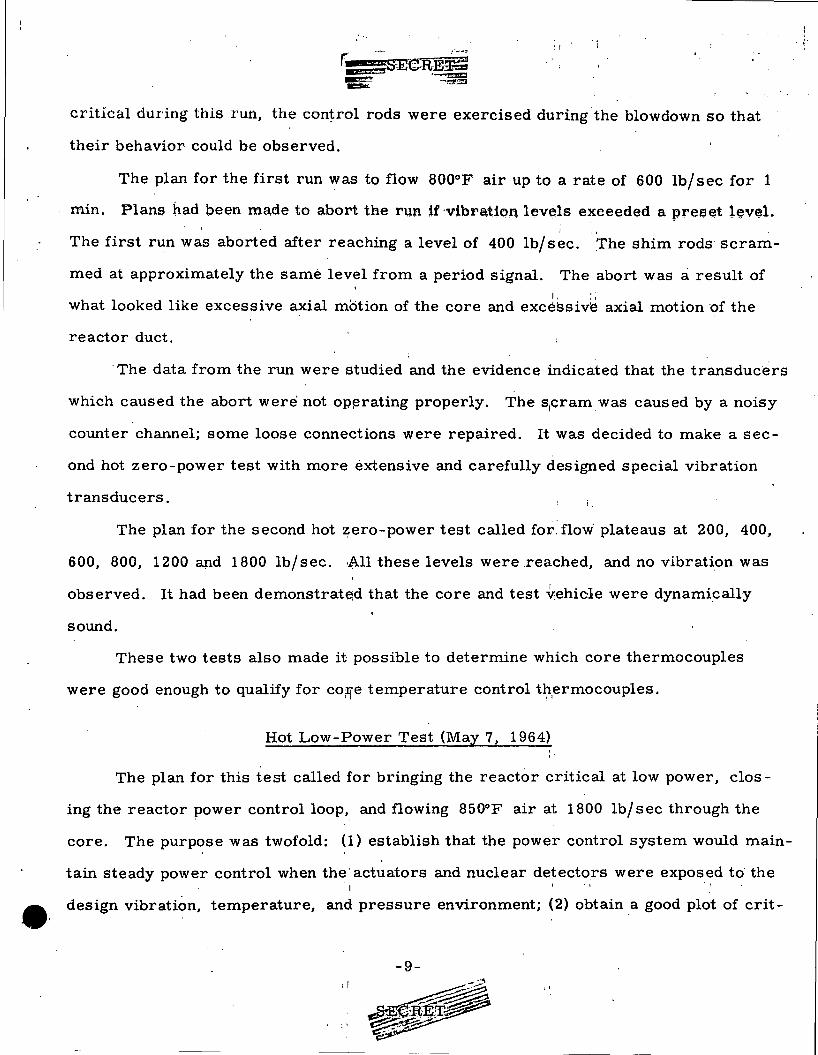
::
critical during this run, the control rods were exercised during the blowdown so that
their behavior could be observed.
The plan for the first run was to flow 800°F air up to a rate of 600 lb/ sec for 1
min. Plans had been made to abort the run U' ·v~bra.tioflleve.ls exceeded a p:reee.t 1~vel. ': II
The first run was aborted after reaching a level of 400 lb/ sec. .The shim rods· scram-
med at approximately the same level from a period signal. The abort was a result of I. ;,
what looked like excessive axial motion of the core and excessiv~ axial motion ·of the
reactor duct.
·The data from the run were studied and the evidence indicated that the transduce!rs
which caused the abort were not op~rating properly. The s19ramwas caused by a noisy
counter channel; some loose connections were repaired. It was decided to make a sec-
ond hot zero-power test with more extensive and carefully designed special vibration
transducers. i.
sound.
These two tests also made it possible to determine which core thermocouples
were good enough to qualify for co Fie temperature control ti;t,ermocouples.
Hot Low-Power Test (May 7, 1964)
The plan for this test called for bringing the reactor critical at low power, clos
ing the reactor power control loop, and flowing 850°F air at 1800 lb/sec through the
core. The purpose was twofold: (1) establish that the power control system would main-
tain steady power control when the' actuators and nuclear detectors were exposed to· the ' I 't
design vibration, temperature, and pressure environment; (2) obtain a good plot of crit-
:I ''

ical shim rod bank position vs reac\~
reactivity temperature coefficient behavior.
•i
The main events of the run were as follows: 'As the airflow was being increased
up to the 1800-lb/sec plateau the positio~ feedback signal from shim actuator B2 be-
came noisy and was manually place1d in the "hold" mode. In this· mode an actuator re
mains in. one position. Just as the plateau was reached, ac~:uator Al scramme~ due to I l n \I fl t' f
1
an apparent loss of air supply pressure. .When Al scrammed, the other actuators (A2,
Bl) began to move outward rapidly to compensate for loss of reactivity. In the exci~e-
ment of the moment a manual scram was initiated although the outward motion of actu-
ators A2 and Bl was exactly what ·the system design required. The nuclear part of - .
the run was aborted but the flow pr0gram was completed as planned.
Very good temperature coefficient data were obtained, and. ~he results agr~ed
much better with calculations than tpose obtained during the.Livermore critical .experi-1
ment. The Livermore experiment was marginal since only a small temperature differ-
ence was available. . I '' '
Obviously it ~was not directly :demonstrated in this run:that the nuclear control
system would control power without\ any perturbations. However,: postrun study of the
data and component checkout work revealed that all malfun.ctions. could be explained and
corrected. The noise in B2 ·was due to a small wire whiske,r which was found in a high-
temperature ~lectrical connector. Actuator Al had scrammed because of a faulty pres
sure switch. Had we not manually scrammed the reactor, the power control system
would have overcome the scramming of Al.
Since all malfunctions had been explained and corrected, it. :was decided to, proceed
with high power operation.
II 'I
I I ,,
; '
';
1.
I. I
e
I.-
. '
INTERMEDIAT.E POWER TEST (MAY 12, .1964)
The reactor w'as taken to its r'irst significant power level in this run. Conditions
of a Mach 2.8, hot-clay flight at 10,000 ft altitucle were simulated. Two major uncer
tainties had to be resolved at a low. but substantial power. The first concerned the n~u-. .
tron counters, which were retractable into a large concrete shield in order to reduce
the neutron intensity at full power so that the counters .would: not .be saturated. Thus '' II 1 il II 1'
the counter response had to be measured as a function of position at a power level large
enough to give an on-scale re~ding far the .fully retracted counters. Then the counters
could be placed to give a full coverage of the reactor power.
The second problem involved: the measurement of core temperature. In order to
place thermocouples in the core it was necessary to pass th~ leads down unfueled tube
columns. These unfueleq columns '\N'Ould operate at low temperature and reduce the
temperature of the adjoining fueled. column which contained the tip of the thermocouple.
This temperature reduction was difficult to estimate because, of the uncertainty in heat
transfer between adjoining tube coll-'mns and the partial blockage of unfueled columns by
the thermocouple lead wires. In addition the gamma-ray heating of the thermocouple
tip was difficult to evaluate. Therefore the possible error in temperature measurement
was several hundred degrees. Since the operator controlled the reactor by obs:erving
core temperature and changing power to o])tain the appropriate temperature, it was ob-
viously necessary to calibrate the core temperature. This was done by stopping at an . . . .
intermediate temperature and using the limited number of gas exit temperature thermo-
couples to determine the core temperature by means of thermodynamic calculations.
The operator was then directed to go to a final indicated core temperature. This pro-
cedure was satisfactory as will be d,emonstrated.
Brittle fractures of the facility. piping expansion joints had been detected before
the reactor runs and had been repaired. It was felt desirable for the first few runs to
-11-

''!,'17• t•' ·l
' .::; . ·;SECRET ,
,;1; I . . . heat the piping slowly and to also p-}~Jat the actuators and r,eactor slowly until experi-
~MI ence had been gained with the system. Therefore the facility blowers delivered ~bout
25 lb/sec of hot air to the piping and reactor for about 10 min before each run. The
rea.etor temperature fose to about 400~'F during th~e proeees. . . . . , I ,
The run was carried out in the following manner. The reactor was taken criticc:il
and switched to automatic power coqtrol on low level counters at about 1 kW. The pow-r. ~ ,
er was then incre·ased to 80 kW. .A:t this power level the neatron ·counter mapping took ' .
place and the counters were stationed at the appropriate positions. This operation re-
quired about 40 min.
When these steps were compl~ted the inlet air from the low: pressure blowers was
shunted through the heaters and the.lO-min "heat soak" complete~,. Blower air was then
valved out of the reactor (reactor inlet air temperature had r~achd 525°F on blowers).
Reactor power was then increased t<i> about 750 kW and the ~utomatic control loop
closed on high log detector signal. , : ·I
From this ppint on, the reac~or power was adjusted using the automatic power
control system wi~h feedback signal~ supplied by the median :signal from the three high-. . ' .
power-range compensated ion chambers. Core temperature, information was supplied
to the nuclear operator by an averaging network which selected the "weighted" average
of up to 12 core thermocouple sign~ls ·and displayed the resU:lt on a stripchart .. The
network weighted the input signals by their relative distance .~ro~ the mean and com
puted a weighted mean accord:i,ngly .. '
After the power control loop was closed, tank farm air was valved through the re
actor with maximum inlet air temperature demanded. A flow rate of 205 lb/ sec was
held for 250 sec, ~then the automati,~ airflow programmer was started. At 440 .lb/sec I' I
the programmer was stopped and r~~ctor power increased tq' ,bring the peak cor~ tem
perature (as displayed on the nuclear operator's stripchart) tp 17 30°F. This yi~lded a
I ..

L ~ET
steady-state calorimetric power of 76 MW. At this point there: was a pause to verify
that reactor power, flow rate, and core component temperatures were consistent with
predictions. The nuclear operator was in constant voice communication with observers
on the various data systems to insure that his tempe:rature information was aorreet ~nd
that the exit gas temperature was running at acceptable levels. The target indic'ated core
temperature was determined to be 2070°F which implied an estimated peak wall temper-
ature of 2200°F.
After it had been determined that all systems were performing properly, the auto
matic airflow program was resumed and the flow rate taken to 1260 lbfsec. As this was
done the reactor power was gradually adjusted upward to prey:ent :the temperature from
dropping. When the plateau was reached, the nuclear operat<;>r in<~reased power ;until the
target core temperature was reached. Again all parameters .were correlated continuously
on the plateau and found to be consistent with predictions. '' . ;I
The airflow plateau was sche~uled to last for 5 min. i ;How~ver, a good deal of
air had been expended on the lower p~ateaus. This situation was anticipated, so a tank
farm pressure of 900 psia or 5 min of high-flow operation was s·et as the termination
point of the plateau. At lower air supply pressures, automatic control of the airflow be-
comes difficult; also, it was necessary to insure that there was sufficient air remaining
for postrun cooling to· counteract fission-product gamma heating.
When the tank farm pressure dropped to 900 psia, airflow control was transferred
to the manual servo mode and the flow was reduced to 200 lb/ sec. A few seconds before
this occurred, the nuclear operator ttransferred the nuclear contr()l system to m<1;nual
servo and ran in the shims. When they were seated the react~r w~s scrammed manually.
Five minutes 'after the scrarri· all coolant flow through the r,eactor was stopped so
that the resultant effect on core temperature could be examined. ·After 4 min the tern-
perature increase was about 100°F (from 855°F to 955°F) on the nuclear operator's

stripchart.
- \' . I I~ I '
~' 'I I ll
i1 .I SE RET
: \ ~\\\l· .>, ' I
The low pressur-e blowers -were then valved through the reactor.
onstrated that the blowers alone were adequate for shutdown cooling.
It was dem
The duration of the run was 1 hour and 45 minutes. Plateau intervals {defined
here as the length of time the magnitude of a given parameter remained above an approx ...
imate value of 9fP/o of its "steady-stat~ mean value") .were as follows:
Item
Calculated flow rate at grid
High log ion chamber power
Ion chamber R2 power
Inlet air temperature
Average fuel temperatures
(x/ L = 0. 7, uncorrected)
95o/o SSMV
1199 lb/sec
297 MW
297 MW
Plateau length (sec)
;, 29'8
242
247
825
24~
Steady-state mean values for:this run were calculated.over the interval from
49,075 to 49,289 sec, which definefi:a fairly steady section of, the, high flow plateau. This
run is illustrated in Fig. 4 .. The inlet gas temperature, exit1 gas ,temperature, core tern-
perature, flow rate, and power are plotted:
A detailed ~nalysis of the data is not appropriate for the present discussion, but
a brief summary of the data is given below. ,, I
The corrected fuel-element wall temperature at the 0. 7 axial station was 2268°F.
which is 68°F above the objective. Since the thermocouple reading at this point requires
large and uncertain corrections, thi~ temperature was determined indirectly by using the
accurately known exit gas temperature and calculating the core temperature. The radial
temperature distribution of the exit gas was flat to within 3o/o .. The temperatures· of the
metal parts of the reactor were in good agreement with calculation, with the exception of
the reactor duct. :The calculations of the duct temperature did not· include external con
vection because of ;the difficulty iri predicting the external airflow and a desire to :t>e con-
I!

' ' '
servative. Therefore the duct temperature was several hundred degrees cooler than
calculated, indicating a relatively high velocity external airflow (- 30 mph), presumably
caused by aspiration by the nozzle. Axial and radial motions of the core due to thermal
expansion were as expected. There was no axial or radial vibration of the core greater
than 2 mils, the resolution of the position transducers.
The control rod position as a function of temperature is in good agreement with • I ~ : I
·,, r r 11 ''
calculation, indicating that our understanding of the temperature coefficient of reactivity
is adequate.
It was expected that the major loss of radioactivity would be thosefission fragments
which left the fuel elements by direct recoil and stopped in t~e gas. Estimates indicate
that approximately 0.2% of the fissiqn fragments would leave by this process. R.adio
chemical measurements of the effluent and observation of the resulting cloud give values
somewhat below this estimate.
After the run a telescopic inspection of the vehicle and base plates was made.
There was no change in appearance o.f any parts of the reacto~. N<? losses of reactivity ''
or any other unusual events occurred during the run. All measured parameters were in
agreement with predictions or fell on the conservative side. It was therefore conCluded
that the run was completely successful, and preparations were begun for the full power
run.
FULL POWER TEST (MAY 20, 1964)
This test was planned to simulate Mach 2.8, sea level, hot day (100°F) design con-
ditions. Test procedures were similar to those used in the intermediate power test,
with the primary difference being the deletion of the neutron detector mapping exercise
and the use of a new set of target val~es for flow rate and cor:e temperature. I .
L s~j}~ . . ..
A good calorimetric-versus-ion-~ber power correlation was obtained from ..
the previous test, so detector positions were not changed from the previous run and high
power scram levels could be set with some certainty. There was also increased confi
dence in the use of median core temperature for control purposes.. The high,..power tar..:
get indicated temperature for the nuclear operator was 2360°:f, which was expected to
yield a peak wall temperature of 2500°F. The target temperatures are less than the de-' . •I ''
sired wall temperature for reasons given in the previous chapter.''
The reactor power was raised to about 700 kW in high log power control. before
introducing tank farm air through the reactor. After a brief pause at 2-00 lbfsec the·air-·
flow rate was taken to 410 lb/ sec. At this point the nuclear operat~r increased the reac-
tor power to get a target core temperature of 17 30°F. This ~~vel .(-7 6 MW) was held just
long enough to verify that crucial parameters were close to predicted values. All sys-
. terns appeared to be operating properly so flow rate was increased to. its final value of
1663 lb/ sec. Reactor power was immediately increased unti~ the. 1target core temper
ature of 2360°F was reached_. The temperature came up smqothly with no perceptible
overshoot in any region of the react<;>ir.
Temperature and pressure d:~ta w,ere continuously compared on the plateau and
found to lie very close to predicted values. Because of limitations in the heater,system
the temperature of the air delivered ,to the reactor could not b,e held constant over the
entire plateau. The automatic programmer demanded a cons~1ant flow rate all this time
so changes in gas temperature were .compensated for, but the power and core temperature
would be expected! to reflect the variation of inlet air temperature.;
Figure 5 is, a plot of the reading of the nine control thermocouples used in the nu
clear operator's median signal network during the high power portion of the run. One of
the thermocouples (10751, No. 8 in J;i'ig. 5) exhibited anomalous behavior: rather than
holding steady, it climbed up 70°F ~y the middle of the plateau. The median network ap-
. '.

---
parently weighted this thermocouple rather heaVily (since it r'an closest to the rriean),
and the nuclear operator adjusted power to correct what was an apparent upward drift in
core temperature. The power variations involved were less than 4o/o.
The flow rate pl~teau was terminated automatically after 5 min as planned. Short
ly before this point was reached t:Q.e shims were inserted at constant speed in manual
servo control. When the shims were seated the reactor wa:s scrammed manually. The ' t• .
1 !l r• .
airflow was reduced to 200 lb/sec ~d held for about 2 min.'' Shutdown cooling 'was com-
pleted with the low pressure blowers.
The duration of the test was ·1 hour. No serious difficulties were experienced in
any phase of reactor operation and no loss. of reactivity could be detected at any, time. A
small limit cycle was noted in the log power control loop which c~used the vernier rod
(C1) to oscillate ±1/ 4 in. at 2 cps during intervals of short period demand (the effect
on the shims was imperceptible). I)uring the power ramp up to 7:6 MW (with period de-
mand at 10 sec) the oscillations becFl.me greater, so rod C2. was .~elected as the,vernier.
The amplitude of the oscillation was :reduced and the run was ,completed without further
difficulty. II
Plateau intervals (defined he:re as the length of time the magnitude of a given pa-
rameter remained above an approximate value of 95%. of ~ts ;'.'steady-state mean .value")
for several test p~rameters are list.ed below:
Item
Calculated flow rate at grid
High log. ion chamber power ; ,
Ion chamby1r R2 power
Inlet air temperature
Average fuel temperature
(x/L = 0.7, uncorrected)
il
II
95% SSMV
1580 lb/ sec
461 MW
461 MW
-17-
/~-f' --(~)
Plateau length (sec)
303
280
292
388.
286

~7/l,'fl' til· /
.I :J S CRET .
The steady state portion of the hit fer plat~au used for c~rrelating data from
this run is the time span covering 50,,050 to 50,170 Sec·, The run is illustrated in Fig. 6.
The inlet ~as temp~rature, exit gas tell_lperature, core temperature, flow rate, and pow
er are plotted.
A brief summary of the data is given below~
The fuel element temperature at the 0.7. axial station was 2590°F, which is 90°
above the objective. The reactor wa~ designed neutronically ;for ari operating point at 5
hours of life. At this time the xenon poisoning would require removal of the rods approx
imately 5 in. Thus for the short time run~· the insertion of the ro<;ts 5 in. farther into
the reactor than for the 5-hour case depresses t?e power' den~ity apd temperature in the
front ·end of the core.· To corhpensat:e and obtain the proper exit. gas temperature ,and
thrust, the center .of the reactor. must go to a higher power density ,and temperature. The
radial exit gas temperature was flat to within 3o/o as in the previous run. Temperatures
of core component~,were consistent ~ith estimates, with the previously mentioned excep-
tion of the duct. Core vibrations wer1e less than 2 mils and th.e fission product e~fluent
was again about 0.2o/o of the p:r.-oducec:I; fragments. The control: rod:positions were1 con-
sistent with those observed in the previous run.
Since the reactor was taken to tpe di~assembly building A-fter this run, a detp.iled
examination could he made of those reactor parts that could b~ 1 obs,~rved without disassem-
bly. Figure 7 is a photograph of the core baseplates taken aft~r tJ;le full power test. Other
than slight changes. in shading there nas been no change in the base. plates. By removing
the manhole covers·forward of the reactor, a detailed examin;;ttion of the control actuators
and front of the reactor was made utilizing a television camera and recorder. No changes I ,
were observed in th.is part of the syst~m. A light placed in front of the reactor allowed
sightings to be mad~ through a major;~ty of the reactor flow holes. Detailed examination I
of these holes failed to show any blockage or anomalies. All cpntrol rods were o~servaple
I'
'i
-18-
SEC.f!./J ~· ' .. ~

II · ~~ECRET
g~ in place and there was no evidence o~torrosion or damage. Figure 8 is a typic'al
picture of a sighting through some of the flow holes. Only a limited. part of the core
could be covered in each pict':lre because of the necessary alignment of the light, the
holes, and the camera.
'i
,.
I

N
N754
N 752
N 750
0 0
"'" t.O w
DISASSEMBLY AREA
GLL-6210-18415A
·o 0 0 co "'" t.O w
0 0 0 0 l{)
\0 I.J..)
I Burial pit
\ TEST~\ AREA
I
I Data reduction
w
Fig. 1. Area and building location map of Pluto test facility.
0 0
t.O w
/ /
\

Air heater r
2,500 ft.
Head house
--1~--L-~:::::;=:::::T-_-_ __..,_ _ _ _ c Access t u n nel· L..-,o~~ - ----------------
Air to test item
Compressors -low pressure air supply
Air s1orage system
MUL-18424
Fig. 2. Test area arrangement.
Substation --fJ ~~---' High pressure compressors

r--------------------------------------------------------------------------------------------------------------------------------------------------------------------
-33.00 ODO
GLL-644-90lA I 12.00 60.00 90.00 106.00
OVTRIGGER 184.00
2<18.50 276.50
SUP CRT 276.50 TORY 11-C TEST VEHICLE
Fig. 3. Schematic of Tory IIC test vehicle.
<t42.50
498.00
(f)
trl .. n

I()
•o x 3: 0 ...J u.
·a: w 3: 0 Q. ~
Q.
~ w "I-
2.2
2.0
1.8
1.6
1.4
1.2
1.0
0
I
I =TT2 INLET GAS TEMP- °F 2=TtransEXIT GAS TEMP-oF 3='f07 FUEL ELEMENT
. WALL TEMP-°F,__...-..J 4 =Wgrid FLOW RATE-pps 5=POWER(Hi Log)
-MW
4
48,000 48,200 48,400 48,600 48,800 49,000 49,200 49,400 TIME, sec
Fig. 4. Parameter measurements during intermediate power run.
-23-
J#
LL. 0 .. 1'-d II
....J
....... )(
ti en w ....J Cl. ::::> 0 u 0 ::!: a:: w :r I-
....J 0 a:: I-z 0 u
.1• '-
2400
2350
2300
2250 7
2200~--~--~------~------~------~------~ 50,500 50,100 50,150 50,200 50,250 50,300
TIME, sec
Fig. 5. Control thermocouple readings for high power test, run 89 (x/L = 0.7).
2 I= TT2 INLET GAS
TEMP-°F 2 = Ttrans EXIT GAS
TEMP- °F
3=To.7 FUEL ELE-
- MENT WALL f() TEMP-°F I 4 4 = wgrid FLOW 0
X 1.6 RATE- pps
- 5 =POWER (Hi Log)-MW
3: 0 ...J lL.
0:: 1.2
w 3: 0 a.. ~
0.8 a.. ~ w t-
5
49, 750 50,000 50,250 50,500 50,750 TIME,sec
Fig. 6. Unc orrected major parameters during run 89.
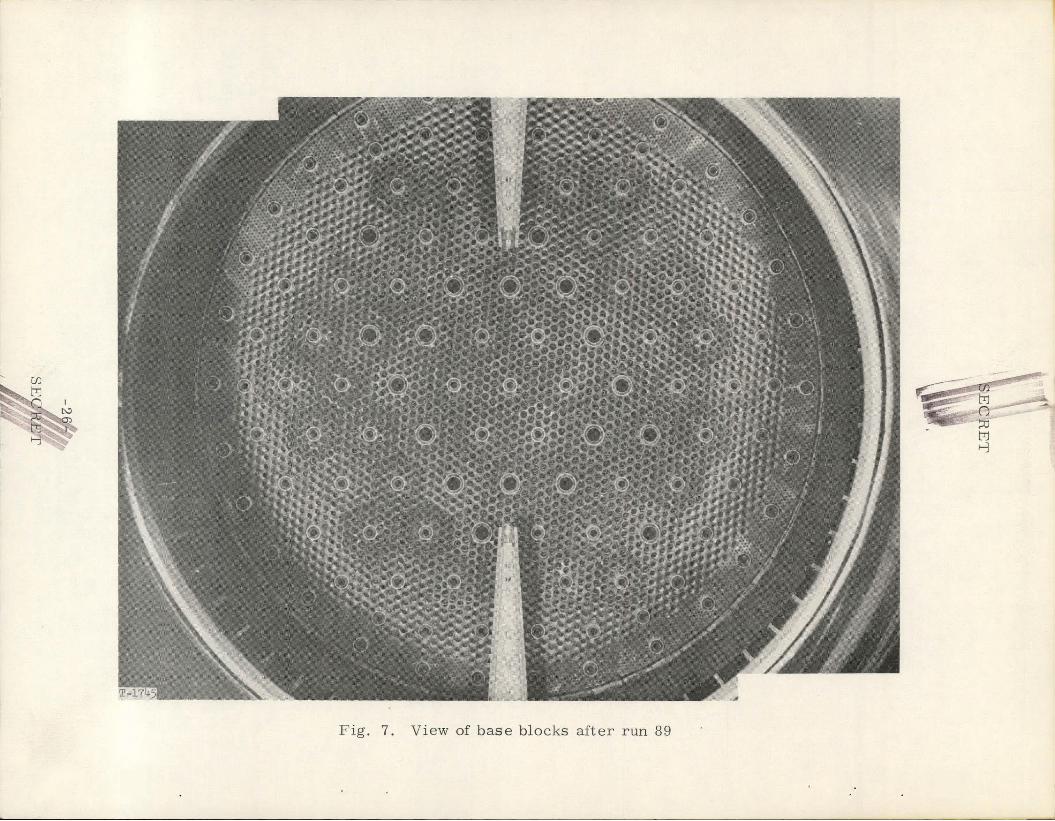
Fig. 7 . View of base blocks after run 89

•
Fig. 8. View through reactor flow channels after run 89. Light is forward of reactor, and camera mm:.t be in close alignment to ·:::>bserve throug~ the holes.

LRL Livermore,
Internal Distribution
SECRET
DISTRIBUTION ,..,.WAi!l,,..ies A ,
Loe~ .Al mo Soientifie L box- to:ry, M rcury, N vad
James Henshall
ACF Industries, Inc.
Aerojet-General Corporation (NASA')
Aerojet-General Corporation, Sacramento
Aeronautical Systems Division
Air Defense Command
Air Force Surgeon General
Air Force Weapons Laboratory
Air University Library I •
Albuquerque Operations Office
Argonne National Laboratory
Army Ballistic Research Laboratories ·
Army Materials Research Agency II •
Army Missile Command
Aro, Inc.
Atomic Energy Commission, Washington
Atomics International
AVCO Corporation
Battelle Memorial Institute
Brookhaven National Laboratory
Bureau of Naval Weapons
Bureau of Naval Weapons (SPO) I I •
Bureau of Ships , •
-28-
Copy No.
1 - 14
15 - 16
17 .. ,, ..
I 18 '
19
20 - 21
22
23
24 - 25
26
27
28
29
30
31
32
33 - 36
37
'38
39
40
,. 41 - 44
45
.. 46

Chicago Patent Group
Defense Atomic Support Agency, Sandia
Department of the· Army
Director of Defense Research and E11-gineering (OAP)
DuPont Company, Aiken ' . Edgerton, Germeshausen and Grier,'' Inc.,· Las Vegas
Foreign Technology Division (AFSC) ·
General Dynamics/Fort Worth
General Electric Company, Cincinnati
Goodyear Aerospace Corporation
Jet Propulsion Laboratory
Johns Hopkins University (APL)
Institute for Deferise Analyses II •
Battelle-Northwest
Allison Division - :OMC
Ling Temco Vought, Inc.
Lockheed Missiles and Space Company (BUWEPS)
Los Alamos Scientific· Laboratory
Marquardt Corpor;3.tion
Massachusetts Institute of Technology (EVANS)
NASA Ames Research Center
NASA Langley Re$earch Center
NASA Lewis Research Center
NASA Manned Spa9:ecraft Center
e NASA Marshall Space. Flight Center
NASA Scientific and Technical Information Facility
·-
1: "
" ,
'. II .,
Copy No.
47
48
49
50
51 ,.,
52
53
. 54
55- 60
61
62
63
64
65 - 66
67
68
69
7q - 71
72 - 75
76
77
78
79 - 84
85
86
87 - 89
:I

Naval Air Development Center
Naval Ordnance Test Station
Navlll Postgraduate School
Naval Radiological Defense Laboratory
Nevada Operations Office
Nuclear Weapons Training Center P~cific , ,
Oak Ridge Operations Office
..
Office of the Assistant General Counsel for Patents (AEC)
Office of the Chief of Naval Operations
Office of the Chief of Naval Operations (OP-0.3EG)
National Reactor Testing Station (PPCO)
Pratt and Whitney Aircraft Division
Pratt and Whitney Aircraft Division :(NASA)
RAND Corporation:
San Francisco Operations O{fice
Sandia Corporation
School of Aerospace Medicine
Strategic Air Command
Union Carbide Corporation (ORNL)
USAF Headquarte:r:-s
USAF Headquarters (DCS/0)
,,
., ,,
II •
Westinghouse Electric Corporation (~ASA)
White Sands Missile Range
Division of·Technical Information Extension
··.
I: • n
! ••
.. ,.,
It
I'
Copy No.
90
91
92
93
94
95
96
97
98
,99, -100
101
102
103
104-105
106 I'
107
108
109
110-119
120
121
122
123-124
125-164

..
L_E.GAL NOTICE
This report was prepared as an account of Government sponsored work. Neither the United States, nor the Commission, n0r any person acting on behalf of the Commission:
A. Makes any warranty or representation, expressed or implied, with respect to the accuracy, completeness, or usefulness of the information contained in this report, or that the use of any information, apparatus, method, or process disclosed in this report may not infringe privately owned rights; or
B. Assumes any liabilities with respect to the use of, or for damages resulting from the use of any" information, apparatus, method or process disclosed in this report.
As used in the above, 11 person acting on behalf of the Commission 11
includes any employee or contractor of the commission, or employee of such contractor, to the extent that such employee or contractor of the Commission, or employee of such contractor prepares, disseminates, or provides access to, any information pursuant to his employment or contract with the Commission, or his employment with such contractor.