living standards, poverty and inequality in the uk: 2018
TRANSCRIPT

20 June 2018
http://www.ifs.org.uk
@TheIFS #livingstandards
Institute for Fiscal Studies
Wifi details:
Network name: The Building Centre (Open network)
Living standards, poverty and inequality in the UK: 2018

Living standards and income inequality Jonathan Cribb
© Institute for Fiscal Studies Living Standards, Poverty and Inequality in the UK: 2018

What do we mean by “income”?
Income is measured:
‒ Net of direct taxes and benefits
‒ At the household level
‒ Before and after housing costs have been deducted (“BHC” and “AHC”)
Income is adjusted to account for:
‒ Differences in household size and structure (“equivalisation”)
‒ Inflation over time (using variants of the CPI)
Latest official income data – based on a survey of 20,000 households – are available for 2016‒17
© Institute for Fiscal Studies Living Standards, Poverty and Inequality in the UK: 2018

© Institute for Fiscal Studies
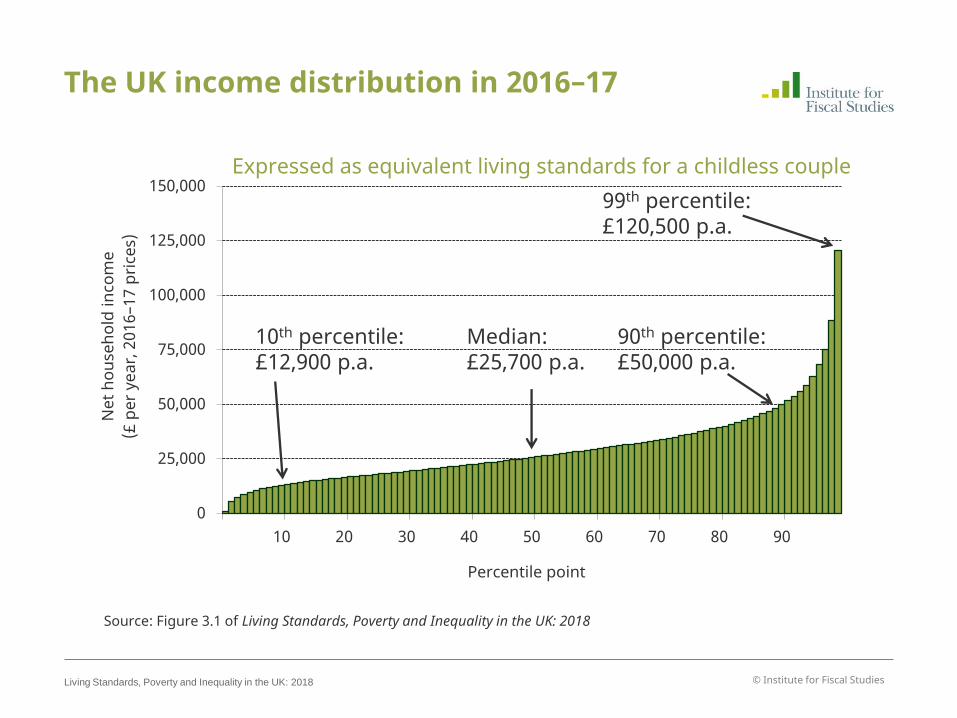
The UK income distribution in 2016–17
0
25,000
50,000
75,000
100,000
125,000
150,000
10 20 30 40 50 60 70 80 90
Net
hou
seho
ld in
com
e (£
per
yea
r, 20
16–1
7 pr
ices
)
Percentile point
Living Standards, Poverty and Inequality in the UK: 2018
Source: Figure 3.1 of Living Standards, Poverty and Inequality in the UK: 2018

© Institute for Fiscal Studies
The UK income distribution in 2016–17
0
25,000
50,000
75,000
100,000
125,000
150,000
10 20 30 40 50 60 70 80 90
Net
hou
seho
ld in
com
e (£
per
yea
r, 20
16–1
7 pr
ices
)
Percentile point
Childless couple: £25,700 p.a.
Source: Figure 3.1 of Living Standards, Poverty and Inequality in the UK: 2018
Living Standards, Poverty and Inequality in the UK: 2018

© Institute for Fiscal Studies
The UK income distribution in 2016–17
0
25,000
50,000
75,000
100,000
125,000
150,000
10 20 30 40 50 60 70 80 90
Net
hou
seho
ld in
com
e (£
per
yea
r, 20
16–1
7 pr
ices
)
Percentile point
Childless couple: £25,700 p.a.
Single adult: £17,200 p.a.
Couple with 2 young children: £35,900 p.a.
Living Standards, Poverty and Inequality in the UK: 2018
Source: Figure 3.1 of Living Standards, Poverty and Inequality in the UK: 2018

© Institute for Fiscal Studies
The UK income distribution in 2016–17
0
25,000
50,000
75,000
100,000
125,000
150,000
10 20 30 40 50 60 70 80 90
Net
hou
seho
ld in
com
e (£
per
yea
r, 20
16–1
7 pr
ices
)
Percentile point
Median: £25,700 p.a.
Expressed as equivalent living standards for a childless couple
Living Standards, Poverty and Inequality in the UK: 2018
Source: Figure 3.1 of Living Standards, Poverty and Inequality in the UK: 2018

© Institute for Fiscal Studies
The UK income distribution in 2016–17
0
25,000
50,000
75,000
100,000
125,000
150,000
10 20 30 40 50 60 70 80 90
Net
hou
seho
ld in
com
e (£
per
yea
r, 20
16–1
7 pr
ices
)
Percentile point
Median: £25,700 p.a.
10th percentile: £12,900 p.a.
Expressed as equivalent living standards for a childless couple
Living Standards, Poverty and Inequality in the UK: 2018
Source: Figure 3.1 of Living Standards, Poverty and Inequality in the UK: 2018

© Institute for Fiscal Studies
The UK income distribution in 2016–17
0
25,000
50,000
75,000
100,000
125,000
150,000
10 20 30 40 50 60 70 80 90
Net
hou
seho
ld in
com
e (£
per
yea
r, 20
16–1
7 pr
ices
)
Percentile point
Median: £25,700 p.a.
90th percentile: £50,000 p.a.
10th percentile: £12,900 p.a.
Expressed as equivalent living standards for a childless couple
Living Standards, Poverty and Inequality in the UK: 2018
Source: Figure 3.1 of Living Standards, Poverty and Inequality in the UK: 2017
© Institute for Fiscal Studies
The UK income distribution in 2016–17
0
25,000
50,000
75,000
100,000
125,000
150,000
10 20 30 40 50 60 70 80 90
Net
hou
seho
ld in
com
e (£
per
yea
r, 20
16–1
7 pr
ices
)
Percentile point
Median: £25,700 p.a.
90th percentile: £50,000 p.a.
10th percentile: £12,900 p.a.
Expressed as equivalent living standards for a childless couple 99th percentile: £120,500 p.a.
Living Standards, Poverty and Inequality in the UK: 2018
Source: Figure 3.1 of Living Standards, Poverty and Inequality in the UK: 2018

© Institute for Fiscal Studies
This presentation
What has happened to average incomes in recent years?
‒ What has driven recent income growth?
‒ How has average income growth compared to previous periods?
‒ How has it differed for working age people and pensioners?
How has income growth differed for high and low income people?
‒ What implications has that had for income inequality?
‒ What has driven recent changes in income inequality?
Living Standards, Poverty and Inequality in the UK: 2018

Median income in Britain since the 1960s
© Institute for Fiscal Studies Living Standards, Poverty and Inequality in the UK: 2018
Note: Great Britain only Source: Authors calculations using the Family Expenditure Survey and Family Resources Survey, various years.
0
5,000
10,000
15,000
20,000
25,000
30,000
1961
1964
1967
1970
1973
1976
1979
1982
1985
1988
1991
1994
1997
2000
2003
2006
2009
2012
2015
Med
ian
equi
valis
ed n
et h
ouse
hold
inco
me
(£ p
er y
ear,
2016
-17
pric
es)
2.0% per year in 40 years prior to 2007-08
0.6% per year since 2007-08

Median income in the UK since 2002-03
© Institute for Fiscal Studies Living Standards, Poverty and Inequality in the UK: 2018
21,000
22,000
23,000
24,000
25,000
26,000
27,000
Med
ian
equi
valis
ed n
et h
ouse
hold
in
com
e (£
per
yea
r, 20
16-1
7 pr
ices
)
Source: Figure 2.2 of Living Standards, Poverty and Inequality in the UK: 2018
1.1% per year 2002-03 to
2007-08
-0.6% per year 2007-08 to
2011-12
1.6% per year 2011-12 to
2016-17

Explaining average (mean) income growth
-4 -3 -2 -1 0 1 2 3 4
Direct taxes
Other
Private pensions and savings
Pensioner benefits
Working age benefits
Gross self employment income
Gross employee earnings
Contribution to average income growth (ppt)
Contribution since 2007-08 Contribution since 2011-12
© Institute for Fiscal Studies Living Standards, Poverty and Inequality in the UK: 2018
Note: Excludes individuals subject to the top income (SPI) adjustment due to responses to dividend taxation in 2016-17 Source: Table 2.1 of Living Standards, Poverty and Inequality in the UK: 2018
Still lower income from employee earnings
Higher income from pensioner benefits,
private pensions and savings
Modest recovery in
employment incomes
Fall in working age benefit
incomes

Average pensioner vs non-pensioner incomes
© Institute for Fiscal Studies Living Standards, Poverty and Inequality in the UK: 2018
70%
75%
80%
85%
90%
95%
100%
105%
110%
2002
-03
2003
-04
2004
-05
2005
-06
2006
-07
2007
-08
2008
-09
2009
-10
2010
-11
2011
-12
2012
-13
2013
-14
2014
-15
2015
-16
2016
-17 M
edia
n pe
nsio
ner i
ncom
e as
a p
erce
ntag
e of
non
-pen
sion
er in
com
e
Before Housing Costs are deducted
After Housing Costs are deducted
Source: Figure 2.7 of Living Standards, Poverty and Inequality in the UK: 2018

© Institute for Fiscal Studies
This presentation
What has happened to average incomes in recent years?
‒ How has average income growth compared to previous periods?
‒ What has driven recent income growth?
‒ How has it differed for working age people and pensioners?
How has income growth differed for high and low income people?
‒ What implications has that had for income inequality?
‒ What has driven recent changes in income inequality?
Living Standards, Poverty and Inequality in the UK: 2018

© Institute for Fiscal Studies
0%
1%
2%
3%
4%
5%
6%
7%
8%
9%
10%
0.20
0.22
0.24
0.26
0.28
0.30
0.32
0.34
0.36
0.38
0.40
1961 1966 1971 1976 1981 1986 1991 1996 2001 2006 2011 2016
Gin
i coe
ffici
ent
Long-run inequality: 1961 to 2016–17 (GB)
Living Standards, Poverty and Inequality in the UK: 2018
Source: Figures 3.7 and 3.8 of Living Standards, Poverty and Inequality in the UK: 2018
Gini coefficient

© Institute for Fiscal Studies
0%
1%
2%
3%
4%
5%
6%
7%
8%
9%
10%
0.20
0.22
0.24
0.26
0.28
0.30
0.32
0.34
0.36
0.38
0.40
1961 1966 1971 1976 1981 1986 1991 1996 2001 2006 2011 2016
Top
1% s
hare
of i
ncom
e
Gin
i coe
ffici
ent
Long-run inequality: 1961 to 2016–17 (GB)
Living Standards, Poverty and Inequality in the UK: 2018
Source: Figures 3.7 and 3.8 of Living Standards, Poverty and Inequality in the UK: 2018
Gini coefficient
Top 1% share of income (RH axis)

© Institute for Fiscal Studies
Changes in income inequality in the recovery
Living Standards, Poverty and Inequality in the UK: 2018
-2%
-1%
0%
1%
2%
3%
5 10 15 20 25 30 35 40 45 50 55 60 65 70 75 80 85 90 95
Ave
rag
e a
nn
ua
l in
com
e g
row
th
Percentile point
2007-08 to 2011-12
2011-12 to 2016-17
Source: Figure 3.10 of Living Standards, Poverty and Inequality in the UK: 2018
Increases in inequality
between bottom and middle
Decreases in inequality
between middle and top
2007-08 to 2016-17
© Institute for Fiscal Studies
Why did middle incomes grow faster than low or high incomes during the recovery?
1. Employment growth much larger in low (and middle) income households
Living Standards, Poverty and Inequality in the UK: 2018

© Institute for Fiscal Studies
Growth in employment favoured bottom and middle
Living Standards, Poverty and Inequality in the UK: 2018
0%
10%
20%
30%
40%
50%
60%
70%
80%
90%
100%
Lowest income 20% Middle income 20% Highest income 20%
16-6
4 em
ploy
men
t rat
e
2011-12 2016-17

© Institute for Fiscal Studies
Why did middle incomes grow faster than low or high incomes during the recovery?
1. Employment growth much larger in low (and middle) income households
2. Earnings growth has been strongest for low earners, which particularly benefits middle income households (!)
3. Earnings growth has been weak for high earners, which suppresses incomes of high income households
Living Standards, Poverty and Inequality in the UK: 2018

© Institute for Fiscal Studies
Real weekly earnings growth
0
10
20
30
40
50
60
70
80
90
0%
2%
4%
6%
8%
10%
12%
14%
16%
18%
10 20 30 40 50 60 70 80 90 Percentile of weekly earnings distribution
Real weekly earnings growth 2011-12 to 2016-17 (LH axis)
Living Standards, Poverty and Inequality in the UK: 2018
Average position (percentile) in household income distribution in 2016-17 (RH axis)

© Institute for Fiscal Studies
Why did middle incomes grow faster than low or high incomes during the recovery?
1. Employment growth much larger in low (and middle) income households
2. Earnings growth has been strongest for low earners, which particularly benefits middle income households (!)
3. Earnings growth has been weak for high earners, which suppresses incomes of high income households
4. Benefit incomes have fallen for lowest income households
Living Standards, Poverty and Inequality in the UK: 2018

© Institute for Fiscal Studies
Changes in working age benefit incomes since 2011-12
Living Standards, Poverty and Inequality in the UK: 2018
-30%
-20%
-10%
0%
10%
20%
30%
0 1-100 101-200 201-300 301-400 401-500 501+
Chan
ge in
mea
n be
nefi
t in
com
e
Total family earnings (£ per week, 2016-17 prices)
-23% = £420 per year
-6% = £620 per year

© Institute for Fiscal Studies
Why did middle incomes grow faster than low or high incomes during the recovery?
1. Employment growth much larger in low (and middle) income households
2. Earnings growth has been strongest for low earners, which particularly benefits middle income households (!)
3. Earnings growth has been weak for high earners, which suppresses incomes of high income households
4. Benefit incomes have fallen for lowest income households
Living Standards, Poverty and Inequality in the UK: 2018

© Institute for Fiscal Studies
Summary
Income growth during the recovery has been slow by long run historical standards, but faster than in the run up to the recession
‒ Driven by (relatively weak) growth in employment incomes
‒ If OBR forecasts are correct, expect relatively slow income growth in coming years
Income inequality much higher than it was late 1970s, little change overall since 1990
During the recovery from the recession, inequality rising between middle and bottom, falling between top and middle
‒ Due to trends in employment and earnings, and falls in benefit incomes
‒ Modest earnings growth + working age benefit cuts suggest increasing inequality in coming years
Living Standards, Poverty and Inequality in the UK: 2018

Poverty Agnes Norris Keiller
© Institute for Fiscal Studies Living Standards, Poverty and Inequality in the UK: 2018

Measuring poverty
Measure of low material living standards
• Proxy living standards with net household income
• Focus on income measured after housing costs are deducted (AHC)
Absolute income poverty (poverty line fixed in real terms)
• Income less than 60% of 2010‒11 median income (CPI adjusted)
• £7.2k p.a. for childless single adult; £17.5k p.a. for couple with 2 kids
Relative income poverty (moving poverty line)
• Income less than 60% of the contemporary median income
© Institute for Fiscal Studies Living standards, poverty and inequality: 2018

This presentation
How has poverty changed in recent years?
• How does this compare to previous periods?
• How has it differed for children and pensioners?
How have housing costs among low-income children changed?
• What does this mean for measuring poverty?
How have the living standards of low-wage employees changed following the introduction of the National Living Wage?
• How have these changes impacted poverty?
© Institute for Fiscal Studies Living standards, poverty and inequality: 2018
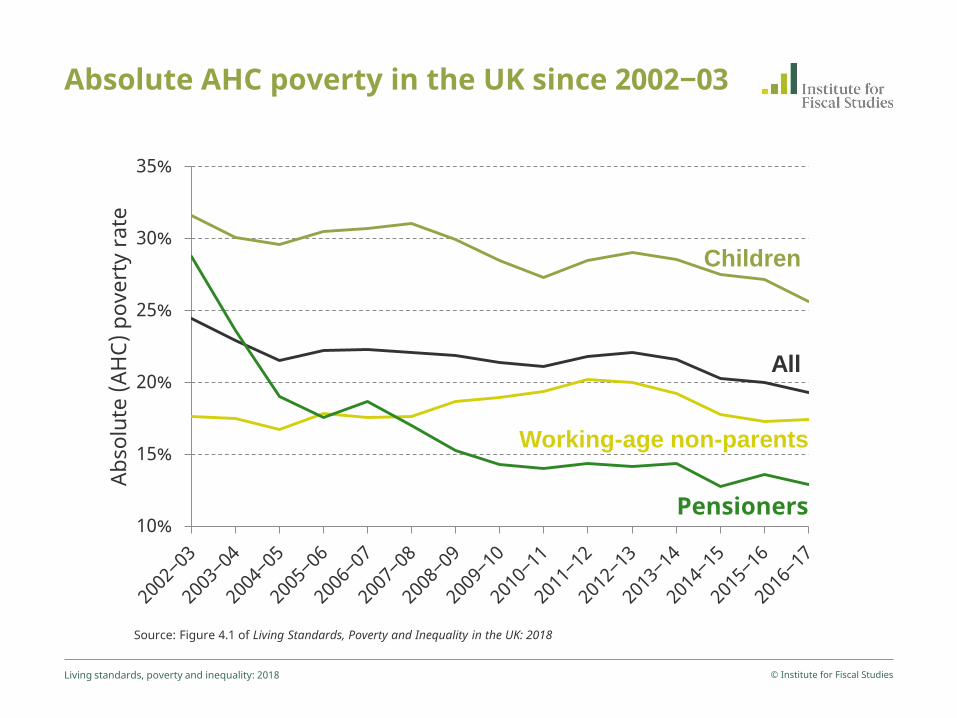
Absolute AHC poverty in the UK since 2002‒03
© Institute for Fiscal Studies Living standards, poverty and inequality: 2018
10%
15%
20%
25%
30%
35%
Abso
lute
(AH
C) p
over
ty ra
te
All
Children
Working-age non-parents
Source: Figure 4.1 of Living Standards, Poverty and Inequality in the UK: 2018
Pensioners

Recent falls in poverty vs earlier trends
© Institute for Fiscal Studies Living standards, poverty and inequality: 2018
-12
-10
-8
-6
-4
-2
0
2
4 All Pensioners Children
Working-age non-parents
Chan
ge in
abs
olut
e AH
C po
vert
y ra
te
(per
cent
age
poin
ts)
Source: Figure 4.2 of Living Standards, Poverty and Inequality in the UK: 2018
2011‒12 to 2016‒17
2007‒08 to 2011‒12 2002‒03 to 2007‒08

Why has pensioner poverty reduction slowed?
© Institute for Fiscal Studies Living standards, poverty and inequality: 2018
Many pensioners in 2002–03 had incomes slightly below poverty line

0%
1%
2%
3%
4%
5%
6%
7%
8%
9%
10% £0
£2
0 £4
0 £6
0 £8
0 £1
00
£120
£1
40
£160
£1
80
£200
£2
20
£240
£2
60
£280
£3
00
£320
£3
40
£360
£3
80
Perc
enta
ge o
f pen
sion
er p
opul
atio
n
Real household income (AHC)
Why has pensioner poverty reduction slowed?
© Institute for Fiscal Studies Living standards, poverty and inequality: 2018
Source: Figure 4.4 of Living Standards, Poverty and Inequality in the UK: 2018
2002‒03
9% Absolute poverty line (AHC)

0%
1%
2%
3%
4%
5%
6%
7%
8%
9%
10% £0
£2
0 £4
0 £6
0 £8
0 £1
00
£120
£1
40
£160
£1
80
£200
£2
20
£240
£2
60
£280
£3
00
£320
£3
40
£360
£3
80
Perc
enta
ge o
f pen
sion
er p
opul
atio
n
Real household income (AHC)
Why has pensioner poverty reduction slowed?
© Institute for Fiscal Studies Living standards, poverty and inequality: 2018
Source: Figure 4.4 of Living Standards, Poverty and Inequality in the UK: 2018
2002‒03
2011‒12
9% Absolute poverty line (AHC)

Why has pensioner poverty reduction slowed?
© Institute for Fiscal Studies Living standards, poverty and inequality: 2018
Many pensioners in 2002–03 had incomes slightly below poverty line
• Only small income growth needed to pull many out of poverty
Income growth among lowest-income fifth of pensioners has slowed
• 8% between 2002–03 and 2007–08; 1% between 2011–12 and 2016–17
• Largely due to slower growth in private pension and saving income

Why has child poverty reduction accelerated?
© Institute for Fiscal Studies Living standards, poverty and inequality: 2018
Between 2011‒12 and 2016–17:
• Falls in child poverty among both working and workless households
• Rises in parental employment
Between 2002–03 and 2007–08:
• Child poverty fell among workless households only
• Little change in parental employment

AHC poverty in the UK since 2002‒03
© Institute for Fiscal Studies Living standards, poverty and inequality: 2018
10%
15%
20%
25%
30%
35%
po
vert
y ra
te (A
HC)
All: absolute
poverty
Source: Figures 4.1 and 4.6 of Living Standards, Poverty and Inequality in the UK: 2018
All: relative
poverty

Relative AHC poverty in the UK since 2002‒03
© Institute for Fiscal Studies Living standards, poverty and inequality: 2018
10%
15%
20%
25%
30%
35%
Rela
tive
pove
rty
rate
(AH
C)
Source: Figure 4.6 of Living Standards, Poverty and Inequality in the UK: 2018
All

Relative AHC poverty in the UK since 2002‒03
© Institute for Fiscal Studies Living standards, poverty and inequality: 2018
10%
15%
20%
25%
30%
35%
Rela
tive
pove
rty
rate
(AH
C)
All
Children
Working-age non-parents
Source: Figure 4.6 of Living Standards, Poverty and Inequality in the UK: 2018
Pensioners

This presentation
How has poverty changed in recent years?
• How does this compare to previous periods?
• How has it differed for children and pensioners?
How have housing costs among low-income children changed?
• What does this mean for measuring poverty?
How have the living standards of low-wage employees changed following the introduction of the National Living Wage?
• How have these changes impacted poverty?
© Institute for Fiscal Studies Living standards, poverty and inequality: 2018

Fast growth in housing costs among low-income hhs. with children
© Institute for Fiscal Studies Living standards, poverty and inequality: 2018
Source: Figure 4.9 of Living Standards, Poverty and Inequality in the UK: 2018
-20%
-10%
0%
10%
20%
30%
40%
50%
1 (lowest)
2 3 4 5 (highest)
Chan
ge in
mea
n re
al h
ousi
ng c
osts
am
ong
child
ren
Household income quintile (AHC)
2002‒03 to 2016‒17

Fast growth in housing costs among low-income hhs. with children
© Institute for Fiscal Studies Living standards, poverty and inequality: 2018
Source: Author’s calculations using the Family Resources Survey 2002‒03 and 2016‒17
£0
£20
£40
£60
£80
£100
£120
1 (lowest)
2 3 4 5 (highest)
Mea
n re
al h
ousi
ng c
osts
am
ong
child
ren
Household income quintile (AHC)
2002‒03
2016‒17
£31

Fast growth in housing costs among low-income hhs. with children
© Institute for Fiscal Studies Living standards, poverty and inequality: 2018
Source: Author’s calculations using the Family Resources Survey 2002‒03 and 2016‒17
£0
£20
£40
£60
£80
£100
£120
1 (lowest)
2 3 4 5 (highest)
Mea
n re
al h
ousi
ng c
osts
net
of
hous
ing
bene
fit a
mon
g ch
ildre
n
Household income quintile (AHC)
2002‒03
2016‒17
£29

Housing tenure of low-income children
More live in social rented housing than higher-income children
• 38% of children in bottom income quintile
Less live in owner-occupied housing than higher-income children
• 25% of children in bottom income quintile
Low-income children have seen biggest shift towards private renting
• Children in bottom income quintile: 15% in 2002‒03; 36% in 2016‒17
© Institute for Fiscal Studies Living standards, poverty and inequality: 2018

Large differences in costs between tenures
© Institute for Fiscal Studies Living standards, poverty and inequality: 2018
£0
£20
£40
£60
£80
£100
£120
£140
£160
Mea
n re
al h
ousi
ng c
osts
am
ong
child
ren Social rented
Owner occupied
Private rented
Source: Figure 4.11 of Living Standards, Poverty and Inequality in the UK: 2018

Has relative child poverty fallen or risen?
© Institute for Fiscal Studies Living standards, poverty and inequality: 2018
10%
15%
20%
25%
30%
35%
Rela
tive
child
pov
erty
rat
e
Source: Figure 4.7 of Living Standards, Poverty and Inequality in the UK: 2018
Fallen
by 3 ppt.
BHC

Has relative child poverty fallen or risen?
© Institute for Fiscal Studies Living standards, poverty and inequality: 2018
10%
15%
20%
25%
30%
35%
Rela
tive
child
pov
erty
rat
e
BHC
Source: Figure 4.7 of Living Standards, Poverty and Inequality in the UK: 2018
Fallen
by 3 ppt.
Risen by
1 ppt. AHC

AHC better at tracking changes in poverty than BHC
Fast growth in housing costs among low-income households
• Likely to have reduced living standards
• Overlooked in BHC measures of income poverty
Changes in BHC poverty do not always reflect changes in living standards of low-income households
© Institute for Fiscal Studies Living standards, poverty and inequality: 2018

This presentation
How has poverty changed in recent years?
• How does this compare to previous periods?
• How has it differed for children and pensioners?
How have housing costs among low-income children changed?
• What does this mean for measuring poverty?
How have the living standards of low-wage employees changed following the introduction of the National Living Wage?
• How have these changes impacted poverty?
© Institute for Fiscal Studies Living standards, poverty and inequality: 2018

Fast pay growth among low-wage employees
© Institute for Fiscal Studies Living standards, poverty and inequality: 2018
-4%
-3%
-2%
-1%
0%
1%
2%
3%
4%
5%
6%
7%
1 (lowest-paid)
2 3 4 5 (highest-paid)
Real
gro
wth
from
201
5‒16
to 2
016‒
17
Pre-tax weekly earnings
Source: Figures 6.5 and 6.6 of Living Standards, Poverty and Inequality in the UK: 2018
Hourly wage quintile
but little change in av. living standards
½%
6%
Household net income (BHC)

Where are low-wage employees in the income distribution?
© Institute for Fiscal Studies Living standards, poverty and inequality: 2018
0%
2%
4%
6%
8%
10%
12%
14%
1 2 3 4 5 6 7 8 9 10
Household income decile (BHC) (lowest- income)
(highest- income)
Source: Figure 6.10b of Living Standards, Poverty and Inequality in the UK: 2018
62% have
below-av.
household
income
38% have
above-av.
household
income
Av. household
income grew by
2% in 2016‒17
Av. household
income fell by
2% in 2016‒17
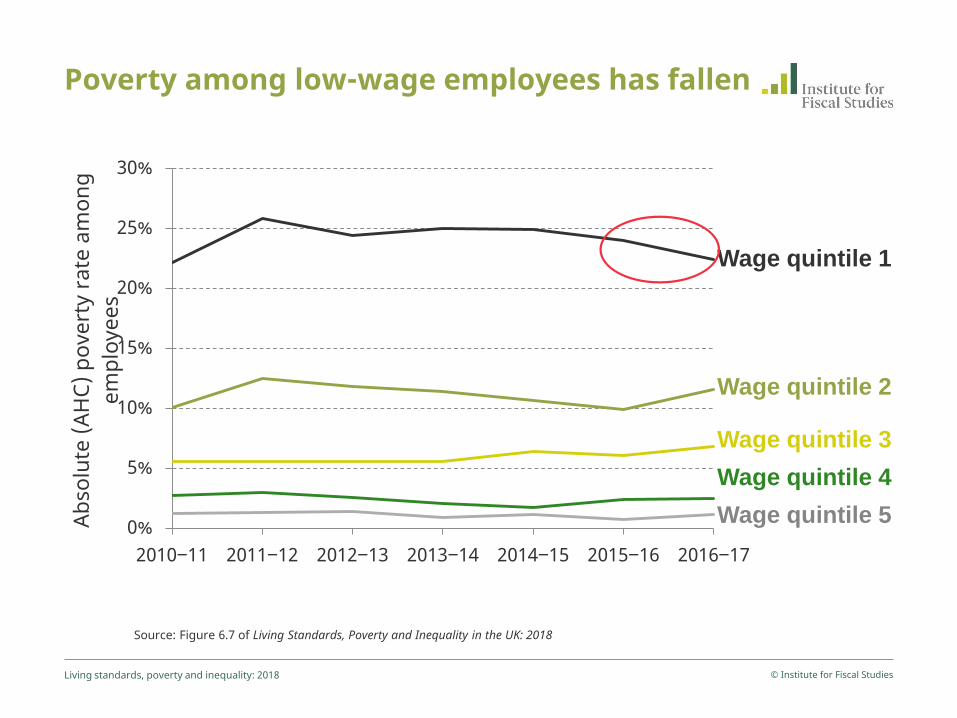
Poverty among low-wage employees has fallen
© Institute for Fiscal Studies Living standards, poverty and inequality: 2018
Source: Figure 6.7 of Living Standards, Poverty and Inequality in the UK: 2018
0%
5%
10%
15%
20%
25%
30%
2010‒11 2011‒12 2012‒13 2013‒14 2014‒15 2015‒16 2016‒17
Abso
lute
(AH
C) p
over
ty ra
te a
mon
g em
ploy
ees
Wage quintile 1
Wage quintile 2
Wage quintile 3
Wage quintile 4
Wage quintile 5

Summary
Absolute (AHC) poverty down from 22% in 2011‒12 to 19% in 2016‒17
Relative (AHC) poverty up slightly from 21% in 2011‒12 to 22% in 2016‒17
Fast growth in housing costs for low-income children have caused AHC and BHC poverty rates to diverge
NLW followed by strong pay growth for low-wage employees, little change in their av. living standards but falls in absolute poverty
© Institute for Fiscal Studies Living standards, poverty and inequality: 2018

Poverty among working-age adults in poor health Tom Waters
© Institute for Fiscal Studies Living Standards, Poverty and Inequality in the UK: 2018

Working age adults in poor health
Increasingly important policy issue:
1. More 25-54 year olds out of work because of sickness & disability than because they cannot find a job.
© Institute for Fiscal Studies Poverty among working-age adults in poor health

Working age adults in poor health
Increasingly important policy issue:
1. More 25-54 year olds out of work because of sickness & disability than because they cannot find a job.
2. Working-age health-related benefit (incapacity and disability) spending on the rise; spending on other working-age benefits falling.
© Institute for Fiscal Studies Poverty among working-age adults in poor health

Spending on working-age income replacement and disability benefits
© Institute for Fiscal Studies Poverty among working-age adults in poor health
0
5
10
15
20
1978
–79
1980
–81
1982
–83
1984
–85
1986
–87
1988
–89
1990
–91
1992
–93
1994
–95
1996
–97
1998
–99
2000
–01
2002
–03
2004
–05
2006
–07
2008
–09
2010
–11
2012
–13
2014
–15
2016
–17
2018
–19
2020
–21
2022
–23
Annu
al e
xpen
ditu
re, £
bn (2
018–
19 p
rices
)
Income support (lone parents) Forecast Income support (lone parents and carers) Incapacity benefits Unemployment benefits Disability benefits
Source: Figure 5.3 of Living Standards, Inequality and Poverty in the UK: 2018

Working age adults in poor health
Increasingly important policy issue:
1. More 25-54 year olds out of work because of sickness & disability than because they cannot find a job.
2. Working-age health-related benefit (incapacity and disability) spending on the rise; spending on other working-age benefits falling.
3. Government committed to halving ‘disability employment gap’.
© Institute for Fiscal Studies Poverty among working-age adults in poor health

0%
10%
20%
30%
40%
50%
60%
70%
80%
90%
Non-disabled Disabled
Employment rates, disabled and non-disabled
© Institute for Fiscal Studies Poverty among working-age adults in poor health
Source: Office for National Statistics, UK labour market: May 2018

0%
10%
20%
30%
40%
50%
60%
70%
80%
90%
Non-disabled Disabled
Employment rates, disabled and non-disabled
© Institute for Fiscal Studies Poverty among working-age adults in poor health
1 in 3 disabled out of work into work
Source: Office for National Statistics, UK labour market: May 2018
‘Target’

Working age adults in poor health
Increasingly important policy issue:
1. More 25-54 year olds out of work because of sickness & disability than because they cannot find a job.
2. Working-age health-related benefit (incapacity and disability) spending on the rise; spending on other working-age benefits falling.
3. Government committed to halving ‘disability employment gap’.
© Institute for Fiscal Studies Poverty among working-age adults in poor health

This presentation
Measure health according to self-reported mental/physical condition lasting 12+ months – “longstanding illness”.
• e.g. Diabetes, respiratory problems, mental health problem.
Focus on the 25-54 year old population.
Questions to answer in this presentation:
• Who has a longstanding illness?
• How do they do in the labour market?
• How do their living standards compare to healthy people?
© Institute for Fiscal Studies Poverty among working-age adults in poor health

Who has a longstanding illness?
© Institute for Fiscal Studies Poverty among working-age adults in poor health

What kind of conditions do they have? Share of 25-54 year olds with a longstanding illness
© Institute for Fiscal Studies Poverty among working-age adults in poor health
0%
5%
10%
15%
20%
25%
30%
2013–14 2014–15 2015–16 2016–17 2017–18
Diabetes
Stomach, liver, kidney, digestion Cardiovascular
Respiratory
Source: Figure 5.4 of Living Standards, Inequality and Poverty in the UK: 2018

What kind of conditions do they have? Share of 25-54 year olds with a longstanding illness
© Institute for Fiscal Studies Poverty among working-age adults in poor health
0%
5%
10%
15%
20%
25%
30%
2013–14 2014–15 2015–16 2016–17 2017–18
Diabetes
Stomach, liver, kidney, digestion Cardiovascular
Respiratory
Other
Back, neck, limbs
Source: Figure 5.4 of Living Standards, Inequality and Poverty in the UK: 2018

What kind of conditions do they have? Share of 25-54 year olds with a longstanding illness
© Institute for Fiscal Studies Poverty among working-age adults in poor health
0%
5%
10%
15%
20%
25%
30%
2013–14 2014–15 2015–16 2016–17 2017–18
Diabetes
Stomach, liver, kidney, digestion Cardiovascular
Respiratory
Mental health
Other
Back, neck, limbs
Source: Figure 5.4 of Living Standards, Inequality and Poverty in the UK: 2018

Demographics and illness Share of 25-54 year olds with a long-standing illness
© Institute for Fiscal Studies Poverty among working-age adults in poor health
0% 5% 10% 15% 20% 25% 30% 35% 40%
Low education
High education
All
Long-standing mental health problem Other long-standing illness
Source: Figure 5.5 of Living Standards, Inequality and Poverty in the UK: 2018

Demographics and illness Share of 25-54 year olds with a long-standing illness
© Institute for Fiscal Studies Poverty among working-age adults in poor health
0% 5% 10% 15% 20% 25% 30% 35% 40%
In a couple
Single
Low education
High education
All
Long-standing mental health problem Other long-standing illness
Source: Figure 5.5 of Living Standards, Inequality and Poverty in the UK: 2018

Demographics and illness Share of 25-54 year olds with a long-standing illness
© Institute for Fiscal Studies Poverty among working-age adults in poor health
0% 5% 10% 15% 20% 25% 30% 35% 40%
Aged 45–54
Aged 35–44
Aged 25–34
In a couple
Single
Low education
High education
All
Long-standing mental health problem Other long-standing illness
Source: Figure 5.5 of Living Standards, Inequality and Poverty in the UK: 2018
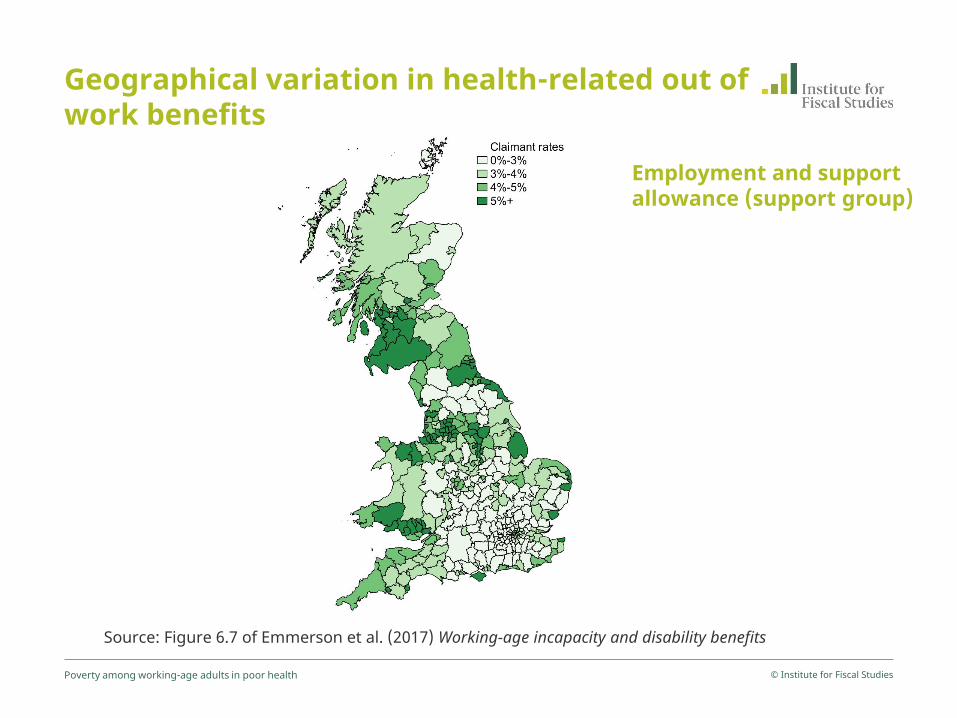
Geographical variation in health-related out of work benefits
© Institute for Fiscal Studies Poverty among working-age adults in poor health
Source: Figure 6.7 of Emmerson et al. (2017) Working-age incapacity and disability benefits
Employment and support allowance (support group)

Who are the unwell population?
Back, neck, and limbs problems are the most common conditions.
Mental health problems on the rise.
Those with a longstanding illness are generally less educated, more likely to be single, and older.
Incapacity benefit claimants concentrated in West of Scotland, South Wales, North of England
© Institute for Fiscal Studies Poverty among working-age adults in poor health
How do they do in the labour market?
© Institute for Fiscal Studies Poverty among working-age adults in poor health

Out-of-work rates and longstanding illness Share of 25-54 year olds out of work
© Institute for Fiscal Studies Poverty among working-age adults in poor health
All 0%
5%
10%
15%
20%
25%
30%
35%
No longstanding illness With a longstanding illness Source: Figure 5.8 of Living Standards, Inequality and Poverty in the UK: 2018
18ppts
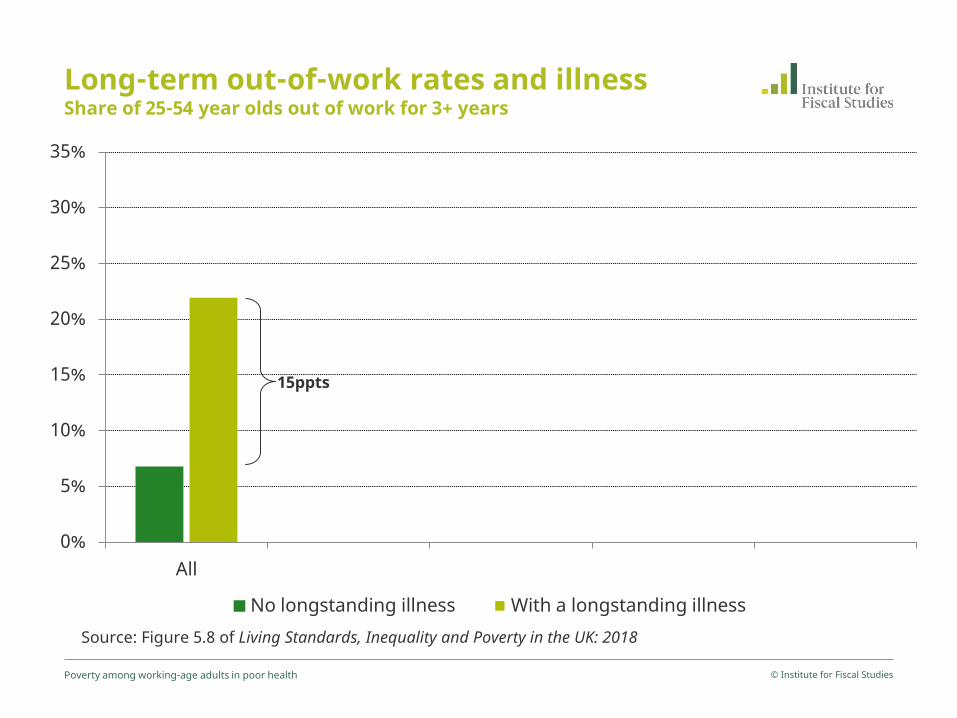
Long-term out-of-work rates and illness Share of 25-54 year olds out of work for 3+ years
© Institute for Fiscal Studies Poverty among working-age adults in poor health
All 0%
5%
10%
15%
20%
25%
30%
35%
No longstanding illness With a longstanding illness Source: Figure 5.8 of Living Standards, Inequality and Poverty in the UK: 2018
15ppts

Long-term out-of-work rates and illness Share of 25-54 year olds out of work for 3+ years
© Institute for Fiscal Studies Poverty among working-age adults in poor health
Women Men All 0%
5%
10%
15%
20%
25%
30%
35%
No longstanding illness With a longstanding illness Source: Figure 5.8 of Living Standards, Inequality and Poverty in the UK: 2018
70% of men who are long term out of work are ill

Long-term out-of-work rates and illness Share of 25-54 year olds out of work for 3+ years
© Institute for Fiscal Studies Poverty among working-age adults in poor health
Low education High education Women Men All 0%
5%
10%
15%
20%
25%
30%
35%
No longstanding illness With a longstanding illness Source: Figure 5.8 of Living Standards, Inequality and Poverty in the UK: 2018
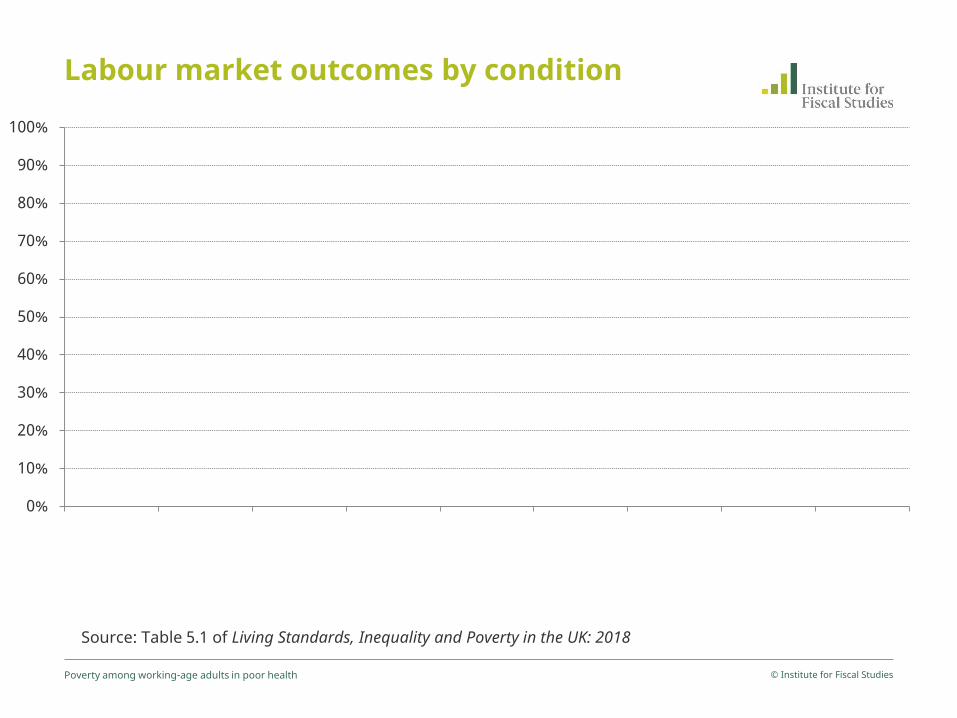
Labour market outcomes by condition
© Institute for Fiscal Studies Poverty among working-age adults in poor health
Source: Table 5.1 of Living Standards, Inequality and Poverty in the UK: 2018
0%
10%
20%
30%
40%
50%
60%
70%
80%
90%
100%
Respiratory Cardiovascular Diabetes Stomach, liver, kidney,
digestion
All healthy
Employment rate (LHS)
32% of those with an illness

Labour market outcomes by condition
© Institute for Fiscal Studies Poverty among working-age adults in poor health
Source: Table 5.1 of Living Standards, Inequality and Poverty in the UK: 2018
0%
10%
20%
30%
40%
50%
60%
70%
80%
90%
100%
Respiratory Cardiovascular Diabetes Stomach, liver, kidney,
digestion
Back, neck, limbs
Other All healthy
Employment rate (LHS)

Labour market outcomes by condition
© Institute for Fiscal Studies Poverty among working-age adults in poor health
Source: Table 5.1 of Living Standards, Inequality and Poverty in the UK: 2018
0%
10%
20%
30%
40%
50%
60%
70%
80%
90%
100%
Respiratory Cardiovascular Diabetes Stomach, liver, kidney,
digestion
Back, neck, limbs
Other Mental health All healthy
Employment rate (LHS)
36ppt gap

Labour market outcomes by condition
© Institute for Fiscal Studies Poverty among working-age adults in poor health
Source: Table 5.1 of Living Standards, Inequality and Poverty in the UK: 2018
0
50
100
150
200
250
300
350
400
450
500
0%
10%
20%
30%
40%
50%
60%
70%
80%
90%
100%
Respiratory Cardiovascular Diabetes Stomach, liver, kidney,
digestion
Back, neck, limbs
Other Mental health All healthy
Employment rate (LHS) Median earnings of employees (£ per week) (RHS)
23% gap

How do those with an illness do in the labour market?
People with a longstanding illness are more likely to be out of work, and much more likely to be long-term out of work than those without.
Men & low educated especially likely to be long-term out of work if they have a longstanding illness.
Those with mental health conditions experience considerably worse labour market outcomes than people with other conditions.
© Institute for Fiscal Studies Poverty among working-age adults in poor health

How do their living standards compare to healthy people?
© Institute for Fiscal Studies Poverty among working-age adults in poor health

Living standards and poor health
Given poorer labour market outcomes of those with longstanding illness, likely to lead to lower incomes & living standards.
© Institute for Fiscal Studies Poverty among working-age adults in poor health

Living standards and poor health
© Institute for Fiscal Studies Poverty among working-age adults in poor health
1.00
1.25
1.50
1.75
2.00
0%
5%
10%
15%
20%
25%
30%
35%
40%
'Snapshot' relative poverty (BHC)
Ratio
of u
nwel
l to
heal
thy
Prop
ortio
n of
hea
lthy/
unw
ell 2
5-54
yea
r old
s
No longstanding illness With a longstanding illness Ratio (RHS) Source: Figure 5.11 of Living Standards, Inequality and Poverty in the UK: 2018

Living standards and poor health
Given poorer labour market outcomes of those with longstanding illness, likely to lead to lower incomes & living standards.
But other ways illness related to living standards, including:
• Low income for longer periods
• Expenditure on health-related goods & services
Therefore, ‘snapshot’ (income) poverty doesn’t tell the whole story.
© Institute for Fiscal Studies Poverty among working-age adults in poor health

Living standards and poor health
© Institute for Fiscal Studies Poverty among working-age adults in poor health
1.00
1.25
1.50
1.75
2.00
0%
5%
10%
15%
20%
25%
30%
35%
40%
'Snapshot' relative poverty (BHC)
Persistent relative poverty (BHC)
Ratio
of u
nwel
l to
heal
thy
Prop
ortio
n of
hea
lthy/
unw
ell 2
5-54
yea
r old
s
No longstanding illness With a longstanding illness Ratio (RHS) Source: Figure 5.11 of Living Standards, Inequality and Poverty in the UK: 2018

Living standards and poor health
© Institute for Fiscal Studies Poverty among working-age adults in poor health
1.00
1.25
1.50
1.75
2.00
0%
5%
10%
15%
20%
25%
30%
35%
40%
'Snapshot' relative poverty (BHC)
Persistent relative poverty (BHC)
Material deprivation
Ratio
of u
nwel
l to
heal
thy
Prop
ortio
n of
hea
lthy/
unw
ell 2
5-54
yea
r old
s
No longstanding illness With a longstanding illness Ratio (RHS) Source: Figure 5.11 of Living Standards, Inequality and Poverty in the UK: 2018

0% 10% 20% 30% 40% 50% 60%
With any longstanding illness
No longstanding illness
Poverty, mental health, and multiple illnesses Share of 25-54 year olds in relative poverty and material deprivation
© Institute for Fiscal Studies Poverty among working-age adults in poor health
Relative poverty (AHC)
Material deprivation
Source: Figure 5.13 of Living Standards, Inequality and Poverty in the UK: 2018

0% 10% 20% 30% 40% 50% 60%
With mental health problem
With any longstanding illness
No longstanding illness
Poverty, mental health, and multiple illnesses Share of 25-54 year olds in relative poverty and material deprivation
© Institute for Fiscal Studies Poverty among working-age adults in poor health
Relative poverty (AHC)
Material deprivation
Source: Figure 5.13 of Living Standards, Inequality and Poverty in the UK: 2018

Summary
Poor health is associated with significantly lower living standards
Those with mental health problems see markedly worse outcomes
• Employment, earnings, living standards
• Particularly concerning as mental health problems on the rise
Snapshot measures understate poor outcomes among those with a longstanding illness
• Much more likely to be long term out of work
• Large differences in persistent poverty & material deprivation
© Institute for Fiscal Studies Poverty among working-age adults in poor health

20 June 2018
http://www.ifs.org.uk
@theifs #livingstandards
Institute for Fiscal Studies
Wifi details:
Network name: The Building Centre (Open network)
Living standards, poverty and inequality in the UK: 2018

20 June 2018
http://www.ifs.org.uk
@theifs #livingstandards
Institute for Fiscal Studies
Wifi details:
Network name: The Building Centre (Open network)
Living standards, poverty and inequality in the UK: 2018