living in the covid-19 pandemic: the health, finances, and
TRANSCRIPT
© Transamerica Institute®, 2019
Living in the COVID-19 Pandemic:
The Health, Finances, and Retirement Prospects of Four Generations
21st Annual Transamerica Retirement Survey of Workers
August 2021
© 2021 Transamerica Institute®. All rights reserved.

Table of Contents
Introduction
About the Authors Page 3
About Transamerica Center for Retirement Studies® Page 4
About the Survey Page 5
Methodology: 21st Annual Transamerica Retirement Survey of Workers Page 6
Terminology Page 7
Acknowledgements Page 8
Living in the COVID-19 Pandemic: The Health, Finances, and Retirement Prospects of Four Generations
Key Highlights Page 9
Recommendations Page 32
Detailed Findings Page 35
― A Portrait of Four Generations Page 36
― In Their Own Words: What I Am Doing Differently Amid COVID-19… Page 41
― Physical and Mental Health Page 42
― Employment Impacts Page 52
― Current Financial Situation Page 61
― Visions and Expectations of Retirement Page 75
― Retirement Savings, Planning, and Preparations Page 92
― The Importance of Employer-Sponsored Retirement Benefits Page 119
Appendix Page 134
― Demographics by Generation Page 135
2

About the Authors
Catherine Collinson serves as CEO and president of Transamerica Institute®, a nonprofit private foundation which includes
Transamerica Center for Retirement Studies®. She is a champion for Americans who are at risk of not achieving a financially
secure retirement. Catherine oversees all research, publications, and outreach initiatives, including the Annual Transamerica
Retirement Survey.
With more than two decades of retirement industry experience, Catherine has become a nationally recognized voice on
retirement trends. She has testified before Congress on matters related to employer-sponsored retirement plans among
small business, which featured the need to raise awareness of the Saver’s Credit among those who would benefit most from
the important tax credit.
In 2018, Catherine was named an Influencer in Aging by PBS’ Next Avenue. In 2016, she was honored with a Hero Award
from the Women’s Institute for a Secure Retirement (WISER) for her tireless efforts in helping improve retirement security
among women. Catherine serves on the Advisory Board Leadership Council of the Milken Institute’s Center for the Future of
Aging. She co-hosts the ClearPath: Your Roadmap to Health & Wealth radio show on Baltimore’s WYPR, an NPR news station.
Catherine is employed by Transamerica Corporation. Since joining the organization in 1995, she has held a number of
positions with responsibilities including the incorporation of Transamerica Center for Retirement Studies as a nonprofit
private foundation in 2007 and its expansion into Transamerica Institute in 2013.
Patti Rowey serves as vice president of Transamerica Institute. She is retirement and aging expert and helps manage and
execute research initiatives, including the Annual Transamerica Retirement Survey. Patti has more than 20 years of
retirement services experience, specializing in market research covering a broad range of stakeholders, including retirement
plan participants and sponsors, financial advisors, retirees — and future savers. She is employed by Transamerica
Corporation.
Heidi Cho is a senior research content analyst for Transamerica Institute. She began her career as an intern at Transamerica
Center for Retirement Studies in 2012. She joined the organization full time in 2014 upon graduating from the University of
Southern California. She is employed by Transamerica Corporation.
3
About Transamerica Center for Retirement Studies
• Transamerica Center for Retirement Studies® (TCRS) is a division of Transamerica Institute® (The
Institute), a nonprofit, private foundation. TCRS is dedicated to educating the public on emerging trends
surrounding retirement security in the United States. Its research emphasizes employer-sponsored
retirement plans, including companies and their employees, retirees, and the implications of legislative
and regulatory changes. For more information about TCRS, please refer to www.transamericacenter.org.
• The Institute is funded by contributions from Transamerica Life Insurance Company and its affiliates,
and may receive funds from unaffiliated third parties.
• TCRS and its representatives cannot give ERISA, tax, investment, or legal advice. This material is
provided for informational purposes only and should not be construed as ERISA, tax, investment, or legal
advice. Interested parties must consult and rely solely upon their own independent advisors regarding
their particular situation and the concepts presented here.
• Although care has been taken in preparing this material and presenting it accurately, TCRS disclaims
any express or implied warranty as to the accuracy of any material contained herein and any liability with
respect to it.
4

About the Survey and Report
• Since 1998, Transamerica Center for Retirement Studies® (TCRS) has conducted a national survey of
U.S. business employers and workers regarding their attitudes toward retirement. The overall goals for
the study are to illuminate emerging trends, promote awareness, and help educate the public. It has
grown to be one of the longest running and largest national surveys of its kind.
• Limited Print and Electronic Rights. This document and trademark(s) contained herein are federally
registered or otherwise protected by law. This representation of Transamerica Institute (TI) intellectual
property is provided for noncommercial use only and this work is licensed under the Creative Commons
Attribution-NonCommercial-NoDerivatives 4.0 International License. To view a copy of this license, visit
http://creativecommons.org/licenses/by-nc-nd/4.0/ or send a letter to Creative Commons, PO Box
1866, Mountain View, CA 94042, USA. Unauthorized posting of this publication online is prohibited.
Permission is required from TI/TCRS to reproduce, or reuse this work, in any form, or any of TI/TCRS’
research or other proprietary documents for commercial use.
5

Methodology: 21st Annual Transamerica Retirement Survey of Workers
• The analysis contained in this report was prepared internally by the research team at Transamerica
Institute (TI) and Transamerica Center for Retirement Studies (TCRS).
• A 25-minute online survey was conducted within the U.S. by The Harris Poll on behalf of TI and TCRS
between November 17 and December 29, 2020 among a nationally representative sample of 10,192
respondents. The data in this report is shown for a subsample of 3,109 workers in for-profit companies.
Worker respondents met the following criteria:
― U.S. residents, age 18 or older
― Full-time or part-time in a for-profit company employing one (1) or more employees
• The base includes:
― 301 Generation Z workers
― 1,249 Millennial workers
― 960 Generation X
― 573 Baby Boomers
― 26 workers who were born prior to 1946
• Data were weighted as follows:
― Census data were referenced for education, age by gender, race/ethnicity, region, household
income, education, employment, marital status, and size of household where necessary to align
them with their actual proportions in the population.
― The weighting also adjusts for attitudinal and behavioral differences between those who are online
versus those who are not, those who join online panels versus those who do not, and those who
respond to surveys versus those who do not.
• Percentages are rounded to the nearest whole percent.
6

Terminology
The report uses the following terminology:
Generation*
Generation Z: Born 1997 to 2012
Millennial: Born 1981 to 1996
Generation X: Born 1965 to 1980
Baby Boomer: Born 1946 to 1964
*Note: TCRS has updated its definition of birth years for generations to align with standard industry
practice, as defined by Pew Research Center. This is the first year that TCRS is using these definitions.
All Workers
Refers to all workers in a for-profit company and aged 18 and older
7

Acknowledgements
Kelly Allsup
Kent Callahan
Sean Cassidy
Heidi Cho
Benita Collier
Catherine Collinson
Andrew Cook
Robert Daniels
Phil Eckman
Steve Eichmann
Lard Friese
Will Fuller
Michelle Gosney
David Hopewell
Sanjana Tharuvesanchi
Aimee Vella Ripley
Mihaela Vincze
Ashlee Vogt
Patti Vogt Rowey
Holly Waters
Ashley Weibel
Steven Weinberg
Kimberly Welch
Hank Williams
Allison Wilson
Elizabeth Jackson
Morgan Karbowski
David Krane
Nicole Malik
Bryan Mayaen
Kerry Paredes
Maurice Perkins
Karyn Polak
Jamie Poston
Julie Quinlan
Diya Radhakrishna
David Schulz
Laura Scully
Frank Sottosanti
8

Key Highlights
Workers have been navigating a public health crisis that has
disrupted their daily lives. They have been coping with concerns
ranging from health and family to employment and finances.
With the immediacy of these concerns and uncertainty about the
future, it is surprising that their preparations for retirement, an
abstract and distant time for many, have not been altogether
forgotten. Nevertheless, many are at risk of not achieving a
financially secure retirement, unless action is taken by
policymakers, employers, and workers.
Living in the COVID-19 Pandemic: The Health, Finances, and
Retirement Prospects of Four Generations, a collaboration
between Transamerica Center for Retirement Studies and
Transamerica Institute, examines the retirement outlook of
Generation Z, Millennials, Generation X, and Baby Boomers. It
focuses on the experiences of employed workers of for-profit
companies and the impacts of the pandemic on their health,
employment, financial well-being, and their ability to save and
invest for retirement. The report is based on findings from the
21st Annual Transamerica Retirement Survey, one of the largest
and longest running surveys of its kind. The survey was
conducted in late 2020 when COVID-19 cases were surging, and
many businesses were shuttered or operating at limited capacity
because of the pandemic.
9

Key Highlights
A Portrait of Four Generations
The retirement landscape has been evolving due to increases in longevity, the dynamic nature of the workforce and employment
trends, the transformation of employer-sponsored retirement benefits, and potential reforms to Social Security benefits. Even
before the pandemic, these changes have been so significant that many of the underlying expectations and assumptions about
retirement differ among the four generations currently in the workforce.
• Generation Z (Born 1997 to 2012). Generation Z are internet natives who are saving for retirement in employer-sponsored
401(k) or similar plans and through personal savings and investments. Generation Z workers are starting to save for
retirement at an unprecedented young age. They will likely change employers many times throughout their careers and
spend time in self-employment, which will require diligence on their part to manage and potentially consolidate their
retirement accounts during these transitions. They began entering the workforce shortly before the COVID-19 pandemic
when unemployment rates were at historic lows, but which subsequently skyrocketed at the onset of the pandemic.
Generation Z will be entering their mid-30s in the 2030s when the Social Security trust fund is estimated to be depleted
unless Congress implements reforms.
• Millennials (Born 1981 to 1996). Millennials are digital natives and retirement savers who will rely on self-funded savings
more than their predecessors. Many entered the workforce around the time of the Great Recession — with higher levels of
student debt than previous generations. Millennials are buying homes, getting married, and starting families at older ages
than past generations. With the aging of Baby Boomers, many Millennials have been, or will be, called upon to serve as
caregivers for their parents, which could detract from their employment and ability to save for retirement. Many Millennials
expect their primary source of retirement income to be self-funded through retirement accounts (e.g., 401(k)s, 403(b)s,
IRAs), or other savings and investments. Most are concerned that Social Security will not be there for them when they are
ready to retire.
• Generation X (Born 1965 to 1980). Generation X entered the workforce in the late 1980s just as 401(k) plans were making
their first appearance and defined benefit plans were beginning to disappear; as such, they are the first generation to have
access to 401(k) plans for the majority of their working careers. Most are saving for retirement, but many are behind on
their savings. The oldest Generation Xers are now in their mid-50s and the youngest are in their early 40s. Although they are
in their sandwich years, during which they may be juggling their careers with raising children and caring for aging parents,
there is no time like the present for them to fully engage in building their assets and long-term financial plans.
10

Key Highlights
A Portrait of Four Generations (cont.)
• Baby Boomers (Born 1946 to 1964). Baby Boomers are the generation that has re-written societal rules at every stage of
their lives. They have also been redefining retirement for themselves and generations to follow. Working Baby Boomers are
planning to work to older ages compared with previous generations. However, few have a backup plan if forced into
retirement unexpectedly. Many were already mid-career when the retirement landscape shifted from defined benefit plans
to 401(k) or similar plans. They have not had a time horizon of 40-plus years to save in 401(k)s. Amid the pandemic, Baby
Boomers have faced health and employment-related risks that could be disruptive their retirement plans. Many Baby
Boomers will be relying on Social Security as their primary form of income in retirement.*
One thing that workers share across generations is that many are at risk of not achieving a financially secure retirement, an
area of growing concern amid the pandemic and its inevitable aftereffects. Given the disruption of the pandemic on workers’
employment, finances, health, and the increased strain on social safety nets, the retirement risks faced by workers are greater
than ever before.
Physical and Mental Health
Workers generally have positive sentiments about their lives amid the pandemic, but many are also struggling with anxieties
and concerns about their physical and mental health. Younger generations, including Generation Z and Millennials, are even
more likely to be concerned about their mental health.
• Workers Are Generally Upbeat but Many Are Distressed. Most workers share positive sentiments about life, such as having
close relationships with family and/or friends (88 percent), being generally happy (86 percent), enjoying life (82 percent),
and having a strong sense of purpose in life (82 percent). Seventy-four percent of workers have a positive view of aging
and 64 percent have an active social life. However, a concerning proportion of workers are experiencing distress, such as
often feeling anxious and depressed (40 percent), often feeling unmotivated and overwhelmed (39 percent), having
trouble making ends meet (37 percent), and feeling isolated and lonely (31 percent).
• Younger Generations Are More Likely to Be Distressed. Half or more of Generation Z and Millennials indicate they often
feel anxious and depressed (52 percent and 50 percent, respectively). Almost six in 10 Generation Z (59 percent) and 48
percent of Millennials say they often feel unmotivated and overwhelmed. Thirty-nine percent of Generation Z and almost
half of Millennials (46 percent) have trouble making ends meet. Approximately four in 10 Generation Z and Millennials feel
isolated and alone (41 percent and 38 percent, respectively).
*Note: In TCRS’ 2019 survey of retirees, 69 percent of retirees indicated that Social Security will be their primary source of income over the course of their retirement. 11

Key Highlights
Physical and Mental Health (cont.)
• Health and Financial-Related Anxieties Caused by the Pandemic. More than eight in 10 workers (84 percent) have
experienced one or more causes of anxiety during the pandemic. Sixty-eight percent cite health-related anxieties including
the risk of contracting COVID-19 (44 percent), their family’s health (40 percent), and their own health (32 percent). Forty-
five percent cite financial-related anxieties such as their finances (32 percent), employment insecurity (23 percent), and
housing expenses (17 percent). One-third of workers cite concerns about family and friends (35 percent) and uncertainty
about the future (33 percent). Other causes of anxiety include social injustice (18 percent), strained relationships (16
percent), and their home environment (e.g., crowded conditions, multigenerational household, isolation, etc.) (14 percent).
• Younger Generations More Likely to Cite Causes of Anxiety. More than three in four workers across generations have
experienced one or more causes of anxiety during the pandemic; however, Generation Z (91 percent) and Millennials (88
percent) are more likely than Generation X (81 percent) and Baby Boomers (78 percent) to have done so. Generation Z and
Millennials (both 53 percent) are more likely than older generations to cite financial-related anxieties. Generation Z and
Millennials are also more likely to cite other sources of anxiety during the pandemic such as social injustice, strained
relationships, and their home environment. Generation Z is also more likely to cite uncertainty about the future as a cause
of anxiety. Approximately one in five Baby Boomers (22 percent) and Generation X (19 percent) indicate nothing has caused
them anxiety during the pandemic.
• 4 in 5 Workers Describe Themselves as Healthy. Eighty-three percent of workers describe their general health as “excellent”
or “good,” with 25 percent describing it as “excellent” and 58 percent as “good.” Fifteen percent describe their health as
being “fair” and one percent as “poor.” Millennials, Generation Z, and Generation X are more likely to describe their general
health as “excellent” (30 percent, 26 percent, and 25 percent, respectively), compared with Baby Boomers (17 percent).
• Two-Thirds of Workers Are Concerned About Their Physical Health. Sixty-six percent of workers are concerned about their
physical health, including 29 percent who are “very concerned” and 37 percent who are “somewhat concerned.” Millennials
(36 percent) are more likely to be “very concerned” than Generation X (27 percent), Generation Z (24 percent), and Baby
Boomers (20 percent).
• 3 in 5 Workers Are Concerned About Their Mental Health. Sixty percent of workers are concerned about their mental health,
including 29 percent who are “very concerned” and 31 percent who are “somewhat concerned.” Millennials (38 percent)
and Generation Z (36 percent) are significantly more likely to be “very concerned” than Generation X (27 percent) and Baby
Boomers (14 percent).
12

Key Highlights
Physical and Mental Health (cont.)
• Workers Can Do More to Safeguard Their Health. When asked about health-related activities they are doing on a
consistent basis, more than seven in 10 workers (71 percent) are engaging in pandemic-related activities, including taking
COVID-19 precautions (62 percent) and socializing with family and friends remotely (43 percent). Fifty-six percent are
eating healthy, and 55 percent are exercising regularly. Fewer than half are getting plenty of rest, maintaining a positive
outlook, avoiding harmful substances, managing stress, getting routine physicals and recommended health screenings, or
seeking medical attention when needed. Note: The survey was conducted prior to the widespread availability of COVID-19
vaccinations.
• Baby Boomers Are Taking More Health Precautions. While most workers are engaging in one or more forms of health-
related activity on a consistent basis, Baby Boomers are more likely than younger generations to be taking COVID-19
precautions (75 percent), maintaining a positive outlook (59 percent), getting routine physicals and recommended
screenings (59 percent), getting plenty of rest (54 percent), seeking medical attention when needed (53 percent), and
avoiding harmful substances (51 percent). Note: The survey was conducted prior to the widespread availability of COVID-
19 vaccinations.
While it is unclear when the pandemic will end, it is indeed clear that workers can take additional steps to protect their health,
ranging from eating healthy, exercising regularly, getting plenty of rest, and managing stress, to continuing to take COVID-19
precautions, staying on top of recommended health screenings, and caring for their mental health.
Employment Impacts
At the time of the survey in late 2020, many employed workers had experienced some sort of negative impact to their
employment that could affect their income and financial well-being. At the same time, on a more positive note, most workers
also received some type of support from their employers such as the ability to work remotely, safety measures for on-site
workers, and/or flexible hours.
During the pandemic, a noteworthy proportion of workers across generations currently serving as caregivers for a relative or
friend and, when doing so, have made adjustments to their work situation.
13

Key Highlights
Employment Impacts (cont.)
• 4 in 10 Personally Experienced Negative Employment Impacts. Among those employed in late 2020, more than four in 10
workers (43 percent) personally experienced one or more negative impacts to their employment situation as a result of the
pandemic, including reduced hours (27 percent), reduced salaries (14 percent), furloughs (10 percent), layoffs (8 percent),
and early retirement (4 percent). More than one in three workers (37 percent) had no impacts on their employment.
• Generation Z Is More Likely to Have Been Negatively Impacted. Almost six in 10 Generation Z workers (59 percent) indicate
their employment situation has been negatively impacted as a result of the pandemic, which is significantly more than
among Millennials (51 percent), Generation X (39 percent), and Baby Boomers (30 percent). A reduction in work hours was
the most often cited negative impact across generations, including Generation Z (43 percent), Millennials (33 percent),
Generation X (23 percent), and Baby Boomers (16 percent). Nearly half of Baby Boomers (48 percent) had no employment
impacts.
• Almost 8 in 10 Say Employers Offered Support During Pandemic. Seventy-nine percent of workers indicate their employer
offered one or more types of support during the pandemic, such as allowing people to work remotely (41 percent),
implementing safety measures for on-site workers (35 percent), and/or allowing flexible hours (35 percent). However, fewer
than one in five workers say their employer provided emergency paid leave (19 percent), provided access to mental health
support (18 percent), or maintained employee benefits for furloughed workers (17 percent). Sixteen percent of workers
indicate their employer did nothing to support employees during the pandemic.
• Employer Support Varies by Generation. Baby Boomers, Generation X, and Millennials (45 percent, 44 percent, and 40
percent, respectively) are more likely than Generation Z (26 percent) to indicate their employers allowed people to work
remotely amid the pandemic. Baby Boomers (72 percent) are somewhat less likely be offered the possible types of support,
compared with Millennials, Generation Z, and Generation X (84 percent, 78 percent, and 76 percent, respectively).
• Most Are Offered Some Type of Alternative Work Arrangements. Eighty-two percent of workers indicate their employers offer
one or more types of alternative work arrangements. The most often cited types of alternative arrangements are flexible
work schedules (45 percent), the ability to work remotely (41 percent), the ability to adjust work hours as needed (39
percent), and the ability to take unpaid leave of absence (37 percent).
• Alternative Work Arrangements Vary by Generation. Younger workers are generally more likely to be offered flexible work
arrangements than older workers. Ninety percent of Generation Z and 88 percent of Millennials are offered one or more
types of alternative work arrangement by their employers, compared with 80 percent of Generation X and 72 percent of
Baby Boomers.
14

Key Highlights
Employment Impacts (contd.)
• Almost 4 in 10 Workers Are and/or Have Been Caregivers. Caregiving for a loved one can put the caregiver’s own health,
employment, and financial situation at risk. During their careers, 39 percent of workers have served as a caregiver for a
relative or friend, including 24 percent who are currently caregivers and 17 percent who have been a caregiver in the past.
Millennial and Generation X workers (30 percent and 26 percent, respectively) are more likely than Generation Z and Baby
Boomer workers (18 percent and 12 percent, respectively) to be currently serving as caregivers.
• Nearly 9 in 10 Caregivers Made Work Adjustments. Among workers who are serving and/or have served as caregivers, 87
percent made one or more work-related adjustments as a result of becoming a caregiver (e.g., missed days of work, reduced
hours, began working an alternative schedule). Millennial, Generation Z, and Generation X workers (93 percent, 91 percent,
and 86 percent, respectively) are more likely to have made adjustments than Baby Boomers (68 percent).
As the economy reopens and employers envision return-to-the-office plans, workers can expect additional adjustments to their
work arrangements. While their employers’ plans may be largely out of their control, workers can pay close attention to employer
announcements, policies, and offerings, so they can assess their options and plan accordingly.
Current Financial Situation
Many workers’ finances have been negatively impacted by the pandemic. They have adjusted their finances ranging from reducing
day-to-day expenses and dipping into savings to accumulating new credit card debt. Younger generations, Generation Z and
Millennials, have been especially impacted.
Workers face competing financial priorities, including paying off debt, saving for retirement, and building emergency savings.
According to the survey’s findings, emergency savings are low among workers, which could lead them to dip into their retirement
savings by taking loans and or early withdrawals, including hardship withdrawals.
• Many Workers’ Finances Have Been Negatively Impacted. Almost half of workers (49 percent) say their financial situation
has been negatively impacted by the pandemic, including 18 percent who have been impacted “a great deal” and 31 percent
who have been “somewhat’ impacted. Generation Z and Millennials (both 58 percent) are significantly more likely to indicate
their financial situation has been negatively impacted, compared with Generation X (46 percent) and Baby Boomers (34
percent).
15
Key Highlights
Current Financial Situation (cont.)
• 6 in 10 Are Dealing With Pandemic-Related Financial Strain. Sixty percent of workers have made adjustments due to
pandemic-related financial strain. The most often cited adjustments are reducing day-to-day expenses (32 percent),
dipping into savings accounts (24 percent), and accumulating new credit card debt (17 percent). Approximately one in
seven workers reduced or stopped contributing to retirement accounts (14 percent), forewent health care (14 percent), or
borrowed money from others (13 percent). Nine percent moved, and seven percent stopped paying their rent or mortgage.
• Younger Generations More Likely to Be Dealing With Financial Strain. Millennials (71 percent), Generation Z (69 percent),
and Generation X (59 percent) are more likely to have made adjustments due to pandemic-related financial strain,
compared with Baby Boomers (40 percent). Approximately one-third of Millennials, Generation Z, and Generation X
workers reduced day-to-day expenses (36 percent, 33 percent, and 33 percent, respectively). Approximately three in 10
Generation X (32 percent) and Millennials (29 percent) dipped into savings accounts. Of concern, approximately one in five
Millennials and Generation X accumulated new credit card debt (20 percent and 18 percent, respectively).
• Workers Face Competing Financial Priorities. Sixty-two percent of workers cite paying off one or more forms of debt as a
current financial priority. A striking 59 percent cite saving for retirement and 45 percent cite building emergency savings
as priorities. One in three workers (33 percent) cite supporting children as a priority. Almost three in 10 workers (28
percent) indicate they are just getting by to cover basic living expenses. Other often-cited financial priorities among
workers include paying health care expenses (23 percent) and contributing to an education fund (21 percent).
• Financial Priorities Vary Across Generations. Generation Z workers are more likely to indicate they are just getting by to
cover basis living expenses (50 percent) and paying off student loans (35 percent) than older generations. Baby Boomers,
Generation X, and Millennials are significantly more likely than Generation Z to cite saving for retirement as a financial
priority (75 percent, 65 percent, 53 percent, and 33 percent, respectively). Building emergency savings is a priority for 50
percent of Generation X, 46 percent of Millennials, 42 percent of Generation Z, and 36 percent of Baby Boomers. A
noteworthy 20 percent of Millennials and 17 percent of Generation Z cite supporting parents. Across generations, more
than half of workers cite paying off one or more forms of debt as a priority.
• More Than 3 in 4 Workers Have Health Care Expense Accounts. Seventy-six percent of workers are currently saving or have
funds saved to pay for health care expenses, including through an individual account such as savings, checking, or
brokerage (58 percent), a health savings account (HSA) (31 percent), and/or a flexible spending account (FSA) (19
percent). A concerning one in four workers (24 percent) are not saving for health care expenses.
16

Key Highlights
Current Financial Situation (contd.)
• Millennials Are More Likely to Be Saving for Health Care Expenses. Millennials (82 percent) are more likely to be saving in
one or more types of accounts for health care expenses, compared with Generation Z (72 percent), Generation X (72
percent), and Baby Boomers (73 percent). However, of concern, a segment of workers across generations are not saving
for health care expenses, including 28 percent of Generation Z, 28 percent of Generation X, 27 percent of Baby Boomers,
and 18 percent of Millennials.
• Emergency Savings Are Alarmingly Low. Emergency savings are needed to cover financial setbacks, such as
unemployment, medical bills, home repairs, auto repairs, and other unexpected expenses. Having emergency savings
could also help prevent workers from dipping into their retirement savings to cover such expenses. However, workers have
alarmingly low emergency savings – they have set aside only $5,000 (median). Notably, emergency savings increase with
age: Generation Z workers have saved $2,000, while Millennials have saved $5,000, Generation X has saved $6,000, and
Baby Boomers have saved $10,000 (medians).
• Dipping Into Retirement Accounts Is Not Uncommon. A concerning percentage of workers are dipping into their retirement
savings before they retire. Loans and withdrawals from retirement accounts can severely inhibit the growth of their long-
term savings. More than one-third of workers (34 percent) have ever taken a loan, early withdrawal, and/or hardship
withdrawal from their 401(k) or similar plan or IRA, including 25 percent who have taken a loan and 25 percent who have
taken an early and/or hardship withdrawal. Millennials (44 percent) are more likely to have ever dipped into retirement
savings than Generation X (33 percent), Generation Z (30 percent), and Baby Boomers (17 percent).
• Paying Off Debt Tops the List of Reasons for Taking 401(k) Loans. Among those who have taken a loan from their 401(k) or
similar plan, the most frequently cited reason for doing so is to pay off debt (41 percent), including credit card debt (32
percent) and/or other debt (19 percent). Other reasons include a financial emergency (32 percent), home improvements
(30 percent), and medical bills (26 percent). Millennials (44 percent), Generation X (40 percent), and Baby Boomers (38
percent) are slightly more likely to cite paying off debt than Generation Z (31 percent).
• Reasons for Hardship Withdrawals from 401(k)s. Among those who have taken a hardship withdrawal from a 401(k) or
similar plan, the most often-cited reasons for doing so are paying for certain medical expenses (21 percent), paying for
tuition and related educational fees (18 percent), expenses and losses incurred due to a disaster in a federally declared
disaster area (15 percent), and payments to prevent eviction from principal residence (12 percent).
17

Key Highlights
Current Financial Situation (contd.)
• Relatively Few Workers Have Set Forth Legal Documentation. When asked about the types of financial and medical-related
legal documents they have set forth, workers most frequently cite a last will and testament (27 percent), a medical power of
attorney or proxy (22 percent), and a power of attorney for finances (22 percent). Fewer than one in five workers have an
advance directive or living will (18 percent), a trust (16 percent), funeral and burial arrangements (14 percent), and HIPAA
waiver (13 percent). However, nearly half of workers (46 percent) do not have any legal documents in place.
• Baby Boomers Are Generally More Likely to Have Legal Documents. Baby Boomers are generally more likely than younger
generations to have set forth legal documents, such as a last will and testament (46 percent), medical power of attorney or
proxy (28 percent), power of attorney for finances (25 percent), advance directive or living will (25 percent), and funeral and
burial arrangements (19 percent). Of concern, many workers across generations do not have any legal documents in place.
Given their financial strains, financial priorities and the need to build emergency savings, many workers could benefit from taking
time to fully assess their situation, identify opportunities and vulnerabilities, and build financial plans. They could also set forth
financial and medical-related legal documents outlining their wishes and designating a representative who can make decisions on
their behalf if they are unable to do so. These documents are especially timely and relevant amid a pandemic.
Visions and Expectations of Retirement
Despite the immediacy and intensity of the pandemic, most workers are keeping their sights set on their future retirement. They
are planning on long lives and long retirements. Their retirement dreams range from travel and spending more time with family
and friends, to pursuing hobbies and volunteerism. Some are even dreaming of doing paid work.
Many of today’s workers expect to work beyond age 65 or do not plan to retire — and the majority plan to continue working at least
part-time in retirement, a finding that is consistent with previous TCRS surveys. Most plan to do so for both healthy aging and
financial-related reasons. Some workers indicate their expected retirement age has changed because of the pandemic.
• Many Envision Long Lives and Long Retirements. Today’s workers are planning to live to age 88 (median) among those who
provided an age when asked how long they are planning to live to. Thirteen percent are planning to live to age 100 or older.
Thirty-eight percent are “not sure.” An implication for increased longevity is potentially more time spent in retirement. The
survey compared workers’ planned life expectancy with their expected retirement age and found that they plan to spend 25
years in retirement (median).
18

Key Highlights
Visions and Expectations of Retirement (cont.)
• 1 in 6 Generation Z and Millennials Plan to Be Centenarians. Generation Z and Millennial workers are planning to live
longer than their older counterparts. One in six Generation Z and Millennials (17 percent and 16 percent, respectively) are
planning to live to age 100 or older, compared with Generation X (10 percent) and Baby Boomers (9 percent). Generation Z
and Millennial workers also plan to spend more time in retirement (30 years and 27 years, respectively), which is
somewhat longer than Generation X (23 years) and Baby Boomers (22 years) (medians).
• Most Cite Positive Word Associations With “Retirement.” Eighty-six percent of workers cite positive word associations with
“retirement” compared with only 44 percent who cite negative words. Workers’ top three positive word associations are
“freedom” (53 percent), “enjoyment” (49 percent), and “stress-free” (37 percent), while the top three negative word
associations are “health decline” (19 percent), “financial insecurity” (18 percent), and “boredom” (18 percent).
• All Four Generations Cite Positive Word Associations. More than eight in 10 workers across generations cite one or more
positive word associations with “retirement.” Workers from the four generations share the most often-cited positive words:
“freedom,” “enjoyment,” and “stress-free.” However, Generation Z and Millennial workers (53 percent and 48 percent,
respectively) are more likely to cite one or more negative word associations, compared with Generation X (41 percent) and
Baby Boomers (34 percent).
• Workers Are Dreaming of an Active Retirement. Traveling (65 percent) is workers’ most frequently cited retirement dream,
followed by spending more time with family and friends (59 percent), and pursuing hobbies (51 percent). A noteworthy 38
percent of workers dream of doing some form of paid work in retirement, such as starting a business (20 percent),
pursuing an encore career (17 percent), and/or continuing to work in the same field (14 percent). More than one in four
workers (26 percent) dream of doing volunteer work in retirement.
• Workers Across Generations Share Similar Retirement Dreams. Workers’ top three retirement dreams — traveling,
spending more time with family and friends, and pursuing hobbies — are shared across generations. However, some
dreams differ. Almost half of Millennials (49 percent) dream of doing some form of paid work in retirement (i.e., starting a
business, pursuing an encore career, continue working in the same field), compared with significantly fewer Generation Z
(37 percent), Generation X (36 percent), and Baby Boomers (21 percent).
19

Key Highlights
Visions and Expectations of Retirement (cont.)
• Retirement Fears Range from Financial to Health-Related. The most frequently cited retirement fears are outliving savings
and investments (42 percent), declining health that requires long-term care (39 percent), a reduction in or elimination of
Social Security in the future (38 percent), and possible long-term care costs (34 percent). Almost one in three workers fear
cognitive decline/dementia/Alzheimer’s Disease (32 percent) and not being able to meet the basic financial needs of their
family (32 percent). Other fears include losing independence (29 percent), lack of access to adequate and affordable
healthcare (29 percent), feeling isolated and alone (27 percent), affordable housing (22 percent), and finding meaningful
ways to spend time and stay involved (21 percent).
• Retirement Fears Vary Across Generations. Workers’ retirement fears range from financial to health-related but vary by
generation. While workers across generations fear outliving their savings and investments to a greater or lesser extent,
Baby Boomers (46 percent) are somewhat more likely than younger generations to fear declining health that requires long-
term care. Baby Boomers and Generation X are more likely to fear reductions in or elimination of Social Security in the
future (both 42 percent). Millennials and Generation Z are more likely to fear feeling isolated and alone (31 percent and
38 percent, respectively). Generation Z (44 percent) is significantly more likely to fear they will be unable to meet the basic
needs of their families.
• Pandemic Has Not Changed When Most Workers Expect to Retire. More than six in 10 workers (61 percent) say that the
pandemic has not changed when they expect to retire. Thirty-one percent say that it has changed their retirement
expectations, including 22 percent who expect to retire later and 9 percent who expect to retire earlier. Millennials (28
percent) are more likely to say that they expect to retire later due to the pandemic, compared with Generation Z,
Generation X, and Baby Boomers (19 percent, 19 percent, and 15 percent, respectively).
• Almost Half of Workers Expect to Work Past Age 65. Forty-nine percent of workers expect to work past age 65 or do not
plan to retire. Expectations of doing so increase with age. More than seven in 10 Baby Boomers (72 percent) either expect
to or are already working past age 65 or do not plan to retire, compared with 51 percent of Generation X, 37 percent of
Millennials, and 36 percent of Generation Z. In contrast, approximately four in 10 Generation Z and Millennials (40 percent
and 39 percent, respectively) plan to retire before age 65. Approximately one in eight workers across generations do not
plan to retire.
20

Key Highlights
Visions and Expectations of Retirement (cont.)
• More Than Half of Workers Plan to Work in Retirement. Fifty-seven percent of workers plan to work after they retire,
including 37 percent who plan to work part-time and 20 percent full-time. Just 27 percent do not plan to work after they
retire, and 17 percent are not sure. Generation X and Millennials (61 percent and 59 percent, respectively) are more likely
to be planning to work in retirement than Baby Boomers and Generation Z (both 47 percent).
• Health and Financial Reasons for Working in Retirement. Among workers who are or plan to work in retirement and/or
past age 65, an equal proportion cite healthy-aging and financial reasons (both 80 percent). The most often cited healthy-
aging reason is to be active (54 percent), while the top financial reason is wanting the income (53 percent). Other
frequently cited healthy-aging reasons cluster around “keep my brain alert” (47 percent), “enjoy what I do” (40 percent),
and “have a sense of purpose” (40 percent). Other frequently cited financial reasons cluster around “concerned that
Social Security will be less than expected” (31 percent), “can’t afford to retire” (29 percent), and “need health benefits”
(26 percent).
• Generations Share Common Reasons for Working in Retirement. Workers across generations similarly share financial and
healthy aging-related reasons for working past age 65 and/or in retirement with some differences. Baby Boomers (67
percent) are somewhat more likely than other generations to indicate they want the income. Generation X and Baby
Boomers (36 percent and 34 percent, respectively) are somewhat more likely to be concerned that Social Security
benefits will be less than expected. Millennials and Generation Z (28 percent and 24 percent, respectively) are somewhat
more likely to cite personal development as a reason.
• Proactive Steps Taken to Help Ensure Continued Work. Workers must be healthy enough and have access to employment
opportunities to be able to work as long as they want and need. While more than eight in 10 workers have taken one or
more proactive steps to continue working (84 percent), only 57 percent are staying healthy, 50 percent are keeping their
job skills up to date, 29 percent are networking and meeting new people, and 26 percent are taking classes to learn new
skills. Approximately one in five workers are scoping out the employment market (20 percent) or obtaining a new degree,
certification, or professional designation (18 percent). Sixteen percent have not taken any steps.
21
Key Highlights
Visions and Expectations of Retirement (cont.)
• Workers Across Generations Can Take More Proactive Steps. Workers across generations have an opportunity to take
more proactive steps to help ensure they can continue to work as long as they want and need. While it is encouraging that
Generation Z and Millennials (90 percent and 89 percent, respectively) have taken one or more steps, relatively few are
staying healthy so they can continue working (57 percent and 52 percent, respectively) or keeping their job skills up to
date (both 54 percent), which are key ingredients for achieving success. Because retirement is becoming closer on the
horizon, and many may be facing savings shortfalls that necessitate continued work, it is concerning that 26 percent of
Baby Boomers and 18 percent of Generation X have not taken any steps.
• Are Today’s Employers Age Friendly? Almost seven in 10 workers (67 percent) consider their employers to be “age friendly”
by offering opportunities, work arrangements, and training and tools needed for employees of all ages to be successful in
their current role or contribution to the company. Sixteen percent of workers say their employers are not age friendly and
17 percent are “not sure.” Millennial workers are somewhat more likely to characterize their employers as age friendly (72
percent) than Generation Z (66 percent), Generation X (65 percent), and Baby Boomers (60 percent).
As workers plan to extend their working lives beyond age 65, it is important they become more proactive about taking steps that
can help protect their employability, such as protecting their health, keeping their job skills up to date, staying abreast of the
employment market, and networking and meeting new people.
Retirement Savings, Planning, and Preparations
Workers are expecting diverse sources of retirement income and many are concerned about the future of Social Security. It is
remarkable that more than eight in 10 workers are saving for retirement in an employer-sponsored 401(k) or similar plan
and/or outside the workplace, even as they are contending with pandemic-related financial strains. Despite the impressive
number who are saving for retirement, many workers may not be saving enough, based on their reported household retirement
savings.
While many workers are confident about their ability to fully retire with a comfortable lifestyle, relatively few are very confident.
Most workers say their retirement confidence has stayed the same amid the pandemic.
22

Key Highlights
Retirement Savings, Planning, and Preparations (cont.)
• Retirement Confidence Has Stayed the Same for Most Workers. Almost two-thirds of workers (64 percent) indicate their
confidence in their ability to retire comfortably has stayed the same in light of the pandemic. Sixteen percent of workers
indicate their confidence has declined, while 11 percent say it has improved. Across generations, Baby Boomers (76
percent) are more likely than Generation Z, Generation X, and Millennials (64 percent, 62 percent, and 60 percent,
respectively) to indicate their retirement confidence has stayed the same.
• Almost 3 in 4 Workers Are Confident About Retirement. Seventy-three percent of workers are confident that they will be
able to fully retire with a comfortable lifestyle, including 24 percent who are “very” confident and 49 percent who are
“somewhat” confident. While confidence is similar across generations, Millennials (30 percent) are more likely to be “very”
confident than Baby Boomers (21 percent), Generation X (19 percent), and Generation Z (16 percent).
• Almost 7 in 10 Think They Are Building a Large Enough Nest Egg. Sixty-eight percent of workers agree that they are
currently building a large enough retirement nest egg, including 30 percent who “strongly agree” and 38 percent who
“somewhat agree.” Millennials (35 percent) are more likely to “strongly agree” than Baby Boomers, Generation X, and
Generation Z (28 percent, 27 percent, and 19 percent, respectively).
• Workers Are Expecting Diverse Sources of Retirement Income. Eighty-two percent of workers expect self-funded savings to
be sources of retirement income, including 401(k), 403(b), and IRAs (71 percent) and/or other savings and investments
(48 percent). Two-thirds of workers (66 percent) cite Social Security, while 26 percent cite company-funded pension plans
as sources of income. Almost four in 10 workers (37 percent) are expecting income from continued work. Fewer than one
in five workers are expecting retirement income from home equity (18 percent) or an inheritance (14 percent).
• Sources of Retirement Income Vary Somewhat by Generation. Self-funded savings in retirement accounts (e.g., 401(k)s,
403(b)s, IRAs) and/or other savings and investments are similarly cited as expected sources of retirement income by
workers across generations. However, the survey finds some noteworthy differences with other expected sources. Baby
Boomers (87 percent) are more likely to expect Social Security to be a source of income than younger generations.
Millennials (40 percent) are somewhat more likely than other generations to cite retirement income from working. In most
cases, Generation Z is somewhat less likely to cite any of the potential sources of retirement income, a finding that is not
surprising given their younger age.
23
Key Highlights
Retirement Savings, Planning, and Preparations (cont.)
• 1 in 3 Baby Boomers Expect to Rely on Social Security. Baby Boomers (34 percent) are more likely to expect Social Security to
be their primary source of income in retirement, compared with Generation X (23 percent), Millennials (14 percent), and
Generation Z (12 percent). In contrast, Generation Z (62 percent), Millennials (58 percent) and Generation X (51 percent) are
more likely than Baby Boomers (43 percent) to cite self-funded savings, such as 401k(s), 403(b)s, IRAs and/or other savings
and investments. Thirteen percent of all workers expect their primary source of retirement income to come from working, a
finding that it is more often cited by Generation Z (17 percent), Millennials (16 percent), and Generation X (13 percent),
compared with Baby Boomers (7 percent). Note: 401(k)s did not become readily available until the 1990s, a time at which
Baby Boomers were already well into their careers and, therefore, they have not had as much time to save in them.
• Almost 3 in 4 Workers Are Concerned About Social Security. Seventy-three percent of workers agree with the statement, “I am
concerned that when I am ready to retire, Social Security will not be there for me,” including 32 percent who “strongly agree”
and 41 percent who “somewhat agree.” Generation X (77 percent), Millennials (77 percent), and Generation Z (70 percent)
are more likely to agree than Baby Boomers (60 percent). Millennials (38 percent) and Generation X (36 percent) are more
likely to “strongly agree” than Generation Z (22 percent) and Baby Boomers (19 percent).
• Workers Should Learn More About Social Security Benefits. A strong knowledge of government benefits is important for all
future retirees and especially important for workers nearing retirement. Only 25 percent of all workers know “a great deal”
about Social Security benefits-- and only 21 percent of age 50-plus workers know “a great deal” about them. Moreover,
among age 50-plus workers who expect to rely on Social Security as their primary source of income in retirement, only 20
percent know a “great deal” about Social Security benefits.
• More than 8 in 10 Workers Are Saving for Retirement. Eighty-two percent of workers are saving for retirement through
employer-sponsored plans, such as a 401(k) or similar plan, and/or outside the workplace. Baby Boomers (84 percent),
Generation X (84 percent), and Millennials (82 percent) are more likely than Generation Z (70 percent) to be saving. Among
those saving for retirement, Generation Z started saving at age 19, Millennials at age 25, Generation X at age 30, and Baby
Boomers at age 35 (medians).
• Almost 7 in 10 Are Saving for Retirement Outside of Work. Sixty-eight percent of workers are saving for retirement outside of
work, such as in an IRA, mutual funds, bank account, etc. Baby Boomers (71 percent), Generation X (71 percent), and
Millennials (69 percent) are more likely to be saving for retirement outside of work, compared with Generation Z (54 percent).
24

Key Highlights
Retirement Savings, Planning, and Preparations (cont.)
• Workers Have a Variety of Retirement Savings & Investments. Among workers who are saving for retirement outside of work,
the most often cited types of savings and investments they currently have specifically for retirement, are a bank account such
as savings, checking, money market, and CDs (66 percent), a 401(k) or similar plan (50 percent), and an individual retirement
account (IRA) (41 percent). Some workers cite saving for retirement via a brokerage account (38 percent), life insurance policy
(36 percent), and/or primary residence (27 percent). Fewer than one in five workers have a health savings account (HAS) (16
percent), an annuity (16 percent), and/or real estate investments other than their primary residence (15 percent).
• Types of Retirement Savings & Investments by Generation. Workers across generations who are saving for retirement outside
of work most frequently utilize a bank account, 401(k) or similar plan, and/or IRA to save and invest specifically for
retirement. However, there are noteworthy differences by generation. Generation X workers (40 percent) are somewhat more
likely to cite a life insurance policy. Baby Boomers (38 percent) are more likely to cite their primary residence. Millennials are
more likely to cite an HSA account. Generation Z workers who are saving for retirement outside of work report lower use for
most of these types of retirement savings and investments, a finding that is not surprising given that they are just beginning
to build their retirement nest eggs.
• Are Workers Adequately Saving for Retirement? Total household retirement savings among all workers is $93,000 (estimated
median). Baby Boomer workers have the most retirement savings at $202,000, compared with Generation X ($107,000),
Millennials ($68,000), and Generation Z ($26,000) (estimated medians). The proportion of workers having saved $250,000
or more increases with age: 11 percent of Generation Z, 25 percent of Millennials, 32 percent of Generation X, and 45
percent of Baby Boomers. In contrast, the proportion of workers who have saved less than $25,000 directionally decreases
with age: 37 percent of Generation Z, 27 percent of Millennials, 20 percent of Generation X, and 16 percent of Baby Boomers.
• Almost Half Don’t Have Enough Income to Save for Retirement. Forty-eight percent of workers agree with the statement, “I
don’t have enough income to save for retirement,” including 20 percent who “strongly agree” and 28 percent who “somewhat
agree.” Generation Z (55 percent), Millennials (49 percent), and Generation X (48 percent) are more likely to agree, compared
with Baby Boomers (40 percent).
• Fewer Than Half Are Aware of the Saver’s Credit (Tax Credit). The Saver’s Credit is a tax credit for eligible taxpayers who save
for retirement in a qualified retirement plan, IRA, or ABLE account. Fewer than half of workers (48 percent) are aware of it.
Millennials (63 percent) are most likely to be aware of the Saver’s Credit, compared with Generation Z (46 percent),
Generation X (46 percent), and Baby Boomers (26 percent).
25

Key Highlights
Retirement Savings, Planning, and Preparations (cont.)
• Debt Is Interfering With Ability to Save for Retirement. Forty-nine percent of workers agree with the statement, “Debt is
interfering with my ability to save for retirement,” including 20 percent who “strongly agree” and 29 percent who
“somewhat agree.” Millennials (57 percent), Generation X (51 percent), and Generation Z (51 percent) are more likely to
agree, compared with Baby Boomers (32 percent). Of concern, 24 percent of Millennials, 22 percent of Generation X, and
19 percent of Generation Z “strongly agree,” compared with 12 percent of Baby Boomers.
• Workers Have a Limited Understanding of Asset Allocation Principles. Fewer than four in 10 workers (38 percent) have “a
great deal” or “quite a bit” of understanding of asset allocation principles as they relate to retirement investing, including
14 percent who know “a great deal” and 24 percent who know “quite a bit.” Millennials (19 percent) have “a great deal” of
understanding, compared with Generation X (13 percent), Generation Z (9 percent), and Baby Boomers (8 percent). A
concerning one in five workers (21 percent) have no understanding of asset allocation principles.
• Many May Be Procrastinating Retirement Investing. Forty percent of workers agree with the statement, “I prefer not to
think about or concern myself with retirement investing until I get closer to my retirement date,” including 13 percent who
“strongly agree” and 27 percent who “somewhat agree.” As may be expected, younger workers are more likely to agree
with this statement than workers: Generation Z (54 percent), Millennials (48 percent), and Generation X workers (38
percent), compared with Baby Boomers (23 percent).
• Workers’ Estimated Retirement Savings Needs. Workers estimate they will need $500,000 (median) by the time they retire
in order to feel financially secure. This estimate is shared by Generation Z and Generation X. Baby Boomers estimate they
will need $750,000 and Millennials estimate they will need only $300,000 (medians). Almost one in five workers (19
percent) estimate they will need to save $2,000,000 or more, including Generation Z (12 percent), Millennials (18
percent), Generation X (22 percent), and Baby Boomers (19 percent).
• Many Workers Are Guessing Their Retirement Savings Needs. Among workers who provided an estimate of their retirement
savings needs, 43 percent indicate they guessed on what it should be. Thirty-eight percent based their estimate on their
current living expenses. Only 25 percent used a retirement calculator or completed a worksheet, with Millennials (29
percent) and Generation X (26 percent) being somewhat more likely than Baby Boomers (20 percent) and Generation Z
(14 percent) to have done so. Millennials (19 percent) are more likely to have based their estimates on an amount given to
them by a financial advisor, compared with Generation X (14 percent), Baby Boomers (10 percent), and Generation Z (8
percent).
26

Key Highlights
Retirement Savings, Planning, and Preparations (cont.)
• One-Third Have a Written Financial Strategy for Retirement. Achieving retirement security involves more than just saving
and investing. It requires having a well-defined financial strategy. Most workers (76 percent) have some form of financial
strategy for retirement, but only 33 percent have a written plan. The other 43 percent have a plan, but it is not written
down. Millennials (39 percent) are more likely to have a written plan, compared with Generation X (32 percent),
Generation Z (26 percent), and Baby Boomers (24 percent).
• Many Don’t Have a Backup Plan if Retirement Comes Unexpectedly. As workers plan to extend their working lives and
continue working in retirement, attention should be given to life’s unforeseen circumstances, which could derail the best
of intentions. Fewer than four in 10 workers (37 percent) have a backup plan for retirement income if they are unable to
work before their planned retirement. Millennials (45 percent) are more likely to have backup plans, compared with
Generation X (33 percent), Generation Z (32 percent), and Baby Boomers (30 percent).
• Less Than Half Are Very Familiar with Spouse’s/Partner’s Savings. Among workers who are married or living with a partner,
75 percent say they are familiar with their spouse’s or partner’s savings, yet only 48 percent are “very familiar.” Millennials
(79 percent) are somewhat more likely to be familiar with their spouse’s or partner’s savings, compared with Generation X
(74 percent), Baby Boomers (70 percent), and Generation Z (66 percent).
• Almost 4 in 10 Workers Use a Professional Financial Advisor. Thirty-nine percent of workers use a professional financial
advisor to help them manage their savings and investments. Millennials (43 percent), Baby Boomers (41 percent), and
Generation X (38 percent) are more likely to use an advisor than Generation Z (22 percent).
• A Wide Variety of Services Are Performed by Financial Advisors. Among those who use a financial advisor, workers most
frequently use them to make retirement investment recommendations (57 percent), followed by calculating a retirement
savings goal (42 percent) and general financial planning (39 percent). Across generations, the use of financial advisor
services varies. Baby Boomers (75 percent) and Generation X (66 percent) are more likely to use their financial advisors
for retirement investment recommendations, compared with Millennials (45 percent) and Generation Z (29 percent).
• Frequency (or Infrequency) of Conversations About Retirement. Retirement is a family matter that calls for important
conversations about plans, expectations, needs, and vulnerabilities. Fewer than one in four workers (24 percent)
frequently discuss saving, investing, and planning for retirement with family and close friends, while 55 percent
occasionally discuss it, and 22 percent never discuss it. Baby Boomers (13 percent) are less likely to frequently discuss it,
compared with Millennials (31 percent), Generation Z (26 percent), and Generation X (22 percent).
27

Key Highlights
Retirement Savings, Planning, and Preparations (cont.)
In addition to saving and investing for retirement, workers can and should be taking additional planning-related action steps
that could improve their current financial situation and long-term retirement outlook. For those needing assistance, they may
want to consider consulting with a professional financial advisor.
The Importance of Employer-Sponsored Retirement Benefits
Employers play a vital role in helping workers save and invest for retirement. Employer-sponsored retirement benefits, such as
401(k) or similar plans, have proven to be highly effective at encouraging savings through the convenience of payroll
deductions, access to institutional investments and advice, educational offerings, and matching contributions. Employer
sponsorship rates of 401(k) or similar plans are already high — yet with room for further growth. Expanding coverage to part-
time workers can also help improve workers’ retirement outcomes.
• Workers Highly Value Retirement Benefits. Workers highly value retirement benefits. Ninety-one percent of workers value a
401(k) or similar retirement plan as an important benefit, a finding which is similar across generations. More than four in
five workers (84 percent) agree that the next time they look for a job, all things being equal, the retirement benefits
offered by the prospective employer will be a major factor in their final decision to accept an offer or not. Generation X (87
percent) and Millennials (86 percent) are more likely to agree that retirement benefits will be a major decision-making
factor, compared with Generation Z (78 percent) and Baby Boomers (76 percent).
• 3 in 4 Workers Are Offered a 401(k) or Similar Plan. Seventy-five percent of workers have access to a 401(k) or similar
employee-funded retirement plan in the workplace. Millennials (79 percent) are somewhat more likely than Generation X
(75 percent), Generation Z (71 percent), and Baby Boomers (70 percent) to have access to an employee-funded plan. Of
great concern is that almost one in five workers (18 percent) are not offered any retirement benefits.
• Full-Time Workers Are More Likely to Be Offered a 401(k). Full-time workers (80 percent) are far more likely to have access
to a 401(k) or similar employee-funded plan compared with part-time workers (51 percent). Among part-time workers,
Generation Z workers (61 percent) are significantly more likely, and Millennials (52 percent) are somewhat more likely to
have benefits compared with Baby Boomers (42 percent) and Generation X (41 percent).
28

Key Highlights
The Importance of Employer-Sponsored Retirement Benefits
• Having Access to a 401(k) Inspires Workers to Save. Workers who are offered a 401(k) or similar retirement plan by their
employer are more likely to save and invest for retirement in the plan and/or outside of work (91 percent) compared with
those who do not have access to such plans (53 percent). Among workers who are not offered a plan, Baby Boomers are
much more likely to be saving for retirement (64 percent) than Generation X (53 percent), Millennials (49 percent), and
Generation Z (38 percent).
• When Offered a Plan, Three in Four Participate. Eighty-one percent of workers who are offered a 401(k) or similar plan
participate in that plan. Participation rates are higher among Generation X (86 percent), Baby Boomers (81 percent), and
Millennials (80 percent) than Generation Z (69 percent). Workers who participate in such a plan contribute 12 percent
(median) of their annual salary into their plans. Generation Z and Millennials contribute 15 percent to their plans, while
Generation X and Baby Boomers are contributing 10 percent (medians).
• About Half Contribute 10 Percent or More to Retirement Plans. Fifty-one percent of workers participating in a 401(k) or
similar retirement plan contribute more than 10 percent of their salaries to their plan, with 37 percent contributing more
than 15 percent, and 14 percent contributing 11 - 15 percent of their annual pay into the plan. Slightly less than half of
workers participating in a plan (49 percent) save 10 percent or less.
• More Than 2 in 5 Across Generations Are “Super Savers.” “Super savers,” or workers who participate in a 401(k) or similar
retirement plan and contribute more than 10 percent of their salaries into the plan, are found across generations. These
“super savers” include 59 percent of Millennials, 58 percent of Generation Z, 46 percent of Generation X, and 42 percent
of Baby Boomers.
• 6 in 10 Plan Participants Use Professionally Managed Accounts. “Professionally managed” accounts refer to a managed
account service, strategic allocation funds, and/or target date funds. The majority of plan participants (62 percent) use a
professionally managed offering in their 401(k) or similar plans, including 29 percent who invest in strategic allocation
funds, 28 percent in target date funds, and 25 percent who use a managed account service.
• Professionally Managed Account Usage Varies by Generation. Among those participating in a 401(k) or similar plan,
Millennials (73 percent) are more likely to use one or more types of professionally managed account, compared with
Generation Z (62 percent), Generation X (59 percent), and Baby Boomers (44 percent). However, the proportion of plan
participants that indicate they set their own asset allocation percentage among the available funds is relatively similar
across generations, including Baby Boomers (49 percent), Generation X (47 percent), Millennials (44 percent), and
Generation Z (44 percent).
29

Key Highlights
The Importance of Employer-Sponsored Retirement Benefits
• Almost Two-Thirds Want More Retirement Information and Advice. Sixty-five percent of workers would like more information
and advice from their employers on how to reach their retirement goals. This desire is highest among Millennials (78
percent), while also strong among Generation X (69 percent), Generation Z (66 percent), and, to a lesser extent, Baby
Boomers (41 percent).
• Employers Can Do More to Facilitate Retirement Transitions. Workers may find it difficult to have a phased transition into
retirement at their current employer — only 40 percent of workers indicate their employers offer opportunities such as
accommodating flexible work schedules and arrangements (22 percent), enabling employees to reduce work hours and
shift from full-time to part-time (20 percent), and/or enabling employees to take positions that are less stressful or
demanding (18 percent). Only 21 percent of employers encourage employees to participate in succession planning,
training, and mentoring. Fewer than one in five workers indicate their employers offer financial counseling about
retirement, offer retirement-oriented lifestyle and transition planning resources, provide seminars and education about
transitioning into retirement, or provide information about encore career opportunities.
• Baby Boomers Less Likely to Have Retirement Transition Support. Slightly fewer than one in four Baby Boomer workers (24
percent) say their employers offer one or more types of flexible transition arrangements for pre-retirees, compared with 52
percent of Millennials, 44 percent of Generation Z, and 36 percent of Generation X. One in four Baby Boomers (40
percent) say their employers do “nothing” to help pre-retirees transition into retirement.
• An Opportunity to Close the Employee Benefits Gap. In addition to retirement benefits, health and welfare benefits can
enhance workers’ financial security. These benefits can bring insurance protections, mitigate out-of-pocket healthcare
expenses, provide the possibility of additional resources in a time of need, and offer wellness help. Most workers believe
these benefits are important; however, a significant gap exists between the percentage of workers who believe they are
important and the percentage who are offered them by their employers. This represents an opportunity for employers to
increase the competitiveness of their compensation and benefits packages, while helping their employees achieve greater
long-term financial security.
30

Key Highlights
The Importance of Employer-Sponsored Retirement Benefits
• The Employee Benefits Gap Applies to All Four Generations. The importance of various types of health and welfare benefits
varies by generation. While more than nine in 10 workers across the four generations consider health insurance to be
important, Generation Z, Millennials, and Generation X are generally more likely than Baby Boomers to find the other types
of health and welfare benefits listed to be important. Across generations, a significant gap exists between the percentages
of workers who believe they are important compared with the percentage who are offered them by their employers.
Beyond offering retirement benefits, employers could profoundly influence their workers’ financial security and preparations for
older age in a number of other ways. These include offering health and welfare benefits, workplace wellness programs, flexible
work arrangements to promote work-life balance, retirement planning and counseling services, and phased retirement
alternatives — and fostering an age-friendly work environment in which employees of all ages are valued and can be successful.
The pandemic has exposed weaknesses and revealed opportunities for improving retirement security among workers. The
insights gained can be applied toward effecting positive change for current and future generations.
Workers’ ability to achieve a secure retirement ultimately depends on access to meaningful employment throughout their
working years, the availability of retirement, and health and welfare benefits, and the preservation of safety nets such as Social
Security and Medicare.
As we emerge from the pandemic, we have an unprecedented opportunity to strengthen the fabric of our retirement system —
including how we live, work, retire, and age with dignity.
Catherine Collinson
CEO and President, Transamerica Institute® and Transamerica Center for Retirement Studies®
31

Recommendations for Workers
Workers across generations have been hard hit by the COVID-19 pandemic and recession. As we emerge from the pandemic, it is
important for workers to focus on their physical and mental health, financial well-being, and their future retirement. Action steps
include:
1. Engage in financial planning to gain a full understanding of your financial situation. Create a budget, prioritize expenses, set
short- and long-term goals, learn about investing, and develop a retirement strategy to help improve your fiscal health. If you
delayed mortgage or rent payments, learn what your obligation is to make past due payments and what financial assistance
may be available to you.
2. If possible, save or continue saving for retirement. By starting as early as possible and consistently saving over time, even
small amounts can add up over a decades-long working life. If you paused saving for retirement due to the pandemic, start
saving again as soon as feasible.
3. Participate in employer-sponsored retirement plans, if available. Take full advantage of matching employer contributions and
defer as much as possible. If not offered a plan, explore options to contribute to an IRA consistently. Job seekers should take
retirement benefits into consideration as part of an overall compensation package.
4. Avoid taking loans and early withdrawals from retirement accounts, which can severely inhibit their long-term growth. Before
tapping into retirement savings, explore all possible alternatives.
5. Review your retirement savings portfolio to ensure investments are consistent with your risk profile and years to retirement.
Learn about professionally managed accounts, target date funds, and strategic allocation. Seek assistance from your
retirement plan provider or a professional financial advisor, if needed.
6. Calculate retirement savings needs, develop a retirement strategy, and write it down. Factor in living expenses, health care,
long-term care needs, and government benefits, as well as funds for pursuing retirement dreams.
7. Take advantage of the Saver’s Credit. Check if you qualify for the Saver’s Credit, a tax credit available to eligible taxpayers who
contribute to a 401(k) or similar plan, an IRA, or an ABLE account.
8. Be proactive to help ensure continued employment now and in retirement. As the economy reopens, take proactive steps to
stay employed and engage in the new landscape of work by learning new skills, honing current skills, and staying current on
employment trends.
9. Create a backup plan in the event of job loss or in case retirement comes early due to an unforeseen circumstance.
10. Take good care of yourself and safeguard your physical and mental health. Continue to take precautions to mitigate the spread
of COVID-19. Explore affordable ways to reduce stress and address anxiety. Consider health implications when making lifestyle
decisions.
11. Beware of scams. Be hypervigilant about suspicious text messages, email, or calls – especially relating to COVID.
32

Recommendations for Employers
Amid the pandemic, employers faced critical decisions about staffing, safety protocols, supporting employees, and more. Now, as
the economy recovers from the pandemic and employers envision their post-pandemic workplaces, it is important to note the vital
role employers play in supporting the long-term health and financial well-being of their employees. Employers have an opportunity
to enhance their business practices and benefits offerings. Specific opportunities for consideration include:
1. Clearly communicate changes to the workplace. Transparent and frequent communication with employees may help alleviate
anxiety about returning to the office.
2. Offer flexible work arrangements that support work-life balance and employees’ personal responsibilities such as parenting,
home-schooling, and caregiving.
3. Offer health and welfare benefits that promote physical, mental, and financial health and well-being such as health, disability,
and life insurance; workplace wellness and financial wellness programs; and employee assistance programs.
4. Offer a retirement plan or achieve efficiencies by joining a multiple employer plan (MEP), a pooled employer plan (PEP), or a
group of plans (GOP). If a plan is not already in place, take advantage of the tax credit available for starting a retirement plan
or joining a MEP, PEP, or GOP.
5. Extend benefits eligibility to part-time workers, including health insurance and retirement plan offerings. For part-time workers
not offered health insurance, provide information about the options available in the marketplace. For part-time workers who
do not qualify as long-term employees for retirement benefits under the SECURE Act, considering providing them with the
ability to contribute to an IRA through payroll deduction.
6. Promote the benefits your company offers, including retirement planning and educational resources available through your
retirement plan provider, and health and wellness programs available through your employee benefit providers. Increasing
awareness of these offerings may help employees increase their physical, mental, and financial well-being.
7. Foster an age-friendly work environment and adopt diversity, equity and inclusion business practices that include age among
other demographic factors (e.g., gender, race, religion, sexual orientation).
8. Encourage lifelong learning opportunities for workers to keep their skills up to date or learn new skills to help them remain
employable in a fast-changing job market.
9. Offer pre-retirees greater levels of assistance in planning their transition into retirement, including education about retirement
income strategies for managing savings to last their lifetime, retirement plan distribution options, and the need for a backup
plan if forced into retirement sooner than expected (e.g., due to health issues, job loss, family obligations). Provide information
about Social Security and Medicare.
10. Create opportunities for workers to phase into retirement by allowing for a transition from full-time to part-time, working in
different capacities or different locations, or having a more flexible schedule.
33

Recommendations for Policymakers
As policymakers are paving the way for the country’s recovery from the pandemic, they have an opportunity to improve diversity,
equity, and inclusion in all aspects of American life – including people’s health and long-term financial well-being. It is now more
urgent than ever to implement policy reforms to strengthen social safety nets, make it more affordable for employers to update
their benefits and business practices, and help workers save and invest for the future. Recommendations include:
1. Address Social Security and Medicare funding issues. The sooner reforms are implemented to the programs, the more time
people will have to adjust their financial plans for retirement.
2. Ensure accessible and affordable health care options are available to all Americans, including part-time, self-employed, and
gig economy workers, as well as those not in the workforce.
3. Engage leaders from across sectors and disciplines to collaborate, innovate and implement new financing and delivery models
for long-term care that are more accessible and affordable to those needing care and family caregivers who provide care.
4. Support family caregivers by providing Social Security credits to those who forego employment to provide care. Establish
medical training programs for family caregivers. Encourage employers to help workers with caregiving responsibilities.
5. Further incentivize small companies to offer employee benefits, including retirement plans and health insurance. Strengthen
small companies’ tax credits for joining multiple employer plans (MEPs) or pooled employer plans (PEPs) and authorize the
formation of 403(b) MEPs and PEPs. Expand inclusion of part-time workers in retirement plans by redefining long-term
employment to two years of service.
6. Enhance existing tax incentives for workers to save for retirement, including increasing catch-up contribution limits; expanding
automatic enrollment, automatic re-enrollment, and automatic increases; allowing employers to base retirement plan matches
on employees’ student loan repayments; and expanding and promoting the Saver’s Credit.
7. Facilitate retirement savings to last a lifetime. Proposals that help participants both manage their investment risk and build
retirement savings to last their lifetime are encouraged, including the broader use of Qualifying Longevity Annuity Contracts
(QLACs) in retirement plans and Individual Retirement Accounts (IRAs).
8. Encourage employers to implement age-friendly business practices as part of their DE&I efforts. Create new incentives and
remove disincentives for employers to hire and retain age 50+ employees, offer phased retirement programs, and create
opportunities for encore careers.
9. Address the digital divide. Consider providing and/or subsidizing additional broadband access, particularly in rural and
underserved urban areas. Internet access is key to timely dissemination of education and information and to engaging with
financial and health-related service providers.
10. Support lifelong learning ranging from financial education in schools and in the workplace to ongoing professional
development, including retraining and learning new job skills.
34

Living in the COVID-19 Pandemic:
The Health, Finances, and
Retirement Prospects of Four Generations
Detailed Findings
35

A Portrait of Four Generations
36

37
59%have experienced one
or more negative employment impacts, due to the pandemic (e.g., reduced hours,
reduced salaries, furloughs, layoffs).
Pg. 47, 49
Generation Z (Born 1997 to 2012)
Generation Z are internet natives who are saving for retirement in employer-sponsored 401(k) or similar plans and through
personal savings and investments. Generation Z workers are starting to save for retirement at an unprecedented young
age. They will likely change employers many times throughout their careers and spend time in self-employment, which will
require diligence on their part to manage and potentially consolidate their retirement accounts during these transitions.
They began entering the workforce shortly before the COVID-19 pandemic when unemployment rates were at historic lows,
but which subsequently skyrocketed at the onset of the pandemic. Generation Z will be entering their mid-30s in the
2030s when the Social Security trust fund is estimated to be depleted unless Congress implements reforms.
70%are saving for
retirement in a 401(k) or similar
plan, and/or outside the workplace.
Pg. 54 Pg. 64 Pg. 66 Pg. 77
Pg. 101
is the percentage of their annual salaries (median) that plan
participants are contributing to
401(k) or similar plans.Pg. 101 Pg. 124 Pg. 105 Pg. 69
15Age 19is the age (median) that Generation Z investors started
saving for retirement.
$26,000is the amount saved
in all household retirement accounts (estimated median).
$2,000is the amount of
emergency savings to cover unexpected
major financial setbacks (median).
7 in 1076% are in good or
excellent health, but 72% are concerned about their mental
health.
69%have made
adjustments due to pandemic-related
financial strain.
35% cite paying off student debt and
33% cite saving for retirement as
financial priorities.
1 in 317% are planning to
live to age 100 or older.
1 in 6
Note: The survey interviewed Generation Z workers aged 18 to 23 in 2020.

38
Pg. 44
Millennials (Born 1981 to 1996)
31% frequently discuss saving, investing, and planning for
retirement with family and close
friends.
Millennials are also digital natives and retirement savers who will rely on self-funded savings more than their
predecessors. Many entered the workforce around the time of the Great Recession — with higher levels of student debt
than previous generations. Millennials are buying homes, getting married, and starting families at older ages than past
generations. With the aging of Baby Boomers, many Millennials have been, or will be, called upon to serve as caregivers for
their parents, which could detract from their employment and ability to save for retirement. Many Millennials expect their
primary source of retirement income to be self-funded through retirement accounts (e.g., 401(k)s, 403(b)s, IRAs), or other
savings and investments. Most are concerned that Social Security will not be there for them when they are ready to retire.
82%are saving for
retirement in a 401(k) or similar
plan, and/or outside the workplace.
Pg. 62 Pg. 59 Pg. 99 Pg. 118
is the percentage of their annual salaries (median) that plan
participants are contributing to
401(k) or similar plans.Pg. 101 Pg. 101 Pg. 124 Pg. 105 Pg. 69
15Age 25is the age (median)
that Millennial investors started
saving for retirement.
$68,000is the amount saved
in all household retirement accounts (estimated median).
$5,000is the amount of
emergency savings to cover unexpected
major financial setbacks (median).
86%are generally happy
people, but 50% often feel anxious
and depressed.
58%indicate their
financial situation has been negatively
impacted by the pandemic.
are concerned that Social Security will
not be there for them when they are
ready to retire.
77% 3 in 10are currently or have served as a caregiver
to a relative or friend during the
course of their working career.
44%

39
Pg. 44, 47
Generation X (Born 1965 to 1980)
Generation X entered the workforce in the late 1980s just as 401(k) plans were making their first appearance and defined
benefit plans were beginning to disappear; as such, they are the first generation to have access to 401(k) plans for the
majority of their working careers. Most are saving for retirement, but many are behind on their savings. The oldest
Generation Xers are now in their mid-50s and the youngest are in their early 40s. Although they are in their sandwich
years, during which they may be juggling their careers with raising children and caring for aging parents, there is no time
like the present for them to fully engage in building their assets and long-term financial plans.
84%are saving for
retirement in a 401(k) or similar
plan, and/or outside the workplace.
Pg. 66 Pg. 59 Pg. 94 Pg. 113
Pg. 101
is the percentage of their annual salaries (median) that plan
participants are contributing to
401(k) or similar plans.
Pg. 101 Pg. 124 Pg. 105 Pg. 69
10Age 30is the age (median) that Generation X investors started
saving for retirement.
$107,000is the amount saved
in all household retirement accounts (estimated median).
$6,000is the amount of
emergency savings to cover unexpected
major financial setbacks (median).
83%are enjoying life and
83% consider themselves to be in
good or excellent health.
19%are “very” confident they will be able to fully retire with a
comfortable lifestyle.
cite paying off debt and 65% cite saving
for retirement as financial priorities.
65%41% are currently or
have served as a caregiver during the
course of their working career.
4 in 10have a financial
strategy for retirement in the form of a written
plan.
32%
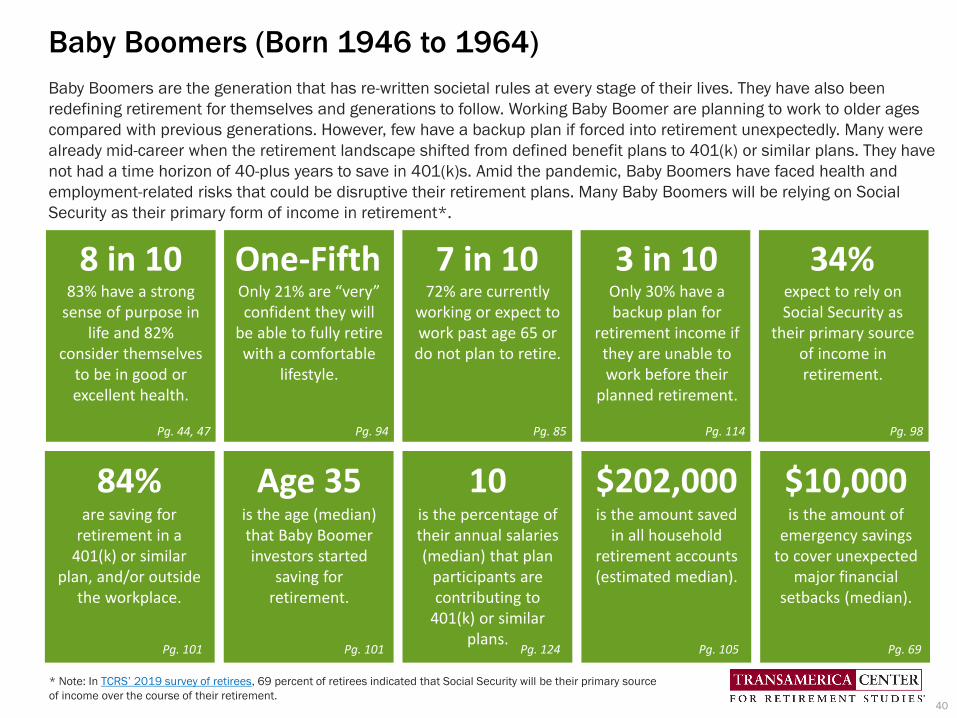
Pg. 44, 47
Baby Boomers (Born 1946 to 1964)
Baby Boomers are the generation that has re-written societal rules at every stage of their lives. They have also been
redefining retirement for themselves and generations to follow. Working Baby Boomer are planning to work to older ages
compared with previous generations. However, few have a backup plan if forced into retirement unexpectedly. Many were
already mid-career when the retirement landscape shifted from defined benefit plans to 401(k) or similar plans. They have
not had a time horizon of 40-plus years to save in 401(k)s. Amid the pandemic, Baby Boomers have faced health and
employment-related risks that could be disruptive their retirement plans. Many Baby Boomers will be relying on Social
Security as their primary form of income in retirement*.
84%are saving for
retirement in a 401(k) or similar
plan, and/or outside the workplace.
Pg. 94 Pg. 85 Pg. 114 Pg. 98
Pg. 101
is the percentage of their annual salaries (median) that plan
participants are contributing to
401(k) or similar plans.
Pg. 101 Pg. 124 Pg. 105 Pg. 69
10Age 35is the age (median) that Baby Boomer investors started
saving for retirement.
$202,000is the amount saved
in all household retirement accounts (estimated median).
$10,000is the amount of
emergency savings to cover unexpected
major financial setbacks (median).
8 in 1083% have a strong
sense of purpose in life and 82%
consider themselves to be in good or excellent health.
One-FifthOnly 21% are “very” confident they will
be able to fully retire with a comfortable
lifestyle.
72% are currently working or expect to work past age 65 or
do not plan to retire.
7 in 10expect to rely on Social Security as
their primary source of income in retirement.
34% Only 30% have a backup plan for
retirement income if they are unable to work before their
planned retirement.
3 in 10
* Note: In TCRS’ 2019 survey of retirees, 69 percent of retirees indicated that Social Security will be their primary source
of income over the course of their retirement. 40

What I Am Doing Differently Amid COVID-19…
I’m more focused on my money and
checking my 401(k). I look for more work
opportunities to make more money.
Age 49 Gen X Male
Trying to stay healthy both
mentally and physically.
Age 29 Millennial Female
I am taking time to move
closer to retirement by saving
more and reducing debt.
Age 62 Boomer Female
I'm not really doing
anything different, just
taking it day by day.
Age 57 Boomer Male
I am working from home and using
the delivery service more frequently.
Age 31 Millennial Male
I am spending less and
relying on my parents more.
Age 23 Gen Z Female
Keeping up communication
with my friends, continue to do
the things I love and exercise.
Age 19 Gen Z Female
Meditation and yoga.
Age 49 Gen X Male
Trying to pay down
credit card debt faster.
Age 49 Gen X Female
BASE: 21ST ANNUAL SURVEY - ALL QUALIFIED RESPONDENTSQ9000. What are you doing differently amid the coronavirus pandemic to support your health, financial security, and/or general well-being? Please be as descriptive as possible.
IDK
Age 22 Gen Z Male
Just trying to be a better
manager of money overall.
Age 57 Boomer Female
Budgeting
Age 30 Millennial Male
41

Physical and Mental Health
42

Workers Are Generally Upbeat but Many Are Distressed
Most workers share positive sentiments about life, such as having close relationships with family and/or
friends (88 percent), being generally happy (86 percent), enjoying life (82 percent), and having a strong
sense of purpose in life (82 percent). Seventy-four percent of workers have a positive view of aging and 64
percent have an active social life. However, a concerning proportion of workers are experiencing distress,
such as often feeling anxious and depressed (40 percent), often feeling unmotivated and overwhelmed (39
percent), having trouble making ends meet (37 percent), and feeling isolated and lonely (31 percent).
43BASE: 21ST ANNUAL SURVEY ALL QUALIFIED RESPONDENTSQ5025. How much do you agree or disagree with the following statements?
How much do you agree or disagree with the following statements? (NET – Strongly/Somewhat Agree) (%)All Workers
88 86 82 82 74
64
40 39 37 31
I have closerelationshipswith family
and/orfriends
I am agenerally
happyperson
I amenjoyingmy life
I have astrong senseof purposein my life
I have apositiveview ofaging
I have anactive
social life
I often feelanxious anddepressed
I often feelunmotivated
andoverwhelmed
I am havingtroublemaking
ends meet
I am isolatedand lonely
Positive Feelings Indicators of Distress

Younger Generations Are More Likely to Be Distressed
Half or more of Generation Z and Millennials indicate they often feel anxious and depressed (52 percent and 50
percent, respectively). Almost six in 10 Generation Z (59 percent) and 48 percent of Millennials say they often
feel unmotivated and overwhelmed. Thirty-nine percent of Generation Z and almost half of Millennials (46
percent) have trouble making ends meet. Approximately four in 10 Generation Z and Millennials feel isolated
and alone (41 percent and 38 percent, respectively).
44BASE: 21ST ANNUAL SURVEY - ALL QUALIFIED RESPONDENTSQ5025. How much do you agree or disagree with the following statements?
82 77
70 70
57 65
52 59
39 41
88 86 83 80 75 72
50 48 46 38
89 88 83 85
77
60
35 34 36 29
90 90 86 83
76
51
24 22 21 19
I have closerelationshipswith family
and/orfriends
I am agenerally
happyperson
I amenjoyingmy life
I have astrong senseof purposein my life
I have apositiveview ofaging
I have anactive
social life
I often feelanxious anddepressed
I often feelunmotivated
andoverwhelmed
I am havingtroublemaking
ends meet
I am isolatedand lonely
Generation Z Millennials Generation X Baby Boomers
How much do you agree or disagree with the following statements? (NET – Strongly/Somewhat Agree) (%)By Generation
Positive Feelings Indicators of Distress

Health and Financial-Related Anxieties Caused by the Pandemic
45BASE: 21ST ANNUAL SURVEY - ALL QUALIFIED RESPONDENTSQ2100H. Which of the following have caused you anxiety during the coronavirus pandemic? Select all.
44 40
32
16
32
23
17
35 33
18 16 14
1
16
Risk ofcontractingCOVID-19
My family’s health
Myown
health
Health careaccessibility
andaffordability
Myfinances
Employmentinsecurity
Housingexpenses
Concernsabout myfamily and
friends
Uncertaintyabout the
future
Socialinjustice
Strainedrelationships
Myhome
environment
Other Nothing hascaused me
anxietyduring thepandemic
Which of the following have caused you anxiety during the coronavirus pandemic? Select all.All Workers (%)
NET – Health-Related68%
NET – Financial-Related45%
More than eight in 10 workers (84 percent) have experienced one or more causes of anxiety during the pandemic.
Sixty-eight percent cite health-related anxieties including the risk of contracting COVID-19 (44 percent), their
family’s health (40 percent), and their own health (32 percent). Forty-five percent cite financial-related anxieties
such as their finances (32 percent), employment insecurity (23 percent), and housing expenses (17 percent).
One-third of workers cite concerns about family and friends (35 percent) and uncertainty about the future (33
percent). Other causes of anxiety include social injustice (18 percent), strained relationships (16 percent), and
their home environment (e.g., crowded conditions, multigenerational household, isolation, etc.) (14 percent).
NET – Experienced Anxiety84%

Younger Generations More Likely to Cite Causes of Anxiety
46BASE: 21ST ANNUAL SURVEY - ALL QUALIFIED RESPONDENTSQ2100H. Which of the following have caused you anxiety during the coronavirus pandemic? Select all.
41
50
41
18
40
27 22
37 41
25 25 21
1
9
41 44
34
19
35
27 21
32 31
21 21 19
1
12
42 38
31
15
30
22 17
36 31
17 12 12
2
19
52
32 28
12
25
17
7
40 34
11 8
5 3
22
Risk ofcontractingCOVID-19
My family’s health
Myown
health
Health careaccessibility
andaffordability
Myfinances
Employmentinsecurity
Housingexpenses
Concernsabout myfamily and
friends
Uncertaintyabout the
future
Socialinjustice
Strainedrelationships
Myhome
environment
Other Nothing hascaused me
anxietyduring thepandemic
Which of the following have caused you anxiety during the coronavirus pandemic? Select all. (%)By Generation
More than three in four workers across generations have experienced one or more causes of anxiety during the pandemic; however,
Generation Z (91 percent) and Millennials (88 percent) are more likely than Generation X (81 percent) and Baby Boomers (78
percent) to have done so. Generation Z and Millennials (both 53 percent) are more likely than older generations to cite financial-
related anxieties. Generation Z and Millennials are also more likely to cite other sources of anxiety during the pandemic such as
social injustice, strained relationships, and their home environment. Generation Z is also more likely to cite uncertainty about the
future as a cause of anxiety. Approximately one in five Baby Boomers (22 percent) and Generation X (19 percent) indicate nothing
has caused them anxiety during the pandemic.
NET – Health-RelatedGeneration Z: 73%Millennials: 70%Generation X: 65%Baby Boomers: 65%
NET – Financial-RelatedGeneration Z: 53%Millennials: 53%Generation X: 43%Baby Boomers: 31%
NET – Experienced AnxietyGeneration Z: 91%Millennials: 88%Generation X: 81%Baby Boomers: 78%

4 in 5 Workers Describe Themselves as Healthy
Eighty-three percent of workers describe their general health as “excellent” or “good,” with 25 percent
describing it as “excellent” and 58 percent as “good.” Fifteen percent describe their health as being “fair”
and one percent as “poor.” Millennials, Generation Z, and Generation X are more likely to describe their
general health as “excellent” (30 percent, 26 percent, and 25 percent, respectively), compared with Baby
Boomers (17 percent).
BASE: 21ST ANNUAL SURVEY - ALL QUALIFIED RESPONDENTSQ2770. Overall, how would you describe your general health?
Self-Described General Health (%)
Excellent Good PoorFair
NET – Excellent/Good Health
All Workers 83%
Generation Z 76%
Millennials 85%
Generation X 83%
Baby Boomers 82%
25
26
30
25
17
58
50
55
58
65
15
20
14
16
17
1
4
1
1
1
Note: Results may not total 100% due to rounding.
47

Two-Thirds of Workers Are Concerned About Their Physical Health
Sixty-six percent of workers are concerned about their physical health, including 29 percent who are “very
concerned” and 37 percent who are “somewhat concerned.” Millennials (36 percent) are more likely to be
“very concerned” than Generation X (27 percent), Generation Z (24 percent), and Baby Boomers (20 percent).
48BASE: 21ST ANNUAL SURVEY - ALL QUALIFIED RESPONDENTSQ1447. How concerned are you about maintaining each of the following? Physical health.
How concerned are you about maintaining each of the following? (%)
Physical Health
Very concerned Somewhat concerned Not very concerned Not at all concerned
NET – Very/Somewhat Concerned
All Workers 66%
Generation Z 61%
Millennials 68%
Generation X 68%
Baby Boomers 60%
29
24
36
27
20
37
37
32
41
40
23
26
21
21
29
11
13
11
11
11

3 in 5 Workers Are Concerned About Their Mental Health
Sixty percent of workers are concerned about their mental health, including 29 percent who are “very
concerned” and 31 percent who are “somewhat concerned.” Millennials (38 percent) and Generation Z
(36 percent) are significantly more likely to be “very concerned” than Generation X (27 percent) and Baby
Boomers (14 percent).
49BASE: 21ST ANNUAL SURVEY - ALL QUALIFIED RESPONDENTSQ1447. How concerned are you about maintaining each of the following? Mental health.
How concerned are you about maintaining each of the following? (%)
Mental Health
Very concerned Somewhat concerned Not very concerned Not at all concerned
NET – Very/SomewhatConcerned
All Workers 60%
Generation Z 72%
Millennials 70%
Generation X 59%
Baby Boomers 42%
29
36
38
27
14
31
36
32
32
28
23
16
19
23
31
17
12
11
19
27
Note: Results may not total to 100% due to rounding.

Engaging in Health-Related Activities on a Consistent Basis (%) All Workers
NET – Pandemic-Related Activities
Taking COVID-19 precautions (e.g., wearing a mask, physically distancing, washing hands, etc.)
Socializing with family and friends remotely (e.g., phone calls, online platforms, etc.)
Eating healthy
Exercising regularly
Getting plenty of rest
Maintaining a positive outlook
Avoiding harmful substances (e.g., cigarettes, alcohol, illicit drugs, etc.)
Managing stress
Getting routine physicals and recommended health screenings
Seeking medical attention when needed
Considering long-term health when making lifestyle decisions
Practicing mindfulness and meditation
Other
Nothing
Workers Can Do More to Safeguard Their Health
When asked about health-related activities they are doing on a consistent basis, more than seven in 10 workers
(71 percent) are engaging in pandemic-related activities, including taking COVID-19 precautions (62 percent) and
socializing with family and friends remotely (43 percent). Fifty-six percent are eating healthy, and 55 percent are
exercising regularly. Fewer than half are getting plenty of rest, maintaining a positive outlook, avoiding harmful
substances, managing stress, getting routine physicals and recommended health screenings, or seeking medical
attention when needed. Note: The survey was conducted prior to the widespread availability of COVID-19
vaccinations.
BASE: 21ST ANNUAL SURVEY - ALL QUALIFIED RESPONDENTS
Q1446. Which of the following health-related activities are you currently doing on a consistent basis? Select all.
71
62
43
56
55
46
44
41
40
38
37
23
22
<1
4
50
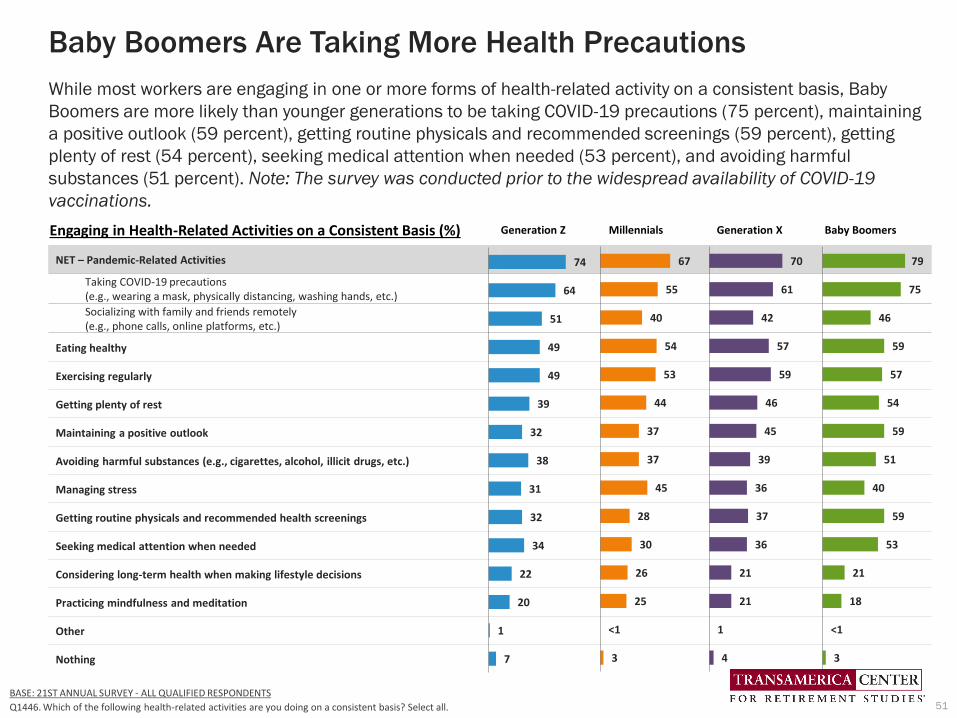
Generation Z Millennials Generation X Baby Boomers
NET – Pandemic-Related Activities
Taking COVID-19 precautions(e.g., wearing a mask, physically distancing, washing hands, etc.)
Socializing with family and friends remotely(e.g., phone calls, online platforms, etc.)
Eating healthy
Exercising regularly
Getting plenty of rest
Maintaining a positive outlook
Avoiding harmful substances (e.g., cigarettes, alcohol, illicit drugs, etc.)
Managing stress
Getting routine physicals and recommended health screenings
Seeking medical attention when needed
Considering long-term health when making lifestyle decisions
Practicing mindfulness and meditation
Other
Nothing
Baby Boomers Are Taking More Health Precautions
While most workers are engaging in one or more forms of health-related activity on a consistent basis, Baby
Boomers are more likely than younger generations to be taking COVID-19 precautions (75 percent), maintaining
a positive outlook (59 percent), getting routine physicals and recommended screenings (59 percent), getting
plenty of rest (54 percent), seeking medical attention when needed (53 percent), and avoiding harmful
substances (51 percent). Note: The survey was conducted prior to the widespread availability of COVID-19
vaccinations.
BASE: 21ST ANNUAL SURVEY - ALL QUALIFIED RESPONDENTS
Q1446. Which of the following health-related activities are you doing on a consistent basis? Select all.
Engaging in Health-Related Activities on a Consistent Basis (%)
74
64
51
49
49
39
32
38
31
32
34
22
20
1
7
51
67
55
40
54
53
44
37
37
45
28
30
26
25
<1
3
70
61
42
57
59
46
45
39
36
37
36
21
21
1
4
79
75
46
59
57
54
59
51
40
59
53
21
18
<1
3

Employment Impacts
52

4 in 10 Personally Experienced Negative Employment Impacts
Among those employed in late 2020, more than four in 10 workers (43 percent) personally experienced
one or more negative impacts to their employment situation as a result of the pandemic, including reduced
hours (27 percent), reduced salaries (14 percent), furloughs (10 percent), layoffs (8 percent), and early
retirement (4 percent). More than one in three workers (37 percent) had no impacts on their employment.
53
Note: Responses not shown for “Other employment impacts” (All Workers: 3%).
BASE: 21ST ANNUAL SURVEY - ALL QUALIFIED RESPONDENTSQ8825. Have you or your spouse/partner experienced any of the following employment impacts as a result of the coronavirus pandemic? Select all.
27
14
10 8
4 7 6 5 5
3
37
15
3 4
Reducedwork hours
Reducedsalary
Furloughed Laid off Retired early Spouse/Partner
reduced workhours
Spouse/Partnerreduced
salary
Spouse/Partner
furloughed
Spouse/Partnerlaid off
Spouse/Partnerretiredearly
Myemploymenthasn't been
impactedby
coronavirus
Spouse’s/ partner’s
employmenthasn'tbeen
impactedby
coronavirus
I was notemployed
at allduring the
coronaviruspandemic
Spouse/partnerwas not
employedat all
during thecoronaviruspandemic
Have you or your spouse/partner experienced any of the following employment impacts as a result of the coronavirus pandemic? Select all.
All Workers (%)
NET – Personally Impacted43%
NET – Spouse/Partner Impacted17%

Generation Z Is More Likely to Have Been Negatively Impacted
54
Note: Responses not shown for “Other employment impacts” (Generation Z: 3%, Millennials: 1%, Generation X: 3%, Baby Boomers: 4%).
BASE: 21ST ANNUAL SURVEY - ALL QUALIFIED RESPONDENTSQ8825. Have you or your spouse/partner experienced any of the following employment impacts as a result of the coronavirus pandemic? Select all.
43
18
9 12
5 2 1 1 2 <1
30
4 6
<1
33
17
11 12
610
7 7 7 5
31
12
3 3
23
139 7
38 6 4 5
2
40
20
2 3
16
9 9
3 14 5 4 2 1
48
15
2 6
Reducedwork hours
Reducedsalary
Furloughed Laid off Retired early Spouse/Partner
reduced workhours
Spouse/Partnerreduced
salary
Spouse/Partner
furloughed
Spouse/Partnerlaid off
Spouse/Partnerretiredearly
Myemploymenthasn't been
impactedby
coronavirus
Spouse’s/ partner’s
employmenthas not
been impacted
by coronavirus
I was notemployed
at allduring the
coronaviruspandemic
Spouse/partnerwas not
employedat all
during thecoronaviruspandemic
Have you or your spouse/partner/significant other experienced any of the following employment impacts as a result of the coronavirus pandemic? Select all.
By Generation (%)
Almost six in 10 Generation Z workers (59 percent) indicate their employment situation has been negatively
impacted as a result of the pandemic, which is significantly more than among Millennials (51 percent),
Generation X (39 percent), and Baby Boomers (30 percent). A reduction in work hours was the most often cited
negative impact across generations, including Generation Z (43 percent), Millennials (33 percent), Generation X
(23 percent), and Baby Boomers (16 percent). Nearly half of Baby Boomers (48 percent) had no employment
impacts.
NET – Personally Impacted
Generation Z: 59%Millennials: 51%Generation X: 39%Baby Boomers: 30%
NET – Spouse/Partner Impacted
Generation Z: 5%Millennials: 23%Generation X: 17%Baby Boomers: 14%
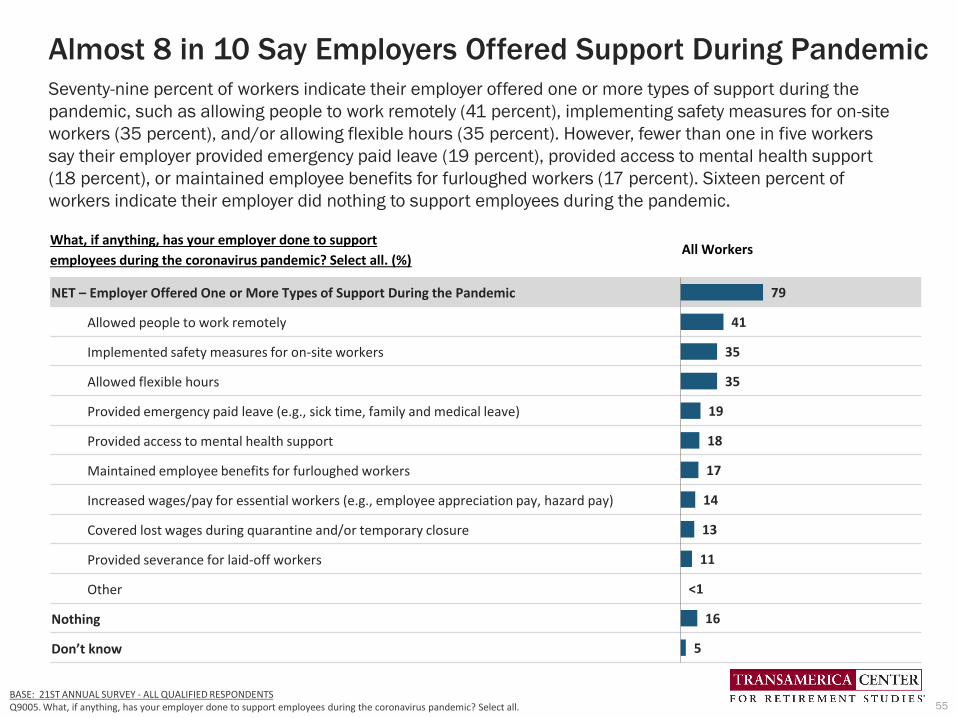
What, if anything, has your employer done to support
employees during the coronavirus pandemic? Select all. (%)All Workers
NET – Employer Offered One or More Types of Support During the Pandemic
Allowed people to work remotely
Implemented safety measures for on-site workers
Allowed flexible hours
Provided emergency paid leave (e.g., sick time, family and medical leave)
Provided access to mental health support
Maintained employee benefits for furloughed workers
Increased wages/pay for essential workers (e.g., employee appreciation pay, hazard pay)
Covered lost wages during quarantine and/or temporary closure
Provided severance for laid-off workers
Other
Nothing
Don’t know
79
41
35
35
19
18
17
14
13
11
<1
16
5
Almost 8 in 10 Say Employers Offered Support During Pandemic
55BASE: 21ST ANNUAL SURVEY - ALL QUALIFIED RESPONDENTSQ9005. What, if anything, has your employer done to support employees during the coronavirus pandemic? Select all.
Seventy-nine percent of workers indicate their employer offered one or more types of support during the
pandemic, such as allowing people to work remotely (41 percent), implementing safety measures for on-site
workers (35 percent), and/or allowing flexible hours (35 percent). However, fewer than one in five workers
say their employer provided emergency paid leave (19 percent), provided access to mental health support
(18 percent), or maintained employee benefits for furloughed workers (17 percent). Sixteen percent of
workers indicate their employer did nothing to support employees during the pandemic.

Employer Support Varies by Generation
56
Baby Boomers, Generation X, and Millennials (45 percent, 44 percent, and 40 percent, respectively) are more
likely than Generation Z (26 percent) to indicate their employers allowed people to work remotely amid the
pandemic. Baby Boomers (72 percent) are somewhat less likely be offered the possible types of support,
compared with Millennials, Generation Z, and Generation X (84 percent, 78 percent, and 76 percent, respectively).
What, if anything, has your employer done to support
employees during the coronavirus pandemic? Select all. (%)Generation Z Millennials Generation X Baby Boomers
NET – Any Employer Support During the Pandemic
Allowed people to work remotely
Implemented safety measures for on-site workers
Allowed flexible hours
Provided emergency paid leave (e.g., sick time, family and medical leave)
Provided access to mental health support
Maintained employee benefits for furloughed workers
Increased wages/pay for essential workers (e.g., employee appreciation pay, hazard pay)
Covered lost wages during quarantine and/or temporary closure
Provided severance for laid-off workers
Other
Nothing
Don’t know
BASE: 21ST ANNUAL SURVEY - ALL QUALIFIED RESPONDENTSQ9005. What, if anything, has your employer done to support employees during the coronavirus pandemic? Select all.
78
26
32
44
25
17
15
18
15
12
1
15
7
84
40
34
37
21
22
19
20
17
13
<1
12
4
76
44
33
34
21
18
16
11
13
9
<1
18
6
72
45
40
28
11
11
16
7
8
8
<1
21
6
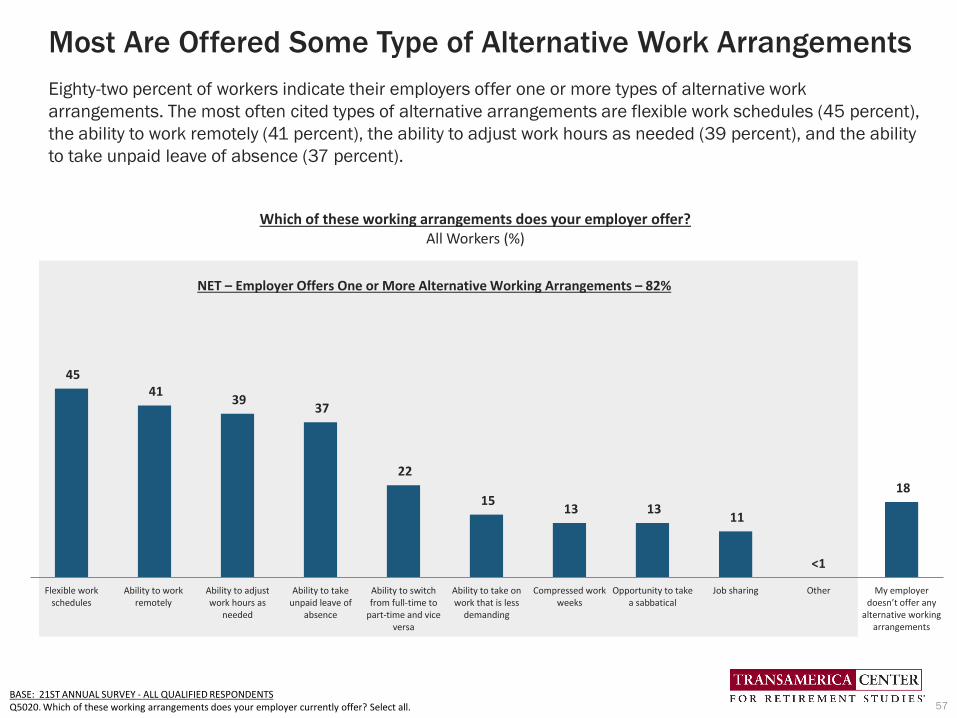
45 41
39 37
22
15 13 13
11
<1
18
Flexible workschedules
Ability to workremotely
Ability to adjustwork hours as
needed
Ability to takeunpaid leave of
absence
Ability to switchfrom full-time to
part-time and viceversa
Ability to take onwork that is less
demanding
Compressed workweeks
Opportunity to takea sabbatical
Job sharing Other My employer doesn’t offer any
alternative working arrangements
Which of these working arrangements does your employer offer?All Workers (%)
Most Are Offered Some Type of Alternative Work Arrangements
Eighty-two percent of workers indicate their employers offer one or more types of alternative work
arrangements. The most often cited types of alternative arrangements are flexible work schedules (45 percent),
the ability to work remotely (41 percent), the ability to adjust work hours as needed (39 percent), and the ability
to take unpaid leave of absence (37 percent).
57BASE: 21ST ANNUAL SURVEY - ALL QUALIFIED RESPONDENTSQ5020. Which of these working arrangements does your employer currently offer? Select all.
NET – Employer Offers One or More Alternative Working Arrangements – 82%

Alternative Work Arrangements Vary by Generation
Younger workers are generally more likely to be offered flexible work arrangements than older workers. Ninety
percent of Generation Z and 88 percent of Millennials are offered one or more types of alternative work
arrangement by their employers, compared with 80 percent of Generation X and 72 percent of Baby Boomers.
58BASE: 21ST ANNUAL SURVEY - ALL QUALIFIED RESPONDENTSQ5020. Which of these working arrangements does your employer currently offer? Select all.
Generation Z Millennials Generation X Baby Boomers
NET – Employer Offers One or More Alternative Working Arrangements
Flexible work schedules
Ability to work remotely
Ability to adjust work hours as needed
Ability to take unpaid leave of absence
Ability to switch from full-time to part-time and vice versa
Ability to take on work that is less demanding
Compressed work weeks
Opportunity to take a sabbatical
Job sharing
Other
My employer doesn’t offer any alternative working arrangements
90
51
33
54
38
26
15
11
9
9
1
10
88
50
42
40
35
26
23
19
18
18
<1
12
80
43
43
37
38
21
12
13
13
7
-
20
72
38
40
34
37
14
6
5
6
2
-
28
Which of these working arrangements does your employer offer? (%)

24 17
60
18 21
62
30
17
55
26
18
58
12 14
74
Yes, I am a currently a caregiver Yes, I have been a caregiver in the past No
Almost 4 in 10 Workers Are and/or Have Been Caregivers
Caregiving for a loved one can put the caregiver’s own health, employment, and financial situation at risk.
During their careers, 39 percent of workers have served as a caregiver for a relative or friend, including
24 percent who are currently caregivers and 17 percent who have been a caregiver in the past. Millennial
and Generation X workers (30 percent and 26 percent, respectively) are more likely than Generation Z
and Baby Boomer workers (18 percent and 12 percent, respectively) to be currently serving as caregivers.
59
Are you currently serving or have you served as a caregiver for a relative or friend during the course of your working career (excluding parenting responsibilities)? (%)
BASE: 21ST ANNUAL SURVEY - ALL QUALIFIED RESPONDENTSQ2500x1. Are you currently serving or have you served as a caregiver for a relative or friend during the course of your working career (excluding parenting responsibilities)? Select all.
NET – Served as Caregiver During Course of Working Career
All Workers 39%Generation Z: 37%Millennials: 44%Generation X: 41%Baby Boomers: 25%
Note: Chart excludes “not sure” responses which are 1 percent among all four generations.

Nearly 9 in 10 Caregivers Made Work Adjustments
Among workers who are serving and/or have served as caregivers, 87 percent made one or more work-related
adjustments as a result of becoming a caregiver (e.g., missed days of work, reduced hours, began working an
alternative schedule). Millennial, Generation Z, and Generation X workers (93 percent, 91 percent, and 86
percent, respectively) are more likely to have made adjustments than Baby Boomers (68 percent).
60
Work-related adjustments as a result of becoming a caregiver (%) All Workers Gen Z Millennials Gen XBaby
Boomers
NET- Made one or more adjustments 87 91 93 86 68
Missed days of work 33 36 33 33 29
Reduced my hours 25 23 32 22 16
Began working an alternative schedule 24 27 26 25 17
Took on additional hours to pay for cost of caregiving 23 22 30 21 3
Began to work remotely 22 21 26 22 10
Taken an unpaid leave of absence from my employer 19 16 20 21 13
Taken a paid leave of absence from my employer 17 16 22 15 6
Reduced job responsibilities or switched to a less demanding job 17 14 19 17 13
Started working as a contractor, freelancer, or in the gig economy 13 6 16 15 4
Transferred to a different location within my company 12 12 14 14 1
Forgone a promotion 11 9 14 10 6
Quit a job 9 9 12 7 5
Retired early 1 - - 1 3
None 10 3 4 12 29
I was not working when I started caregiving 3 6 3 2 3
Note: Responses not shown for “Other” (All Workers: 1%, Generation Z: <1%, Millennials: 1%, Generation X: 1%, Baby Boomers: <1%).
BASE: 21ST ANNUAL SURVEY - SERVED AS A CAREGIVERQ2505x1. Which of the following have you done as a result of becoming a caregiver? Select all.
Current Financial Situation
61

Many Workers’ Finances Have Been Negatively Impacted
Almost half of workers (49 percent) say their financial situation has been negatively impacted by the pandemic,
including 18 percent who have been impacted “a great deal” and 31 percent who have been “somewhat’
impacted. Generation Z and Millennials (both 58 percent) are significantly more likely to indicate their financial
situation has been negatively impacted, compared with Generation X (46 percent) and Baby Boomers (34 percent).
62BASE: 21ST ANNUAL SURVEY - ALL QUALIFIED RESPONDENTSQ9010. To what extent has your financial situation been negatively impacted by the pandemic?
To what extent has your financial situation been negatively impacted by the pandemic? (%)
19
24
18
8
39
34
28
26
30
25
29
36
11
17
24
30
Generation Z
Millennials
Generation X
Baby Boomers
NET – A Great Deal/ Somewhat: 58%
NET – A Great Deal/ Somewhat: 46%
NET – A Great Deal/ Somewhat: 34%
A Great Deal Somewhat Not very much Not at all
NET – A Great Deal/ Somewhat: 58%
18
31 29
22
All Workers Workers by GenerationNET – A Great
Deal/ Somewhat
49%
Note: Results may not total to 100% due to rounding.
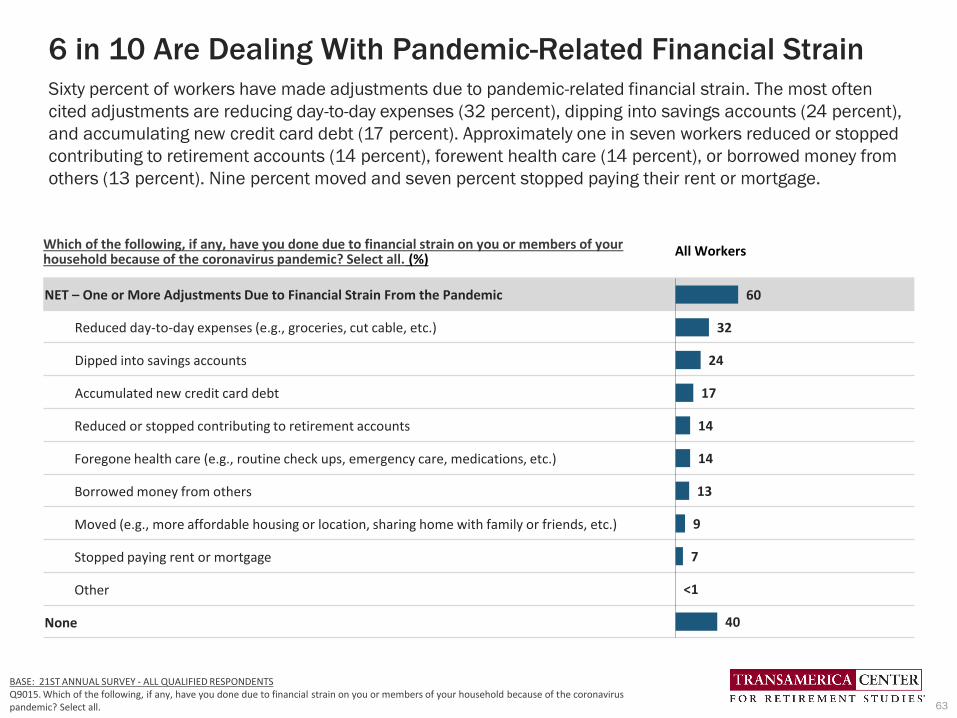
Which of the following, if any, have you done due to financial strain on you or members of your household because of the coronavirus pandemic? Select all. (%)
All Workers
NET – One or More Adjustments Due to Financial Strain From the Pandemic
Reduced day-to-day expenses (e.g., groceries, cut cable, etc.)
Dipped into savings accounts
Accumulated new credit card debt
Reduced or stopped contributing to retirement accounts
Foregone health care (e.g., routine check ups, emergency care, medications, etc.)
Borrowed money from others
Moved (e.g., more affordable housing or location, sharing home with family or friends, etc.)
Stopped paying rent or mortgage
Other
None
60
32
24
17
14
14
13
9
7
<1
40
6 in 10 Are Dealing With Pandemic-Related Financial Strain
63
BASE: 21ST ANNUAL SURVEY - ALL QUALIFIED RESPONDENTSQ9015. Which of the following, if any, have you done due to financial strain on you or members of your household because of the coronavirus pandemic? Select all.
Sixty percent of workers have made adjustments due to pandemic-related financial strain. The most often
cited adjustments are reducing day-to-day expenses (32 percent), dipping into savings accounts (24 percent),
and accumulating new credit card debt (17 percent). Approximately one in seven workers reduced or stopped
contributing to retirement accounts (14 percent), forewent health care (14 percent), or borrowed money from
others (13 percent). Nine percent moved and seven percent stopped paying their rent or mortgage.

Which of the following, if any, have you done due to financial strain on you or members of your household because of the coronavirus pandemic? Select all (%)
Gen Z Millennials Gen X Baby Boomers
NET – One or More Adjustments Due to Financial StrainFrom the Pandemic
Reduced day-to-day expenses (e.g., groceries, cut cable, etc.)
Dipped into savings accounts
Accumulated new credit card debt
Reduced or stopped contributing to retirement accounts
Foregone health care (e.g., routine check ups, emergency care, medications, etc.)
Borrowed money from others
Moved (e.g., more affordable housing or location, sharing home with family or friends, etc.)
Stopped paying rent or mortgage
Other
None
69
33
32
14
10
13
23
15
6
<1
31
Younger Generations More Likely to Be Dealing With Financial Strain
64
Millennials (71 percent), Generation Z (69 percent), and Generation X (59 percent) are more likely to have made
adjustments due to pandemic-related financial strain, compared with Baby Boomers (40 percent). Approximately
one-third of Millennials, Generation Z, and Generation X workers reduced day-to-day expenses (36 percent, 33
percent, and 33 percent, respectively). Approximately three in 10 Generation X (32 percent) and Millennials (29
percent) dipped into savings accounts. Of concern, approximately one in five Millennials and Generation X
accumulated new credit card debt (20 percent and 18 percent, respectively).
BASE: 21ST ANNUAL SURVEY - ALL QUALIFIED RESPONDENTSQ9015. Which of the following, if any, have you done due to financial strain on you or members of your household because of the coronavirus pandemic? Select all.
40
26
15
10
9
8
1
1
1
<1
60
71
36
29
20
18
16
20
13
11
<1
29
59
33
22
18
14
15
10
7
6
<1
41

Workers Face Competing Financial Priorities
Sixty-two percent of workers cite paying off one or more forms of debt as a current financial priority. A striking 59
percent cite saving for retirement and 45 percent cite building emergency savings as priorities. One in three
workers (33 percent) cite supporting children as a priority. Almost three in 10 workers (28 percent) indicate they
are just getting by to cover basic living expenses. Other often cited financial priorities among workers include
paying health care expenses (23 percent) and contributing to an education fund (21 percent).
65
BASE: 21ST ANNUAL SURVEY - ALL QUALIFIED RESPONDENTS
Q2639. Which of the following are your financial priorities right now? Select all.
59
45
40
31
16 13
33
28
23 21
17 13
10
5 4
Saving forretirement
Buildingemergency
savings
Paying offcredit card
Paying offmortgage
Paying offstudent loans
Paying offother
consumerdebt
Supportingchildren
Just getting byto cover basic
living expenses
Paying healthcare expenses
Contributingto an
educationfund (for my
children,grandchildren,
or other)
Creating aninheritance or
financiallegacy
Supportingparents
Paying long-term careexpenses
Supportinggrandchildren
Other
Financial Priorities Right Now? (%)All Workers
NET – Paying off debt: 62%

Financial Priorities Vary Across Generations
Generation Z workers are more likely to indicate they are just getting by to cover basis living expenses (50
percent) and paying off student loans (35 percent) than older generations. Baby Boomers, Generation X, and
Millennials are significantly more likely than Generation Z to cite saving for retirement as a financial priority (75
percent, 65 percent, 53 percent, and 33 percent, respectively). Building emergency savings is a priority for 50
percent of Generation X, 46 percent of Millennials, 42 percent of Generation Z, and 36 percent of Baby
Boomers. A noteworthy 20 percent of Millennials and 17 percent of Generation Z cite supporting parents.
Across generations, more than half of workers cite paying off one or more forms of debt as a priority.
66
Generation Z Millennials Generation X Baby Boomers
Saving for retirement
Building emergency savings
NET – Paying off debt
Paying off credit card
Paying off mortgage
Paying off student loans
Paying off other consumer debt
Supporting children
Just getting by to cover basic living expenses
Paying health care expenses
Contributing to an education fund (for my children, grandchildren, or other)
Creating an inheritance or financial legacy
Supporting parents
Paying long-term care expenses
Supporting grandchildren
Other
BASE: 21ST ANNUAL SURVEY - ALL QUALIFIED RESPONDENTS
Q2639. Which of the following are your financial priorities right now? Select all.
Financial Priorities Right Now (%)
33
42
61
29
18
35
8
13
50
19
13
10
17
7
3
6
53
46
66
43
30
22
16
42
32
26
25
20
20
15
6
5
65
50
65
42
38
10
13
43
25
23
27
17
11
10
6
2
75
36
53
37
29
5
10
11
17
15
7
12
3
3
4
2

58
31
19
3
24
Individual account(e.g., savings, checking,
brokerage, etc.)
Health savings account(HSA)
Flexible spending account(FSA)
Other None, I am not saving forhealth care expenses
More Than 3 in 4 Workers Have Health Care Expense AccountsSeventy-six percent of workers are currently saving or have funds saved to pay for health care expenses,
including through an individual account such as savings, checking, or brokerage (58 percent), a health
savings account (HSA) (31 percent), and/or a flexible spending account (FSA) (19 percent). A concerning
one in four workers (24 percent) are not saving for health care expenses.
67BASE: 21ST ANNUAL SURVEY – ALL QUALIFIED RESPONDENTSq755H. In which of the following accounts, if any, are you currently saving or have funds saved to pay for health care expenses? Select all.
NET – Saving for Health Care Expenses: 76%
In which of the following accounts, if any, are you saving or have funds saved to pay for health care expenses? Select all. (%)All Workers

Millennials Are More Likely to Be Saving for Health Care ExpensesMillennials (82 percent) are more likely to be saving in one or more types of accounts for health care expenses,
compared with Generation Z (72 percent), Generation X (72 percent), and Baby Boomers (73 percent).
However, of concern, a segment of workers across generations are not saving for health care expenses,
including 28 percent of Generation Z, 28 percent of Generation X, 27 percent of Baby Boomers, and 18 percent
of Millennials.
68BASE: 21ST ANNUAL SURVEY – ALL QUALIFIED RESPONDENTSq755H. In which of the following accounts, if any, are you currently saving or have funds saved to pay for health care expenses? Select all.
55
25
15
3
28
58
40
24
4
18
56
31
19
2
28
63
19 11
2
27
Individual account(e.g., savings, checking,
brokerage, etc.)
Health savings account (HSA) Flexible spending account(FSA)
Other None, I am not saving forhealth care expenses
NET – Saving for Health Care Expenses
Generation Z: 72%Millennials: 82%Generation X: 72%Baby Boomers: 73%
In which of the following accounts, if any, are you saving or have funds saved to pay for health care expenses? Select all. (%)By Generation

Emergency Savings Are Alarmingly Low
Emergency savings are needed to cover financial setbacks, such as unemployment, medical bills, home
repairs, auto repairs, and other unexpected expenses. Having emergency savings could also help prevent
workers from dipping into their retirement savings to cover such expenses. However, workers have
alarmingly low emergency savings – they have set aside only $5,000 (median). Notably, emergency savings
increase with age: Generation Z workers have saved $2,000, while Millennials have saved $5,000,
Generation X has saved $6,000, and Baby Boomers have saved $10,000 (medians).
BASE: 21ST ANNUAL SURVEY - ALL QUALIFIED RESPONDENTSQ2825. How much do you have in emergency savings specifically to cover the cost of unexpected major financial setbacks (e.g., unemployment, medical bills, home repairs, auto repairs, other)?
12 16 12 12 10
7
1110 7
3
12
1414
12
9
9
811
8
10
6
76
6
7
2
23
2
2
3
32
3
3
12
8 10
15
14
93 9
9
12
All Workers Generation Z Millennials Generation X Baby Boomers
$100k or more
$25k to less than $100k
$20k to less than $25k
$15k to less than $20k
$10k to less than $15k
$5k to less than $10k
$1k to less than $5k
$1 to less than $1k
None ($0)
Not sure 26 27 24 26 30
2020 Total Household Emergency Savings (%)
69
Median $5,000 $2,000 $5,000 $6,000 $10,000
Note: Percentages may not add up to 100% due to rounding.

Dipping Into Retirement Accounts Is Not Uncommon
A concerning percentage of workers are dipping into their retirement savings before they retire. Loans and
withdrawals from retirement accounts can severely inhibit the growth of their long-term savings. More than one-
third of workers (34 percent) have ever taken a loan, early withdrawal, and/or hardship withdrawal from their
401(k) or similar plan or IRA, including 25 percent who have taken a loan and 25 percent who have taken an
early and/or hardship withdrawal. Millennials (44 percent) are more likely to have ever dipped into retirement
savings than Generation X (33 percent), Generation Z (30 percent), and Baby Boomers (17 percent).
70BASE: 21ST ANNUAL SURVEY - ALL QUALIFIED RESPONDENTSQ754X1. Have you ever taken any form of loan or early withdrawal from a qualified retirement account such as a 401(k) or similar plan or IRA? Select all.
Taken Loan, Early Withdrawal, Hardship Withdrawal (%) All Workers Gen Z Millennials Gen X Baby Boomers
TOTAL NET – Have Taken a Loan, Early Withdrawal, and/or Hardship Withdrawal From 401(k) or Similar Plan or IRA
34 30 44 33 17
NET – Have Taken a Loan 25 23 35 24 9
NET – Have Taken an Early and/or Hardship Withdrawal 25 21 35 22 12
Yes, I have taken a loan from a 401(k) or similar plan and am paying it back 18 15 24 19 6
Yes, I have taken a loan from a 401(k) or similar plan but was unable to pay it back so it became an early withdrawal and incurred taxes and penalties
11 10 18 9 3
Yes, I have taken a hardship withdrawal and incurred taxes and penalties 12 10 18 11 4
Yes, I have taken an early withdrawal and cashed out a portion or all of a 401(k) or similar plan balance after my separation of employment from a prior employer and incurred taxes and penalties
9 6 13 9 4
Yes, I have taken an early withdrawal and cashed out a portion or all of an IRA and incurred taxes and penalties
6 6 8 5 4
No, I have never taken a loan or early withdrawal from a 401(k) or similar plan or IRA 61 59 50 61 79
Not sure 6 11 6 6 4

BASE: 21ST ANNUAL SURVEY - THOSE WHO HAVE TAKEN A LOAN (Total N=848, Gen Z N=64; Millennials N=451; Gen X N=278; Baby Boomers N=55)Q659. For what purpose(s) did you take out a loan(s)? Select all. 71
Reasons for Taking Loan From Retirement Plan (%) All Workers Gen Z Millennials Gen X Baby Boomers
NET- Paying Off Debt 41 31 44 40 38
Pay off credit card debt 32 19 35 32 31
Pay off other debt 19 16 21 19 14
A financial emergency 32 14 35 35 16
Home improvements 30 15 33 33 10
Medical bills 26 26 32 20 6
Purchase of a vehicle 23 21 25 24 14
Purchase of primary residence 23 21 25 24 9
Every day expenses 23 29 28 16 12
Unplanned major expenses (e.g., home or car repair, etc.) 19 11 20 20 16
College tuition 18 41 19 12 7
Burial or funeral expense 16 13 19 14 4
Avoid eviction 14 9 17 13 5
Some other purpose 1 0 <1 2 9
Paying Off Debt Tops the List of Reasons for Taking 401(k) Loans
Among those who have taken a loan from their 401(k) or similar plan, the most frequently cited reason for
doing so is to pay off debt (41 percent), including credit card debt (32 percent) and/or other debt (19 percent).
Other reasons include a financial emergency (32 percent), home improvements (30 percent), and medical bills
(26 percent). Millennials (44 percent), Generation X (40 percent), and Baby Boomers (38 percent) are slightly
more likely to cite paying off debt than Generation Z (31 percent).
Note: Percentages reported for Generation Z and Baby Boomers should be considered directional due to a small sample base.

BASE: 21ST ANNUAL SURVEY - THOSE WHO HAVE TAKEN A HARDSHIP WITHDRAWAL(Total N=403, Gen Z N=26; Millennials N=223; Gen X N=125; Baby Boomers N=27)Q1465. What is the primary reason you have taken a hardship withdrawal from your employee-funded retirement savings plan? 72
Primary Reason for Hardship Withdrawal (%) All Workers
Pay for certain medical expenses for you, your spouse, children, dependents, or primary beneficiaries under the plan 21
Payment of tuition and related educational fees for the next 12 months of post-secondary education for you, your spouse, children, dependents, or primary beneficiaries under the plan
18
Expenses and losses (including loss of income) incurred due to a disaster located in a federally declared disaster area that included your principal residence or principal place of employment
15
Payments to prevent your eviction from your principal residence 12
Expenses for repairs of damage to your principal residence that would qualify for the casualty deduction under the Internal Revenue Code
11
Cover the costs related to the purchase of a principal residence 10
Burial or funeral expenses for your spouse, children, dependents, or primary beneficiaries under the plan 6
Other 7
Reasons for Hardship Withdrawals from 401(k)s
Among those who have taken a hardship withdrawal from a 401(k) or similar plan, the most often cited
reasons for doing so are paying for certain medical expenses (21 percent), paying for tuition and related
educational fees (18 percent), expenses and losses incurred due to a disaster in a federally declared disaster
area (15 percent), and payments to prevent eviction from principal residence (12 percent).
Note: Sample sizes by generation are too small to report for this survey question.

Relatively Few Workers Have Set Forth Legal Documentation
When asked about the types of financial and medical-related legal documents they have set forth, workers
most frequently cite a last will and testament (27 percent), a medical power of attorney or proxy (22 percent),
and a power of attorney for finances (22 percent). Fewer than one in five workers have an advance directive or
living will (18 percent), a trust (16 percent), funeral and burial arrangements (14 percent), and HIPAA waiver
(13 percent). However, nearly half of workers (46 percent) do not have any legal documents in place.
73
27 22 22
18 16 14 13
<1
Last will and testament Medical power ofattorney or proxy
Power of attorney forfinances
Advance directive orliving will
A trust Funeral & burialarrangements
HIPAA waiver None
Note: Responses not shown for “Other” (All Workers: <1%).
BASE: 21ST ANNUAL SURVEY – ALL QUALIFIED RESPONDENTSQ1517. Which of the following legal documents have you set forth in writing? Select all.
Which of the following legal documents have you set forth in writing? Select all. (%)All Workers

Baby Boomers Are Generally More Likely to Have Legal Documents
Baby Boomers are generally more likely than younger generations to have set forth legal documents, such as a
last will and testament (46 percent), medical power of attorney or proxy (28 percent), power of attorney for
finances (25 percent), advance directive or living will (25 percent), and funeral and burial arrangements (19
percent). Of concern, many workers across generations do not have any legal documents in place.
74
15 14 11 12 13
10 9
55
20 21 22 16 18
13 13
45
27
20 20 17 17
13 12
50 46
28 25 25
13 19
16
39
Last will and testament Medical power ofattorney or proxy
Power of attorney forfinances
Advance directive orliving will
A trust Funeral & burialarrangements
HIPAA waiver None
Generation Z Millennials Generation X Baby Boomers
Note: Responses not shown for “Other” (Generation Z: 0%, Millennials: <1%, Generation X: <1%, Baby Boomers: 1%).
BASE: 21ST ANNUAL SURVEY – ALL QUALIFIED RESPONDENTSQ1517. Which of the following legal documents have you set forth in writing? Select all.
Which of the following legal documents have you set forth in writing? Select all. (%)By Generation

Visions and Expectations of Retirement
75
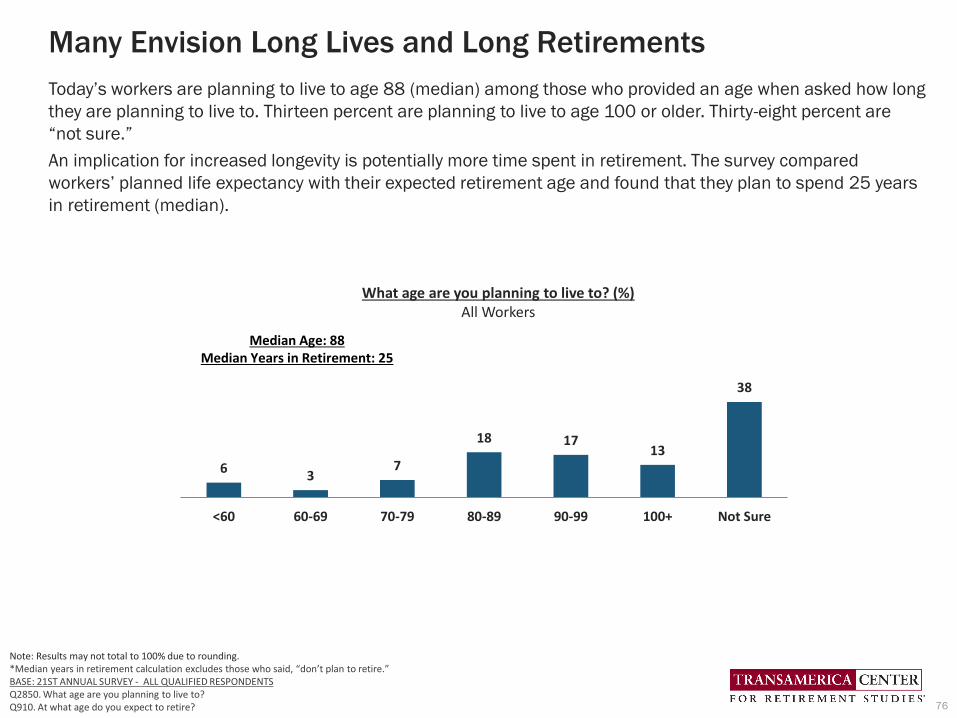
Many Envision Long Lives and Long Retirements
Today’s workers are planning to live to age 88 (median) among those who provided an age when asked how long
they are planning to live to. Thirteen percent are planning to live to age 100 or older. Thirty-eight percent are
“not sure.”
An implication for increased longevity is potentially more time spent in retirement. The survey compared
workers’ planned life expectancy with their expected retirement age and found that they plan to spend 25 years
in retirement (median).
76
Note: Results may not total to 100% due to rounding.*Median years in retirement calculation excludes those who said, “don’t plan to retire.”BASE: 21ST ANNUAL SURVEY - ALL QUALIFIED RESPONDENTSQ2850. What age are you planning to live to?Q910. At what age do you expect to retire?
63
7
18 1713
38
<60 60-69 70-79 80-89 90-99 100+ Not Sure
Median Age: 88Median Years in Retirement: 25
What age are you planning to live to? (%)All Workers

1 in 6 Generation Z and Millennials Plan to Be Centenarians
Generation Z and Millennial workers are planning to live longer than their older counterparts. One in six
Generation Z and Millennials (17 percent and 16 percent, respectively) are planning to live to age 100 or older,
compared with Generation X (10 percent) and Baby Boomers (9 percent). Generation Z and Millennial workers
also plan to spend more time in retirement (30 years and 27 years, respectively), which is somewhat longer than
Generation X (23 years) and Baby Boomers (22 years) (medians).
77
Note: Results may not total to 100% due to rounding.*Median years in retirement calculation excludes those who said, “don’t plan to retire.”BASE: 21ST ANNUAL SURVEY - ALL QUALIFIED RESPONDENTSQ2850. What age are you planning to live to?Q910. At what age do you expect to retire?
82
7
17 17 16
33
<60 60-69 70-79 80-89 90-99 100+ Not Sure
MillennialsMedian Age: 89
Median Years in Retirement: 27
6 3 617 17
10
40
<60 60-69 70-79 80-89 90-99 100+ Not Sure
Generation X
Median Age: 85Median Years in Retirement: 23
1 4 518 17
9
46
<60 60-69 70-79 80-89 90-99 100+ Not Sure
Baby Boomers
Median Age: 87Median Years in Retirement: 22
5 27
19 20 17
29
<60 60-69 70-79 80-89 90-99 100+ Not Sure
Generation ZMedian Age: 90
Median Years in Retirement: 30
What age are you planning to live to? (%)By Generation

Most Cite Positive Word Associations With “Retirement”
Eighty-six percent of workers cite positive word associations with “retirement” compared with only 44 percent who
cite negative words. Workers’ top three positive word associations are “freedom” (53 percent), “enjoyment” (49
percent), and “stress-free” (37 percent), while the top three negative word associations are “health decline” (19
percent), “financial insecurity” (18 percent), and “boredom” (18 percent).
78
53 49
37 34
28
21 19 18 18
12 11
5
Freedom Enjoyment Stress-free Fulfillment Opportunity Personalgrowth
Health decline Financialinsecurity
Boredom Isolation Dependent onothers
Unimportant
Note: Responses not shown for “Other” (All Workers: 1%).
BASE: 21ST ANNUAL SURVEY - ALL QUALIFIED RESPONDENTSQ5000. Which of the following do you personally associate with the word “retirement”? Select all.
Which of the following do you personally associate with the word “retirement”?All Workers (%)
Positive (NET = 86%)
Negative (NET = 44%)

All Four Generations Cite Positive Word Associations
More than eight in 10 workers across generations cite one or more positive word associations with
“retirement.” Workers from the four generations share the most often cited positive words: “freedom,”
“enjoyment,” and “stress-free.” However, Generation Z and Millennial workers (53 percent and 48 percent,
respectively) are more likely to cite one or more negative word associations, compared with Generation X
(41 percent) and Baby Boomers (34 percent).
79
NETPositive
(%)
NETNegative
(%)
Freedom
(%)
Enjoyment
(%)
Stress-free
(%)
Fulfillment
(%)
Opportunity
(%)
Personal growth
(%)
Health decline
(%)
Financial insecurity
(%)
Boredom
(%)
Isolation
(%)
Dependenton others
(%)
Unimportant
(%)
89
48 50 48 38 37 30 24 21 19 19 13 13 6
Bab
y B
oo
me
rsG
en
XM
ille
nn
ials
Note: Responses not shown for “Other” (Generation Z: 1%, Millennials: 1%, Generation X: 1%, Baby Boomers: 1%).
BASE: 21ST ANNUAL SURVEY - ALL QUALIFIED RESPONDENTSQ5000. Which of the following do you personally associate with the word “retirement”? Select all.
84
41 54 47
35 31 28 20 18 20 15 9 10 5
84
34
60 56 34 32 26
17 14 16 15 9 7 4
85
53 55 44 48
31 25 26 26 14
25 20 14 4
Ge
n Z

Workers Are Dreaming of an Active Retirement
Traveling (65 percent) is workers’ most frequently cited retirement dream, followed by spending more time with
family and friends (59 percent), and pursuing hobbies (51 percent). A noteworthy 38 percent of workers dream
of doing some form of paid work in retirement, such as starting a business (20 percent), pursuing an encore
career (17 percent), and/or continuing to work in the same field (14 percent). More than one in four workers
(26 percent) dream of doing volunteer work in retirement.
80
65
59
51
26
21 20 17
14
5
Traveling Spending moretime with
family & friends
Pursuinghobbies
Doingvolunteer work
Taking care of mygrandchildren
Starting abusiness
Pursuing anencore career
(new role, work,activity, or career)
Continuingto work in
the same field
I don't haveany retirement
dreams.
How do you dream of spending your retirement? (%)All Workers
Note: Responses not shown for “Other” (All Workers: 1%).
BASE: 21ST ANNUAL SURVEY - ALL QUALIFIED RESPONDENTSQ1418. How do you dream of spending your retirement? Select all.
NET – Working38%

Workers Across Generations Share Similar Retirement Dreams
81
Note: Responses not shown for “Other” (Generation Z: <1%, Millennials: <1%, Generation X: <1%, Baby Boomers: 2%).
BASE: 21ST ANNUAL SURVEY - ALL QUALIFIED RESPONDENTSQ1418. How do you dream of spending your retirement? Select all.
63
53 53
20 21 22
12 9
7
6562
55
2724
30
20 20
3
67
61
49
27
2119
17
12
5
63
56
45
26
15
3
10 119
Traveling Spending moretime with
family & friends
Pursuinghobbies
Doingvolunteer work
Taking careof my
grandchildren
Starting abusiness
Pursuing anencore career
(new role, work,activity, or career)
Continuingto work in
the same field
I don't haveany retirement
dreams.
How do you dream of spending your retirement? (%)By Generation
Workers’ top three retirement dreams — traveling, spending more time with family and friends, and pursuing
hobbies — are shared across generations. However, some dreams differ. Almost half of Millennials (49 percent)
dream of doing some form of paid work in retirement (i.e., starting a business, pursuing an encore career,
continue working in the same field), compared with significantly fewer Generation Z (37 percent), Generation X
(36 percent), and Baby Boomers (21 percent).
NET – Working
Generation Z: 37%Millennials: 49%Generation X: 36%Baby Boomers: 21%

Retirement Fears Range from Financial to Health-Related
The most frequently cited retirement fears are outliving savings and investments (42 percent), declining
health that requires long-term care (39 percent), a reduction in or elimination of Social Security in the future
(38 percent), and possible long-term care costs (34 percent).
Almost one in three workers fear cognitive decline/dementia/Alzheimer’s Disease (32 percent) and not being
able to meet the basic financial needs of their family (32 percent). Other fears include losing independence
(29 percent), lack of access to adequate and affordable healthcare (29 percent), feeling isolated and alone
(27 percent), affordable housing (22 percent), and finding meaningful ways to spend time and stay involved
(21 percent).
82
42 39 38
34 32 32
29 29 27
22 21
17
9
Outliving mysavings andinvestments
Declininghealth that
requireslong-term
care
SocialSecuritywill be
reduced orcease to existin the future
Possiblelong-termcare costs
Cognitivedecline,
dementia,Alzheimer's
Disease
Not beingable to
meet thebasic financial
needs ofmy family
Losing myindependence
Lack of accessto adequate
and affordablehealthcare
Feeling isolatedand alone
Affordablehousing
Findingmeaningful
ways to spendtime & stay
involved
Being laid offnot being
able to retireon my own
terms
I don't have anyretirement
fears
What are your greatest fears about retirement? (%)All Workers
Note: Responses not shown for “Other” (All Workers: <1%).
BASE: 21ST ANNUAL SURVEY - ALL QUALIFIED RESPONDENTSQ1422. What are your greatest fears about retirement? Select all.

Retirement Fears Vary Across Generations
83
41
38
28
31
38
44
35
25
38
27
19 20
6
37 3735
33 3234
30 30 31
24 23 24
8
46
39
42
32
29
33
28
32
24 23
19
15
9
46 46
42
39
36
21
2725
1715
21
7
10
Outliving mysavings andinvestments
Declininghealth that
requireslong-term
care
SocialSecuritywill be
reduced orcease to existin the future
Possiblelong-termcare costs
Cognitivedecline,
dementia,Alzheimer's
Disease
Not beingable to
meet thebasic financial
needs ofmy family
Losing myindependence
Lack of accessto adequate
and affordablehealthcare
Feelingisolated
and alone
Affordablehousing
Findingmeaningful
ways to spendtime & stay
involved
Being laid off -not being
able to retireon my own
terms
I don't haveany retirement
fears
What are your greatest fears about retirement? (%)By Generation
Generation Z Millennials Generation X Baby Boomers
Workers’ retirement fears range from financial to health-related but vary by generation. While workers
across generations fear outliving their savings and investments to a greater or lesser extent, Baby Boomers
(46 percent) are somewhat more likely than younger generations to fear declining health that requires
long-term care. Baby Boomers and Generation X are more likely to fear reductions in or elimination of
Social Security in the future (both 42 percent). Millennials and Generation Z are more likely to fear feeling
isolated and alone (31 percent and 38 percent, respectively). Generation Z (44 percent) is significantly
more likely to fear they will be unable to meet the basic needs of their families.
Note: Responses not shown for “Other” (Generation Z: 0%, Millennials: <1%, Generation X: <1%, Baby Boomers: <1%).
BASE: 21ST ANNUAL SURVEY - ALL QUALIFIED RESPONDENTSQ1422. What are your greatest fears about retirement? Select all.
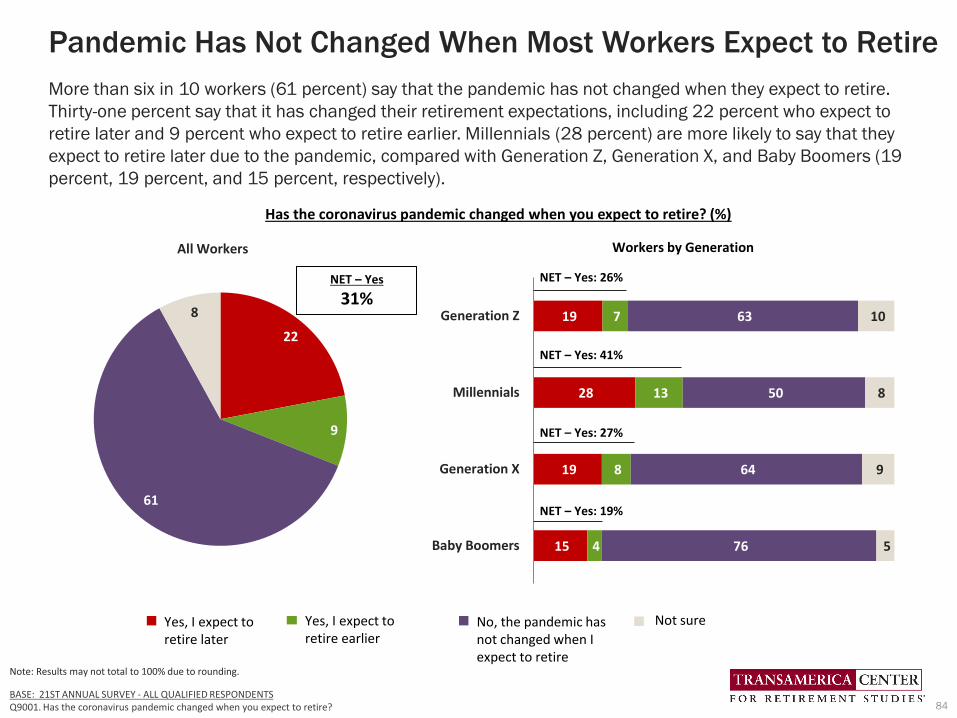
Pandemic Has Not Changed When Most Workers Expect to Retire
More than six in 10 workers (61 percent) say that the pandemic has not changed when they expect to retire.
Thirty-one percent say that it has changed their retirement expectations, including 22 percent who expect to
retire later and 9 percent who expect to retire earlier. Millennials (28 percent) are more likely to say that they
expect to retire later due to the pandemic, compared with Generation Z, Generation X, and Baby Boomers (19
percent, 19 percent, and 15 percent, respectively).
84BASE: 21ST ANNUAL SURVEY - ALL QUALIFIED RESPONDENTSQ9001. Has the coronavirus pandemic changed when you expect to retire?
Has the coronavirus pandemic changed when you expect to retire? (%)
19
28
19
15
7
13
8
4
63
50
64
76
10
8
9
5
Generation Z
Millennials
Generation X
Baby Boomers
NET – Yes: 41%
NET – Yes: 27%
NET – Yes: 19%
Yes, I expect to retire later
Yes, I expect to retire earlier
No, the pandemic has not changed when I expect to retire
Not sure
NET – Yes: 26%
22
9
61
8
All Workers Workers by Generation
NET – Yes
31%
Note: Results may not total to 100% due to rounding.

Almost Half of Workers Expect to Work Past Age 65
Forty-nine percent of workers expect to work past age 65 or do not plan to retire. Expectations of doing so
increase with age. More than seven in 10 Baby Boomers (72 percent) either expect to or are already working past
age 65 or do not plan to retire, compared with 51 percent of Generation X, 37 percent of Millennials, and 36
percent of Generation Z. In contrast, approximately four in 10 Generation Z and Millennials (40 percent and 39
percent, respectively) plan to retire before age 65. Approximately one in eight workers across generations do not
plan to retire.
85BASE: 21ST ANNUAL SURVEY - ALL QUALIFIED RESPONDENTSQ910. At what age do you expect to retire?
At what age do you expect to retire? (%)
Before Age 65 At Age 65 After Age 65 Do Not Plan to Retire
NET – After Age 65 or Do Not Plan to Retire
All Workers 49%
Generation Z 36%
Millennials 37%
Generation X51%
Baby Boomers 72%
29
40
39
24
13
23
24
25
26
15
36
23
26
38
58
13
13
11
13
14
Note: Some responses do not add up to 100% due to rounding.

More Than Half of Workers Plan to Work in Retirement
Fifty-seven percent of workers plan to work after they retire, including 37 percent who plan to work part-time
and 20 percent full-time. Just 27 percent do not plan to work after they retire, and 17 percent are not sure.
Generation X and Millennials (61 percent and 59 percent, respectively) are more likely to be planning to work
in retirement than Baby Boomers and Generation Z (both 47 percent).
86BASE: 21ST ANNUAL SURVEY - ALL QUALIFIED RESPONDENTSQ1525. Do you plan to work after you retire?
20
37
27
17
Do you plan to work after you retire? (%)
All Workers
NET – Plan to Work
57%
Yes, I plan to work full time
Yes, I plan to work part time
No, I do not plan to work
Not sure
Workers by Generation
12
26
21
8
35
33
40
39
30
27
22
32
23
14
17
20
Generation Z
Millennials
Generation X
Baby Boomers
NET Plan to Work: 59%
NET Plan to Work: 61%
NET Plan to Work: 47%
NET Plan to Work: 47%
Note: Some responses do not add up to 100% due to rounding.
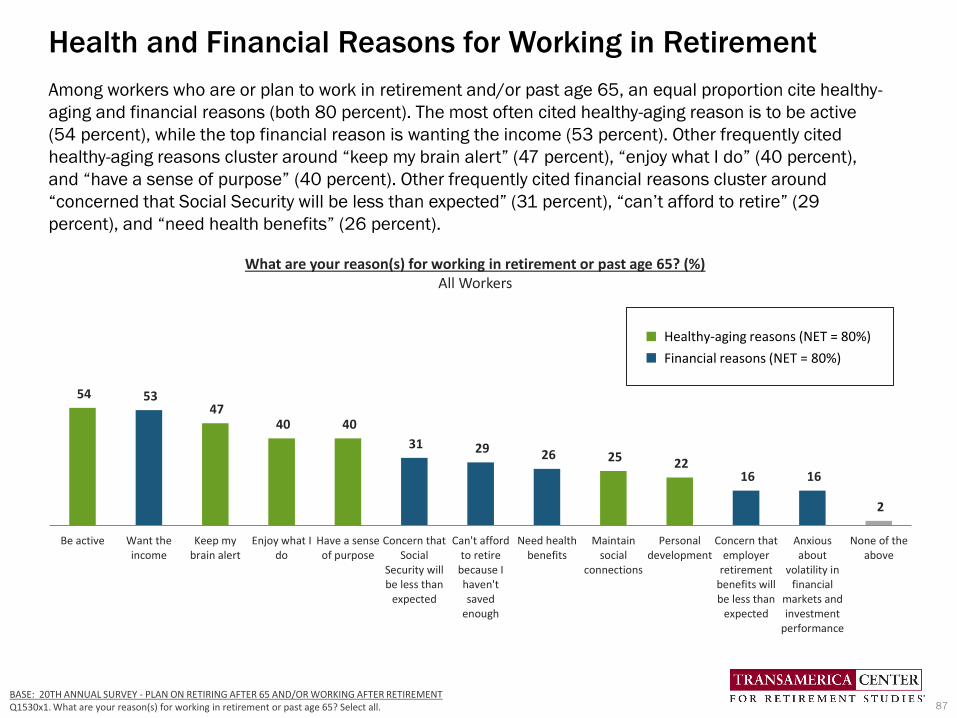
Health and Financial Reasons for Working in Retirement
Among workers who are or plan to work in retirement and/or past age 65, an equal proportion cite healthy-
aging and financial reasons (both 80 percent). The most often cited healthy-aging reason is to be active
(54 percent), while the top financial reason is wanting the income (53 percent). Other frequently cited
healthy-aging reasons cluster around “keep my brain alert” (47 percent), “enjoy what I do” (40 percent),
and “have a sense of purpose” (40 percent). Other frequently cited financial reasons cluster around
“concerned that Social Security will be less than expected” (31 percent), “can’t afford to retire” (29
percent), and “need health benefits” (26 percent).
87
54 53 47
40 40
31 29 26 25 22 16 16
2
Be active Want theincome
Keep mybrain alert
Enjoy what Ido
Have a senseof purpose
Concern thatSocial
Security willbe less than
expected
Can't affordto retire
because Ihaven'tsaved
enough
Need healthbenefits
Maintainsocial
connections
Personaldevelopment
Concern thatemployer
retirementbenefits willbe less than
expected
Anxiousabout
volatility infinancial
markets andinvestment
performance
None of theabove
BASE: 20TH ANNUAL SURVEY - PLAN ON RETIRING AFTER 65 AND/OR WORKING AFTER RETIREMENTQ1530x1. What are your reason(s) for working in retirement or past age 65? Select all.
What are your reason(s) for working in retirement or past age 65? (%)All Workers
Healthy-aging reasons (NET = 80%)
Financial reasons (NET = 80%)

Generations Share Common Reasons for Working in Retirement
Workers across generations similarly share financial and healthy aging-related reasons for working past age 65
and/or in retirement with some differences. Baby Boomers (67 percent) are somewhat more likely than other
generations to indicate they want the income. Generation X and Baby Boomers (36 percent and 34 percent,
respectively) are somewhat more likely to be concerned that Social Security benefits will be less than expected.
Millennials and Generation Z (28 percent and 24 percent, respectively) are somewhat more likely to cite
personal development as a reason.
88BASE: 21ST ANNUAL SURVEY - PLAN ON RETIRING AFTER 65 AND/OR WORKING AFTER RETIREMENTQ1530x1. What are your reason(s) for working in retirement or past age 65? Select all.
NET
Financial Reasons
(%)
NET
Healthy-aging Reasons
(%)
Be active
(%)
Want the income
(%)
Keep mybrain alert
(%)
Enjoy what
I do
(%)
Have a sense of purpose
(%)
Concern that Social Security
will be less than expected
(%)
Can’t afford to retire because
I haven’t saved
enough
(%)
Need health benefits
(%)
Maintain social
connections
(%)
Personal development
(%)
Concernemployer
retirement benefits will be less than expected (%)
Anxious re: volatility in
financial markets and investment
performance (%)
80 84
51 45 44 41 39 29 27 25 27 28 20 20
79 79
54 50 48 35 39 36 32 31 23 20 19 14
82 74 55
67 48 43 41 34 29 24 24
14 9 12
Bab
y B
oo
me
rsG
en
XM
ille
nn
ials
Ge
n Z
84 81 60 59
47 41 40 22 22 23 28 24
10 16
Note: Chart excludes “none of the above” responses which were 4 percent or less across generations.

Proactive Steps Taken to Help Ensure Continued Work
Workers must be healthy enough and have access to employment opportunities to be able to work as long as
they want and need. While more than eight in 10 workers have taken one or more proactive steps to continue
working (84 percent), only 57 percent are staying healthy, 50 percent are keeping their job skills up to date, 29
percent are networking and meeting new people, and 26 percent are taking classes to learn new skills.
Approximately one in five workers are scoping out the employment market (20 percent) or obtaining a new
degree, certification, or professional designation (18 percent). Sixteen percent have not taken any steps.
89BASE: 21ST ANNUAL SURVEY - ALL QUALIFIED RESPONDENTSQ1531. Which of the following steps, if any, have you taken to help ensure that you’ll be able to work as long as you want and need? Select all.
57 50
29 26
20 18 17
2
16
Staying healthy so Ican continue
working
Keeping my jobskills up to date
Networking andmeeting new
people
Taking classes tolearn new skills
Scoping out theemploymentmarket and
opportunitiesavailable
Obtaining a newdegree,
certification, orprofessionaldesignation
Attending virtualconferences and
webinars
Other I have not taken any steps to ensure I’ll be able to work as long as I want
and need
NET – Taken One or More Steps to Continue Working: 84%
Which of the following steps, if any, have you taken to help ensure that you’ll be able to work as long as you want and need? (%)

Generation Z Millennials Generation X Baby Boomers
NET – Taken One or More Steps to Continue Working
Staying healthy so I can continue working
Keeping my job skills up to date
Networking and meeting new people
Taking classes to learn new skills
Scoping out the employment market and opportunities available
Obtaining a new degree, certification, or professional designation
Attending virtual conferences and webinars
Other
I have not taken any steps to ensure I’ll be able to work as long as I want and need
90
57
54
35
33
24
28
13
3
10
Workers Across Generations Can Take More Proactive Steps
Workers across generations have an opportunity to take more proactive steps to help ensure they can continue
to work as long as they want and need. While it is encouraging that Generation Z and Millennials (90 percent
and 89 percent, respectively) have taken one or more steps, relatively few are staying healthy so they can
continue working (57 percent and 52 percent, respectively) or keeping their job skills up to date (both 54
percent), which are key ingredients for achieving success. Because retirement is becoming closer on the
horizon, and many may be facing savings shortfalls that necessitate continued work, it is concerning that 26
percent of Baby Boomers and 18 percent of Generation X have not taken any steps.
90BASE: 21ST ANNUAL SURVEY - ALL QUALIFIED RESPONDENTSQ1531. Which of the following steps, if any, have you taken to help ensure that you’ll be able to work as long as you want and need? Select all.
Have you taken any steps to ensure that you’ll be able to continue working as long as you want and need? (%)
82
59
49
29
22
18
14
18
2
18
74
62
42
14
9
9
4
6
2
26
89
52
54
37
36
27
27
22
2
11

Are Today’s Employers Age Friendly?
Almost seven in 10 workers (67 percent) consider their employers to be “age friendly” by offering
opportunities, work arrangements, and training and tools needed for employees of all ages to be successful
in their current role or contribution to the company. Sixteen percent of workers say their employers are not
age friendly and 17 percent are “not sure.” Millennial workers are somewhat more likely to characterize their
employers as age friendly (72 percent) than Generation Z (66 percent), Generation X (65 percent), and Baby
Boomers (60 percent).
91
Do you consider your employer to be “age friendly”? (%)
67
16
17
All Workers
Yes No Not Sure
66
72
65
60
17
15
17
18
16
13
18
22
Generation Z
Millennials
Generation X
Baby Boomers
BASE: 20TH ANNUAL SURVEY - ALL QUALIFIED RESPONDENTSQ2745. Do you consider your employer to be “age friendly” (for example offering opportunities, work arrangements, and training and tools needed for employees of all ages to be successful in their current role or contribution to the company)?
Workers by Generation
Note: Results may not total 100% due to rounding.
Retirement Savings, Planning, and Preparations
92

Retirement Confidence Has Stayed the Same For Most Workers
Almost two-thirds of workers (64 percent) indicate their confidence in their ability to retire comfortably has
stayed the same in light of the pandemic. Sixteen percent of workers indicate their confidence has declined,
while 11 percent say it has improved. Across generations, Baby Boomers (76 percent) are more likely than
Generation Z, Generation X, and Millennials (64 percent, 62 percent, and 60 percent, respectively) to indicate
their retirement confidence has stayed the same.
16
64
11
9
All Workers
BASE: 21ST ANNUAL SURVEY - ALL QUALIFIED RESPONDENTSQ8810. How has your confidence in your ability to retire comfortably changed in light of the coronavirus pandemic?
12
17
16
16
64
60
62
76
10
16
10
2
14
8
11
7
Generation Z
Millennials
Generation X
Baby Boomers
Declined Stayed the same Improved Don’t know/Not sure
How has your confidence in your ability to retire comfortably changed in light of the coronavirus pandemic? (%)
93
Workers by Generation
Note: Results may not total 100% due to rounding.

Almost 3 in 4 Workers Are Confident About Retirement
Seventy-three percent of workers are confident that they will be able to fully retire with a comfortable lifestyle,
including 24 percent who are “very” confident and 49 percent who are “somewhat” confident. While confidence
is similar across generations, Millennials (30 percent) are more likely to be “very” confident than Baby Boomers
(21 percent), Generation X (19 percent), and Generation Z (16 percent).
94BASE: 21ST ANNUAL SURVEY - ALL QUALIFIED RESPONDENTSQ880. How confident are you that you will be able to fully retire with a lifestyle you consider comfortable?
How confident are you that you will be able to fully retire with a lifestyle you consider comfortable? (%)
16
30
19
21
56
46
49
53
22
18
20
15
7
6
11
11
Generation Z
Millennials
Generation X
Baby Boomers
NET – Confident: 76%
NET – Confident: 68%
NET – Confident: 74%
Very Confident Somewhat Confident Not Too Confident Not At All Confident
NET – Confident: 72%
24
49
18
9
All Workers Workers by Generation
NET – Confident
73%
Note: Results may not total 100% due to rounding.

Almost 7 in 10 Think They Are Building a Large Enough Nest Egg
Sixty-eight percent of workers agree that they are currently building a large enough retirement nest egg,
including 30 percent who “strongly agree” and 38 percent who “somewhat agree.” Millennials (35 percent) are
more likely to “strongly agree” than Baby Boomers, Generation X, and Generation Z (28 percent, 27 percent,
and 19 percent, respectively).
BASE: 21ST ANNUAL SURVEY - ALL QUALIFIED RESPONDENTSQ800. How much do you agree or disagree that you are currently building a large enough retirement nest egg (i.e., total retirement savings)?
Strongly Agree Somewhat Agree Somewhat Disagree Strongly Disagree Not Sure
95
Building a Large Enough Retirement Nest Egg (%)NET – Agree
All Workers68%
Generation Z 64%
Millennials 73%
Generation X64%
Baby Boomers 65%
30
19
35
27
28
38
45
38
37
37
14
16
12
15
15
13
12
10
15
14
6
7
4
7
6
Note: Results may not total 100% due to rounding.

Workers Are Expecting Diverse Sources of Retirement Income
Eighty-two percent of workers expect self-funded savings to be sources of retirement income, including
401(k), 403(b), and IRAs (71 percent) and/or other savings and investments (48 percent). Two-thirds of
workers (66 percent) cite Social Security, while 26 percent cite company-funded pension plans as sources of
income. Almost four in 10 workers (37 percent) are expecting income from continued work. Fewer than one
in five workers are expecting retirement income from home equity (18 percent) or an inheritance (14
percent).
96BASE: 21ST ANNUAL SURVEY - ALL QUALIFIED RESPONDENTSQ1145. Which of the following do you expect to be sources of income to cover your living expenses after you retire? Select all.
71
48
66
37
26
18 14
2
401(k), 403(b), IRAs Other savings andinvestments
Social Security Working Company-fundedpension plan
Home equity Inheritance Other
NET – Self-Funded Savings: 82%
Which of the following do you expect to be sources of income to cover your living expenses after you retire? (%)All Workers

Sources of Retirement Income Vary Somewhat by Generation
Self-funded savings in retirement accounts (e.g., 401(k)s, 403(b)s, IRAs) and/or other savings and
investments are similarly cited as expected sources of retirement income by workers across generations.
However, the survey finds some noteworthy differences with other expected sources. Baby Boomers (87
percent) are more likely to expect Social Security to be a source of income than younger generations.
Millennials (40 percent) are somewhat more likely than other generations to cite retirement income from
working. In most cases, Generation Z is somewhat less likely to cite any of the potential sources of retirement
income, a finding that is not surprising given their younger age.
97BASE: 21ST ANNUAL SURVEY - ALL QUALIFIED RESPONDENTSQ1145. Which of the following do you expect to be sources of income to cover your living expenses after you retire? Select all.
64
46 48
35
16 13 11
3
71
44
56
40
26 20
16
2
71
48
69
37
26 19
14
2
74
57
87
33 29
14 10
2
401(k), 403(b),IRAs
Other savings andinvestments
Social Security Working Company-fundedpension plan
Home equity Inheritance Other
Which of the following do you expect to be sources of income to cover your living expenses after you retire? (%)By Generation
NET – Self-Funded Savings
Generation Z: 79%Millennials: 81%Generation X: 81%Baby Boomers: 84%

Baby Boomers (34 percent) are more likely to expect Social Security to be their primary source of income in
retirement, compared with Generation X (23 percent), Millennials (14 percent), and Generation Z (12 percent).
In contrast, Generation Z (62 percent), Millennials (58 percent) and Generation X (51 percent) are more likely
than Baby Boomers (43 percent) to cite self-funded savings, such as 401k(s), 403(b)s, IRAs and/or other
savings and investments. Thirteen percent of all workers expect their primary source of retirement income to
come from working, a finding that it is more often cited by Generation Z (17 percent), Millennials (16 percent),
and Generation X (13 percent), compared with Baby Boomers (7 percent). Note: 401(k)s did not become readily
available until the 1990s, a time at which Baby Boomers were already well into their careers and, therefore,
they have not had as much time to save in them.
98
1 in 3 Baby Boomers Expect to Rely on Social Security
41
46
48
39
31
12
16
10
12
12
21
12
14
23
34
13
17
16
13
7
7
3
5
9
11
2
2
3
2
1
2
2
2
1
2
1
2
1
1
1
All Workers
Generation Z
Millennials
Generation X
Baby Boomers
401(k), 403(b), andIRAs
Other savings andinvestments
Social Security
Working
Company-fundedpension plan
Home equity
Inheritance
Other
BASE: 21ST ANNUAL SURVEY - ALL QUALIFIED RESPONDENTSQ1150. Which one of the following do you expect to be your primary source of income to cover your living expenses after you retire?
NET – Self-Funded Savings: 43%
Expected Primary Source of Retirement Income (%)
NET – Self-Funded Savings: 51%
NET – Self-Funded Savings: 58%
NET – Self-Funded Savings: 62%
NET – Self-Funded Savings: 53%
Note: Results may not total 100% due to rounding.

Almost 3 in 4 Workers Are Concerned About Social Security
Seventy-three percent of workers agree with the statement, “I am concerned that when I am ready to retire,
Social Security will not be there for me,” including 32 percent who “strongly agree” and 41 percent who
“somewhat agree.” Generation X (77 percent), Millennials (77 percent), and Generation Z (70 percent) are
more likely to agree than Baby Boomers (60 percent). Millennials (38 percent) and Generation X (36 percent)
are more likely to “strongly agree” than Generation Z (22 percent) and Baby Boomers (19 percent).
99
BASE: 21ST ANNUAL SURVEY - ALL QUALIFIED RESPONDENTSQ930. How much do you agree or disagree with each of the following statements regarding retirement? “I am concerned that when I am ready to retire, Social Security will not be there for me.”
“I am concerned that when I am ready to retire, Social Security will not be there for me.” (%)
Strongly Agree Somewhat Agree Somewhat Disagree Strongly Disagree
NET – Agree
All Workers73%
Generation Z 70%
Millennials 77%
Generation X77%
Baby Boomers 60%
32
22
38
36
19
41
48
39
41
41
18
24
15
14
26
10
5
9
9
13
Note: Results may not total 100% due to rounding.

Workers Should Learn More About Social Security Benefits
A strong knowledge of government benefits is important for all future retirees and especially important for
workers nearing retirement. Only 25 percent of all workers know “a great deal” about Social Security
benefits-- and only 21 percent of age 50-plus workers know “a great deal” about them. Moreover, among
age 50-plus workers who expect to rely on Social Security as their primary source of income in retirement,
only 20 percent know a “great deal” about Social Security benefits.
100BASE: 21ST ANNUAL SURVEY - ALL QUALIFIED RESPONDENTSQ1540. How good of an understanding do you have of Social Security?
20
30
45
5
Age 50+ Workers Who Expect to Rely on Social Security
21
31
41
7
Age 50+ Workers
Level of Understanding re: Social Security Benefits (%)
A Great Deal Quite a Bit Some None
25
31
37
8
All Workers
Note: Results may not total 100% due to rounding.

More than 8 in 10 Workers Are Saving for Retirement
Eighty-two percent of workers are saving for retirement through employer-sponsored plans, such as a 401(k) or
similar plan, and/or outside the workplace. Baby Boomers (84 percent), Generation X (84 percent), and
Millennials (82 percent) are more likely than Generation Z (70 percent) to be saving. Among those saving for
retirement, Generation Z started saving at age 19, Millennials at age 25, Generation X at age 30, and Baby
Boomers at age 35 (medians).
101
82
70
82 84 84
All Workers Generation Z Millennials Generation X Baby Boomers
Workers Who Are Saving For Retirement Through an Employer-Sponsored Retirement Plan and/or Outside of Work (%)
Age Started Saving(Median)
27 years 19 years 25 years 30 years 35 years
BASE: 21ST ANNUAL SURVEY - CURRENTLY OFFERED QUALIFIED PLANQ1190. Do you currently participate in, or have money invested in your company’s employee-funded retirement savings plan?BASE: 21ST ANNUAL SURVEY - ALL QUALIFIED RESPONDENTSQ740. Are you currently saving for retirement outside of work, such as in an IRA, mutual funds, bank account, etc.?BASE: 21ST ANNUAL SURVEY - INVESTING FOR RETIREMENTQ790. At what age did you first start saving for retirement?

Yes68
No32
Saving for Retirement Outside of Work (%)All Workers
Almost 7 in 10 Are Saving for Retirement Outside of Work
Sixty-eight percent of workers are saving for retirement outside of work, such as in an IRA, mutual funds,
bank account, etc. Baby Boomers (71 percent), Generation X (71 percent), and Millennials (69 percent) are
more likely to be saving for retirement outside of work, compared with Generation Z (54 percent).
102BASE: 21ST ANNUAL SURVEY - ALL QUALIFIED RESPONDENTSQ740. Are you currently saving for retirement outside of work, such as in an IRA, mutual funds, bank account, etc. ?
Saving Outside for Retirement
of Work(Yes %)
Generation
Generation Z 54
Millennials 69
Generation X 71
Baby Boomers 71

Workers Have a Variety of Retirement Savings & Investments
Among workers who are saving for retirement outside of work, the most often cited types of savings and
investments they currently have specifically for retirement, are a bank account such as savings, checking, money
market, and CDs (66 percent), a 401(k) or similar plan (50 percent), and an individual retirement account (IRA)
(41 percent). Some workers cite saving for retirement via a brokerage account (38 percent), life insurance policy
(36 percent), and/or primary residence (27 percent). Fewer than one in five workers have a health savings
account (HAS) (16 percent), an annuity (16 percent), and/or real estate investments other than their primary
residence (15 percent).
103
66
50
41 38 36
27
16 16 15 11
1
Bank account(e.g., savings,
checking, moneymarket, CDs, etc.)
401(k), 403(b),457(b) or similar
plan
IRA Brokerage account(e.g., stocks,
bonds, mutualfunds, ETFs, etc.)
Life insurancepolicy
Primary residence HSA (healthsavings account)
Annuity Real estateinvestment other
than primaryresidence
Businessownership
I have no savingsand investments
Note: Reponses not shown for “Other investments” (All Workers: 1%)
BASE: 21ST ANNUAL SURVEY – THOSE WHO ARE SAVING OUTSIDE OF WORKQ750. What types of savings and investments do you currently have that are specifically for retirement? Select all.
What types of savings and investments do you currently have that are specifically for retirement? Select all. (%)All Workers

Types of Retirement Savings & Investments by Generation
104
62
39
26 22
27
14 9 7
17 16
2
58
49
36 34 34
22 2115 17 15
1
68
52
4238 40
27
16 14 1411
1
75
52 5248
3338
12
21
11
3<1
Bank account(e.g., savings,
checking, moneymarket, CDs, etc.)
401(k), 403(b),457(b) or similar
plan
IRA Brokerageaccount (e.g.,stocks, bonds,mutual funds,
ETFs, etc.)
Life insurancepolicy
Primary residence HSA (healthsavings account)
Annuity Real estateinvestment other
than primaryresidence
Businessownership
I have no savingsand investments
Generation Z Millennials Generation X Baby Boomers
Workers across generations who are saving for retirement outside of work most frequently utilize a bank
account, 401(k) or similar plan, and/or IRA to save and invest specifically for retirement. However, there are
noteworthy differences by generation. Generation X workers (40 percent) are somewhat more likely to cite a life
insurance policy. Baby Boomers (38 percent) are more likely to cite their primary residence. Millennials are
more likely to cite an HSA account. Generation Z workers who are saving for retirement outside of work report
lower use for most of these types of retirement savings and investments, a finding that is not surprising given
that they are just beginning to build their retirement nest eggs.
What types of savings and investments do you currently have that are specifically for retirement? Select all. (%)By Generation
Note: Responses not shown for “Other investments” (Generation Z: 2%, Millennials: <1%, Generation X: <1%, Baby Boomers: 1%).
BASE: 21ST ANNUAL SURVEY – THOSE WHO ARE SAVING OUTSIDE OF WORKQ750. What types of savings and investments do you currently have that are specifically for retirement? Select all.

Are Workers Adequately Saving for Retirement?
Total household retirement savings among all workers is $93,000 (estimated median). Baby Boomer workers
have the most retirement savings at $202,000, compared with Generation X ($107,000), Millennials
($68,000), and Generation Z ($26,000) (estimated medians). The proportion of workers having saved
$250,000 or more increases with age: 11 percent of Generation Z, 25 percent of Millennials, 32 percent of
Generation X, and 45 percent of Baby Boomers. In contrast, the proportion of workers who have saved less
than $25,000 directionally decreases with age: 37 percent of Generation Z, 27 percent of Millennials, 20
percent of Generation X, and 16 percent of Baby Boomers.
105BASE: 21ST ANNUAL SURVEY - ALL QUALIFIED RESPONDENTS. Q1300. Approximately how much money does your household have saved in all of your retirement accounts?
Not sure 7 19 6 5 6Decline to answer 4 1 3 4 8
Notes: 1) The median is estimated based on the approximate midpoint of the range of each response category. Non-responses are excluded from the estimate. 2) Results may not total 100% due to rounding.
7 10 8 7 6
611
74 4
5
8
54 2
6
8
75
4
7
10
8
84
10
12
13
9
6
18
11
19
20
14
30 1125
32
45
All Workers Generation Z Millennial Generation X Baby Boomer
$250k or more
$100k to less than $250k
$50k to less than $100k
$25k to less than $50k
$10k to less than $25k
$5k to less than $10k
$1 to less than $5k
None ($0)
2020 Total Household Retirement Savings (%)
Estimated Median $93,000 $26,000 $68,000 $107,000 $202,000

Almost Half Don’t Have Enough Income to Save for Retirement
Forty-eight percent of workers agree with the statement, “I don’t have enough income to save for
retirement,” including 20 percent who “strongly agree” and 28 percent who “somewhat agree.”
Generation Z (55 percent), Millennials (49 percent), and Generation X (48 percent) are more likely to
agree, compared with Baby Boomers (40 percent).
106
BASE: 21ST ANNUAL SURVEY - ALL QUALIFIED RESPONDENTSQ930. How much do you agree or disagree with each of the following statements regarding retirement? “I don’t have enough income to save for retirement.”
“I don’t have enough income to save for retirement.” (%)
Strongly Agree Somewhat Agree Somewhat Disagree Strongly Disagree
NET – Agree
All Workers48%
Generation Z 55%
Millennials 49%
Generation X 48%
Baby Boomers 40%
20
21
22
21
14
28
34
27
27
26
28
31
28
27
27
25
14
22
24
33
Note: Results may not total 100% due to rounding.

Fewer Than Half Are Aware of the Saver’s Credit (Tax Credit)
The Saver’s Credit is a tax credit for eligible taxpayers who save for retirement in a qualified retirement
plan, IRA, or ABLE account. Fewer than half of workers (48 percent) are aware of it. Millennials (63
percent) are most likely to be aware of the Saver’s Credit, compared with Generation Z (46 percent),
Generation X (46 percent), and Baby Boomers (26 percent).
107
48 46
63
46
26
All Workers Generation Z Millennials Generation X Baby Boomers
Awareness of the Saver’s Credit
Yes (%)
BASE: 20TH ANNUAL SURVEY - ALL QUALIFIED RESPONDENTSQ1120. Are you aware of a tax credit called the ’’Saver’s Credit,’’ which is available to individuals and households, who meet certain income requirements, for making contributions to an IRA or a company-sponsored retirement plan such as a 401(k) plan or 403(b) plan?

Debt Is Interfering With Ability to Save for Retirement
Forty-nine percent of workers agree with the statement, “Debt is interfering with my ability to save for
retirement,” including 20 percent who “strongly agree” and 29 percent who “somewhat agree.” Millennials (57
percent), Generation X (51 percent), and Generation Z (51 percent) are more likely to agree, compared with
Baby Boomers (32 percent). Of concern, 24 percent of Millennials, 22 percent of Generation X , and 19 percent
of Generation Z “strongly agree,” compared with 12 percent of Baby Boomers.
108
BASE: 21ST ANNUAL SURVEY - ALL QUALIFIED RESPONDENTSQ930. How much do you agree or disagree with each of the following statements regarding retirement? “Debt is interfering with my ability to save for retirement.”
“Debt is interfering with my ability to save for retirement.” (%)
Strongly Agree Somewhat Agree Somewhat Disagree Strongly Disagree
NET – Agree
All Workers49%
Generation Z 51%
Millennials 57%
Generation X 51%
Baby Boomers 32%
20
19
24
22
12
29
32
33
29
20
24
30
22
23
26
27
19
21
25
42
Note: Results may not total 100% due to rounding.

Workers Have a Limited Understanding of Asset Allocation Principles
Fewer than four in 10 workers (38 percent) have “a great deal” or “quite a bit” of understanding of asset
allocation principles as they relate to retirement investing, including 14 percent who know “a great deal” and
24 percent who know “quite a bit.” Millennials (19 percent) have “a great deal” of understanding, compared
with Generation X (13 percent), Generation Z (9 percent), and Baby Boomers (8 percent). A concerning one in
five workers (21 percent) have no understanding of asset allocation principles.
109BASE: 21ST ANNUAL SURVEY - ALL QUALIFIED RESPONDENTSQ760. How much of an understanding do you have regarding asset allocation principles as they relate to retirement investing?
How much of an understanding do you have regarding asset allocation principles as they relate to retirement investing? (%)
9
19
13
8
17
26
24
24
48
39
42
42
26
16
21
26
Generation Z
Millennials
Generation X
Baby Boomers
NET – A Great Deal/ Quite a Bit: 45%
NET – A Great Deal/ Quite a Bit: 37%
NET – A Great Deal/ Quite a Bit: 32%
A Great Deal Quite a Bit Some None
NET – A Great Deal/ Quite a Bit: 26%
14
24
41
21
All Workers Workers by GenerationNET – A Great
Deal/ Quite a Bit
38%
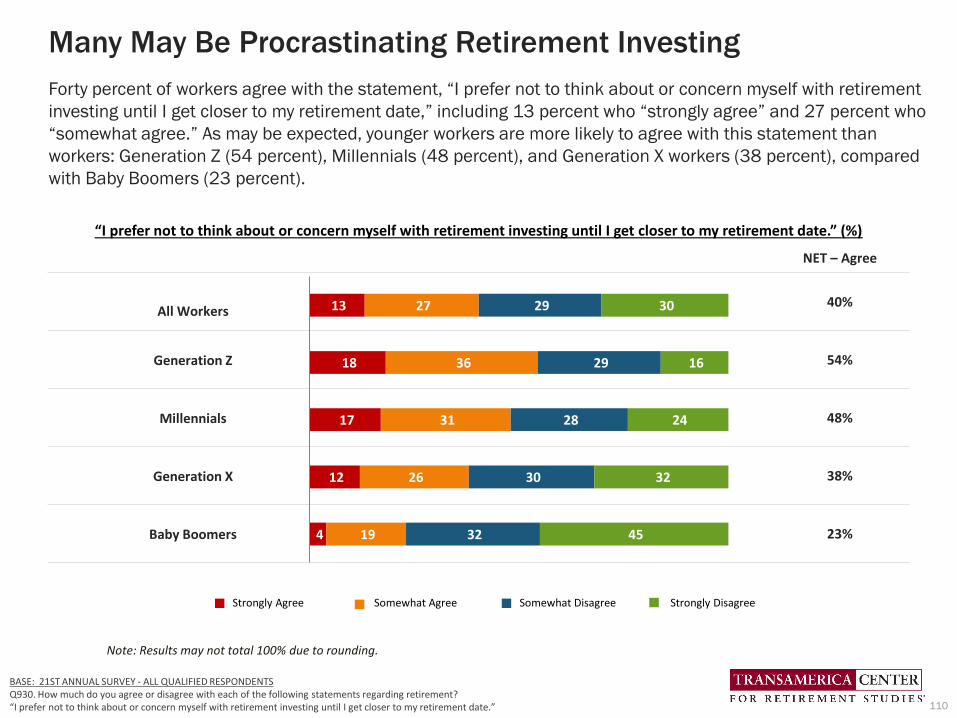
Many May Be Procrastinating Retirement Investing
Forty percent of workers agree with the statement, “I prefer not to think about or concern myself with retirement
investing until I get closer to my retirement date,” including 13 percent who “strongly agree” and 27 percent who
“somewhat agree.” As may be expected, younger workers are more likely to agree with this statement than
workers: Generation Z (54 percent), Millennials (48 percent), and Generation X workers (38 percent), compared
with Baby Boomers (23 percent).
110
BASE: 21ST ANNUAL SURVEY - ALL QUALIFIED RESPONDENTSQ930. How much do you agree or disagree with each of the following statements regarding retirement? “I prefer not to think about or concern myself with retirement investing until I get closer to my retirement date.”
“I prefer not to think about or concern myself with retirement investing until I get closer to my retirement date.” (%)
Strongly Agree Somewhat Agree Somewhat Disagree Strongly Disagree
NET – Agree
All Workers40%
Generation Z 54%
Millennials 48%
Generation X 38%
Baby Boomers 23%
13
18
17
12
4
27
36
31
26
19
29
29
28
30
32
30
16
24
32
45
Note: Results may not total 100% due to rounding.

Workers’ Estimated Retirement Savings Needs
Workers estimate they will need $500,000 (median) by the time they retire in order to feel financially
secure. This estimate is shared by Generation Z and Generation X. Baby Boomers estimate they will need
$750,000 and Millennials estimate they will need only $300,000 (medians). Almost one in five workers
(19 percent) estimate they will need to save $2,000,000 or more, including Generation Z (12 percent),
Millennials (18 percent), Generation X (22 percent), and Baby Boomers (19 percent).
111
BASE: 21ST ANNUAL SURVEY - ALL QUALIFIED RESPONDENTSQ890. Thinking in terms of what money can buy today, how much money do you believe you will need to have saved by the time you retire in order to feel financially secure?
Estimated RetirementSavings Needs
All Workers Generation Z Millennials Generation X Baby Boomers
Less than $100k 20% 27% 29% 15% 10%
$100k to less than $500k 24% 21% 26% 23% 23%
$500k to less than $1m 19% 25% 14% 19% 23%
$1m to less than $2m 18% 15% 13% 20% 24%
$2m or more 19% 12% 18% 22% 19%
Median $500,000 $500,000 $300,000 $500,000 $750,000
Note: Results may not total 100% due to rounding.

Many Workers Are Guessing Their Retirement Savings Needs
Among workers who provided an estimate of their retirement savings needs, 43 percent indicate they guessed on
what it should be. Thirty-eight percent based their estimate on their current living expenses. Only 25 percent used a
retirement calculator or completed a worksheet, with Millennials (29 percent) and Generation X (26 percent) being
somewhat more likely than Baby Boomers (20 percent) and Generation Z (14 percent) to have done so. Millennials
(19 percent) are more likely to have based their estimates on an amount given to them by a financial advisor,
compared with Generation X (14 percent), Baby Boomers (10 percent), and Generation Z (8 percent).
112
43
38
25
17
13
23
15
15
4
Basis of Estimating Retirement Savings Goal (%)All Workers 50
39 45 47
Generation Z Millennial Generation X Baby Boomer
Guessed Retirement Savings Needs (%)
1429 26 20
Generaton Z Millennial Generation X Baby Boomer
NET – Used a Retirement Calculator or Completed Worksheet (%)
BASE: 21ST ANNUAL SURVEY - PROVIDED ESTIMATE OF MONEY NEEDED FOR RETIREMENTQ900. How did you arrive at that number? Select all.
819 14 10
Generation Z Millennial Generation X Baby Boomer
Amount Given By a Financial Advisor (%)
Guessed
Estimated based on current living expenses
NET – Used a calculator or completed worksheet
Used a retirement calculator
Completed a worksheet
Expected earnings on investments
Read/heard that is how much is needed
Amount given to me by financial advisor
Other
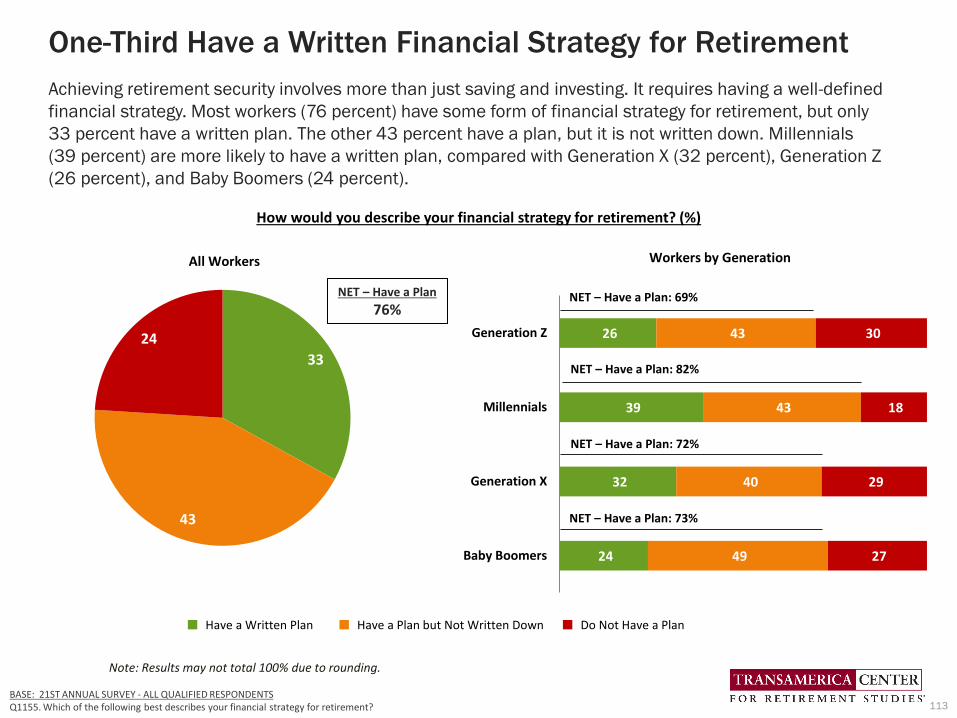
One-Third Have a Written Financial Strategy for Retirement
Achieving retirement security involves more than just saving and investing. It requires having a well-defined
financial strategy. Most workers (76 percent) have some form of financial strategy for retirement, but only
33 percent have a written plan. The other 43 percent have a plan, but it is not written down. Millennials
(39 percent) are more likely to have a written plan, compared with Generation X (32 percent), Generation Z
(26 percent), and Baby Boomers (24 percent).
113
26
39
32
24
43
43
40
49
30
18
29
27
Generation Z
Millennials
Generation X
Baby Boomers
Workers by Generation
33
43
24
How would you describe your financial strategy for retirement? (%)
All Workers
BASE: 21ST ANNUAL SURVEY - ALL QUALIFIED RESPONDENTSQ1155. Which of the following best describes your financial strategy for retirement?
Have a Written Plan Have a Plan but Not Written Down Do Not Have a Plan
NET – Have a Plan
76%
NET – Have a Plan: 73%
NET – Have a Plan: 72%
NET – Have a Plan: 82%
NET – Have a Plan: 69%
Note: Results may not total 100% due to rounding.
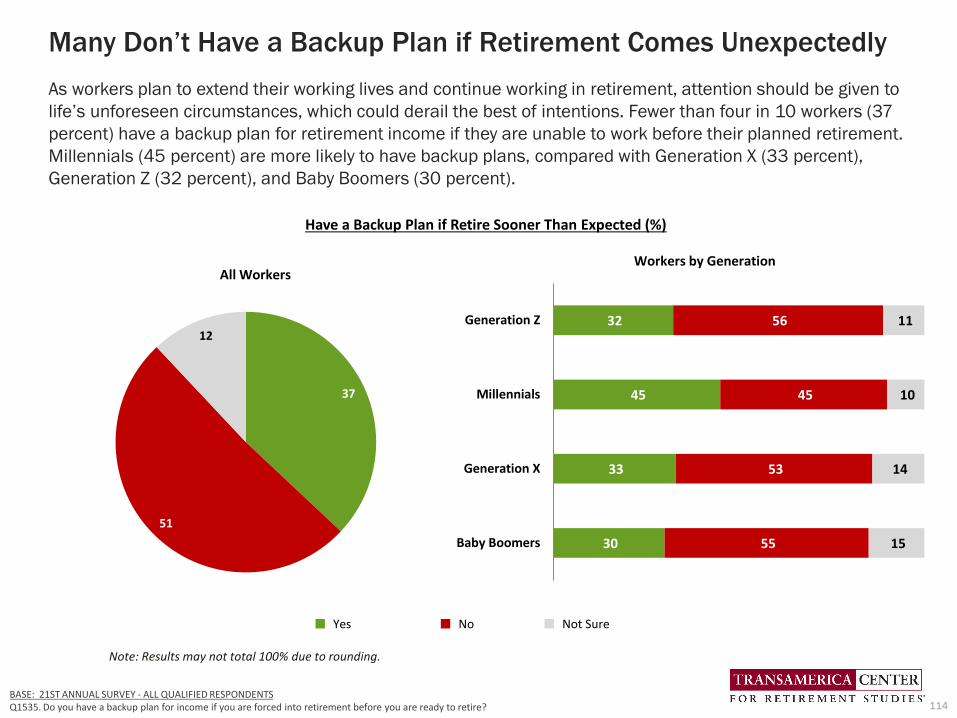
Many Don’t Have a Backup Plan if Retirement Comes Unexpectedly
As workers plan to extend their working lives and continue working in retirement, attention should be given to
life’s unforeseen circumstances, which could derail the best of intentions. Fewer than four in 10 workers (37
percent) have a backup plan for retirement income if they are unable to work before their planned retirement.
Millennials (45 percent) are more likely to have backup plans, compared with Generation X (33 percent),
Generation Z (32 percent), and Baby Boomers (30 percent).
114BASE: 21ST ANNUAL SURVEY - ALL QUALIFIED RESPONDENTSQ1535. Do you have a backup plan for income if you are forced into retirement before you are ready to retire?
Have a Backup Plan if Retire Sooner Than Expected (%)
37
51
12
All Workers
Yes No Not Sure
Workers by Generation
32
45
33
30
56
45
53
55
11
10
14
15
Generation Z
Millennials
Generation X
Baby Boomers
Note: Results may not total 100% due to rounding.

Less Than Half Are Very Familiar with Spouse’s/Partner’s Savings
Among workers who are married or living with a partner, 75 percent say they are familiar with their
spouse’s or partner’s savings, yet only 48 percent are “very familiar.” Millennials (79 percent) are
somewhat more likely to be familiar with their spouse’s or partner’s savings, compared with Generation X
(74 percent), Baby Boomers (70 percent), and Generation Z (66 percent).
115BASE: 21ST ANNUAL SURVEY - MARRIED OR LIVING WITH PARTNERQ1520. How familiar are you with your spouse’s or partner’s retirement plan and savings?
36
49
47
48
30
30
27
22
15
7
9
8
10
3
4
4
9
11
14
18
Generation Z
Millennials
Generation X
Baby Boomers
NET – Familiar: 66%
NET – Familiar: 79%
NET – Familiar: 74%
NET – Familiar: 70%
48
27
8
4
14
All Workers
NET – Familiar
75%
Level of Familiarity with Spouse's/Partner's Retirement Savings (%)
Workers by Generation
Very Familiar Somewhat Familiar Not Too Familiar Not At All Familiar My spouse/partner doesn’t have any retirement savings
Note: Results may not total 100% due to rounding.
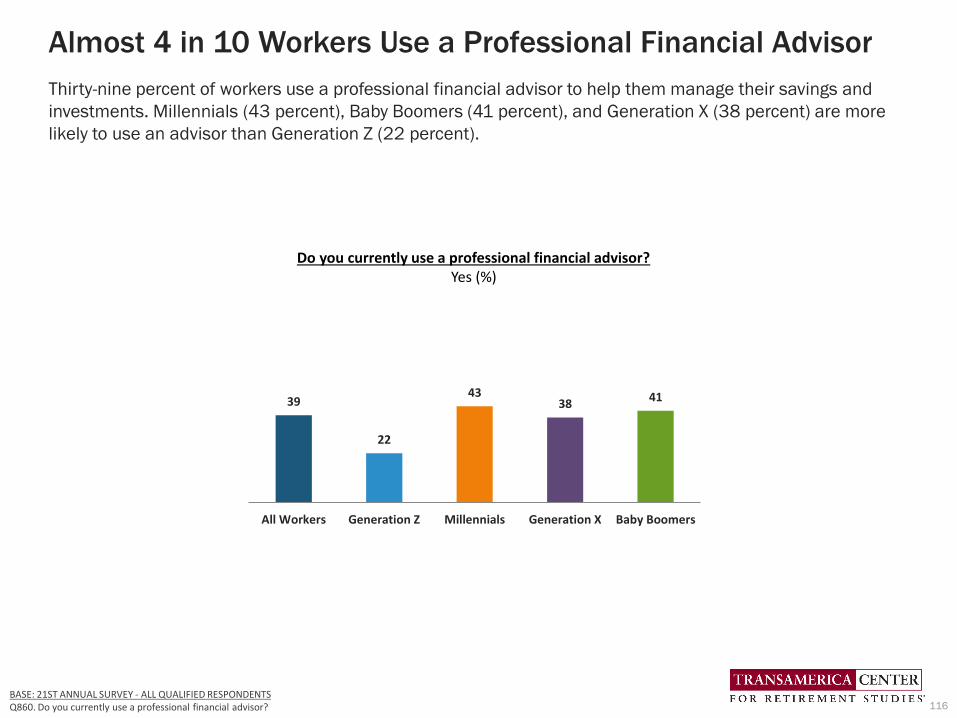
Almost 4 in 10 Workers Use a Professional Financial Advisor
Thirty-nine percent of workers use a professional financial advisor to help them manage their savings and
investments. Millennials (43 percent), Baby Boomers (41 percent), and Generation X (38 percent) are more
likely to use an advisor than Generation Z (22 percent).
116BASE: 21ST ANNUAL SURVEY - ALL QUALIFIED RESPONDENTSQ860. Do you currently use a professional financial advisor?
39
22
4338
41
All Workers Generation Z Millennials Generation X Baby Boomers
Do you currently use a professional financial advisor?Yes (%)

All Workers Generation Z* Millennials Generation X Baby Boomers
Make retirement investment recommendationssuch as mutual funds, annuities, stocks, bonds, etc.
Calculate retirement savings goal
General financial planning(e.g., college funding, cash flow analysis, budgeting, etc.)
Develop strategies for spending down savings to ensure they last my lifetime
Tax planning and preparation
Recommend retirement-related product needsincluding health, life, and long-term care insurance
Plan for health care expenses
Plan for possible assisted living and long-term care needs
Inheritance and estate planning
Handle day-to-day finances (e.g., pay bills)
Some other services
57
42
39
34
33
33
27
24
23
17
2
A Wide Variety of Services Are Performed by Financial Advisors
Among those who use a financial advisor, workers most frequently use them to make retirement investment
recommendations (57 percent), followed by calculating a retirement savings goal (42 percent) and general
financial planning (39 percent). Across generations, the use of financial advisor services varies. Baby Boomers
(75 percent) and Generation X (66 percent) are more likely to use their financial advisors for retirement
investment recommendations, compared with Millennials (45 percent) and Generation Z (29 percent).
117
*Note: Percentage reported for Generation Z should be considered directional due to a small sample base.
BASE: 21ST ANNUAL SURVEY - USE A FINANCIAL ADVISORQ870. What types of services do you use your professional financial advisor to perform? Select all.
What types of services do you use your professional financial advisor to perform? Select all. (%)
75
43
31
27
24
32
18
14
20
5
6
45
36
43
38
38
35
32
32
26
24
1
66
49
41
31
34
37
27
22
23
16
1
29
38
36
31
38
14
31
18
22
31
1

Frequency (or Infrequency) of Conversations About Retirement
Retirement is a family matter that calls for important conversations about plans, expectations, needs, and
vulnerabilities. Fewer than one in four workers (24 percent) frequently discuss saving, investing, and planning for
retirement with family and close friends, while 55 percent occasionally discuss it, and 22 percent never discuss
it. Baby Boomers (13 percent) are less likely to frequently discuss it, compared with Millennials (31 percent),
Generation Z (26 percent), and Generation X (22 percent).
118
How frequently do you discuss saving, investing, and planning for retirement with family and close friends? (%)
26
31
22
13
53
54
54
57
21
14
25
30
Generation Z
Millennials
Generation X
Baby Boomers
NET Discuss: 85%
NET Discuss: 76%
NET Discuss: 70%
Frequently Occasionally Never
BASE: 21ST ANNUAL SURVEY - ALL QUALIFIED RESPONDENTSQ1515. How frequently do you discuss saving, investing and planning for retirement with family and close friends?
NET Discuss: 79%
Workers by Generation
24
55
22
All Workers
NET – Discuss
79%
Note: Results may not total 100% due to rounding.

The Importance of Employer-Sponsored
Retirement Benefits
119

Workers Highly Value Retirement Benefits
Workers highly value retirement benefits. Ninety-one percent of workers value a 401(k) or similar retirement plan as
an important benefit, a finding which is similar across generations. More than four in five workers (84 percent) agree
that the next time they look for a job, all things being equal, the retirement benefits offered by the prospective
employer will be a major factor in their final decision to accept an offer or not. Generation X (87 percent) and
Millennials (86 percent) are more likely to agree that retirement benefits will be a major decision-making factor,
compared with Generation Z (78 percent) and Baby Boomers (76 percent).
120
BASE: 21ST ANNUAL SURVEY - ALL QUALIFIED RESPONDENTSQ1170. Please tell us how important that benefit is to you, personally. “A 401(k)/403(b)/457(b) or other employee self-funded plan.”Q831. How much do you agree or disagree with the following statement? “The next time I look for a job, all things being equal, the retirement benefits offered by the prospective employer will be a major factor in my final decision.”
84 78 86 8776
All Workers Gen Z Millennials Gen X Baby Boomers
Retirement benefits offered by a prospective employer will be a major factor in decision to accept
NET – Strongly/Somewhat Agree (%)91 90 93 91 87
All Workers Gen Z Millennials Gen X Baby Boomers
Importance of 401(k) or similar plan as a benefitNET – Very/Somewhat Important (%)

3 in 4 Workers Are Offered a 401(k) or Similar Plan
Seventy-five percent of workers have access to a 401(k) or similar employee-funded retirement plan in
the workplace. Millennials (79 percent), are somewhat more likely than Generation X (75 percent),
Generation Z (71 percent), and Baby Boomers (70 percent) to have access to an employee-funded plan.
Of great concern is that almost one in five workers (18 percent) are not offered any retirement benefits.
121
75
66
15
11
31
22
18
2
18
Retirement Benefits Offered by Employers (%)All Workers
71 79 75 70
Gen Z Millennial Gen X Baby Boomer
5867 67 65
Gen Z Millennial Gen X Baby Boomer
An Employee-Funded 401(k) Plan (%)
2213 19 24
Gen Z Millennial Gen X Baby Boomer
None. My employer doesn’t offer any retirement benefits. (%)
BASE: 21ST ANNUAL SURVEY - ALL QUALIFIED RESPONDENTSQ1180. Which of the following retirement benefits does your company currently offer to you, personally? Select all.
NET – Employee-Funded Plan(e.g., 401(k) or similar plan)
Employee-funded 401(k) plan
An employee-funded 403(b) or 457(b) plan
Other employee self-funded plan (e.g., SIMPLE, SEP, or other plans)
NET – Company-Funded Defined Benefit Plan
Traditional defined-benefit plan
Cash balance plan
Other
None. My employer doesn’t offer any retirement benefits.
NET – Employee-Funded Plan (e.g., 401(k) or Similar Plan) (%)

Full-Time Workers Are More Likely to Be Offered a 401(k)
Full-time workers (80 percent) are far more likely to have access to a 401(k) or similar employee-funded plan
compared with part-time workers (51 percent). Among part-time workers, Generation Z workers (61 percent)
are significantly more likely, and Millennials (52 percent) are somewhat more likely to have benefits
compared with Baby Boomers (42 percent) and Generation X (41 percent).
122BASE: 21ST ANNUAL SURVEY - ALL QUALIFIED RESPONDENTSQ1180. Which of the following retirement benefits does your company currently offer to you, personally? Select all.
80 79 83 78 78
All Workers Gen Z Millennials Gen X Baby Boomers
NET – Employee-Funded 401(k) or Similar Plan (%)
70 6471 70 72
All Workers Gen Z Millennials Gen X Baby Boomers
An Employee-Funded 401(k) Plan (%)
Full-Time Workers
5161
5241 42
All Workers Gen Z Millennials Generation X Baby Boomers
NET – Employee-Funded 401(k) or Similar Plan (%)
4251
36 37 38
All Workers Gen Z Millennials Generation X Baby Boomers
An Employee-Funded 401(k) Plan (%)
Part-Time Workers

Having Access to a 401(k) Inspires Workers to Save
Workers who are offered a 401(k) or similar retirement plan by their employer are more likely to save and
invest for retirement in the plan and/or outside of work (91 percent) compared with those who do not have
access to such plans (53 percent). Among workers who are not offered a plan, Baby Boomers are much more
likely to be saving for retirement (64 percent) than Generation X (53 percent), Millennials (49 percent), and
Generation Z (38 percent).
BASE: 21ST ANNUAL SURVEY - CURRENTLY OFFERED QUALIFIED PLAN / NOT CURRENTLY OFFERED QUALIFIED PLANQ1190. Do you currently participate in, or have money invested in your company’s employee-funded retirement savings plan?Q740. Are you currently saving for retirement outside of work, such as in an IRA, mutual funds, bank account, etc.?
91 83
90 94 93
All Workers Gen Z Millennials Gen X BabyBoomers
Among Those Offered a 401(k) or Similar Plan (%)
Saving for Retirement (in an Employer-Sponsored Plan and/or Outside of Work)
53
38 49 53
64
All Workers Gen Z Millennials Gen X BabyBoomers
Among Those Not Offered a 401(k) or Similar Plan (%)
123

When Offered a Plan, Three in Four Participate
Eighty-one percent of workers who are offered a 401(k) or similar plan participate in that plan. Participation rates
are higher among Generation X (86 percent), Baby Boomers (81 percent), and Millennials (80 percent) than
Generation Z (69 percent). Workers who participate in such a plan contribute 12 percent (median) of their
annual salary into their plans. Generation Z and Millennials contribute 15 percent to their plans, while
Generation X and Baby Boomers are contributing 10 percent (medians).
124
BASE: 21ST ANNUAL SURVEY - CURRENTLY OFFERED QUALIFIED PLANQ1190. Do you currently participate in, or have money invested in your company’s employee-funded retirement savings plan?BASE: 21ST ANNUAL SURVEY - CURRENTLY PARTICIPATES IN QUALIFIED PLANQ601. What percentage of your salary are you saving for retirement through your company-sponsored plan this year?
81
69
8086
81
All Workers Gen Z Millennials Gen X BabyBoomers
Participates in 401(k) or Similar PlanYes (%)
12
15 15
10 10
All Workers Gen Z Millennials Gen X BabyBoomers
Percentage of Annual Salary Saved in PlanMedian (%)

About Half Contribute 10 Percent or More to Retirement Plans
Fifty-one percent of workers participating in a 401(k) or similar retirement plan contribute more than 10
percent of their salaries to their plan, with 37 percent contributing more than 15 percent, and 14 percent
contributing 11 - 15 percent of their annual pay into the plan. Slightly less than half of workers participating
in a plan (49 percent) save 10 percent or less.
125
What percentage of your salary are you contributing to your company-sponsored plan this year? (%)All Workers Currently Participating in a 401(k) or Similar Plan
21
28
14
37
1 to 5% 6 to 10% 11 to 15% >15%
Save >10 Percent = 51%
BASE: 21ST ANNUAL SURVEY - CURRENTLY PARTICIPATES IN QUALIFIED PLANQ601. What percentage of your salary are you saving for retirement through your company-sponsored plan this year?

More Than 2 in 5 Across Generations Are “Super Savers”
“Super savers,” or workers who participate in a 401(k) or similar retirement plan and contribute more than 10
percent of their salaries into the plan, are found across generations. These “super savers” include 59 percent
of Millennials, 58 percent of Generation Z, 46 percent of Generation X, and 42 percent of Baby Boomers.
126
What percentage of your salary are you contributing to your company-sponsored plan this year? (%) By Generation
26 16 16
42
1 to 5% 6 to 10% 11 to 15% >15%
Generation Z
17 24
12
47
1 to 5% 6 to 10% 11 to 15% >15%
Millennials
24 30
13
33
0 to 5% 6 to 10% 11 to 15% >15%
Generation X
22 35
19 23
1 to 5% 6 to 10% 11 to 15% >15%
Baby Boomers
Save >10 Percent = 58%
Save >10 Percent = 59%
Save >10 Percent = 46%
Save >10 Percent = 42%
BASE: 21ST ANNUAL SURVEY - CURRENTLY PARTICIPATES IN QUALIFIED PLANQ601. What percentage of your salary are you saving for retirement through your company-sponsored plan this year?

6 in 10 Plan Participants Use Professionally Managed Accounts“Professionally managed” accounts refer to a managed account service, strategic allocation funds, and/or
target date funds. The majority of plan participants (62 percent) use a professionally managed offering in
their 401(k) or similar plans, including 29 percent who invest in strategic allocation funds, 28 percent in
target date funds, and 25 percent who use a managed account service.
127BASE: 21ST ANNUAL SURVEY - THOSE PARTICIPATING IN A QUALIFIED PLANQ1466. What is your current approach to investing in your employer-sponsored retirement plan? Select all.
29 28 25
46
8
I invest in a strategic allocationfund that is designed to addressmy specific risk tolerance profile.
I invest in a target date fund thatis designed to change allocationpercentages as I approach my
target retirement year.
I use a managed account servicewhere I do not make investment
or allocation decisions.
I set my own asset allocationpercentages among the available
funds.
Not sure
What is your current approach to investing in your employer-sponsored retirement plan? (%)
NET – Uses One or More Types of Professionally Managed Account
All Workers: 62%
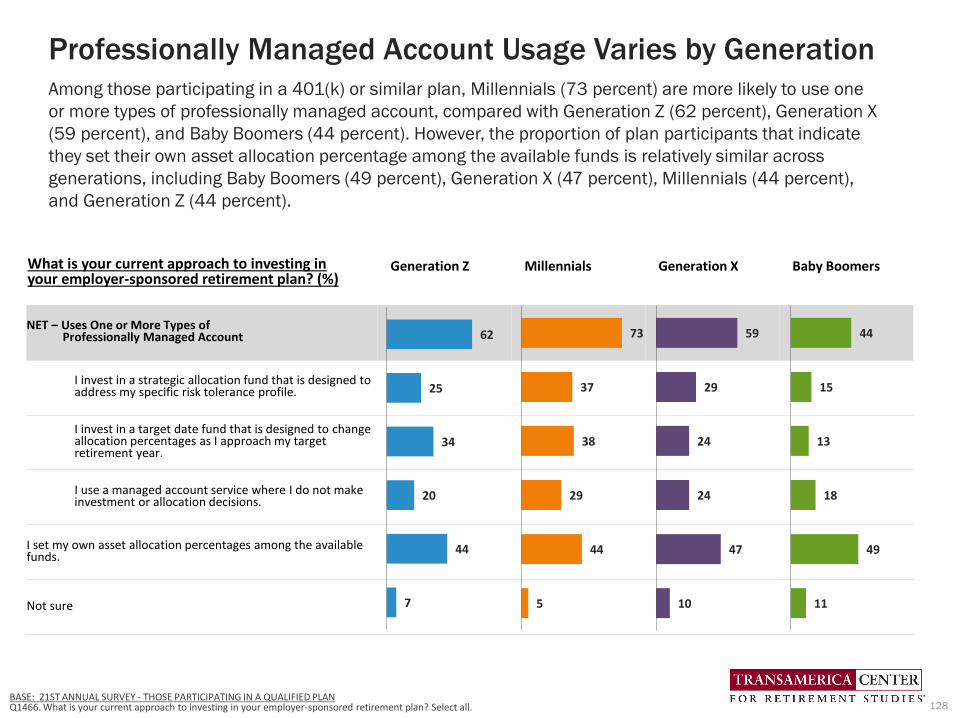
Generation Z Millennials Generation X Baby Boomers
NET – Uses One or More Types of Professionally Managed Account
I invest in a strategic allocation fund that is designed to address my specific risk tolerance profile.
I invest in a target date fund that is designed to change allocation percentages as I approach my target retirement year.
I use a managed account service where I do not make investment or allocation decisions.
I set my own asset allocation percentages among the available funds.
Not sure
62
25
34
20
44
7
Professionally Managed Account Usage Varies by GenerationAmong those participating in a 401(k) or similar plan, Millennials (73 percent) are more likely to use one
or more types of professionally managed account, compared with Generation Z (62 percent), Generation X
(59 percent), and Baby Boomers (44 percent). However, the proportion of plan participants that indicate
they set their own asset allocation percentage among the available funds is relatively similar across
generations, including Baby Boomers (49 percent), Generation X (47 percent), Millennials (44 percent),
and Generation Z (44 percent).
128BASE: 21ST ANNUAL SURVEY - THOSE PARTICIPATING IN A QUALIFIED PLANQ1466. What is your current approach to investing in your employer-sponsored retirement plan? Select all.
73
37
38
29
44
5
59
29
24
24
47
10
44
15
13
18
49
11
What is your current approach to investing in your employer-sponsored retirement plan? (%)
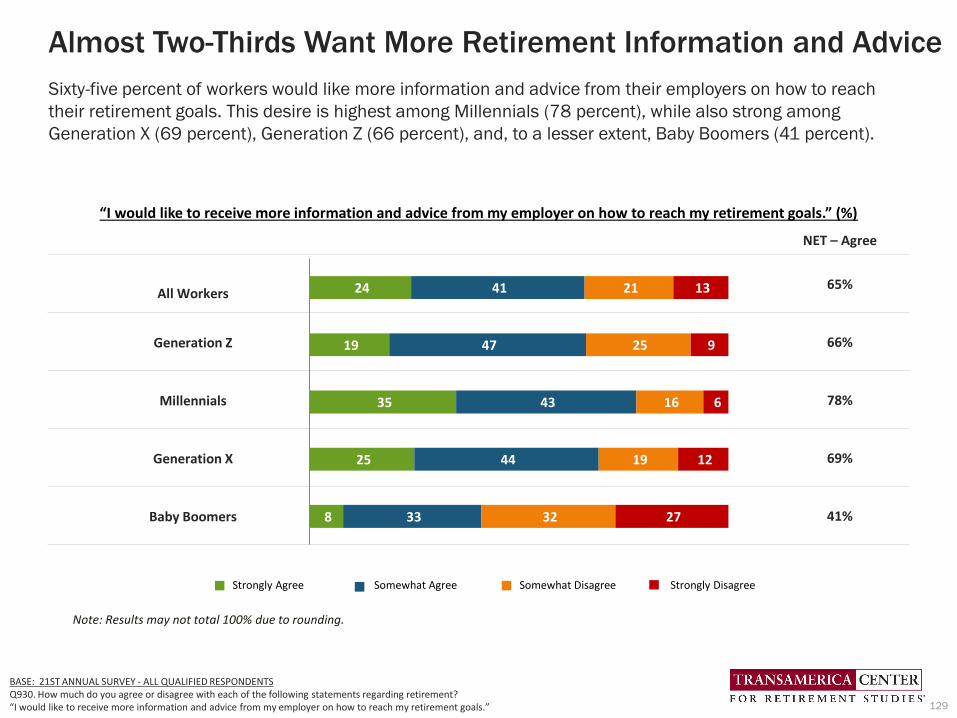
Almost Two-Thirds Want More Retirement Information and Advice
Sixty-five percent of workers would like more information and advice from their employers on how to reach
their retirement goals. This desire is highest among Millennials (78 percent), while also strong among
Generation X (69 percent), Generation Z (66 percent), and, to a lesser extent, Baby Boomers (41 percent).
129
BASE: 21ST ANNUAL SURVEY - ALL QUALIFIED RESPONDENTSQ930. How much do you agree or disagree with each of the following statements regarding retirement?“I would like to receive more information and advice from my employer on how to reach my retirement goals.”
“I would like to receive more information and advice from my employer on how to reach my retirement goals.” (%)
Strongly Agree Somewhat Agree Somewhat Disagree Strongly Disagree
NET – Agree
All Workers65%
Generation Z 66%
Millennials 78%
Generation X 69%
Baby Boomers 41%
24
19
35
25
8
41
47
43
44
33
21
25
16
19
32
13
9
6
12
27
Note: Results may not total 100% due to rounding.
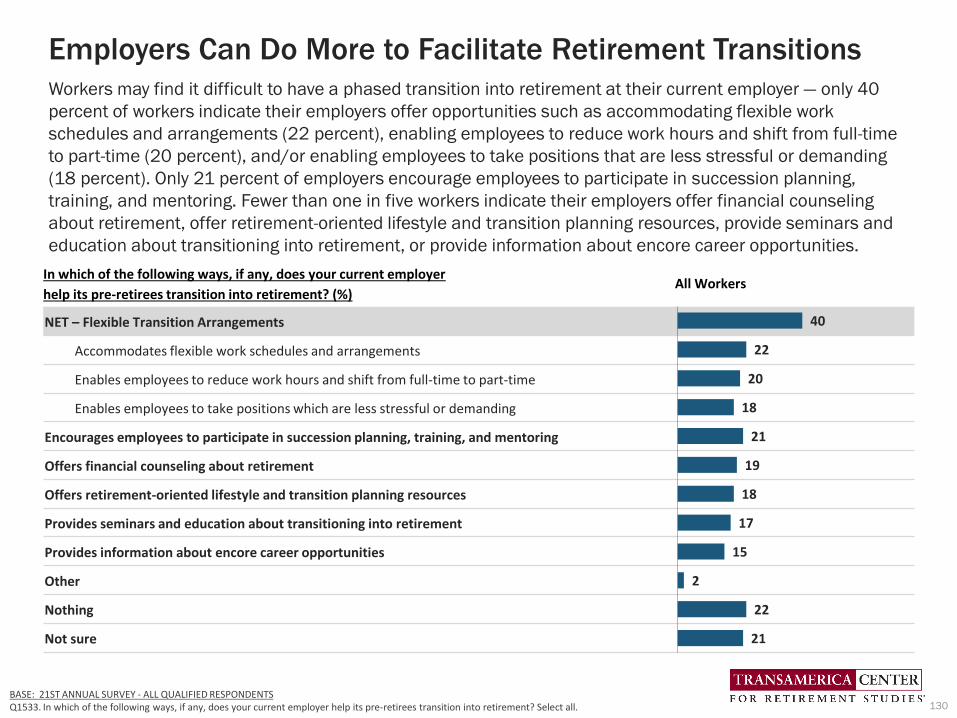
In which of the following ways, if any, does your current employer
help its pre-retirees transition into retirement? (%)All Workers
NET – Flexible Transition Arrangements
Accommodates flexible work schedules and arrangements
Enables employees to reduce work hours and shift from full-time to part-time
Enables employees to take positions which are less stressful or demanding
Encourages employees to participate in succession planning, training, and mentoring
Offers financial counseling about retirement
Offers retirement-oriented lifestyle and transition planning resources
Provides seminars and education about transitioning into retirement
Provides information about encore career opportunities
Other
Nothing
Not sure
40
22
20
18
21
19
18
17
15
2
22
21
Employers Can Do More to Facilitate Retirement Transitions
130BASE: 21ST ANNUAL SURVEY - ALL QUALIFIED RESPONDENTSQ1533. In which of the following ways, if any, does your current employer help its pre-retirees transition into retirement? Select all.
Workers may find it difficult to have a phased transition into retirement at their current employer — only 40
percent of workers indicate their employers offer opportunities such as accommodating flexible work
schedules and arrangements (22 percent), enabling employees to reduce work hours and shift from full-time
to part-time (20 percent), and/or enabling employees to take positions that are less stressful or demanding
(18 percent). Only 21 percent of employers encourage employees to participate in succession planning,
training, and mentoring. Fewer than one in five workers indicate their employers offer financial counseling
about retirement, offer retirement-oriented lifestyle and transition planning resources, provide seminars and
education about transitioning into retirement, or provide information about encore career opportunities.

In which of the following ways, if any, does your current employer help its employees who are transitioning into retirement? (%)
Generation Z Millennials Generation X Baby Boomers
NET – Flexible Transition Arrangements 52
Accommodates flexible work schedules and arrangements
Enables employees to reduce work hours and shift from full-time to part-time
Enables employees to take positions which are less stressful or demanding
Encourages employees to participate in succession planning, training, and mentoring
Offers financial counseling about retirement
Offers retirement-oriented lifestyle and transition planning resources
Provides seminars and education about transitioning into retirement
Provides information about encore career opportunities
Other
Nothing
Not sure
44
26
20
22
22
18
16
16
18
3
12
25
Baby Boomers Less Likely to Have Retirement Transition Support
131BASE: 21ST ANNUAL SURVEY - ALL QUALIFIED RESPONDENTSQ1533. In which of the following ways, if any, does your current employer help its pre-retirees transition into retirement? Select all.
36
20
19
15
18
19
16
17
13
2
26
23
27
24
26
30
24
25
21
23
1
12
16
24
15
16
6
9
10
6
9
4
1
40
26
Slightly fewer than one in four Baby Boomer workers (24 percent) say their employers offer one or more types
of flexible transition arrangements for pre-retirees, compared with 52 percent of Millennials, 44 percent of
Generation Z, and 36 percent of Generation X. One in four Baby Boomers (40 percent) say their employers
do “nothing” to help pre-retirees transition into retirement.
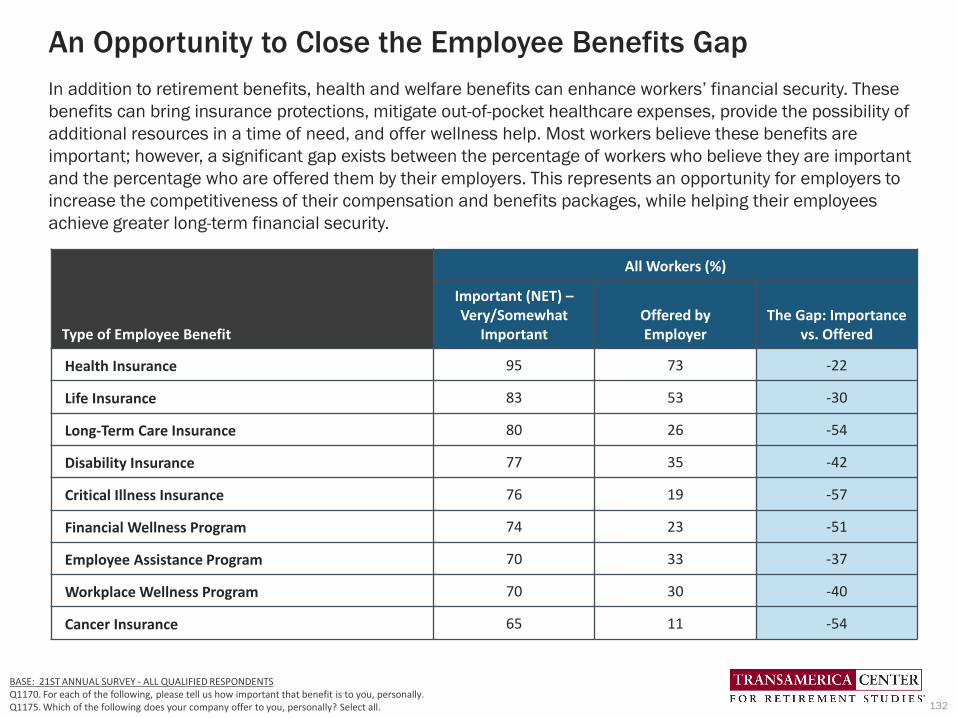
An Opportunity to Close the Employee Benefits Gap
In addition to retirement benefits, health and welfare benefits can enhance workers’ financial security. These
benefits can bring insurance protections, mitigate out-of-pocket healthcare expenses, provide the possibility of
additional resources in a time of need, and offer wellness help. Most workers believe these benefits are
important; however, a significant gap exists between the percentage of workers who believe they are important
and the percentage who are offered them by their employers. This represents an opportunity for employers to
increase the competitiveness of their compensation and benefits packages, while helping their employees
achieve greater long-term financial security.
132
Type of Employee Benefit
All Workers (%)
Important (NET) –Very/Somewhat
ImportantOffered by Employer
The Gap: Importance vs. Offered
Health Insurance 95 73 -22
Life Insurance 83 53 -30
Long-Term Care Insurance 80 26 -54
Disability Insurance 77 35 -42
Critical Illness Insurance 76 19 -57
Financial Wellness Program 74 23 -51
Employee Assistance Program 70 33 -37
Workplace Wellness Program 70 30 -40
Cancer Insurance 65 11 -54
BASE: 21ST ANNUAL SURVEY - ALL QUALIFIED RESPONDENTSQ1170. For each of the following, please tell us how important that benefit is to you, personally.Q1175. Which of the following does your company offer to you, personally? Select all.

The Employee Benefits Gap Applies to All Four Generations
The importance of various types of health and welfare benefits varies by generation. While more than nine in
10 workers across the four generations consider health insurance to be important, Generation Z, Millennials,
and Generation X are generally more likely than Baby Boomers to find the other types of health and welfare
benefits listed to be important. Across generations, a significant gap exists between the percentages of workers
who believe they are important compared with the percentage who are offered them by their employers.
133
BASE: 2STANNUAL SURVEY - ALL QUALIFIED RESPONDENTSQ1170. For each of the following, please tell us how important that benefit is to you, personally.Q1175. Which of the following does your company offer to you, personally?
Type of Employee Benefit
Generation Z (%) Millennials (%) Generation X (%) Baby Boomers (%)
NETImportant
Offeredby
Employer
The Gap: Importancevs. Offered
NETImportant
Offeredby
Employer
The Gap: Importance vs. Offered
NET Important
Offeredby
Employer
The Gap: Importance vs. Offered
NET Important
Offeredby
Employer
The Gap: Importance vs. Offered
HealthInsurance
93 64 -29 95 73 -22 98 78 -20 91 70 -21
Life Insurance 83 35 -48 87 56 -31 86 56 -30 72 51 -21
Long-Term Care Insurance
75 17 -58 85 34 -51 82 26 -56 70 18 -52
Disability Insurance
71 16 -55 80 34 -46 80 41 -39 68 39 -29
Critical Illness Insurance
79 19 -60 83 23 -60 75 19 -56 63 13 -50
Financial Wellness Program
79 23 -56 84 30 -54 74 22 -52 55 12 -43
Employee Assistance Program
73 29 -44 82 39 -43 71 31 -40 45 27 -18
Workplace Wellness Program
75 28 -47 80 34 -46 72 31 -41 46 21 -25
CancerInsurance
64 10 -54 74 14 -60 64 10 -54 48 5 -43

Appendix
134

21st Annual Survey: A Portrait of Workers by Generation
CharacteristicsAll Workers (%)
n=3,109Gen Z (%)
n=301Millennials (%)
n=1,249
Generation X (%)
n=960
Baby Boomers (%)
n=573
Gender* Male 59 58 61 62 52Female 40 40 38 36 47Transgender 1 1 1 <1 <1
Marital Status Married/Living with partner 60 15 62 67 65 Divorced/Separated/Widowed 12 1 4 16 22Never married 28 84 34 17 13
Employment Status Full Time 84 55 87 92 78 Part Time 16 45 13 8 22
Educational Attainment
Less than High School 3 6 3 3 2 High School to Some College 50 72 43 48 56College Degree or More 47 23 54 49 42
Annual Household Income
Less than $50,000 15 31 17 12 11 $50,000 to $99,999 32 28 32 32 32$100,000+ 51 37 50 55 56Decline to Answer 2 3 2 2 1Estimated Median $91,000 $70,000 $88,000 $96,000 $94,000
Work Arrangement Leave your home to go to work 49 61 43 49 57Work remotely (e.g., from home or anywhere) 40 29 42 41 38Equally leave home to go to work and work remotely 15 15 20 13 7
LGBQ+ Status** LGBQ+ 8 22 8 6 4Did not identify as LGBQ+ 92 75 92 93 96Decline to Answer 1 2 <1 1 <1
Race/Ethnicity White 77 70 75 75 87Black/African American 12 13 13 12 6 Asian/Pacific Islander 8 10 9 8 5Hispanic 16 18 19 17 7Other 6 11 7 7 3
Urbanicity Urban 39 30 52 36 24Suburban 47 49 38 51 55Rural 14 22 10 13 21
Note: Results may not total to 100% due to rounding.* Gender: Responses 1% or less for "Other" and "Prefer not to answer" are not shown.** LGBQ+ Status: Responses of 1% or less for “Not sure” are not shown.
135
