living donor liver transplant- upmc experience
TRANSCRIPT
University of Pittsburgh Medical CenterCenter of Excellence Dr. Swaytha Ganesh
Living Donor Liver Transplant- UPMC Experience
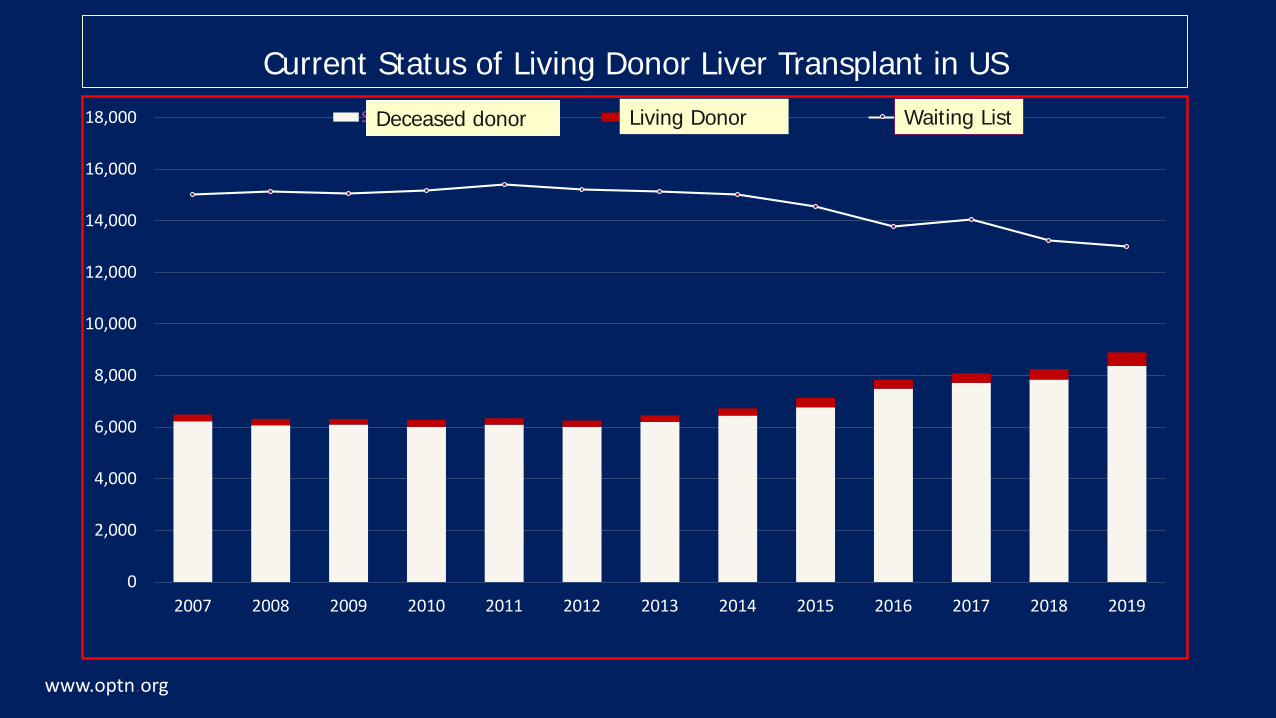
Current Status of Living Donor Liver Transplant in US
0
2,000
4,000
6,000
8,000
10,000
12,000
14,000
16,000
18,000
2007 2008 2009 2010 2011 2012 2013 2014 2015 2016 2017 2018 2019
Series2 Series3 Series1Waiting ListLiving DonorDeceased donor
www.optn.org

Living Donor Transplant Around the World
02468
101214161820
Korea Taiwan Hong Kong Japan Belgium Germany U.S.A. Italy
Living-Donor Liver Transplants per Million People
2006 2010 2016
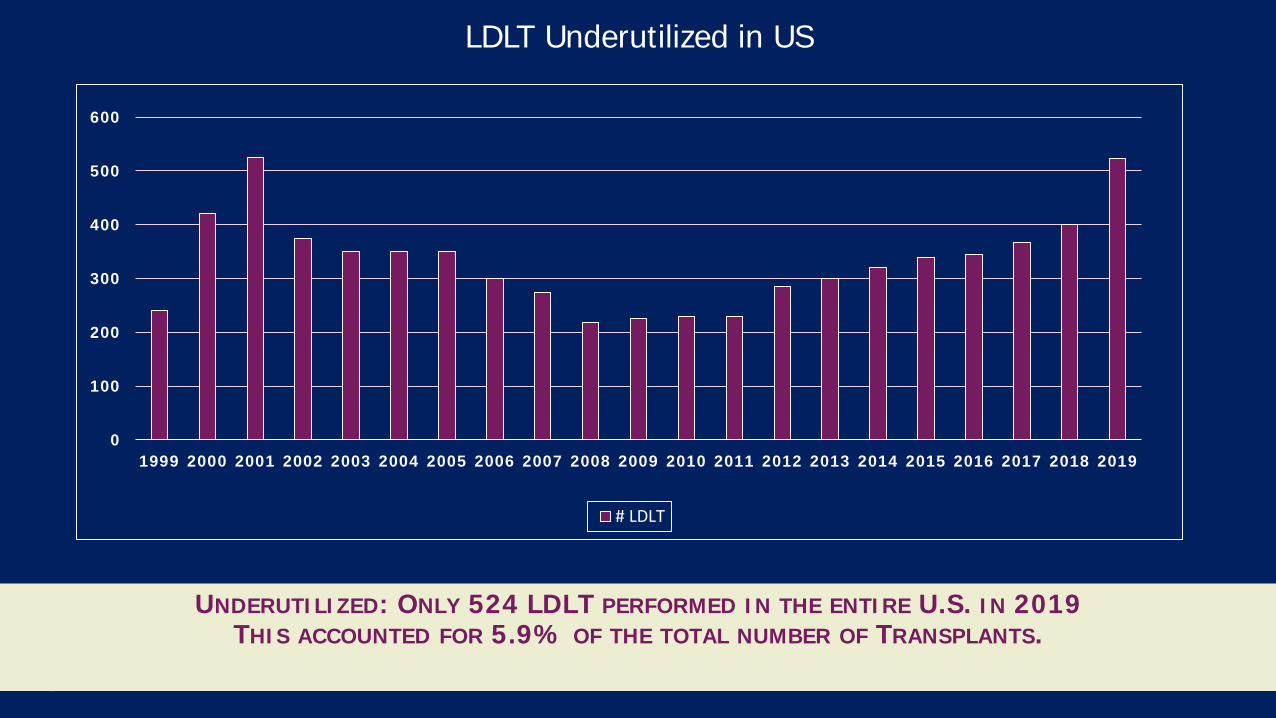
LDLT Underutilized in US
4
0
100
200
300
400
500
600
1999 2000 2001 2002 2003 2004 2005 2006 2007 2008 2009 2010 2011 2012 2013 2014 2015 2016 2017 2018 2019
# LDLT
UNDERUTILIZED: ONLY 524 LDLT PERFORMED IN THE ENTIRE U.S. IN 2019THIS ACCOUNTED FOR 5.9% OF THE TOTAL NUMBER OF TRANSPLANTS.

ONLY 15 US CENTERS HAVE DONE >100 ALDLT Total
5
Number of LDLT(2018)
Number of
Centers
≥10 12
5-9 15
1-4 20
0
100
200
300
400
500
600 564
380
296
361
215
373
182 173
308
245

LDLT at UPMC
0102030405060708090
100
2010 2011 2012 2013 2014 2015 2016 2017 2018 2019 2020# Adult LDLT # Pediatric LDLT
In 2019, 60% of our transplants were with a living donor (national average 5.4%)

LDLT at UPMC
7
0
10
20
30
40
50
60
70
8071
2926
23
1613
10 10 10 10
8
Outcomes: Donors and Recipients
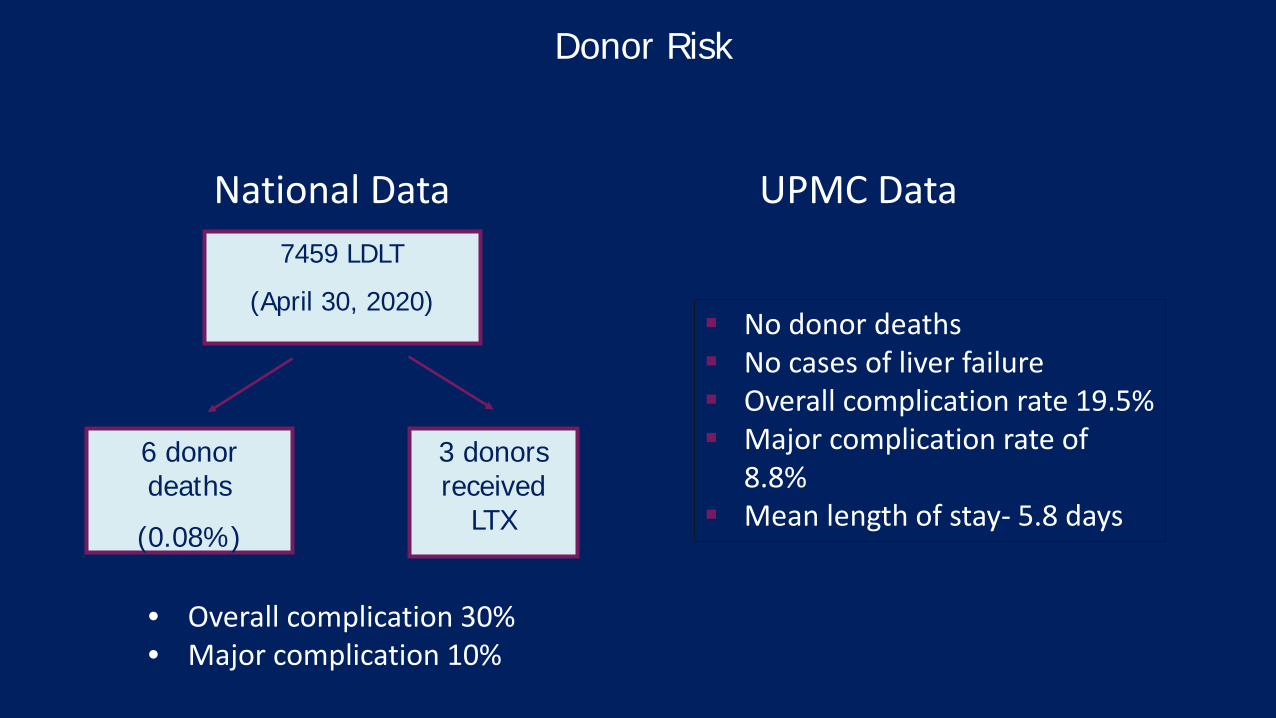
Donor Risk
7459 LDLT(April 30, 2020)
6 donor deaths
(0.08%)
3 donors received
LTX
National Data UPMC Data
No donor deaths No cases of liver failure Overall complication rate 19.5% Major complication rate of
8.8% Mean length of stay- 5.8 days
• Overall complication 30%• Major complication 10%
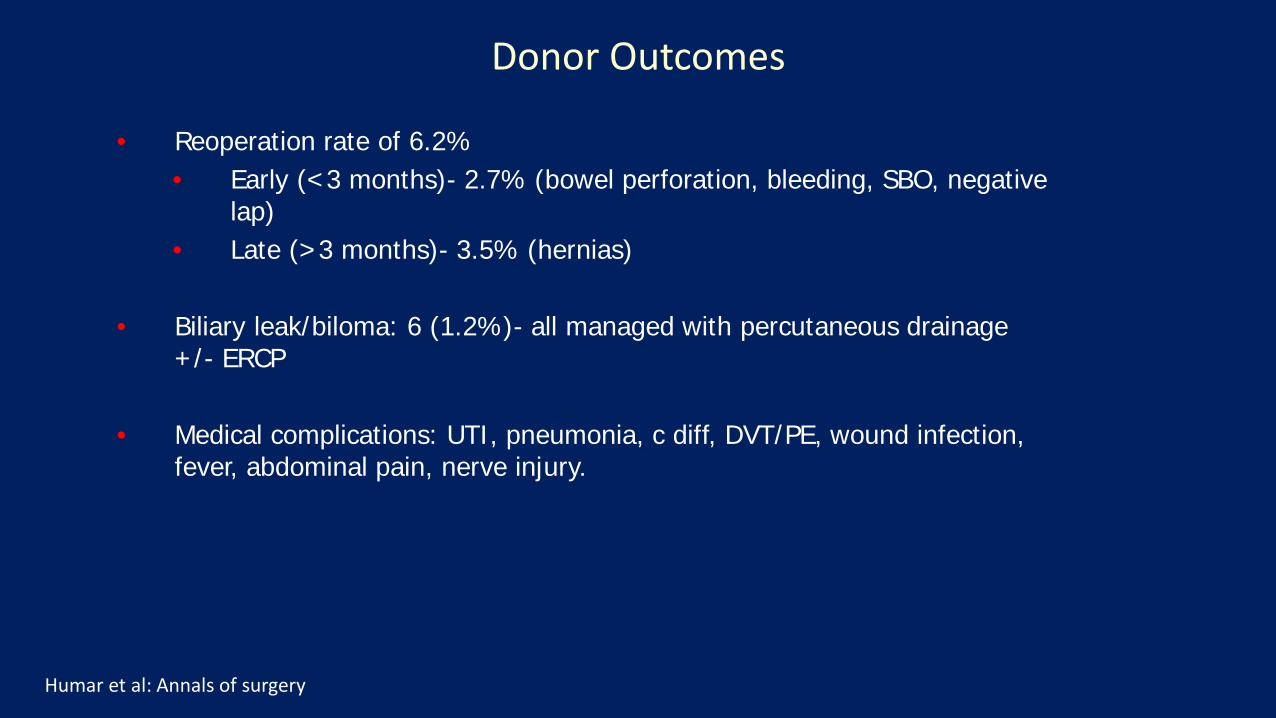
• Reoperation rate of 6.2%• Early (<3 months)- 2.7% (bowel perforation, bleeding, SBO, negative
lap)• Late (>3 months)- 3.5% (hernias)
• Biliary leak/biloma: 6 (1.2%)- all managed with percutaneous drainage +/- ERCP
• Medical complications: UTI, pneumonia, c diff, DVT/PE, wound infection, fever, abdominal pain, nerve injury.
Donor Outcomes
Humar et al: Annals of surgery

Recovery:
– 5-7 days in hospital– 4-6 weeks desk job– 10-12 weeks physical job– 80-90% by 3 months post donation
Donor Safety
11

What’s new at UPMC with Living donors
• ABOi LPE• LDLT for Extended criteria ( Dr. Hughes)• Altruistic/ Anonymous donation• Champion Program
12
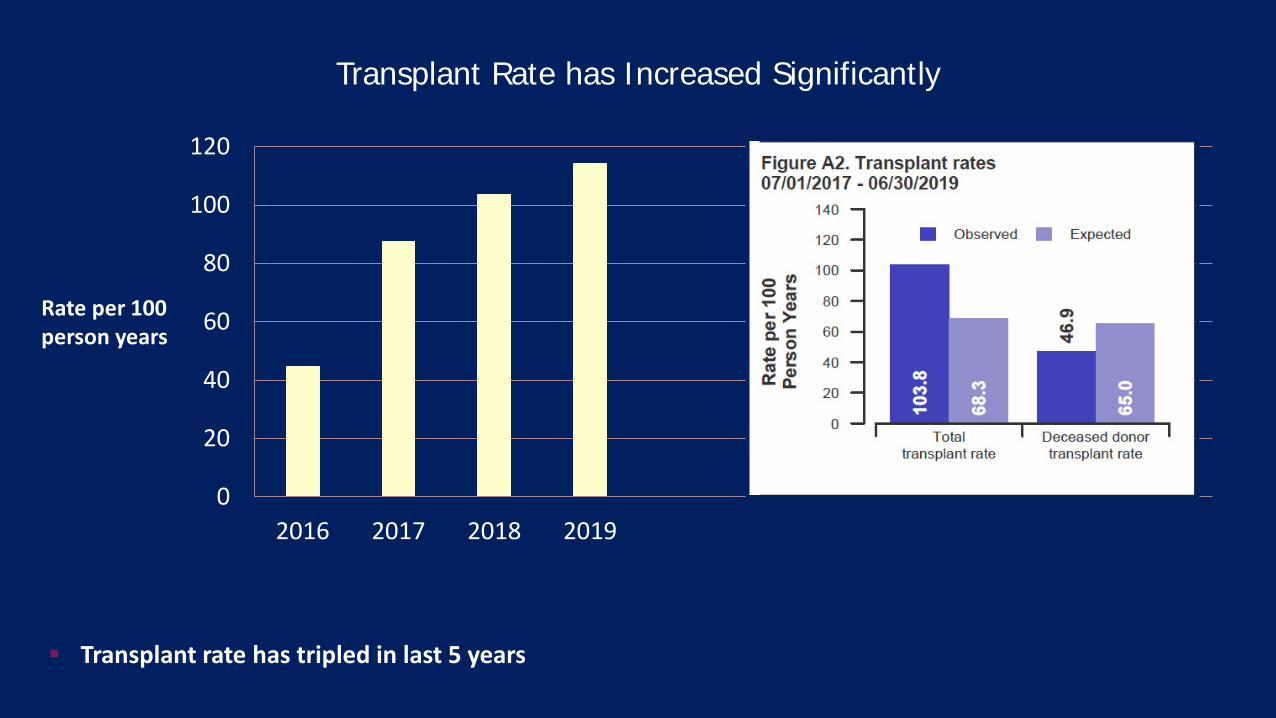
Transplant Rate has Increased Significantly
0
20
40
60
80
100
120
2016 2017 2018 2019
Transplant rate has tripled in last 5 years
Rate per 100 person years

Waiting List Mortality has decreased Significantly
0
5
10
15
20
25
30
2016 2017 2018 2019
# Adult LDLT
Rate per 100 person years
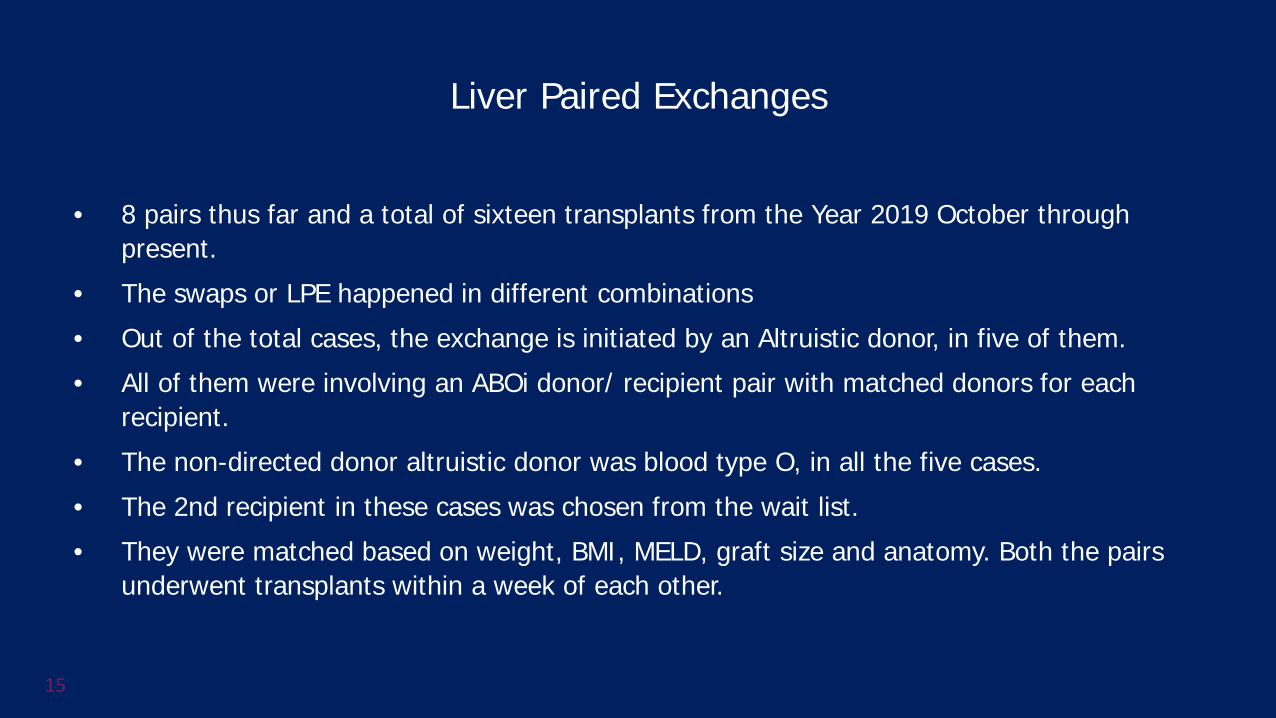
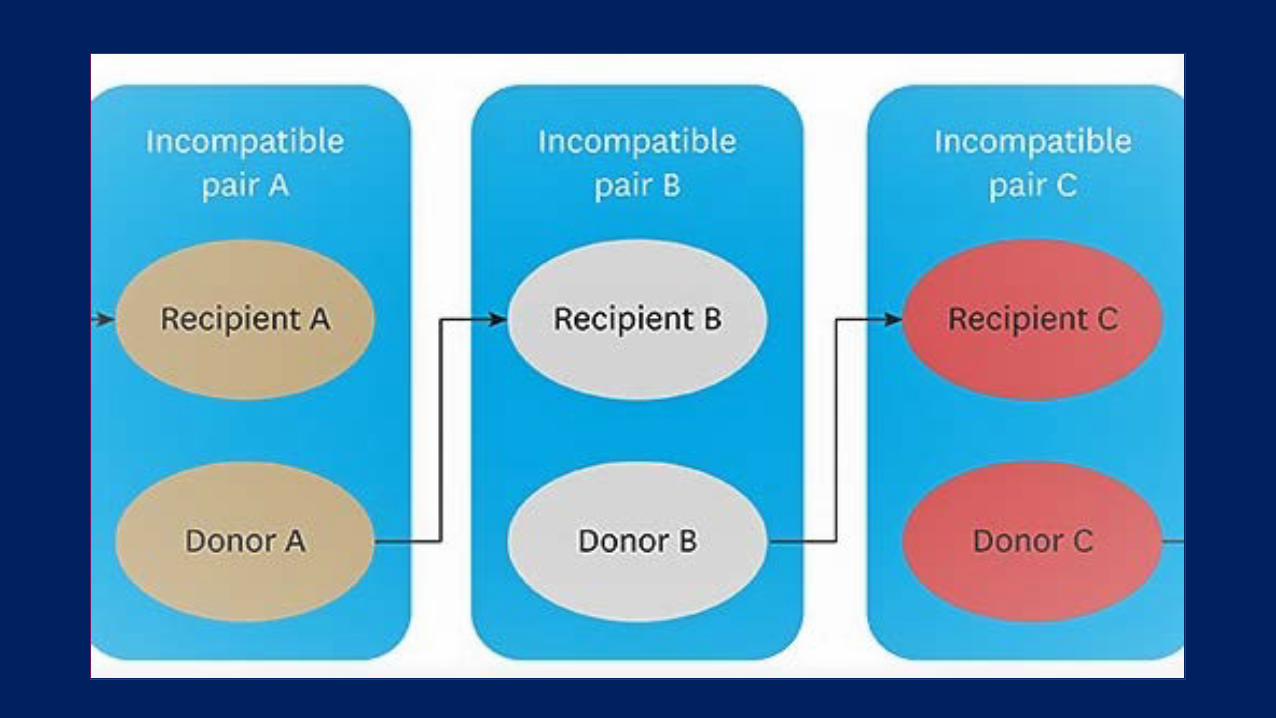
Liver Paired Exchanges
• 8 pairs thus far and a total of sixteen transplants from the Year 2019 October through present.
• The swaps or LPE happened in different combinations • Out of the total cases, the exchange is initiated by an Altruistic donor, in five of them. • All of them were involving an ABOi donor/ recipient pair with matched donors for each
recipient. • The non-directed donor altruistic donor was blood type O, in all the five cases. • The 2nd recipient in these cases was chosen from the wait list. • They were matched based on weight, BMI, MELD, graft size and anatomy. Both the pairs
underwent transplants within a week of each other.
15
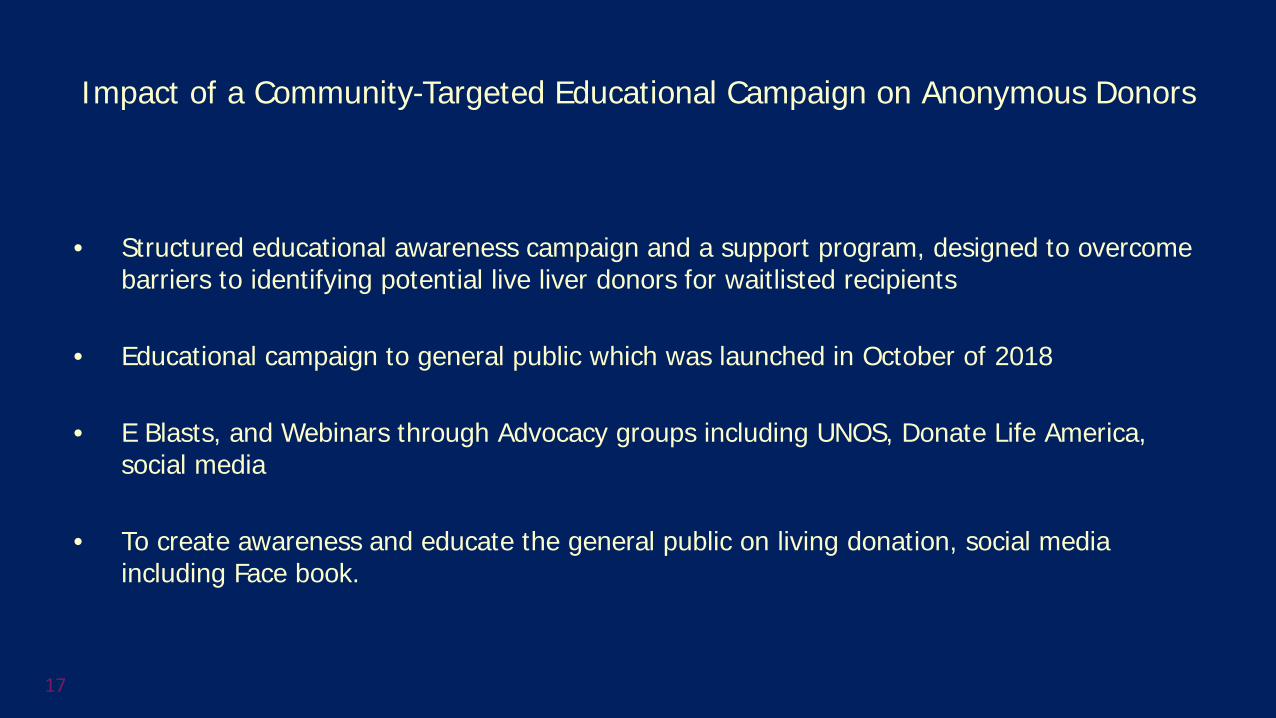
Impact of a Community-Targeted Educational Campaign on Anonymous Donors
• Structured educational awareness campaign and a support program, designed to overcome barriers to identifying potential live liver donors for waitlisted recipients
• Educational campaign to general public which was launched in October of 2018
• E Blasts, and Webinars through Advocacy groups including UNOS, Donate Life America, social media
• To create awareness and educate the general public on living donation, social media including Face book.
17
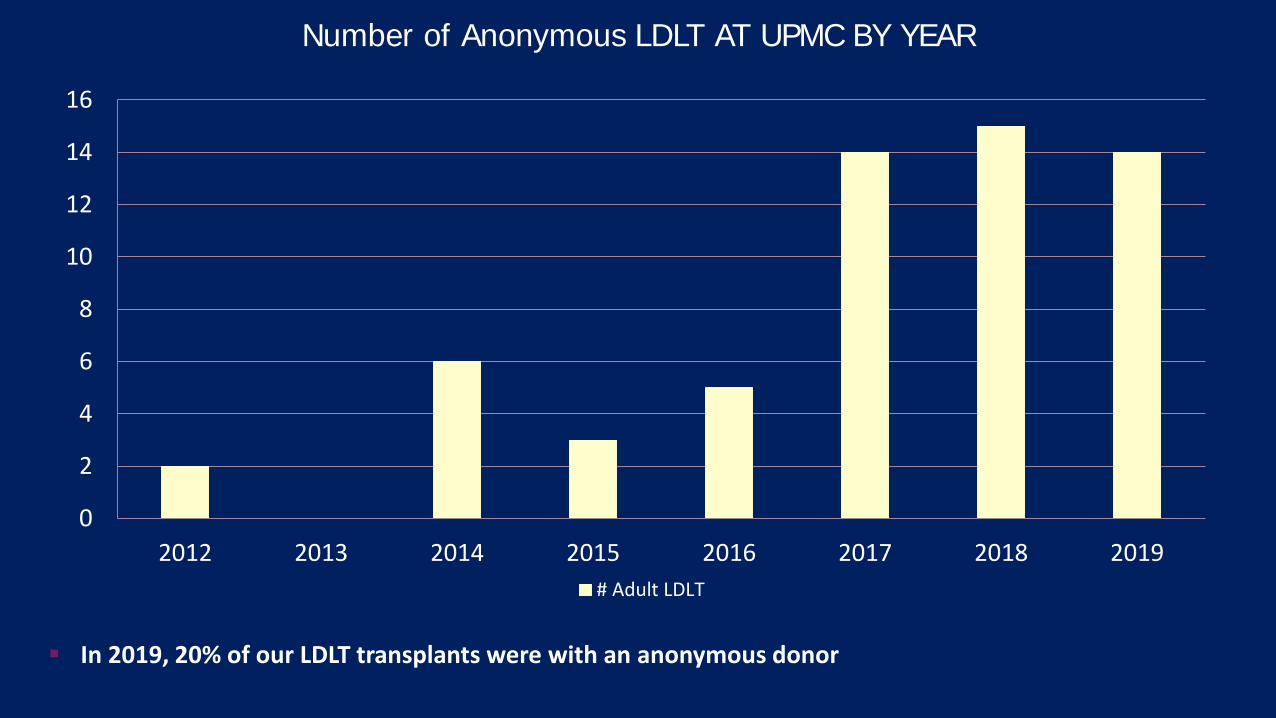
Number of Anonymous LDLT AT UPMC BY YEAR
0
2
4
6
8
10
12
14
16
2012 2013 2014 2015 2016 2017 2018 2019# Adult LDLT
In 2019, 20% of our LDLT transplants were with an anonymous donor
20
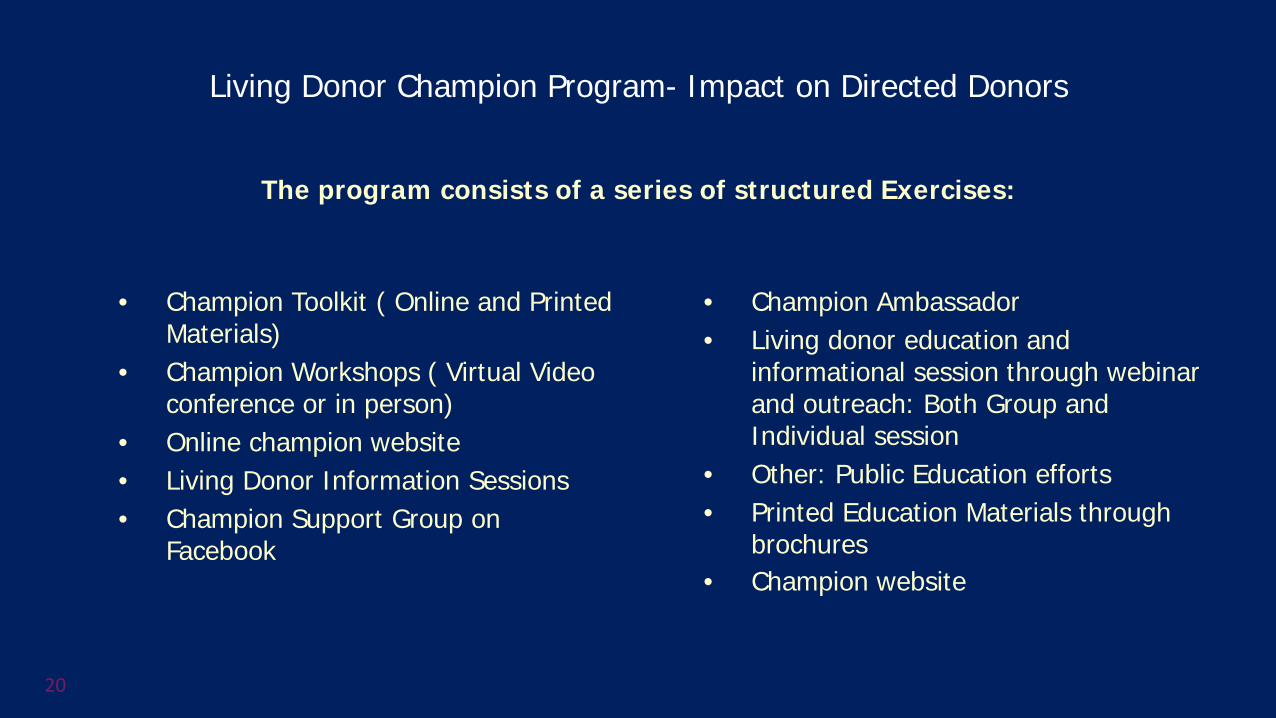
Living Donor Champion Program- Impact on Directed Donors
The program consists of a series of structured Exercises:
• Champion Toolkit ( Online and Printed Materials)
• Champion Workshops ( Virtual Video conference or in person)
• Online champion website • Living Donor Information Sessions• Champion Support Group on
• Champion Ambassador• Living donor education and
informational session through webinar and outreach: Both Group and Individual session
• Other: Public Education efforts• Printed Education Materials through
brochures• Champion website
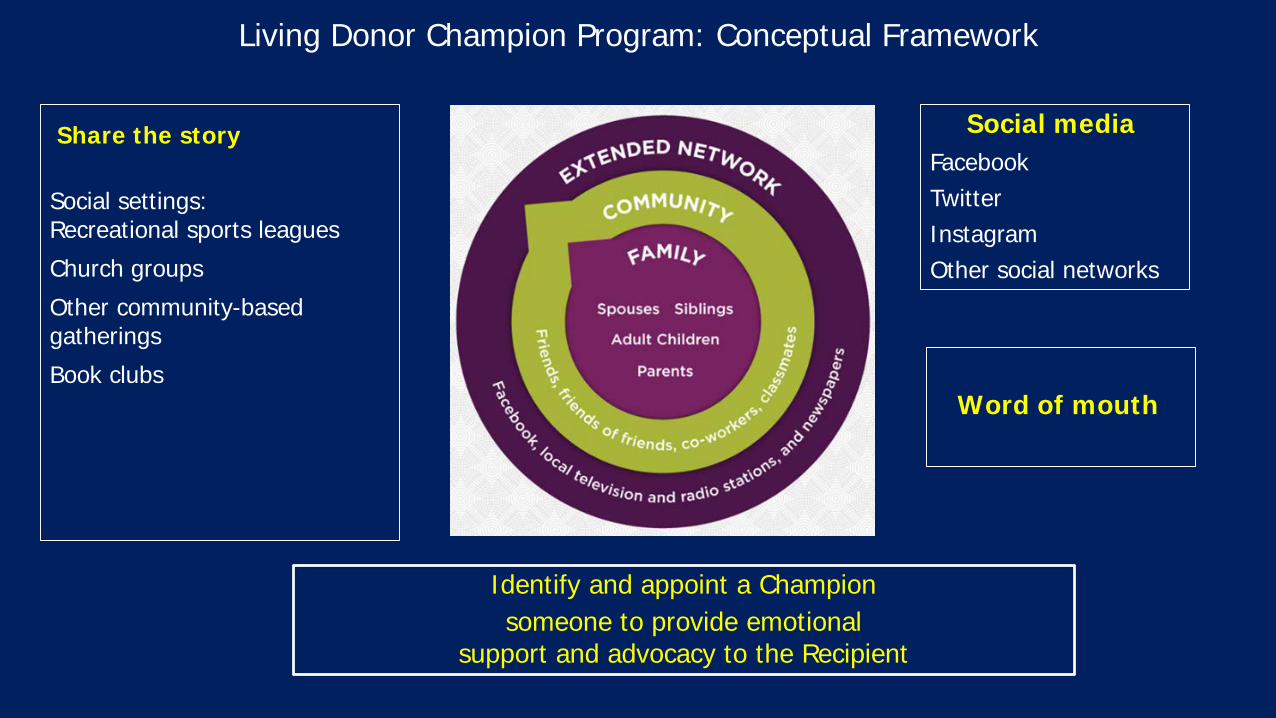
Living Donor Champion Program: Conceptual Framework
Identify and appoint a Champion someone to provide emotional
support and advocacy to the Recipient
Social settings:Recreational sports leaguesChurch groupsOther community-based gatheringsBook clubs
Social mediaFacebookTwitterInstagramOther social networks
Word of mouth
Share the story

Outcomes: Recipients

Recipient Survival Outcomes: LDLT vs DDLT
Patient Survival Graft Survival
Humar et al, Annals of Surgery, 2019
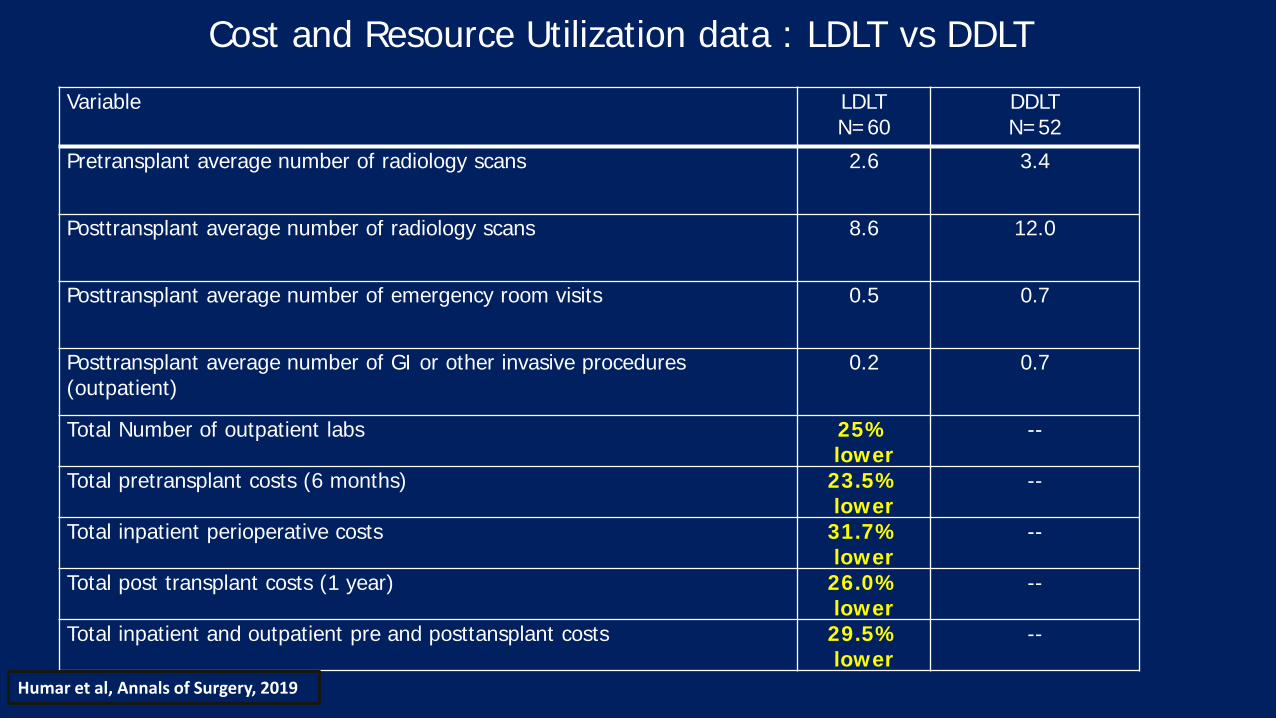
Cost and Resource Utilization data : LDLT vs DDLTVariable LDLT
N=60DDLTN=52
Pretransplant average number of radiology scans 2.6 3.4
Posttransplant average number of radiology scans 8.6 12.0
Posttransplant average number of emergency room visits 0.5 0.7
Posttransplant average number of GI or other invasive procedures (outpatient)
0.2 0.7
Total Number of outpatient labs 25% lower
--
Total pretransplant costs (6 months) 23.5% lower
--
Total inpatient perioperative costs 31.7% lower
--
Total post transplant costs (1 year) 26.0% lower
--
Total inpatient and outpatient pre and posttansplant costs 29.5% lower
--
Humar et al, Annals of Surgery, 2019
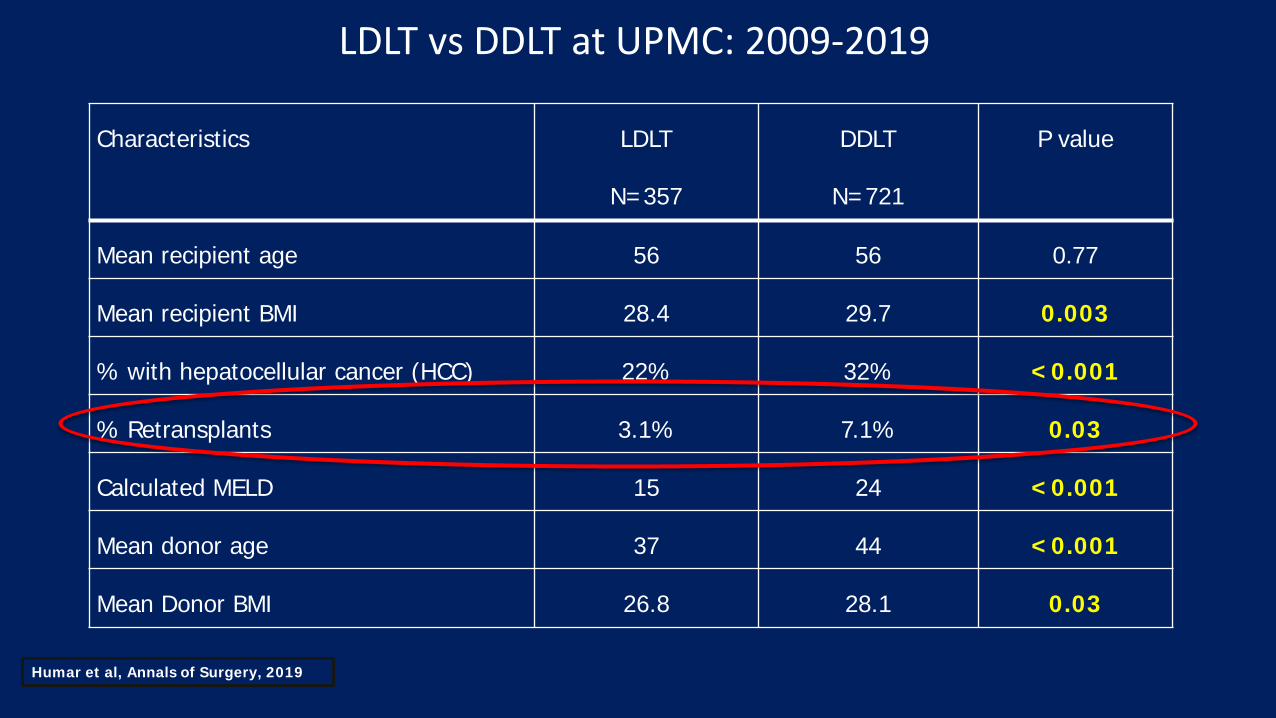
LDLT vs DDLT at UPMC: 2009-2019
Characteristics LDLT
N=357
DDLT
N=721
P value
Mean recipient age 56 56 0.77
Mean recipient BMI 28.4 29.7 0.003
% with hepatocellular cancer (HCC) 22% 32% <0.001
% Retransplants 3.1% 7.1% 0.03
Calculated MELD 15 24 <0.001
Mean donor age 37 44 <0.001
Mean Donor BMI 26.8 28.1 0.03
Humar et al, Annals of Surgery, 2019
LDLT comprised 53.6% of UPMC’s transplants (National average 4.8%)
The transplant rate increased from 44.8 (rate per 100-person years) in 2015 to 103.8 in 2019
Criteria for LDLT should be based on ability to provide a survival advantage.
LDLT is not the last resort but rather the first and better resort
LDLT Program at UPMC
27