living conditions in europe 2018 edition
TRANSCRIPT

S T A T I S T I C A L B O O K S
Living conditions in Europe 2018 edition


2018 editionLiving conditions
in Europe

Printed by Imprimerie Centrale in Luxembourg
Manuscript completed in March 2018
Neither the European Commission nor any person acting on behalf of the Commission is responsible for the use that might be made of the following information.
Luxembourg: Publications Office of the European Union, 2018
© European Union, 2018
Reuse is authorised provided the source is acknowledged. The reuse policy of European Commission documents is regulated by Decision 2011/833/EU (OJ L 330, 14.12.2011, p. 39).
Copyright for photographs: cover: © Adisa/Shutterstock.com; chapter 1: © fotogestoeber/Shutterstock.com; chapter 2: © Rosie Apples/Shutterstock.com; chapter 3: © Tupungato/Shutterstock.com; chapter 4: © Doglikehorse/Shutterstock.com; chapter 5: © Rawpixel.com/Shutterstock.com.
For any use or reproduction of photos or other material that is not under the EU copyright, permission must be sought directly from the copyright holders.For more information, please consult: http://ec.europa.eu/eurostat/about/policies/copyright
Theme: Population and social conditionsCollection: Statistical books
Print: ISBN 978-92-79-86497-1 PDF: ISBN 978-92-79-86498-8ISSN 1725-5988 ISSN 2363-2526doi:10.2785/14408 doi:10.2785/39876Cat. No: KS-DZ-18-001-EN-C Cat. No: KS-DZ-18-001-EN-N

Living conditions in Europe — 2018 edition 3
Abstract
Living conditions in Europe — 2018 editionThis publication provides a picture of current living conditions in Europe, as well as the socio-economic factors affecting the everyday life of Europeans. Chapter 1 focuses on the financial dimensions of poverty and inequality. Chapter 2 examines to what extent a lack of adequate income can prevent people from affording an adequate standard of living. Chapter 3 presents statistics with regard to the quality of housing, while Chapter 4 provides information on the interactions between living conditions and labour and health status. Finally, Chapter 5 provides an analysis of social participation and social integration. The majority of the indicators presented in the publication come from European statistics on income and living conditions (EU-SILC), with data up to 2016.
ProductionINFORMA sàrl: Simon Allen, Giovanni Albertone, Andrew Redpath
LayoutINFORMA sàrl
Chief editorEmilio Di MeglioEurostat, Unit F.4., Income and living conditions; Quality of life
EditorsEmilio Di Meglio, Agata Kaczmarek-Firth, Agnieszka Litwinska, Cristian RusuEurostat, Unit F.4., Income and living conditions; Quality of life
Map productionEurostat, Unit F.4.
DisseminationCatherine CoyetteEurostat, Unit B.4., Digital dissemination
Contact detailsEurostatBâtiment Joseph Bech5, rue Alphonse Weicker2721 LuxembourgLUXEMBOURGFor more information please consult:http://ec.europa.eu/eurostathttp://ec.europa.eu/eurostat/help/support
Data extractionData were extracted during the period: 23 October - 3 November 2017

Contents
Living conditions in Europe — 2018 edition 4
Contents
Abstract 3
Contents 4
Introduction 5
1. Income distribution and income inequality 71.1 Income distribution 9
1.2 Income inequality 21
2. Effects of income on living conditions 252.1 Poverty and social exclusion 27
2.2 Material deprivation 42
2.3 Economic strain 47
3. Housing quality 533.1 Housing conditions 54
3.2 Living environments 64
3.3 Housing affordability 70
4. Socio-economic aspects of living conditions 774.1 Health conditions 78
4.2 Labour conditions 87
4.3 Childcare and education arrangements 105
5. Social participation and integration 1095.1 Social participation 110
5.2 Social networks 122
Annex 133Methodological notes 134
Glossary 135
Abbreviations and symbols 143

Introduction
Living conditions in Europe — 2018 edition 5
Introduction
(1) For more information, see: http://eur-lex.europa.eu/LexUriServ/LexUriServ.do?uri=COM:2010:2020:FIN:EN:PDF.
(2) For more information, see: http://ec.europa.eu/social/main.jsp?catId=1044&langId=.
(3) European Commission, GDP and beyond — Measuring progress in a changing world, COM (2009) 433 final, Brussels, 2009 (http://eur-lex.europa.eu/LexUriServ/LexUriServ.do?uri=COM:2009:0433:FIN:EN:PDF).
Since the launch of the Europe 2020 strategy (1) for smart, sustainable and inclusive growth, the importance of income and living conditions statistics has grown rapidly. Indeed, one of the five Europe 2020 headline targets is related to social inclusion and consists of lifting at least 20 million people in the European Union (EU) from the risk of poverty or social exclusion by 2020.
The social consequences of the global financial and economic crisis gave even more importance to data on income and living conditions. One example concerns the creation of a reference framework for monitoring performance through the European pillar of social rights.
The social investment package (2) adopted in February 2013, urged countries to put more emphasis on social investment to achieve the Europe 2020 targets, and also led to increased demand for timely and reliable data on the social situation in Europe.
Finally, the Beyond GDP (3) debate has drawn attention for the need to complement GDP measures with indicators that encompass social and environmental aspects of progress.
EU statistics on income and living conditions (EU-SILC) are the main data source used within this publication for a comparative analysis of income and living conditions in the EU; they also provide information in order to analyse various aspects of social exclusion.
This statistical book aims to present a comprehensive picture of current living conditions in Europe. Different aspects of living conditions are covered through a broad selection of indicators reflecting socio-economic conditions that affect the everyday lives of Europeans. The main aspects concern income, poverty and social exclusion, material deprivation and housing conditions, as well as health and labour conditions, social participation and social integration.
This publication is divided into five chapters, each focusing on different aspects of living conditions. Chapter 1 presents the financial dimensions of poverty and inequality and covers key income-based statistics and indicators reflecting disparities in the distribution of monetary resources. Chapter 2 shows how poverty, social exclusion and material deprivation can impact on the ability of people to have an adequate standard of living. Chapter 3 uses EU-SILC data to illustrate a range of issues in relation to housing quality, presenting information on actual dwellings as well as the local environment that surrounds them. Chapter 4 examines the impact that socio-economic factors may have on people’s living standards, for example, the influence of their labour market status or their health status. In Chapter 5, social participation and integration are analysed, for example, detailing the share of people who are active citizens, the share of people that participate in volunteering activities, or the frequency with which people interact with their friends and/or family.

Introduction
Living conditions in Europe — 2018 edition 6
The data used in the publication were drawn from Eurostat’s dissemination database during the period from 23 October to 3 November 2017 and cover all 28 Member States of the EU; subject to data availability, information is also presented for EFTA (Iceland, Liechtenstein, Norway and Switzerland) and candidate countries (Montenegro, the former Yugoslav Republic of Macedonia, Albania, Serbia and Turkey).
The majority of the indicators come from EU-SILC data set and are generally available up until 2016. Some specific aspects of the analysis refer to earlier reference periods, for example:
the 2012 EU-SILC ad-hoc module for data on housing; the 2013 EU-SILC ad-hoc module on personal well-being; the 2014 EU-SILC ad-hoc module on material deprivation; and the 2015 EU-SILC ad-hoc module on social and cultural participation. Apart from the data derived from EU-SILC, use was also made of two additional sources — national accounts and harmonised indices of consumer prices (HICP) — the former provides information pertaining to the structure of household consumption expenditure, while the latter was used to deflate income statistics so an analysis of income developments in real terms could be made.

1 Income distribution and income inequality

1 Income distribution and income inequality
Living conditions in Europe — 2018 edition8
Gross domestic product (GDP) is a measure of the total output of an economy; from the perspective of living conditions, GDP may also be calculated as the sum of primary incomes that are distributed by resident producer units (in the form of wages, rents, interest and profits). When a country’s population is taken into account, GDP per capita provides both a convenient measure of average incomes and of the living standards enjoyed by the inhabitants living in a specific economy, as well as (when adjusted to take account of price differences between countries — through the use of purchasing power parities (PPPs)) — a measure for comparisons of living standards across countries.
Nevertheless, GDP per capita is a relatively simple, aggregate measure and in order to have a more detailed picture of living conditions, it is pertinent to analyse the distribution (rather than average levels) of household income. A number of different statistical measures are available for this purpose, including household disposable income, in other words, the total income that households have at their disposal for spending or saving. While the aggregated level of household disposable income is available from national accounts and might be used for a general analysis of the household sector, this indicator also lacks any distributional dimension and it is therefore preferable to base any analysis of income distributions on micro data sources, in other words, statistical surveys for a representative sample of actual households, rather than aggregate macroeconomic measures. Such surveys allow an analysis of median income levels or the distribution of income across socio-economic strata of the population.
In order to take into account differences in household size and composition and thus enable comparisons of income levels, the concept of equivalised disposable income may be used. It is based on expressing total (net) household income in relation to the number of ‘equivalent adults’, using a standard
(equivalence) scale — Eurostat uses a ‘modified OECD scale’ — which gives a weight to each member of a household (and then adds these up to arrive at an equivalised household size), taking into account the number of persons in each household and the age of its members (more details are provided in the glossary). Total disposable household income, derived as the sum of the income received by every member of the household and by the household as a whole, is divided by the equivalised household size to determine the equivalised disposable income attributed to each household member.
The median of the equivalised disposable income distribution is typically used in the European Union (EU) as a key measure for analysing standards of living within each economy. It is simply the income level that divides the population into two groups of equal size: one encompassing half the population with a level of disposable income above the median, and the other half with a level of disposable income below the median. The use of the median (in contrast to the arithmetic mean) avoids any potential distortion that may be caused by the existence of extreme values, such as a few extremely rich households that may raise the arithmetic mean.
In 2016, median equivalised net income varied considerably across the EU Member States, ranging from PPS 4 720 in Romania to PPS 29 285 in Luxembourg, the EU-28 average was PPS 16 468; note, these figures have been converted into purchasing power standards (PPS) — a unit that takes account of price level differences between countries.
Median equivalised net income fell, in real terms, in 4 out of the 25 EU Member States for which data are available in 2016 (no data for Ireland, Italy or Luxembourg) — they were Bulgaria, Finland, Greece and Malta.
Across all 28 EU Member States, the top 20 % of the population with the highest incomes (the

1Income distribution and income inequality
Living conditions in Europe — 2018 edition 9
top quintile) accounted for at least one third of total income, a share that rose to 44.2 % in Bulgaria in 2016. By contrast, the bottom 20 % of the population with the lowest incomes together accounted for less than one tenth of all income, except in the Czech Republic (10.1 %), their share falling to 5.5 % in Romania.
The S80/S20 income quintile share ratio is based on a comparison of the income received by the top quintile and that received by the bottom quintile, while the Gini coefficient measures the extent to which the distribution of income differs between a utopian distribution (where each member of the population has exactly the same income) and perfect inequality (where a single person receives all of the income).
On the basis of the Gini coefficient, Bulgaria and Lithuania experienced the highest levels of inequality in 2016; note that even higher coefficients were recorded in Turkey and Serbia. The lowest levels of income inequality, using this measure, were recorded in Slovakia, Slovenia and the Czech Republic; note that an even lower Gini coefficient was recorded in Iceland, while Norway also recorded a relatively low coefficient.
Income inequality may be analysed across different age groups. The EU-28 income quintile share ratio for elderly people (defined here as those aged 65 and over) was lower — at 4.1 in 2016 — than the average ratio for the whole population (5.2). This pattern was repeated across all of the EU Member States, except for France; income distribution among the elderly
was also relatively unequal (compared with the average for the whole population) in Iceland (2015 data) and Switzerland.
Social transfers, the main instrument for the realisation of welfare policies, play a major role in some countries by helping to reduce income inequalities. In 2016, social transfers reduced income inequality among the EU-28 population: the Gini coefficient for income (including pensions) was 51.6 before social transfers and fell to 30.8 after taking account of these transfers.
1.1 Income distribution
Median disposable income in the EU‑28 was PPS 16 468
In 2016, median equivalised net disposable income (hereafter referred to as median disposable income) averaged PPS 16 468 in the EU-28. Across the EU Member States, it ranged from PPS 29 285 in Luxembourg (2015 data) to PPS 4 720 in Romania.
Map 1.1 reveals a clear geographical divide, insofar as the highest levels of median disposable income were generally recorded in western and Nordic Member States, although the level of income was also above the EU-28 average in Malta. By contrast, median disposable incomes were generally lower in southern Europe, while the lowest levels of income were recorded in eastern Europe and the Baltic Member States.
1 Income distribution and income inequality
Living conditions in Europe — 2018 edition10
Map 1.1: Median equivalised net income, 2016(PPS)
Administrative boundaries: © EuroGeographics © UN-FAO © Turkstat
Note: Ireland, Italy, Luxembourg, Iceland, the former Yugoslav Republic of Macedonia and Turkey, 2015. Romania: provisional.
Median equivalised net income, 2016(PPS)
0 200 400 600 800 km
Guadeloupe (FR)
0 25
Martinique (FR)
0 20
Guyane (FR)
0 100
Réunion (FR)
0 20
Açores (PT)
0 50
Madeira (PT)
0 20
Canarias (ES)
0 100
Malta
0 10
Liechtenstein
0 5
Cartography: Eurostat — GISCO, 05/2018
Source: Eurostat (online data code: ilc_di03)
Mayotte (FR)
0 15
(PPS)EU-28 = 16 468
< 10 00010 000 – < 16 50016 500 – < 23 000>= 23 000Data not available
Note: Ireland, Italy, Luxembourg, Iceland, the former Yugoslav Republic of Macedonia and Turkey, 2015. Romania: provisional.
Source: Eurostat (online data code: ilc_di03)

1Income distribution and income inequality
Living conditions in Europe — 2018 edition 11
Figure 1.1: Median equivalised net income by educational level, 2016(PPS)
0
10 000
20 000
30 000
40 000
50 000
EU-2
8
Luxe
mbo
urg
(1)Au
stria
Den
mar
kSw
eden
Germ
any
Belg
ium
Net
herla
nds
Fran
ceFi
nlan
dUn
ited
King
dom
Irela
nd (1
)M
alta
Cypr
usIta
ly (1
)Sl
oven
iaSp
ain
Czec
h Re
publ
icEs
toni
aSl
ovak
iaPo
rtug
alPo
land
Lith
uani
aLa
tvia
Croa
tiaGr
eece
Hung
ary
Bulg
aria
Rom
ania
(2)
Nor
way
Switz
erla
ndIc
elan
d (1)
Turk
ey (1
)Se
rbia
Form
. Yug
. Rep
. of M
aced
onia
(1)
High (ISCED levels 5-8) Medium (ISCED levels 3-4 ) Low (ISCED levels 0-2)Note: refers to the population aged 18-64. Ranked on the median equivalised net income for the population aged 18-64.
(1) 2015.(2) Provisional.
Source: Eurostat (online data codes: ilc_di03 and ilc_di08)
Among the population aged 18-64 years, those persons with a tertiary education degree (ISCED levels 5-8) consistently recorded higher levels of median disposable income than those persons who had completed either a lower (ISCED levels 0-2) or medium (ISCED levels 3-4) level of educational attainment (see Figure 1.1).
In 2016, EU-28 median disposable income was almost 80 % higher for people with a high level of educational attainment (PPS 23 161) when compared with the level of income for people with a low level of educational attainment (PPS 12 975). The largest income gaps between persons with low and high levels of educational attainment were recorded in Luxembourg (2015 data), Belgium, Germany and Malta; this was also
the case in Switzerland. By contrast, the gap in income levels between those people with high and low levels of educational attainment was considerably less in Slovakia, Romania, Greece and Denmark; this was also the case in Iceland (2015 data), the former Yugoslav Republic of Macedonia and Serbia.
CHANGES IN MEDIAN DISPOSABLE INCOME OVER TIME
The EU-28’s median disposable income in nominal terms (in other words, without adjusting for inflation) rose by 2.0 % between 2015 and 2016 (see Table 1.1). There were three EU Member States where disposable incomes fell between

1 Income distribution and income inequality
Living conditions in Europe — 2018 edition12
Table 1.1: Median equivalised net income in national currency terms before and after adjusting for inflation, 2015 and 2016
Currency
Median equivalised net income Harmonised index of consumer prices (HICP)
Median equivalised net income,
change in real terms, 2015-2016
2015 2016
Change in nominal
terms, 2015-2016
2016
Annual average rate
of change, 2015-2016
(national currency) (%) (2015 = 100) (%) (%)EU‑28 EUR 16 138 16 468 2.0 100.3 0.3 1.8 Belgium EUR 21 654 22 295 3.0 101.8 1.8 1.2 Bulgaria (1) BGN 6 516 6 163 − 5.4 98.7 − 1.3 − 4.2 Czech Republic CZK 204 395 213 812 4.6 100.7 0.7 3.9 Denmark DKK 211 450 213 803 1.1 100.0 0.0 1.1 Germany EUR 20 668 21 275 2.9 100.4 0.4 2.5 Estonia EUR 7 889 8 645 9.6 100.8 0.8 8.7 Ireland EUR 21 688 : : 99.8 − 0.2 : Greece EUR 7 520 7 500 − 0.3 100.0 0.0 − 0.3 Spain EUR 13 352 13 681 2.5 99.7 − 0.3 2.8 France EUR 21 415 21 713 1.4 100.3 0.3 1.1 Croatia HRK 41 632 43 593 4.7 99.4 − 0.6 5.4 Italy EUR 15 846 : : 99.9 − 0.1 : Cyprus EUR 13 793 14 020 1.6 98.8 − 1.2 2.9 Latvia LVL 5 828 6 365 9.2 100.1 0.1 9.1 Lithuania LTL 5 180 5 645 9.0 100.7 0.7 8.2 Luxembourg EUR 35 270 : : 100.0 0.0 : Hungary HUF 1 406 568 1 478 006 5.1 100.5 0.5 4.6 Malta EUR 13 493 13 572 0.6 100.9 0.9 − 0.3 Netherlands (1) EUR 21 292 22 733 6.8 100.1 0.1 6.7 Austria EUR 23 260 23 694 1.9 101.0 1.0 0.9 Poland PLN 23 247 24 618 5.9 99.8 − 0.2 6.1 Portugal EUR 8 435 8 782 4.1 100.6 0.6 3.5 Romania RON 10 287 10 884 5.8 98.9 − 1.1 6.9 Slovenia EUR 12 332 12 327 0.0 99.9 − 0.2 0.1 Slovakia EUR 6 930 6 951 0.3 99.5 − 0.5 0.8 Finland EUR 23 763 23 650 − 0.5 100.4 0.4 − 0.9 Sweden SEK 230 248 235 373 2.2 101.1 1.1 1.1 United Kingdom GBP 16 951 17 321 2.2 100.7 0.7 1.5 Iceland ISK 3 669 616 : : 100.8 0.8 : Norway NOK 346 569 354 161 2.2 103.9 3.9 − 1.6 Switzerland CHF 48 081 47 258 − 1.7 99.5 − 0.5 − 1.2 Former Yugoslav Republic of Macedonia (2) MKD 130 603 : : 99.8 − 0.2 :
Serbia (2) RSD 298 402 308 320 3.3 101.3 1.3 2.0 Turkey (2) TRY 9 841 : : 107.7 7.7 :
(1) Median equivalised net income: break in series.(2) Harmonised index of consumer prices: definition differs.
Source: Eurostat (online data codes: ilc_di03, prc_hicp_aind and cpc_ecprice)

1Income distribution and income inequality
Living conditions in Europe — 2018 edition 13
Figure 1.2: Real change in median equivalised net income in national currency terms, 2015‑2016(%)
−5.0
−2.5
0.0
2.5
5.0
7.5
10.0
EU-2
8 (1)
Latv
iaEs
toni
aLi
thua
nia
Irela
nd (2
)Ro
man
ia (3
)N
ethe
rland
s (4)
Pola
ndCr
oatia
Hung
ary
Czec
h Re
publ
icPo
rtug
alCy
prus
Spai
nLu
xem
bour
g (2)
Germ
any
Unite
d Ki
ngdo
mBe
lgiu
mD
enm
ark
Fran
ceSw
eden
Aust
riaSl
ovak
iaIta
ly (2
)Sl
oven
iaGr
eece
Mal
taFi
nlan
dBu
lgar
ia (4
)
Icel
and
(2)Sw
itzer
land
Nor
way
Form
. Yug
. Rep
. of M
aced
onia
(2)(5
)Tu
rkey
(2)(5
)Se
rbia
(5)
(1) Estimate.(2) 2014-2015.(3) Provisional.
(4) Break in series.(5) Harmonised index of consumer prices: definition differs.
Source: Eurostat (online data codes: ilc_di03, prc_hicp_aind and cpc_ecprice)
2015 and 2016; note there is no data available for Ireland, Italy or Luxembourg. The largest reduction was recorded in Bulgaria (− 5.4 %), while relatively small declines were observed for Finland (− 0.5 %) and Greece (− 0.3 %). On the other hand, median disposable incomes rose at a rapid pace in the Baltic Member States: they increased by 9.0 % in Lithuania, by 9.2 % in Latvia and this growth rate peaked at 9.6 % in Estonia.
Median disposable incomes fell in real terms in four of the EU Member States between 2015 and 2016
After adjusting for inflation (using the harmonised indices of consumer prices (HICP)), the development of median disposable incomes between 2015 and 2016 was relatively similar (which may reflect the historically low levels of inflation recorded during
the period under consideration). Indeed, median disposable incomes rose in the EU-28 by 1.8 % in real terms (compared with a 2.0 % increase in nominal terms).
Median disposable incomes fell, in real terms, in 4 of the 25 EU Member States for which data are available (see Figure 1.2). The largest reduction among the EU Member States occurred in Bulgaria (− 4.2 %), while the declines observed in Finland, Malta and Greece were all relatively small (less than 1.0 %); disposable incomes also fell in Norway (− 1.6 %) and Switzerland (− 1.2 %).
The highest increases in real disposable incomes between 2015 and 2016 were recorded in the three Baltic Member States — Latvia (9.1 %), Estonia (8.7 %) and Lithuania (8.2 %), followed by Romania (6.9 %), the Netherlands (6.7 %) and Poland (6.1 %).

1 Income distribution and income inequality
Living conditions in Europe — 2018 edition14
Figure 1.3: Share of national net disposable income for the first and fifth income quintiles, 2011 and 2016(%)
0 5
10 15 20 25 30 35 40 45 50
EU-2
8
Belg
ium
Bulg
aria
(1)
Czec
h Re
publ
icD
enm
ark
Germ
any
Esto
nia
(1)Ire
land
(2)
Gree
ceSp
ain
Fran
ceCr
oatia
Italy
(2)
Cypr
usLa
tvia
Lith
uani
aLu
xem
bour
g (2)
Hung
ary
Mal
taN
ethe
rland
s (1)
Aust
riaPo
land
Port
ugal
Rom
ania
(3)
Slov
enia
Slov
akia
Finl
and
Swed
en (1
)Un
ited
King
dom
(1)
Icel
and
(2)N
orw
aySw
itzer
land
(1)
F orm
. Yug
. Rep
. of M
aced
onia
(2)(4
)Se
rbia
(5)
Turk
ey (2
)
First quintile 2011 Fifth quintile 2011First quintile 2016 Fifth quintile 2016
(1) Break in series.(2) 2015 instead of 2016.(3) Provisional.
(4) 2012 instead of 2011.(5) 2013 instead of 2011.
Source: Eurostat (online data code: ilc_di01)
A more detailed analysis that focuses on income distribution is presented in Figure 1.3. It is based on ordering the disposable incomes of individuals and then dividing these into quintiles (fifths), in other words, the top 20 % of the population with the highest incomes (referred to as the top or fifth income quintile) down to the 20 % of the population with the lowest incomes (referred to as the bottom or first income quintile).
The top 20 % of earners in the EU‑28 together shared almost two fifths of the total disposable income
In 2016, some 38.5 % of the total disposable income in the EU-28 could be attributed to people in the top 20 % of the income distribution, while people in the bottom quintile of the income distribution received a 7.7 % share of total disposable income (see Figure 1.3).
The top 20 % of highest earners in Cyprus, Greece, Spain, Latvia, Portugal, Lithuania and Bulgaria together received more than 40.0 % of the total disposable income within their respective economies in 2016. In the majority of the remaining EU Member States, the share of the top 20 % of highest earners was within the range of 35.0 %- 40.0 %, although this fell to 34.0 % in Slovenia and 33.7 % in Slovakia; a comparable share (33.7 %) was also recorded in Iceland (2015 data).
At the other end of the income scale, people in the bottom quintile of the income distribution received less than 7.7 % (which was the EU-28 average) of total disposable income in five southern EU Member States — Croatia, Portugal, Italy (2015 data), Greece and Spain — the three Baltic Member States, Bulgaria and Romania. Only the Czech Republic reported a share in double-digits (10.1 %).

1Income distribution and income inequality
Living conditions in Europe — 2018 edition 15
Figure 1.4: Share of equivalised income by income quintile, 2016(%)
0
25
50
75
100
EU-2
8
Belg
ium
Bulg
aria
Czec
h Re
publ
icD
enm
ark
Germ
any
Esto
nia
Irela
nd (1
)Gr
eece
Spai
nFr
ance
Croa
tiaIta
ly (1
)Cy
prus
Latv
iaLi
thua
nia
Luxe
mbo
urg
(1)Hu
ngar
yM
alta
Net
herla
nds
Aust
riaPo
land
Port
ugal
Rom
ania
(2)
Slov
enia
Slov
akia
Finl
and
Swed
enUn
ited
King
dom
Icel
and
(1)N
orw
aySw
itzer
land
F orm
. Yug
. Rep
. of M
aced
onia
(1)
Serb
iaTu
rkey
(1)
First quintile Second quintile Third quintile
Fourth quintile Fifth quintile
(1) 2015.(2) Provisional.
Source: Eurostat (online data code: ilc_di01)
The share of total disposable income attributed to the bottom and top income quintiles declined between 2011 and 2016
Between 2011 and 2016, the share of EU-28 disposable income that was accounted for by the bottom and top income quintiles fell: the share of total income accounted for by those people with the lowest incomes fell from 7.9 % to 7.7%, while that accounted for by the top earners fell from 38.8 % to 38.5 %. A closer analysis of the other income quintiles reveals that people in the third and fourth income quintiles received a higher proportion of the EU-28’s total disposable income during the period under consideration (both shares rose by 0.2 percentage points).
There were 16 EU Member States that reported a falling share of total disposable income being attributed to the lowest income quintile over the
period 2011-2016; note that the data for Ireland, Italy and Luxembourg refers to 2011-2015. By contrast, there were eight Member States where the share of the lowest income quintile rose and four where it remained unchanged. The biggest declines were recorded in Romania and Sweden, where the share of the bottom income quintile in total disposable income fell by 0.9 percentage points, followed by Bulgaria and Luxembourg (− 0.8 points). The biggest gains were recorded in Croatia, as the share of disposable income attributed to the bottom income quintile rose by 0.6 points; a much larger change was recorded in the former Yugoslav Republic of Macedonia, where the share of the bottom income quintile rose by 1.8 points (2012-2015).
At the other end of the spectrum, there were 12 EU Member States where the share of
1 Income distribution and income inequality
Living conditions in Europe — 2018 edition16
disposable income attributed to the top income quintile fell between 2011 and 2016, while the share of disposable income accounted for by the top income quintile rose in 15 Member States; it remained unchanged in Finland. The share of disposable income accounted for by the top income quintile rose by more than 2.0 percentage points in Sweden, Cyprus and Bulgaria, with a peak of 3.2 points recorded in Lithuania. By contrast, the share of the top income quintile fell by more than 1.0 percentage points in Croatia, Poland, France and Slovakia, with the biggest decline recorded in the United Kingdom (− 1.6 points).
INCOME MOBILITY
This next section analyses the share of the population who experience fluctuations in their economic well-being from one year to the next, by studying the proportion of people that move up/down the income ladder receiving a higher or lower level of income.
The analysis is based on how people’s disposable income moves over a three-year period in relation to a set of income deciles — these are similar to income quintiles but instead of ranking the disposable incomes of individuals and then dividing these into fifths, the ranking is divided into tenths; as such, the highest decile refers to the top 10 % of the population with the highest incomes. It is important to note that upward or downward income transitions may occur as a result of direct changes in an individual’s financial situation (more or less income), but may also result from aggregate changes across the whole economy; for example, an individual may see their income frozen, while there is a more general increase in incomes across the remainder of the population and as a result that individual may move to a lower income decile (even if their income remains unchanged). It is also important to consider that these measures of income mobility reflect not only changes in income but also other dynamic aspects of labour markets
(such as the demand for labour, unemployment levels, flexible working patterns, job (in)security, etc.) as well as changes in family composition — given the indicator is based on equivalised disposable income attributed to each household member.
These remarks notwithstanding, around 15 % of the EU-28 population moved either upwards or downwards on the income ladder by more than one income decile during the three-year period prior to 2016 (see Table 1.2).
Among the EU Member States, more than one fifth (20.9 %) of the population in Estonia made an upward transition of more than one income decile in the three years prior to 2016, while an even higher share was recorded in Ireland (21.8 %; latest data covers the three years prior to 2015). By contrast, in the three years prior to 2016, at least one fifth of the population in Greece (21.5 %), Slovakia (21.1 %) and Lithuania (20.0 %) experienced a downward transition of more than one income decile.
Income mobility appeared to slow
When considering developments over time and comparing results for 2011 with those for 2016, it was commonplace to find that both upward and downward income mobility was reduced. Upward income mobility affected 17.8 % of the EU-28 population in 2011, a share that had fallen to 15.2 % by 2016. In a similar vein, the share of the EU-28 affected by downward income transitions was 17.2 % in 2011, a share that had fallen to 14.6 % by 2016. Upward income mobility was reduced at a particularly fast pace in Lithuania (2011-2015), Latvia, Ireland (2011-2015) and Bulgaria, while downward income mobility was reduced at a relatively fast pace in Romania (2011-2015), Ireland (2011-2015) and Latvia.
There were relatively few examples of higher degrees of income mobility in 2015/2016 (compared with 2011). This may reflect, at least to some degree, the impact of the global financial and economic crisis for the earlier

1Income distribution and income inequality
Living conditions in Europe — 2018 edition 17
Table 1.2: Share of the population with an upward/downward transition of more than one income decile during the three years prior to the survey, 2011‑2016(%)
Upward transition of more than one income decile
Downward transition of more than one income decile
2011 2012 2013 2014 2015 2016 2011 2012 2013 2014 2015 2016EU‑28 17.8 17.1 16.6 16.7 15.9 15.2 17.2 16.7 16.4 16.1 15.4 14.6 Belgium 18.0 16.7 18.6 16.4 15.8 17.0 16.6 14.9 18.2 15.6 14.1 14.3 Bulgaria (1) 22.5 20.8 19.4 20.2 18.3 17.0 20.6 20.3 18.3 17.8 17.5 19.0 Czech Republic 21.7 16.4 18.6 18.5 18.9 17.0 20.4 18.7 18.4 18.3 18.0 15.6 Denmark 15.0 17.1 17.4 16.8 16.1 13.7 15.2 16.8 19.5 14.3 13.4 12.9 Germany 15.8 16.3 14.6 16.6 14.3 13.0 15.6 14.9 15.9 15.4 14.4 13.3 Estonia (2) 21.8 16.3 21.2 20.4 21.2 20.9 20.7 19.0 20.5 18.1 18.7 19.6 Ireland 28.1 16.3 16.8 17.9 21.8 : 24.4 14.9 21.6 16.1 17.8 : Greece 22.3 21.2 23.5 22.2 18.1 : 21.0 22.6 21.5 21.3 21.5 : Spain 16.9 16.1 16.1 15.6 13.1 15.1 16.9 16.0 16.1 14.9 15.0 15.4 France 15.9 15.7 14.4 15.1 14.9 14.4 15.5 14.8 14.0 15.4 15.0 12.8 Croatia : : 18.2 18.7 19.4 18.4 : : 18.0 16.0 18.2 17.5 Italy 17.2 17.1 16.9 14.5 14.8 : 17.2 16.1 16.8 15.0 14.0 : Cyprus 14.9 18.6 13.7 16.6 15.6 15.0 15.3 15.8 14.8 15.9 14.9 16.7 Latvia (3) 24.5 20.4 19.7 21.5 16.8 17.8 23.4 20.9 20.0 21.4 18.9 18.1 Lithuania 25.0 19.8 21.3 18.5 17.3 : 23.7 17.6 18.1 16.4 20.0 : Luxembourg 16.7 16.1 16.6 16.7 15.4 : 16.8 15.6 16.2 15.9 12.5 : Hungary 19.2 19.0 19.2 18.6 17.8 19.6 20.2 17.6 17.8 18.7 18.9 18.3 Malta 17.9 17.3 18.4 16.3 17.0 17.8 18.0 17.6 18.2 15.2 16.8 16.1 Netherlands (1) 13.7 13.8 12.5 13.1 12.1 14.4 12.4 14.8 14.2 11.7 9.9 13.0 Austria 18.6 18.1 18.2 15.2 17.0 18.8 15.7 16.5 15.5 15.3 16.5 17.8 Poland 21.5 19.4 18.4 19.2 19.8 19.9 20.5 19.1 18.0 17.4 17.2 19.1 Portugal 16.9 17.7 16.8 16.8 15.2 14.5 17.2 15.6 16.9 14.9 15.1 14.9 Romania 14.3 11.9 11.8 11.0 11.3 : 14.2 11.3 9.6 7.7 6.7 : Slovenia 14.3 13.5 14.6 13.6 14.8 13.3 14.7 14.0 13.6 13.9 13.7 13.7 Slovakia 19.0 20.3 18.6 19.8 19.3 : 19.2 17.4 18.3 19.1 21.1 : Finland 14.4 15.1 15.0 14.7 15.7 : 13.9 17.4 15.1 13.6 14.9 : Sweden (4) 16.6 15.6 17.2 16.3 14.5 17.6 16.5 15.6 14.9 15.8 13.4 16.2 United Kingdom 20.7 20.6 19.7 21.1 19.7 : 19.0 21.7 18.9 21.8 19.2 : Iceland 21.9 22.5 21.4 22.3 23.4 : 19.6 21.6 21.7 19.7 19.0 : Norway 15.7 15.8 14.5 16.2 16.5 17.3 15.2 15.8 14.7 15.1 15.1 16.6 Switzerland : : 19.0 19.9 17.7 17.0 : : 17.8 18.9 17.7 16.4 Former Yugoslav Republic of Macedonia : : 23.7 19.6 20.9 : : : 22.1 21.0 22.2 :
Serbia : : : : : 21.0 : : : : : 19.5 Turkey : : : 19.1 19.1 : : : : 19.4 18.1 :
Note: refers to the share the population having moved more than one income decile during the three year period prior to the reference period shown.
(1) 2016: break in series.(2) 2014: break in series.
(3) 2012: break in series.(4) 2012 and 2015: break in series.
Source: Eurostat (online data code: ilc_di30c)

1 Income distribution and income inequality
Living conditions in Europe — 2018 edition18
reference period, with a higher share of the population exposed to fluctuating income levels during the crisis. That said, the share of the population who moved upward by more than one income decile (during the three years prior to the survey) rose by at least 1.0 percentage points in Finland (1.3 points; 2011-2015) and Sweden (1.0 points; 2011-2016). There were also several examples where a growing share of the population was exposed to the risk of falling incomes between 2011 and 2016. Some 17.8 % of the population in Austria reported a downward transition of more than one income decile during the three years prior to the survey in 2016; this was 2.1 percentage points higher than the corresponding share from 2011 (15.7 %). Similar results were recorded for Slovakia — where the share of the population experiencing a downward transition grew by 1.9 points (2011-2015) — Cyprus (up 1.4 points) and Finland (up 1.0 points; 2011-2015).
IMPACT OF SOCIAL TRANSFERS ON INCOME
This next section compares the situation for disposable income before and after social transfers to assess the impact and redistributive effects of welfare policies. These transfers cover assistance that is given by central, state or local institutional units and include, among others, pensions, unemployment benefits, sickness and invalidity benefits, housing allowances, social assistance and tax rebates.
Social transfers led to median disposable income in the EU‑28 rising by PPS 4 821
Figure 1.5 shows the overall impact of social transfers; this information is split between transfers for pensions and other transfers, for example, social security benefits and social assistance that have the aim of alleviating or reducing the risk of poverty.
In 2016, median disposable income in the EU-28 was PPS 4 821 higher as a result of social transfers
when taking account of pensions, and was PPS 1 327 higher if pensions are excluded from the analysis.
Among the EU Member States, there were considerable variations in the contribution made by social transfers to median disposable income in 2016. The largest transfers were observed in Luxembourg (2015 data), where social transfers (including pensions) raised the median disposable income of the population from PPS 19 666 to PPS 29 285, in other words, by PPS 9 619. Social transfers (including pensions) were also relatively high in Austria (PPS 7 206), France (PPS 6 429), Sweden (PPS 6 275), as well as in Norway (PPS 7 130).
A somewhat different pattern emerges if pensions are excluded from the analysis: in 2016, the highest social transfers (excluding pensions) were recorded in Sweden (PPS 2 929), Luxembourg (PPS 2 916; 2015 data) and Ireland (PPS 2 833; 2015 data).
It is interesting to compare the level of social transfers across the EU Member States including and excluding pensions. In Denmark and Estonia, social transfers including pensions were 1.9 times as high as social transfers excluding pensions in 2016. However, in Greece the same ratio was much higher, as the value of social transfers including pensions was 9.2 times as high as social transfers excluding pensions; the next highest ratios were recorded in Romania and Poland (where transfers including pensions were more than six times as high as transfers excluding pensions).
Social transfers were often targeted at nuclear families
Across the EU-28, median disposable income before social transfers was higher (PPS 13 815 in 2016) for persons living in nuclear households comprising two or more adults without dependent children than for the other two types of household that are shown in Table 1.3 (PPS 10 141 for those living in a household with

1Income distribution and income inequality
Living conditions in Europe — 2018 edition 19
Figure 1.5: Contribution of social transfers to median equivalised net income, 2016(PPS)
0
2 000
4 000
6 000
8 000
10 000
EU-2
8
Luxe
mbo
urg
(1)Au
stria
Fran
ceSw
eden
Germ
any
Belg
ium
Irela
nd (1
)Fi
nlan
dSp
ain
Italy
(1)
Unite
d Ki
ngdo
mD
enm
ark
Slov
enia
Gree
ceN
ethe
rland
sCy
prus
Port
ugal
Pola
ndM
alta
Hung
ary
Croa
tiaSl
ovak
iaEs
toni
aCz
ech
Repu
blic
Lith
uani
aBu
lgar
iaLa
tvia
Rom
ania
(2)
Nor
way
Switz
erla
ndIc
elan
d (1)
Serb
iaTu
rkey
(1)
Form
. Yug
. Rep
. of M
aced
onia
(1)
Social transfers including pensions Social transfers excluding pensions
(1) 2015.(2) Provisional.
Source: Eurostat (online data codes: ilc_di03, ilc_di13 and ilc_di14)
two or more adults with dependent children and was PPS 8 487 for those living in households composed of a single person with dependent children); note this analysis includes pensions.
This pattern held across each of the EU Member States, except for Slovakia, where those living in households with two or more adults with dependent children had a slightly higher level of disposable income (PPS 8 212 in 2016) than those living in households composed of two or more adults without dependent children (where median disposable income was PPS 24 lower).
The impact of social transfers was considerable, as the level of median disposable income for those living in EU-28 households composed of two or more adults rose to PPS 18 492 in 2016, some 82.3 % higher than before social transfers (PPS 10 141). For comparison, social transfers led to a 55.1 % increase in the median disposable income of those people living in households
composed of a single person with dependent children, while the impact of social transfers was considerably lower for those people living in households composed of two or more adults without dependent children (up 15.0 %).
The redistributive impact of social transfers generally resulted in the highest levels of median disposable income being recorded for those people living in households that were composed of two or more adults with dependent children. This pattern held across all but five of the EU Member States in 2016; the only exceptions were Denmark, Estonia, Latvia, Cyprus and Belgium — where the highest levels of median disposable income were recorded by people living in households composed of two or more adults without dependent children.
A comparison of median disposable income before and after social transfers reveals that most governments chose to direct the greatest share

1 Income distribution and income inequality
Living conditions in Europe — 2018 edition20
Table 1.3: Median equivalised net income before and after social transfers by household type, 2016(PPS)
Before social transfers After social transfers
Single adult with dependent
children
Two or more adults with dependent
children
Two or more adults
without dependent
children
Single adult with dependent
children
Two or more adults with dependent
children
Two or more adults
without dependent
childrenEU-28 8 487 10 141 13 815 13 165 18 492 15 887 Belgium 9 248 9 742 19 607 13 594 22 264 22 444 Bulgaria 3 589 4 747 5 239 4 249 7 910 6 513 Czech Republic 7 471 8 754 11 617 8 513 13 507 12 954 Denmark 14 585 12 222 22 051 16 960 21 824 23 521 Germany 10 921 13 867 18 746 15 021 23 197 21 915 Estonia 7 745 8 959 10 839 9 307 12 486 13 025 Ireland (1) 2 757 11 082 14 830 12 006 20 259 18 036 Greece 5 584 2 819 6 607 6 861 9 592 8 070 Spain 8 891 7 975 12 201 10 487 16 720 14 297 France 10 076 10 160 17 972 14 197 23 041 20 578 Croatia 5 085 5 171 7 174 7 124 9 505 8 776 Italy (1) 10 700 7 801 12 593 12 269 16 979 14 561 Cyprus 8 840 9 054 14 246 12 231 15 985 16 605 Latvia 5 035 6 553 8 474 6 813 9 658 10 036 Lithuania 5 392 7 254 8 289 6 564 11 001 9 943 Luxembourg (1) 12 636 17 692 22 631 18 403 33 613 27 588 Hungary 3 885 5 470 6 057 5 827 9 586 8 020 Malta 7 373 12 813 15 789 11 660 18 361 17 177 Netherlands 10 235 14 156 20 485 15 640 23 079 21 871 Austria 11 372 15 260 17 047 16 418 26 180 20 991 Poland 6 447 6 714 8 586 8 054 12 021 10 396 Portugal 6 947 4 264 9 278 8 063 11 614 10 536 Romania 2 508 3 097 3 254 3 169 5 841 4 287 Slovenia 10 282 8 010 13 849 12 460 16 513 16 034 Slovakia 6 689 8 212 8 188 7 571 12 110 9 786 Finland 10 663 12 166 17 890 15 282 22 431 20 824 Sweden 11 714 13 223 17 970 14 879 24 313 21 705 United Kingdom 3 635 14 238 15 472 11 891 20 997 17 051 Iceland (1) 10 715 18 393 18 591 15 323 23 324 20 433 Norway 15 180 19 332 25 852 19 741 33 807 29 661 Switzerland 16 566 21 506 22 483 21 485 31 181 25 362 Former Yugoslav Republic of Macedonia (1) 3 133 3 434 3 480 3 349 5 685 4 179
Serbia 2 611 2 207 3 358 4 284 5 957 4 918 Turkey (1) 3 983 4 426 4 176 5 359 7 908 4 993
(1) 2015,
Source: Eurostat (online data codes: ilc_di04 and ilc_di13b)

1Income distribution and income inequality
Living conditions in Europe — 2018 edition 21
of their support — in the form of social transfers — towards households with two or more adults and dependent children. For example, the median disposable income among those people living in this type of household in Greece rose from PPS 2 819 to PPS 9 592 as a result of social transfers (an increase of 240 %). Social transfers also resulted in median disposable incomes more than doubling among for those people living in households with two or more adults and dependent children in Portugal, Belgium, France, Italy (2015 data), Spain and Slovenia.
In Ireland, the United Kingdom and Malta social transfers were targeted more towards single‑parent households
There were three exceptions to this pattern, where impact of social transfers was felt more by those people living in households composed of a single person with dependent children. For example, median disposable income in Ireland rose by 335 % in 2015 as a result of social transfers for single-parent households (compared with an 83 % increase for people living in a household composed of two or more adults with dependent children, and a 22 % increase for people living in households with two or more adults without dependent children). The redistributive impact of social transfers was also felt most by single-parent households in the United Kingdom (where incomes rose by 227 % in 2016 as a result of social transfers) and Malta (up 58 %).
In absolute terms, the highest increases in income were recorded for people living in Luxembourg in a household with two or more adults with dependent children: they saw their income rise in 2015 by PPS 15 921 as a result of social transfers. There were also considerable increases in incomes for people living in this type of household in France, Belgium, Sweden, Austria and Finland, as social transfers resulted in median disposable income rising by in excess of PPS 10 000 in 2016.
Median disposable incomes for people living in single-parent households rose by PPS 9 249 as a result of social transfers in Ireland (2015 data) and by PPS 8 256 in the United Kingdom (2016 data).
1.2 Income inequalityAs noted above, while median disposable income provides a measure of average living standards, devoid of the potential distortion of aggregate measures such as GDP per capita, it still fails to offer a complete picture as it does not capture the distribution of income within the population and thereby does little to reflect economic inequalities.
THE GINI COEFFICIENT
The Gini coefficient is a leading indicator that is used to measure income inequality. The Gini coefficient may range from 0, corresponding to perfect equality (in other words, income is equally distributed among every individual in a given society) to 100, corresponding to perfect inequality (in other words, when all of the income is received by a single person); thus, a lower Gini coefficient reflects a more egalitarian distribution of income.
In 2016, the Gini coefficient for the EU-28 was 30.8. The highest income disparities among the EU Member States (with a Gini coefficient of at least 35.0 — as shown by the darkest blue shade in Map 1.2) were recorded in Bulgaria and Lithuania. A second group of countries, with a Gini coefficient above the EU-28 average (in the range of 31.0-34.9) comprised Romania, Spain, Latvia, Greece, Portugal, Estonia, Italy (2015 data), Cyprus and the United Kingdom. At the other end of the range, income was more evenly distributed in the Netherlands, Belgium, Finland, the Czech Republic, Slovenia and Slovakia, as well as Iceland and Norway, where the Gini coefficient was less than 27.0.

1 Income distribution and income inequality
Living conditions in Europe — 2018 edition22
Map 1.2: Gini coefficient for equivalised disposable income, 2016(%)
Administrative boundaries: © EuroGeographics © UN-FAO © Turkstat
Note: Ireland, Italy, Luxembourg, Iceland, the former Yugoslav Republic of Macedonia and Turkey, 2015. Romania: provisional.
Gini coefficient for equivalised disposable income, 2016(%)
0 200 400 600 800 km
Guadeloupe (FR)
0 25
Martinique (FR)
0 20
Guyane (FR)
0 100
Réunion (FR)
0 20
Açores (PT)
0 50
Madeira (PT)
0 20
Canarias (ES)
0 100
Malta
0 10
Liechtenstein
0 5
Cartography: Eurostat — GISCO, 05/2018
Source: Eurostat (online data code: ilc_di12)
Mayotte (FR)
0 15
(%)EU-28 = 30.8
< 27.027.0 – < 31.031.0 – < 35.0>= 35.0Data not available
Note: Ireland, Italy, Luxembourg, Iceland, the former Yugoslav Republic of Macedonia and Turkey, 2015. Romania: provisional.
Source: Eurostat (online data code: ilc_di12)

1Income distribution and income inequality
Living conditions in Europe — 2018 edition 23
Figure 1.6: Income quintile share ratio, 2016(ratio)
0
2
4
6
8
10
EU-2
8
Bulg
aria
Rom
ania
(1)
Lith
uani
aGr
eece
Spai
nLa
tvia
Port
ugal
Italy
(2)
Esto
nia
Unite
d Ki
ngdo
mCr
oatia
Luxe
mbo
urg
Cypr
usPo
land
Germ
any
Irela
nd (2
)Fr
ance
Hung
ary
Swed
enM
alta
Den
mar
kAu
stria
Net
herla
nds
Belg
ium
Slov
enia
Slov
akia
Finl
and
Czec
h Re
publ
ic
Switz
erla
ndN
orw
ayIc
elan
d (2)
Serb
iaTu
rkey
(2)
Form
. Yug
. Rep
. of M
aced
onia
(2)
Total population Aged 65 and over
Note: the income quintile share ratio (also referred to as the S80/S20 ratio) is calculated as the ratio of the total income received by the 20 % of the population with the highest incomes (the top quintile) compared with the total income received by the 20 % of the population with the lowest incomes (the bottom quintile).
(1) Provisional.(2) 2015.
Source: Eurostat (online data code: ilc_di11)
THE S80/S20 INCOME QUINTILE SHARE RATIO
Income inequalities within countries may also be illustrated through the income quintile share ratio, which is calculated as the ratio between the income received by the top quintile and the income received by the bottom quintile. High values for this ratio suggest that there are considerable disparities in the distribution of income between upper and lower income groups.
In 2016, the income quintile share ratio for the EU-28 was 5.2; this signifies that, on average, the income received by the top 20 % of the population with the highest incomes was more than five times as high as the income received by the 20 % of the population with the lowest incomes.
The income quintile share ratio ranged from a low of 3.5 in Czech Republic and 3.6 in Finland, Slovakia and Slovenia to a value of 6.0-7.0 in Latvia, Spain and Greece, rising to 7.1 in Lithuania, 7.2 in Romania and peaking at 7.9 in Bulgaria (see Figure 1.6).
The distribution of income was more often more equitable among the older generations
On the basis of the same measure, elderly people (aged 65 and over) in the EU-28 experienced less income inequality than the whole population, as their income quintile share ratio was 4.1 in 2016. This pattern of a more equitable distribution of income among the elderly (compared with the total population) was evident in the vast majority

1 Income distribution and income inequality
Living conditions in Europe — 2018 edition24
Figure 1.7: Gini coefficient for equivalised disposable income before and after social transfers, 2016(%)
0
10
20
30
40
50
60
70
EU-2
8
Gree
cePo
rtug
alSw
eden
Germ
any
Unite
d Ki
ngdo
mRo
man
ia (1
)Bu
lgar
iaLi
thua
nia
Hung
ary
Irela
nd (2
)Fr
ance
Spai
nD
enm
ark
Cypr
usBe
lgiu
mIta
ly (2
)Cr
oatia
Finl
and
Luxe
mbo
urg
(2)La
tvia
Aust
riaEs
toni
aPo
land
Net
herla
nds
Czec
h Re
publ
icM
alta
Slov
enia
Slov
akia
Switz
erla
ndN
orw
ayIc
elan
d (2)
Serb
iaTu
rkey
(2)
Form
. Yug
. Rep
. of M
aced
onia
(2)
Before social transfers Before social transfers (but after pensions) After social transfers
Note: ranked on the Gini coefficient for equivalised disposable income before social transfers (pensions included in social transfers).
(1) Provisional.(2) 2015.
Source: Eurostat (online data codes: ilc_di12, ilc_di12b and ilc_di12c)
of EU Member States, the only exceptions being France and Slovenia (where the ratio was identical), while income inequality was also slightly higher among the elderly in Switzerland.
IMPACT OF SOCIAL TRANSFERS ON INEQUALITIES
The effect of European welfare systems, in other words, pensions and other social transfers, in addressing income inequality can be demonstrated by comparing Gini coefficients before and after social transfers, to provide a
quantitative assessment of their redistributive impact.
In 2016, the EU-28 Gini coefficient for median disposable income before social transfers was 51.6, which fell to 30.8 after social transfers. The impact of pensions and other social transfers on income inequality was particularly large in Germany, Greece and Portugal — where the Gini coefficient fell by 26-27 points — while the largest impact was recorded in Sweden (where the coefficient was reduced by 30.1 points).

2 Effects of income on living conditions

2 Effects of income on living conditions
Living conditions in Europe — 2018 edition26
The European Union (EU) promotes smart, sustainable and inclusive growth to improve its competitiveness and productivity, underpinning its social market economy. However, the Europe 2020 strategy cannot be monitored solely through traditional macroeconomic measures: rather, a range of socio-economic aspects are also taken into account.
In recent years, Eurostat has invested considerable resources in developing a set of indicators that are designed to reach ‘Beyond GDP’, thereby providing a more inclusive analysis of economic, social and environmental aspects of progress. Indeed, economic indicators such as gross domestic product (GDP) were never designed to be comprehensive measures of prosperity and well-being. With this in mind a range of indicators have been developed which help to provide information to address global challenges for the 21st century — poverty, the quality of life, health, climate change or resource depletion. This chapter addresses poverty and its impact on living conditions.
The risk of poverty and social exclusion is not dependent strictly on a household’s level of income, but may also reflect joblessness, low work intensity, working status, or a range of socio-economic issues.
In 2016, an estimated 23.5 % of the EU-28 population — or some 118 million people — was at risk of poverty or social exclusion. This indicator is based on the number of persons who are (i) either at risk of poverty (as indicated by their disposable income); and/or (ii) face severe material deprivation (as gauged by their ability to purchase a set of predefined material items); and/or (iii) live in a household with very low work intensity.
The results presented in this chapter confirm that the risk of poverty or social exclusion was greater across the EU-28 among women (than men), young adults (rather than middle-aged persons or pensioners), and people with a low level of
educational attainment (rather than those with a tertiary level of educational attainment).
Almost half of the EU-28 population living in single person households with dependent children were at risk of poverty or social exclusion in 2016, while the risk of poverty or social exclusion also increased among those households inhabited by nuclear families with more than two children.
Working status is unsurprisingly one of the main socio-economic characteristics that impacts upon the risk of poverty or social exclusion. In 2016, while the risk of poverty or social exclusion in the EU-28 was 12.4 % for employed persons, this rose to just over two thirds (67.0 %) for those persons who were unemployed and stood at 42.9 % for other inactive persons (those who chose, for whatever reason, not to work).
The risk of poverty or social exclusion varies considerably between the EU Member States, but also within individual Member States. For example, in some Member States — predominantly in eastern or southern Europe — the risk of poverty or social exclusion was higher in rural areas than it was in urban areas (cities, or towns and suburbs), whereas in many western and northern Member States it was more common to find poverty or social exclusion concentrated in urban areas.
As already noted in the first chapter, social protection measures, such as social transfers, provide an important means for tackling monetary poverty: in 2016, social transfers reduced the EU-28 at-risk-of-poverty rate from 25.9 % (before social transfers, pensions excluded) to 17.3 %, bringing the rate down by 8.6 percentage points.
The persistent risk of poverty is considered an even greater problem — in much the same way as long-term unemployment — as it is inherently linked to a disproportionately higher risk of social exclusion. The persistent at-risk-of-poverty rate shows the proportion of people

2Effects of income on living conditions
Living conditions in Europe — 2018 edition 27
who were below the poverty threshold and had also been below the threshold for at least two of the three preceding years. This is of interest insofar as it allows a longitudinal analysis of whether the risk of poverty is transitory in nature (shared among various members of society) or whether it is a more structural phenomenon (whereby an unlucky few are found to be persistently poor). The persistent at-risk-of-poverty rate was more prevalent among the population living in single person households, particularly those with dependent children (many of these households are characterised by income levels that are persistently below the poverty threshold). On average, more than one fifth (21.9 %) of single-parent households in the EU-28 was at persistent risk of poverty in 2016.
Material deprivation, defined as the inability to afford a set of predefined material items that are considered by most people to be desirable or even necessary to lead an adequate quality of life, is a concept that may be used to complement a relative analysis of monetary poverty by providing information on absolute poverty. In 2016, close to one sixth (15.7 %) of the EU-28 population could not afford three or more out of nine standard deprivation items — 8.2 % of the population could not afford three items, while 7.5 % could not afford four or more items (severe material deprivation).
A more detailed analysis for the individual items that are used to determine material deprivation reveals, for instance, that among those at risk of poverty in the EU-28 in 2016, some 21.3 % were also unable to afford a decent meal every second day, while almost two thirds (65.2 %) of those living in single person households
with dependent children were unable to face unexpected financial expenses.
2.1 Poverty and social exclusionInclusive growth is one of three priorities of the Europe 2020 strategy (the other two concern smart and sustainable growth). In 2010, when this strategy was officially adopted, the European Council decided to set a headline target for social inclusion in the EU, namely, to lift at least 20 million people out of poverty or social exclusion by 2020. Progress towards this target is monitored through Eurostat’s headline indicator for those ‘at risk of poverty or social exclusion’.
The number or share of people who are at risk of poverty or social exclusion combines three separate measures and covers those persons who are in at least one of these three situations:
• persons who are at risk of poverty, in other words, with an equivalised disposable income that is below the at-risk-of-poverty threshold;
• persons who suffer from severe material deprivation, in other words, those who cannot afford at least four out of nine predefined material items that are considered by most people to be desirable or even necessary to lead an adequate quality of life;
• persons (aged 0 to 59) living in a household with very low work intensity, in other words, those living in households where adults worked no more than 20 % of their full work potential during the past year.

2 Effects of income on living conditions
Living conditions in Europe — 2018 edition28
Figure 2.1: People at risk of poverty or social exclusion, EU‑28, 2006‑2016(million persons)
0
20
40
60
80
100
120
140
2006 2007 2008 2009 2010 2011 2012 2013 2014 2015 2016
EU headline target for 2020to have at least 20 million
fewer people a�ectedby the risk of poverty
or social exclusion
Note: the overall EU target is to lift at least 20 million people out of the risk of poverty and exclusion by 2020 compared with a baseline that was set in 2008. 2006-2009: EU-27. 2006 and 2016: estimates.
Source: Eurostat (online data code: ilc_peps01)
Almost one in four Europeans was at risk of poverty or social exclusion
In 2016, there were 118 million people in the EU-28 at risk of poverty or social exclusion, which was equivalent to 23.5 % of the total population. Having peaked at 123.6 million in 2012, the number of persons who were at risk of poverty or social exclusion in the EU-28 fell during four consecutive years. There was an overall reduction of 5.6 million in relation to the number
of people who were at risk of poverty or social exclusion during this period (see Figure 2.1).
Despite the progress made in recent years towards the Europe 2020 target, an analysis over a longer period of time reveals that the recent decline in the number of persons at risk of poverty or social exclusion (2012-2016) failed to offset the increases that were recorded during and in the immediate aftermath of the global financial and economic crisis between 2010 and 2012.

2Effects of income on living conditions
Living conditions in Europe — 2018 edition 29
Figure 2.2: People at risk of poverty or social exclusion by socio‑economic characteristic, EU‑28, 2016(%)
0
15
30
45
60
75
Mal
e
Fem
ale
< 18
18-2
4
25-4
9
50-6
4
65 a
nd o
ver
Low
Med
ium
High
Empl
oyed
Unem
ploy
ed
Retir
ed
Oth
er in
activ
e
Sex Age (years) Education Activity status
Note: analysis by education and activity status refers to the adult population aged 18 years and over. Estimates.
Source: Eurostat (online data codes: ilc_peps01, ilc_peps02 and ilc_peps04)
THE PROFILE OF EUROPEANS AT RISK OF POVERTY OR SOCIAL EXCLUSION
Women, young adults, unemployed persons and those with a low level of educational attainment experienced — on average — a greater risk of poverty or social exclusion than other members of the EU-28 population in 2016 (see Figure 2.2).
The risk of poverty or social exclusion in the EU-28 was higher for women (aged 18 and over) than it was for men (24.3 % compared with 22.4 % in 2016).
There were larger differences when analysing the risk of poverty or social exclusion by age: in 2016, the highest risk (30.7 %) was recorded for young adults (aged 18-24 years) in the EU-28, while the lowest risk (17.7 %) was recorded for people aged 65 and over. The risk of poverty or social exclusion was 22.7 % for people aged 25-49 years and rose to 24.0 % among the population aged 50-64 years (perhaps reflecting,
among others, the increased risk of health issues or difficulties that some older members of the labour force have to find work if they are made unemployed).
Besides age and sex, educational attainment also has a considerable impact on the risk of poverty or social exclusion within the EU-28. In 2016, more than 3 out of every 10 (30.7 %) persons aged 18 and over with a low level of educational attainment (ISCED levels 0-2) was at risk of poverty or social exclusion, compared with 11.5 % of people in the same age group with a high level of educational attainment (ISCED levels 5-8).
Finally, an analysis by activity status reveals that those persons who were unemployed faced a particularly high risk of poverty or social exclusion. At an EU-28 level, more than two thirds (67.0 %) of the unemployed aged 18 and over were at risk of poverty or social exclusion; for comparison, the share among those in employment was 12.4 %.

2 Effects of income on living conditions
Living conditions in Europe — 2018 edition30
Almost half of the population living in single person households with dependent children was at risk of poverty or social exclusion
In 2016, almost one quarter (24.6 %) of the EU-28 population living in households with dependent children was at risk of poverty or social exclusion. This rate varied considerably across the EU Member States, from highs of 42.5 % in Romania and 40.9 % in Bulgaria down to 12.8 % in Finland and 12.0 % in Denmark (see Table 2.1).
On average, the population living in households without children faced less risk of poverty or social exclusion — 22.1 % across the EU-28 in 2016 — when compared with the population living in households with dependent children. However, a closer analysis reveals that this pattern was repeated in just 16 of the EU Member States; with the risk of poverty or social exclusion particularly concentrated among people living in households with children in Romania and Spain. By contrast, the risk of poverty or social exclusion was higher for people living in households without children in the remaining 12 Member States, including each of the Baltic and Nordic Member States. In Estonia and Latvia the risk of poverty or social exclusion among those persons living in households without children was 11.0-12.0 percentage points higher than the risk faced by people living in households with children.
People living in single-parent households constitute a particularly vulnerable group within the EU-28. In 2016, almost half (48.2 %) of this subpopulation faced the risk of poverty or social exclusion. Among the EU Member States, this rate ranged between 71.4 % in Bulgaria and 33.4 % in Slovenia.
The risk of poverty or social exclusion was also generally higher for the population living in larger family units. For example, the risk for people living in a household composed of two adults with three or more dependent children averaged 31.2 % across the EU-28 in 2016, which was 6.6 percentage points higher than the average for all households with children. This pattern was repeated for all but two of the EU Member States, the exceptions being Slovenia and Finland where people living in households composed of two adults and three or more dependent children had a marginally lower risk of poverty or social exclusion; this was also the case in Iceland (2015 data) and Norway.
In 2016, almost one third (32.6 %) of the EU-28 population living alone (single person households) faced the risk of poverty or social exclusion. In the three Baltic Member States this rate exceeded 50.0 % in 2016, while a peak of 62.0 % was recorded in Bulgaria. In four Member States — namely, Croatia, Slovenia, Latvia and Estonia, the risk of poverty or social exclusion was higher for the population living in single person households than it was for people living in single-parent households.
Among the different types of household covered in Table 2.1, the lowest risk of poverty or social exclusion was recorded for people living in households composed of two adults where at least one person was aged 65 years or older — a rate of 15.3 % across the EU-28 in 2016. Among the EU Member States, the range was between 37.9 % in Bulgaria and 5.1 % in Denmark; even lower rates were recorded in Iceland (5.0 %; 2015 data) and particularly Norway (2.2 %).
2Effects of income on living conditions
Living conditions in Europe — 2018 edition 31
Table 2.1: People at risk of poverty or social exclusion by household type, 2016(%)
Households without children Households with children
Total Single person
Two adults, at least
one aged 65 years or
over
Two or more adults
without depend‑
ent children
Total
Single adult with
depend‑ent
children
Two adults with one
depend‑ent child
Two adults with three
or more depend‑
ent children
Two or more adults with
depend‑ent
children
EU-28 22.1 32.6 15.3 18.0 24.6 48.2 17.9 31.2 22.2 Belgium 21.4 30.9 16.2 17.2 20.1 53.0 13.2 22.0 16.0 Bulgaria 40.0 62.0 37.9 32.6 40.9 71.4 28.5 89.1 38.9 Czech Republic 12.2 25.1 6.0 8.1 14.4 46.7 8.6 23.7 11.6 Denmark 21.1 33.0 5.1 12.1 12.0 36.9 3.8 12.8 8.1 Germany 21.8 36.7 13.5 13.8 16.8 43.0 13.3 20.4 13.1 Estonia 30.0 57.7 16.9 15.8 18.7 40.3 15.6 31.4 16.6 Ireland (1) 23.8 40.3 15.1 19.0 27.3 61.7 22.2 27.9 23.3 Greece 33.4 37.0 22.4 32.5 38.0 50.6 32.0 44.3 37.5 Spain 23.8 24.7 19.7 23.5 31.9 53.3 25.4 43.6 30.5 France 15.8 22.2 8.4 12.7 20.4 44.9 13.3 25.1 17.0 Croatia 31.8 49.6 31.8 27.7 24.5 43.2 21.8 39.6 24.0 Italy (1) 25.9 31.6 18.5 23.8 31.7 43.9 23.9 46.8 30.7 Cyprus 27.8 33.7 24.4 26.5 27.6 50.9 26.4 28.6 26.2 Latvia 34.5 60.3 31.1 25.4 22.6 46.8 17.4 28.8 19.9 Lithuania 32.4 50.3 24.6 22.6 28.0 54.4 17.3 34.4 24.1 Luxembourg (1) 15.2 23.5 7.6 11.5 21.2 50.5 15.1 25.2 18.4 Hungary 23.0 30.0 16.9 20.2 29.6 62.3 22.6 38.4 26.3 Malta 19.6 28.9 30.2 17.4 20.5 50.3 12.2 39.3 18.1 Netherlands 17.8 30.8 10.5 11.0 15.6 45.0 14.7 17.5 12.3 Austria 17.7 28.5 11.7 12.7 18.3 40.2 10.9 26.2 16.4 Poland 19.8 32.2 14.9 16.6 22.9 47.3 16.2 35.0 22.2 Portugal 24.5 33.7 22.3 22.6 25.6 42.0 19.3 46.2 24.1 Romania 34.2 47.3 27.7 29.9 42.5 58.2 26.1 72.6 42.0 Slovenia 23.1 41.1 13.9 16.5 14.5 33.4 18.5 14.4 13.1 Slovakia 14.6 22.3 12.9 12.9 20.9 40.7 12.3 37.7 20.2 Finland 19.6 36.1 5.6 10.1 12.8 41.9 9.6 12.7 9.0 Sweden 18.8 34.4 6.6 8.8 17.5 36.7 12.6 27.0 14.2 United Kingdom 20.0 33.3 16.0 15.6 24.4 56.9 16.2 31.3 18.8 Iceland (1) 14.0 29.8 5.0 6.7 12.3 43.2 13.6 9.2 8.1 Norway 18.1 33.1 2.2 6.9 12.2 40.1 5.2 10.4 6.5 Switzerland 17.9 26.5 21.8 13.8 18.2 42.0 12.1 28.2 16.3 Former Yugoslav Republic of Macedonia (1) 40.2 53.6 34.6 39.1 42.3 71.2 40.9 65.9 41.8
Serbia 38.7 48.4 30.2 36.6 38.8 55.5 31.1 56.5 37.9 Turkey (1) 35.0 44.0 39.6 33.4 43.6 72.1 30.9 61.7 43.0
(1) 2015.
Source: Eurostat (online data code: ilc_peps03)

2 Effects of income on living conditions
Living conditions in Europe — 2018 edition32
Figure 2.3: People at risk of poverty or social exclusion by degree of urbanisation, 2016(%)
0
10
20
30
40
50
60
EU-2
8 (1)
Bulg
aria
Rom
ania
Gree
ceLi
thua
nia
Italy
(2)
Latv
iaSp
ain
Croa
tiaCy
prus
Hung
ary
Irela
nd (2
)Po
rtug
alEs
toni
aUn
ited
King
dom
Pola
ndBe
lgiu
mM
alta
(3)
Germ
any
Slov
enia
(2)
Luxe
mbo
urg
(2)Sw
eden
Fran
ceSl
ovak
iaAu
stria
Den
mar
k (2)
Net
herla
nds
Finl
and
Czec
h Re
publ
ic (2
)
Switz
erla
ndN
orw
ay (2
)Ic
elan
d (2)
Serb
ia
Rural areas Towns and suburbs Cities
Note: ranked on the share of the total population at risk of poverty or social exclusion.
(1) Rural areas: estimate.(2) 2015.
(3) Rural areas: low reliability.
Source: Eurostat (online data codes: ilc_peps01 and ilc_peps13)
More than a quarter of the EU‑28 population living in rural areas was at risk of poverty or social exclusion
Aside from socio-demographic factors, the risk of poverty or social exclusion is also affected by the degree of urbanisation.
Figure 2.3 reveals that slightly more than one quarter (25.5 %) of the EU-28 population living in rural areas was exposed to the risk of poverty or social exclusion in 2016. For comparison, the risk was somewhat lower for people living in cities (23.6 %), while the lowest risk was recorded for the population living in towns and suburbs (21.6 %).
A more detailed analysis reveals there were contrasting patterns among the EU Member States concerning the impact that urbanisation had on the risk of poverty or social exclusion. In much of western Europe the risk of poverty or social exclusion was most pronounced in cities; this was particularly true in Belgium, Austria, Denmark, Germany and the Netherlands. By contrast, the risk of poverty or social exclusion
was particularly concentrated among rural populations in Bulgaria and Romania, as well as in Lithuania, Latvia and Poland.
In 2016, the highest risks of poverty or social exclusion in cities were recorded in Greece (33.6 %), Bulgaria (31.1 %), Belgium (29.3 %), Italy (28.7 %; 2015 data) and Spain (25.9 %); none of the remaining EU Member States reported that in excess of one quarter of city-dwellers were faced by such risk.
By contrast, the risk of poverty or social exclusion for rural populations was highest in Bulgaria and Romania, as both reported that more than half of their rural population faced such risks. As well as Bulgaria (53.8 %) and Romania (51.7 %), more than one third of the rural populations of Greece (38.9 %), Lithuania (37.6 %), Latvia (35.0 %), Spain (33.5 %) and Croatia (also 33.5 %) faced the risk of poverty or social exclusion in 2016.
The risk of poverty or social exclusion for those people living in towns and suburbs was often situated between the extremities recorded

2Effects of income on living conditions
Living conditions in Europe — 2018 edition 33
Figure 2.4: People at risk of poverty or social exclusion by type of risk, EU‑28, 2016(million persons)
51.9
15.5
13.2
11.5
8.4
2.515.1
At-risk-of-poverty
Severe materialdeprivation
Very low work intensity
Population:— neither at risk of poverty,— nor severely materially deprived,— nor living in a household with very low work intensity,= 384.5 million
Note: the sum of the data for the seven intersecting groups may differ slightly from the totals published elsewhere due to rounding.
Source: Eurostat (online data code: ilc_pees01)
for rural areas and cities. However, in Italy (29.5 %; 2015 data), Ireland (28.4 %; 2015 data), Luxembourg (22.5 %; 2015 data), France (20.2 %; 2016 data) and the Czech Republic (15.5 %; 2015 data) people living in towns and suburbs faced a higher risk of poverty or social exclusion than the remainder of the population.
COMPONENT INDICATORS WHICH CONTRIBUTE TO AN ANALYSIS OF THE RISK OF POVERTY OR SOCIAL EXCLUSION
Figure 2.4 provides an analysis for the EU-28 population of the various risks of poverty or social exclusion in 2016. Among the 118.0 million inhabitants within the EU-28 that faced the risk of poverty or social exclusion in 2016, some
8.4 million lived in households experiencing simultaneously all three poverty and social exclusion criteria. There were 15.1 million people in the EU-28 living both at risk of poverty and in a household with very low work intensity; 11.5 million were at risk of poverty and at the same time severely materially deprived; 2.9 million lived in households with very low work intensity while experiencing severe material deprivation.
However, the majority of the EU-28 population living at risk of poverty or social exclusion experienced only one of the three individual criteria: there were 51.9 million persons who were exclusively at risk of poverty, 15.5 million who faced severe material deprivation and 13.2 million that lived in households with very low work intensity.

2 Effects of income on living conditions
Living conditions in Europe — 2018 edition34
Figure 2.5: People at risk of poverty or social exclusion by type of risk, 2016(%)
5
15
25
35
45
EU-2
8
Bulg
aria
Rom
ania
(1)
Gree
ceLi
thua
nia
Italy
(2)
Latv
iaSp
ain
Croa
tiaCy
prus
Hung
ary
Irela
nd (2
)Po
rtug
alEs
toni
aUn
ited
King
dom
Pola
ndBe
lgiu
mM
alta
Germ
any
Slov
enia
Luxe
mbo
urg
(2)Sw
eden
Fran
ceAu
stria
Slov
akia
Den
mar
kN
ethe
rland
sFi
nlan
dCz
ech
Repu
blic
Switz
erla
ndN
orw
ayIc
elan
d (2)
Form
. Yug
. Rep
. of M
aced
onia
(2)
Turk
ey (2
)Se
rbia
Very low work intensity (other than at-risk-of-poverty or experiencing severe material deprivation)Severe material deprivation (other than at-risk-of-poverty, but possibly with very low work intensity)At-risk-of-poverty rate (possibly with severe material deprivation and/or very low work intensity)
Note: the sum of the data for the three groups may differ slightly from the totals published elsewhere due to rounding.
(1) Provisional.(2) 2015.
Source: Eurostat (online data codes: ilc_li02 and ilc_pees01)
The information shown in Figure 2.5 confirms that monetary poverty — in other words, those people at risk of poverty — was the most widespread form of poverty or social exclusion, some 17.3 % of the EU-28 population was at risk of poverty in 2016 (possibly combined with one or both of the other two risks). A further 3.6 % of the EU-28 population faced severe material deprivation in 2016 (either as a single risk or combined with living in a household with very low work intensity), while 2.6 % of the EU-28 population lived in households with very low work intensity (without experiencing either of the other two risk factors).
MONETARY POVERTY
The at-risk-of-poverty rate provides information for the monetary dimension of poverty and social exclusion; it shows the proportion of the population that has an income level below the national at-risk-of-poverty threshold.
In 2016, more than one fifth of the total population was at risk of poverty in Romania (25.3 %), Bulgaria (22.9 %), Spain (22.3 %), Lithuania (21.9 %), Latvia (21.8 %), Estonia (21.7 %) and Greece (21.2 %). At the other end of the scale, less than 13.0 % of the population was at risk of poverty in the Netherlands and Slovakia (both 12.7 %), Denmark (11.9 %) and Finland

2Effects of income on living conditions
Living conditions in Europe — 2018 edition 35
Figure 2.6: At‑risk‑of‑poverty rate and at‑risk‑of‑poverty threshold, 2016
0
5
10
15
20
25
30
EU-2
8 (1)
Luxe
mbo
urg
Aust
riaGe
rman
yD
enm
ark
Net
herla
nds
Belg
ium
Fran
ceSw
eden
Finl
and
Irela
nd (2
)Un
ited
King
dom
Mal
taCy
prus
Slov
enia
Italy
(2)
Spai
nCz
ech
Repu
blic
Esto
nia
Pola
ndPo
rtug
alSl
ovak
iaLi
thua
nia
Latv
iaGr
eece
Croa
tiaHu
ngar
yBu
lgar
iaRo
man
ia (2
)
Nor
way
Switz
erla
ndIc
elan
d (2)
Turk
ey (2
)Se
rbia
F orm
. Yug
. Rep
. of M
aced
onia
(2)
At-risk-of-poverty rate (%) At-risk-of-poverty threshold for single person (PPS thousand)
(1) At-risk-of-poverty rate: estimate. At-risk-of-poverty threshold: not available.
(2) 2015.(3) Provisional.
Source: Eurostat (online data codes: ilc_li02 and ilc_pees01)
(11.6 %), while the lowest share among the EU Member States was recorded in the Czech Republic (9.7 %). The at-risk-of-poverty rate was also below 13.0 % in Norway and fell to a rate that was below that reported in any of the EU Member States in Iceland (9.6 %; 2015 data).
At-risk-of-poverty thresholds may, in theory, be set at any arbitrary level. However, in the EU widespread use is generally made of a threshold set at 60 % of the national median equivalised income. Note these thresholds do not measure wealth or poverty, per se, rather they provide information on levels of income below which the population is considered to have relatively
low income, which does not necessarily imply a very low standard of living or quality of life. Poverty thresholds are usually expressed in terms of purchasing power parities (PPPs) — to allow cross-country comparisons to be made — as these adjust for price level differences between EU Member States.
In 2016, national poverty thresholds for a single person ranged from a high of PPS 16 862 in Luxembourg down to PPS 4 046 in Bulgaria and PPS 2 877 in Romania. The poverty threshold in Norway was higher than in any of the EU Member States, at PPS 17 170.

2 Effects of income on living conditions
Living conditions in Europe — 2018 edition36
Figure 2.7: At‑risk‑of‑poverty rate by age group, 2016(%)
0
10
20
30
40
50
EU-2
8 (1)
Rom
ania
(2)
Bulg
aria
Spai
nLi
thua
nia
Latv
iaEs
toni
aGr
eece
Italy
(3)
Croa
tiaPo
rtug
alPo
land
Germ
any
Luxe
mbo
urg
Mal
taIre
land
(3)
Swed
enCy
prus
Unite
d Ki
ngdo
mBe
lgiu
mHu
ngar
yAu
stria
Slov
enia
Fran
ceN
ethe
rland
sSl
ovak
iaD
enm
ark
Finl
and
Czec
h Re
publ
ic
Switz
erla
ndN
orw
ayIc
elan
d (3)
Serb
iaTu
rkey
(3)
Form
. Yug
. Rep
. of M
aced
onia
(3)
Less than 18 years 18-24 years 25-49 years 50-64 years 65 years and over
Note: ranked on the at-risk-of-poverty rate for the whole population.
(1) Estimates.(2) Provisional.(3) 2015.
Source: Eurostat (online data code: ilc_li02)
Among the adult population, elderly people — defined here as aged 65 and over — were found to be among the least affected members of society in relation to their exposure to the risk of poverty. The at-risk-of-poverty rate among elderly people in the EU-28 was 14.5 % in 2016, while the highest risk of poverty was recorded for young adults — defined here as those aged 18-24 years — almost a quarter (23.4 %) of which were at risk of poverty.
It was commonplace to find that young adults had the highest at-risk-of poverty rate and this pattern was repeated for the vast majority of EU Member States: the only exceptions were the Baltic Member States, Croatia, Cyprus, Slovenia and Malta— in each of these cases, the highest at-risk-of-poverty rate (among adults) was recorded for elderly persons aged 65 and over (see Figure 2.7).
THE AT-RISK-OF-POVERTY RATE BEFORE AND AFTER DEDUCTING HOUSING COSTS
Housing costs include those costs associated with living somewhere (for example, rental payments, mortgage interest payments, or the cost of repairs), utility costs that result from the use of a dwelling (such as water or electricity charges), and other local taxes/charges.
Housing costs often account for a considerable proportion of a household’s disposable income and rising housing costs are often cited as one of the key factors that impact on the share of the population that is affected by monetary poverty.
A comparison of the at-risk- of-poverty rate before and after deducting housing costs is shown in Figure 2.8: it reveals that the share of

2Effects of income on living conditions
Living conditions in Europe — 2018 edition 37
Figure 2.8: At‑risk‑of‑poverty rate before and after deducting housing costs, 2016(%)
0
10
20
30
40
50
EU-2
8
Rom
ania
(1)
Bulg
aria
Spai
nLi
thua
nia
Latv
iaEs
toni
aGr
eece
Italy
(2)
Croa
tiaPo
rtug
alPo
land
Germ
any
Mal
taIre
land
(2)
Swed
enCy
prus
Unite
d Ki
ngdo
mBe
lgiu
mLu
xem
bour
g (2)
Hung
ary
Aust
riaSl
oven
iaFr
ance
Net
herla
nds
Slov
akia
Den
mar
kFi
nlan
dCz
ech
Repu
blic
Switz
erla
ndN
orw
ayIc
elan
d (2)
Serb
iaTu
rkey
(2)(3
)Fo
rm. Y
ug. R
ep. o
f Mac
edon
ia (2
)(3)
After deducting housing costs Before deducting housing costs
(1) Provisional.(2) 2015.
(3) After deducting housing costs: not available.
Source: Eurostat (online data codes: ilc_li02 and ilc_li48)
the EU-28 population that was at risk of poverty in 2016 rose from 17.3 % (before deducting housing costs) to reach 32.3 % (after deducting housing costs); as such, the share of the EU-28 population that was at risk of poverty almost doubled when taking account of housing costs.
The impact of housing costs varies considerably both between and within EU Member States (for example, somebody who chooses to live in central Paris may expect to spend a considerably larger proportion of their income on housing costs than someone who chooses to live in Perpignan, Rennes or Strasbourg).
Across the EU Member States, the relative impact of housing on poverty was particularly pronounced in the Czech Republic, Denmark, the Netherlands, Germany, Greece, Slovakia, the United Kingdom and Hungary, where the at-risk-of-poverty rate more than doubled in 2016 after deducting housing costs.
By contrast, many of the eastern and southern EU Member States were characterised by housing costs having a relatively low impact on the risk of poverty. This may be attributed, at least in part, to lower house prices, utility prices and residential taxes and to a higher percentage of home ownership (without a mortgage).

2 Effects of income on living conditions
Living conditions in Europe — 2018 edition38
Figure 2.9: At‑risk‑of‑poverty rate before and after social transfers, 2016(%)
0
10
20
30
40
EU-2
8
Rom
ania
(1)
Bulg
aria
Spai
nLi
thua
nia
Latv
iaEs
toni
aGr
eece
Italy
(2)
Croa
tiaPo
rtug
alPo
land
Germ
any
Luxe
mbo
urg
Mal
taIre
land
(2)
Swed
enCy
prus
Unite
d Ki
ngdo
mBe
lgiu
mHu
ngar
yAu
stria
Slov
enia
Fran
ceN
ethe
rland
sSl
ovak
iaD
enm
ark
Finl
and
Czec
h Re
publ
ic
Switz
erla
ndN
orw
ayIc
elan
d (2)
Serb
iaTu
rkey
(2)
Form
. Yug
. Rep
. of M
aced
onia
(2)
Before social transfers (but after pensions) After social transfers
(1) Provisional.(2) 2015.
Source: Eurostat (online data codes: ilc_li02 and ilc_li10)
THE IMPACT OF SOCIAL TRANSFERS ON MONETARY POVERTY
Social protection measures, such as social benefits, are an important means for tackling monetary poverty. By comparing at-risk-of-poverty rates before and after social transfers it is possible to make an assessment of the effectiveness of welfare systems (see Figure 2.9).
In 2016, social transfers reduced the at-risk-of poverty rate for the EU-28 population from 25.9 % (before social transfers, pensions excluded) to 17.3 %, bringing the rate down by 8.6 percentage points.
Social transfers had a particularly large impact on poverty reduction in 2016 in Ireland (2015 data), the Nordic Member States, Austria and the United Kingdom, where the at-risk-of-poverty rate fell by more than 12.0 percentage points
after social transfers; this pattern was repeated in Norway.
The impact of social transfers was much less significant in Bulgaria, Romania and Greece, as at-risk-of-poverty rates were reduced by no more than 5.0 percentage points; this pattern was repeated in both the former Yugoslav Republic of Macedonia and Turkey (both 2015 data).
AT-RISK-OF-POVERTY RATE ANCHORED AT A SPECIFIC POINT IN TIME
Given the at-risk-of-poverty rate is calculated on the basis of poverty thresholds that change from one year to the next (reflecting changes to the overall level of income and its distribution between different socio-economic groups), it is necessary to remain cautious when interpreting poverty developments over time, especially during periods of rapid economic change (booms or recessions).

2Effects of income on living conditions
Living conditions in Europe — 2018 edition 39
Map 2.1: At‑risk‑of‑poverty rate anchored in 2008, 2008‑2016(percentage points difference, 2016 minus 2008)
Administrative Boundaries: © EuroGeographics © UN-FAO© Turkstat
Note: a negative value indicates a reduction in poverty on the basis of results for which the poverty threshold is anchored in 2008.Ireland, Italy, Luxembourg, Iceland and Turkey: 2015 instead of 2016. EU-27 instead of EU-28: 2008. Romania, 2016: provisional.Croatia: not available.
At-risk-of-poverty rate anchored in 2008, 2008-2016(percentagepoints difference, 2016 minus 2008)
0 200 400 600 800 km
Cartography: Eurostat — IMAGE, 04-05-18
Source: Eurostat (online data code: ilc_li22b)
(percentage points difference, 2016 minus 2008)
EU-28 = 0.9< -4.0-4.0 – < 0.00.0 – < 4.0>= 4.0Data not available
Guadeloupe (FR)
0 25
Martinique (FR)
0 20
Guyane (FR)
0 100
Réunion (FR)
0 20
Açores (PT)
0 50
Madeira (PT)
0 20
Canarias (ES)
0 100
Malta
0 10
Liechtenstein
0 5
Mayotte (FR)
0 15
Note: a negative value indicates a reduction in poverty on the basis of results for which the poverty threshold is anchored in 2008. Ireland, Italy, Luxembourg, Iceland and Turkey: 2015 instead of 2016. EU-27 instead of EU-28: 2008. Romania, 2016: provisional. Croatia: not available.
Source: Eurostat (online data code: ilc_li22b)

2 Effects of income on living conditions
Living conditions in Europe — 2018 edition40
A more reliable measure for monitoring developments over time can be achieved by monitoring the at-risk-of-poverty rate anchored at a specific point in time and adjusted for inflation.
On this basis, the at-risk-of-poverty rate anchored in 2008 rose, on average, by 0.9 percentage points across the EU-28 between 2008 and 2016. There was a varied pattern to developments in the individual EU Member States, with the impact of the global financial and economic crisis apparent in several southern EU Member States — Greece, Cyprus, Spain and Italy — as well as Ireland; a similar pattern was also observed in Iceland (see Map 2.1).
THE PERSISTENT AT-RISK-OF-POVERTY RATE
The persistent at-risk-of-poverty rate shows the proportion of people with a level of income below the poverty threshold in both the reference year as well as at least two out of the three preceding years. Thus, this indicator captures those members of society who are particularly vulnerable to the persistent risk of poverty over relatively lengthy periods of time. The rationale behind this indicator is based on the fact that the chances for a household to recover or be lifted out of poverty falls the longer it remains below the at risk of poverty threshold.
In 2016, there was a higher persistent risk of poverty among the population living in single person households. On average, more than one fifth (21.9 %) of the EU-28 population living in single-parent households was at persistent risk of poverty, while 17.4 % of the population living in single person households faced similar risks of
persistent poverty (see Table 2.2); both of these figures were considerably higher than the risk of persistent poverty recorded for people living in households with two or more adults (irrespective of whether or not they had children). The lowest persistent at-risk-of poverty rate — 6.6 % in the EU-28 — was recorded for households composed of two or more adults without dependent children.
Among the EU Member States, around one third of all people living in single-parent households in Belgium, Greece (2015 data) and Ireland (2015 data) faced a persistent risk of poverty in 2016. This share rose to 42.3 % in Malta and peaked at over half (51.5 %; 2015 data) of all single-parent households in Luxembourg. Among those people who were living on their own in single person households, persistent at-risk-of-poverty rates were particularly high in Bulgaria (34.3 %) and Estonia (42.9 %).
Persistent at-risk-of-poverty rates were generally lower for people living in households composed of two or more adults without dependent children than they were for people living in households composed of two or more adults with dependent children. This pattern was repeated in 2016 across a majority of the EU Member States, as Denmark, Cyprus, Sweden, Germany and particularly Croatia were the only exceptions.
In households composed of two or more adults with dependent children, the persistent at-risk-of-poverty rate peaked in 2016 at 27.8 % in Romania (2015 data), while the next highest rates (within the range of 16.5 %-19.0 %) were recorded in Greece (2015 data), Italy (2015 data) and Bulgaria.

2Effects of income on living conditions
Living conditions in Europe — 2018 edition 41
Table 2.2: Persistent at‑risk‑of‑poverty rate by household type, 2016(%)
Single adult Two or more adultsWithout dependent
childrenWith dependent
childrenWithout dependent
childrenWith dependent
childrenEU-28 17.4 21.9 6.6 11.9 Belgium 14.6 32.7 7.3 8.4 Bulgaria 34.3 30.4 7.6 16.9 Czech Republic 9.5 18.5 2.0 3.7 Denmark (1) 14.0 12.7 5.6 4.0 Germany 26.3 17.8 6.1 4.1 Estonia 42.9 19.8 5.8 8.3 Ireland (2) 22.8 34.2 3.0 6.1 Greece (2) 10.4 33.3 9.3 16.5 Spain 8.0 24.5 10.0 19.0 France 8.7 23.7 3.0 8.9 Croatia (1) 27.0 26.3 16.1 10.7 Italy (2) 17.6 31.6 8.6 16.7 Cyprus (1) 19.3 23.0 7.1 5.4 Latvia (2) 23.1 20.9 4.8 9.2 Lithuania (2) 26.4 25.8 8.0 12.9 Luxembourg (2) 10.0 51.5 1.9 14.3 Hungary 10.9 24.7 3.3 9.9 Malta 15.9 42.3 8.2 10.6 Netherlands 10.0 20.9 2.0 8.6 Austria 15.9 5.1 5.9 7.1 Poland 16.9 30.4 5.3 10.2 Portugal 16.3 15.3 7.5 13.6 Romania (2) 22.5 29.9 7.5 27.8 Slovenia 26.0 17.1 5.6 6.0 Slovakia (2) 10.2 19.0 3.3 9.0 Finland (2) 22.7 11.0 4.5 5.7 Sweden 20.5 21.4 1.9 0.1 United Kingdom (2) 15.4 19.7 4.7 5.2 Iceland (1)(2) 5.6 14.3 0.9 1.9 Norway 14.1 17.3 0.4 1.1 Switzerland 10.4 11.9 5.4 7.1 Former Yugoslav Republic of Macedonia (1)(3) 9.6 14.6 10.5 13.0
Serbia (1) 22.1 19.4 11.4 17.1 Turkey (2) 13.0 33.0 6.4 19.1
(1) Single person with dependent children: low reliability.(2) 2015.
(3) 2015, except for single person with dependent children: 2014.
Source: Eurostat (online data code: ilc_li23)

2 Effects of income on living conditions
Living conditions in Europe — 2018 edition42
Figure 2.10: Severe material deprivation rate and at‑risk‑of poverty rate, 2016(%)
0
10
20
30
40
EU-2
8
Rom
ania
(1)
Bulg
aria
Spai
nLi
thua
nia
Latv
iaEs
toni
aGr
eece
Italy
(2)
Croa
tiaPo
rtug
alPo
land
Germ
any
Mal
taIre
land
(2)
Swed
enCy
prus
Unite
d Ki
ngdo
mBe
lgiu
mLu
xem
bour
g (2)
Hung
ary
Aust
riaSl
oven
iaFr
ance
Net
herla
nds
Slov
akia
Den
mar
kFi
nlan
dCz
ech
Repu
blic
Switz
erla
ndN
orw
ayIc
elan
d (2)
Serb
iaTu
rkey
(2)
F orm
. Yug
. Rep
. of M
aced
onia
(2)
At-risk-of-poverty rate Severe material deprivation rate
Note: the severe material deprivation rate refers to the share of the population unable to pay for at least four out of nine items that are deemed to be desirable or even necessary to lead an adequate life.
(1) Provisional.(2) 2015.
Source: Eurostat (online data codes: ilc_li02 and ilc_sip8)
2.2 Material deprivationMaterial deprivation indicators provide a measure related to the (in)ability of individuals to be able to afford a set of nine predefined material items that are considered by most people to be desirable or even necessary to lead an adequate quality of life. These include the ability to: meet unexpected expenses; afford a one-week annual holiday away from home; afford a meal with meat, fish or a vegetarian equivalent every second day; adequately heat their dwelling; purchase a range of durable goods such as a washing machine, colour television, a telephone, or a car; pay a mortgage, rent, utility bills or other loan payments on time.
The material deprivation rate is defined as the proportion of the population that is unable to
afford three or more out of this list of nine items, while the severe material deprivation rate is defined as the proportion of the population that is unable to afford four or more of the above-mentioned items.
As shown in Figure 2.10, severe material deprivation rates for the EU Member States were generally lower than at-risk-of-poverty rates in 2016. Across the whole of the EU-28 the severe material deprivation rate was 7.5 % in 2016 (compared with an at-risk-of-poverty rate of 17.3 %). Severe material deprivation rates ranged from 0.8 % in Sweden and 2.0 % in Luxembourg (2015 data) to 22.4 % in Greece, 23.8 % in Romania and a peak of 31.9 % in Bulgaria.
The only EU Member States to record higher levels of absolute poverty (as measured by the severe material deprivation rate) compared with relative

2Effects of income on living conditions
Living conditions in Europe — 2018 edition 43
Figure 2.11: Material deprivation rates, 2016(%)
0
10
20
30
40
50
60
EU-2
8
Bulg
aria
Rom
ania
(1)
Gree
ceHu
ngar
yCy
prus
Lith
uani
aLa
tvia
Croa
tiaIta
ly (2
)Po
rtug
alSl
ovak
iaIre
land
(2)
Pola
ndSp
ain
Belg
ium
Slov
enia
Unite
d Ki
ngdo
mCz
ech
Repu
blic
Esto
nia
Fran
ceM
alta
Germ
any
Aust
riaD
enm
ark
Net
herla
nds
Finl
and
Luxe
mbo
urg
(2)Sw
eden
Nor
way
Icel
and
(2)Sw
itzer
land
Form
. Yug
. Rep
. of M
aced
onia
(2)
Turk
ey (2
)Se
rbia
Could not a�ord three items Could not a�ord four or more items
Note: the material deprivation rate refers to the share of the population unable to pay for at least three out of nine items that are deemed to be desirable or even necessary to lead an adequate life; the severe material deprivation rate refers to the share of the population unable to pay for at least four out of the same nine items.
(1) Provisional.(2) 2015.
Source: Eurostat (online data code: ilc_sip8)
poverty (as measured by the at-risk-of-poverty rate) were Bulgaria, Hungary and Greece; a similar pattern was repeated in Turkey and the former Yugoslav Republic of Macedonia (both 2015 data).
As far as material deprivation is concerned, some 8.2 % of the EU-28 population was in a position whereby they could not afford three out of the nine material items in 2016 (see Figure 2.11); while a further 7.5 % of the population could not afford four or more items. As such, almost one sixth (15.7 %) of the EU-28 population experienced material deprivation, while the severe material deprivation rate was 7.5 %..
Among the EU Member States, less than 5.0 % of the total population in Sweden and Luxembourg (2015 data) was categorised as being materially deprived in 2016; this was also the case in Norway.
On the other hand, upwards of one tenth of the population in 12 of the EU Member States was unable to afford three items in 2016 (data for Ireland and Italy refer to 2015); the highest shares were recorded in Greece, Romania and Croatia (where a peak of 17.6 % was registered). When combined with those persons unable to afford four or more items, the highest material deprivation rates were recorded in Greece, Romania and Bulgaria (where a peak of 46.9 % was registered).

2 Effects of income on living conditions
Living conditions in Europe — 2018 edition44
Single‑parent households are most often affected by severe material deprivation
In 2016, some 15.7 % of the EU-28 population living in single-parent households was considered to be severely materially deprived; this was the highest share among any of the different household types that are depicted in Table 2.3. There were two other types of household where the severe material deprivation rate was in double-digits, namely: households composed of single men (10.9 %) or single women (10.0 %), while the severe material deprivation rate was also higher than the EU-28 average (7.5 %) for households composed of two adults with three or more children (9.7 %).
Across the individual EU Member States in 2016:
• Germany, Estonia, Croatia, Latvia, Lithuania, the Netherlands, Poland, Slovenia, Slovakia and Finland each recorded higher severe material deprivation rates for their populations living in households without children (when compared to the population living in households with children);
• Bulgaria, Italy, Portugal and Romania each reported that persons living in households with two adults with three or more dependent children were most affected by severe material deprivation (when compared with the other household types depicted in Table 2.3);
• severe material deprivation rates for people living in households composed of two or more adults with dependent children were at least twice as high as the EU-28 average (7.5 %) in Cyprus and Hungary, were more than three times as high as the EU-28 average in Romania and Greece, and were just over four times as high as the EU-28 average in Bulgaria (30.6 %).
Severe material deprivation affects more foreign citizens
Foreign (non-national) citizens were generally more vulnerable to severe material deprivation than the national population (see Table 2.4). Across the whole of the EU-28, some 9.7 % of foreign citizens were affected by severe material deprivation in 2016 compared with 7.0 % of national citizens. This pattern held across the majority of the EU Member States, although the United Kingdom, Poland, Hungary and Bulgaria were exceptions as they reported fewer foreign citizens facing severe material deprivation. Severe material deprivation touched more than one fifth of all foreign citizens living in Italy (2015 data) and Bulgaria, with this share rising to a peak of 47.9 % for those foreign citizens who were living in Greece.

2Effects of income on living conditions
Living conditions in Europe — 2018 edition 45
Table 2.3: Severe material deprivation rate by household type, 2016(%)
Households without children Households with children
Total Single male
Single female
Two adults, at least
one aged 65 years or
over
Total
Single adult with
depend‑ent
children
Two adults with one
depend‑ent child
Two adults with three
or more depend‑
ent children
Two or more adults with
depend‑ent
children
EU-28 7.0 10.9 10.0 4.3 8.0 15.7 5.2 9.7 7.2 Belgium 4.7 10.6 8.0 1.2 6.3 14.9 3.1 7.9 5.2 Bulgaria 31.9 37.5 54.7 32.4 32.1 56.2 22.1 85.5 30.6 Czech Republic 4.3 7.8 7.5 2.2 5.3 17.0 4.6 8.4 4.3 Denmark 2.6 5.9 3.1 0.4 2.7 8.4 1.6 3.0 1.8 Germany 4.2 9.1 8.5 1.0 3.0 9.5 2.0 3.3 2.0 Estonia 5.9 11.9 7.9 3.3 3.5 13.3 3.1 5.2 2.6 Ireland (1) 5.7 10.6 7.9 2.8 8.6 22.6 6.0 6.8 7.0 Greece 19.1 22.9 22.4 12.8 26.1 36.2 18.6 34.3 25.7 Spain 4.9 6.3 6.4 2.4 6.6 12.2 4.8 11.3 6.3 France 3.8 8.1 6.7 1.1 4.9 14.4 2.9 5.0 3.6 Croatia 14.5 24.5 19.6 13.6 10.7 23.6 7.9 16.8 10.3 Italy 11.9 14.5 14.0 9.8 11.9 14.6 9.4 16.3 11.7 Cyprus 9.8 14.7 6.5 5.3 16.4 25.5 13.8 19.2 15.9 Latvia 14.2 19.6 22.3 13.6 11.5 21.6 9.6 13.5 10.3 Lithuania 15.9 22.1 21.8 13.8 11.2 24.9 6.2 9.2 9.2 Luxembourg (1) 1.6 3.2 2.8 0.0 2.3 10.6 1.4 2.0 1.5 Hungary 14.2 24.5 15.9 9.4 18.4 42.3 14.2 22.9 15.9 Malta 3.8 7.1 4.8 3.5 5.0 21.9 2.8 4.7 3.6 Netherlands 2.9 5.9 6.2 1.1 2.3 11.4 1.2 1.8 1.3 Austria 2.8 6.1 4.6 0.6 3.2 9.1 1.8 5.4 2.7 Poland 7.7 18.1 11.7 5.7 5.2 21.6 3.1 7.5 4.7 Portugal 7.6 13.5 10.6 6.4 9.1 15.9 6.4 17.3 8.4 Romania 21.5 28.6 30.5 19.0 25.6 36.6 14.4 47.3 25.2 Slovenia 6.5 12.5 10.7 4.7 4.4 12.9 4.8 4.0 3.7 Slovakia 8.3 17.8 11.6 9.3 8.1 24.5 3.2 14.9 7.5 Finland 2.7 5.9 6.0 0.8 1.6 6.8 0.9 1.3 0.9 Sweden 0.8 2.1 1.0 0.2 0.8 1.4 0.5 1.0 0.7 United Kingdom 3.9 9.8 5.2 1.0 6.5 20.0 3.2 7.1 4.2 Iceland (1) 1.4 1.7 5.6 0.0 1.6 7.9 0.8 1.8 0.8 Norway 1.8 4.6 3.0 0.0 2.1 9.0 0.2 1.3 0.7 Switzerland 1.0 2.2 2.1 0.1 2.2 7.3 2.7 2.0 1.8 Former Yugoslav Republic of Macedonia (1) 33.6 41.1 50.7 27.6 28.8 38.6 29.0 46.4 28.7
Serbia 22.9 28.0 30.6 18.8 16.9 30.2 16.7 28.0 16.3 Turkey (1) 25.4 28.9 39.2 32.0 32.0 55.8 23.4 47.0 31.6
Note: the severe material deprivation rate refers to the share of the population unable to pay for at least four out of nine items that are deemed to be desirable or even necessary to lead an adequate life.
(1) 2015.
Source: Eurostat (online data code: ilc_mddd13)

2 Effects of income on living conditions
Living conditions in Europe — 2018 edition46
Table 2.4: Severe material deprivation rate for the adult population by broad group of citizenship and sex, 2016(%)
Nationals Non-nationalsTotal Male Female Total Male Female
EU-28 7.0 6.7 7.3 9.7 9.8 9.6 Belgium 3.6 3.5 3.7 12.4 12.1 12.6 Bulgaria (1) 32.0 30.2 33.7 23.4 11.4 35.2 Czech Republic 4.4 4.2 4.5 7.4 6.5 8.2 Denmark 2.0 2.2 1.7 9.7 11.2 8.4 Germany 3.7 3.3 4.0 4.2 4.1 4.3 Estonia 4.3 4.7 3.9 8.2 5.6 9.8 Ireland (2) 6.6 6.0 7.3 8.4 8.4 8.4 Greece 19.3 18.8 19.6 47.9 49.3 46.7 Spain 4.2 4.0 4.4 14.8 13.4 15.9 France 3.5 3.2 3.9 8.5 8.2 8.7 Croatia 12.4 13.2 11.7 14.9 13.2 16.4 Italy (2) 10.0 10.1 9.9 20.8 24.2 18.0 Cyprus 11.9 12.2 11.6 15.5 16.7 14.7 Latvia 12.6 11.7 13.4 14.8 12.9 16.0 Lithuania 13.7 13.2 14.0 19.0 17.0 20.3 Luxembourg (2) 0.9 0.5 1.3 2.6 2.7 2.5 Hungary 15.3 15.4 15.2 9.2 5.1 13.1 Malta 4.0 3.9 4.0 4.2 4.0 4.3 Netherlands 1.6 1.5 1.8 9.3 8.2 10.2 Austria 1.5 1.6 1.5 8.3 8.0 8.5 Poland 6.8 6.7 6.8 6.3 7.0 5.8 Portugal 7.8 7.3 8.3 11.7 10.9 12.3 Romania 22.2 22.0 22.5 : : : Slovenia 4.9 4.7 5.2 10.9 10.8 11.0 Slovakia (1) 7.9 7.8 7.9 11.4 9.4 12.7 Finland 2.2 2.0 2.4 5.0 4.7 5.3 Sweden 0.5 0.5 0.5 2.3 3.1 1.5 United Kingdom 4.7 4.6 4.8 4.3 4.4 4.2 Iceland (2) 1.4 0.8 2.0 1.0 0.7 1.4 Norway 1.2 1.1 1.3 6.5 7.8 5.3 Switzerland 0.5 0.4 0.7 3.1 2.6 3.7 Former Yugoslav Republic of Macedonia (2) 30.0 30.1 29.9 43.2 35.7 46.2
Serbia 20.0 20.0 20.0 19.8 18.4 20.9 Turkey (2) 28.1 27.5 28.7 14.1 13.4 14.7
Note: refers to the population aged 18 years or over. The severe material deprivation rate refers to the share of the population unable to pay for at least four out of nine items that are deemed to be desirable or even necessary to lead an adequate life.
(1) Non-national males: low reliability.(2) 2015.
Source: Eurostat (online data code: ilc_mddd16)

2Effects of income on living conditions
Living conditions in Europe — 2018 edition 47
Figure 2.12: Inability to afford a meal with meat, fish or vegetarian equivalent every second day, 2016(%)
0
10
20
30
40
50
60
70
80
EU-2
8
Bulg
aria
Gree
ceHu
ngar
yRo
man
iaSl
ovak
iaLa
tvia
Lith
uani
aCz
ech
Repu
blic
Croa
tiaIta
ly (1
)Be
lgiu
mGe
rman
yFr
ance
Mal
taPo
land
Slov
enia
Aust
riaEs
toni
aUn
ited
King
dom
Cypr
usLu
xem
bour
g (1)
Port
ugal
Spai
nFi
nlan
dIre
land
(1)
Net
herla
nds
Den
mar
kSw
eden
Nor
way
Icel
and
(1)Sw
itzer
land
Turk
ey (1
)Fo
rm. Y
ug. R
ep. o
f Mac
edon
ia (3
)Se
rbia
People at-risk-of-poverty Total population
(1) 2015.
Source: Eurostat (online data code: ilc_mdes03)
2.3 Economic strain
More than one in five people in the EU‑28 at risk of poverty was unable to afford a meal with meat, fish or a vegetarian equivalent every second day
In 2016, some 8.3 % of the EU-28 population was unable to afford a meal with meat, fish or a vegetarian equivalent every second day (see Figure 2.12). The share of the population facing difficulties with respect to this economic strain was highest in Bulgaria, where more than one third (34.6 %) of the population was unable to afford such a meal every second day. By contrast, in Ireland (2015 data), the Netherlands, Denmark and Sweden, fewer than 3.0 % of the population faced such difficulties.
Looking in more detail, more than one fifth (21.3 %) of the subpopulation of people across the EU-28 who were at risk of poverty reported being unable to afford such a meal every second day. This share ranged among the EU Member States from 3.4 % of those at risk of poverty in Sweden up to 63.9 % of those who at risk of poverty in Bulgaria. In a similar vein, more than half (58.5 %) of the population at risk of poverty in Greece was also unable to afford a meal with meat, fish or vegetarian equivalent every second day.

2 Effects of income on living conditions
Living conditions in Europe — 2018 edition48
ABILITY TO FACE UNEXPECTED FINANCIAL EXPENSES
The ability to cope with unexpected financial expenses is a measure of financial security, and may be used to identify risks and vulnerabilities that are not necessarily revealed through an analysis of income-based indicators. Note that this indicator provides wealth-based information rather than information pertaining to income or expenditure; as such, it presents complementary information that may be used to analyse the financial situation of households.
Around two fifths (39.3 %) of the EU-28 population living in households with dependent children was unable to face unexpected financial expenses in 2016, compared with just over one third (33.6 %) of the population who were living in households without children (see Table 2.5).
Across the EU Member States in 2016, more than half of the population living in households with dependent children was unable to face unexpected financial expenses in Bulgaria, Lithuania, Greece, Ireland (2015 data), Romania, Croatia, Hungary, Cyprus and Latvia (where a peak of 58.7 % was recorded). At the other end of the range, less than one quarter of the population living in households with dependent children was unable to face unexpected financial expenses in Luxembourg (2015 data), Sweden, Malta and the Netherlands (where a low of 22.0 % was recorded).
A more detailed analysis reveals that those people living alone or in single-parent households often reported considerable difficulties in facing unexpected financial expenses. In 2016, almost two thirds (65.2 %) of people living in EU-28 households composed of single persons with dependent children were unable to face unexpected financial expenses.
Relatively high shares were also recorded for households composed of single women (46.5 %) and single men (39.7 %).
In 2016, more than three quarters of the population living in single-parent households were unable to face unexpected financial expenses in Latvia, Bulgaria and Croatia, while this share exceeded four fifths in the United Kingdom, Hungary and Ireland (where a peak of 87.6 % was recorded; 2015 data).
As noted above, almost half (46.5 %) of all single-female households in the EU-28 reported an inability to face unexpected financial expenses, with this share ranging from a low of 26.8 % in Luxembourg (2015 data) up to a high of 86.6 % in Bulgaria (2016 data). In Italy, Slovenia, Greece, Lithuania, Latvia and Bulgaria, the share of women living alone who faced difficulties in coping with unexpected financial expenses in 2016 was higher than for any of the other household types analysed in Table 2.5.
Households composed of two adults generally recorded lower levels of inability to deal with unexpected financial expenses; this was particularly the case for the subpopulation living in households composed of two adults with at least one member aged 65 years or over, among which approximately a quarter (25.7 %) of individuals in the EU-28 were unable to face unexpected financial expenses in 2016. This pattern was repeated in a majority of the EU Member States, although there were exceptions in several eastern, southern and Baltic Member States — Bulgaria, Estonia, Greece, Croatia, Italy, Cyprus, Latvia, Lithuania, Malta, Poland, Portugal, Romania, Slovenia and Slovakia. In each of these, the lowest shares of people facing difficulties in meeting unexpected financial expenses were recorded for households composed of two adults with one or two dependent children.

2Effects of income on living conditions
Living conditions in Europe — 2018 edition 49
Table 2.5: Inability to face unexpected financial expenses by household type, 2016(%)
Households without children Households with children
Total Single male
Single female
Two adults, at least one aged 65 years or
over
Total
Single adult with
depend‑ent
chil dren
Two adults
with one depend‑ent child
Two adults
with two depend‑
ent chil dren
EU-28 33.6 39.7 46.5 25.7 39.3 65.2 32.6 31.6 Belgium 21.4 32.9 33.8 10.4 30.0 59.4 24.2 18.9 Bulgaria 58.0 70.3 86.6 68.8 50.6 77.1 46.7 45.4 Czech Republic 30.4 38.6 50.2 23.6 33.7 67.7 29.4 27.9 Denmark 23.5 29.0 32.3 13.3 25.5 59.3 23.6 18.4 Germany 28.7 38.5 46.0 14.7 31.7 62.3 27.3 24.7 Estonia 33.0 42.0 45.3 28.2 30.2 55.2 29.4 25.1 Ireland (1) 41.6 48.5 49.5 31.5 55.1 87.6 50.4 47.7 Greece 54.1 51.7 65.1 53.3 53.0 63.2 45.5 48.6 Spain 36.3 38.6 41.9 32.3 41.0 62.2 35.8 32.5 France 25.7 31.2 36.8 16.6 37.6 64.5 30.3 30.0 Croatia 60.6 67.1 75.6 58.6 55.3 79.4 50.5 51.1 Italy 41.0 43.3 52.9 39.6 39.4 45.7 35.1 35.1 Cyprus 56.7 56.1 65.8 51.6 56.5 74.5 53.5 46.6 Latvia 61.3 65.2 78.0 63.0 58.7 77.0 53.4 51.9 Lithuania 53.7 63.0 70.1 54.5 52.6 66.1 44.9 48.8 Luxembourg (1) 20.9 30.4 26.8 10.3 24.7 48.5 25.2 18.7 Hungary 45.5 52.3 54.1 36.0 56.4 84.4 47.0 43.7 Malta 18.8 22.0 28.4 18.4 22.6 49.0 16.9 17.8 Netherlands 23.0 35.0 38.7 13.6 22.0 56.5 23.0 15.7 Austria 19.6 29.2 32.6 7.8 25.9 50.2 18.7 18.9 Poland 40.0 48.2 60.5 37.4 36.2 67.5 30.6 31.9 Portugal 37.3 40.8 50.9 35.4 39.2 61.4 33.9 30.6 Romania 53.4 60.6 72.3 49.8 55.4 74.7 45.0 52.0 Slovenia 44.6 47.2 63.1 38.5 39.2 60.4 41.1 36.5 Slovakia 36.0 50.3 50.2 38.6 39.4 62.5 30.0 34.2 Finland 27.5 41.8 41.4 13.1 31.6 65.5 26.9 22.1 Sweden 17.9 30.1 28.2 6.7 24.0 47.4 16.4 14.7 United Kingdom 29.0 40.9 40.8 19.0 47.4 80.5 33.8 36.7 Iceland (1) 34.1 44.0 51.7 20.6 38.8 68.2 36.5 34.9 Norway 17.7 25.6 28.2 7.9 18.5 44.9 10.8 13.3 Switzerland 16.5 22.4 23.1 9.6 26.5 42.3 23.4 19.6 Former Yugoslav Republic of Macedonia (1) 59.7 69.5 81.2 60.8 57.8 62.4 60.1 55.1
Serbia 50.9 54.0 68.7 50.9 46.3 66.9 37.0 44.0 Turkey (1) 30.4 34.4 52.2 41.3 33.5 55.5 26.1 30.4
Note: refers to the ability of a household to cover — from their own resources — an unexpected expense that is defined as 1/12 of the national at-risk-of-poverty threshold.
(1) 2015.
Source: Eurostat (online data code: ilc_mdes04)

2 Effects of income on living conditions
Living conditions in Europe — 2018 edition50
Figure 2.13: Share of population living in households by their ability to make ends meet, EU‑28, 2016(%)
With greatdi�culty,
9.1
With di�culty,
15.0
With some
di�culty, 28.3
Fairly easily,
26.8
Easily, 15.4
Very easily, 5.4
Note: refers to a subjective, non-monetary assessment about the level of difficulty experienced by households in making ends meet.
Source: Eurostat (online data code: ilc_mdes09)
Just less than one tenth of the EU‑28 population had great difficulty with making ends meet
Figure 2.13 presents an alternative measure of financial inclusion/exclusion, defined in relation to the ability of individuals ‘to make ends meet’; this indicator is based on a subjective measure, namely, a household’s self-perceived feeling about the level of difficulty they experience when paying for everyday expenses (items that are considered usual or necessary).
Just less than one tenth (9.1 %) of the EU-28 population reported great difficulty with making ends meet in 2016, while an additional 43.3 % reported difficulty or some difficulty in making ends meet; as such, more than half (52.4 %) of the EU-28 population perceived that they faced at least some difficulty in their ability to make ends meet in 2016. By contrast, approximately 1 in 20 persons (5.4 %) within the EU-28
population declared that it was very easy to make ends meet.
Cross-country comparisons (see Figure 2.14) reveal that in 2016 more than half of the population in Croatia (51.4 %) and Cyprus (59.8 %) reported having difficulty or great difficulty in making ends meet, while this share rose to more than three fifths of the population in Bulgaria (61.7 %) and to more than three quarters of the population in Greece (76.8 %); more than half the populations of the former Yugoslav Republic of Macedonia (55.5 %; 2015 data) and Serbia (63.9 %) also faced difficulty or great difficulty in making ends meet.
On the other hand, less than 1 in 10 persons in Sweden (7.6 %), Germany (6.9 %) and Finland (also 6.9 %) reported facing difficulty or great difficulty in making ends meet; this was also the case in Norway (5.4 %).

2Effects of income on living conditions
Living conditions in Europe — 2018 edition 51
Figure 2.14: Share of population living in households that have difficulty or great difficulty in making ends meet, 2016(%)
0
10
20
30
40
50
60
70
80
EU-2
8
Gree
ceBu
lgar
iaCy
prus
Croa
tiaRo
man
iaHu
ngar
yLa
tvia
Port
ugal
Spai
nIta
ly (1
)Ire
land
(2)
Lith
uani
aSl
ovak
iaSl
oven
iaPo
land
Czec
h Re
publ
icBe
lgiu
mM
alta
Fran
ceUn
ited
King
dom
Esto
nia
Aust
riaN
ethe
rland
sLu
xem
bour
g (2)
Den
mar
kSw
eden
Germ
any
Finl
and
Icel
and
(2)Sw
itzer
land
Nor
way
Serb
iaFo
rm. Y
ug. R
ep. o
f Mac
edon
ia (2
)Tu
rkey
(2)
With di�culty With great di�culty
(1) Provisional.(2) 2015.
Source: Eurostat (online data code: ilc_mdes09)


3 Housing quality

3 Housing quality
Living conditions in Europe — 2018 edition54
In the context of material living standards and well-being, housing is a fundamental characteristic. Indeed, many people would agree that being able to afford adequate housing of decent quality in a safe environment is a basic need, as a dwelling should provide shelter, adequate space for its occupants to live, eat and sleep, as well as a degree of privacy for the household as a whole and for its individual members.
Housing quality is a broad term that covers a wide range of issues, which are related not only to the dwelling itself, but also to the broader residential area surrounding where people live. Housing quality may be assessed, for example, in relation to: structural issues such as damp walls or a leaking roof; overcrowding or a shortage of space; ability to keep home adequately warm or, a lack of basic amenities (for example, , hot and cold running water, or bathing and sanitary facilities). It may also be assessed through a wider residential context, for example, whether (or not) people are living in a noisy area, are exposed to pollution, or feel unsafe in their neighbourhood. The information presented in this chapter generally analyses these aspects in terms of the subjective responses of individuals to questions about their local environment.
Overall, 16.6 % of the Europeans lived in an overcrowded household in 2016. There were considerable differences between European Union (EU) Member States, with overcrowding more prevalent in the southern and eastern Member States, while cross-country comparisons revealed that the highest levels of overcrowding were usually concentrated in cities (where space is often at a premium).
In 2016, some 15.4 % of the EU-28 population reported that they were living in a dwelling with a leaking roof, damp walls, floors or foundation, or rot in window frames or the floor, while almost half this share of the population — some 8.7 % — were unable to keep their home adequately warm.
In 2016, 17.9 % of the EU-28 population considered that noise from neighbours or from the street was a problem; this share was slightly higher than the corresponding proportions of the EU-28 population who declared that they faced problems in relation to pollution and grime (14.0 %), or crime, violence or vandalism (13.0 %). For all three of these issues, the prevalence of these problems across the EU-28 diminished during the five-year period from 2011 to 2016.
For many households their largest single expenditure item each month is in relation to housing costs. In those cases where housing costs represent a considerable share of total household expenditure, it is increasingly likely that the population may have to defer or cancel expenditure on other items (possibly in relation to some basic needs). The housing cost overburden rate is defined by those households which allocate 40 % or more of their disposable income to housing. In 2016, this rate covered 11.1 % of the EU-28 population (and was much higher among tenants than owners), with shares rising above 15.0 % in Germany and Bulgaria, while a peak of 40.5 % was recorded in Greece.
3.1 Housing conditionsPoor housing conditions are one of the main contributing factors that prevent Europeans from enjoying an acceptable standard of living. The first part of this chapter analyses the distribution of housing stock before looking in more detail at overcrowding, living space and structural issues that impact on the quality of housing available to people living in the EU.
Europeans tend to live more in houses than in flats
In 2016, 41.8 % of the EU-28 population lived in flats, while a majority of people lived in a house — just over one third (33.5 %) of the population lived in detached houses and almost one quarter (24.0 %) were living in semi-detached houses (see Figure 3.1).

3Housing quality
Living conditions in Europe — 2018 edition 55
The share of persons living in flats ranged from 7.4 % in Ireland (2015 data) and 14.3 % in the United Kingdom to cover more than three out of every five people in Estonia (62.0 %), Latvia (66.1 %) and Spain (also 66.1 %).
On the other hand, more than half of the population in Poland (51.9 %) and Denmark (54.9 %) lived in detached houses, while this share rose to more than 60.0 % in Romania (61.9 %), Hungary (62.8 %) and Slovenia (65.5 %), peaking at 71.0 % in Croatia; a relatively high share of the populations in Norway (59.9 %) and Serbia (64.2 %) also lived in detached houses.
Ireland (51.6 %; 2015 data), the Netherlands (58.4 %) and the United Kingdom (60.1 %) were the only EU Member States where more than half of the population was living in a semi-detached house in 2016.
Almost 7 out of 10 persons in the EU‑28 lived in an owner‑occupied dwelling
Many Europeans strive to become homeowners, as this may offer increased security of tenure,
while at the same time providing a means of generating wealth.
In 2016, almost 7 out of 10 (69.3 %) persons in the EU-28 lived in an owner-occupied dwelling (see Figure 3.2). Across each of the EU Member States, at least half of the population owned their own home, with this share ranging from 51.7 % in Germany and 55.0 % in Austria — the only Member States having less than 60.0 % of their population owning their own dwelling — to 90.1 % in Croatia, 90.3 % in Lithuania and 96.0 % in Romania.
A closer analysis reveals that 42.7 % of the EU-28 population lived in an owner-occupied dwelling without a housing loan or mortgage in 2016. The share of the population that were homeowners and did not have an outstanding mortgage or housing loan was generally quite high in eastern Europe and the Baltic Member States: for example, in Romania, Slovakia, Croatia and Lithuania it rose to more than 80.0 %. By contrast, in much of western Europe, more than one third of homeowners had a mortgage or loan and this share rose to more than half in
Figure 3.1: Population distribution by type of dwelling, 2016(%)
0
25
50
75
100
EU-2
8 (1)
Spai
nLa
tvia
Esto
nia
Lith
uani
aGe
rman
yGr
eece
Mal
taIta
ly (2
)Cz
ech
Repu
blic
Slov
akia
Bulg
aria
Swed
enAu
stria
Port
ugal
Pola
ndRo
man
ia (3
)Lu
xem
bour
g (2)
Finl
and
Fran
ceD
enm
ark
Hung
ary
Slov
enia
Cypr
usBe
lgiu
mCr
oatia
Net
herla
nds
Unite
d Ki
ngdo
mIre
land
(2)
Switz
erla
ndIc
elan
d (2)
Nor
way
Serb
ia
Flat Semi-detached or terraced house Detached house Other
(1) Estimates.(2) 2015.
(3) Provisional.
Source: Eurostat (online data code: ilc_lvho01)

3 Housing quality
Living conditions in Europe — 2018 edition56
Figure 3.2: Population distribution by tenure status, 2016(%)
0
25
50
75
100
EU-2
8 (1)
Rom
ania
(2)
Lith
uani
aCr
oatia
Slov
akia
Hung
ary
Pola
ndBu
lgar
iaEs
toni
aM
alta
Latv
iaCz
ech
Repu
blic
Spai
nPo
rtug
alSl
oven
iaGr
eece
Luxe
mbo
urg
(3)Ita
ly (3
)Cy
prus
Finl
and
Belg
ium
Irela
nd (3
)N
ethe
rland
sSw
eden
Fran
ceUn
ited
King
dom
Den
mar
kAu
stria
Germ
any
Nor
way
Icel
and
(3)Sw
itzer
land
F orm
. Yug
. Rep
. of M
aced
onia
(3)
Serb
iaTu
rkey
(3)
Tenant, rent at reduced price or freeOwner, no outstanding mortgage or housing loanTenant, rent at market price
Owner, with mortgage or loan
Note: ranked on the overall share of the population living in owner-occupied dwellings.
(1) Estimates.(2) Provisional.
(3) 2015.
Source: Eurostat (online data code: ilc_lvho02)
Sweden (54.8 %) and the Netherlands (61.0 %); even higher shares were recorded in Norway (62.3 %) and Iceland (62.8 %; 2015 data).
Just over three tenths (30.7 %) of the EU-28 population lived in rented accommodation in 2016: some 19.8 % of the population were tenants living in dwellings with a market rent, while 10.9 % lived in rent-free or reduced price dwellings. Among the EU Member States, the share of people living in a dwelling with a market price rent rose to more than 30.0 % in the Netherlands, Sweden, Denmark and Germany (where a peak of 39.8 % was recorded). There was a relatively high share of the population living in rent-free or reduced price dwellings in France (16.0 %), the United Kingdom (18.6 %) and Slovenia (19.6 %); this was also the case in Turkey (16.1 %; 2015 data).
SUFFICIENCY OF SPACE IN THE DWELLING
Despite a slowdown in population growth, many EU Member States are characterised by a shortage of (adequate) housing; this reflects, at least in part, a change in the composition of households, as an increasing share of the population choose to live alone, while fewer extended families occupy the same dwelling.
The overcrowding rate is defined on the basis of the number of rooms available to a household, the household’s size, family situation and the ages of its members. In 2016, some 16.6 % of the EU-28 population lived in an overcrowded household; this rate ranged from a low of less than 5.0 % in Cyprus, Malta, Ireland (2015 data), Belgium and the Netherlands, to more than 40.0 % in Hungary, Slovakia, Poland, Croatia,

3Housing quality
Living conditions in Europe — 2018 edition 57
Bulgaria, Latvia and Romania (where the highest share was recorded, at 48.4 %).
As such, the overcrowding rate was generally higher in eastern and to a lesser degree southern
Europe, while it was generally lower in western Europe and the Nordic Member States (see Map 3.1).
Map 3.1: Overcrowding rate, 2016(%)
Administrative boundaries: © EuroGeographics © UN-FAO © Turkstat
Note: Ireland, Italy, Luxembourg, Iceland, the former Yugoslav Republic of Macedonia and Turkey, 2015.
Overcrowding rate, 2016(%)
0 200 400 600 800 km
Guadeloupe (FR)
0 25
Martinique (FR)
0 20
Guyane (FR)
0 100
Réunion (FR)
0 20
Açores (PT)
0 50
Madeira (PT)
0 20
Canarias (ES)
0 100
Malta
0 10
Liechtenstein
0 5
Cartography: Eurostat — GISCO, 05/2018
Source: Eurostat (online data code: ilc_lvho05a)
Mayotte (FR)
0 15
(%)EU-28 = 16.6
< 8.08.0 – < 16.016.0 – < 32.0>= 32.0Data not available
Note: Ireland, Italy, Luxembourg, Iceland, the former Yugoslav Republic of Macedonia and Turkey, 2015.
Source: Eurostat (online data code: ilc_lvho05a)

3 Housing quality
Living conditions in Europe — 2018 edition58
Figure 3.3: Overcrowding rate by degree of urbanisation, 2016(%)
0
10
20
30
40
50
60
EU-2
8 (1)
Rom
ania
Latv
iaBu
lgar
iaCr
oatia
Pola
ndSl
ovak
iaHu
ngar
yGr
eece
Italy
(2)
Lith
uani
aCz
ech
Repu
blic
Aust
riaSw
eden
Esto
nia
Slov
enia
Port
ugal
Den
mar
kUn
ited
King
dom
Fran
ceGe
rman
yLu
xem
bour
g (2)
Finl
and
Spai
nN
ethe
rland
sBe
lgiu
mIre
land
(2)
Mal
ta (3
)Cy
prus
Icel
and
(2)Sw
itzer
land
Nor
way
Serb
ia
Cities Towns and suburbs Rural areasNote: ranked on the total overcrowding rate.
(1) Rural areas: estimate.(2) 2015.
(3) Rural areas: low reliability.
Source: Eurostat (online data codes: ilc_lvho05a and ilc_lvho05d)
Figure 3.3 shows that people living in cities were more likely to be living in crowded conditions than those living in towns and suburbs or rural areas. In 2016, 17.6 % of city-dwellers in the EU-28 were living in an overcrowded household, while the corresponding shares for people living in rural areas (17.1 %) and towns and suburbs (14.9 %) were somewhat lower.
There was more variation among the EU Member States in terms of the distribution of overcrowded households by degree of urbanisation. In 2016, overcrowding rates for people living in the cities of Denmark, the Czech Republic, Sweden and Italy (2015 data) were 10-12 percentage points higher than for the population living in rural areas, while this gap widened to 15.2 points difference in Bulgaria and peaked at 20.5 points difference in Austria. There
were a few exceptions to this general pattern of higher levels of overcrowding in cities, notably in Slovakia, Latvia and Spain (where the highest overcrowding rates were recorded for people living in towns and suburbs) and Poland and Hungary (where the highest overcrowding rates were recorded for people living in rural areas).
Alongside the overcrowding rate, another measure which may be used to analyse living space is the average number of rooms per person. In 2016, each EU-28 inhabitant had an average of 1.6 rooms.
In keeping with the results already presented for overcrowding, the average number of rooms per person was lower, at 1.5, for those people living in cities than it was for those people living in rural areas (1.7 rooms). Differences in the average

3Housing quality
Living conditions in Europe — 2018 edition 59
Figure 3.4: Average number of rooms per person by degree of urbanisation, 2016(rooms)
0.0
0.5
1.0
1.5
2.0
2.5
EU-2
8 (1)
Belg
ium
Irela
nd (2
)M
alta
(3)
Cypr
usLu
xem
bour
g (2)
Den
mar
kSp
ain
Net
herla
nds
Finl
and
Unite
d Ki
ngdo
mGe
rman
yFr
ance
Port
ugal
Swed
enEs
toni
aAu
stria
Czec
h Re
publ
icLi
thua
nia
Slov
enia
Italy
(2)
Bulg
aria
Gree
ceLa
tvia
Hung
ary
Croa
tiaPo
land
Slov
akia
Rom
ania
Nor
way
Switz
erla
ndIc
elan
d (2)
Serb
ia
Rural areasTowns and suburbsCities
Note: ranked on the average number of rooms per person for all types of regions.
(1) Rural areas: estimate.(2) 2015.
(3) Rural areas: low reliability.
Source: Eurostat (online data code: ilc_lvho04d)
numbers of rooms per person were generally much greater between EU Member States rather than within individual Member States. In 2016, the average number of rooms per person ranged from a high of 2.2 in Belgium and values of at least 2.0 rooms per person in Ireland (2015 data), Malta, Cyprus and Luxembourg (2015 data), down to 1.1 rooms per person in Croatia, Poland and Slovakia, with the lowest average recorded in Romania (1.0 rooms per person); among the non-member countries, Norway recorded a relatively high average number of rooms per person (2.1), while the average in Serbia (0.9 rooms) was lower than in any of the EU Member States.
People living in rural areas tended to report the highest (or joint highest) average number
of rooms per person. In 2016, this pattern held in the vast majority of the EU Member States, although the highest average number of rooms in Cyprus and Slovenia was recorded for people living in cities, and in Malta for people living in towns and suburbs.
A comparison within individual EU Member States reveals that the average number of rooms per person was generally quite similar when analysed by degree of urbanisation. In the United Kingdom, those living in rural areas had, on average, 0.6 more rooms per person than people living in cities, while a similar pattern was observed in Denmark and Luxembourg (2015 data), where the difference was 0.4 rooms per person.

3 Housing quality
Living conditions in Europe — 2018 edition60
In 2016, the average number of rooms per person was somewhat higher, at 1.7 rooms, for EU-28 homeowners than it was for tenants living in rented accommodation, 1.5 rooms per person (see Table 3.1). As may be expected, the space available to people living in houses was, on average, greater than that available to people living in flats. This was particularly the case among homeowners, as people living in houses had, on average, 0.3 more rooms per person than homeowners living in flats. There was almost no difference in the average size of dwellings among tenants, whether they resided in houses (1.6 rooms per person) or flats (1.5 rooms per person).
The average number of rooms per person was higher for homeowners than for tenants in each of the EU Member States in 2016, with the exception of the Netherlands (where tenants lived, on average, in larger dwellings) and Malta (where the dwellings were of similar size).
Space constraints on tenants were particularly apparent in Luxembourg (2015 data) and the United Kingdom, where tenants had 0.7 fewer rooms per person than homeowners; in Ireland (2015 data), Sweden, Austria and Romania, the corresponding gap was at least 0.5 rooms in favour of homeowners.

3Housing quality
Living conditions in Europe — 2018 edition 61
Table 3.1: Average number of rooms per person by tenure status and type of dwelling, 2016(rooms)
Total population
Owner TenantTotal House Flat Total House Flat
EU-28 1.6 1.7 1.8 1.5 1.5 1.6 1.5Belgium 2.2 2.2 2.2 2.4 2.0 2.0 1.9Bulgaria 1.2 1.2 1.3 1.1 0.8 0.7 0.8Czech Republic 1.5 1.5 1.6 1.4 1.1 1.2 1.1Denmark 1.9 2.0 2.0 1.8 1.8 2.0 1.7Germany 1.8 1.9 1.9 1.9 1.6 1.6 1.6Estonia 1.6 1.7 1.8 1.5 1.4 1.5 1.4Ireland (1) 2.1 2.2 2.3 1.7 1.6 1.6 1.4Greece 1.2 1.3 1.3 1.2 1.1 1.0 1.1Spain 1.9 2.0 2.1 1.9 1.6 1.8 1.6France 1.8 2.0 2.0 1.7 1.6 1.6 1.5Croatia 1.1 1.1 1.1 1.0 0.9 0.9 0.9Italy (1) 1.4 1.4 1.5 1.4 1.1 1.1 1.1Cyprus 2.0 2.0 2.0 2.1 1.9 1.9 1.9Latvia 1.2 1.2 1.4 1.1 0.9 1.0 0.9Lithuania (2) 1.5 1.5 1.7 1.4 1.2 1.3 1.2Luxembourg (1) 2.0 2.2 2.2 1.8 1.5 1.8 1.4Hungary 1.2 1.2 1.2 1.2 0.9 0.8 1.0Malta 2.1 2.1 2.3 2.0 2.1 2.5 2.0Netherlands 1.9 1.9 1.9 2.0 2.1 2.1 2.1Austria 1.6 1.8 1.8 1.6 1.3 1.4 1.3Poland 1.1 1.1 1.2 1.0 0.8 0.9 0.8Portugal 1.7 1.7 1.8 1.5 1.5 1.5 1.5Romania (2) 1.0 1.1 1.1 0.9 0.6 0.7 0.6Slovenia 1.5 1.6 1.6 1.5 1.2 1.3 1.1Slovakia 1.1 1.2 1.3 1.0 0.8 0.9 0.9Finland 1.9 2.0 2.0 2.0 1.6 1.7 1.5Sweden 1.7 1.9 2.0 1.6 1.4 1.8 1.3United Kingdom 1.9 2.2 2.2 1.9 1.5 1.5 1.4Iceland (1) 1.6 1.6 1.7 1.5 1.4 1.4 1.4Norway 2.1 2.1 2.2 1.9 1.7 1.8 1.6Switzerland 1.9 2.1 2.1 2.0 1.7 1.9 1.7Former Yugoslav Republic of Macedonia (1)(3) 0.9 0.9 1.0 0.8 0.9 1.2 0.7
Serbia 0.9 0.9 1.0 0.9 0.8 0.8 0.7Turkey (1) 1.0 1.0 0.9 1.1 1.0 0.8 1.1
(1) 2015.(2) Tenants living in houses: low reliability.
(3) Tenants living in houses and tenants living in flats: low reliability.
Source: Eurostat (online data code: ilc_lvho03)

3 Housing quality
Living conditions in Europe — 2018 edition62
Figure 3.5: Share of population living in a dwelling with a leaking roof, damp walls, floors or foundation, or rot in window frames or floor, EU‑28, 2006‑2016(%)
0.0
2.5
5.0
7.5
10.0
12.5
15.0
17.5
20.0
2006 2007 2008 2009 2010 2011 2012 2013 2014 2015 2016
Note: EU-27 instead of EU-28, 2006-2009. Estimate: 2006.
Source: Eurostat (online data code: ilc_mdho01)
STRUCTURAL PROBLEMS FOR DWELLINGS
Among the various structural problems that may be experienced in a dwelling, some 15.4 % of the EU-28 population reported that in 2016 their home had a leaking roof, damp walls, floors or foundations, or rot in its window frames or floor. Between 2006 and 2009, the proportion of the EU population that lived in a dwelling that was affected by at least one of these issues fell from 18.9 % to 16.0 %. There was a slight increase in 2010 (which may be linked to a lack of investment following the global financial and economic crisis), after which the share of population living in a dwelling with a leaking roof, damp walls, floors or foundation, or rot in its window frames or floor fluctuated (see Figure 3.5).
More than 1 out of every 11 persons in the EU‑28 was unable to keep their home adequately warm
Overall, some 8.7 % of the EU-28 population in 2016 could not afford to keep their home adequately warm (see Table 3.2); this share increased to 21.0 % of the EU-28 population when analysing those individuals who were at risk of poverty.
In 2016, more than one fifth of the population living in Portugal (22.5 %) and Cyprus (24.3 %) and more than one quarter of the population living in Greece (29.1 %) and Lithuania (29.3 %) was unable to keep their home adequately warm; this share peaked in Bulgaria, at 39.2 %.

3Housing quality
Living conditions in Europe — 2018 edition 63
Table 3.2: Share of population unable to keep home adequately warm by risk of poverty, 2011‑2016(%)
Total population Population at risk of poverty2011 2012 2013 2014 2015 2016 2011 2012 2013 2014 2015 2016
EU‑28 9.8 10.8 10.7 10.2 9.4 8.7 22.0 24.5 24.2 23.5 22.7 21.0 Belgium 7.1 6.6 5.8 5.4 5.2 4.8 20.9 18.7 18.4 18.3 14.8 16.2 Bulgaria (1)(2) 46.3 46.5 44.9 40.5 39.2 39.2 68.9 70.0 69.7 66.0 66.8 61.9 Czech Republic 6.4 6.7 6.2 6.1 5.0 3.8 13.4 15.3 14.6 15.6 13.5 13.0 Denmark 2.3 2.5 3.8 2.9 3.6 2.7 7.4 8.4 10.2 5.8 12.7 7.9 Germany 5.2 4.7 5.3 4.9 4.1 3.7 16.8 14.8 16.5 13.3 12.7 12.4 Estonia (1) 3.0 4.2 2.9 1.7 2.0 2.7 8.1 9.6 5.7 3.7 6.1 6.1 Ireland 6.8 8.4 10.0 8.9 9.0 : 12.5 16.1 19.5 17.0 19.1 : Greece 18.6 26.1 29.5 32.9 29.2 29.1 38.8 47.6 48.4 52.6 50.9 52.5 Spain 6.5 9.1 8.0 11.1 10.6 10.1 13.2 18.9 15.6 23.5 23.3 23.2 France 6.0 6.0 6.6 5.9 5.5 5.0 16.9 15.2 17.7 15.0 16.3 14.0 Croatia 9.8 10.2 9.9 9.7 9.9 9.3 22.5 23.9 24.0 24.3 23.7 21.7 Italy 17.8 21.3 18.8 18.0 17.0 15.8 36.1 44.0 40.4 38.3 35.9 : Cyprus 26.6 30.7 30.5 27.5 28.3 24.3 46.3 50.6 51.0 47.5 49.2 49.0 Latvia 22.5 19.9 21.1 16.8 14.5 10.6 40.8 35.1 35.5 31.0 29.1 22.7 Lithuania 36.2 34.1 29.2 26.5 31.1 29.3 40.1 38.2 34.0 34.7 39.4 29.8 Luxembourg 0.9 0.6 1.6 0.6 0.9 : 2.2 2.2 4.5 2.0 3.3 : Hungary 12.2 15.0 14.6 11.6 9.6 9.2 29.4 35.1 34.0 29.4 24.7 22.7 Malta 17.6 22.1 23.4 22.1 13.9 6.8 28.1 32.1 34.9 35.5 28.0 13.6 Netherlands (2) 1.6 2.2 2.9 2.6 2.9 2.6 6.6 8.7 6.3 9.0 8.2 7.9 Austria 2.7 3.2 2.7 3.2 2.6 2.7 8.6 7.7 8.3 7.7 8.0 8.7 Poland 13.6 13.2 11.4 9.0 7.5 7.1 28.7 27.6 23.8 20.7 18.7 16.7 Portugal 26.8 27.0 27.9 28.3 23.8 22.5 44.8 43.1 44.6 47.5 43.3 42.7 Romania 15.6 15.0 14.7 12.9 13.1 13.8 26.7 25.8 25.6 24.6 27.3 25.6 Slovenia 5.4 6.1 4.9 5.6 5.6 4.8 12.4 17.3 13.1 15.4 13.6 14.2 Slovakia 4.3 5.5 5.4 6.1 5.8 5.1 10.4 13.6 16.1 22.4 17.8 17.0 Finland 1.8 1.5 1.2 1.5 1.7 1.7 3.8 3.8 2.8 3.3 3.7 3.8 Sweden (3) 1.6 1.4 0.8 0.8 1.2 2.6 3.9 3.5 3.7 2.7 2.5 4.6 United Kingdom (4) 6.5 8.1 10.6 9.4 7.8 6.1 11.4 19.2 21.7 20.2 18.6 14.2 Iceland 2.0 1.5 1.4 1.8 1.4 : 3.7 3.5 2.7 4.4 2.8 : Norway 1.2 0.7 0.9 0.6 0.5 0.9 4.3 2.3 3.6 2.3 2.4 4.5 Switzerland (1) 0.7 0.4 0.4 0.7 0.6 0.6 1.4 1.0 0.7 2.6 0.8 2.0 Former Yugoslav Republic of Macedonia 26.7 26.8 26.4 26.1 23.4 : 48.9 45.9 41.2 51.0 44.2 :
Serbia : : 18.3 17.1 15.2 13.3 : : 30.0 26.5 25.1 21.6 Turkey 35.4 37.2 29.3 15.5 15.9 : 56.3 59.9 58.7 36.1 45.8 :
(1) 2014: break in series.(2) 2016: break in series.
(3) 2015: break in series.(4) 2012: break in series.
Source: Eurostat (online data code: ilc_mdes01)

3 Housing quality
Living conditions in Europe — 2018 edition64
Among those subpopulations at risk of poverty, the share that could not afford to adequately warm their home in 2016 was higher than 20.0 % in 11 EU Member States, and was particularly high in Italy (35.9 %; 2015 data), Portugal (42.7 %), Cyprus (49.0 %), Greece (52.5 %) and Bulgaria (61.9 %).
Energy prices tend to fluctuate far more than the inflation rate and during the period 2011-2013 they were relatively high. However, during most of 2014 the price of energy fell at quite a rapid pace; thereafter, energy prices remained at relatively low levels (compared with historical developments). This pattern was reflected in the share of the EU-28 population that was unable to keep their home adequately warm, which peaked in 2012 and 2013 after which it fell for three successive years during the period 2014-2016.
3.2 Living environmentsLiving conditions are also affected by the quality of the local environment around residential areas where people live. Some people express concerns about issues such as noise, pollution, crime, violence or vandalism, which may impact on their quality of life.
Noise was the most widespread environmental problem for people living in the EU
In 2016, noise from neighbours or from the street was the most widespread environmental problem, as reported by 17.9 % of EU-28 inhabitants. An analysis by EU Member State in 2016 reveals that the issue of noise was particularly prevalent among those populations living in Luxembourg (2015 data), Romania, Portugal and the Netherlands, where between one quarter and one fifth of the population complained about noise in the local area where
they lived, a share that rose to 25.1 % in Germany and 26.2 % in Malta (see Table 3.3).
Compared with the other two issues presented in Table 3.3, noise was the main problem reported in a majority (20 out of 28) of the EU Member States in 2016. It was however more common to find that people in Latvia, Lithuania, Hungary, Malta and Slovenia complained about problems relating to pollution, grime or other environmental issues, while in Bulgaria, Ireland (2015 data) and Italy (also 2015 data) it was more common for people to complain about crime, violence or vandalism.
Between 2011 and 2016, the share of the EU-28 population perceiving noise as a problem dropped by 1.8 percentage points, while there were reductions of 1.1 percentage points in the shares of people who perceived pollution, grime and other environmental problems to be an issue and the shares of people who perceived crime, violence or vandalism to be an issue.
Among the EU Member States, it was commonplace to find a reduction in the proportion of people who claimed their living standards were affected by these three issues during the period 2011-2016. The proportion of people living in Cyprus and Romania who were affected by noise from their neighbours or from the street fell at a rapid pace, while the same was true in Malta and Cyprus for people affected by pollution, grime or other environmental problems, and in Latvia and Greece for people affected by crime, violence and vandalism. By contrast, during the period 2011-2015 an increasing proportion (4.2-5.9 percentage points) of the population living in Luxembourg was affected by all three of these issues, while there was a relatively large increase in the share of the population in Italy that was affected by crime, violence and vandalism (up 4.9 points).

3Housing quality
Living conditions in Europe — 2018 edition 65
Table 3.3: Share of population encountering environmental problems in/around their dwelling, 2006, 2011 and 2016(%)
Noise from neighbours or from the street
Pollution, grime or other environmental problems
Crime, violence or vandalism in the area
2006 2011 2016 2006 2011 2016 2006 2011 2016EU-28 : 19.7 17.9 : 15.1 14.0 : 14.1 13.0 Belgium 22.5 19.7 15.6 15.8 16.5 13.2 18.0 15.6 13.4 Bulgaria 17.7 12.2 10.0 22.7 15.9 15.1 24.5 27.2 25.0 Czech Republic 18.8 15.3 14.5 19.4 17.7 13.5 14.3 15.0 11.7 Denmark 18.4 18.6 18.2 7.9 8.9 6.8 13.6 15.7 8.4 Germany 28.9 25.8 25.1 24.5 23.1 23.2 12.6 12.9 14.1 Estonia 22.4 12.7 10.4 21.3 12.4 9.9 20.1 14.5 9.2 Ireland (1) 14.5 9.3 8.0 8.8 4.0 4.7 16.5 10.4 11.0 Greece 19.9 25.1 19.9 17.0 25.3 19.6 8.5 20.1 11.8 Spain 26.5 15.6 16.2 16.5 8.1 10.1 19.3 10.8 10.3 France 19.5 18.5 17.7 15.4 11.7 14.1 16.1 14.8 14.8 Croatia : 11.0 8.5 : 7.5 7.0 : 3.6 3.0 Italy (1) 25.0 20.8 18.3 21.4 19.5 17.6 14.8 14.5 19.4 Cyprus 36.0 27.5 15.6 24.4 19.2 9.2 12.9 15.0 9.8 Latvia 21.4 15.9 13.3 33.2 24.1 17.2 27.2 19.0 10.0 Lithuania 20.0 13.9 13.4 13.8 14.2 15.6 7.8 4.8 3.4 Luxembourg (1) 22.5 14.6 20.1 18.0 11.2 17.1 11.1 10.7 14.9 Hungary 17.1 9.9 12.2 12.9 12.0 12.8 10.0 10.9 9.7 Malta 25.9 30.1 26.2 38.6 41.4 30.3 12.5 12.7 10.4 Netherlands 31.3 23.6 24.9 14.3 14.3 13.2 16.7 18.6 16.9 Austria 18.7 19.2 17.3 7.5 10.5 10.7 12.1 12.1 12.4 Poland 19.7 14.5 13.0 13.0 11.2 11.4 9.0 6.3 5.6 Portugal 25.3 23.1 23.1 20.2 15.2 13.1 11.9 10.1 7.8 Romania : 28.3 20.3 : 19.1 14.5 : 16.3 14.1 Slovenia 17.5 17.2 13.4 20.3 19.0 15.9 9.5 8.6 8.5 Slovakia 19.4 16.3 12.1 19.8 17.1 9.3 8.4 10.0 6.9 Finland 16.5 13.1 12.0 12.6 8.8 7.2 15.3 8.3 6.5 Sweden 12.6 13.2 17.1 6.9 6.9 6.3 13.5 10.2 12.7 United Kingdom 22.3 19.8 17.0 13.2 11.5 9.0 27.6 20.7 16.8 Iceland (1) 12.0 12.0 11.4 7.9 10.7 9.0 2.4 2.3 2.2 Norway 11.9 12.1 10.1 7.1 7.5 6.8 3.9 4.9 4.6 Switzerland : 17.6 17.8 : 10.3 8.9 : 12.3 10.9 Former Yugoslav Republic of Macedonia (1) : 11.7 7.5 : 11.8 11.5 : 6.9 5.7
Serbia : : 12.2 : : 15.2 : : 18.2 Turkey (1) 25.2 16.3 16.8 28.0 26.6 24.2 21.4 10.7 11.2
Note: there are a large number of breaks in series.
(1) 2015 instead of 2016.
Source: Eurostat (online data codes: ilc_mddw01, ilc_mddw02 and ilc_mddw03)

3 Housing quality
Living conditions in Europe — 2018 edition66
Table 3.4 shows that across the EU-28 these three problems were more likely to be faced by the population at risk of poverty than by the total population: in 2016, the share of the population affected by noise was 3.0 percentage points higher for the population living at risk of poverty than it was for the whole population, while the share of people living at risk of poverty and affected by crime, violence or vandalism was 2.8 percentage points higher (than the average for the whole population), and the share of people living at poverty and affected by pollution, grime and other environmental problems was 1.6 percentage points higher (than for the total population).
In 2016, the share of population at risk of poverty and concerned by noise from neighbours or from the street was 1.5 times as high as the share recorded for the whole population in Belgium, Denmark and Ireland (2015 data). Croatia, Poland, Greece and especially Romania, were the only EU Member States to report that their subpopulations at risk of poverty were less likely to be exposed to noise than the average recorded for the total population.
In a similar vein, the share of population at risk of poverty and concerned by pollution, grime or
other environmental problems was at least 1.5 times as high as the share recorded for the whole population in Hungary and Belgium, while the share of the population at risk of poverty and concerned by crime, violence or vandalism was at least 1.5 times as high as the share recorded for the total population in Ireland (2015 data), the Czech Republic, Denmark and Hungary.
Europeans living in urban areas were generally more concerned with noise than those people living in rural areas
On average, 23.3 % of the EU-28’s population living in cities perceived noise from neighbours or from the street to be a problem in 2016. The share of the population suffering from noise was lower for those people living in towns and suburbs (17.6 %) or in rural areas (10.4 %) — see Figure 3.6.
In 2016, pollution, grime and other environmental issues were perceived as problems by 18.9 % of city-dwellers across the EU-28 (see Figure 3.7). Such problems were less prevalent among the subpopulations living in towns and suburbs (12.8 %) and especially rural areas (8.1 %).

3Housing quality
Living conditions in Europe — 2018 edition 67
Table 3.4: Share of population encountering environmental problems in/around their dwelling by risk of poverty, 2016(%)
Noise from neighbours or from the street
Pollution, grime or other environmental problems
Crime, violence or vandalism in the area
Total population
Population at risk of poverty
Total population
Population at risk of poverty
Total population
Population at risk of poverty
EU‑28 17.9 20.9 14.0 15.6 13.0 15.8 Belgium 15.6 23.6 13.2 20.5 13.4 19.3 Bulgaria 10.0 11.4 15.1 21.1 25.0 25.3 Czech Republic 14.5 19.5 13.5 19.1 11.7 18.2 Denmark 18.2 27.7 6.8 8.9 8.4 13.8 Germany 25.1 32.4 23.2 27.4 14.1 19.5 Estonia 10.4 11.6 9.9 10.5 9.2 9.8 Ireland (1) 8.0 12.0 4.7 5.6 11.0 16.1 Greece 19.9 16.0 19.6 16.4 11.8 10.3 Spain 16.2 20.0 10.1 13.1 10.3 14.1 France 17.7 24.8 14.1 16.3 14.8 20.9 Croatia 8.5 7.4 7.0 5.3 3.0 2.5 Italy (1) 18.3 19.4 17.6 18.6 19.4 18.6 Cyprus 15.6 17.1 9.2 12.3 9.8 8.5 Latvia 13.3 14.8 17.2 17.8 10.0 8.3 Lithuania 13.4 13.7 15.6 14.2 3.4 3.7 Luxembourg (1) 20.1 27.8 17.1 24.5 14.9 14.3 Hungary 12.2 15.9 12.8 19.2 9.7 16.0 Malta 26.2 30.4 30.3 32.5 10.4 10.9 Netherlands 24.9 34.5 13.2 16.4 16.9 22.9 Austria 17.3 20.9 10.7 11.4 12.4 10.4 Poland 13.0 11.9 11.4 9.3 5.6 4.9 Portugal 23.1 23.6 13.1 15.4 7.8 7.3 Romania 20.3 13.4 14.5 11.0 14.1 15.2 Slovenia 13.4 14.7 15.9 14.1 8.5 7.6 Slovakia 12.1 16.4 9.3 16.4 6.9 9.8 Finland 12.0 16.8 7.2 6.8 6.5 9.1 Sweden 17.1 21.7 6.3 7.1 12.7 16.8 United Kingdom 17.0 19.7 9.0 10.5 16.8 20.9 Iceland (1) 11.4 16.3 9.0 11.7 2.2 5.1 Norway 10.1 16.6 6.8 9.4 4.6 6.7 Switzerland 17.8 22.9 8.9 8.9 10.9 14.2 Former Yugoslav Republic of Macedonia (1) 7.5 6.3 11.5 11.2 5.7 4.5
Serbia 12.2 10.9 15.2 12.8 18.2 15.4 Turkey (1) 16.8 15.1 24.2 26.5 11.2 11.9
(1) 2015.
Source: Eurostat (online data codes: ilc_mddw01, ilc_mddw02 and ilc_mddw03)

3 Housing quality
Living conditions in Europe — 2018 edition68
Figure 3.6: Share of population reporting noise from neighbours or from the street by degree of urbanisation, 2016(%)
0
5
10
15
20
25
30
35
EU-2
8 (1)
Mal
ta (2
)Ge
rman
yN
ethe
rland
sPo
rtug
alRo
man
iaLu
xem
bour
g (3)
Gree
ceIta
ly (3
)D
enm
ark
Fran
ceAu
stria
Swed
enUn
ited
King
dom
Spai
nBe
lgiu
mCy
prus
Czec
h Re
publ
icLi
thua
nia
Slov
enia
Latv
iaPo
land
Hung
ary
Slov
akia
Finl
and
Esto
nia
Bulg
aria
Croa
tiaIre
land
(3)
Switz
erla
ndIc
elan
d (3)
Nor
way
Serb
ia
Cities Towns and suburbs Rural areas
Note: ranked on the share of the total population reporting noise from neighbours or from the street.
(1) Rural areas: estimate.(2) Rural areas: low reliability.
(3) 2015.
Source: Eurostat (online data codes: ilc_mddw01 and ilc_mddw04)
In 2016, almost one in five (19.1 %) persons living in cities across the EU-28 perceived crime, violence or vandalism as a problem. This share fell to 10.8 % among the subpopulation that was living in towns and suburbs and to 6.6 % for those people living in rural areas (see Figure 3.8).
As such, people living in cities across the EU-28 were, on average, more concerned by all three problems identified as having an impact on their living conditions and local environment.
Among the EU Member States, a similar pattern was observed in 2016 with the following exceptions:
• noise from neighbours or from the street was most commonly perceived as a problem by the subpopulation living in towns and suburbs in Romania;
• pollution, grime or other environmental problems were more frequently cited as problems by the subpopulations living in towns and suburbs in Luxembourg (2015 data) and Hungary;
• crime, violence or vandalism was more commonly perceived as a problem by the subpopulation of people living in the towns and suburbs of Hungary.

3Housing quality
Living conditions in Europe — 2018 edition 69
Figure 3.7: Share of population reporting pollution, grime or other environmental problems by degree of urbanisation, 2016(%)
0
5
10
15
20
25
30
35
EU-2
8 (1)
Mal
ta (2
)Ge
rman
yGr
eece
Italy
(3)
Latv
iaLu
xem
bour
g (3)
Slov
enia
Lith
uani
aBu
lgar
iaRo
man
iaFr
ance
Czec
h Re
publ
icBe
lgiu
mN
ethe
rland
sPo
rtug
alHu
ngar
yPo
land
Aust
riaSp
ain
Esto
nia
Slov
akia
Cypr
usUn
ited
King
dom
Finl
and
Croa
tiaD
enm
ark
Swed
enIre
land
(3)
Icel
and
(3)Sw
itzer
land
Nor
way
Serb
ia
Cities Towns and suburbs Rural areas
Note: ranked on the share of the total population reporting pollution, grime or other environmental problems.
(1) Rural areas: estimate.(2) Rural areas: low reliability.
(3) 2015.
Source: Eurostat (online data codes: ilc_mddw02 and ilc_mddw05)
Figure 3.8: Share of population reporting crime, violence or vandalism in their area by degree of urbanisation, 2016(%)
0
5
10
15
20
25
30
35
EU-2
8 (1)
Bulg
aria
Italy
(2)
Net
herla
nds
Unite
d Ki
ngdo
mLu
xem
bour
g (2)
Fran
ceGe
rman
yRo
man
iaBe
lgiu
mSw
eden
Aust
riaGr
eece
Czec
h Re
publ
icIre
land
(2)
Mal
ta (3
)Sp
ain
Latv
iaCy
prus
Hung
ary
Esto
nia
Slov
enia
Den
mar
kPo
rtug
alSl
ovak
iaFi
nlan
dPo
land
Lith
uani
aCr
oatia
Switz
erla
ndN
orw
ayIc
elan
d (2)
Serb
ia
Cities Towns and suburbs Rural areas
Note: ranked on the share of the total population reporting crime, violence or vandalism in their area.
(1) Rural areas: estimate.(2) 2015.
(3) Rural areas: low reliability.
Source: Eurostat (online data codes: ilc_mddw03 and ilc_mddw06)

3 Housing quality
Living conditions in Europe — 2018 edition70
3.3 Housing affordabilityIn 2010, a European Commission Communication titled, the European platform against poverty and social exclusion: a European framework for social and territorial cohesion (COM(2010) 758 final), addressed the issue of affordable accommodation by declaring that ‘access to affordable accommodation is a fundamental need and right’.
That said, housing costs often make up the largest component of expenditure for many households, thereby potentially leading to deferred or cancelled expenditure, possibly in relation to other basic needs.
Some 11.1 % of the EU‑28 population spent 40 % or more of their household disposable income on housing
Housing affordability may be analysed through the housing cost overburden rate, which shows the share of the population living in households that spent 40 % or more of their disposable income on housing.
The housing cost overburden rate for the EU-28 was 11.1 % in 2016. There were, however, large differences between the EU Member States, as the lowest rates — less than 7.0 % — were recorded in eight Member States, with lows of 3.1 % in Cyprus and 1.4 % in Malta (see Map 3.2). By contrast, the housing cost overburden rate was at least 15.0 % in Denmark, Germany and Bulgaria, rising to a peak of 40.5 % in Greece; a high share (28.2 %) was also recorded in Serbia. These differences may, at least partially, reflect differences in national policies for social
housing or public subsidies and benefits that are provided by governments for housing.
Having fluctuated between 2011 and 2016, the EU-28’s housing cost overburden rate was 0.3 percentage points lower at the end of the period under consideration (see Table 3.5). In half (14) of the EU Member States, the housing cost overburden rate fell between 2011 and 2016, while there were 10 Member States where the rate increased and four where it remained unchanged. The biggest reductions for the housing cost overburden rate were recorded in Latvia (down 5.5 percentage points), Hungary (− 4.2 points) and the United Kingdom (− 4.1 points); note that there was a relatively steady downward pattern to the rates observed in Latvia and Hungary, while in the United Kingdom there was a considerable reduction in 2012 after which the rate climbed and then remained relatively unchanged. The highest increases were recorded in Greece (16.3 percentage points), Bulgaria (12.0 points; note there is a break in series) and Luxembourg (5.2 points; note there is also a break in series).
The share of the population living in households that spent 40 % or more of their disposable income on housing was greater among EU-28 tenants than it was among homeowners in 2016; this was especially the case for tenants living in dwellings with a market price rent, for whom the housing cost overburden rate was 28.0 %, while it was 5.4 % for homeowners with a mortgage.
The housing cost overburden rate varied considerably across the EU Member States in 2016 when analysed by tenure status, as shown in Table 3.6. For tenants living in dwellings with a market price rent it ranged from a low of 8.4 %

3Housing quality
Living conditions in Europe — 2018 edition 71
Map 3.2: Housing cost overburden rate, 2016(%)
Administrative boundaries: © EuroGeographics © UN-FAO © Turkstat
Note: Ireland, Luxembourg, Slovakia, Iceland, the former Yugoslav Republic of Macedonia and Turkey, 2015.EU-28: estimate. Italy and Romania: provisional.
Housing cost overburden rate, 2016(%)
0 200 400 600 800 km
Guadeloupe (FR)
0 25
Martinique (FR)
0 20
Guyane (FR)
0 100
Réunion (FR)
0 20
Açores (PT)
0 50
Madeira (PT)
0 20
Canarias (ES)
0 100
Malta
0 10
Liechtenstein
0 5
Cartography: Eurostat — GISCO, 05/2018
Source: Eurostat (online data code: ilc_lvho07a)
Mayotte (FR)
0 15
(%)EU-28 = 11.1
< 7.07.0 – < 11.011.0 – < 15.0>= 15.0Data not available
Note: Ireland, Luxembourg, Slovakia, Iceland, the former Yugoslav Republic of Macedonia and Turkey, 2015. EU-28: estimate. Italy and Romania: provisional.
Source: Eurostat (online data code: ilc_lvho07a)

3 Housing quality
Living conditions in Europe — 2018 edition72
Table 3.5: Housing cost overburden rate by risk of poverty, 2011‑2016(%)
Total population Population at risk of poverty2011 2012 2013 2014 2015 2016 2011 2012 2013 2014 2015 2016
EU‑28 11.4 10.9 11.1 11.5 11.3 11.1 38.0 38.1 37.7 40.1 39.2 39.0 Belgium 10.6 11.0 9.6 10.4 9.4 9.5 42.7 44.0 39.0 42.6 37.6 37.6 Bulgaria (1) 8.7 14.5 14.3 12.9 14.8 20.7 25.8 46.0 38.5 40.4 44.6 55.3 Czech Republic 9.5 10.0 11.7 10.5 10.4 9.5 42.3 46.3 51.6 44.1 48.0 45.4 Denmark 18.5 16.7 17.9 15.6 15.1 15.0 71.0 69.4 75.2 68.1 66.8 74.1 Germany 16.1 16.6 16.4 15.9 15.6 15.8 46.3 51.7 49.2 54.4 51.9 50.3 Estonia (2) 7.4 7.9 7.2 8.3 6.8 4.9 29.5 32.4 29.3 30.8 25.8 19.3 Ireland 6.1 6.3 4.6 6.2 4.6 : 27.3 28.0 21.0 27.1 18.2 : Greece 24.2 33.1 36.9 40.7 40.9 40.5 78.8 90.5 93.1 95.0 95.8 91.9 Spain 10.0 10.7 10.3 10.9 10.3 10.2 35.8 40.0 38.3 39.6 38.1 36.4 France 5.2 5.2 5.2 5.1 5.7 5.2 22.2 22.2 23.1 20.9 21.5 22.3 Croatia 8.0 6.8 8.4 7.5 7.2 6.4 31.2 28.5 34.8 30.0 31.1 29.4 Italy 8.7 8.1 8.9 8.5 8.6 9.1 31.9 30.1 32.2 31.9 32.9 34.0 Cyprus 3.1 3.3 3.3 4.0 3.9 3.1 10.5 12.9 11.5 14.4 13.1 12.6 Latvia 12.5 11.2 11.4 9.6 8.1 7.0 37.9 35.9 38.2 32.5 25.9 25.2 Lithuania 11.1 8.9 8.2 7.1 9.1 7.8 38.0 33.1 28.8 27.4 32.2 29.6 Luxembourg (1) 4.2 4.9 5.6 6.8 6.0 9.4 23.6 23.9 25.9 30.9 27.9 37.0 Hungary 13.0 14.7 14.3 12.8 8.5 8.8 40.6 38.8 40.7 38.4 31.5 32.9 Malta 3.0 2.6 2.6 1.6 1.1 1.4 11.6 11.9 11.5 5.8 4.6 5.9 Netherlands (1) 14.5 14.4 15.7 15.4 14.9 10.7 42.8 46.6 48.3 51.1 51.4 42.9 Austria (3) 7.8 7.0 7.2 6.6 6.4 7.2 36.9 37.0 39.1 36.7 34.8 38.8 Poland 10.2 10.5 10.3 9.6 8.7 7.7 35.7 36.1 33.5 32.0 30.7 29.6 Portugal 7.2 8.3 8.3 9.2 9.1 7.5 26.4 28.8 30.9 33.7 33.5 29.1 Romania 10.5 18.4 16.9 16.2 15.9 14.4 23.2 45.0 41.5 40.1 42.6 38.8 Slovenia 4.7 5.2 6.0 6.4 6.1 5.7 22.5 26.0 26.3 29.4 27.7 28.3 Slovakia 8.4 8.4 8.3 9.0 9.1 : 38.4 36.3 36.2 36.4 34.5 : Finland 4.4 4.5 4.9 5.1 4.9 4.4 15.3 17.2 20.4 21.2 20.4 19.5 Sweden (4) 7.9 7.6 7.9 7.8 8.7 8.5 43.2 39.3 39.6 40.5 39.9 38.7 United Kingdom (2)(5) 16.4 7.3 7.9 12.5 12.4 12.3 52.8 26.0 27.0 41.7 40.0 42.4 Iceland 11.3 9.0 8.8 8.1 9.6 : 53.5 50.5 44.3 41.0 50.5 : Norway 10.4 9.7 9.6 8.2 9.4 9.7 49.3 44.0 42.5 41.5 43.2 43.6 Switzerland (2) 13.1 12.1 10.6 11.7 11.7 12.0 52.2 50.4 43.9 47.2 43.9 44.7 Former Yugoslav Republic of Macedonia 19.5 20.1 17.6 15.6 12.3 : 57.4 62.2 57.4 55.4 46.3 :
Serbia : : 28.0 32.6 29.1 28.2 : : 68.6 79.1 74.0 71.6 Turkey 10.7 9.8 11.7 10.3 10.5 : 19.4 16.9 20.4 19.8 20.5 :
(1) 2016: break in series.(2) 2014: break in series.(3) 2011: low reliability.
(4) 2015: break in series.(5) 2012: break in series.
Source: Eurostat (online data code: ilc_lvho07a)
in Slovenia (2015 data) up to 50.4 % in Bulgaria and 84.6 % in Greece. For homeowners that had a mortgage the housing cost overburden rate
ranged from less than 2.0 % in France, Malta, Finland, Luxembourg (2015 data) and Croatia up to more than one fifth in Bulgaria, more than
3Housing quality
Living conditions in Europe — 2018 edition 73
a quarter in Greece, and close to one third in Slovakia (2015 data) and Romania. Slovakia was the only EU Member State where the housing cost
overburden rate was higher among homeowners with a mortgage than it was for tenants living in dwellings with a market price rent.
Table 3.6: Housing cost overburden rate by tenure status, 2016(%)
Total population
Owner Tenant
With mortgage Without mortgage Market price Reduced price
or freeEU‑28 11.1 5.4 6.4 28.0 13.0 Belgium 9.5 2.4 1.3 35.4 11.9 Bulgaria 20.7 23.2 19.6 50.4 20.3 Czech Republic 9.5 6.0 5.2 29.3 10.6 Denmark 15.0 5.2 4.3 31.1 : Germany 15.8 10.3 9.2 23.0 19.1 Estonia 4.9 3.0 3.6 28.5 6.4 Ireland (1) 4.6 2.7 1.5 18.0 3.7 Greece 40.5 28.5 30.6 84.6 10.4 Spain 10.2 6.7 2.8 43.0 10.6 France 5.2 1.1 0.9 16.5 8.9 Croatia 6.4 1.8 5.9 45.2 7.7 Italy (1) 8.6 4.8 2.8 32.7 9.9 Cyprus 3.1 2.5 0.2 18.1 0.6 Latvia 7.0 9.3 5.8 13.0 8.0 Lithuania 7.8 3.3 7.3 48.3 12.2 Luxembourg (1) 6.0 1.4 0.7 23.2 4.0 Hungary 8.8 11.2 5.1 36.6 19.6 Malta 1.4 1.2 0.6 22.1 0.9 Netherlands 10.7 3.1 3.2 28.0 16.4 Austria 7.2 2.1 1.7 15.6 10.2 Poland 7.7 11.9 5.9 24.5 11.5 Portugal 7.5 4.4 2.9 31.9 5.4 Romania 14.4 32.5 13.7 36.3 19.2 Slovenia 5.7 7.7 2.8 29.0 7.7 Slovakia (1) 9.1 30.9 6.0 8.4 9.1 Finland 4.4 1.4 2.1 14.6 8.2 Sweden 8.5 2.8 7.5 18.0 5.6 United Kingdom 12.3 4.8 4.3 35.4 16.2 Iceland (1) 9.6 7.4 7.2 20.7 15.9 Norway 9.7 6.7 4.3 34.0 18.6 Switzerland 12.0 4.4 7.9 18.2 12.2 Former Yugoslav Republic of Macedonia (1) 12.3 13.2 11.8 43.8 15.0
Serbia 28.2 31.4 25.7 68.3 33.8 Turkey (1) 10.5 14.1 1.5 36.1 1.9
(1) 2015.
Source: Eurostat (online data code: ilc_lvho07a and ilc_lvho07c)

3 Housing quality
Living conditions in Europe — 2018 edition74
Figure 3.9 provides an alternative analysis, as it focuses on the share of the population that spent more than half of their disposable income on housing costs. Across the EU-28, more than one in six (17.2 %) tenants living in dwellings with a market price rent spent more than half of their disposable income on housing costs in 2016.
The share of tenants living in dwellings with a market price rent that spent more than half of their disposable income on housing costs was systematically higher than the share for the whole population across all 28 of the EU Member States. In Spain, Lithuania and Bulgaria, in excess of 3 out of every 10 tenants living in dwellings with a market price rent spent more than half of their disposable income on housing costs in 2016.
Figure 3.9: Share of population with a housing cost burden over 50 % of disposable income, 2016(%)
10
30
50
70
EU-2
8 (1)
Gree
ceBu
lgar
iaRo
man
iaGe
rman
yD
enm
ark
(2)Un
ited
King
dom
Spai
nIta
ly (3
)N
ethe
rland
sBe
lgiu
mCz
ech
Repu
blic
Swed
enLi
thua
nia
Slov
akia
(4)
Port
ugal
Aust
riaHu
ngar
yPo
land
Latv
iaCr
oatia
Luxe
mbo
urg
(3)Sl
oven
iaEs
toni
aFr
ance
Irela
nd (3
)Fi
nlan
dCy
prus
Mal
ta
Switz
erla
ndIc
elan
d (3)
Nor
way
Serb
iaFo
rm. Y
ug. R
ep. o
f Mac
edon
ia (3
)Tu
rkey
(3)
Tenant, rent at market price
Tenant, rent at reduced price or free
Owner, no outstanding mortgage or housing loan
Owner, with mortgage or loan
Note: ranked on the share of the total population with a housing cost burden over 50 % of disposable income.
(1) Tenant, rent at reduced price or free: estimate.(2) Tenant, rent at reduced price or free: not available, low
reliability.
(3) 2015.(4) Owner, with mortgage or loan: not available, low reliability.
Source: Eurostat (online data codes: ilc_lvho27 and ilc_lvho28)

3Housing quality
Living conditions in Europe — 2018 edition 75
HOUSEHOLD CONSUMPTION EXPENDITURE
National accounts provide information about household consumption expenditure on goods and services; this information may be analysed according to the classification of individual consumption by purpose (COICOP), where Division 04 covers housing, water, electricity, gas and other fuels.
In 2016, the average amount spent by each inhabitant in the EU-28 on housing-related purposes averaged EUR 3 900. There were considerable variations between the EU Member States, reflecting differences in both rental/house prices and utility prices.
In 2016, average expenditure per inhabitant on housing, water, electricity, gas and other fuels ranged from EUR 800 in Bulgaria and EUR 1 100 in Hungary and Romania (2015 data), up to EUR 6 100 in the United Kingdom and EUR 6 600
in Denmark, reaching a peak of EUR 7 500 in Luxembourg.
In 12 of the 27 EU Member States for which data are available (no data for Croatia), expenditure per inhabitant on housing-related items was above the EU-28 average (as denoted by the yellow shaded areas in Map 3.3) — most of these were located in western and northern Europe, but the list also included Italy. By contrast, expenditure was lower than the EU-28 average in eastern Europe and the three Baltic Member States, as well as most of southern Europe.
The share of housing, water, electricity, gas and other fuels in EU-28 final household consumption expenditure was 24.5 % in 2016 (which was slightly higher than 5 or 10 years before). The highest proportion was attributed to imputed rentals for housing (13.1 % of final household consumption expenditure), followed by actual rentals (4.9 %), electricity, gas and other fuels (4.0 %), water supply and related services (1.6 %) and maintenance and repair for dwellings (0.9 %).
Table 3.7: Share of housing, water, electricity, gas and other fuels in final household consumption expenditure, EU‑28, 2006, 2011 and 2016(%)
Consumption purpose (COICOP code) 2006 2011 2016
Housing, water, electricity, gas and other fuels (04) 22.9 24.3 24.5 Actual rentals for housing (04.1) 4.3 4.6 4.9 Imputed rentals for housing (04.2) 12.4 12.7 13.1 Maintenance and repair of the dwelling (04.3) 0.9 1.0 0.9 Water supply and miscellaneous services relating to the dwelling (04.4) 1.4 1.6 1.6 Electricity, gas and other fuels (04.5) 3.9 4.3 4.0
Source: Eurostat (online data code: nama_10_co3_p3)

3 Housing quality
Living conditions in Europe — 2018 edition76
Map 3.3: Average household expenditure on housing, water, electricity, gas and other fuels, 2016(EUR per inhabitant)
Administrative boundaries: © EuroGeographics © UN-FAO © Turkstat
Note: Romania and Norway, 2015. Greece, Spain, France, Cyprus, the Netherlands and Portugal: provisional. Poland: estimate.
Average household expenditure on housing, water, electricity, gas and other fuels, 2016(EUR per inhabitant)
0 200 400 600 800 km
Guadeloupe (FR)
0 25
Martinique (FR)
0 20
Guyane (FR)
0 100
Réunion (FR)
0 20
Açores (PT)
0 50
Madeira (PT)
0 20
Canarias (ES)
0 100
Malta
0 10
Liechtenstein
0 5
Cartography: Eurostat — GISCO, 05/2018
Source: Eurostat (online data code: nama_10_co3_p3)
Mayotte (FR)
0 15
(EUR per inhabitant)EU-28 = 3 900
< 1 5001 500 – < 3 9003 900 – < 5 000>= 5 000Data not available
Note: Romania and Norway, 2015. Greece, Spain, France, Cyprus, the Netherlands and Portugal: provisional. Poland: estimate.
Source: Eurostat (online data code: nama_10_co3_p3)

4 Socio-economic aspects of living conditions

4 Socio-economic aspects of living conditions
Living conditions in Europe — 2018 edition78
This chapter presents statistics related to living conditions experienced by Europeans. It offers a picture of everyday lives across the European Union (EU), reflecting aspects such as health, labour market conditions or childcare arrangements, each of which may potentially have a profound impact on living standards.
The first topic covered is the health status of individuals in the EU-28 and the accessibility they have to healthcare. When asked in 2016, two thirds (66.7 %) of the EU-28 population aged 18 and over responded that their health was good or very good.
The second section covers the labour market and its impact on living standards, as provided by an analysis of work intensity, income distribution, the share of young working adults still living at home, or the risk of poverty. In 2016, very low work intensity mainly affected those people living in single person households (aside from those households with at least one senior member aged 65 years or over). There appears to be a clear link between work intensity and the risk of poverty, insofar as the risk of poverty declined to 10.1 % among the population aged less than 60 living in households characterised by high work intensity and was even lower (5.9 %) for households characterised by very high work intensity.
The share of young adults (aged 18-34 years) in the EU-28 still living with their parents rose slightly between 2007 and 2016, when it stood at 54.1 % among young men and 41.7 % among young women. The majority of these young adults were either employed or students, while their decision to continue living with their parents may be influenced by the precarious nature of their employment, insofar as almost half (46.5 %) of young adults living with their parents had a temporary employee contract.
The final topic covered by this chapter is childcare and education arrangements. In 2016, almost half (47.3 %) of all children under the
age of three years were cared for only by their parents; this share ranged from lows of 19.9 % in Portugal and 24.1 % in the Netherlands up to highs of more than 70.0 % in Bulgaria and especially Slovakia (79.8 %).
In 2016, formal childcare was much more common for older children in the EU-28, being provided to 86.3 % of children aged between three years and the minimum compulsory school age and 97.0 % of children between the minimum compulsory school age and 12 years were in formal childcare or education.
4.1 Health conditionsMost Europeans would agree that universal access to good healthcare, at an affordable cost to both individuals and society at large, is a basic need. They would also agree that good health is a major determinant for their individual quality of life and ability to participate in social and family-related activities, while at the same time promoting economic growth and overall well-being.
The statistics presented in this section are based on an evaluation of self-perceived health. Therefore, readers should bear in in mind that cultural and personal differences may have an impact on the results.
Two thirds of the EU‑28 population perceived themselves as being in good or very good health
In 2016, 66.7 % of the EU-28 population aged 18 and over reported that their health status was good or very good. At the other end of the spectrum, almost 1 in 10 (9.1 %) persons perceived their health status to be bad or very bad (see Figure 4.1).
Among the EU Member States, there was a high degree of variation concerning self-perceived health status. In 2016, the share of population aged 18 and over that perceived their health to be very good ranged from 4.9 % in Latvia and

4Socio-economic aspects of living conditions
Living conditions in Europe — 2018 edition 79
less than 10.0 % in the two other Baltic Member States — Lithuania and Estonia — as well as in Portugal, up to more than two fifths of the adult population in Ireland (2015 data), Cyprus and Greece (where a peak of 43.7 % was recorded).
The share of population that reported their health status as very bad was below 4.0 % in each of the 28 EU Member States, with the highest shares recorded in Croatia and Portugal (both 3.9 % in 2016).
Figure 4.1: Self‑perceived health among population aged 18 and over, 2016(%)
0
25
50
75
100
EU-2
8 (1)
Irela
nd (2
)Cy
prus
Net
herla
nds
Swed
enGr
eece
Belg
ium
Mal
taSp
ain
Den
mar
kLu
xem
bour
g (2)
Finl
and
Rom
ania
Aust
riaUn
ited
King
dom
(3)
Slov
akia
Fran
ceBu
lgar
iaIta
ly (2
)Ge
rman
ySl
oven
iaCz
ech
Repu
blic
(3)
Hung
ary
Croa
tiaPo
land
Esto
nia
(3)Po
rtug
alLa
tvia
Lith
uani
a (3)
Switz
erla
ndN
orw
ayIc
elan
d (2)
Serb
ia
Very good Good Fair Bad Very bad
Note: ranked on the share of the total population aged 18 and over reporting their health as very good or good.
(1) Estimates.(2) 2015.
(3) Low reliability.
Source: Eurostat (online data code: ilc_lvhl01)
Four fifths of employed persons in the EU‑28 perceived themselves as being in good or very good health
Figure 4.2 presents an analysis of the self-perceived health of EU-28 population in 2016, according to working status. Among persons aged 16 and over, some 80.3 % of those in employment reported that they were in good or very good health (compared with just 2.8 % that reported they were in bad or very bad health).
The situation was quite different for unemployed persons, as just over two thirds (68.9 %) of this
subpopulation perceived their health as being good or very good in 2016 (compared with 9.1 % that reported they were in bad or very bad health).
By contrast, just over two fifths (40.6 %) of retired persons in the EU-28 perceived their health as being good or very good in 2016 (compared with 18.0 % that reported they were in bad or very bad health). Contrary to the other types of working status, the response most often given by retired persons was that they considered their health to be fair (41.4 %).

4 Socio-economic aspects of living conditions
Living conditions in Europe — 2018 edition80
Figure 4.2: Self‑perceived health among population aged 16 and over by working status, EU‑28, 2016(%)
0
25
50
75
100
Employed Unemployed Retired
Very good Good Fair Bad Very bad
Source: Eurostat (online data code: hlth_silc_01)
Perceptions of bad or very bad health status were more prevalent among the elderly, particularly older women
As may be expected — given that many health problems tend to be more common among the elderly — there was a clear relationship between a person’s age and their (perceived) health status (see Table 4.1).
Across the EU-28, 1.5 % of persons aged 16-24 years reported that their health status was bad or very bad in 2016. This share increased as a function of age to reach 13.6 % of the population among those aged 65-74 years. Thereafter, it
rose at a much faster pace, as just less than one quarter (23.2 %) of the EU-28 population aged 75-84 years reported that their health status was bad or very bad, rising to more than a third (34.7 %) of the population aged 85 and over. Note that these statistics exclude persons residing in homes for the elderly (where the prevalence of bad or very bad health status is likely to be higher than among the elderly who are living in private dwellings). This pattern of a rising share of elderly people with bad and very bad health status was repeated in the vast majority of EU Member States.

4Socio-economic aspects of living conditions
Living conditions in Europe — 2018 edition 81
Table 4.1: Share of population reporting their health as bad or very bad by age group, 2016(%)
Total population (16 years and over)
Years
16‑24 25‑34 35‑44 45‑54 55‑64 65‑74 75‑84 85 and over
EU‑28 8.8 1.5 2.2 3.9 7.3 11.6 13.6 23.2 34.7 Belgium 9.3 1.5 3.1 6.9 10.2 11.7 12.1 20.7 29.5 Bulgaria 11.1 1.7 1.9 2.8 6.7 13.0 20.2 38.0 52.5 Czech Republic 11.8 0.5 2.2 4.3 9.6 14.7 17.3 34.2 49.1 Denmark 7.6 2.7 4.9 4.7 8.7 12.6 7.0 14.3 19.2 Germany 8.3 1.1 2.2 4.4 9.1 12.7 11.4 15.7 32.3 Estonia 14.4 1.6 2.6 3.9 9.4 16.7 23.7 43.2 47.1 Ireland 3.6 0.9 1.0 1.4 4.1 5.4 7.3 8.9 11.7 Greece 10.4 0.8 2.0 3.5 5.2 8.7 17.2 35.1 59.5 Spain 7.0 0.9 0.9 2.1 5.0 8.4 12.8 21.6 35.0 France 8.1 2.0 2.7 4.9 7.8 10.6 10.0 20.7 28.6 Croatia 18.8 1.5 2.5 6.0 13.7 23.5 38.6 57.4 70.1 Italy 7.7 1.4 1.2 2.0 3.7 7.5 12.2 25.0 38.4 Cyprus 4.6 0.6 0.5 1.4 3.7 6.5 10.7 21.8 24.5 Latvia 15.7 1.9 3.0 5.0 9.8 18.0 30.7 47.7 59.6 Lithuania 17.1 1.5 0.8 4.4 9.9 18.5 30.5 56.0 62.4 Luxembourg 9.6 1.6 3.4 5.0 12.5 13.9 15.9 28.3 39.3 Hungary 13.3 1.5 2.0 3.8 8.7 19.2 25.4 43.5 58.6 Malta 3.2 0.1 0.4 0.6 1.4 3.7 7.0 13.7 22.6 Netherlands 4.9 0.8 2.1 2.9 6.6 7.5 6.3 7.6 17.1 Austria 8.1 1.1 2.8 3.7 7.8 10.9 11.0 22.5 34.4 Poland 13.7 1.6 2.5 4.5 10.7 18.7 27.2 42.1 55.5 Portugal 15.9 1.8 3.1 4.4 10.6 19.4 31.1 45.5 58.2 Romania 7.2 0.4 0.8 1.5 3.5 10.6 13.0 28.6 46.1 Slovenia 10.0 2.1 3.4 3.2 8.0 13.6 18.1 32.2 35.2 Slovakia 11.8 1.4 1.9 2.9 9.6 17.2 27.9 48.9 71.8 Finland 6.0 2.3 2.1 2.9 4.2 7.3 8.3 14.6 25.6 Sweden 5.6 2.6 4.0 4.5 5.4 7.5 6.9 8.5 13.0 United Kingdom 8.9 3.0 3.8 7.0 9.2 12.2 11.1 15.3 17.4 Iceland (1) 2.7 5.7 3.7 4.8 6.1 8.4 9.5 5.7 10.8 Norway 7.7 2.3 3.2 6.3 8.9 8.9 10.9 15.7 23.8 Switzerland 4.5 1.1 1.8 3.7 6.9 6.8 5.6 5.5 4.5 Montenegro (2) 0.9 15.7 2.5 5.2 12.2 24.4 41.9 64.9 73.7 Former Yugoslav Republic of Macedonia 7.7 1.1 1.3 2.3 4.9 11.5 19.4 37.1 50.9
Serbia 17.9 1.3 1.9 4.7 13.2 24.6 36.5 54.8 72.6 Turkey (1) 2.6 12.4 3.9 7.7 12.5 21.4 35.8 52.5 64.7
(1) 2015.(2) 2014.
Source: Eurostat (online data code: hlth_silc_01)

4 Socio-economic aspects of living conditions
Living conditions in Europe — 2018 edition82
Figure 4.3 provides a more detailed analysis of the situation for persons aged 65 and over. It shows that in 2016 there was a gender gap, insofar as more than one quarter (21.4 %) of elderly women in the EU-28 perceived their health status as bad or very bad, while the corresponding share among men was 4.8 percentage points lower (16.6 %).
The same pattern — a higher share of elderly women (than elderly men) reporting bad or very bad health status — was repeated in 2016 in all of the EU Member States. The smallest differences between the sexes were recorded in Ireland and the United Kingdom (the only Member States where the gender gap was less than 1.0 percentage point). By contrast, the gap between the sexes rose to more than 10.0 percentage points in 2016 in Portugal (where the share of men reporting bad or
very bad health status was 12.0 points lower than the corresponding share for women) and Luxembourg (where the difference was 12.5 points). This gender gap may, at least in part, be explained by women having a higher level of life expectancy, which may be linked to increased risks for contracting various illnesses/diseases and therefore a deterioration of health status.
In 2016, the share of elderly women that reported bad or very bad health status rose to more than two fifths in Latvia, Portugal, Lithuania and Croatia; the latter was the only EU Member State where more than half (52.3 %) of all elderly women perceived their health to be bad or very bad. The same four Member States — Portugal, Latvia, Lithuania and Croatia also recorded the highest shares of elderly men reporting that they had bad or very bad health status, with a peak of 42.6 % in Croatia.
Figure 4.3: Share of population aged 65 and over reporting their health as bad or very bad by sex, 2016(%)
0
10
20
30
40
50
60
70
EU-2
8
Croa
tiaLi
thua
nia
Latv
iaPo
rtug
alSl
ovak
iaPo
land
Hung
ary
Esto
nia
Bulg
aria
Gree
ceCz
ech
Repu
blic
Slov
enia
Luxe
mbo
urg
Rom
ania
Italy
Spai
nAu
stria
Belg
ium
Fran
ceCy
prus
Germ
any
Unite
d Ki
ngdo
mFi
nlan
dD
enm
ark
Mal
taIre
land
Swed
enN
ethe
rland
s
Nor
way
Icel
and
(1)Sw
itzer
land
Mon
tene
gro
(2)Se
rbia
Turk
ey (1
)Fo
rm. Y
ug. R
ep. o
f Mac
edon
ia
Male Female
Note: ranked on the share of the total population (male and female) aged 65 and over reporting their health as bad or very bad.
(1) 2015. (2) 2014.
Source: Eurostat (online data code: hlth_silc_01)

4Socio-economic aspects of living conditions
Living conditions in Europe — 2018 edition 83
High costs proved to be a barrier to accessing medical care and dental care for 1.7 % and 3.7 % of the EU‑28 population
The provision of free state-funded medical examinations and treatments varies considerably between EU Member States, reflecting the different organisation of national health services and the balance between public and private provisions. Relatively high medical or dental costs may act as a barrier preventing some individual patients from accessing the healthcare they require.
Across the EU-28, some 1.7 % of the population aged 16 and over stated in 2016 that the high cost of medical care was the main reason that resulted in them having unmet medical needs (see Table 4.2). This share varied from less than 1.0 % in 17 EU Member States up to 4.9 % in Italy, 5.3 % in Latvia and Romania, peaking at 12.0 % in Greece.
Among the first income quintile (in other words, the 20 % of the EU-28 population with the lowest incomes), the share of adults with unmet medical needs due primarily to their cost/expense rose to 4.2 %. By contrast, among the 20 % of highest-earners in the EU-28 (the top or fifth income quintile), the share of adults who stated that their main reason for unmet medical needs was due to their cost/expense was much lower (0.3 %).
A similar pattern was repeated in 2016 across each of the EU Member States, with a higher proportion of the adult population in the first income quintile (than the fifth income quintile) reporting unmet medical needs primarily because care was too expensive.
In Greece, Latvia and Italy the share of the adult population in the lowest income quintile with unmet medical needs because care was too expensive in 2016 was more than 10.0 percentage points higher than the corresponding share recorded among the adult population in the top income quintile; these were the only EU Member States where the gap between the shares for these two subpopulations was in double-digits.
In 2016, the share of the adult population in the first income quintile with unmet medical needs primarily because care was too expensive peaked at 34.3 % in Greece, while Latvia (13.1 %) and Italy (11.6 %) also reported that more than one tenth of this subpopulation had such unmet needs. By contrast, there were 10 EU Member States where less than 1.0 % of the adult population in the first income quintile reported that the principal reason why they had unmet medical needs was because care was too expensive.
A similar analysis for the top income quintile in 2016 reveals that Romania had the highest share (1.6 %) of this subpopulation with unmet medical needs because care was too expensive; Romania was the only EU Member States where more than 1.0 % of the top income quintile reported unmet medical needs. By contrast, none of the adults in the top income quintile reported unmet medical needs primarily because care was too expensive in half (14 out of 28) the Member States.
Although not usually life-threatening, dental conditions may result in excruciating pain, while untreated dental problems may have longer-term detrimental effects on both an individual’s health and well-being.

4 Socio-economic aspects of living conditions
Living conditions in Europe — 2018 edition84
Table 4.2: Share of population aged 16 and over reporting unmet needs for medical or dental care because the care was too expensive by income group, 2016(%)
Unmet medical needs Unmet dental needsTotal
population First quintile Fifth quintile Total population First quintile Fifth quintile
EU‑28 1.7 4.2 0.3 3.7 7.9 0.9 Belgium 2.2 7.7 0.0 3.7 11.3 0.0 Bulgaria 2.2 5.4 0.7 3.4 5.8 1.4 Czech Republic 0.2 0.6 0.0 0.6 1.3 0.1 Denmark 0.2 0.2 0.0 3.7 5.7 0.7 Germany 0.2 0.5 0.0 0.6 1.6 0.1 Estonia 1.1 3.2 0.1 9.3 16.7 2.4 Ireland 1.5 2.3 0.6 3.2 4.5 1.5 Greece 12.0 34.3 0.4 13.5 26.0 0.2 Spain 0.2 0.3 0.0 5.2 12.5 0.6 France 1.0 3.0 0.2 2.9 6.7 0.7 Croatia 0.7 2.2 0.0 0.9 1.7 0.4 Italy 4.9 11.6 0.9 8.1 16.9 2.4 Cyprus 0.6 1.9 0.1 3.6 6.5 1.1 Latvia 5.3 13.1 0.8 13.2 26.8 4.3 Lithuania 0.7 2.2 0.2 3.6 6.3 1.2 Luxembourg 0.3 0.9 0.0 1.1 4.0 0.1 Hungary 0.9 2.3 0.1 2.0 4.9 0.4 Malta 0.7 1.7 0.0 1.1 2.4 0.2 Netherlands 0.1 0.2 0.0 0.3 1.2 0.0 Austria 0.2 0.4 0.0 0.4 1.1 0.0 Poland 2.3 4.9 0.6 2.9 5.6 1.2 Portugal 2.0 4.1 0.3 13.8 26.7 2.6 Romania 5.3 9.9 1.6 6.3 12.0 2.9 Slovenia 0.1 0.3 0.0 0.4 1.2 0.1 Slovakia 0.8 1.7 0.1 1.7 4.8 0.2 Finland 0.1 0.1 0.0 0.4 1.0 0.1 Sweden 0.4 1.0 0.0 3.5 8.0 0.9 United Kingdom 0.1 0.2 0.0 1.4 1.5 0.4 Iceland (1) 3.3 6.2 1.4 10.2 17.6 4.2 Norway 0.4 1.0 0.0 3.6 10.1 0.5 Switzerland 0.5 0.6 0.1 3.4 6.6 0.4 Montenegro (2) 6.5 10.7 1.8 6.7 12.1 1.9 Former Yugoslav Republic of Macedonia 2.0 4.7 0.4 2.4 4.2 0.5
Serbia 2.6 6.6 0.4 8.1 14.9 2.7 Turkey (1) 6.2 13.8 1.6 5.7 9.6 2.8
(1) 2015.(2) 2014.
Source: Eurostat (online data codes: hlth_silc_08 and hlth_silc_09)

4Socio-economic aspects of living conditions
Living conditions in Europe — 2018 edition 85
In 2016, the share of the EU-28 population aged 16 and over reporting that the high cost/expense of dental care had resulted in unmet dental care needs was 3.7 % — slightly more than double the corresponding share for unmet medical needs. This may reflect some people giving a higher priority to their medical needs rather than their dental needs and may also be affected by the relatively high level of dental care costs in some EU Member States, in comparison to medical costs which are often (entirely) paid/reimbursed by social security systems.
In 2016, the share of the population with unmet dental needs primarily due to their cost/expense ranged from less than 1.0 % in seven EU Member States (with a lowest share of 0.3 % recorded in the Netherlands) to more than 10.0 % in Latvia, Greece and Portugal (where the highest share was recorded at 13.8 %).
Some 7.9 % of the EU-28’s adult population in the lowest income quintile had unmet dental needs in 2016, compared with 0.9 % of the EU-28 adult population in the top income quintile. Across some of the EU Member States, people in the bottom income quintile were considerably more likely to have unmet dental needs than their compatriots in the upper income quintile. This pattern was most evident in Greece, where the share for the lowest income quintile (26.0 %) was 130 times as high as the share for the highest income quintile (0.2 %). A similar pattern existed in several other EU Member States, as the share of people with unmet dental needs was at least 20 times as high among the bottom income quintile as it was for the top income quintile in Spain, Slovakia and Luxembourg; in Belgium, the Netherlands and Austria none of the adult
population in the upper income quintile had unmet dental needs.
Large differences in the amount of money households spent on healthcare
National accounts provide information about household consumption expenditure on goods and services; this information may be analysed according to the classification of individual consumption by purpose (COICOP), where Division 06 covers health — this includes expenditure on: medical products, appliances and equipment; outpatient services; hospital services.
Each inhabitant in the EU-28 spent an average of EUR 600 on healthcare in 2016 (see Map 4.1). There were large differences in the level of expenditure between EU Member States in 2016, from a low of EUR 200 per inhabitant in the Czech Republic and Slovenia up to EUR 1 000 or more per inhabitant in Germany, Ireland, Slovakia and Belgium (where the highest value was recorded, averaging EUR 1 100 per inhabitant).
These variations reflect, to some degree, the different provisions for the delivery of healthcare across the EU Member States: on the one hand, there are some characterised by predominantly public systems financed through taxation, where healthcare is provided free at the point of use; others are characterised by social premium payments, whereby patients usually pay their medical bills and are later reimbursed by government. As such, in those countries where healthcare provision tends to be provided free at the point of use it is more commonplace to find that healthcare expenditure was relatively low.

4 Socio-economic aspects of living conditions
Living conditions in Europe — 2018 edition86
Map 4.1: Average household expenditure on healthcare, 2016(EUR per inhabitant)
Administrative boundaries: © EuroGeographics © UN-FAO © Turkstat
Note: Romania and Norway, 2015. Greece, Spain, France, Cyprus, the Netherlands and Portugal: provisional. Poland: estimate.
Average household expenditure on healthcare, 2016(EUR per inhabitant)
0 200 400 600 800 km
Guadeloupe (FR)
0 25
Martinique (FR)
0 20
Guyane (FR)
0 100
Réunion (FR)
0 20
Açores (PT)
0 50
Madeira (PT)
0 20
Canarias (ES)
0 100
Malta
0 10
Liechtenstein
0 5
Cartography: Eurostat — GISCO, 05/2018
Source: Eurostat (online data code: nama_10_co3_p3)
Mayotte (FR)
0 15
(EUR per inhabitant)EU-28 = 600
< 400400 – < 600600 – < 800>= 800Data not available
Note: Romania and Norway, 2015. Greece, Spain, France, Cyprus, the Netherlands and Portugal: provisional. Poland: estimate.
Source: Eurostat (online data code: nama_10_co3_p3)

4Socio-economic aspects of living conditions
Living conditions in Europe — 2018 edition 87
A more detailed analysis for the EU-28 reveals that average expenditure on healthcare in 2016 was concentrated on medical products, appliances and equipment (41.9 % of all healthcare expenditure) and out-patient services
(41.4 % of all healthcare expenditure), while a relatively small share (16.7 % of total healthcare expenditure) was accounted for by hospital services.
Figure 4.4: Analysis of household consumption expenditure on healthcare, EU‑28, 2016(%)
Medical products, appliances
and equipment, 41.9
Out-patient services,
41.4
Hospital services,
16.7
Source: Eurostat (online data code: nama_10_co3_p3)
4.2 Labour conditions
Very low work intensity affected mainly persons living in single person households
The main income source for most households and therefore the main determinant of its economic situation is the employment status of its members.
Very low work intensity is one of the three components of the Europe 2020 poverty and social exclusion indicator (see Subchapter 2.1 for more details). Work intensity is defined as the ratio between the number of months that household members of working age (defined here as people aged 18-59 years, excluding dependent children aged 18-24 years) actually worked during the income reference year and the total number of months that they could theoretically have worked. People living in households with very low work intensity are defined as those where working
members provided no more than 20 % of their total potential work during the previous 12 month period.
In 2016, some 14.4 % of the EU-28 population aged less than 60 that was living in households without children were members of a household with very low work intensity (see Table 4.3). This rate ranged among the EU Member States between 6.9 % in Slovakia and 25.7 % in Greece.
More than one fifth (22.1 %) of the EU-28 population aged less than 60 who were living alone had a very low level of work intensity in 2016. While this share was higher than the average for the total population living in households without children (14.4 %), it was, unsurprisingly, less than the share recorded for the population aged less than 60 who were living in households composed of two adults, at least one of which was aged 65 years or over (37.5 %).

4 Socio-economic aspects of living conditions
Living conditions in Europe — 2018 edition88
Table 4.3: Share of population aged less than 60 living in households with very low work intensity by household type, 2016(%)
Households without children Households with children
Total Single person
Two adults, at least
one aged 65 years or
over
Two or more adults
without depend‑
ent children
Total
Single adult with
depend‑ent
children
Two adults with one
depend‑ent child
Two adults with three
or more depend‑
ent children
Two or more adults with
depend‑ent
children
EU-28 22.1 32.6 15.3 18.0 24.6 48.2 17.9 31.2 22.2 Belgium 21.4 30.9 16.2 17.2 20.1 53.0 13.2 22.0 16.0 Bulgaria 40.0 62.0 37.9 32.6 40.9 71.4 28.5 89.1 38.9 Czech Republic 12.2 25.1 6.0 8.1 14.4 46.7 8.6 23.7 11.6 Denmark 21.1 33.0 5.1 12.1 12.0 36.9 3.8 12.8 8.1 Germany 21.8 36.7 13.5 13.8 16.8 43.0 13.3 20.4 13.1 Estonia 30.0 57.7 16.9 15.8 18.7 40.3 15.6 31.4 16.6 Ireland (1) 23.8 40.3 15.1 19.0 27.3 61.7 22.2 27.9 23.3 Greece 33.4 37.0 22.4 32.5 38.0 50.6 32.0 44.3 37.5 Spain 23.8 24.7 19.7 23.5 31.9 53.3 25.4 43.6 30.5 France 15.8 22.2 8.4 12.7 20.4 44.9 13.3 25.1 17.0 Croatia 31.8 49.6 31.8 27.7 24.5 43.2 21.8 39.6 24.0 Italy (1) 25.9 31.6 18.5 23.8 31.7 43.9 23.9 46.8 30.7 Cyprus 27.8 33.7 24.4 26.5 27.6 50.9 26.4 28.6 26.2 Latvia 34.5 60.3 31.1 25.4 22.6 46.8 17.4 28.8 19.9 Lithuania 32.4 50.3 24.6 22.6 28.0 54.4 17.3 34.4 24.1 Luxembourg (1) 15.2 23.5 7.6 11.5 21.2 50.5 15.1 25.2 18.4 Hungary 23.0 30.0 16.9 20.2 29.6 62.3 22.6 38.4 26.3 Malta 19.6 28.9 30.2 17.4 20.5 50.3 12.2 39.3 18.1 Netherlands 17.8 30.8 10.5 11.0 15.6 45.0 14.7 17.5 12.3 Austria 17.7 28.5 11.7 12.7 18.3 40.2 10.9 26.2 16.4 Poland 19.8 32.2 14.9 16.6 22.9 47.3 16.2 35.0 22.2 Portugal 24.5 33.7 22.3 22.6 25.6 42.0 19.3 46.2 24.1 Romania 34.2 47.3 27.7 29.9 42.5 58.2 26.1 72.6 42.0 Slovenia 23.1 41.1 13.9 16.5 14.5 33.4 18.5 14.4 13.1 Slovakia 14.6 22.3 12.9 12.9 20.9 40.7 12.3 37.7 20.2 Finland 19.6 36.1 5.6 10.1 12.8 41.9 9.6 12.7 9.0 Sweden 18.8 34.4 6.6 8.8 17.5 36.7 12.6 27.0 14.2 United Kingdom 20.0 33.3 16.0 15.6 24.4 56.9 16.2 31.3 18.8 Iceland (1)(2) 14.0 29.8 5.0 6.7 12.3 43.2 13.6 9.2 8.1 Norway 18.1 33.1 2.2 6.9 12.2 40.1 5.2 10.4 6.5 Switzerland 17.9 26.5 21.8 13.8 18.2 42.0 12.1 28.2 16.3 Former Yugoslav Republic of Macedonia (1) 40.2 53.6 34.6 39.1 42.3 71.2 40.9 65.9 41.8
Serbia 38.7 48.4 30.2 36.6 38.8 55.5 31.1 56.5 37.9 Turkey (1) 35.0 44.0 39.6 33.4 43.6 72.1 30.9 61.7 43.0
(1) 2015.(2) Two adults, at least one aged 65 years or over: low reliability.
Source: Eurostat (online data code: ilc_lvhl13)

4Socio-economic aspects of living conditions
Living conditions in Europe — 2018 edition 89
The share of the EU-28 population with very low work intensity was lower among those people aged less than 60 who were living in households with children. In 2016, the overall share of this subpopulation living in households with very low work intensity was 8.3 %, with even lower shares recorded for those people living in households composed of two or more adults with dependent children (6.3 %) or two adults with one dependent child (6.0 %). By contrast, more than one quarter (27.7 %) of the population living in single person households with dependent children were living in households with very low work intensity.
The share of the population aged less than 60 and living in a household with children and with very low work intensity ranged among the EU Member States from 2.9 % in Luxembourg (2015 data) and less than 5.0 % in Estonia, Slovenia and Poland, up to more than 10.0 % in the United Kingdom, Belgium, Spain, Greece, Bulgaria and Ireland (2015 data), where the highest share was recorded, at 18.3 %.
Across the EU-28, the share of the population aged less than 60 and living alone in households with very low work intensity (22.1 %) was somewhat lower in 2016 than the corresponding share recorded for those people living in single person households with dependent children (27.7 %). This pattern was repeated across the majority of the EU Member States, although
there were eight exceptions where very low work intensity was more prevalent among those living on their own and without children. The presence of dependent children had a particularly large impact on the share of the population living in households with very low work intensity in Belgium, the Czech Republic, the United Kingdom, Malta and Cyprus, as rates were at least 10.0 percentage points higher than those recorded for single persons living alone (without children).
Across the EU-28 in 2016, some 13.3 % of the foreign-born population aged 18-59 was living in a household with very low work intensity; this share was 2.6 percentage points higher than the corresponding share for the nationally-born population (10.7 %) — see Figure 4.5.
There was no clear pattern evident between these two rates in 2016 across the 27 EU Member States for which data are available (incomplete data for Romania). In 18 of the Member States, a higher share of the foreign-born population was living in households with very low work intensity; this gap was particularly wide in Sweden, the Netherlands, Belgium and Finland. By contrast, in nine of the Member States a lower share of foreign-born (rather than nationally-born) citizens were living in households with very low work intensity; this gap was widest in Hungary, the United Kingdom and Italy (2015 data).

4 Socio-economic aspects of living conditions
Living conditions in Europe — 2018 edition90
Figure 4.5: Share of population aged 18‑59 living in households with very low work intensity by country of birth, 2016(%)
0
10
20
30
40
50
EU-2
8 (1)
Gree
ceIre
land
(2)
Spai
nBe
lgiu
mCr
oatia
Finl
and
Italy
(2)
Den
mar
kBu
lgar
iaCy
prus
Unite
d Ki
ngdo
mGe
rman
yLi
thua
nia
Net
herla
nds
Port
ugal
Fran
ceSl
oven
iaAu
stria
Swed
enRo
man
ia (3
)Hu
ngar
yLa
tvia
Pola
ndM
alta
Luxe
mbo
urg
(2)Es
toni
aCz
ech
Repu
blic
Slov
akia
(4)
Nor
way
Switz
erla
ndIc
elan
d (2)
Serb
iaFo
rm. Y
ug. R
ep. o
f Mac
edon
ia (2
)Tu
rkey
(2)
Foreign country Reporting country
Note: ranked on the share of the total population aged 18-59 living in households with very low work intensity.
(1) Foreign country: estimate.(2) 2015.
(3) Foreign country: not available.(4) Foreign country: low reliability.
Source: Eurostat (online data codes: ilc_lvhl12 and ilc_lvhl16)
Risk of poverty decreases considerably as work intensity rises
The next section focuses on the impact that work intensity may have in relation to the risk of poverty. Several governments across the EU have focused on getting people back into work as a key policy for alleviating the risk of poverty, through initiatives that are designed to ‘make work pay’; for example, introducing changes to welfare and tax systems that encourage people to work (more).
The work intensity of each household is unsurprisingly closely related to its income:
generally, the higher the number of working people from a single household and the longer they work, the greater the chance that they may earn a decent wage, thereby guaranteeing a certain level of income and standard of living.
In 2016, the EU-28 at-risk-of-poverty rate for people aged less than 60 living in households with very low work intensity was 60.0 %; this share ranged from 41.3 % in Luxembourg to more than three quarters of the population in Slovakia and the three Baltic Member States (see Map 4.2).

4Socio-economic aspects of living conditions
Living conditions in Europe — 2018 edition 91
Map 4.2: At‑risk‑of‑poverty rate for population aged less than 60 living in households with very low work intensity, 2016(%)
Administrative boundaries: © EuroGeographics © UN-FAO © Turkstat
Note: Ireland, Italy, Luxembourg, Iceland, the former Yugoslav Republic of Macedonia and Turkey, 2015. Romania: provisional.
At-risk-of-poverty rate for population aged less than 60 living in householdswith very low work intensity, 2016(%)
0 200 400 600 800 km
Guadeloupe (FR)
0 25
Martinique (FR)
0 20
Guyane (FR)
0 100
Réunion (FR)
0 20
Açores (PT)
0 50
Madeira (PT)
0 20
Canarias (ES)
0 100
Malta
0 10
Liechtenstein
0 5
Cartography: Eurostat — GISCO, 05/2018
Source: Eurostat (online data code: ilc_li06)
Mayotte (FR)
0 15
(%)EU-28 = 60.0
< 5050 – < 6060 – < 70>= 70Data not available
Note: Ireland, Italy, Luxembourg, Iceland, the former Yugoslav Republic of Macedonia and Turkey, 2015. Romania: provisional.
Source: Eurostat (online data code: ilc_li06)

4 Socio-economic aspects of living conditions
Living conditions in Europe — 2018 edition92
Figure 4.6: At‑risk‑of‑poverty rate for population aged less than 60 by household work intensity, 2016(%)
0
20
40
60
80
EU-2
8
Esto
nia
Lith
uani
aLa
tvia
Slov
akia
Bulg
aria
Swed
enCz
ech
Repu
blic
Mal
taCr
oatia
Germ
any
Belg
ium
Rom
ania
(1)
Pola
ndSp
ain
Slov
enia
Italy
(2)
Net
herla
nds
Port
ugal
Irela
nd (2
)Fr
ance
Hung
ary
Gree
ceAu
stria
Finl
and
Cypr
usUn
ited
King
dom
Den
mar
kLu
xem
bour
g (2)
Nor
way
Switz
erla
ndIc
elan
d (2)
Serb
ia
For
m. Y
ug. R
ep. o
f Mac
edon
ia (2
)Tu
rkey
(2)
Low work intensity (0.20-0.45)
High work intensity (0.55-0.85)
Very low work intensity (0.00-0.20)
Medium work intensity (0.45-0.55)
Very high work intensity (0.85-1.00)
Note: work intensity defined as the ratio of the number of months all working-age household members have worked during the year compared with the number of months the same household members theoretically could have worked.
(1) Provisional.(2) 2015.
Source: Eurostat (online data code: ilc_li06)
In 2016, the risk of poverty decreased as work intensity increased: falling from 43.3 % among those people living in EU-28 households with low work intensity, to 22.5 % for people living in households with medium work intensity, to 10.1 % for people living in households with high work intensity and reaching a low of 5.9 % for people living in households with very high
work intensity; the definitions for each of these categories are provided in Figure 4.6.
A similar pattern to that recorded for the EU-28 was repeated in each of the EU Member States in 2016, with the exception of Denmark, where the lowest risk of poverty was recorded for people living in households with medium work intensity.

4Socio-economic aspects of living conditions
Living conditions in Europe — 2018 edition 93
Across much of the EU, the risk of in‑work poverty was lower for women (rather than men)
The risk of poverty is not exclusively restricted to inactive or retired persons and those who choose to work a relatively short amount of time each week. Indeed, the risk of poverty extends to those in work: in 2016, almost 1 in 10 (9.6 %) persons aged 18 and over living in the EU-28 was at risk of poverty despite being in work. Note that the risk of poverty faced by an individual is assessed taking into account the total income of the household in which they live (and is therefore not directly linked to their personal income, but a broader measure covering the whole household).
In 2016, the share of the EU-28 male population aged 18 and over that was in work and at
risk of poverty was higher (10.0 %) than the corresponding share for the female population (9.1 %) — see Figure 4.7.
In 2016, the same pattern was repeated in 24 of the EU Member States, as the only exceptions were the Czech Republic, Cyprus, Hungary and especially Germany (where the female in-work at-risk-of-poverty rate was 2.9 percentage points higher than that for men). The gap between male and female in-work at-risk-of-poverty rates was greatest in Romania, where the rate among men was 6.3 percentage points higher than the rate for women. The gender gap was at least 3.0 points — again with higher rates for men — in Malta, Bulgaria, Italy (2015 data) and Greece. These gaps may, at least in part, be influenced by the relatively low share of women in employment across much of southern Europe and the Balkans.
Figure 4.7: In‑work at‑risk‑of‑poverty rate for population aged 18 and over by sex, 2016(%)
0
5
10
15
20
25
EU-2
8
Rom
ania
(1)
Gree
ceSp
ain
Luxe
mbo
urg
(2)Ita
ly (2
)Bu
lgar
iaPo
rtug
alPo
land
Esto
nia
Hung
ary
Germ
any
Unite
d Ki
ngdo
mLi
thua
nia
Latv
iaAu
stria
Cypr
usFr
ance
Swed
enSl
ovak
iaSl
oven
iaM
alta
Croa
tiaN
ethe
rland
sD
enm
ark
Irela
nd (2
)Be
lgiu
mCz
ech
Repu
blic
Finl
and
Switz
erla
ndIc
elan
d (2)
Nor
way
Turk
ey (2
)Se
rbia
Form
. Yug
. Rep
. of M
aced
onia
(2)
Male Female
Note: ranked on the share of the total (male and female) population aged 18 and over in-work and at-risk-of-poverty.
(1) Provisional.(2) 2015.
Source: Eurostat (online data code: ilc_iw01)

4 Socio-economic aspects of living conditions
Living conditions in Europe — 2018 edition94
Modest increase of in‑work risk of poverty between 2011 and 2016
The EU-28 in-work at-risk-of-poverty rate in the rose at a modest pace during the period 2011-2016, up from 8.8 % to 9.6 % (see Table 4.4). The highest risk of poverty was recorded among young adults in work (12.1 %), as rates fell as a function of age: to 9.7 % for those employed and aged 25-54 years, 8.6 % for those employed and aged 55-64 years, and 8.5 % for those employed and aged 65 and over.
There were considerable differences across the EU Member States: in almost half (13 out of 28), the highest in-work at-risk-of-poverty rates in 2016 were recorded for young adults aged 18-24 years; in Poland, the risk of in-work poverty was identical for young adults aged 18-24 years and for people aged 25-54 years. There were four EU Member States where the highest in-work at-risk-of-poverty rates were recorded among the population aged 25-54 years and four (other) Member States where the highest rates were recorded among the population aged 55-64 years; all eight of these Member States were characterised by relatively low risks of poverty insofar as their highest rates never exceeded 11.0 %. There were six Member States where the highest in-work at-risk-of-poverty rates were recorded for the population aged 65 and over: they had a greater degree of variation, from a low of 5.0 % in Finland up to 20.5 % in Greece
and 43.6 % in Romania. The wide disparities across Member States between in-work at-risk-of-poverty rates for the elderly may reflect some elderly people choosing to remain in employment beyond the age of 65 as a lifestyle choice, in contrast to others who might continue to work more out of (economic) necessity.
More than one third of the EU‑28 working‑age population saw a notable change in their income
This section refers exclusively to income derived from employment and analyses income transitions within the working-age population. To do so, information on income levels is ranked and then divided into 10 separate groups of equal size — each of these is called a decile. The income that an individual receives may vary from one year to the next and this is especially true when people change jobs or if they adjust their usual working hours, but may also occur as a result of changes to their responsibilities/seniority, or may simply reflect an annual pay rise or a bonus payment. As such, the position that people occupy within the overall distribution of income varies over time, either due to changes in their own income or changes for the rest of the working population. It is likely that there will be a greater number of transitions between income deciles in those economies that are characterised by flexible labour markets or a rapid pace of economic change.

4Socio-economic aspects of living conditions
Living conditions in Europe — 2018 edition 95
Table 4.4: In‑work at‑risk‑of‑poverty rate by age, 2011 and 2016(%)
18 years and over 18-24 years 25-54 years 55-64 years 65 years and
over2011 2016 2011 2016 2011 2016 2011 2016 2011 2016
EU-28 8.8 9.6 11.3 12.1 8.7 9.7 8.1 8.6 9.5 8.5 Belgium (1) 4.2 4.7 6.6 4.6 4.1 4.9 3.6 3.5 8.1 9.6 Bulgaria (2) 8.2 11.4 10.5 13.5 8.3 11.8 6.7 10.2 4.7 3.6 Czech Republic 4.0 3.8 2.4 3.1 4.5 3.9 2.1 3.7 1.0 1.5 Denmark 6.3 5.3 19.9 21.3 5.8 4.5 3.8 4.2 10.5 3.2 Germany 7.7 9.5 9.6 14.0 7.6 9.2 7.5 8.8 8.5 10.4 Estonia (2) 7.9 9.6 10.3 7.4 8.5 10.6 6.1 8.2 0.0 2.9 Ireland (3) 5.6 4.8 10.4 5.8 4.6 4.5 6.1 5.9 16.2 5.6 Greece 11.9 14.1 12.9 19.0 11.3 13.2 15.8 17.4 9.9 20.5 Spain 10.9 13.1 12.1 18.3 11.2 13.7 8.1 8.6 14.7 11.7 France 7.6 7.9 11.2 12.8 7.4 7.9 6.8 6.4 7.2 4.5 Croatia (4) 6.6 5.6 7.6 8.5 6.6 5.5 5.4 5.0 7.4 6.3 Italy (3) 11.0 11.5 15.1 12.8 11.3 11.9 8.5 10.2 3.4 3.5 Cyprus 7.3 8.2 10.1 10.2 7.3 8.5 5.9 6.9 3.6 1.0 Latvia 9.3 8.3 8.3 8.5 9.4 8.3 11.4 9.2 0.0 4.2 Lithuania 9.5 8.5 6.1 9.1 10.4 9.4 6.5 5.9 5.8 0.8 Luxembourg (1)(3) 9.9 11.6 11.8 13.9 10.1 11.6 5.9 10.0 16.1 11.7 Hungary (1) 6.2 9.6 6.2 8.6 6.4 9.4 5.1 11.0 0.0 1.9 Malta (4) 6.1 5.8 5.3 3.6 6.6 6.0 3.8 5.5 0.0 11.6 Netherlands (2) 5.4 5.6 8.0 7.1 5.5 5.7 3.9 4.9 3.3 6.4 Austria (1) 7.6 8.3 9.4 12.4 7.5 7.9 6.8 7.1 11.1 11.1 Poland 11.1 10.8 11.0 10.9 11.2 10.9 10.9 10.6 3.9 3.4 Portugal 10.3 10.9 11.7 12.0 9.7 10.5 12.5 12.1 21.0 14.3 Romania 19.1 18.9 31.6 31.2 17.4 17.9 21.8 18.6 41.6 43.6 Slovenia (4) 6.0 6.1 3.4 7.0 6.2 6.0 5.1 6.7 7.0 6.6 Slovakia (1) 6.3 6.5 5.5 2.7 6.8 7.0 4.0 5.3 0.0 6.0 Finland 3.9 3.1 7.9 4.8 3.5 3.0 4.0 2.9 2.4 5.0 Sweden (2) 7.5 6.7 16.4 16.0 6.6 6.7 3.6 3.5 5.4 3.3 United Kingdom (2) 7.9 8.6 9.2 8.4 7.2 8.4 9.8 9.6 10.3 8.9 Iceland (3) 6.4 6.5 10.9 10.6 6.6 6.7 4.2 5.8 1.9 4.4 Norway 5.6 5.7 25.3 23.3 4.8 5.7 2.1 0.8 6.3 2.8 Switzerland (2) 7.7 7.3 8.9 8.7 7.2 7.5 8.2 5.6 14.1 9.8 Former Yugoslav Republic of Macedonia (1)(3) 10.2 8.9 11.2 7.7 10.1 9.1 10.3 8.0 13.4 25.3
Serbia : 12.6 : 12.5 : 11.7 : 15.5 : 42.8 Turkey (3) 16.0 13.7 17.0 14.3 15.7 13.8 15.9 11.4 18.4 16.0
(1) 65 years and over: low reliability.(2) 2016: break in series.
(3) 2015.(4) 65 years and over, 2011: low reliability.
Source: Eurostat (online data code: ilc_iw01)

4 Socio-economic aspects of living conditions
Living conditions in Europe — 2018 edition96
Figure 4.8: Income transitions for the working‑age population — changes in level of income from employment during the previous year, 2016(%)
0
25
50
75
100
EU-2
8 (1)
Bulg
aria
Swed
enUn
ited
King
dom
(2)
Esto
nia
Latv
iaHu
ngar
yAu
stria
Finl
and
(2)D
enm
ark
Slov
akia
(2)
Spai
nLi
thua
nia
(2)Lu
xem
bour
g (2)
Mal
taBe
lgiu
mPo
rtug
alCr
oatia
Slov
enia
Czec
h Re
publ
icGe
rman
yFr
ance
Pola
ndIre
land
(2)
Net
herla
nds
Gree
ce (2
)Cy
prus
Italy
(2)
Rom
ania
(2)
Icel
and
(2)N
orw
aySw
itzer
land
Turk
ey (2
)Se
rbia
Form
. Yug
. Rep
. of M
aced
onia
(2)
Transition to more than one income decile higher
Transition to one income decile higher
No change
Transition to one income decile lower
Transition to more than one income decile lower
Transition to no income
(1) Estimates.(2) 2015.
Source: Eurostat (online data code: ilc_lvhl34)
In 2016, more than one third (37.7 %) of the EU-28 working-age population (defined here as people aged 16-64 years) was confronted by a change in their income decile (when compared with the previous year). Those that moved up at least one income decile accounted for 20.5 % of the working-age population, while those that moved down at least one decile accounted for 17.3 % — among which 3.7 % were confronted by a transition to no income (which may occur, among others, from being made unemployed, enrolling in education or training, taking a career break, or caring for a relative); the remaining 62.3 % of the EU-28’s working-age population
had no change in their income decile (see Figure 4.8).
Map 4.3 and Map 4.4 provide more information in relation to upward and downward income transitions among the working-age populations of the EU Member States in 2016. The highest shares for upward income transitions (of at least one decile) were recorded in Bulgaria, Sweden and the United Kingdom (2015 data), while the highest shares for downward income transitions were recorded in Bulgaria, Latvia and Estonia.

4Socio-economic aspects of living conditions
Living conditions in Europe — 2018 edition 97
Map 4.3: Share of the working‑age population reporting an upward transition of at least one income decile during the previous year, 2016(%)
Administrative boundaries: © EuroGeographics © UN-FAO © Turkstat
Note: the working-age population is defined as those aged 16-64 years. Ireland, Greece; Italy, Lithuania, Luxembourg,Romania, Slovakia, Finland, the United Kingdom, Iceland, the former Yugoslav Republic of Macedonia and Turkey: 2015.
Share of the working-age population reporting an upward transitionof at least one income decile during the previous year, 2016(%)
0 200 400 600 800 km
Guadeloupe (FR)
0 25
Martinique (FR)
0 20
Guyane (FR)
0 100
Réunion (FR)
0 20
Açores (PT)
0 50
Madeira (PT)
0 20
Canarias (ES)
0 100
Malta
0 10
Liechtenstein
0 5
Cartography: Eurostat — GISCO, 05/2018
Source: Eurostat (online data code: ilc_lvhl34)
Mayotte (FR)
0 15
(%)EU-28 = 20.5
< 18.018.0 – < 21.021.0 – < 24.0>= 24.0Data not available
Note: the working-age population is defined as those aged 16-64 years. Ireland, Greece; Italy, Lithuania, Luxembourg, Romania, Slovakia, Finland, the United Kingdom, Iceland, the former Yugoslav Republic of Macedonia and Turkey: 2015.
Source: Eurostat (online data code: ilc_lvhl34)

4 Socio-economic aspects of living conditions
Living conditions in Europe — 2018 edition98
Map 4.4: Share of the working‑age population reporting a downward transition of at least one income decile during the previous year, 2016(%)
Administrative boundaries: © EuroGeographics © UN-FAO © Turkstat
Note: the working-age population is defined as those aged 16-64 years; the share of the working-age population reporting a downward transition includes those who transitioned to no income. Ireland, Greece; Italy, Lithuania, Luxembourg, Romania, Slovakia, Finland, the United Kingdom, Iceland, the former Yugoslav Republic of Macedonia and Turkey: 2015.Source: Eurostat (online data code: ilc_lvhl34)
Share of the working-age population reporting a downward transitionof at least one income decile during the previous year, 2016(%)
0 200 400 600 800 km
Guadeloupe (FR)
0 25
Martinique (FR)
0 20
Guyane (FR)
0 100
Réunion (FR)
0 20
Açores (PT)
0 50
Madeira (PT)
0 20
Canarias (ES)
0 100
Malta
0 10
Liechtenstein
0 5
Cartography: Eurostat — GISCO, 05/2018
Mayotte (FR)
0 15
(%)EU-28 = 17.3
< 14.014.0 – < 17.017.0 – < 22.0>= 22.0Data not available
Note: the working-age population is defined as those aged 16-64 years; the share of the working-age population reporting a downward transition includes those who transitioned to no income. Ireland, Greece; Italy, Lithuania, Luxembourg, Romania, Slovakia, Finland, the United Kingdom, Iceland, the former Yugoslav Republic of Macedonia and Turkey: 2015.
Source: Eurostat (online data code: ilc_lvhl34)

4Socio-economic aspects of living conditions
Living conditions in Europe — 2018 edition 99
Almost half of all young adults aged 18‑34 were living with their parents
Leaving the parental home is an important event in many people’s lives and can be viewed as part of the transition or passage (of rites) from childhood to adulthood — a journey which includes, among others, the completion of education, becoming an active participant in the labour force, achieving economic and cultural independence, and forming other relationships or one’s own family unit.
The decision to live independently out of the parental home is increasingly affected by the security of employment and the price/
availability of accommodation (for rent or sale). Between 2007 and 2016, the share of young adults (defined here as those aged 18-34 years) in the EU-28 who were living with their parents increased slightly, from 46.9 % to 48.0 % (see Figure 4.9).
In 2016, more than half (54.1 %) of all young men in the EU-28 continued to live with their parents, while the corresponding share for young women was lower, at 41.7 %. The share of young men and young women who continued to live with their parents rose during the period 2007 to 2016, the share for young men rose by 1.0 percentage points, while that for young women increased by 1.2 points.
Figure 4.9: Share of young adults (aged 18‑34) living with their parents by sex, EU‑28, 2007‑2016(%)
0
10
20
30
40
50
60
2007 2008 2009 2010 2011 2012 2013 2014 2015 2016
Male Female
Note: 2007-2009, EU-27.
Source: Eurostat (online data code: ilc_lvps08)

4 Socio-economic aspects of living conditions
Living conditions in Europe — 2018 edition100
A more detailed analysis is presented in Table 4.5, which provides information for two subpopulations of young adults (namely those aged 18-24 and those aged 25-34). Across the EU-28, the share of 18-24 year-olds that continued to live with their parents during the period 2011-2016 rose marginally from 79.3 % to 79.6 %, while there was also a small increase in the proportion of 25-34 year-olds who lived with their parents, their share rising from 27.9 % to 28.5 %.
In 2016, the share of young adults aged 18-24 still living with their parents was less than 50.0 % in Denmark and Finland, while less than two thirds of this age group were still living with their parents in Sweden and the United Kingdom. At the other end of the range, at least 9 out of every 10 young persons aged 18-24 years was still living with their parents in Luxembourg (2015 data), Cyprus, Slovenia, Spain, Malta, Slovakia, Croatia and Italy (2015 data), where the highest share was recorded, at 94.5 %.
Turning to young adults aged 25-34, all three Nordic Member States reported in 2016 that less than 10 % of this subpopulation continued to live with their parents, while there were five western EU Member States where less than one fifth of all adults aged 25-34 were still living with their parents. By contrast, there were five southern and eastern Member States where more than half of all young adults aged 25-34 continued to live with their parents, they were: Italy (50.6 %; 2015 data), Malta (51.5 %), Greece (54.8 %), Slovakia (55.5 %) and Croatia (58.7 %).
An analysis of developments for the share of young adults living with their parents between 2011 and 2016 reveals there were eight EU Member States where the share of both age groups continuing to live at home declined — this was the case in Bulgaria, the Czech Republic, Latvia, Lithuania, Austria, Slovenia, Slovakia and the United Kingdom. On the other hand, there were 14 Member States where the share of both age groups continuing to live at home increased — this was particularly true in Belgium, Greece, Spain, France and Italy (2011-2015).

4Socio-economic aspects of living conditions
Living conditions in Europe — 2018 edition 101
Table 4.5: Share of young adults living with their parents by age group, 2011, 2015 and 2016(%)
18-24 years 25-34 years2011 2015 2016 2011 2015 2016
EU-28 79.3 79.3 79.6 27.9 28.7 28.5 Belgium 78.0 82.4 89.8 15.6 19.0 22.0 Bulgaria (1) 85.2 78.7 82.6 55.7 44.2 46.8 Czech Republic 86.8 86.7 83.6 33.3 34.4 32.9 Denmark 45.0 41.4 42.2 2.3 3.7 3.8 Germany 84.5 85.3 83.8 14.7 19.1 17.9 Estonia (2) 74.6 73.4 75.7 20.0 22.1 22.6 Ireland 76.1 85.6 : 22.6 22.3 : Greece 80.9 82.6 85.5 50.7 53.4 54.8 Spain 86.9 91.9 92.5 36.6 39.1 40.0 France 64.4 69.4 71.3 11.6 10.1 13.4 Croatia 91.2 93.6 94.1 57.9 55.8 58.7 Italy 91.5 94.5 : 44.0 50.6 : Cyprus 88.8 87.8 90.4 29.7 27.3 31.7 Latvia 81.8 83.0 79.5 37.5 34.4 35.8 Lithuania 82.8 79.1 81.7 30.1 34.5 29.8 Luxembourg 87.9 90.0 : 25.2 27.3 : Hungary 84.9 83.7 82.9 38.6 40.6 40.9 Malta 95.0 94.7 93.5 48.3 48.8 51.5 Netherlands (1) 70.3 72.9 71.5 9.7 9.9 10.6 Austria 74.8 74.3 74.5 23.6 21.4 18.2 Poland 88.6 89.2 89.2 44.4 45.7 45.5 Portugal 88.8 89.9 88.8 46.3 45.7 45.6 Romania 86.0 88.3 86.6 39.2 43.4 43.7 Slovenia 91.6 92.6 90.5 44.1 42.5 43.1 Slovakia 96.2 94.5 93.9 56.4 54.1 55.5 Finland 43.9 43.6 44.7 4.1 4.7 4.3 Sweden (2) 53.8 54.8 54.3 4.1 5.3 6.0 United Kingdom (2) 70.7 61.9 65.1 15.1 16.0 14.3 Iceland 64.6 66.2 : 11.9 14.0 : Norway 43.0 47.2 46.3 3.6 5.4 6.7 Switzerland (2) 81.9 78.6 78.3 14.2 13.7 15.4 Former Yugoslav Republic of Macedonia 90.0 91.0 : 62.1 62.6 :
Serbia : 87.4 87.2 : 58.8 56.0 Turkey 75.7 79.6 : 32.7 35.7 :
(1) 2016: break in series.(2) 2015: break in series.
Source: Eurostat (online data code: ilc_lvps08)

4 Socio-economic aspects of living conditions
Living conditions in Europe — 2018 edition102
Figure 4.10: Analysis of of young adults (aged 18‑34) living with their parents by self‑defined economic status, 2016(% share of young adults living with parents)
0
25
50
75
100
EU-2
8
Mal
taUn
ited
King
dom
Slov
akia
Aust
riaPo
land
Rom
ania
Latv
iaBu
lgar
iaGe
rman
yLu
xem
bour
g (1)
Czec
h Re
publ
icCr
oatia
Hung
ary
Esto
nia
Port
ugal
Irela
nd (1
)Li
thua
nia
Net
herla
nds
Cypr
usSl
oven
iaSw
eden
Spai
nGr
eece
Den
mar
kBe
lgiu
mIta
ly (1
)Fr
ance
Finl
and
Switz
erla
ndIc
elan
d (1)
Nor
way
Turk
ey (1
)F o
rm. Y
ug. R
ep. o
f Mac
edon
ia (1
)Se
rbia
Employed working full-timeEmployed working part-timeStudentsUnemployedOther inactive
Note: ranked on the share of young adults (aged 18-34) who are employed (full-time or part-time) and living with their parents.
(1) 2015.
Source: Eurostat (online data code: ilc_lvps09)
The highest share of young adults still living with their parents were students
In 2016, students accounted for almost two fifths (38.0 %) of the young adults (aged 18-34) in the EU-28 who continued to live with their parents. The next highest share of young adults continuing to live with their parents was recorded among those in full-time employment (35.37 %), while 13.6 % were unemployed; 7.4 % were in part-time employment, and 5.7 % were inactive (see Figure 4.10).
In 2016, more than half of all the young adults who continued to live with their parents in
Sweden (51.3 %), the Netherlands (53.4 %), Belgium (53.9 %) and Denmark (55.6 %) were students; this share fell to less than one quarter in Bulgaria (24.9 %), the United Kingdom (24.1 %) and Malta (23.9 %).
In a similar vein, more than half of all the young adults who continued to live with their parents in Slovakia (57.1 %) and Malta (60.1 %) were in full-time employment, while the unemployed accounted for more than 1 in 5 young adults who continued to live with their parents in Italy (20.1 %; 2015 data), Spain (21.1 %), Croatia (22.5 %) and particularly Greece (30.6 %).

4Socio-economic aspects of living conditions
Living conditions in Europe — 2018 edition 103
A growing share of young employed adults who continued to live with their parents were employed on a temporary basis
In 2016, a relatively high share (46.5 %) of young adult employees in the EU-28 who were still living with their parents had a temporary employment contract (Figure 4.11). This share was often much higher, as more than half of all the young adult employees living with their parents in 10 of the EU Member States in 2016 had a temporary employee contract; this share almost reached three quarters (74.1 %) in Spain.
By contrast, the share of young adult employees still living with their parents who had a
temporary employee contract was much lower in the Baltic Member States, Romania and the United Kingdom.
A closer analysis for two different groups of young adults in the EU-28 shows that there was an increase between 2011 and 2016 in the share of young adult employees still living with their parents who had a temporary contract (see Table 4.6). By 2016, a majority (55.9 %) of this subpopulation aged 18-24 years had a temporary employee contract, while the corresponding share for young adult employees aged 25-34 years with a temporary employee contract was 37.7 %.
Figure 4.11: Analysis of young adult employees (aged 18‑34) living with their parents by type of employment contract, 2016(% share of young adult employees living with parents)
0
25
50
75
100
EU-2
8
Latv
iaRo
man
iaEs
toni
aUn
ited
King
dom
Lith
uani
aM
alta
Bulg
aria
Aust
riaIre
land
(1)
Hung
ary
Cypr
usSl
ovak
iaCz
ech
Repu
blic
Belg
ium
Luxe
mbo
urg
(1)Sl
oven
iaD
enm
ark
Italy
(1)
Gree
ceCr
oatia
Net
herla
nds
Port
ugal
Finl
and
Fran
ceGe
rman
yPo
land
Swed
enSp
ain
Nor
way
Icel
and
(1)Sw
itzer
land
Turk
ey (1
)Fo
rm. Y
ug. R
ep. o
f Mac
edon
ia (1
)Se
rbia
Permanent employee contract Temporary employee contract
(1) 2015.
Source: Eurostat (online data code: ilc_lvps10)

4 Socio-economic aspects of living conditions
Living conditions in Europe — 2018 edition104
Table 4.6: Analysis of young adult employees living with their parents by type of employment contract and age, 2011 and 2016(% share of young adult employees)
Permanent employee contract Temporary employee contract18-24 years 25-34 years 18-24 years 25-34 years
2011 2016 2011 2016 2011 2016 2011 2016EU-28 60.4 44.1 68.1 62.3 39.6 55.9 31.9 37.7 Belgium 48.8 53.4 64.8 73.6 51.2 46.6 35.2 26.4 Bulgaria (1) 81.3 71.9 93.1 89.0 18.7 28.1 6.9 11.0 Czech Republic 59.6 58.5 81.2 79.6 40.4 41.5 18.8 20.4 Denmark 93.7 56.3 : : 6.3 43.7 : : Germany 75.5 24.7 71.6 64.8 24.5 75.3 28.4 35.2 Estonia (1) 86.0 86.3 87.3 94.1 14.0 13.7 12.7 5.9 Ireland (2) 66.8 75.1 81.9 86.6 33.2 24.9 18.1 13.4 Greece 49.0 38.1 65.2 48.3 51.0 61.9 34.8 51.7 Spain 22.8 13.6 46.3 32.0 77.2 86.4 53.7 68.0 France 38.1 32.2 62.5 51.8 61.9 67.8 37.5 48.2 Croatia 41.1 28.8 62.8 54.0 58.9 71.2 37.2 46.0 Italy (2) 49.5 48.1 66.8 60.0 50.5 51.9 33.2 40.0 Cyprus 74.3 68.6 80.9 77.0 25.7 31.4 19.1 23.0 Latvia 82.3 99.0 86.3 99.2 17.7 1.0 13.7 0.8 Lithuania 86.4 79.4 91.7 92.9 13.6 20.6 8.3 7.1 Luxembourg (2) 48.8 48.0 80.5 73.3 51.2 52.0 19.5 26.7 Hungary 69.2 64.7 81.2 83.4 30.8 35.3 18.8 16.6 Malta 82.5 80.8 94.5 88.4 17.5 19.2 5.5 11.6 Netherlands (1) 47.5 41.1 63.6 57.9 52.5 58.9 36.4 42.1 Austria 77.4 81.0 88.8 87.7 22.6 19.0 11.2 12.3 Poland 25.7 23.3 52.9 45.2 74.3 76.7 47.1 54.8 Portugal 42.7 24.1 58.9 51.4 57.3 75.9 41.1 48.6 Romania 91.9 90.5 95.3 95.6 8.1 9.5 4.7 4.4 Slovenia 38.7 44.5 68.3 65.8 61.3 55.5 31.7 34.2 Slovakia 62.2 57.4 77.4 79.5 37.8 42.6 22.6 20.5 Finland (3) 42.3 39.3 81.2 50.8 57.7 60.7 18.8 49.2 Sweden (1)(3) 33.1 25.2 56.6 66.0 66.9 74.8 43.4 34.0 United Kingdom (1) 83.7 85.6 94.5 93.1 16.3 14.4 5.5 6.9 Iceland (2)(3) 65.6 66.9 66.8 55.4 34.4 33.1 33.2 44.6 Norway (3) 63.3 60.9 : 90.5 36.7 39.1 : 9.5 Switzerland (1) 51.2 49.4 77.4 73.8 48.8 50.6 22.6 26.2 Former Yugoslav Republic of Macedonia (2) 65.4 73.1 73.4 77.3 34.6 26.9 26.6 22.7
Serbia : 34.3 : 52.2 : 65.7 : 47.8 Turkey (2) 77.7 76.1 84.9 83.4 22.3 23.9 15.1 16.6
(1) 2016: break in series.(2) 2015 instead of 2016.
(3) 25-34 years: low reliability.
Source: Eurostat (online data code: ilc_lvps10)

4Socio-economic aspects of living conditions
Living conditions in Europe — 2018 edition 105
4.3 Childcare and education arrangementsThe unequal division of household tasks/duties — including those linked to raising children — is often presented as a key factor when explaining why female employment rates are lower than those recorded for men. This division of tasks may have other implications, such as the gender pay gap or a lack of female participation in social and/or political activities.
EU policy initiatives — for example, the European employment strategy, which has been integrated into the Europe 2020 growth strategy — aim to promote social mobility among women, for example, by reassessing the work-life balance, creating flexible working arrangements,
removing tax disincentives for second earners, or providing better access to affordable childcare and other care services; the final section in this chapter concentrates on the last of these measures.
Almost half of all children under three years of age were cared for only by their parents
In 2016, close to half (47.3 %) of all children in the EU-28 who were aged less than three years were cared for exclusively by their parents (see Figure 4.12). This share varied considerably across the EU Member States, from lows of 19.9 % in Portugal and 24.1 % in the Netherlands up to highs of more than 70.0 % in Bulgaria and especially Slovakia (79.8 %).
Figure 4.12: Share of children aged less than three cared for only by their parents, 2016(%)
01020304050607080
EU-2
8
Slov
akia
Bulg
aria
Latv
iaLi
thua
nia
Finl
and
Germ
any
Czec
h Re
publ
icHu
ngar
yCr
oatia
Aust
riaEs
toni
aPo
land
Mal
taSw
eden
Spai
nUn
ited
King
dom
Gree
ceIre
land
Italy
Belg
ium
Rom
ania
Luxe
mbo
urg
Fran
ceCy
prus
Slov
enia
Den
mar
kN
ethe
rland
sPo
rtug
al
Nor
way
Switz
erla
nd (1
)Ic
elan
d (2)
F orm
. Yug
. Rep
. of M
aced
onia
Serb
ia
(1) 2014.(2) 2015.
Source: Eurostat (online data code: ilc_caparents)

4 Socio-economic aspects of living conditions
Living conditions in Europe — 2018 edition106
Children who are not cared for exclusively by their parents may receive formal childcare, other types of childcare, or both. Formal childcare is defined here as regulated childcare provided away from the child’s home; it includes, inter alia, the time spent at school within compulsory education. Other types of childcare comprise care that is provided by a professional child-minder at the child’s home or at child-minders’ home and care provided by grandparents, other household members (outside parents), other relatives, friends or neighbours.
In 2016, almost one third (32.9 %) of EU-28 children aged less than three years received formal childcare; they were relatively evenly split between those receiving less than 30 hours of formal childcare per week (15.0 %) and those receiving 30 or more hours (17.9 %).
Among the EU Member States, the share of children aged less than three years receiving 30 hours or more of formal childcare per week in 2016 peaked at 70.0 % in Denmark, while more than half of all children aged less than three received formal childcare in the Netherlands (53.0 %), Sweden (51.0 %) and Luxembourg (50.9 %) — see Table 4.7.
The share of EU-28 children that received formal childcare increased as a function of their age. In 2016, the share for children aged between three years and the minimum compulsory school age was 86.3 %, while it rose to 97.0 % for those aged between the minimum compulsory school age and 12 years of age.
In 2016, Croatia (51.3 %) and Greece (55.6 %) were the only EU Member States to report that less than three fifths of their children aged between three years and the minimum compulsory school age received some formal childcare. By contrast, more than 95 % of all Spanish, Danish, Swedish and Belgian children in this age group received such care.
Given that formal childcare includes compulsory education, it is not surprising to find that more than 90.0 % of children aged between the minimum compulsory school age and 12 years received some formal childcare; in 2016, this pattern was apparent in each of the EU Member States, other than Romania and Slovakia.
Table 4.8 provides information in relation to the provision of other types of childcare, with an analysis by age. In 2016, more than three tenths (30.2 %) of all children in the EU-28 under the age of three years received other types of childcare; as such, this was almost as high as the share receiving formal childcare (32.9 %). More than half of all children under the age of three years received other types of childcare in Greece, Romania and the Netherlands (where the highest share was recorded, at 59.4 %).
For children between the age of three years and the minimum compulsory school age, the share of EU-28 children receiving other types of childcare was comparable to that recorded for children under the age of three years; it stood at 28.7 % in 2016. A slightly lower share (26.5 %) of children aged between the minimum compulsory school age and 12 years received other types of childcare.

4Socio-economic aspects of living conditions
Living conditions in Europe — 2018 edition 107
Table 4.7: Share of children receiving formal childcare by age of child and duration of care, 2016(% of population in each age group)
Aged less than three years
Aged from three years up to the minimum
compulsory school age
Aged between the minimum compulsory
school age and 12 years
1‑29 hours per week
30 hours or more per
week
1‑29 hours per week
30 hours or more per
week
1‑29 hours per week
30 hours or more per
weekEU‑28 15.0 17.9 34.5 51.8 31.7 65.3 Belgium 15.3 28.5 25.3 73.3 15.2 77.7 Bulgaria 0.0 12.5 7.4 67.3 37.8 59.3 Czech Republic 3.0 1.7 25.8 55.2 40.6 58.2 Denmark 7.8 62.2 11.7 84.2 1.1 98.7 Germany 11.2 21.4 38.6 53.2 37.4 52.8 Estonia 9.4 20.8 8.7 84.1 53.1 46.0 Ireland 20.4 8.2 67.3 25.6 53.9 46.0 Greece 2.9 6.0 15.1 40.5 29.2 67.7 Spain 20.6 18.7 51.3 43.9 47.7 52.1 France 17.0 31.9 37.0 56.9 31.4 67.8 Croatia 2.2 13.5 4.4 46.9 61.7 30.4 Italy 12.1 22.3 18.3 74.3 14.8 85.1 Cyprus 6.8 18.0 40.7 37.8 74.3 25.6 Latvia 1.7 26.6 1.6 80.3 14.4 84.4 Lithuania 2.7 12.5 7.6 70.8 52.6 45.9 Luxembourg 17.9 33.0 31.8 55.4 29.0 64.2 Hungary 3.4 12.2 13.7 73.1 15.9 80.2 Malta 18.1 13.2 31.5 56.6 8.7 91.3 Netherlands 47.6 5.4 74.0 19.5 68.5 31.3 Austria 15.0 5.6 62.7 26.0 57.5 42.4 Poland 2.3 5.6 15.3 45.7 41.5 56.2 Portugal 2.7 47.2 5.8 86.2 5.9 93.9 Romania 8.6 8.8 50.7 10.1 87.4 1.3 Slovenia 3.9 35.7 8.5 81.4 27.4 72.1 Slovakia 0.0 0.5 12.3 65.0 22.6 41.4 Finland 9.8 22.9 23.7 60.2 84.8 15.2 Sweden 17.4 33.6 27.0 69.6 0.6 99.4 United Kingdom 24.0 4.4 46.2 27.2 3.8 95.9 Iceland 9.6 90.4 3.3 96.7 38.6 61.4 Norway 5.1 47.0 11.1 78.3 51.3 47.9 Switzerland (1) 24.0 5.8 56.9 9.1 51.4 48.2 Former Yugoslav Republic of Macedonia 2.3 6.8 : : 62.7 10.8
Serbia 1.5 16.6 : : 41.3 21.6 (1) 2014.
Source: Eurostat (online data code: ilc_caindformal)

4 Socio-economic aspects of living conditions
Living conditions in Europe — 2018 edition108
Table 4.8: Share of children receiving other types of childcare by age of child and duration of care, 2016(% of population in each age group)
Aged less than three years
Aged from three years up to the minimum
compulsory school age
Aged between the minimum compulsory
school age and 12 years
1‑29 hours per week
30 hours or more per
week
1‑29 hours per week
30 hours or more per
week
1‑29 hours per week
30 hours or more per
weekEU‑28 22.0 8.2 25.5 3.2 24.4 2.1 Belgium 12.8 7.4 23.3 0.3 16.7 0.4 Bulgaria 14.0 4.0 13.5 3.7 10.6 1.4 Czech Republic 37.0 2.2 47.1 2.0 41.8 1.9 Denmark 0.3 1.0 0.2 0.2 2.0 0.1 Germany 9.5 3.6 12.0 0.3 14.5 0.2 Estonia 26.2 2.8 27.8 1.6 14.1 0.8 Ireland 21.8 11.6 25.5 2.6 18.5 0.5 Greece 27.4 22.9 31.4 17.2 30.2 5.2 Spain 8.8 9.1 7.7 1.3 6.2 0.8 France 16.0 9.5 24.2 3.0 17.4 0.8 Croatia 23.2 14.7 30.7 13.7 29.2 4.4 Italy 30.3 8.8 29.6 3.3 26.3 2.1 Cyprus 14.2 31.7 27.9 9.1 29.5 1.7 Latvia 4.1 3.3 7.5 1.6 12.2 2.6 Lithuania 14.6 9.9 24.5 5.0 20.8 4.0 Luxembourg 22.5 1.3 39.5 4.6 19.8 0.9 Hungary 31.2 1.7 41.6 2.7 30.2 1.4 Malta 25.2 9.5 27.4 3.7 23.2 0.6 Netherlands 57.9 1.5 59.7 0.2 39.1 0.6 Austria 34.7 1.0 46.8 1.0 31.2 1.1 Poland 30.4 15.8 42.3 9.0 44.8 3.4 Portugal 19.3 23.9 29.2 5.0 28.1 1.2 Romania 34.7 18.6 41.5 10.2 36.5 4.3 Slovenia 37.2 9.7 55.5 6.7 46.5 1.3 Slovakia 17.3 2.3 32.0 1.8 23.1 1.0 Finland 2.7 2.1 2.0 0.6 0.0 0.0 Sweden 0.6 0.5 1.3 1.2 1.0 0.0 United Kingdom 31.7 8.6 38.8 4.4 34.2 5.3 Iceland 13.6 23.6 25.1 0.4 22.1 0.0 Norway 5.0 0.8 4.1 0.1 4.2 0.1 Switzerland (1) 42.1 5.7 49.5 4.5 39.2 1.2 Former Yugoslav Republic of Macedonia 23.8 23.1 : : 14.4 11.8
Serbia 36.8 24.4 : : 38.6 16.5 Note: other types of childcare includes care from a professional child-minder at child’s home or at the child-minder’s home and childcare provided by grandparents, other household members (besides the parents), other relatives, friends or neighbours.
(1) 2014.
Source: Eurostat (online data code: ilc_caindother)

5 Social participation and integration

5 Social participation and integration
Living conditions in Europe — 2018 edition110
At the Laeken European Council in December 2001, European heads of state and government endorsed a first set of common statistical indicators for social exclusion and poverty that are subject to a continuing process of refinement by the indicators sub-group (ISG) of the social protection committee (SPC). These indicators are an essential element in the open method of coordination (OMC) to monitor the progress made by European Union (EU) Member States in alleviating poverty and social exclusion.
In 2013, the European Commission called on EU Member States to prioritise social investment, with a particular emphasis on active inclusion strategies and the impact this could have on one of five key Europe 2020 targets, namely, to lift at least 20 million people out of poverty and social exclusion.
Active participation in cultural and social life is thought to be closely linked with an individual’s quality of life, with growing importance given to cultural and social capital (in contrast to economic capital). Within this context, social participation and integration are increasingly viewed as being of significance, particularly for marginalised groups (such as migrants, the disabled or the elderly).
This chapter presents statistics on social participation and integration in the EU. All of the data are based on an ad-hoc module that forms part of the EU’s statistics on income and living conditions (EU-SILC). The module was implemented in 2015 and covered social/cultural participation and material deprivation; it collected a wide range of indicators covering areas such as participation in cultural and sporting events, interactions with relatives, friends and neighbours, or social participation (for example, unpaid charity work, helping others, or political activities).
Ad-hoc EU-SILC modules are developed each year in order to complement permanently collected variables with supplementary information that highlights unexplored aspects of social inclusion. The 2015 ad-hoc module included variables on social and cultural participation (15 variables) as well as variables on material deprivation (seven variables). These two topics were also covered by previous ad-hoc modules in 2006 (for social participation) and in 2009 and 2014 (for material deprivation).
The EU-SILC questionnaire on social and cultural participation was addressed to household members aged 16 and over and mostly covered a reference period of 12 months prior to the interview (note however, for some questions a different reference period was used, for example, the respondent’s usual or current situation).
5.1 Social participationThe EU-SILC ad-hoc module on social and cultural participation conducted in 2015 provides a definition for some key terms that allow an analysis of social participation.
Active citizenship: participation in the activities of a political party or a local interest group; participation in a public consultation; peaceful protest including signing a petition; participation in a demonstration; writing a letter to a politician, or writing a letter to the media (this may be carried out via the internet). Note that voting in an election is not considered as active citizenship (as voting in some countries is compulsory).
Participation in formal voluntary work: non-compulsory, volunteer work conducted to help other people, the environment, animals, the wider community, etc. through unpaid work for an organisation, formal group or club (for example, charitable or religious organisations).

5Social participation and integration
Living conditions in Europe — 2018 edition 111
Figure 5.1: Share of people participating in active citizenship by socio‑economic characteristic, EU‑28, 2015(%)
0
5
10
15
20
25
Mal
e
Fem
ale
16-2
4
25-6
4
65-7
4
75 a
nd o
ver
Low
Med
ium
High
Firs
t qui
ntile
Seco
nd q
uint
ile
Third
qui
ntile
Four
th q
uint
ile
Fifth
qui
ntile
Citie
s
Tow
ns a
nd su
burb
s
Rura
l are
as
Sex Age (years) Education Income Degree ofurbanisation
Note: refers to the population aged 16 years and over (except for analysis by age). Estimates.
Source: Eurostat (online data codes: ilc_scp19 and ilc_scp20)
Participation in informal voluntary activities: helping other people not living in the same household (for example, by cooking for them or cleaning their home); taking care of people in hospitals or in their own home; taking people for a walk, shopping, etc.; helping animals (for example, homeless or wild animals); other informal voluntary activities (for example, cleaning a beach or a forest).
ACTIVE CITIZENSHIP
Active citizenship describes people who decide to get involved in democracy at all levels, from local communities, through towns and cities to nationwide activities. Indeed, participative
democracy requires people to get involved and to play an active role in political organisations or supporting various causes with a commitment to improve the welfare of society.
In 2015, the share of the EU-28 population aged 16 and over that participated in active citizenship was 11.9 %. A slightly higher share of men (12.2 %) compared with women (11.7 %) were active citizens, while working-age adults (25-64 years), people with a higher level of educational attainment (ISCED levels 5-8), people in the top income quintile, and people living in cities all tended to participate more than average in active citizenship (see Figure 5.1).

5 Social participation and integration
Living conditions in Europe — 2018 edition112
Figure 5.2: Share of active citizens by sex, 2015(%)
0
5
10
15
20
25
30
EU-2
8 (1)
Fran
ceSw
eden
Net
herla
nds
Finl
and
Luxe
mbo
urg
Unite
d Ki
ngdo
m (2
)Ge
rman
yAu
stria
Port
ugal
Mal
taEs
toni
aIre
land
(2)
Gree
ceSp
ain
Pola
nd (2
)D
enm
ark
Slov
enia
Italy
Lith
uani
aCr
oatia
Latv
iaBe
lgiu
mHu
ngar
yCz
ech
Repu
blic
Bulg
aria
Rom
ania
Slov
akia
Cypr
us
Switz
erla
ndIc
elan
dN
orw
ay
Form
. Yug
. Rep
. of M
aced
onia
Serb
ia
Male Female
Note: refers to the population aged 16 years and over. Ranked on the overall share (male and female) of the population who were active citizens.
(1) Estimates.(2) Low reliability.
Source: Eurostat (online data code: ilc_scp19)
The EU Member States with the highest shares of active citizens were characterised by a high degree of female participation
Across the EU Member States, the share of active citizens peaked in 2015 in France (24.6 %), followed by Sweden (22.1 %), the Netherlands (17.8 %) and Finland (17.0 %); contrary to the results for the whole of the EU-28, a higher proportion of women (compared with men) were active citizens in each of these four Member States. There were only three other Member States where a higher proportion of women were active citizens in 2015, namely, Ireland, the United Kingdom and Lithuania (see Figure 5.2).
At the other end of the range, less than 5.0 % of the population in 2015 were active citizens in Belgium, Hungary, the Czech Republic,
Bulgaria, Romania, Slovakia and Cyprus — which had the lowest proportion (2.1 %).
Active citizenship was most common among middle‑aged people …
Table 5.1 provides information on the share of active citizens by age. In 2015, the share of the EU-28 population participating in active citizenship peaked at 13.3 % among those persons aged 50-64 years, while people aged 35-49 years had a share that was only slightly lower (13.1 %). Participation in active citizenship was lower at either end of the age spectrum, falling to 10.4 % among young adults (16-24 years) and to 6.5 % for the elderly (aged 75 years or more).
A closer analysis reveals that there was a very mixed pattern among the EU Member States: for example, the highest share of active citizens was recorded among young

5Social participation and integration
Living conditions in Europe — 2018 edition 113
Table 5.1: Share of active citizens by age, 2015(%)
Total population
(aged 16 years
and over)
16-24 years
25-34 years
35-49 years
50-64 years
65-74 years
75 years and over
EU‑28 11.9 10.4 12.5 13.1 13.3 12.0 6.5 Belgium 4.9 3.1 4.0 6.0 6.5 4.1 2.8 Bulgaria 3.7 5.1 4.1 4.2 4.1 2.7 0.9 Czech Republic 4.2 3.2 4.2 4.9 4.0 4.9 2.5 Denmark 6.8 5.5 8.2 6.3 7.5 7.7 5.3 Germany 13.9 11.7 16.2 15.5 14.0 13.9 9.3 Estonia 8.7 9.9 10.0 9.8 8.1 7.3 5.4 Ireland (1) 8.7 2.1 9.3 10.5 10.3 11.1 5.3 Greece 8.4 10.4 8.9 9.4 9.3 6.3 3.7 Spain 7.9 8.1 7.9 9.4 10.0 5.3 1.3 France 24.6 19.8 25.3 28.4 28.8 24.7 12.5 Croatia 5.6 5.2 7.4 6.4 6.4 3.6 1.4 Italy 6.3 6.5 6.4 7.0 8.0 5.2 2.3 Cyprus 2.1 1.0 1.8 2.5 3.1 2.1 1.3 Latvia 5.6 5.7 6.0 6.6 5.8 4.3 3.7 Lithuania 6.3 9.3 6.4 7.2 6.7 3.7 2.1 Luxembourg 16.3 15.2 14.9 14.2 21.3 18.8 8.0 Hungary 4.7 3.9 4.0 4.9 5.7 5.2 2.1 Malta 9.6 7.8 8.4 10.8 11.2 10.4 5.6 Netherlands 17.8 14.6 18.6 19.4 19.4 18.0 11.2 Austria 11.9 11.2 13.1 13.7 13.5 9.0 5.1 Poland (1) 7.3 5.7 8.2 8.2 8.3 6.9 2.9
Portugal 9.8 11.5 12.5 13.0 8.6 6.5 3.9 Romania 3.6 6.8 4.5 3.9 3.0 1.6 1.1 Slovenia 6.5 5.9 6.7 7.2 6.1 8.3 3.0 Slovakia 2.8 2.2 2.9 3.2 2.7 2.8 1.6 Finland 17.0 14.8 24.1 21.1 15.7 13.4 6.9 Sweden 22.1 24.0 24.9 23.4 21.4 20.1 15.9 United Kingdom (1) 14.5 8.2 12.2 15.1 17.3 21.0 10.5 Iceland 16.9 16.5 21.1 18.3 17.6 11.9 7.1 Norway 11.6 11.7 12.7 12.5 13.1 9.5 3.6 Switzerland 26.6 25.9 23.8 27.5 30.2 26.3 20.3 Former Yugoslav Republic of Macedonia 9.8 11.6 14.5 10.2 8.2 5.0 2.3
Serbia 3.9 3.7 4.0 4.2 5.0 2.7 1.4 (1) Low reliability.
Source: Eurostat (online data code: ilc_scp19)
adults in Bulgaria, Romania, Lithuania and Greece, while the highest share of active citizens in the Czech Republic, Slovenia,
Ireland and the United Kingdom was recorded among people aged 65-74 years.

5 Social participation and integration
Living conditions in Europe — 2018 edition114
Figure 5.3: Share of active citizens by educational attainment, 2015(%)
0 5
10 15 20 25 30 35 40
EU-2
8 (1)
Fran
ceSw
eden
Net
herla
nds
Finl
and
Luxe
mbo
urg
Unite
d Ki
ngdo
m (2
)Ge
rman
yAu
stria
Port
ugal
Mal
taEs
toni
aIre
land
(2)
Gree
ceSp
ain
Pola
nd (2
)D
enm
ark
Slov
enia
Italy
Lith
uani
aCr
oatia
Latv
iaBe
lgiu
mHu
ngar
yCz
ech
Repu
blic
Bulg
aria
Rom
ania
Slov
akia
Cypr
us
Switz
erla
ndIc
elan
dN
orw
ay
Form
. Yug
. Rep
. of M
aced
onia
Serb
ia
High (ISCED levels 5-8) Medium (ISCED levels 3-4 ) Low (ISCED levels 0-2)
Note: refers to the population aged 16 years and over. Ranked on the overall share of the population who were active citizens.
(1) Estimates.(2) Low reliability.
Source: Eurostat (online data code: ilc_scp19)
… and among people with a high level of educational attainment
The share of active citizens generally increased as a function of an individual’s educational attainment (see Figure 5.3). In 2015, the share of active citizens among the EU-28 population with a low level of educational attainment (ISCED levels 0-2) was 5.6 %, rising to 11.4 % for those with a medium level of educational attainment (ISCED levels 3-4) and peaking at more than one in five (20.8 %) persons for those with a high level of educational attainment (ISCED levels 5-8). This pattern was reproduced in each of the EU Member States, with
the exception of Malta, where a higher share (9.4 %) of people with a low level of educational attainment were active citizens, when compared with the corresponding share (9.0 %) for people with a medium level of educational attainment.
In 2015, the largest disparities in active citizenship between those subpopulations with high and low levels of educational attainment were observed in France (27.4 percentage points), Portugal (20.4 points), the United Kingdom (18.5 points) and the Netherlands (18.3 points).

5Social participation and integration
Living conditions in Europe — 2018 edition 115
Figure 5.4: Share of active citizens by income quintile, 2015(%)
0 5
10
15
20 25
30
35 40
EU-2
8 (1)
Fran
ceSw
eden
Net
herla
nds
Finl
and
Luxe
mbo
urg
Unite
d Ki
ngdo
m (2
)Ge
rman
yAu
stria
Port
ugal
Mal
taEs
toni
aIre
land
(2)
Gree
ceSp
ain
Pola
nd (2
)D
enm
ark
Slov
enia
Italy
Lith
uani
aCr
oatia
Latv
iaBe
lgiu
mHu
ngar
yCz
ech
Repu
blic
Bulg
aria
Rom
ania
Slov
akia
Cypr
us
Switz
erla
ndIc
elan
dN
orw
ay
Serb
ia
Fifth quintileFourth quintileThird quintileSecond quintileFirst quintile
Note: refers to the population aged 16 years and over. Ranked on the overall share of the population who were active citizens.
(1) Estimates.(2) Low reliability.
Source: Eurostat (online data code: ilc_scp20)
Figure 5.4 provides an analysis of active citizenship by income quintile. It reveals that a larger proportion of people with higher incomes were active citizens. For example, across the EU-28 some 17.2 % of the fifth quintile (the top 20 % of the population with the highest incomes) were active citizens in 2015. This share was almost double the value recorded for the lowest quintile (the bottom 20 % of the population with the lowest incomes), as just 8.9 % of this subpopulation were active citizens.
This pattern was reproduced in most of the EU Member States and in some cases the disparities were considerable: for example, the share of active citizens among those in the fifth income quintile was 7.5 times as high as the share for the bottom quintile in Cyprus, 5.0 times as high in Lithuania, 4.8 times as high in Bulgaria, and 4.0 times as high in Romania. By contrast, the share of active citizens in Denmark was higher for the bottom quintile (8.0 %) than it was for the fifth quintile (6.9 %); this pattern was repeated in both Iceland and Norway.
An analysis of active citizenship by household type and degree of urbanisation (see Table 5.2) reveals that in 2015 a relatively high proportion (17.1 %) of the EU-28 population aged 16 and over living in single person households and in cities were active citizens. This may reflect, at least to some degree, the development of community-led, grassroots activism in many urban centres (sometimes in response to the gentrification of neighbourhoods).
In 2015, active citizens accounted for more than one quarter of the adult population living in single person households in cities in in Sweden, France, the Netherlands and Finland; this pattern was also repeated in Switzerland.
People living in households composed of two adults with dependent children were generally less inclined to be active citizens. Nevertheless, more than a quarter of the adult population living in this type of household in France were active citizens; this was also the

5 Social participation and integration
Living conditions in Europe — 2018 edition116
Table 5.2: Share of active citizens by household type and by degree of urbanisation, 2015(%)
Total population
(aged 16 years and
over)
Single person Two adults with dependent children
Cities Towns and suburbs Rural areas Cities Towns and
suburbs Rural areas
EU‑28 11.9 17.1 12.2 12.1 13.7 11.7 12.5 Belgium 4.9 6.7 5.8 5.5 6.2 3.6 5.4 Bulgaria 3.7 7.0 3.2 1.6 6.9 3.6 2.3 Czech Republic 4.2 6.3 4.4 4.6 4.6 4.0 5.8 Denmark 6.7 14.6 8.0 7.3 5.4 4.6 4.2 Germany 13.9 20.3 11.6 14.3 14.5 14.1 13.4 Estonia 8.6 12.6 13.3 6.3 9.9 9.6 9.0 Ireland (1) 8.6 18.6 12.3 7.2 8.2 5.9 8.5 Greece 8.4 8.3 7.8 6.4 9.2 11.0 10.4 Spain 7.9 10.4 10.4 7.5 9.9 9.3 6.2 France 24.5 27.7 21.0 24.8 27.3 26.5 25.2 Croatia 5.6 7.1 4.1 3.8 5.8 10.1 6.6 Italy 6.3 6.6 6.9 6.6 8.1 6.7 7.3 Cyprus 2.1 2.7 2.3 1.0 3.0 0.9 1.5 Latvia 5.5 7.3 6.3 3.9 7.0 8.5 5.2 Lithuania (2) 6.3 6.6 : 2.2 9.6 0.0 5.1 Luxembourg 16.2 21.8 15.1 19.3 14.4 10.7 20.6 Hungary 4.7 4.8 4.2 4.7 4.4 5.0 4.8 Malta 9.6 8.3 8.9 : 9.6 7.7 : Netherlands 17.6 27.4 21.9 16.8 19.0 16.4 16.0 Austria 11.9 19.5 9.2 8.8 16.7 9.9 11.7 Poland (1) 7.3 10.7 3.8 5.8 8.4 6.8 7.7 Portugal 9.8 13.1 9.1 4.9 14.1 12.9 11.4 Romania 3.6 2.0 4.8 0.9 4.9 6.6 3.7 Slovenia 6.5 12.9 8.7 5.7 8.0 6.4 6.2 Slovakia 2.8 3.1 1.0 2.6 2.4 2.8 3.3 Finland 16.8 26.0 18.7 12.7 19.7 17.7 15.3 Sweden 21.9 31.6 27.1 25.8 22.1 22.0 21.2 United Kingdom (1) 14.7 15.5 17.5 21.0 12.6 12.6 15.5 Iceland 16.7 23.7 17.6 19.3 19.7 16.9 8.8 Norway 11.6 14.0 14.2 19.6 11.3 9.5 12.2 Switzerland 26.5 25.5 21.0 22.5 27.5 27.2 30.2 Serbia 3.9 5.0 3.3 1.4 4.4 2.0 3.0
(1) Low reliability.(2) Two adults with dependent children in towns and suburbs: low reliability.
Source: Eurostat (online data code: ilc_scp20)
case in Switzerland. It is interesting to note that in the Czech Republic, Ireland, Luxembourg, Slovakia and the United Kingdom, the highest share of active citizens among people living
in households composed of two adults with dependent children was recorded in rural areas; this pattern was repeated in Norway and Switzerland.
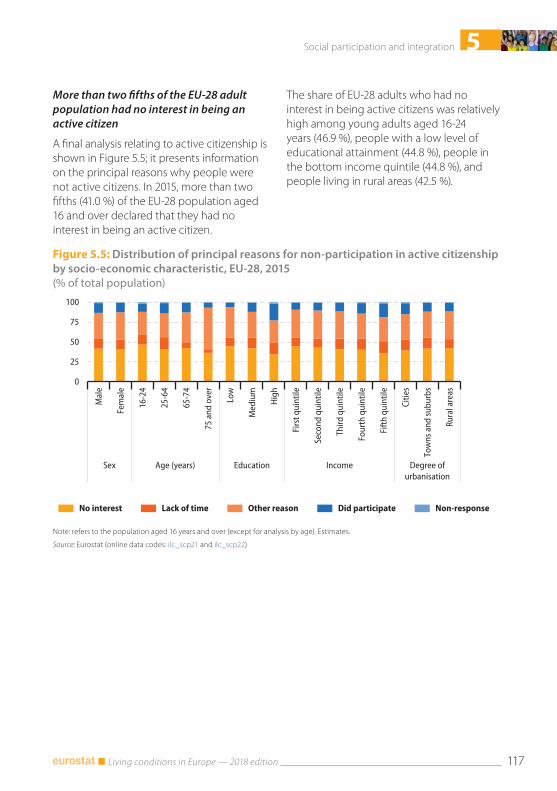
5Social participation and integration
Living conditions in Europe — 2018 edition 117
Figure 5.5: Distribution of principal reasons for non‑participation in active citizenship by socio‑economic characteristic, EU‑28, 2015(% of total population)
0
25
50
75
100
Mal
e
Fem
ale
16-2
4
25-6
4
65-7
4
75 a
nd o
ver
Low
Med
ium
High
Firs
t qui
ntile
Seco
nd q
uint
ile
Third
qui
ntile
Four
th q
uint
ile
Fifth
qui
ntile
Citie
s
Tow
ns a
nd su
burb
s
Rura
l are
as
Sex Age (years) Education Income Degree ofurbanisation
No interest Lack of time Other reason Did participate Non-response
Note: refers to the population aged 16 years and over (except for analysis by age). Estimates.
Source: Eurostat (online data codes: ilc_scp21 and ilc_scp22)
More than two fifths of the EU‑28 adult population had no interest in being an active citizen
A final analysis relating to active citizenship is shown in Figure 5.5; it presents information on the principal reasons why people were not active citizens. In 2015, more than two fifths (41.0 %) of the EU-28 population aged 16 and over declared that they had no interest in being an active citizen.
The share of EU-28 adults who had no interest in being active citizens was relatively high among young adults aged 16-24 years (46.9 %), people with a low level of educational attainment (44.8 %), people in the bottom income quintile (44.8 %), and people living in rural areas (42.5 %).

5 Social participation and integration
Living conditions in Europe — 2018 edition118
Figure 5.6: Participation rates for volunteering by socio‑economic characteristic, EU‑28, 2015(%)
0 5
10 15 20 25 30
Mal
e
Fem
ale
16-2
4
25-6
4
65-7
4
75 a
nd o
ver
Low
Med
ium
High
Firs
t qui
ntile
Seco
nd q
uint
ile
Third
qui
ntile
Four
th q
uint
ile
Fifth
qui
ntile
Citie
s
Tow
ns a
nd su
burb
s
Rura
l are
as
Sex Age (years) Education Income Degree ofurbanisation
Formal voluntary activities Informal voluntary activities
Note: refers to the population aged 16 years and over (except for analysis by age). Estimates.
Source: Eurostat (online data codes: ilc_scp19 and ilc_scp20)
FORMAL AND INFORMAL VOLUNTARY ACTIVITIES
In 2015, approximately one fifth of the EU-28 population aged 16 and over participated in voluntary activities; the share of the adult population participating in formal voluntary activities was 18.0 %, while the share engaged in informal voluntary activities was slightly higher, at 20.7 %.
A closer analysis for the EU-28 by socio-economic characteristic (see Figure 5.6) reveals that men, people aged 65-74 years, people with a high level of educational attainment, people in the top income quintile, and people living in rural areas tended to participate more (than average) in formal volunteering. These patterns were
often repeated when analysing the share of the EU-28 population that participated in informal voluntary activities, although a higher share of women (than men) and a higher share of people living in cities (than people living in towns and suburbs) participated in informal volunteering.
Among the EU Member States in 2015, the highest share of adults participating in formal voluntary activities was recorded in Luxembourg (34.8 %), while more than one quarter of the adult population participated in these activities in Germany, the Netherlands, Austria, Denmark and Sweden; this was also the case in Switzerland and Norway. There were nine Member States where fewer than 1 in 10 adults participated

5Social participation and integration
Living conditions in Europe — 2018 edition 119
Figure 5.7: Participation rates for formal and informal voluntary activities, 2015(%)
0
10
20
30
40
50
60
EU-2
8 (1)
Luxe
mbo
urg
Germ
any
Net
herla
nds
Aust
riaD
enm
ark
Swed
enFi
nlan
dFr
ance
Belg
ium
Slov
enia
Irela
nd (2
)Un
ited
King
dom
(2)
Esto
nia
Lith
uani
aPo
land
(2)
Czec
h Re
publ
icIta
lyGr
eece
Spai
nCr
oatia
Port
ugal
Mal
taSl
ovak
iaLa
tvia
Cypr
usHu
ngar
yBu
lgar
iaRo
man
ia
Switz
erla
ndN
orw
ayIc
elan
d
Form
. Yug
. Rep
. of M
aced
onia
Serb
ia
Informal voluntary activities Formal voluntary activities
Note: refers to the population aged 16 years and over. Ranked on the share of formal voluntary activities.
(1) Estimates.(2) Low reliability.
Source: Eurostat (online data code: ilc_scp19)
in formal voluntary activities in 2015 — they were principally located in eastern and southern Europe, with the lowest share recorded in Romania (3.2 %).
In 2015, a majority of the adult populations of the Netherlands (58.0 %), Finland (52.2 %) and Poland (50.6 %) participated in informal voluntary activities, while the share in Sweden was only slightly lower (49.9 %). At the other end of the range, the share of the adult population that participated in informal voluntary activities was less than 10.0 % in Hungary, Bulgaria, Romania, Cyprus and Malta — note that all five of these EU Member States also reported participation rates that were less than 10.0 % for formal voluntary activities.
Although the participation rate for informal voluntary activities in the EU-28 was only slightly higher (20.7 %) than the rate for formal activities (18.0 %) in 2015, there were several EU Member States where much higher shares of the adult population participated in informal voluntary activities. This was particularly the case in Poland, the Netherlands, Finland, Sweden and Latvia, where the participation rate for informal activities was more than 20 percentage points higher than that recorded for formal activities; this pattern was repeated in Iceland. By contrast, the share of the adult population in Germany that participated in formal voluntary activities was 17.1 percentage points higher than the participation rate for informal voluntary activities.

5 Social participation and integration
Living conditions in Europe — 2018 edition120
Figure 5.8: Participation rates for formal voluntary activities by educational attainment, 2015(%)
0
10
20
30
40
50
60
70
EU-2
8 (1)
Luxe
mbo
urg
Germ
any
Net
herla
nds
Aust
riaD
enm
ark
Swed
enFi
nlan
dFr
ance
Belg
ium
Slov
enia
Irela
nd (2
)Un
ited
King
dom
(2)
Esto
nia
Lith
uani
aPo
land
(2)
Czec
h Re
publ
icIta
lyGr
eece
Spai
nCr
oatia
Port
ugal
Mal
taSl
ovak
iaLa
tvia
Cypr
usHu
ngar
yBu
lgar
iaRo
man
ia
Switz
erla
ndN
orw
ayIc
elan
d
Form
. Yug
. Rep
. of M
aced
onia
Serb
ia
High (ISCED levels 5-8) Medium (ISCED levels 3-4 ) Low (ISCED levels 0-2)
Note: refers to the population aged 16 years and over. Ranked on the overall share of the population who participated in formal voluntary activities.
(1) Estimates.(2) Low reliability.
Source: Eurostat (online data code: ilc_scp19)
Figure 5.8 and Figure 5.9 provide more detailed information in relation to participation rates for volunteering with an analysis by educational attainment. The former shows that in 2015 more than a quarter (26.2 %) of the EU-28 adult population with a high level of educational attainment participated in formal voluntary activities. This could be contrasted with the much lower share (10.6 %) for adults with a low level of educational attainment.
A similar picture existed for participation in informal voluntary activities, insofar as the highest rate (27.3 %) was recorded for the EU-28 adult population with a high level of
educational attainment, while the lowest rate (13.5 %) was recorded for people with a low level of educational attainment.
In 2015, the highest participation rates for both formal and informal voluntary activities across each of the EU Member States were systematically recorded among people with a high level of educational attainment. Note that in Switzerland, those people with a medium level of educational attainment had a slightly higher participation rate (49.7 %) for informal voluntary activities than people with a high level of educational attainment (48.4 %).

5Social participation and integration
Living conditions in Europe — 2018 edition 121
Figure 5.9: Participation rates for informal voluntary activities by educational attainment, 2015(%)
0
10
20
30
40
50
60
70
EU-2
8 (1)
Net
herla
nds
Finl
and
Pola
nd (2
)Sw
eden
Slov
enia
Den
mar
kLu
xem
bour
gLa
tvia
Aust
riaEs
toni
aIre
land
(2)
Fran
ceBe
lgiu
mPo
rtug
alSl
ovak
iaCr
oatia
Czec
h Re
publ
icLi
thua
nia
Gree
ceUn
ited
King
dom
(2)
Germ
any
Italy
Spai
nHu
ngar
yBu
lgar
iaRo
man
iaCy
prus
Mal
ta
Nor
way
Switz
erla
ndIc
elan
d
Form
. Yug
. Rep
. of M
aced
onia
Serb
ia
High (ISCED levels 5-8) Medium (ISCED levels 3-4 ) Low (ISCED levels 0-2)
Note: refers to the population aged 16 years and over. Ranked on the overall share of the population who participated in informal voluntary activities.
(1) Estimates.(2) Low reliability.
Source: Eurostat (online data code: ilc_scp19)
An analysis of participation rates for formal voluntary activities in 2015 between people with a high and a low level of educational attainment reveals that the largest gaps in participation were recorded in Austria, Luxembourg and Lithuania. A similar analysis
for informal voluntary activities reveals that the largest gaps in participation between people with a high and a low level of educational attainment were recorded in Poland, Latvia and the Netherlands.
Just over one fifth of the EU‑28 adult population had no time to participate in volunteering
In 2015, 22.4 % of EU-28 adults aged 16 and over stated that they did not have sufficient free time to participate in formal voluntary activities. A slightly lower proportion (21.3 %) of adults responded that they did not have enough time to participate in informal voluntary activities.
The share of the adult population that did not participate in volunteering due to a lack of time rose together with educational attainment levels and with income levels. By contrast, the share of the population that did not participate in volunteering because they had no interest was higher among those people with a lower level of educational attainment and a lower level of income.

5 Social participation and integration
Living conditions in Europe — 2018 edition122
Figure 5.10: Principal reasons for non‑participation in volunteering by socio‑economic characteristic, EU‑28, 2015(% of total population)
0
25
50
75
100
Mal
e
Fem
ale
16-2
4
25-6
4
65-7
4
75 a
nd o
ver
Low
Med
ium
High
Firs
t qui
ntile
Seco
nd q
uint
ile
Third
qui
ntile
Four
th q
uint
ile
Fifth
qui
ntile
Citie
s
Tow
ns a
nd su
burb
s
Rura
l are
as
Sex Age (years) Education Income Degree ofurbanisation
Formal voluntary activities
0
25
50
75
100
Mal
e
Fem
ale
16-2
4
25-6
4
65-7
4
75 a
nd o
ver
Low
Med
ium
High
Firs
t qui
ntile
Seco
nd q
uint
ile
Third
qui
ntile
Four
th q
uint
ile
Fifth
qui
ntile
Citie
s
Tow
ns a
nd su
burb
s
Rura
l are
as
Sex Age (years) Education Income Degree ofurbanisation
Informal voluntary activities
No interest Lack of time Other reason Did participate Non-response
Note: refers to the population aged 16 years and over (except for analysis by age). Estimates.
Source: Eurostat (online data codes: ilc_scp21 and ilc_scp22)
5.2 Social networksAs noted in the introduction, policymakers are increasingly concerned with finding ways to encourage social participation and integration, especially among marginalised groups. This section provides information in relation to the support networks and other social contacts of European citizens.
HAVING SOMEONE FOR HELP OR TO DISCUSS PERSONAL MATTERS
In 2015, 5.9 % of the EU-28 population did not have any relative, friend or neighbour who they could ask for help. Men, elderly people, people with a low level of educational attainment, people with low incomes and people living in urban areas

5Social participation and integration
Living conditions in Europe — 2018 edition 123
Figure 5.11: Share of people not having someone to ask for help by socio‑economic characteristic, EU‑28, 2015(%)
0 2 4 6 8
10 12
Mal
e
Fem
ale
16-2
4
25-6
4
65-7
4
75 a
nd o
ver
Low
Med
ium
High
Firs
t qui
ntile
Seco
nd q
uint
ile
Third
qui
ntile
Four
th q
uint
ile
Fifth
qui
ntile
Citie
s
Tow
ns a
nd su
burb
s
Rura
l are
as
Sex Age (years) Education Income Degree ofurbanisation
Note: refers to the population aged 16 years and over (except for analysis by age). Estimates.
Source: Eurostat (online data codes: ilc_scp15 and ilc_scp16)
Figure 5.12: Share of people not having someone with whom to discuss personal matters by socio‑economic characteristic, EU‑28, 2015(%)
0 1 2 3 4 5 6 7 8 9
10
Mal
e
Fem
ale
16-2
4
25-6
4
65-7
4
75 a
nd o
ver
Low
Med
ium
High
Firs
t qui
ntile
Seco
nd q
uint
ile
Third
qui
ntile
Four
th q
uint
ile
Fifth
qui
ntile
Citie
s
Tow
ns a
nd su
burb
s
Rura
l are
as
Sex Age (years) Education Income Degree ofurbanisation
Note: refers to the population aged 16 years and over (except for analysis by age). Estimates.
Source: Eurostat (online data codes: ilc_scp17 and ilc_scp18)
were more likely not to have someone to ask for help (see Figure 5.11).
In 2015, some 6.0 % of the EU-28 adult population did not have someone with whom to discuss personal matters. Once
again, men, elderly people, people with a low level of educational attainment, people with low incomes and people living in urban areas were more likely not to have someone with whom to discuss personal matters (see Figure 5.12).

5 Social participation and integration
Living conditions in Europe — 2018 edition124
Figure 5.13: Share of people not having someone to ask for help by educational attainment, 2015(%)
0
5
10
15
20
EU-2
8 (1)
Italy
Luxe
mbo
urg
Port
ugal
Net
herla
nds
Latv
iaBe
lgiu
mEs
toni
aFr
ance
Unite
d Ki
ngdo
m (2
)Cr
oatia
Bulg
aria
Den
mar
kRo
man
iaAu
stria
Pola
nd (2
)M
alta
Irela
nd (2
)Gr
eece
Slov
enia
Germ
any
Lith
uani
aSp
ain
Cypr
usHu
ngar
ySw
eden
Slov
akia
Czec
h Re
publ
icFi
nlan
d
Switz
erla
ndIc
elan
dN
orw
ay
Form
. Yug
. Rep
. of M
aced
onia
Serb
ia
High (ISCED levels 5-8)Medium (ISCED levels 3-4 )Low (ISCED levels 0-2)
Note: refers to the population aged 16 years and over. Ranked on the overall share for the total population.
(1) Estimates.(2) Low reliability.
Source: Eurostat (online data code: ilc_scp15)
Almost 1 in 10 Europeans with a low level of educational attainment did not have someone to ask for help
Figure 5.13 presents an analysis of the share of people who did not have someone to ask for help by educational attainment. In 2015, almost 1 in 10 (9.1 %) adults (aged 16 and over) in the EU-28 with a low level of educational attainment found themselves in this position, while corresponding shares for those people with a medium (5.0 %) or high (3.5 %) level of educational attainment were considerably lower.
Among the EU Member States, the share of the adult population in 2015 that did not have someone to ask for help ranged
from highs of 13.2 % in Italy and 12.9 % in Luxembourg — the only Member States to record double-digit shares — down to less than 3.0 % in Hungary, Sweden, Slovakia, the Czech Republic and Finland.
Generally, people with lower levels of educational attainment were more likely not to have someone to ask for help, while people with a high level of educational attainment were least likely not to have someone to ask for help. The United Kingdom was the only EU Member State where this pattern was not followed, as the lowest share of people who did not have someone to ask for help was recorded for people with a medium level of educational attainment.

5Social participation and integration
Living conditions in Europe — 2018 edition 125
Figure 5.14: Share of people not having someone with whom to discuss personal matters by age, 2015(%)
0
5
10
15
20
25
EU-2
8 (1)
Fran
ce (1
)Ita
lyN
ethe
rland
sBe
lgiu
mLa
tvia
Port
ugal
Esto
nia
Luxe
mbo
urg
Mal
taLi
thua
nia
Croa
tiaRo
man
iaBu
lgar
iaPo
land
(1)
Unite
d Ki
ngdo
m (1
)Fi
nlan
dSw
eden
Irela
nd (1
)D
enm
ark
Germ
any
Gree
ceAu
stria
Slov
enia
Czec
h Re
publ
icHu
ngar
ySp
ain
Slov
akia
Cypr
us
Switz
erla
ndIc
elan
dN
orw
ay
Form
. Yug
. Rep
. of M
aced
onia
Serb
ia
75 years and over 16-24 years
Note: refers to the population aged 16 years and over. Ranked on the overall share for the total population.
(1) Low reliability.
Source: Eurostat (online data code: ilc_scp17)
Almost 1 in 10 elderly Europeans aged 75 and over did not have someone with whom to discuss personal matters
In 2015, 6.0 % of the EU-28 adult population did not have someone with whom to discuss personal matters. There were quite large differences between the generations.
The share of the EU-28 population aged 75 and over that did not have someone with whom to discuss personal matters rose to 9.2 % in 2015; this could be contrasted with a 2.7 % share among people aged 16-24 years. In 10 of the EU Member States, the share of people aged 75 and over that did not have someone with whom to discuss personal matters rose into double-digits; the highest
shares were recorded in the Netherlands (14.0 %), Italy (14.2 %) and particularly France (20.6 %).
France also recorded the largest inter-generational difference: as the share of its population aged 75 and over that did not have someone with whom to discuss personal matters was 17.4 percentage points higher than the corresponding share recorded among young adults (16-24 years). There were also considerable inter-generational differences (more than 10.0 percentage points between these two subpopulations) in the three Baltic Member States, the Netherlands and Finland.

5 Social participation and integration
Living conditions in Europe — 2018 edition126
Figure 5.15: Share of people not having someone with whom to discuss personal matters by income quintile, 2015(%)
0
5
10
15
20
EU-2
8 (1)
Fran
ce (1
)Ita
lyN
ethe
rland
sBe
lgiu
mLa
tvia
Port
ugal
Esto
nia
Luxe
mbo
urg
Mal
taLi
thua
nia
Croa
tiaRo
man
iaBu
lgar
iaPo
land
(1)
Swed
enFi
nlan
dUn
ited
King
dom
(1)
Irela
nd (1
)D
enm
ark
Germ
any
Gree
ceAu
stria
Slov
enia
Czec
h Re
publ
icHu
ngar
ySp
ain
Slov
akia
Cypr
us
Switz
erla
ndIc
elan
dN
orw
ay
Serb
iaFifth quintileFourth quintileThird quintileSecond quintileFirst quintile
Note: refers to the population aged 16 years and over. Ranked on the overall share for the total population.
(1) Low reliability.
Source: Eurostat (online data code: ilc_scp18)
In 2015, the share of the EU-28 adult population not having someone with whom to discuss personal matters peaked at 9.5 % for the first income quintile (the bottom 20 % of the population with the lowest incomes). This share consistently fell as income levels rose and reached a low of 3.7 % among the fifth income quintile (the top 20 % of the population with the highest incomes).
In most of the EU Member States, the highest share of the population not having someone with whom to discuss personal matters was recorded among the bottom income quintile: in 2015, the only exceptions to this pattern were Denmark (where the share of the second income quintile was slightly higher) and Spain (where the first and second income quintiles had identical shares).

5Social participation and integration
Living conditions in Europe — 2018 edition 127
Figure 5.16: People who get together at least once a week with family and relatives or with friends by socio‑economic characteristic, EU‑28, 2015(%)
0 10 20 30 40 50 60 70 80 90
Mal
e
Fem
ale
16-2
4
25-6
4
65-7
4
75 a
nd o
ver
Low
Med
ium
High
Firs
t qui
ntile
Seco
nd q
uint
ile
Third
qui
ntile
Four
th q
uint
ile
Fifth
qui
ntile
Citie
s
Tow
ns a
nd su
burb
s
Rura
l are
as
Sex Age (years) Education Income Degree ofurbanisation
Family and relatives Friends
Note: refers to the population aged 16 years and over (except for analysis by age). Estimates.
Source: Eurostat (online data codes: ilc_scp09 and ilc_scp10)
SOCIAL CONTACT WITH FRIENDS AND FAMILY
Social interactions affect people’s quality of life: the satisfaction that people derive from being with family, friends (or colleagues) impacts on their subjective well-being, and may act as a buffer against the negative effects of stress. This section analyses the frequency with which Europeans get together and communicate with family and friends.
In 2015, more than half (51.9 %) of the EU-28 population aged 16 and over got together at least once a week with family and relatives (in its widest meaning). A similar share (53.2 %) of the EU-28 population got together with friends at least once a week.
These overall figures hide some interesting differences: for example, men in the EU-28 were more likely to get together at least once a week with friends (54.6 % in 2015) than with family and relatives (48.8 %), while a higher proportion of women in the EU-28 got together with family and relatives (54.6 %) compared with friends (51.8 %).
In 2015, more than four fifths (80.6 %) of all young adults (aged 16-24 years) in the EU-28 got together with friends at least once a week; this share was considerably higher than for any other age group. By contrast, some 56.1 % of elderly people aged 75 and over got together at least once a week with family and relatives; this was the highest share among any of the age groups shown in Figure 5.16.

5 Social participation and integration
Living conditions in Europe — 2018 edition128
Figure 5.17: People who have contact at least once a week with family and relatives or with friends by socio‑economic characteristic, EU‑28, 2015(%)
0 10 20 30 40 50 60 70 80 90
Mal
e
Fem
ale
16-2
4
25-6
4
65-7
4
75 a
nd o
ver
Low
Med
ium
High
Firs
t qui
ntile
Seco
nd q
uint
ile
Third
qui
ntile
Four
th q
uint
ile
Fifth
qui
ntile
Citie
s
Tow
ns a
nd su
burb
s
Rura
l are
as
Sex Age (years) Education Income Degree ofurbanisation
Family and relatives Friends
Note: refers to the population aged 16 years and over (except for analysis by age). Estimates.
Source: Eurostat (online data codes: ilc_scp11 and ilc_scp12)
The frequency with which a respondent is usually in contact with family and relatives or with friends relates to any form of contact made by telephone, SMS, the Internet (e-mail, Skype, Facebook, FaceTime or other social networks and communication tools), letter or fax; note that the information presented should be based on a ‘conversation’ and therefore excludes sharing and viewing information on social media if there is no other form of interaction.
In 2015, just over two thirds of the EU-28 adult population had contact at least once a week with their family and relatives (68.7 %), the corresponding share for people having contact at least once a week with their friends was slightly lower (63.8 %). Almost three quarters (73.2 %) of women had contact at least once a week with family and relatives, which was 9.6 percentage points higher than the corresponding share for men (63.6 %). The gap between the sexes was much smaller when
considering contact at least once a week with friends — 65.0 % for women, compared with 62.3 % for men.
In 2015, the share of the EU-28 adult population that had contact at least once a week with their family and relatives or with their friends was higher among those subpopulations with higher levels of educational attainment or income and those people who were living in cities.
However, there was much more variation when analysing the results by age, as the share of young adults (aged 16-24 years) in the EU-28 who had contact at least once a week with their friends reached almost 9 out 10 (89.5 %) and then fell rapidly for older age groups; by contrast, the share of the EU-28 population who had contact at least once a week with their family or relatives was relatively constant across the different age groups (see Figure 5.17).

5Social participation and integration
Living conditions in Europe — 2018 edition 129
Figure 5.18: Distribution of the frequency with which people get together with family and relatives, 2015(%)
0 10 20 30 40 50 60 70 80 90
EU-2
8 (1)
Belg
ium
Net
herla
nds
Finl
and
Italy
Unite
d Ki
ngdo
m (2
)Sp
ain
Mal
taPo
rtug
alSw
eden
Irela
nd (2
)Lu
xem
bour
gAu
stria
Czec
h Re
publ
icSl
oven
iaFr
ance
Gree
ceCy
prus
Hung
ary
Germ
any
Slov
akia
Den
mar
kCr
oatia
Rom
ania
Esto
nia
Latv
iaLi
thua
nia
Bulg
aria
Pola
nd (2
)
Nor
way
Icel
and
Switz
erla
nd
Form
. Yug
. Rep
. of M
aced
onia
Serb
ia
Less than every day but at least once every week
Every day
Less than once a week but at least once a month
Less than once a month
Note: refers to the population aged 16 years and over. Ranked on the share of less than every day but at least once every week.
(1) Estimates.(2) Low reliability.
Source: Eurostat (online data code: ilc_scp09)
1 in 6 adults in the EU‑28 got together with family and relatives every day …
On average, most people in the EU-28 got together with their family and relatives on a fairly regular basis. In 2015, more than one third (35.2 %) of the EU-28 adult population met up with their family and relatives at least once a week (excluding every day), while a slightly lower share (33.1 %) met up with their family and relatives less than once a week but at least once a month.
In 2015, one sixth (16.7 %) of the EU-28 adult population reported that they got together with family and relatives every day; note that the figures exclude those family members and relatives who share the same dwelling. Among the EU Member States, the share of the adult population getting together with
family and relatives every day rose to around one third in Portugal, Malta, Greece and Slovakia and peaked at 45.4 % in Cyprus; note a much higher share was recorded in the former Yugoslav Republic of Macedonia (85.8 %).
At the other end of the range, some 15.1 % of the EU-28 adult population in 2015 reported getting together with family and relatives less than once a month (including not at all); these figures may be influenced by the considerable distances that divide some families, as an increasing share of the EU-28 population relocates for work or retirement. More than one fifth of the adult populations of the three Baltic Member States and Luxembourg got together less than once a month with their family and relatives, the highest share being recorded in Latvia (24.8 %).

5 Social participation and integration
Living conditions in Europe — 2018 edition130
Figure 5.19: Distribution of the frequency with which people get together with friends, 2015(%)
0 10 20 30 40 50 60 70 80 90
EU-2
8 (1)
Belg
ium
Esto
nia
Latv
iaSw
eden
Aust
riaFi
nlan
dN
ethe
rland
sIta
lyIre
land
(2)
Slov
enia
Unite
d Ki
ngdo
m (2
)Lu
xem
bour
gFr
ance
Gree
ceCr
oatia
Cypr
usD
enm
ark
Czec
h Re
publ
icHu
ngar
yLi
thua
nia
Spai
nSl
ovak
iaGe
rman
yBu
lgar
iaRo
man
iaPo
rtug
alPo
land
(2)
Mal
ta
Switz
erla
ndIc
elan
dN
orw
ay
Serb
iaFo
rm. Y
ug. R
ep. o
f Mac
edon
ia
Less than every day but at least once every week
Every day
Less than once a week but at least once a month
Less than once a month
Note: refers to the population aged 16 years and over. Ranked on the share of less than every day but at least once every week.
(1) Estimates.(2) Low reliability.
Source: Eurostat (online data code: ilc_scp11)
… while more than one quarter of the adult population in the EU‑28 got together with friends on a daily basis
Figure 5.19 shows a similar set of information relating to the frequency with which people in the EU-28 got together with their friends. In 2015, more than one third (36.8 %) of the EU-28 adult population reported getting together with friends at least once every week (but not every day), while similar shares met friends every day (26.9 %) or less than once a week but at least once a month (26.8 %); as such, less than one tenth (9.4 %) of EU-28 adult population got together with their friends less than once a month (or not at all).
In 2015, Cyprus, Greece and Spain had the highest shares of their adult populations getting together with their friends on a daily basis; each reported a share that was higher than two fifths, with a peaked of 48.4 % in Cyprus. These shares were synonymous with a more general pattern, insofar as most of the southern EU Member States recorded relatively high shares of their adult populations having daily contact with friends (Italy was the main exception), whereas much lower shares of the adult populations in most eastern and Baltic Member States got together on a daily basis with their friends, with a low of 9.7 % recorded in Poland.

5Social participation and integration
Living conditions in Europe — 2018 edition 131
Figure 5.20: Share of people communicating daily via social media by socio‑economic characteristic, EU‑28, 2015(%)
0 10 20 30 40 50 60 70
Mal
e
Fem
ale
16-2
4
25-6
4
65-7
4
75 a
nd o
ver
Low
Med
ium
High
Firs
t qui
ntile
Seco
nd q
uint
ile
Third
qui
ntile
Four
th q
uint
ile
Fifth
qui
ntile
Citie
s
Tow
ns a
nd su
burb
s
Rura
l are
as
Sex Age (years) Education Income Degree ofurbanisation
Note: refers to the population aged 16 years and over (except for analysis by age). Estimates.
Source: Eurostat (online data codes: ilc_scp13 and ilc_scp14)
COMMUNICATION VIA SOCIAL MEDIA
Within the framework of the EU-SILC 2015 ad-hoc module on social and cultural participation and material deprivation, respondents were asked about the frequency with which they communicated via social media (including community-based websites, online discussions forums, chat rooms and other social media spaces — for example, Facebook, LinkedIn or Twitter).
Approximately half of the EU‑28 adult population had not communicated via social media during the previous 12 months
In 2015, just over half (50.5 %) of the EU-28 adult population reported that they had not communicated via social media during the
previous 12 months. By contrast, the second most popular response was recorded for those respondents who communicated using social media on a daily basis (26.2 %).
This contrasting situation may be largely explained by the age of respondents: as almost two thirds (66.4 %) of young adults (16-24 years) used social media on a daily basis, compared with just 6.8 % of the population aged 65-74 years and 2.2 % of the population aged 75 and over (see Figure 5.20).
Aside from young adults, it was also the case that across the EU-28 in 2015, women, people with a high level of educational attainment or income, and people living in cities were more likely to communicate on a daily basis through social media.
Table 5.3 provides more detail in relation to the share of the adult population (aged 16 and over) that was communicating via social media in 2015. The share that used social media on a daily basis was higher than 40.0 % in Cyprus, Denmark, Sweden, Ireland
and Malta (where a peak of 42.6 % was recorded). By contrast, close to three fifths of the adult population in Italy (59.6 %) and Croatia (63.3 %) had not communicated via social media during the 12 months prior to the survey.

5 Social participation and integration
Living conditions in Europe — 2018 edition132
Table 5.3: Share of people communicating via social media by age and by frequency, 2015(%)
Total population (aged 16 years and over) 16-24 years 75 years and over
Every day Not in the last 12 months Every day Not in the last
12 months Every day Not in the last 12 months
EU-28 26.2 50.5 66.4 9.6 2.2 92.4 Belgium 35.2 46.4 79.2 7.4 2.8 92.0 Bulgaria 30.7 52.5 68.9 20.9 0.6 97.3 Czech Republic 22.8 48.2 68.2 7.1 1.7 92.9 Denmark 40.7 29.6 82.2 1.9 7.3 80.0 Germany 23.2 48.6 60.3 9.3 4.1 82.0 Estonia 27.4 57.2 76.5 7.1 0.8 97.7 Ireland (1) 41.8 40.0 87.3 4.4 5.2 88.6 Greece 28.8 52.9 78.8 9.5 0.4 98.7 Spain 30.9 51.1 75.7 8.7 1.5 97.3 France 20.2 56.6 61.4 10.3 1.6 95.5 Croatia 24.8 63.3 76.8 9.5 0.4 99.0 Italy 23.8 59.6 68.6 13.3 0.7 98.5 Cyprus 40.6 47.1 83.5 6.8 1.1 97.3 Latvia 19.5 46.7 56.3 6.4 0.5 97.0 Lithuania 18.6 53.2 64.4 6.7 0.0 97.9 Luxembourg 36.9 43.5 81.9 3.3 2.1 94.8 Hungary 24.0 46.5 63.9 10.4 1.3 94.5 Malta 42.6 43.6 85.0 7.2 4.4 92.5 Netherlands 39.2 38.6 71.2 8.0 4.9 88.5 Austria 32.8 49.1 77.8 7.0 2.0 94.7 Poland (1) 17.6 51.6 56.2 6.1 0.5 96.2 Portugal 24.8 53.7 73.2 8.4 1.0 96.2 Romania 17.3 50.7 43.0 21.4 1.3 85.8 Slovenia 21.5 57.9 69.4 8.6 1.0 97.3 Slovakia 31.5 41.8 73.6 7.6 0.6 94.8 Finland 35.5 43.5 73.1 6.2 3.4 91.8 Sweden 41.2 37.6 79.3 4.7 5.2 88.2 United Kingdom (1) 35.1 42.7 76.4 5.8 3.8 90.8 Iceland 34.6 26.1 55.9 5.6 6.4 82.4 Norway 45.5 36.8 79.9 8.8 5.5 89.5 Switzerland 24.0 50.5 55.5 11.6 1.4 92.4 Former Yugoslav Republic of Macedonia 37.7 46.8 78.3 12.0 1.2 97.7
Serbia 21.5 61.4 70.9 10.7 0.3 98.7 (1) Low reliability.
Source: Eurostat (online data code: ilc_scp13)
A closer analysis of those people not communicating via social media during the 12 months prior to the survey in 2015 reveals a peak among young adults (16-24 years) in Bulgaria and Romania, where more than a fifth of this subpopulation had not used social media,
while Italy (13.3 %), Hungary (10.4 %) and France (10.3 %) were the only other EU Member States where more than one tenth of all young adults had not communicated via social media during the previous 12 month period.

Annex

Annex
Living conditions in Europe — 2018 edition134
Methodological notes
EU STATISTICS ON INCOME AND LIVING CONDITIONS
EU statistics on income and living conditions, abbreviated as EU-SILC, is the European reference source for comparative statistics on income distribution and social inclusion in the European Union (EU).
EU-SILC is carried out on an annual basis and is used to analyse both monetary (income) and non-monetary poverty and social exclusion (examples of the latter include information on material deprivation or social participation). EU-SILC is also used for monitoring progress towards the Europe 2020 headline target for poverty reduction, namely to reduce the number of people at risk of poverty or social exclusion by 20 million.
EU-SILC was launched in 2003 in seven countries under a gentlemen’s agreement. Later, it was gradually expanded to cover all EU Member States. From 2010 onwards, EU-SILC has been implemented across a total of 32 countries, the 28 EU Member States, Iceland, Norway, Switzerland and Turkey. EU-SILC provides two types of annual data: cross sectional data (in other words, data pertaining to a specific time period) and longitudinal data, which are related to level changes over time, observed over a four-year timeframe.
The cross-sectional components of the EU-SILC survey are conducted across approximately 130 000 households and 270 000 individuals aged 16 and over, while the longitudinal components are based on a survey of approximately 100 000 households and 200 000 individuals.
The survey’s reference population is all private households and their current members residing in the territory of an EU Member State at the time of data collection; the target population does not include persons living in collective households and in institutions. EU-SILC, although not relying
on a common questionnaire, is based on the idea of a common ‘framework’. The latter defines the harmonised lists of target primary (annual) and secondary (every four years or less frequently) variables to be transmitted to Eurostat. The variables are compiled based on common guidelines and procedures, common concepts (household and income) and classifications aiming to safeguard the comparability of the information produced.
The secondary variables collected under the 2015 ad-hoc module of EU-SILC complement the variables permanently collected in EU-SILC with information highlighting social and cultural participation and material deprivation.
NATIONAL ACCOUNTS
National accounts data have been used in this publication to provide information in relation to household consumption expenditure on goods and services; this information has been used to provide an analysis of expenditure on housing and health, following the classification of individual consumption by purpose (COICOP).
Note that in the previous edition of this publication data on household consumption expenditure was derived from household budget surveys (HBS). These are only conducted every five years in the EU and therefore were, at the time of writing, unable to provide fresh data for the 2015 reference period (the data were still being processed). As such, a decision was taken to make use of national accounts data in order to provide a more timely data set.
The final consumption expenditure of households encompasses all domestic costs (by residents and non-residents) for individual needs. Consumption is a key indicator of citizens’ well-being, with housing, energy, transport and food accounting for about half of total household expenditure.

Annex
Living conditions in Europe — 2018 edition 135
Glossary
ABILITY TO ASK FOR HELP
The ability of an individual to be able to ask for help measures the respondent’s possibility to ask for any kind of help, moral, material or financial, from family and relatives, or friends (including neighbours); both relatives and friends should be understood in their widest meaning.
ABILITY TO DISCUSS PERSONAL MATTERS
The ability of an individual to be able to discuss personal matters is defined as the presence of at least one person the respondent can discuss personal matters with (whether the respondent needs to or not). The person can be a fellow household member, a family member or relative, a friend, or an acquaintance.
ABILITY TO MAKE ENDS MEET
The ability to make ends meet is a subjective non-monetary indicator that assesses the respondents’ feeling about the level of difficulty experienced by the household in making ends meet, in other words, paying for its usual and necessary expenses (including housing-related costs). The indicator is defined on the basis of a set of values according to the level of difficulty in making ends meet: with great difficulty, with difficulty, with some difficulty, fairly easily, easily and very easily.
AT-RISK-OF-POVERTY RATE ANCHORED AT A FIXED MOMENT IN TIME
The at-risk-of-poverty rate anchored at a fixed moment in time is the share of people with an equivalised disposable income in a given year below the risk of poverty threshold in the year 2008, adjusted for inflation.
AT-RISK-OF-POVERTY RATE AFTER SOCIAL TRANSFERS
The at-risk-of-poverty rate is the share of people with an equivalised disposable income (after social transfer) below the at-risk-of-poverty threshold, which is set at 60 % of the national median equivalised disposable income after social transfers.
This indicator does not measure wealth or poverty, but low income in comparison to other residents in the same country, which does not necessarily imply a low standard of living.
AT-RISK-OF-POVERTY RATE BEFORE SOCIAL TRANSFERS
The at-risk-of-poverty rate before social transfers is calculated as the share of people having an equivalised disposable income before social transfers that is below the at-risk-of- poverty threshold calculated after social transfers. Pensions, such as old-age and survivors’ (widows’ and widowers’) benefits, are counted as income (before social transfers) and not as social transfers. This indicator examines the hypothetical non-existence of social transfers.
AT RISK OF POVERTY OR SOCIAL EXCLUSION
At risk of poverty or social exclusion (AROPE) refers to the situation of people who are either at risk of poverty and/or severely materially deprived and/or living in a household with a very low work intensity. This is a headline indicator used to monitor the Europe 2020 strategy poverty target of reducing the number of people at risk of poverty or social exclusion by 20 million.

Annex
Living conditions in Europe — 2018 edition136
CLASSIFICATION OF INDIVIDUAL CONSUMPTION BY PURPOSE
The classification of individual consumption by purpose (COICOP) is a nomenclature developed by the United Nations Statistics Division to classify and analyse individual consumption expenditures incurred by households, non-profit institutions serving households and general government. It includes expenditure categories such as housing, water, electricity, and gas and other fuels or health.
COMMUNICATION VIA SOCIAL MEDIA
Communication via social media is defined in relation to the frequency with which respondents actively participate on social networking sites, such as community-based websites, online discussions forums, chat rooms and other social media spaces — for example, Facebook, LinkedIn or Twitter.
Active participation means not only joining social networks but also contributing to discussions (for example, posting messages or photos, or ‘likes’, are all included).
CONTACT WITH FRIENDS OR FAMILY
This indicator is based on the frequency with which respondents are usually in contact with their family and relatives or friends during the year. Contact can be made by telephone, SMS, the Internet (e-mail, Skype, Facebook, FaceTime or other social networks and communication tools), letter or fax; note that the information presented should be based on a ‘conversation’ and therefore excludes sharing and viewing on social media if there is no other form of interaction. The indicator refers only to family and relatives or friends who do not live in the same household as the respondent.
DEGREE OF URBANISATION
The degree of urbanisation is a classification that indicates the character of an area based on the share of local population living in urban clusters and in urban centres, it classifies local administrative units level 2 (LAU 2 or communes) into three types of area: (1) rural areas (thinly-populated areas), (2) towns and suburbs (intermediate density areas), (3) cities (densely-populated areas).
The classification is based on the 2011 population grid and 2014 LAU boundaries.
DEPENDENT CHILDREN
Dependent children include all children up to the age of 14 plus those persons aged 15-24 years who are economically inactive (therefore mainly in education) and who are living with at least one of their parents.
DWELLING
A dwelling is a room or suite of rooms — including its accessories, lobbies and corridors — in a permanent building or a structurally separated part of a building which, by the way it has been built, rebuilt or converted, is designed for habitation by one private household all year round. A dwelling can be either a one-family dwelling in a stand-alone building or detached edifice, or an apartment in a block of flats; dwellings include garages for residential use. In EU-SILC the following types of dwelling are identified:
• house: no internal space or maintenance and other services are normally shared with other dwellings; sharing of a garden or other exterior areas is not precluded.
• flats or apartments: a building normally sharing some internal space or maintenance and other services with other units.
• detached: a dwelling that has no common walls with another.

Annex
Living conditions in Europe — 2018 edition 137
• semi-detached: refers to two dwellings that share at least one wall; ‘terraced’ refers to a row of (more than two) dwellings that are joined together.
• other kinds of accommodation: include those situated in buildings that are (primarily) used for other uses than housing (for example, schools) and fixed habitations like huts or a cave.
EMPLOYEE WITH A TEMPORARY CONTRACT
An employee with a temporary contract is an employee whose main job will terminate either after a period fixed in advance, or after a period not known in advance, but nevertheless defined by objective criteria, such as the completion of an assignment or the period of absence of an employee who is temporarily being replaced.
EQUIVALISED DISPOSABLE INCOME
The equivalised disposable income is the total income of a household, after tax and other deductions, that is available for spending or saving, divided by the number of household members converted into equalised adults; household members are equalised or made equivalent by weighting each person according to their age, using the so-called modified OECD equivalence scale. The equivalised disposable income is calculated in three steps:
• all monetary incomes received from any source by each member of a household are added up; these include income from work, investment and social benefits, plus any other household income; taxes and social contributions that have been paid, are deducted from this sum.
• in order to reflect differences in a household’s size and composition, total (net) household income is divided by the number of ‘equivalent adults’, using a standard (equivalence) scale
— the modified OECD scale; this scale gives a weight to all members of the household (and then adds these up to arrive at the equivalised household size) — 1.0 to the first adult; 0.5 to the second and each subsequent person aged 14 and over; 0.3 to each child aged under 14.
• finally, the resulting figure is called the equivalised disposable income and is attributed equally to each member of the household.
For poverty indicators, the equivalised disposable income is calculated from the total disposable income of each household divided by the equivalised household size. The income reference period is a fixed 12-month period (such as the previous calendar or tax year) for all countries except the United Kingdom (for which the income reference period is the current year) and Ireland (for which the survey is continuous and income is collected for the last 12 months).
EUROPEAN UNION
The European Union (EU) is an economic and political union of 28 European countries. The EU was established on 1 November 1993 with 12 Member States by the Treaty on European Union (Maastricht Treaty). The number of countries has grown to the present 28 through a series of enlargements: on 31 December 1994, the EU had 12 Member States (EU-12): Belgium, Denmark, Germany, Ireland, Greece, Spain, France, Italy, Luxembourg, the Netherlands, Portugal and the United Kingdom. From January 1995, there were three additional EU Member States (EU-15): Austria, Finland and Sweden. In May 2004, 10 more countries joined (EU-25): Cyprus, the Czech Republic, Estonia, Hungary, Latvia, Lithuania, Malta, Poland, Slovenia and Slovakia. On 1 January 2007, Bulgaria and Romania also became members (EU-27). On 1 July 2013, Croatia became the 28th EU Member State (EU-28).

Annex
Living conditions in Europe — 2018 edition138
FORMAL CHILDCARE
Formal arrangements for childcare include all kinds of care organised/controlled by public or private structures. Care that is provided directly by childminders without any structure or formal arrangement between the carer and the parents is excluded
Other types of childcare include that provided by professional childminders at the child’s home or at childminder’s home and childcare provided by other household members (outside of the parents), grandparents and other relatives, friends or neighbours.
FORMAL VOLUNTEERING
Formal volunteering refers to those activities organised through an organisation, a formal group or a club; it includes unpaid work for charitable or religious organisations.
GETTING TOGETHER WITH FRIENDS OR FAMILY
The indicator on getting together with family and friends asks respondents about the frequency with which they usually get together with family or friends during a usual year; only relatives or friends who do not live in the respondent’s household should be considered.
GINI COEFFICIENT
A Gini coefficient measures the extent to which the distribution of income within a country deviates from a perfectly equal distribution. A coefficient of 0 expresses perfect equality (where everyone has the same income), while a coefficient of 100 expresses the situation where only one person has all the income.
GROSS DOMESTIC PRODUCT
Gross domestic product (GDP) is a basic measure of a country’s overall economic health.
As an aggregate measure of production, GDP is equal to the sum of the gross value added of all resident institutional units (in other words, industries) engaged in production, plus any taxes, and minus any subsidies, on products not included in the value of their outputs. Gross value added is the difference between output and intermediate consumption. This method for calculating GDP is often referred to as the output approach.
GDP may also be calculated as:
• the expenditure approach: the sum of the final uses of goods and services (all uses except intermediate consumption) measured in purchasers’ prices, minus the value of imports of goods and services;
• the income approach: the sum of primary incomes distributed by resident producer units.
HARMONISED INDEX OF CONSUMER PRICES
The harmonised index of consumer prices (HICP) measures the change over time in the prices of consumer goods and services acquired, used or paid for by households. Consumer price indices aim to cover a complete set of goods and services consumed within a territory, through a representative basket of items (for example, food and beverages, products for personal hygiene, newspapers and periodicals, expenditure on housing, water, electricity, gas and other fuels, health, transport, communications, education, restaurants and hotels).

Annex
Living conditions in Europe — 2018 edition 139
HOUSEHOLD
A household, in the context of surveys on social conditions or income), is defined as a housekeeping unit or, operationally, as a social unit: (a) having common arrangements; (b) sharing household expenses or daily needs; (c) in a shared common residence.
A household includes either one person living alone or a group of people, not necessarily related, living at the same address with common housekeeping, in other words, sharing at least one meal per day or sharing a living or sitting room.
Collective households or institutional households (as opposed to private households) include hospitals, old people’s homes, residential homes, prisons, military barracks, religious institutions, boarding houses and workers’ hostels.
HOUSEHOLD CONSUMPTION EXPENDITURE
The concept of household consumption expenditure, as presented in this publication, is derived from national accounts statistics. It refers to any expenditure that is made by a person living alone or by a group of people living together in shared accommodation with common domestic expenses. It includes expenditure incurred for the direct satisfaction of individual needs and covers the purchase of goods and services, the consumption of own production (such as garden produce) and the imputed rent of owner-occupied dwellings.
Household consumption expenditure is classified by consumption purpose according to the classification of individual consumption by purpose (COICOP), which is composed of the following two-digit categories:
01: food and non-alcoholic beverages;02: alcoholic beverages, tobacco and narcotics;03: clothing and footwear;
04: housing, water, electricity, gas and other fuels;05: furnishings, household equipment and routine household maintenance;06: health;07: transport;08: communication;09: recreation and culture;10: education;11: restaurants and hotels;12: miscellaneous goods and services.
HOUSING COST OVERBURDEN RATE
The housing cost overburden rate is defined as the share of the population living in households where total housing costs (‘net’ of housing allowances) represent more than 40 % of disposable income (‘net’ of housing allowances).
INCOME
Gross income includes income from market sources and cash benefits. The former includes employee cash or near-cash income, non-cash employee income, cash benefits from self-employment, income from the rental of property or land, regular inter-household cash transfers received, interest, dividends, profit from capital investments in unincorporated businesses, income received by people aged under 16 and pensions from individual private plans. Cash benefits are the sum of all unemployment, old-age, survivor’s, sickness and disability benefits; education-related, family/children-related and housing allowances; and benefits for social exclusion or those not elsewhere classified. Direct taxes and regular inter-household cash transfers paid are deducted from gross income to give disposable income.
The definition of total household disposable income, used for calculating EU-SILC indicators, excludes imputed rent, in other words, money that the household saves on full (market) rent by living in its own accommodation or in

Annex
Living conditions in Europe — 2018 edition140
accommodation it rents at a price that is lower than the market rent. The definition of income currently used also excludes non-monetary income components, in particular the value of goods produced for own consumption, social transfers in kind and non-cash employee income except company cars.
The income reference period is a fixed 12-month period (such as the previous calendar or tax year) or a moving 12-month period (such as the 12 months preceding the interview). Note that in the United Kingdom, the income reference period is the current year, whereas in Ireland, the survey is continuous and income information is collected for the last 12 months.
INCOME QUINTILES
Quintiles refer to the position in the frequency distribution. The quintile cut-off value may be obtained by sorting all incomes from lowest to highest, and then choosing the value of income under which 20 % (lower limit), 40 % (second limit), 60 % (third), 80 % (fourth) and 100 % (upper limit) of the population are located.
The first income quintile refers to those persons with a level of income below the lower quintile cut-off (the bottom 20 % of earners), the second income quintile refers to those persons whose income is located between the lower cut-off and the second quintile cut-off, and so on, up to the fifth or final income quintile that refers to the top fifth of the population with the highest incomes (the top 20 % of highest earners).
INCOME QUINTILE SHARE RATIO
The income quintile share ratio (S80/S20 ratio) is a measure used to analyse the inequality of income distribution. It is calculated as the ratio of total income received by the 20 % of the population with the highest income (the top quintile) to that received by the 20 % of the population with the lowest income (the bottom quintile); all incomes are compiled as equivalised disposable incomes.
INFLATION
Inflation is an increase in the general price level of goods and services. When there is inflation in an economy, the value of money decreases because a fixed amount of money will buy fewer goods and services than before.
Deflation is the opposite of inflation. It is a decrease in the general price level of goods and services and represents an increase in the value of money, where a fixed amount of money will buy more goods and services than before.
INFORMAL VOLUNTEERING
Informal volunteering refers to unorganised activities that do not involve an organisation, a formal group or a club (formal volunteering); it includes unpaid work such as:
• helping other people, including family members not living in the same household (for example, cooking for others; taking care of people in hospitals/at home; taking people for a walk or shopping, etc.);
• helping animals (for example, taking care of homeless or wild animals);
• other informal voluntary activities (for example, cleaning a beach or a forest).
INTERNATIONAL STANDARD CLASSIFICATION OF EDUCATION
The international standard classification of education (ISCED) is an instrument for compiling internationally comparable education statistics. ISCED 2011 was implemented by Eurostat for all data collections from 2014.
There are eight levels of education in ISCED 2011.ISCED 0: early childhood education;ISCED 1: primary education;ISCED 2: lower secondary education;ISCED 3: upper secondary education;ISCED 4: post-secondary non-tertiary education;ISCED 5: short-cycle tertiary education;ISCED 6: bachelor’s or equivalent level;

Annex
Living conditions in Europe — 2018 edition 141
ISCED 7: master’s or equivalent level;ISCED 8: doctoral or equivalent level.
IN-WORK AT-RISK-OF-POVERTY RATE
The in-work at-risk-of-poverty rate is defined as the share of employed persons aged 18 and over with an equivalised disposable income below the risk-of-poverty threshold, which is set at 60 % of the national median equivalised disposable income (after social transfers).
MATERIAL DEPRIVATION
Material deprivation refers to a state of economic strain and durables, defined as the enforced inability to afford a range of items considered by most people to be desirable or even necessary to lead an adequate quality of life. The indicator distinguishes between individuals who cannot afford a certain good or service, and those who do not have this good or service for another reason, for example, because they do not want or do not need it.
The material deprivation indicator measures the proportion of the population that cannot afford at least three of the following nine items: 1. to pay their rent, mortgage or utility bills; 2. to keep their home adequately warm; 3. to face unexpected expenses; 4. to eat a meal involving meat, fish or a vegetarian equivalent every second day; 5. to go on holiday for one week; 6. to purchase a television set; 7. to purchase a washing machine; 8. to purchase a car; 9. to purchase a telephone.
The severe material deprivation rate is defined as the enforced inability to pay for at least four of the above-mentioned items.
OVERCROWDING RATE
The overcrowding rate is defined as the share of the population living in an overcrowded household. A person is considered to be living in an overcrowded household if the household
does not have at its disposal a minimum number of rooms equal to:
• one room for the household;• one room per couple in the household;• one room for each single person aged 18 and
over;• one room per pair of single people of the same
gender between 12 and 17 years of age;• one room for each single person between 12
and 17 years of age and not included in the previous category;
• one room per pair of children under 12 years of age.
PERSISTENT AT-RISK-OF-POVERTY RATE
The persistent at-risk-of-poverty rate shows the share of the population living in households where the equivalised disposable income was below the at-risk-of-poverty threshold for the current year and at least two out of the preceding three years. Its calculation requires a longitudinal survey instrument, under which the individual respondents are followed during a four-year period.
PURCHASING POWER PARITIES AND PURCHASING POWER STANDARDS
Purchasing power parities (PPPs) are indicators of price level differences across countries. They provide information as to how many currency units a given quantity of goods and services costs in different countries. PPPs can therefore be used as currency conversion rates to convert expenditures expressed in national currencies into an artificial common currency (the purchasing power standard (PPS)), thereby eliminating the effect of price level differences across countries. PPPs make it possible to produce meaningful volume or price level indicators required for cross-country comparisons, truly reflecting the differences in the purchasing power, for example, of households.

Annex
Living conditions in Europe — 2018 edition142
Purchasing power parities are obtained by comparing price levels for a basket of comparable goods and services that are selected to be representative of consumption patterns in the various countries.
REAL TERMS
Real values/real terms are monetary values that are adjusted or deflated for changes in prices; they are typically used for financial and income flows.
SELF-PERCEIVED HEALTH
Self-perceived health is based on the respondent’s own assessment of their general health status; this is a subjective measure with the following responses — very good, good, fair, bad and very bad.
SELF-REPORTED UNMET MEDICAL AND DENTAL NEEDS
Self-reported unmet needs refer to the respondent’s own assessment of whether they need medical or dental care. Medical care refers to individual healthcare services (a medical examination or treatment) provided by or under direct supervision of medical doctors or equivalent professions according to national healthcare systems. Dental care refers to individual healthcare services provided by or under direct supervision of stomatologists (dentists). Healthcare provided by orthodontists is included.
SOCIAL BENEFITS
Social benefits other than social transfers in kind are transfers made in cash to households to relieve them of the financial burden of certain risks or needs — for example, pensions, family and child allowances, and disabled persons’ allowances.
SOCIAL PROTECTION
Social protection can be defined as the coverage of precisely defined risks and needs associated with sickness/healthcare and invalidity; disability; old-age; parental responsibilities; the loss of a spouse or parent; unemployment; housing; social exclusion.
SOCIAL TRANSFERS
Social transfers cover the social help given by central, state or local institutional units. They include: old-age (retirement) and survivors’ (widows’ and widowers’) pensions; unemployment benefits; family-related benefits; sickness and invalidity benefits; education- related benefits; housing allowances; social assistance; other benefits.
WORK INTENSITY
The work intensity of a household is the ratio of the total number of months that all working-age household members have worked during the income reference year and the total number of months the same household members theoretically could have worked in the same period.
For this indicator, a working-age person is a defined as someone aged 18-59 years, with the exclusion of students in the age group between 18 and 24 years. Households composed only of children, of students aged less than 25 and/or people aged 60 and over are excluded from the indicator calculation.
People living in households with very low work intensity are defined as the number of persons living in a household having work intensity that was no more than a threshold set at 0.20.

Annex
Living conditions in Europe — 2018 edition 143
Abbreviations and symbols
STATISTICAL SYMBOLS
: not available– not applicable% per cent
ACRONYMS AND ABBREVIATIONS
AROPE At risk of poverty or social exclusionCOICOP classification of individual consumption
by purposeEUR euroEU-SILC EU statistics on income and living
conditionsGDP gross domestic productHICP harmonised index of consumer pricesISCED international standard classification of
educationOECD Organisation for Economic Cooperation
and DevelopmentPPS purchasing power standard
GEOGRAPHICAL AGGREGATES
EU European UnionEU-28 European Union of 28 Member States
from 1 July 2013EU-27 European Union of 27 Member States
from 1 January 2007
CURRENCY CODES
BGN Bulgaria — levCZK Czech Republic — korunaDKK Denmark — kroneGBP United Kingdom — pound sterlingHRK Croatia — kunaHUF Hungary — forintLVL Latvia — latsLTL Lithuania — litasPLN Poland — zlotyRON Romania — leuSEK Sweden — krona
CHF Switzerland — franc/Franken/francoISK Iceland — kronaNOK Norway — krone
MKD the former Yugoslav Republic of Macedonia — denar
RSD Serbia — dinarTRY Turkey — lira


Getting in touch with the EU
In personAll over the European Union there are hundreds of Europe Direct Information Centres. You can find the address of the centre nearest you at: https://europa.eu/european-union/contact_en
On the phone or by e-mailEurope Direct is a service that answers your questions about the European Union. You can contact this service ‑ by freephone: 00 800 6 7 8 9 10 11 (certain operators may charge for these calls), ‑ at the following standard number: +32 22999696 or ‑ by electronic mail via: https://europa.eu/european-union/contact_en
Finding information about the EU
OnlineInformation about the European Union in all the official languages of the EU is available on the Europa website at: https://europa.eu/european-union/index_en
EU PublicationsYou can download or order free and priced EU publications from EU Bookshop at: https://publications.europa.eu/en/publications. Multiple copies of free publications may be obtained by contacting Europe Direct or your local information centre (see https://europa.eu/european-union/contact_en)
EU law and related documentsFor access to legal information from the EU, including all EU law since 1951 in all the official language versions, go to EUR-Lex at: http://eur-lex.europa.eu
Open data from the EUThe EU Open Data Portal (http://data.europa.eu/euodp/en/data) provides access to datasets from the EU. Data can be downloaded and reused for free, both for commercial and non-commercial purposes.

Living conditions in Europe 2018 edition
This publication provides a picture of current living conditions in Europe, as well as the socio-economic factors affecting the everyday life of Europeans. Chapter 1 focuses on the financial dimensions of poverty and inequality. Chapter 2 examines to what extent a lack of adequate income can prevent people from affording an adequate standard of living. Chapter 3 presents statistics with regard to the quality of housing, while Chapter 4 provides information on the interactions between living conditions and labour and health status. Finally, Chapter 5 provides an analysis of social participation and social integration. The majority of the indicators presented in the publication come from European statistics on income and living conditions (EU-SILC), with data up to 2016.
For more informationhttp://ec.europa.eu/eurostat/
Print: KS-DZ-18-001-EN
-CPD
F: KS-D
Z-18-001-EN-N
Print: ISBN 978-92-79-86497-1PDF: ISBN 978-92-79-86498-8