livestock trucking services
TRANSCRIPT

LIVESTOCK TRUCKING SERVICES:
Quality, Adequacy, and Shipment Patterns
AGRICULTURAL ECONOMIC REPORT NO. 312
ECONOMIC RESEARCH SERVICE
U.S. DEPARTMENT OF AGRICULTURE

LIVESTOCK TRUCKING SERVICES: QUALITY, ADEQUACY, AND SHIPMENT PATTERNS, by L. A. Hoffman, P..P. Boles, and T. Q. Hutchinson. Economic Research Service, U.S. Department of Agriculture. Agricultural Economic Report No. 312.
ABSTRACT
For-hire truck service experienced by shippers of beef cattle and calves during 1972 was examined. Factors studied include major flow patterns of beef cattle, availability of for-hire truck service, extent of and reasons for shippers entering private carriage, channels through which shippers contact truckers, condition of animals after truck transport (including weight and death loss), and shippers' satisfaction with for-hire truck service.
Keywords: Transportation, livestock, weight loss, death loss, quality of service, seasonality.
Washington, D.C. 20250 October 1975

CONTENTS
Page
Summary ,.,, , ii
Introduction , 1
Scope and Methodology 2
Shipment Patterns 6
Mode of Transport ••...••.•• *..... 12
Private Carriage Utilization .........* 12
For-Hire Cattle Truck Service 12 Shipper Information System 12 Availability of Service 13 Weight Loss of Cattle and Calves Hauled by Truck 15 Watering of Cattle and Calves During Transit 17 Animal Loss in Transit 20 End-of-Trip Animal Condition 23 Shippers' Satisfaction With Service 25
Conclusions ^ 26
Appendix—LIVESTOCK TRANSPORTATION SURVEY 28

SUMMARY
Livestock handlers and feedlot operators were generally satisfied with unregulated cattle trucking services received in 1972. Most cattle and calves arrived in "acceptable," "good," or "excellent" condition. Losses in transit were minimal, and resulted most often from poor animal condition prior to loading or accidental trampling in transit.
Livestock handlers and feedlot operators responding to a questionnaire reported 97 and 99 percent, respectively, of their cattle and calves were transported by truck. Of these cattle and calves, about four-fifths were moved by for-hire carriers.
The reason most often cited for supplying private livestock transportation was the inadequate service of for-hire livestock carriers. However, private carriage did not appear substantial, accounting for slightly less than one- fifth of.the cattle and calves trucked.
Shippers reported that they most often learn of and contact truckers through the regularly hired trucker. Truck brokers were their least often reported source of information.
Seasonality of inshipments occurred in each of the five feeding States. Iowa, Nebraska, and Texas experienced heavy movements of cattle during September, October, and November. Colorado reported peak inshipments during May and June and again in October. California had peak movements during October, November, and December.
Nearly 47 percent of all livestock handlers and about 8 percent of all feedlots reported months during 1972 when services of for-hire truckers were especially hard to obtain. Larger shippers, in general, experienced more difficulty in obtaining truck service than did smaller ones. Difficulties were most frequently reported during those months of peak cattle movements, when livestock transportation capacity was apparently in relatively short supply.
Animal weight loss in transit was most frequently caused by the length of time in transit, animal condition prior to loading, and weather condition at time of loading. Excessive shrinkage occurred more with larger shippers than with smaller shippers.
Over nine-tenths of the feedlots in each firm size group and more than four-fifths of the handlers in nearly all size groups reported satisfactory for-hire service. Many shippers made favorable conmients about the for-hire truckers used. Compliments most often given were: good attitude of the trucking firm, promptness of service, skillful drivers, and quality equipment furnished.
11

LIVESTOCK TRUCKING SERVICES:
Quality, Adequacy, and Shipment Patterns
L. A. Hoffman, P. P. Boles, and T. Q. Hutchinson 1/
INTRODUCTION
During the early 1970's, cattlemen, livestock dealers, and livestock truckers became increasingly concerned about the economics of livestock transportation. In 1971, the Economic Research Service (ERS) undertook a study of this topic. The first part resulted in Cost of Operating Trucks for Livestock Transportation, Marketing Research Report No. 982, issued in January 1973. This report on the level, kind, and quality of livestock transportation service is the second part.
Statement of Problem
Both livestock shippers and carriers have reported difficulties in live- stock truck transportation. Problems reported by shippers include: trucks were unavailable when needed; drivers did not safeguard cattle during transit; and equipment was in need of repairs. Also, some shippers have alleged dis- criminatory traneiportation pricing. Several for-hire livestock carriers, on the other hand, have claimed that inadequate revenues have prevented them from offering dependable service or forced them to terminate business opera- tions.
Some livestock carriers and other participants in livestock marketing have proposed regulating interstate shipments of live animals by truck. Under section 203(b)(6) of part 2 of the Interstate Commerce Act, interstate trucking of livestock is currently exempt from economic regulation by the Interstate Commerce Commission (ICC). Legislation proposing ICC regulation of interstate trucking of livestock was introduced in both houses of the 90th U.S. Congress, Second Session, but failed to be enacted.
1/ Agricultural economists. National Economic Analysis Division, Economic Research Service.

Objectives
The fundamental objectives of ERS' overall study are to determine whether (1) the level, kind5 and quality of service provided by motor carriers is adequate and suitable to the needs of the industry; or (2) pricing of transportation services is frequently monopolistic, results in excessive profit levels for motor carriers, or is frequently discriminatory to shippers. Evidence that these conditions are widespread would justify research into the potentials for correcting them through economic regulation.
Specific objectives of this phase were to (1) determine the major flow patterns of beef cattle and test them for seasonality; (2) determine truck rates for beef cattle, test them for significant differences among major flow patterns, and compare them with estimated truck operating costs (rate data were collected in this phase of the study, but analysis has been deferred to a later time); (3) determine the quality of for-hire truck service for beef cattle by examining factors such as availability of service, condition of animals after truck transport, and shippers' level of perceived satisfaction with for-hire truck service; (4) determine the information channels through which beef cattle shippers learn of and contact truckers; (5) examine the extent and reasons for use of private carriage in the beef cattle marketing industry.
SCOPE AND METHODOLOGY
Livestock shippers were sampled to include a significant portion of U.S. beef cattle raised and fed and to offer broad geographic representation. Shippers were sampled from 13 States in the following regions: Southeastern States, Corn Belt, Northern Plains, Southwestern States, Mountain States, and Pacific States (fig. 1). Sample States accounted for about three-fifths of all fed cattle marketed and more than half of all cattle and calves marketed in the United States during 1971.
Shipper Listings
Listings of shippers included livestock handlers (coiranission firms, order buyers, dealers, and clearinghouses) and beef cattle feedlots. Representative livestock handlers engaged in interstate livestock marketing were obtained from a listing of all livestock handlers registered under the Packers and Stockyards Act in 1971. A feedlot sample was obtained from a listing of beef cattle feedlots maintained by the Statistical Reporting Service (SRS), U,S. Department of Agriculture.
Sample Procedures
A stratified random sample was drawn for both livestock handlers and beef cattle feedlots. ERS designed and drew the livestock handler sample. Live- stock handlers were stratified according to annual gross revenue reported for 1971 (table 1).

STATES INCLUDED IN SURVEY OF LIVESTOCK SHIPPERS
Cattle feedlots and livestock handlers Livestock handlers only
Figure 1

Table 1—Livestock handler sample plan for 13 States
Firm size by annual gross revenue, 1971 (million dollars)
Handlers in population : Sample rate : Sample size \J
: Number Percent Number
20.0 or more 57 100 57 10.0-19.9 : 116 50 63 5.0-9.9 : 163 20 34 2.0-4.9 : 442 10 46 1.0-1.9 581 5 34
Under 1.0 : 2,194 2 38
lotax •••••«•••••••• : 3,553 272
1^/ Based on all 13 States' livestock handlers by each stratum and their sample rate. The sample size for each stratum may be greater or less than the number expected. This difference was due to rounding at the State level/ Expansion factors reflected the rounding effects for each State, Therefore, population estimates based on the survey are not biased by the roundings,
The feedlot sample was designed and drawn by SRS, Feedlots were stratified according to one-time capacity rather than annual revenue or throughput (table 2). Texas, Colorado, and California feedlots were sampled at the same rate for for each stratum (table 2), Sample rates for feedlots in Nebraska were similar except for the smallest stratum. Strata sample rates for feedlots in Iowa were somewhat different than in the other feeding States, since Iowa did not have any feedlots in the largest and second largest strata. To attain efficient use of enumerators, a greater proportion of large shippers were sampled than small shippers. There were fewer large shippers, but these shippers accounted for the greatest volume of cattle and calves transported in 1971.
Survey Response
Data on the transportation of cattle and calves during 1972 were obtained from personal interviews with livestock handlers and feedlot operators, (ôample questionnaires are in the appendix). Of the 272 livestock handlers contacted, 221 supplied usable questionnaires (table 3). Of those question- naires not used, 21 were refusals and 30 were "out-of-scope." Handlers who had died, had not handled cattle and calves in 1972, or no longer functioned as livestock handlers were considered out-of-scope.
Of the 605 feedlots contacted, 495 provided usable questionnaires (table 4). Nine of the 110 questionnaires not used were refusals and 101 were out- of-scope. Feedlot operators who had died, had not fed cattle in 1972, or had ceased to operate feedlots were considered out-of-scope.
Data from each shipper's questionnaire were expanded to population estimates. Expansion factors were not adjusted to compensate for refusals or shippers considered out-of-scope. These factors were unadjusted because there

Table 2—Cattle feedlot sample plan for 5 States
Feedlot size by capacity (head)
Feedlots in population : Sample rate 1/ '' Sample size 2/
Number Percent Number
32,000 or more 46 100 46 16,000-31,999 80 50 41 8,000-15,999 : 127 24 31 4,000-7,999 214 13 27 1,000-3,999 : 890 7 66
Under 1,000 53,794 1 394
Total : 55,151 605
1/ Sample rate by State by decreasing stratum size. Texas-Colorado-California: 100.0, 50.0, 20.0, 10.0, 5.0, 2.0 Nebraska: 100.0, 50.0, 20.0, 10.0, 5.0, 0.66 Iowa: 0, 0, 100.0, 50.0, 20.0, 0.66
2^/ Based on all 13 States' livestock handlers by each stratum and their sample rate. The sample size for each stratum may be greater or less than the number expected. This difference was due to rounding at the State level. Expansion factors reflected the rounding effects for each State. Therefore, population estimates based on the survey are not biased by the roundings.
Table 3—Survey response for livestock handlers, 1972
Firm size by annual gross revenue, 1971
(million dollars)
Total question- naires
Usable question- naires
Questionnaires not used
Non- ; cooperators ¡Out-of-scope
Number
20.0 or more 10.0-19.9 ... 5.0-9.9 2.0-4.9 1.0-1.9
Under' 1.0 ...
Total
57 49 4 63 57 3 34 28 0 46 37 6 34 23 4 38 27 4
272 221 21
4 3 6 3 7 7
30
was Insufficient information concerning the cause of refusals. It was assumed that out-of-scope shippers existed in the population in the same proportion as found in the sample.

Table 4~Survey response for cattle feedlots, 1972
Feedlot capacity (head)
Total ' question- ' naires
Usable ' question- '
naires '
Questionnaires not used
; Non- , cooperators
• !out •
-of-scope
Number
46 45 0 1 41 36 3 2 31 27 1 3 27 23 0 4 66 52 4 10
394 312 1 81
32,000 or more 16,000-31,999 8,000-15,999 4,000-7,999 . 1,000-3,999 .
Under 1,000 . ■
Total .•.«••.. 605 495 101
SHIPMENT PATTERNS
Shipments to the five feeding States considered in this study were examined to determine major movement corridors and possible seasonal move- ments within these corridors. If seasonal movements of cattle do occur, one might expect peak demand periods for livestock truck service.
Livestock shipment data were obtained from SRS's State offices in the five feeding States for 1970-72, These and other SRS data were used to estimate livestock flows into these States and seasonality. Inshipment data for the five feeding States were grouped into areas for all States except for inshipments from one feeding State to another. Inshipments are primarily from nine areas, the five feeding States, Canada, and Mexico (fig. 2).
Major Flow Patterns of the Five Feeding States
Inshipments from States or regions included estimates of all cattle (stocker, feeder, and fat) and calves entering the State. Average volumes greater than 100,000 head were considered major inshipments.
Based on average inshipment data for 1970-72, Iowa received most of its cattle and calves from the following areas or States, in order o£ decreasing magnitude: Northern Great Plains, Corn Belt, Nebraska, Mountain States, Southern Great Plains, and Texas (table 5). About 90 percent of Iowa's in- coming cattle and calves originated in these areas.
Nebraska received major shipments of cattle and calves from the following sources, in order of decreasing volume: Southern Great Plains, Northern Great Plains, Mountain States, Corn Belt, Iowa, and Texas. These origins accounted for about 86 percent of all inshipments to Nebraska, based on the 3-year average.

ORIGINS OF ESTIMATED SHIPMENTS INTO THE 5 FEEDING STATES, 1972
^^®R/N/ÍA
MEXICO
Figure 2

Table 5—Estimated inshipments of cattle and calves for the 5 feeding States by area of origin, 1970-72 1/
State and year •North- *east
South- east
Corn Belt
South Central
: No. : : So. : Iowa :Great :Nebr.¡Great :Texas
:Plains : :Plains :
Mt. States Colo.
South- west
North- west Calif. Canada
.•Other : Mexico:States: Total
: 2/ :
Iowa : : 1970 : 1 1971 : 1 1972 : 1
Average 1970-72 ..: 1
Nebraska: : 1970 : 0 1971 : 0 1972 : 0
Average 1970-72 ..: 0
Colorado: 1970 : 0 1971 : 0 1972 : 0
Average 1970-72 ..: 0
California: : 1970 ...: 0 1971 : 0 1972 : 0
Average 1970-72 ..: 0
Texas : : 1970 : 0 1971 : 0 1972 ..: 0
Average 1970-72 ..: 0
Total: 2/ • 1970 : 1 1971 : 1 1972 : 1
Average 1970-72 ..: 1
1,000 head
1 562 73 0 681 560 288 110 332 52 23 14 11 4 0 149 2,861 1 612 70 0 826 546 196 99 429 41 24 13 5 8 0 154 3,025 1 637 73 0 647 486 243 106 499 34 23 16 6 27 0 123 2,931 1 603 72 0 718 531 242 105 420 42 23 14 8 13 0 142 2,936
1 266 45 153 306 0 424 188 341 101 37 4 8 0 0. 90 1,964 0 268 58 182 396 0 395 113 400 97 30 8 6 0 0 89 2,041 3 319 81 205 472 0 502 190 428 89 27 11 14 0 0 87 2,427 1 284 61 180 391 0 441 163 390 95 31 8 9 0 0 88 2,144
0 108 67 0 31 98 460 500 217 0 374 5 95 0 0 76 2,029 0 158 57 0 44 172 555 485 426 0 422 18 112 0 0 51 2,499 0 167 67 0 79 187 620 619 475 0 310 49 19 0 0 58 2,650 0 144 64 0 51 152 545 535 373 0 369 24 76 0 0 61 2,393
0 10 110 0 0 1 31 782 139 24 842 205 0 0 97 33 2,274 0 0 140 1 0 1 33 822 162 11 849 218 0 0 96 4.8 2,379 0 8 143 4 0 2 44 810 110 14 828 237 0 0 80 78 2,356 0 6 l3l 2 0 2 36 805 137 16 840 220 0 0 91 53 2,336
185 39 508 5 1 2 511 0 7 23 546 0 2 0 0 72 1,898 211 74 843 5 8 4 529 0 11 42 604 0 1 0 0 18 2,351 329 124 1,129 19 14 21 970 0 44 64 540 0 4 0 0 58 3,315 242 79 827 10 8 9 670 0 21 43 563 0 2 0 0 49 2,521
187 985 803 158 1,018 660 1,714 1,580 1,035 199 1,822 228 116 4 97 419 11,027 213 1,111 1,168 188 1,275 723 1,708 1,518 1,428 191 1,929 256 124 8 96 359 12,296 333 1,255 1,492 227 1,211 695 2,378 1,725 1,556 201 1,728 312 43 27 80 403 13,669 244 1,117 1,154 191 1,168 693 1,933 1,608 1,340 197 1,826 265 94 13 91 394 12,330
1/ Estimates include all cattle (stocker, feeder, and fat) and calves. _2/ Cattle inshipment data into each of the 5 feeding States were for shipments from a limited number of States (Colorado—14, California—
17, Texas—20, Nebraska—29, and Iowa—33) with the remainder from all other States. State figures were incorporated into a region where ^applicable.
V Numbers may not add to total due to rounding.
Source: Estimates computed from livestock shipment data obtained from the Statistical Reporting Service's State offices in the 5 feeding States and from table 7.
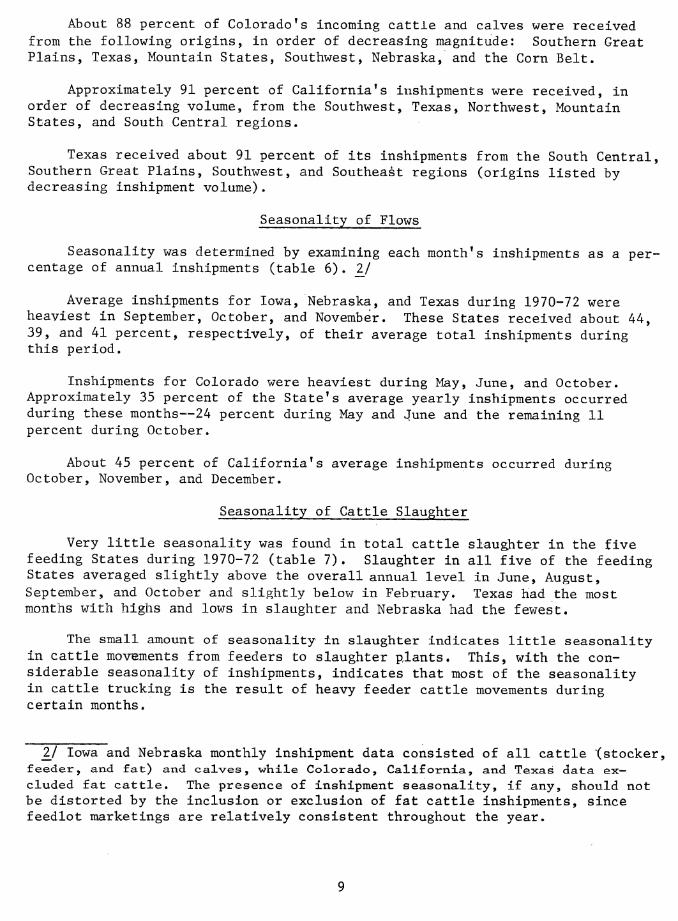
About 88 percent of Colorado's incoming cattle and calves were received from the following origins, in order of decreasing magnitude: Southern Great Plains, Texas, Mountain States, Southwest, Nebraska, and the Corn Belt.
Approximately 91 percent of California's inshipments were received, in order of decreasing volume, from the Southwest, Texas, Northwest, Mountain States, and South Central regions.
Texas received about 91 percent of its inshipments from the South Central, Southern Great Plains, Southwest, and Southeast regions (origins listed by decreasing inshipment volume)•
Seasonality of Flows
Seasonality was determined by examining each month's inshipments as a per- centage of annual inshipments (table 6). Ij
Average inshipments for Iowa, Nebraska, and Texas during 1970-72 were heaviest in September, October, and November. These States received about 44, 39, and 41 percent, respectively, of their average total inshipments during this period,
Inshipments for Colorado were heaviest during May, June, and October. Approximately 35 percent of the State's average yearly inshipments occurred during these months—24 percent during May and June and the remaining 11 percent during October.
About 45 percent of California's average inshipments occurred during October, November, and December.
Seasonality of Cattle Slaughter
Very little seasonality was found in total cattle slaughter in the five feeding States during 1970-72 (table 7). Slaughter in all five of the feeding States averaged slightly above the overall annual level in June, August, September, and October and slightly below in February. Texas had the most months with highs and lows in slaughter and Nebraska had the fewest.
The small amount of seasonality in slaughter indicates little seasonality in cattle movements from feeders to slaughter plants. This, with the con- siderable seasonality of inshipments, indicates that most of the seasonality in cattle trucking is the result of heavy feeder cattle movements during certain months.
Ij Iowa and Nebraska monthly inshipment data consisted of all cattle (stocker, feeder, and £at) and calves, while Colorado, California, and Texas data ex- cluded fat cattle. The presence of inshipment seasonality, if any, should not be distorted by the inclusion or exclusion of fat cattle inshipments, since feedlot marketings are relatively consistent throughout the year.

MODE OF TRANSPORT
Shippers were asked whether their beef cattle moved via truck, truck-rail combination, or rail. Survey results showed that almost all beef cattle are transported entirely by truck. Of total cattle and calves purchased or sold by handlers during 1972, 97 percent moved by truck, 2 percent by truck-rail combination, and 1 percent by rail.
Little variation in transportation existed among size groups, except that handlers in the smallest group moved all of their cattle by truck. Cattle shipped via truck-rail combination were reported by handlers in Texas, Oklahoma, Iowa, Nebraska, Colorado, and California. Some handlers in Texas, Iowa, Missouri, Montana, and California reported shipping cattle solely by rail. However, the origins of these shipments were not specified.
Of the beef cattle marketed from feedlots during 1972, nearly 99 percent moved by truck and the remainder by truck-rail combination. The beef cattle moving by^ truck-rail combination were from several of the larger Texas feed- lots, with capacities of at least 16,000 head.
PRIVATE CARRIAGE UTILIZATION
The use of privately operated equipment to transport shippers' cattle did not appear significant. Fewer than one-fifth of the cattle and calves trans- ported for shippers were hauled by private carriers.
Shippers who entered private livestock transportation reported that they did so more because of a lack of adequate for-hire tfuck service than for cost- related reasons. Less frequently cited reasons for shippers using their own equipment were: more economical; part of the original enterprise and used for other needs as well as hauling cattle and calves; and miscellaneous.
FOR-HIRE CATTLE TRUCK SERVICE
Shipper Information System
Prior to the survey, little information existed concerning how the live- stock shipper obtained his for-hire livestock truck service. One hypothesis was that an institutionalized marketing information system, such as truck brokers, existed. Such a system is common in the fresh fruit and vegetable industry, where brokers arrange for a large percentage of all shipments.
In an attempt to identify any such marketing information system, shippers in the survey were first asked whether they arranged for transportation of cattle and calves in for-hire trucks during 1972. Those shippers responding positively—-about 79 percent of the handlers and nearly 87 percent of the feedlots—were asked who they contacted to arrange for-hire transportation. They could select one or more of the following sources: A truck broker or dispatcher; a regularly hired trucker; other truckers; or other sources (to be specified).
12

The information source most often used by both ty.pes of shippers was the regularly hired trucker (table 8). Other selections by decreasing order of frequency were: other truckers; other sources such as a maintained list of truckers; and truck brokers or dispatchers. Similar results were found in almost all shipper size groups.
Table 8—Percent of shippers reporting type of information system used to learn of and contact livestock truckers
Type of shipjfer
Livestock handler •
Cattle feedlot .
Truck broker: or
dispatcher
Type of information system Regularly
hired truckers
Other truckers
Other sources
Did not arrange; for transportation
64
80
Percent Ij
21
10
21
13
II Percentages do not add horizontally to 100 since a shipper could select more than one type of information system.
Availability,of Service
Shippers were asked if there were some months during 1972 in which services of for-hire truckers were especially hard to obtain. Of the usable shipper questionnaires, nearly half of all livestock handlers and about 8 percent of all feedlots gave an affirmative answer (tables 9 and 10).
In general, the larger shippers experienced more difficulty hiring truckers than did the smaller shippers. Possibly the smaller livestock handlers had less difficulty because they transported more of their cattle and calves in their own equipment than did the larger handlers.
Regardless of firm size, livestock handlers reported September, October, and November as the most difficult months of the year to obtain for-hire truck services (table 9). However, difficulties varied somewhat by State. In addition to the fall months, Oklahoma handlers reported May as a difficult month, Texas handlers reported April and May, and Colorado handlers reported April, May, and June.
September, October, and November were most often reported by feedlots as months in which services of for-hire truckers were especially hard to obtain ■ (table 10). Similar results were found for each feedlot size group. Diffi- culties varied slightly by region. In addition to the fall months, Texas feedlots reported May, and Colorado feedlots reported January and February, as months when for-hire truck service was difficult to find.
13

Table 9—Percent of livestock handlers reporting services of for-hire trucks especially difficult to obtain, by months and size groups, 1972
Firm size by annual gross revenue, 1971 (million dollars)
20,0 or more 69 10,0-19.9 48 5.0-9.9 69 2.0-4.9 70 1.0-1.9 61
Under 1.0 : 33 All handlers 2/ 47
Handlers reporting
difficulties Jan. Feb. Mar. Apr.
2 0 0 8
13 4 5
2 8 0 5 0 7 5 11 9 4 4 4 4 5
12 7
14 14 9 7 9
May June July Aug. Sept. Oct. Nov.
Percent 1/
24 10 6 12 47 14 5 2 7 38 17 7 10 17 48 14 8 8 11 38 9 9 4 17 35
11 0 0 7 11 12 4 3 11 24
65 39 47 33 66 34 65 46 61 48 30 22 44 32
Dec.
8 7 7
16 26 7
12
1/ Monthly percentages do not add horizontally to the percentage of handlers reporting difficulties, since a handler could select more than one month.
11 All data in this table have been expanded to represent the population in table 1.
Table 10--Percent of cattle feedlots reporting services of for-hire trucks especially difficult to obtain, by months and size groups, 1972
Feedlot size by capacity
(head)
32,000 and more .... 42 16,000-31,999 53 8,000-15,999 ...... 61 4,000-7,999 40 1,000-3,999 37
Under 1,000 : 7 All feedlots 3/ : 8
Handlers reporting
difficulties Jan. Feb. Mar. Apr. May June July Aug. Sept. Oct. Nov.
2 6 0 0 3 II 2/
4 3 0 0 3 y
11 0 0 0
y 11
16 17 9 O 3 1 1
16 19 23 12 O 2/ 1
Percent \l
1 6
14 6 3 O II
7 3 O 6 O O 2/
4 6 O 6 O O 2/
Dec.
20 29 24 4 22 28 33; 14 37 51 48- 19 27 28 14 6 22 34 25 9 1 * 5 4 2/ 2 6 4 1
X/ Monthly percentages do not add horizontally to the percentage of feedlots reporting difficulties, since a feedlot operator could select more than one month.
2J Less than 0.5 percent. 3/ All data in this table have been expanded to represent the population in table 2.

Months when services of for-hire truckers were most often reported to be difficult to obtain coincided with peak inshipment movements. For example, September, October, and November were most often reported by shippers as difficult months to obtain for-hire truck service (tables 9 and 10). During these months, Iowa, Nebraska, California, and Texas received heavy inship- ments (table 6). Colorado, Texas, and Oklahoma shippers reported for-hire truck service also difficult to obtain in April, May, and June. During these months, Colorado received heavy inshipments, primarily from the Southern Great Plains and Texas.
Although some shippe/rs reported difficulties in obtaining service during each month of the year, most difficulties occurred only during the spring and fall peak demand periods. Therefore, it seems reasonable to conclude that demand for for-hire truck service during peak movement periods exceeded the readily available supply of equipment.
Weight Loss of Cattle and Calves Hauled by Truck
Factors Contributing to Weight Loss
Responses of livestock handlers and feedlots reporting factors contributing to cattle and calf weight loss in truck transit were grouped as follows:
(1) Length of time animals are on truck. (2) Driver and/or equipment problems. (3) Condition of animal before loading. (4) Weather conditions and time of loading. (5) Improper handling before loading, during loading and unloading, and
after unloading. (6) Crowding or overloading truck. (7) Normal body function and stress. (8) No answer or didn't know. (9) Other.
In general, the larger handlers and feedlots cited length of time animals are on the truck as the most frequent reason for animal weight loss in transit, (tables 11 and 12). In contrast, the smaller handlers and feedlots cited factors 3 through 6 most frequently. Average length of the most common haul was greater for larger firms than smaller firms in most cases (tables 13 and 14). Assuming that the length of time animals were on trucks was primarily a function of distance and highway speed limits, cattle shipped by larger shippers would tend to be on board for more hours than cattle shipped by smaller shippers. Larger shippers could, therefore, be expected to cite length of time animals were on the truck more frequently as the principal source of weight loss, while smaller shippers would cite other reasons such as animal condition prior to loading or crowding.
Some shippers have claimed that carelessness of for-hire truckers contribu- ted to excessive weight loss in transit. It is clear from these results, how- ever, that improper handling by for-hire truckers was not considered the major cause of weight loss in truck transit and that, in most cases, weight loss was caused by factors beyond the control of the for-hire truckers.
15

Table 11—Percent of livestock handlers reporting factors contributing to cattle and calf weight loss in truck transit, by firm size, 1972
Factors Firm size by annual gross revenue, 1971 (million dollars)
:20.0 or more: 19.9-rlO.O 9.9-5>0 4.9-2.0 1.9-1.0 ;Less than 1.0
All handlers
: Percent _1 /
Length of time animals are on truck . : 59 36 55 51 35 44 44 Driver and/or equipment problems : 33 26 31 24 0 15 15 Condition of animal before loading ..: 31 29 35 27 39 30 31 Weather conditions and time of :
loading : 25 33 31 30 39 33 34 Itoproper handling before loading, : during loading and unloading, and : after unloading : 16 7 10 14 17 26 . ,21
Crowding and overloading truck : 18 21 21 27 17 48 36 Normal body function and stress : 10 19 21 3 9 11 10 No answer or didn*t know : 10 21 3 14 13 0 6 Other i ,....: 18 16 17 11 13 30 22
1/ Percents do not add vertically to 100 percent because a livestock handler could report more than one factor.
Table 12—Percent of feedlot operators reporting factors contributing to cattle and calf weight loss in truck transit, by firm size, 1972
Factors Firm size (1.000 head)
:32.0 or more: 31.9-16.0 : 15.9-8.0 7.9-4.0 3.9-1.0 Under 1.0
All feedlots
Length of time animals are on truck •: Driver and/or equipment problems ....; Condition of animal before loading ..: Weather conditions and time of
loading ! Improper handling before loading, during loading and unloading, and after loading
Crowding and overloading truck : Normal body function and stress No answer or didn't know Other
Percent 1/
73 75 57 51 38 18 19
29 22 10 42 32 23 23 16 14 19 52 32 16 16
33 42 29 60 19 25
1/ Percents do not add vertically to 100 percent because a livestock handler could report more than one factor.
25
7 17 19 25 34 26 26 13 22 14 13 30 25 25 11 14 23 1 12 14 14 0 8 5 1 4 15 15
13 17 24 7 19 18 18

Incidence of Above-Normal Weight Loss
Cattle and calves lose weight during transit. By assuming that highway speed limits nearly determine the time required for specific trips, the inci- dence of greater-than-normal shrink during transit may indicate inattentive drivers, poorly maintained equipment, or other factors.
Shippers were asked what percentage of their most common hauls experienced above-normal shrinkage. As shown in table 15, most livestock handlers did not experience excessive shrinkage on their most common hauls. Forty-four percent reported experiencing only normal shrink. Of those handlers reporting excessive shrinkage, the larger handlers reported a greater incidence of shrink than did the smaller ones. Of those handlers reporting above-normal shrink, most stated that from 1 to 10 percent of the trips comprising their most common haul experienced.greater than normal shrink.
Of those feedlots answering the question, most reported no above-normal shrinkage on their most common hauls (tables 16 and 17). Of those feedlots reporting greater than normal shrinkage, most mentioned that from 1 to 10 per- cent of their most common hauls were affected. Overall, slaughter cattle had less excessive shrinkage than did feeder cattle.
Table 13—Percent of livestock handlers reporting range of most common haul, by firm size, 1972 1/
Firm size by annual gross revenue, 1971 Range '. (million dollars) . All (miles) 20.0 or: 10.0- : 5.0- : 2.0- : 1.0- :Less than handlers
more I 19.9 : 9.9 : 4.9 : 1.9 : 1.0
Percent
25 and under .... 6 8 5 0 6 17 11 26-50 9 24 10 0 13 17 13 51-100 ; 6 8 9 16 19 22 19 101-299 31 18 24 20 12 28 23 300-500 ; 11 11 33 28 31 5. 16 501-1,000 23 18 10 12 13 11 12 1,001 and over .. • 14 13 9 24 6 0 6 All handlers .... ! 100 100 100 100 100 100 100
1/ A most common haul was indicated by 154 handlers in the question concerning rates (see app. I).
Watering of Cattle and Calves During Transit
Livestock handlers reported 26 hours as the average length of time required before cattle and calves were watered during transit (table 18). This average varied very little among size groups. The amount of time required by handlers ranged from 12 to 36 hours.
17

Table 14—Percent of feedlot operators reportingjf,.range of most common haul, by firm size, 1972 1/
Range ' (miles) '
Firm size (1,000 head) All feedlots 32.0 or: 16.0- : 8.0- • : 4.0- : 1.0-' : Under :
more : 31.9 : 15.9 : 7.9 : 3.9 : i.O :
Percent
25 and under • : 9 5 22 25 28 22 22 26-50 5 5 11 18 11 27 27 51-100 9 19 0 21 32 27 27 101-299 . 45 29 29 25 17 20 20 300-500 : 9 9 0 3 12 2 2 501-1,000 : 5 19 29 0 0 2 2 1,001 and over .... : 18 14 9 8 0 0 2/ All feedlots : 100 100 100 100 100 100 100
Xj A most common haul was reported by 343 feeders in the question concerning rates (see app. II).
Ij Less than one-tenth of 1 percent.
Table 15—Percent of handlers reporting above-normal shrinkage for their most common hauls, by firm size, 1972
Firm size by Percent of hauls ; Did not \ know or
annual gross : revenue, 1971 : 0 : 1-10 : 11-20 : 21-30
\ Total
(million dollars) : , no answer
Percent
20.0 or more : 39 24 4 6 11 100 10.0-19.9 : 36 28 0 2 34 100 5.0-9.9 ; 52 28 0 3 17 100 •2.0*4.9 •... : 32 27 8 3 30 100 1.0-1.9 52 17 0 0 31 100
Less than 1.0 : 44 19 0 0 37 100 All handlers : 44 21 1 1 33 100
Feedlot operators required cattle and calves in transit to be watered after an average of 19 hours (table 19). This average varied among size groups, ranging from 17 to 33 hours. The amount of time required by any feedlot operation ranged from 12 to 50 hours. Although there is no law establishing a maximum time that may elapse before cattle and calves must be watered during truck transit, many livestock handlers and feedlot operators
18

Table 16—Percent of feedlots reporting above-normal shrinkage for their most common hauls of slaughter cattle, by firm size, 1972
Feedlot size by Percent of hauls _: Did not : '• know or • vno answer :
capacity (head)
; 0 • 1-10. • ■ •
• 11-20 • • • 21-30 •
Total
Percent
32,000 or more 42 13 0 0 45 100 16,000-31,999 : 47 14 0 0 39 100 8,000-15,999 : 43 21 9 0 27 100 4,000-7,999 : 60 16 9 0 15 100 1,000-3,999 • 65 23 3 0 9 100
Under 1,000 83 8 0 0 9 100 All handlers ; 82 8 1/ 0 10 100
Table 17—Percent of feedlots reporting above-normal shrinkage for their most common hauls of feeder cattle, by firm size, 1972
Feedlot size by Percent of hauls _: Did not : : know or : capacity = 0 '• 1-10 • 11-20 : 21-30 Total
(head) : • • • • :no answer:
Percent
32,000 or more : 13 31 4 7 45 100 16,000-31,999 : 31 17 11 3 38 100 8,000-15,999 : 29 31 9 5 26 100 4,000-7,999 : 31 34 0 12 23 100 1,000-3,999 : 57 25 9 1 8 100
Under 1,000 : 86 3 0 2 9 100 All feedlots : 85 4 1/ 2 9 100
1/ Less than 0.1 percent
thought there was a statutory 36-hour má:KÍmum. Apparently, they were thinking of the law which requires railroads to water animals in transit for trips in excess of 36 hours. 4/
4^/ The Twenty-Eight Hour Law (45 U.S.C. 71 et seq) (a) prohibits the confining of livestock in railroad cars or vessels for longer than 28 hours without un- loading for feed, water, and rest for at least five consecutive hours except under specified unavoidable circumstances; (b) permits time of confinement to be extended to 36 hours upon request of the shipper.
19

Table 18~Length of time required by livestock handlers before watering cattle and calves during transit, by size groups, 1972
Firm size by '. Percent of handlers !~ [ watering cattle [ '. in transit
Length of time annual gross
Average Range
revenue, 1971 (million dollars) * Low : High
' Percent
33
" Hours —
20.0 and over : ' 26 12 36 10.0-19.9 " 24 27 12 36 5.0-9.9 ' 7 28 24 32 2.0-4.9 21 23 12 36 1.0-1.9 : 17 29 20 36
Under 1.0 ' 4 24 24 24 All handlers ' 10 26 12 36
Table 19—Length of time required by feedlot operators before watering cattle and calves during transit, by size groups, 1972
Percent of operators]- watering cattle
. in transit *
Length of time Feedlot size
Average Range
by capacity (head) 1 Low • High
' Percent
! 56 : 43 : 32 ! 19 : 7 : 1 : 2
26 23 29 33 24 17 19
36 36 36 50 36 24
50
32,000 and over ...... 16,000-31,999 5,000-15,999 4,000-7,999 1,000-3,999
Under 1,000 All feedlots
■ Hours ~
12 18 24 24 18 12
12
Animal Loss in Transit
It has been alleged that many cattle are lost in truck transit due to trucker negligence. To determine the severity of this problem, shippers were asked how many head they lost in transit during 1972 and the causes of these losses.
Although one large firm reported losing 1,000 head, all livestock handlers lost an average of 6 animals per fiirm (table 20). Many firms experienced no losses. Average head lost per firm varied by firm size group, but tended to be larger for the larger firms.
20

Table 21—^^P er cent of livestock handlers reporting animals lost during truck transit by cause and firm size, 1972
Causes of cattle loss in truck transit
Firm size by 1971 annual gross revenue (million dollars ) All
20.0 or : 19.9- : 9.9- : 4.9- • • 1.9- :Less than: handlers more : 10.0 : 5.0 : 2.0 - • 1.0 : 1.0 :
Percent 1/
12 9 10 5 9 7 8 14 10 21 19 17 11 14 24 17 38 14 26 4 12 16 16 3 — — 4 3 10 2 3 5 13 — 4
20 10 14 11 _. 4 5 16 20 17 22 -17 7 13 8 3 17 — — 4 3 ro
Improper handling during preloading, loading, unloading and postloading
Crowding or overloading truck Condition of animal before loading .. Wrecks and unforeseen problems Driver and equipment problems Weather conditions and time of
loading ••• Animals were trampled No answer or didn' t know
Handlers reporting a loss 71 53 83 59 48 30 42
— = No response. 1^/ Since a firm could report more than one cause of loss, the percentages will not add vertically to
equal the percentage of handlers reporting a loss.

Table 20—Livestock handlers' cattle and calves lost in trudk transit by size group, 1972
Firm size by annual ! Average
Range gross revenue, 1971 : (million dollars) :
[ Low • • •
High
Head
20.0 or more ¡ 10.0-19.9 5.0-9.9 '. i 2.0-4.9 1.0-1.9
Under 1.0 All handlers
! 52 15 23
: 7 : 3 ! 3 : 6
0 0 0 0 0 0 0
1,000 100 107 75 18 25
1,000
Cattle and calves lost during transit represented only 35 of every 100,000 head of cattle and calves purchased or sold by all handlers. Losses per 100,000 head varied little by firm size group.
More large handlers experienced loss of animals in transit than did small handlers (table 21). The most frequent cause for animal loss differed by firm size group. Handlers in three size groups most often reported that the lost animals were in unsatisfactory condition before loading, two handler groups stated animals were trampled, and one group reported damage from crowding or overloading the truck.
Cattle and calves lost in truck transit by all cattle feeders averaged less than one animal per firm (table 22). Many feedlots experienced no losses, and the largest number of cattle lost by a single feedlot was 250. On the average, larger feedlots lost more cattle than did smaller feedlots.
Table 22—Feedlots* cattle and calves lost in truck transit by size group, 1972
Feedlot size by capacity
(head)
Range
Low High
Head
32,000 or more 16,000-31,999 8,000-15,999 4,000-7,999 . 1,000-3,999 .
Under 1,000 .. All feedlots .
30 11 17 23 1 1/ 1/
0 150 0 35 0 250 0 200 0 9 0 14 0 250
1/ Less than one animal
22

Causes of animal loss varied somewhat by feedlot size group (table 23). The reason most often given by feeders in the three largest groups was the unsatisfactory condition of the animal before loading. The three smallest groups most often mentioned that animals were trampled in transit.
As the survey results show, losses in truck transit did not appear excessive, and trucker negligence was seldom reported.
Both livestock handlers and feedlot operators reported the following methods of handling reimbursement for animals lost in transit: The loss was shared equally between shipper and trucker; the negligent party was responsible for the loss; the trucker was charged for all losses; or the shipper suffered all losses. Thus, not all shippers would be compensated for their losses. However, more than three-fifths of the handlers and feedlots reporting a loss in transit were reimbursed in whole or in part for their loss. Most of these shippers stated that compensation was made within 30 days of claim.
End-of-Trip Animal Condition
The quality of service provided by for-hire truckers was assumed to be measured, in part, by end-of-trip animal condition. Shippers were asked to rate the condition of animals moved by for-hire carriers as "excellent," "good," "acceptable," "fair," or "poor."
Almost all shippers reported end-of-trip animal condition in for-hire carriers as "excellent," "good," or "acceptable." Regardless of firm size, shippers most often reported a "good" animal condition (tables 24 and 25). One-fourth of the handlers and about one-third of the feedlots reported an "excellent" end-of-trip condition. Some of the largei: feedlots did not rate animal condition as highly as did the smaller feedlots or most of the handlers.
Table 24—Percent of livestock handlers reporting end-of-trip condition of cattle shipped in for-hire carriers, by firm size, 1972
Firm size by Animal condition i
: Did not : ! answer :
annual grosß revenue, I97I ¡Excel-
lent : Good ^Accept-] Fair : Poor Total
(million dollars) .able :
Percent
20.0 or more ; 16 65 8 0 0 11 100 10.0-19.9 : 35 53 5 0 0 7 100 5.0-9.9 ' 24 62 0 3 0 11 100 2.0-4.9 : 33 53 6 0 0 8 100 1.0-1.9 : ! 13 57 17 4 0 9 100
Under 1.0 ¡ 26 59 4 0 0 11 100 All handlers .•....; 25 58 6 1 0 10 100
23

Table 23—Percent of cattle feedlots reporting animals lost during truck transit by cause and firm size, 1972
4>
Causes of cattle loss in truck transit
Firm size capacity groups (1.000 head)
1.32.0 or : 31.9- : 15.9- : 7.9- : more : 16.0 : 8.0 : 4.0
Improper handling during preloading, : loading, and postloading ........... : 2 6
Crowding or overloading truck : 16 14 Condition of animal before loading ... : 27 42 Wrecks and unforeseen problems : 11 3 Driver and equipment problems : 18 3 Weather conditions and time of :
loading : 20 17 Animals were trampled : 22 36 No answer or didn* t know ......: 2 3
Feedlots reporting a loss .•.•••••••: 89 81 88
3.9- : Under 1.0 : 1.0
Percent 1/
5 6 19 18 6 40 18 9 5 9 14 8 7
19 18 7 28 31 19 6 4
76 32
1 1 2/ 1 2
1 3 1
All feedlots
1 1 1 1 2
1 3 1
— ^ No response. 1/ Since a firm could report more than one cause of loss, the percentages will not add vertically to
equal the percentage of feedlots reporting á loss. 2/ Less than 0.5 percent.

Table 25—Percent of feedlpts reporting end-of-trip condition of cattle shipped in for-hire carriers, by firm size, 1972
Feedlot size Animal condit Ion ' .: Did : : not : by capacity :Excel- •
• r\ J :Accept-: • Total (million dollars) •lent . Good
:able Fair i:'oor • : answer :
Percent
32,000 or more : 4 47 40 4 2 3 100 16,000-31,999 11 64 14 11 0 0 100 8,000-15,999 2 67 18 5 4 4 100 4,000-7,999 8 86 0 6 0 0 100 l,000-3;999 : 21 11 1 3 0 3 100
Under 1,000 , : 34 57 1 1/ 0 8 100 All feedlots ■ 34 57 1 1/ 1/ 8 100
\J Less than 0.3 percent.
Shippers^ Satisfaction With Service
Shippers were asked to rate their for-hire cattle truck service as satis- factory or unsatisfactory. They were also asked to state the factors which contributed to their level of satisfaction.
Regardless of firm size, most shippers of cattle and calves stated that for-hire truck service was "satisfactory." Of the usable livestock handler and feedlot questionnaires, about 86 and 92 percent, respectively, reported "satisfactory" service (tables 26 and 27). Approximately 4 percent of all handlers and less than 1 percent of all feedlots reported "unsatisfactory" service. The remaining 10 per'cent of handlers and 8 percent of feedlots did not answer the question.
Table 26—Percent of livestock handlers reporting level of service satisfaction, by size group, 1972
Firm size by annual gross revenue, 1971
(million dollars)
20.0 or more 10.0-19.9 . 5.0-9»9 ., 2.0-4.9 .. 1.0-1.9 .,
Less than 1 All handlers
Level of satisfaction
Satisfactory \ Unsatisfactory
Did not answer
90 93 76 89 87 85 86
Percent
Total
0 10 100 0 7 100
14 10 100 5 9 100 4 9 -100 4 11 100 4 10 100
25

Table 27—Percent of feedlot operators reporting level of service satisfaction, by size group, 1972
Feedlot size by capacity
(head)
Level of satisfaction
Satisfactory ] Unsatisfactory Did not answer Total
Percent
32,000 or more 16,000-31,999 8,000-15,999 4,000-7,999 . 1,000-3,999 .
Under 1,000 .. All feedlots «
91 94
100 100 94 92 92
7 6 0 0 1 1/ 1/
2 0 0 0 5 8 8
100 100 100 100 100 100 100
IJ 0,1 percent.
Reasons the shippers gave for rating service as satisfactory were grouped into the following categories; Positive attitude of the trucking firm and the good job done by the firm; promptness of service; good courteous drivers; good equipment; sufficient cargo insurance; proper loading and unloading; animals arriving in good condition; no answer or didn't know; and miscellaneous. Those reasons given most often by all shipper size groups werei Positive attitude of the trucking firm and the good job done by the firm; promptness of service; good equipment; and good courteous drivers.
Reasons given for rating service as unsatisfactory were grouped into the following categories: Poor quality drivers; poor quality equipment; poor trucking firm management; lack of prompt service; insufficient number of trucks; no answer or didn't know; and miscellaneous. The reason given moat often by medium-sized livestock handlers was poor quality drivers. The smaller handlers and larger feedlots most often reported poor quality drivers and lack of prompt service. Smaller feedlots most often cited poor quality equipment and lack of prompt service.
CONCLUSIONS
There were no substantial indications that subjecting interstate for-hire motor carrier service to economic regulation would improve performance for shippers. A great majority of shippers reported that present (unregulated) for-hire truck service was "satisfactory." Most cattle and calves arrived in "acceptable," "good," or "excellent" condition. Losses in transit were minimal, averaging six animals per handler and less than one animal per feedlot. The most frequent causes of loss were poor animal condition prior to loading or accidental downing in transit. For-hire cattle truck service appeared to be available in sufficient quantity throughout most of the year, except in the peak cattle movement periods of the fall and, for a few areas, in certain spring months. Lack of attention by for-hire truck drivers was infrequently reported to be the cause of animal weight loss in transit. Generally, the
26

most frequent causes were related to length of time animals were on the truck, animal's condition before loading, weather conditions, and time of loading and overloading• Shippers were generally complimentary concerning the attitude of the trucking firm, promptness of service, skills of the drivers, and quality of equipment furnished.
This study did not ,diT^ctly examine the profit margins of for-hire truckers of cattle and calves. It is possible to deduce, however, that these margins were not unreasonably high. If very large profits were available in the live- stock trucking industry, one would expect to find a large number of shippers supplying their own transportation. Such was not the case. Slightly less than one-fifth of the feedlots and nearly one-half of the handlers engaged in some private carriage. More importantly, slightly less than one-fifth of all cattle and calves shipped by truck i^ioved in shipper-controlled equipment.
It appeared that shippers considered unregulated for-hire truckers to be supplying the livestock industry with satisfactory service at reasonable prices.
27

APPENDIX UNITED STATES DEPARTMENT OF AGRICULTURE Statistical Reporting Service
0. M. B. Number 40.S73017 Approval Expires 12*31>73
Livestock Transportation Survey
LIVESTOCK HANDLER QUESTIONNAIRE
The Statistical Reporting Service is acting as the collecting agent for the Economic Research Service on this survey. The fuil authority of these agencies will be used to prevent disclosure of your identity or
individual answers to anyone outside these two agencies.
Firm Name
Person Contacted
Title
Address. Route or Street
City State Zip Code
Phone
Appointment made for:
Date :
Questionnaire Completed:
Enumerator —..__...«.
Date
Time Interview Began.
Time Interview Ended 28

-3- I. D. NUMBER
•>
1-5 6-1Í OHic«Us« 12-17
EXP. FACTOR 1B-23
1. Is this person or finn,. (Name on Face Page)
. currently doing business as:
a. SELLING ON COMMISSION (SeWng Commission Firms, YES NO Auction Markets, Market Agency Selling on Commission)? [^ - i |^ - 2 Enter Code
b. ORDER BUY ER (Buying on Commission)? D"' 1111-2 Enter Code
c. LIVESTOCK DEALER (Buying or Selling)? CZI-^ UJ ' ^ Enter Code
d. CLEARING HOUSE OR CLEARER? [U - i CD - 2 Enter Code
// ANY oí Items la, b, c, or d are checked YES, ask item 3,
if ALL oi Items la, b, c, or d are checked NO, ask item 2,
2. What does your firm's business consist of?
24-29
30-35
36-41
42-47
CONCLUDE THE INTERVIEW
3. How many of the following kinds of livestock did you or your firm PURCHASE or SELL during 1972?
a. Cattle and calves Head
b. Hogs and pigs. • • • •••••••• • ••.••• Heed
c. Sheep and lambs • • • • • • Heed
d. Other (Specify ) Heed
// NO cattle and calves reported, CONCLUDE THE INTERVIEW.
4. What oercent of the CATTLE and CALVES your firm PURCHASED or SOLD in 1972 were transported by:
a. Truck—rail combination? Percent
b. Truck only?« • •••••.•.••.•.•••• •.• Percent
c. Rail only? • •..•..• •... Percent
//100 percent by RAIL, CONCLUDE THE INTERVIEW.
48-53
54-Sd
60-65
66-71
72-77
6-11
T7=Tr
m

-4-
NoWi I Would like to ask about the cattle and calves you transport by TRUCK»
5. a. Did your ïïhn own JOI lease trucks equipmeitit (iticliiding lôâàeà ^iwner^operatof -equipment) used to haul cattle and calves PURCHASEÜ or SOLD durini 1972? (Exclude pickups) YES □-! NO [13-2Enter Code
// NO, skip to item 14,
18-23
b. How many of each of the following types of truck equipment used to haul cattle and cidves did your firm own or lease on September 30, 1972?
0^
Equipment Type Ownej Leased* Leased from Owner-Operators
Straight trucks
(Number) 24-29
(Number) 30-35
(Number) 36^41
l^lat bed livestock trailers - 1 deck 42-47 48U5â 54#:é9
60-65 66-71 72-77
Pot trailers
6-1 1 12^17 18-23
Cattle box and pull trailer
24-29 30d^3S 36-41
Double trailer 42-47 48-53 54-59
Tractors
60-65 66-71 72-77
♦ All equipment leased excluding leased from owner—operators,
6. During 1972, what percent of the trips made by your owned or leased trucks with cattle and calves on board fell into the following one—way distances?
LOAOEOMILES
m. 25 andiinder • • •. « • •, , • • ..«..••.« Percent
b. 26-50 ...v.v. .V. ...•.............'............. .Percent
c 51-100. .-....*.... v.V,....................V........... Percent
d. 181 ^ 299.. ........*..... .V... ...V........... ...,....,,......,,.,. Percent
e. 300 and over. •....••.••«••••••.••.•••.••...,•. ••••«...... Percent
7. What percent of thé cattle and calves PURCHASED or SOLD by your firm tluring 1W2 were carried dá trucks owned or leased by your firm? (Include leased owner^vperators) • • • • Percent
8. «. What percf^tage of the time do you make a transportation charge to the buyer or seller for cattle and calves hauled in your trucks?. • • Percent
// "0" percent, skip to item 9.
NK 6-11
12-17
18-23
24-29
90-as
100%
S6-41
42-47

- 5-
b. What was the usual one-way charge per unit made for each of the following distances?
UNIT CODE 1 - Head 2 - Hundredweight 3 - Full load 4 - Mile 5 - Other (Specify_
TRUCK TYPE CQÙ^ 1 - Straight truck 2 - Flat bed livestock trailers ~ 1 deck 3 - Flat bed livefetock trailers - 2 deck 4 - Pot trailer 5 - Cattle box and pull trailer 6 - Double trailer
One -Way Miles Amount Charged Unit Code Truck Type Code
25 and undet
•>
48-53 54-59 60-65
6-11 12-17 18-23
24-29 30-35 36-41
26-50
09
42-47 48-53 54-59
60-65 66-71 72-77
6-11 12-17 18-23
51 - 100
\
24-29 30-35 36-41
42-47 48-53 54-59
60-65 66-71 72-77
101 - 299 0^
6-11 12-17 18-23
24-29 30-35 36-41
42-47 48-53 54-59
300 and over 0^
60-65 66-71 72-77
6-11 12-17 18-23
24-29 P*
30-35 36-41
c. How did you arrive at charges reported above?
Enter d. Did the availability of BACKHAUL affect your usual rate? YES Q-l NO n-2 Code
If NO, skip to item 9,
e. How did the presence of BACKHAUL affect your rate?
42-47

-6-
9. Now, considering all the trips made by yoör owned or leased trucks during 1972:
a. What percent of the trips did you have a FOR-HIRE BACKHAUL? P«r6«nt
b. What percent of the trips did you BACKHAUL commodities used by YOUR FIRM?,... Percwt
48-53
54-59
. P«rc»nt c. Then, this makes (100% - (9a + 9b).................................. of the trips that your trucks BACKHAULED EMPTY. Is that right? YES □ NO □
//NO, pfo6e to make sure 9a + 9b -^90 = lö07o.
li 9c = lö07o, skip to item 12.
sk Item 10 ONLY if positive entry in Item 9a.
0. Now, let*s talk about the ____percent of your trips that you had FOR-HIRE BACKHAULS. (Item 9a)
a. Did you learn of the availability of these FOR-HIRE backhauls from a:
(1) Trucker? ....YESQ- i NO □ "> Enter Code
60-65
(2) Truck broker or dispatcher •
(3) Other fSpec/7y _____
66-71
......YEsQ-i NoQ-2 Enter Cod#
. J.... YES □ - i NO □ - 2 Enter Code
72-77
6-f 1
b. Did the availability of these FOR-HIRE backhauls in your firm's trucks differ among areas you haul to and from?
YEsQ-i NOO-2 Enter Code
'// YES, identify the areas that differ and state the reaaon.
12-17
m
c. What commodities made up your FOR-HIRE backhaul?
If livestock check: Check
(1) Cattie and calves..... □- l
(2) Hogs and pigs. ...•.••.. [~] - 2
(3) Sheep and Lambs*.•••..«••...•••••».. | |-3
(4) Other fSpeci/y ;.... ["1-4
Enter Code 18-23
Enter Code 24-29
Enter Code 30-35
Enter Code 36-41
//CATTLE AND CALVES checked, ask Items d and e. //CATTLE AND CALVES not checked, skip to Item 11.
-7-
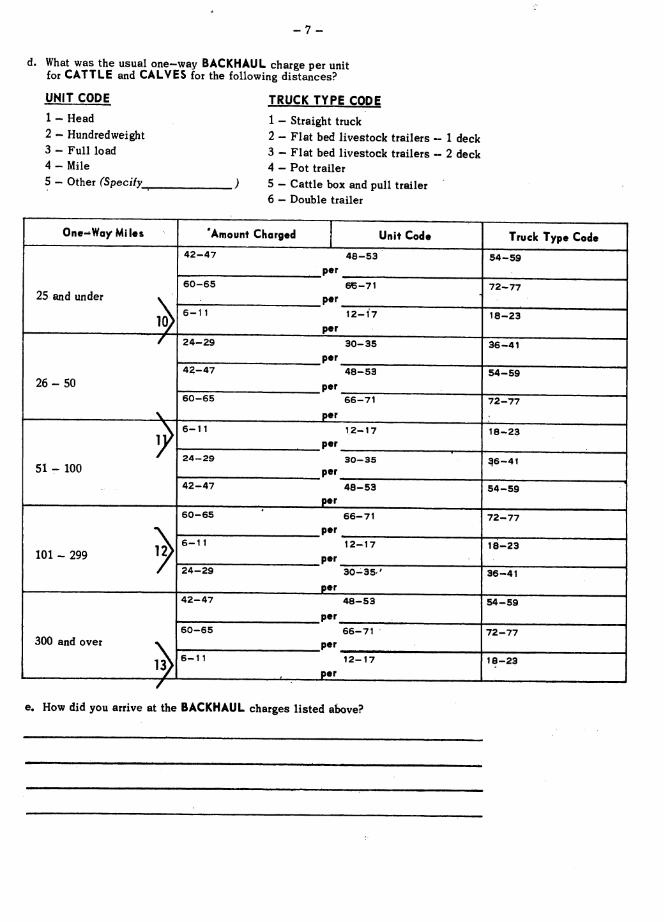
d. What was the usual one-way BACKHÁUL charge per unit for CATTLE and CALVES for the following distances?
UNIT CODE
1 - Head
2 — Hundredweight 3 - Full load 4 - Mile 5 - Other (Specify^
TRUCK TYPE CODE
1 — Straight truck 2 - Flat bed livestock trailers - 1 deck 3 - Flat bed livestock trailers - 2 deck 4 - Pot trailer 5 - Cattle box and pull trailer 6 — Double trailer
One-^Wa/Miles 'Amount Chorged Unit Code Truck Type Code
25 and under
->
42-47 48-53 per
54-59
60-65 66-71 per
72-77
6-11 12-17 per
18-23
26-50
\
24-29 30-35 per
36-41
4?-47 48-53 54-59
60-65 66-71 per
72-77
51 - 100 '}
6-11 12-17 per
18-23
24-29 30-35 per
46-41
42-47 48-53 per
54-59
101 - 299 )
60-65 66-71 per
72-77
6-lt 12-17 per
18-23
24-29 30-35' per
36-41
300 and over
^
42-47 48-53
per
54-59
60-65 66-71 per
72-77
6-11 12-17 per
18-23
/
e. How did you arrive at the BACKHAUL charges listed above?

-8-
Ask item 11 ONLY if positive entry in item 96.
11, Now, let's talk about the ..percent of your trips that you BACKHÀULED (item 9b)
commodities for YOUR OWN USE.
a. What commodities normally made up these BACK HAULS?
If livestock check: Check
(1) Cattle and calves .... □ - 1 inter Cod«
(2) Hogs and pigs □ - 2 Enter Code
(3) Sheep and lambs. 1111-3 Enter Code
(4) Other (Specify )..... [ZJ-^ Enter Code
12. Please rate the *'end-of-tripM condition of cattle and calves hauled in trucks owned or leased by your firm: (Include leased owner-operator trucks.)
CHECK ONE f , ,
Excellent ., □ - i
13. Why did your firm decide to supply transportation with owned or leased trucks (include leased owner-operators)?
24-29
30-35
36-41
42-47
b. Did the availability of BACKHAULS of commodities used by YOUR FIRM differ among areas you haul to and from?
48-53 YES [mi-i NO □ - 2 Enttff Code I
If YES, identify the areas that differed and state the reason.
Good... ,. n-a
Acceptable □ - 3 Enter Code
Fair n-4
Poor. □ - 5
54-59

-9-
14. Did your firm arrange for transportation of CATTLE and CALVES in FOR-HIRE trucks in 1972? • .YES □ - I NO □ - 2 Enter Code
If NO, skip to Item 17.
60-65
15. In 1972, did you use any of the following sources to arrange FUR-HI RE transportation?
// YES, what percent of your firm's CATTLE and CALVES were moved as a result of this contact?
YES
a. A truck broker or dispatcher. ••••••••. [^
b. A regularly hired trucker* • • • • • [^
c. Other truckers..* •••••••• ••••••••••• ¡^
d. Other sources (Specify _^^ ) •• □
NO
I I Percent
I I Percent
I I Percent
I I Percent
16. In 1972, were there some months in which the services of FOR-HIRE truckers were especially hard to obtain? YES Q - l NO □ - 2 Enter Code
//NO, skip to Item 17.
a. In what months did you find services of FOR-HIRE truckers especially hard to obtain? (Circle one or more month codes,)
01 — January 02 - February 03 - March 04 - April 05 - May 06-June
07 - July 08 - August 09 - September 10 - October 11 - November 12 - December
66-71
72-77
6-11
12-17
18-23
OFFICE USE 24-29 30-35
K.
17. In 1972, did you pay or record FOR-HIRE truck rates for cattle and calves PURCHASED or SOLD by your firm? YES □ - i NO □ - 2 Enter Code
// NO, who paid the transportation charges?
36-41
// NO, skip to item 19,

- 10 -
Now, I need some information about truck rates, length of haul and type of truck used for which you paid or recorded the »costs of hauling^attle and calves PURCHASED or SOLD by your firm.
Let's talk first about your most common haul in 1972, and then list other hauls.
18. TRIP LIST UNIT CODE
1 = Head 2 = Hundredweight 3 = Full load 4 = Mile 5 = Other (Specify -
')
a b c ê . • FROM
Town or point of origin
(Please Print)
TO
Town or point of destination
(Please Print)
Approx. One—Way
mileage
Miles
Usual Rote Paid
Dollars & Cents
Unit Cod*
Code 6-11 12-17 18-23 24-29 30-3S 36-41
1 Pet
2 Per
3 Pet
4 Per
5 P..r
6 Pet
7 Per
8 Per
9 Per
10 Per
Now, I would like to talk about weight and death losses of cattle and calves hauled by truck.
19. What factors contribute to cattle and calf weight loss in truck transit?

-11-
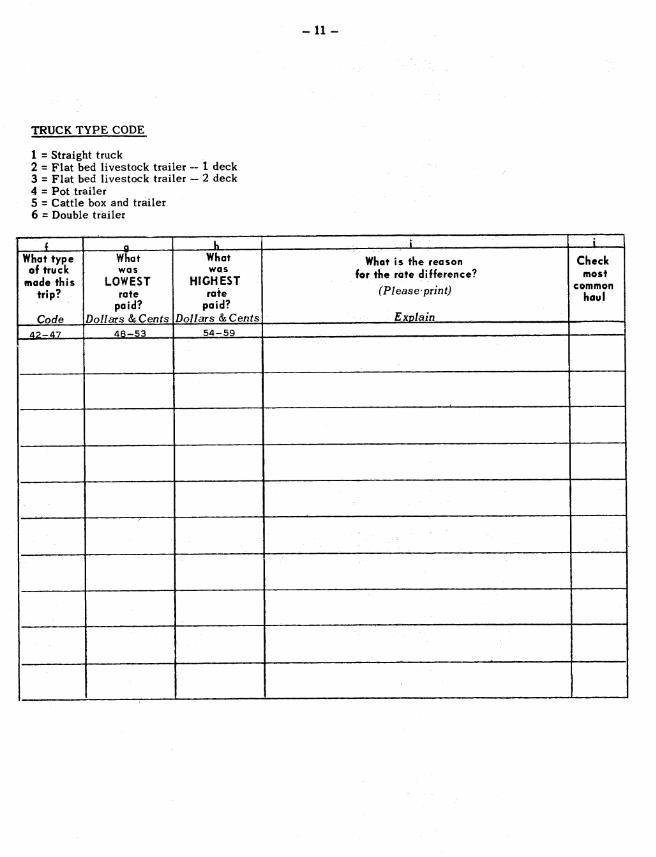
TRUCK TYPE CODE
1 = Straight truck 2 = Flat bed livestock trailer — 1 deck 3 = Flat bed livestock trailer - 2 deck 4 = Pot trailer 5 = Cattle box and trailer 6 = Double trailer
f 9 h i Î What type
of truck mode this
trip?
Code
What was
LOWEST rate
paid? Dollars & Cents
What was
HIGHEST rate
paid? Dollars as Cents
What is the reason for the rate difference?
ExDlain
Check most
common haul
42-47 48-53 54-59
'

- 12-
20. Considering your most common haul from to : (Checked in item 18)
a. What percent of your hauls experienced an above normal shrink percentage in truck transit? Percent
b. For these hauls, what was the shrink percent you considered to be above normal? Percent
21.. Of the total cattle and calves PURCHASED or SOLD by your firm, how many head did you lose in truck transit during 1972? Number
If'%*' skip to item 22.
a. What were the causes of these losses?
><I6/ 6- 11
12- -17
18- -23
b. Was compensation made for cattle and calves lost in truck transit?
YES □- 1 NO □ - 2 DON'T KNOW □»3 Enter Co'de
// NO or DON'T KNOW, skip to item 22.
24-29
c. Were these claims usually paid within:
30 DAYS OR LESS □ - 1 3Í DAYS OR MORE □ - 2 Enter Code
30-3S

- 13-
22. Were cattle and calves shipped for you by truck wotered during transit?
YES CIl-l NO □ - 2 Enter Code
// NO, skip to item 23.
Si, How many hours in truck transit can elapse before you require cattle to be watered? Hours
23. Please rate the "end-of-trip" condition of cattle and calves hauled in FOK-HIRE trucks during 1972.
Check ONE
Excellent I I - i
Good I I- 2
Acceptable [111-3 Enter Code
Fair .'. I I- 4
Poor. I I- 5
24. Do you consider the service of FOR-HIRE cattle truckers you use satisfactory or unsatisfactory?
SATISFACTORY □ - 1 UNSATISFACTORY □ - 2 Enter Code
a. What factors make this service ? (satisfactory or unsatisfactory)
36-41
42-47
48-53
54-59

-15-
25. In order to conduct another phase of this transportation survey at a later time, it is necessary to compile a list of FOR-HIRE truckers.
Please give me the name and address of FOR-HIRi truckers who carried livestock for your firm in 1972.
Name (Please Print) Complete Mailing Address Telephone •
■

UNITED STATES DEPARTMENT OF AGRICULTURE Statistical Reporting Service'
0. M. B. Number 40.S73017 Approval Expires 12-31*73
Livestock Transportation Survey
CATTLE FEEDER QUESTIONNAIRE
Firm Name
Person Contccted ,
Title
Address . Route OT Street
City
Phone
State Zip Code
Appointment made for:
Date
Ti ime.
Questionnaire Completed:
Enumerator
Dote
Time Interview Began .
Time Interview Ended

o. M. B. Number 40-S73017 Appro vat Expires 12-3T-73
-3- I. D, NUMBER
01 t-5
Office Us 6-11 12-17
18-23
EXP, FACTOR
LIVESTOCK TRANSPORTATION SURVEY
Catfle Feeder Questionnaire
1. How many cattle and calves were marketed from your feedlot in 1972?
a. Cattle and calves. . Head
24-29
// "0'* cattle and calves reported, CONCLUDE THE INTERVIEW,
2. What percent of the CATTLE and CALVES coming into your feedlot in 1972 were transported by:
a. Truck—rail combination? ..•»....•. •,•..•....•.. t ...• # •Percent
b. Truck only?. • .........,..••...••...•.•...•. •....Percent
c. Rail only? •....••.......» ..•..•. Percent
3, What percent of the CATTLE and CALVES marketed from your feedlot in 1972 were transported by:
a. Truck—rail combination?. .........•............•...•.•••.• • • • • .Percent
b. Truck only? Percent
c. Rail only? Percent
// 100 percent by RAIL only for Items 2 and 3, CONCLUDE THE INTERVIEW,
30-35
36-41
42-47
48-53
54-59
60-65
-4-
Now, I would like to ask about the cattle-and calves you transport by TRUCK.
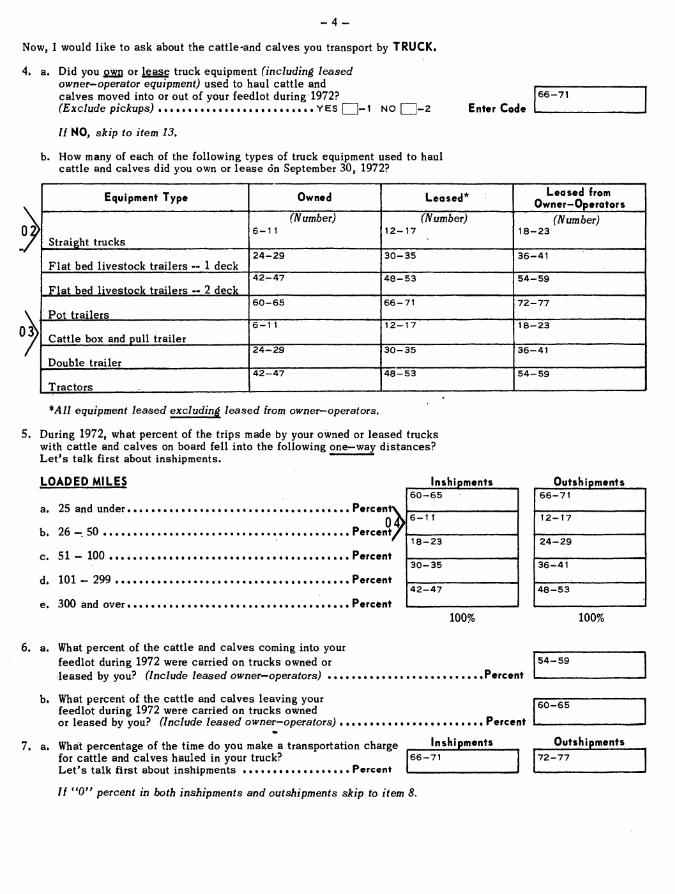
4. a. Did you own or lease truck equipment (including leased owner—operator equipment) used to haul cattle and calves moved into or out of your feedlot during 1972? (Exclude pickups) •. • • YES | |--i NO | \-2
If NO, skip to item 13.
b. How many of each of the following types of truck equipment used to haul cattle and calves did you own or lease on September 30, 1972?
Enter Code 66-71
Equipment Type Owned Leased"^ Leased from Owner-Operators
Straight trucks
(Number) 6-1 1
(Number) 12-17
(Number) 18-23
Flat bed livestock trailers — 1 deck 24-29 30-35 36-41
Flat bed livestock trailers -- 2 deck 42-47 48-53 54-59
Pot trailers 60-65 66-71 72-77
Cattle box and pull trailer 6-11 12-17 18-23
Double trailer 24-29 30-35 36-41
Tractors 42-47 48-53 54-59
*Ail equipment leased excluding leased from owner—operators.
During 1972, what percent of the trips made by your owned or leased trucks with cattle and calves on board fell into the following one—way distances? Let's talk first about inshipments.
LOADED MILES
a, . 25 and under•• •••••••••••••••••••••• Percen'
b. 26 -. 50 •. • Percent
c. 51-100 • Percent
d. 101-299 Percent
e. 300 and over • ••••.••••••• Percent
Inshipments 60-65
6-1 1
18-23
30-35
42-47
100%
Outshipments 66-71
12-17
24-29
36-41
48-53
100%
a. What percent of the cattle and calves coming into your feedlot during 1972 were carried on trucks owned or leased by you? (Include leased owner-^operators) •«••.•*•••. • Percent
b. What percent of the cattle and calves leaving your feedlot during 1972 were carried on trucks owned or leased by you? (Include leased owner—operators) • • • • • • • Percent
7. a. What percentage of the time do you make a transportation charge for cattle and calves hauled in your truck? Let's talk first about inshipments . Percent
Inshipments 66-71
54-59
60-65
Outshipments 72-77
// "0" percent in both inshipments and outshipments skip to item 8.

-5-
bo What was the usual one—way charge per unit made for each of the following distances? First, let's talk about inshipmentSo UNIT COPE 1 - Head 2 — Hundredweight 3 - Full load 4 - Mile 5 — Other (Specify^
TRUCK TYPE CODE 1 - Straight truck 2 — Fiat bed livestock trailers -- 1 deck 3 - Flat-bed livestock trailers ~ 2 deck 4 — Pot trailer 5 — Cattle box and pull trailer 6 — Double trailer
One -Way Miles
6-1 1
25 and under 36-41
26-50 6-1 1
36-41
6-1 1
51 - 100
Amount Charged Unit Code
12-17 per
42-47 per
6-1 1 12-Î7 per
36-41 42-/17 per
12-17 per
42-47 per
12-17 per
36-41 42-47 per
6-1 1 12-17 per
Shipped In
18-23 1
48-53 1
18-23 1
48-53 1
18-23 1
48-53 1
18-23 1
48-53 1
18-23 1
Out 24-29
1 54-59
1 24-29
1 54-59
1 24-29
1 54-59
1 24-29
1 54-59
1 24-29
1
Truck Type Code
30-35
60-65
30-3F
60-65
30-35
60-65
30-35
60-65
30-35
36-41 42-47
101 - 299 per
6-11 12-17 per
36-41 42-47
48-53
. 1 54-59
1 60-65
18-23 1
24-29 1
30-35
48-53 1
54-59 1
60-65
6-1 1 12-17
300 and over 36-41 per
42-47 per
6-11 12-17 per
18-23 24-29
1 30-35
48-53 1
54-59 1
60-65
18-23 1
24-29 1
30-35
c. How did you arrive at charges reported above?
Enter d. Did the availability of BÂCKHAUL affect your usual rate? YES | 1^1 NO □-2 Code
If NO, skip to item 8,
e. How did the presence of BACKHAUL affect your rate?
36-41

-6-
8. Now, considering all the trips made both for inshipments and outshipments by your owned or leased trucks during 1972:
a. What percent of the trips did you have a FOR-HIRE BACKHAUL? Percent
b. What percent of the trips did you BACKHAUL commodities used by YOU? Percent
c. Then, this makes (100% - (8a + 8b). Percent of the trips that your trucks BACKHAULED EMPTY, Is that right? YES □ NO n
// NO, probe to make sure 8a + 8b -\- Sc = 100%.
If 8c = i007o, skip to item 11,
42-47
48-53
54-59
Ask Item 9 ONLY if positive entry in Item 8a.
9. Now, let's talk about the percent of your trips that you had FOR-HIRE BACKHAULS. (Item 8a)
a. Did you learn of the availability of these FOR-HIRE backhauls from a:
(1) Trucker? YES □ - i NO | |- 2
(2) Truck broker or dispatcher.
(3) Other rSpeci/y
YES □ - 1 NO [ 1-2
.;.... YES □ - 1 NO [ 1-2
b. Did the availability of these FOR-HIRE backhauls in your trucks differ among areas you haul to and from?
YESQ- 1 NOn-2
//YES, identify the areas that differ and state the reason.
Enter Code
Enter Code
Enter Code
Enter Code
60-65
66-71
72-77
NIK 6-11
c. What commodities made up your FOR-HIRE backhaul?
If livestock check: Check
(1) Cattle and calves.. • • • [^ - i
(2) Hogs and pigs • •••••••••• [^ . 2
(3) Sheep and Lambs ...• | | - 3
(4) Other rSpecj/y ;.... CJ'^
Enter Code
12-17
Enter Code
18-23
Enter Code
24-29
Enter Code 30-35
// CATTLE AND CALVES checked, ask Items d and e. // CATTLE AND CALVES not checked, skip to Item 10,

-7-
d. What was the usual one—way BÁCKHAUL charge per unit fof CATTLE and CALVES for the following distances?
UNIT CODE
1 - Head 2 — Hundredweight 3 « Full load 4 - Mile 5 - Other (Specify^
TRUCK TYPE CODE
1 - Straight truck 2 — Flat bed livestock trailers -- 1 deck 3 - Flat bed livestock trailers — 2 deck 4 - Pot trailer 5 — Cattle box and pull trailer 6 — Double trailer
One-Way Miles Amount Charged Unit Code Truck Type Code
25 and under
,\
36-41 42-47
per
48-53
54-59 60-65
per
66-71
6-Î1 12-17
per
18-23
26-50
\
24-29 30-35
per
36-41
42-47 48-53
per
54-59
60-65 66-71
per
72-77
51 - 100 '>
S-11 12-17
per
18-23
24-29 30-35
per
36-41
42-47 48-53
per
54-59
101 - 299 )
60-65 66-71
per
72-77
6-1 1 12-17
per
18-23
24-29 30-35
per
36-41
300 and over
i>
42-47 48-53
per
54-59
60-65 66-71
per
72-77
6-11 12-17
per
18-23
/
e. How did you arrive at the BACKHAUL charges listed above?

-8-
Ask item 10 ONLY if positive entry in item Sb,
10, Now, let's talk about the percent of your trips that you BACKHAULED (item 8b)
commodities for YOUR OWN USE.
a. What commodities normally made up these BACKHAULS?
If livestock check: Check
(1) Cattle and calves [ | - 1
(2) Hogs and pigs □ - 2
(3) Sheep and lambs., □ - 3
(4) Other (Specify ) □ - 4
Enter Code 24-29
Enter Code 30-35
Enter Code 36-41
Enter Code 42-47
b. Did the availability of BACKHAULS of commodities used by YOU differ among areas you haul to and from?
YES □-! NO □-2 Enter Code
If YES, identify the areas that differed and state the reason.
48-53
11. Please rate the "end-of-trip" condition of cattle and calves hauled in trucks owned or leased by you: (Include leased owner-operator trucks.)
CHECK ONE
Excellent | |- i
Good [ I - 2
Acceptable □ - 3 Enter Code
Fair [ 1-4
Poor I 1-5
12. Why did you decide to supply transportation with owned or leased trucks (include leased owner-operators)?
54-59

-9-
13a Did you arrange for transportation of CATTLE and CALVES in FOR-HIRE trucks in 1972? YES □ - I NO Q - 2 Enter Code
if NO, skip to Item 16.
60-85
14o In 1972, did you use any of the following sources to arrange FOR-HIRE transportation?
// YES, what percent of this feedlot's CATTLE and CALVES were moved as a result oí this contact?
YES
a. A truck broker or dispatcher... • -. Q
b. A regularly hired trucker, •••••.•j.*... □
c. Other truckers. ••• •« •.... [[]]]
d. Other sources (Specify^ ,,^.^, ) -. Q
NO
I I ••«••,•••« •..Percent
j I Percent
I I .Percent
r~1 Percent
66-71
72-77
6-11
12-17
15. In 1972, were there some months in which the services of FOR-HIRE truckers were especially hard to obtain? YES □ " ^ NO □ - 2 Enter Cede
//NO, skip to Item 16.
a. In what months did you find services of FOR-HIRE truckers especially hard to obtain? (Circle one or more month codes,)
18-23
01 — January 02 - February 03 - March 04 - April 05 - May 06 - June
07 - July 08 - August 09 - September 10 - October 11 — November 12 — December
OFFICE USE
16. In 1972, did you pay FOR-HIRE truck rates for cattle and calves?
// NO, who paid the transportation charges?
YES □ - 1 NO □ - 2 Enter Code
36-41
24-29 30-35
// NO, skip to item 18.

-10-
Now, I need some information about truck rates, length of haul and type of truck used for which you paid the costs of hauling cattle and calves coming in or going out of your feedlot.
Let's talk first about the most common haul you paid charges for in 1972, and then list other hauls»
17. TRIP LIST UNIT CODE
1 = Head 2 = Hundredweight 3 = Full load 4 = Mile 5 = Other (Specify -
■>
a b c d e
FROM Town or point of origin
_ (Please nrint)
TO Town or point of destination
(Please mint)
Approx. One-Way mileage
Miles
Usual Rate Paid
Dollars & Cents
Unit Code
Code ç-n 12-17 18-23 24-29 ^ 30-35 36-41
1 Per
2 Per
3 Per
4 Per
5 Pi^r
ê Per
7 Per
8 Pftr
9 Per
10 Per
Now, I would like to talk about weight and death losses of cattle and calves hauled by truck.
18. What factors contribute to cattle and calf weight loss in truck transit?
-11-
TRUCK TYPE CODE
1 = Straight truck 2 = Flat bed livestock trailer — 1 deck 3 = Flat bed iivestock trailer — 2 deck 4 = Pot trailer 5 = Cattle box and trailer 6 = Double trailer
( a h I L . .- What type
of truck made this
trip?
Code
What was
LOWEST rate
paid? Dollars an Cents
What was
HIGHEST rate
paid? Dollars & Cents
What is the reason lor the rate difference?
(Please-print)
Exviain
Check most
common haul
42-47 46-53 54-59
_

-12-
19o Considering your most common haul from to : (Checked in item 17)
a. What percent of your hauls experienced an above normal shrink percentage in truck transit?
.20
b. For these hauls, what was the shrink percent you considered to be above normal?
20, How^any head of cattle and calves did you lose in truck transit during 1972? o o ». o » ». » o o o o o » o ». c o «
//"O," skip to item 21.
a. What were the causes of these losses?
FAT CATTLE
FEEDER CATTLE
Percent 6-1t 1î»-17
Percent 18-23 24-29
Number 30-35
b. Was compensation made for cattle and calves lost in truck transit?
YES □- 1 NO □ - 2 DON'T KNOW □-3 Enter Code
36-41
// NO or DON'T KNOW, skip to Item 21.
c. Were these claims usually paid within:
30 DAYS OR LESS □ - 1 31 DAYS OR MORE □ - 2 Enter Code 42-47

-13-
21. Were cattle and calves shipped for you by truck wotered during transit?
YES □ - 1 NO □ - 2 Enter Code
// /VO, skip to item 22,
a. How many hours in truck tr ansit can elapse before you require cattle to be watered? * Hours
22c Please rate the "end-of-trip" condition of cattle and calves hauled in FOR-HIRE trucks during 1972.
Check ONE
Excellent Fl - i
Good □ - 2
Acceptable CZJ-^ E"**' ^*>*'«
Fair IZl-^
Poor □ - S
23- Do you consider the service of FOR-HIRE cattle truckers you use satisfactory or unsatisfactory?
SATISFACTORY □-! UNSATISFACTORY [Z] ' ^ Enter Code
â. What factors make this service ? (satisfactory or unsatisfactory)
48-53
54-59
60-65
66-71

- 15-^
24, In order to conduct another phase of this transportation survey at a later time, it is necessary to compile a list of FOR-HIRE truckers.
Please give me the name and address of FOR-HIRE truckers who carried livestock for you in 1972«
Name (Please print) Complete Mailing Address Telephone