livestock & meat market outlook - · pdf filelivestock & meat market outlook glynn...
TRANSCRIPT

Livestock & Meat Market Outlook
Glynn TonsorDept. of Agricultural Economics
Kansas State University
Agricultural Lenders ConferenceOctober 12-13, 2010
1

OVERVIEW• SUPPLY:
– Historically tight supplies• Shrinking cow herd, low cold storage stocks,…
• DEMAND: – Export demand has been strong– Domestic demand more volatile & worrisome
• FEEDS:– Excellent pastures; volatile grain prices
• MACROECONOMIC PRESSURES – Growing in relevance…
2

BEEF IN COLD STORAGEEnd of the Month
340
360
380
400
420
440
460
480
500
JAN MAR MAY JUL SEP NOV
Mil. Pounds
Avg.2004-08
2009
2010
M-S-0909/22/10
Livestock Marketing Information CenterData Source: USDA/NASS

What is driving cow herd dynamics?
• Excellent Pasture Conditions &• Expected Profits = EXPANSION (typically)
• Are cow-calf producers cash strapped??? • Is the age of operators at hand and
retirement decisions at play???

US RANGE AND PASTURE CONDITIONPercent Poor and Very Poor, Weekly
5
10
15
20
25
30
35
40
May Jul Sep
Percent
Avg.2004-082009
2010
G-NP-3010/04/10
Data Source: USDA-NASS, Compiled by LMIC

GREAT PLAINS REGIONRANGE AND PASTURE CONDITION
Percent Poor and Very Poor, Weekly
0
5
10
15
20
25
30
35
May Jul Sep
Percent
Avg.2004-082009
2010
G-NP-3210/04/10
Data Source: USDA-NASS, Compiled by LMIC

SOUTHEAST REGIONRANGE AND PASTURE CONDITION
Percent Poor and Very Poor, Weekly
0
10
20
30
40
50
60
May Jul Sep
Percent
Avg.2004-082009
2010
G-NP-3610/04/10
Data Source: USDA-NASS, Compiled by LMIC

CALF CROPJuly 1 Estimates, U.S., Annual
35
37
39
41
43
45
1980 1983 1986 1989 1992 1995 1998 2001 2004 2007 2010
Mil. Head
C-N-18B07/23/10
-1.2 Percent2010 = 35.4 Million Head
Livestock Marketing Information CenterData Source: USDA/NASS
8

HEIFERS HELD AS BEEF COW REPLACEMENTS
July 1, U.S.
3
4
5
6
7
1980 1983 1986 1989 1992 1995 1998 2001 2004 2007 2010
Mil. Head
C-N-3707/23/10
-2.2 %
Livestock Marketing Information CenterData Source: USDA/NASS
9

BEEF COW SLAUGHTERFederally Inspected, Weekly
4045505560657075808590
JAN
APRJU
LOCT
Thou. Head
Avg.2004-08
2009
2010
C-S-3410/01/10Data Source: USDA-NASS, Compiled by LMIC

STEER DRESSED WEIGHTFederally Inspected, Weekly
780790800810820830840850860870880
JAN
APRJU
LOCT
Pounds
Avg.2004-08
2009
2010
C-S-1810/01/10Data Source: USDA-NASS, Compiled by LMIC
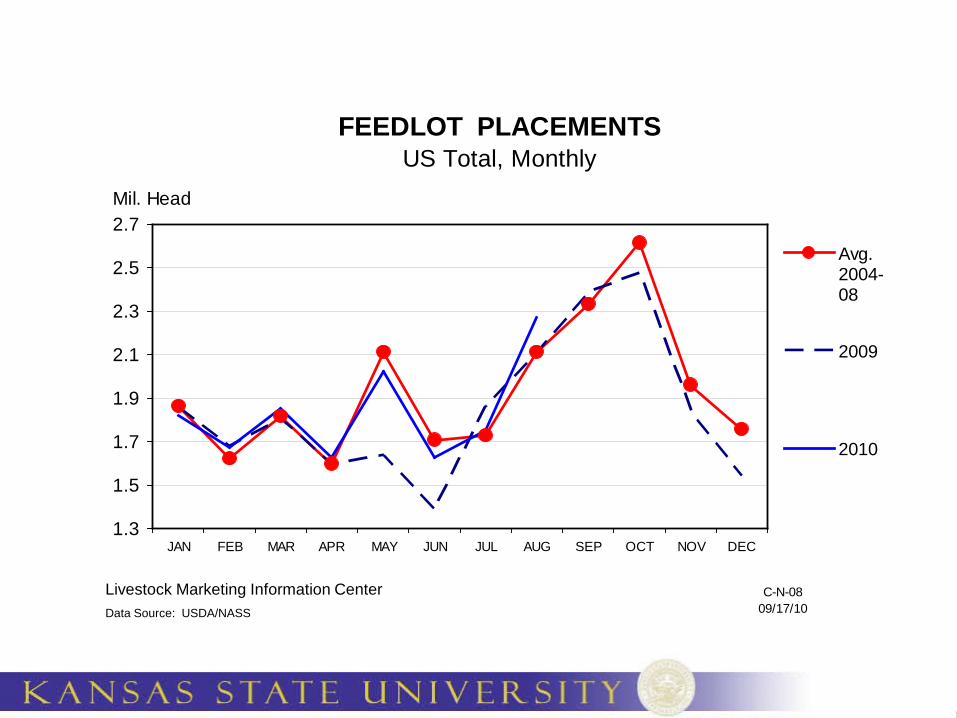
FEEDLOT PLACEMENTSUS Total, Monthly
1.3
1.5
1.7
1.9
2.1
2.3
2.5
2.7
JAN FEB MAR APR MAY JUN JUL AUG SEP OCT NOV DEC
Mil. Head
Avg.2004-08
2009
2010
C-N-0809/17/10
Livestock Marketing Information CenterData Source: USDA/NASS

U S BEEF AND VEAL EXPORTSCarcass Weight, Monthly
507090
110130150170190210230
JAN FEB MAR APR MAY JUN JUL AUG SEP OCT NOV DEC
Mil. Pounds
Avg.2004-08
2009
2010
I-N-1609/10/10Data Source: USDA-ERS & USDA-FAS, Compiled by LMIC

U S BEEF EXPORTS TO MAJOR MARKETSCarcass Weight, Monthly
0102030405060708090
100
2002 2003 2004 2005 2006 2007 2008 2009 2010
Mil. Pounds
Japan
Canada
Mexico
SouthKorea
I-N-3509/10/10Data Source: USDA-ERS & USDA-FAS, Compiled by LMIC

U S BEEF AND VEAL EXPORTSAs a Percentage of Production, Carcass Weight, Annual
0
2
4
6
8
10
1986 1989 1992 1995 1998 2001 2004 2007 2010
Percent
I-N-0709/24/10Data Source: USDA-ERS & FAS; Compiled & Forecasts by LMIC

NATIONAL RESTAURANT NEWS STOCK MARKET INDEX
Weekly
800
900
1000
1100
1200
1300
1400
1500
1600
JAN
APRJU
LOCT
Value
Avg.2004-08
2009
2010
Data Source: National Restaurant News; Compiled by LMIC10/06/10

Source: Fed. Reserve Bank, St. Louis http://research.stlouisfed.org/fred2/graph/?id=UMCSENT#

Livestock Marketing Information Center
U S RED MEAT & POULTRY CONSUMPTIONPer Capita, Retail Weight, Annual
0102030405060708090
100
1986 1989 1992 1995 1998 2001 2004 2007 2010
Pounds
Beef
Pork
TotalChicken
Turkey
M-C-1009/24/10

10097
91
87 8784
8177 78
81 80 8184 83
9188
85 8581
77
0
10
20
30
40
50
60
70
80
90
100
1990
1991
1992
1993
1994
1995
1996
1997
1998
1999
2000
2001
2002
2003
2004
2005
2006
2007
2008
2009
Dem
and
Inde
x (1
990=
100)
Year
Annual, All Fresh Beef Demand Index (1990=100)
Source: Glynn T. Tonsor, Kansas State University, Sept. 2010

100
95 94
86 8783
85
75 77 7680 80
83 83
9187
85 8482 82
74
0
10
20
30
40
50
60
70
80
90
100
1990
1991
1992
1993
1994
1995
1996
1997
1998
1999
2000
2001
2002
2003
2004
2005
2006
2007
2008
2009
2010
Dem
and
Inde
x (1
990=
100)
Year
1st Quarter (Jan-Mar), All Fresh Beef Demand Index (1990=100)
Source: Glynn T. Tonsor, Kansas State University, Sept. 2010
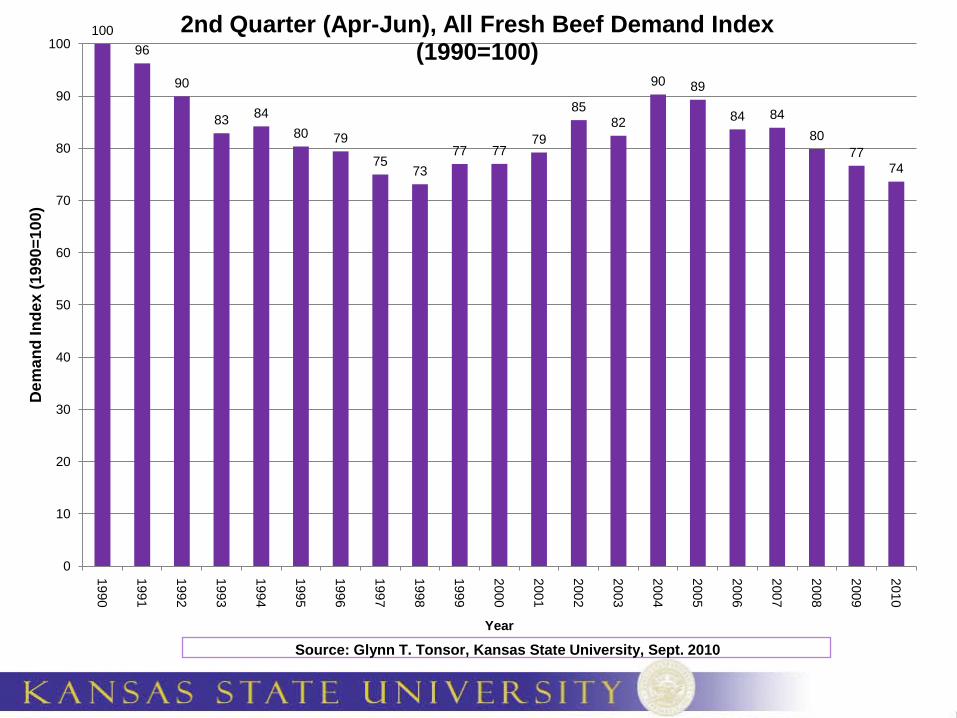
10096
90
83 8480 79
7573
77 7779
8582
90 89
84 8480
7774
0
10
20
30
40
50
60
70
80
90
100
1990
1991
1992
1993
1994
1995
1996
1997
1998
1999
2000
2001
2002
2003
2004
2005
2006
2007
2008
2009
2010
Dem
and
Inde
x (1
990=
100)
Year
2nd Quarter (Apr-Jun), All Fresh Beef Demand Index (1990=100)
Source: Glynn T. Tonsor, Kansas State University, Sept. 2010

MED. & LRG. #1 STEER CALF PRICES400-500 Pounds, Southern Plains, Weekly
105
110
115
120
125
130
135
140
145
JAN APR JUL OCT
$ Per Cwt.
Avg.2004-08
2009
2010
C-P-49A10/04/10Data Source: USDA-AMS, Compiled by LMIC

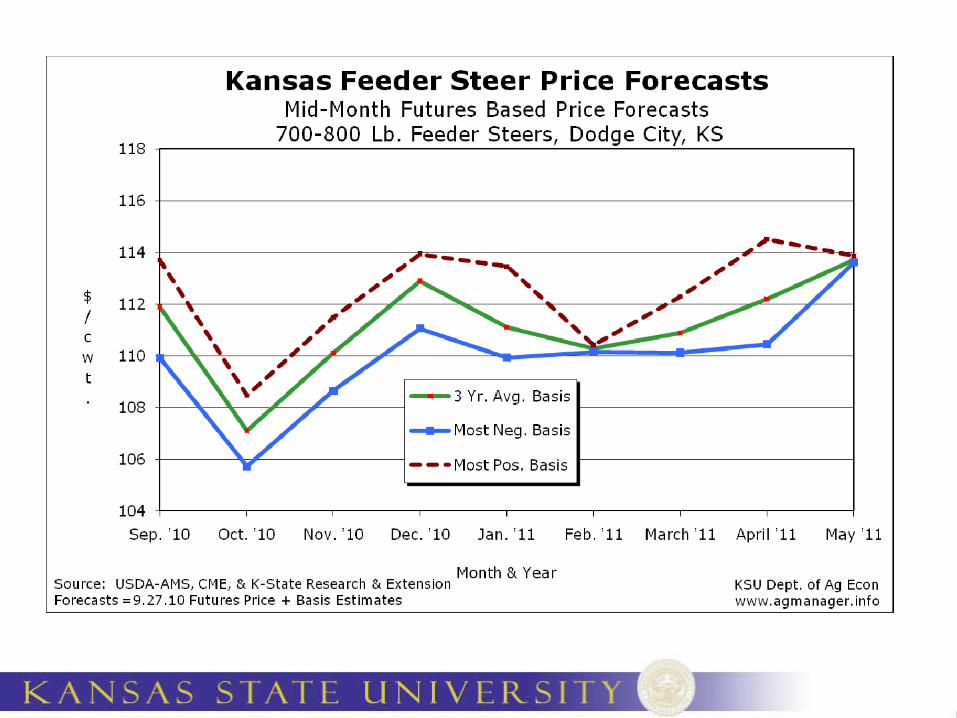
MED. & LRG. #1 FEEDER STEER PRICES700-800 Pounds, Southern Plains, Weekly
85
90
95
100
105
110
115
120
JAN APR JUL OCT
$ Per Cwt.
Avg.2004-08
2009
2010
C-P-4910/04/10Data Source: USDA-AMS, Compiled by LMIC

SLAUGHTER STEER PRICESSouthern Plains, Weekly
77
82
87
92
97
102
JAN APR JUL OCT
$ Per Cwt.
Avg.2004-08
2009
2010
C-P-5210/04/10Data Source: USDA-AMS, Compiled by LMIC

Livestock Marketing Information Center
AVERAGE RETURNS TO CATTLE FEEDERSFeeding 725 Lb. Steers, S. Plains, Monthly
-250
-150
-50
50
150
250
2001 2002 2003 2004 2005 2006 2007 2008 2009 2010
$ Per Head
C-P-2209/17/10
Latest Data: August 2010

Livestock Marketing Information Center
ESTIMATED AVERAGE COW CALF RETURNSReturns Over Cash Cost (Includes Pasture Rent), Annual
-100
-50
0
50
100
150
1982 1984 1986 1988 1990 1992 1994 1996 1998 2000 2002 2004 2006 2008 2010
$ Per Cow
C-P-6608/30/10

Livestock Marketing Information Center
C-P-6008/30/10
BUY/SELL MARGINSS. Plains, Mar. 7-800 lb. Steer as % of Nov. 5-600 lb.
Steer
75
80
85
90
95
100
105
110
1991 1993 1995 1997 1999 2001 2003 2005 2007 2009
Percent
1991-2010 Average
Livestock Marketing Information Center
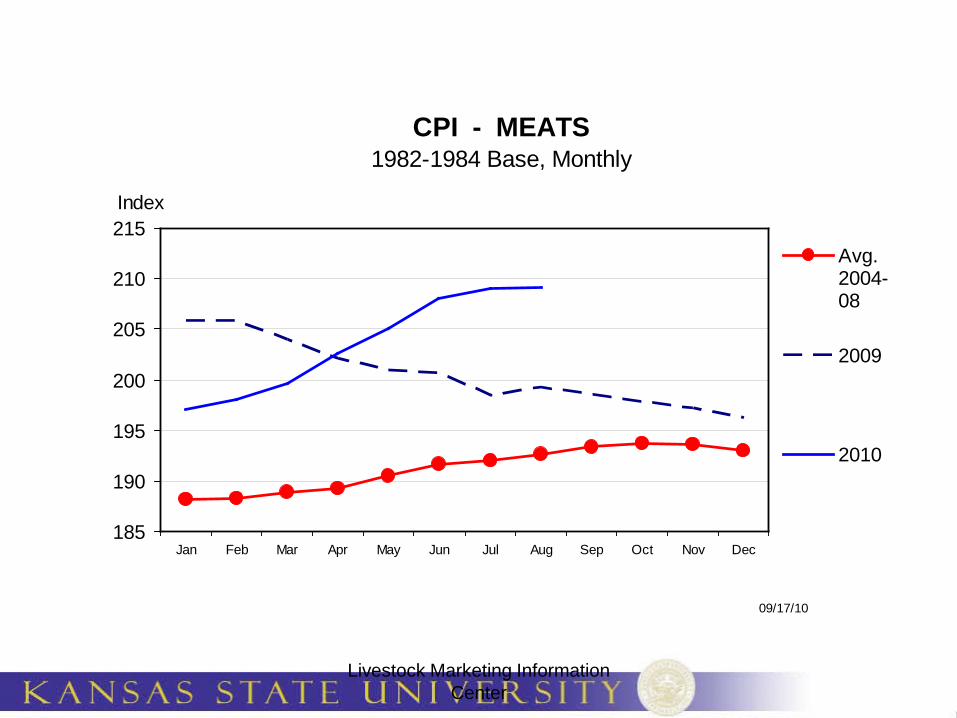
CPI - MEATS1982-1984 Base, Monthly
185
190
195
200
205
210
215
Jan Feb Mar Apr May Jun Jul Aug Sep Oct Nov Dec
Index
Avg.2004-08
2009
2010
09/17/10

RETAIL BEEF PRICEChoice, Monthly
395
405
415
425
435
445
455
JAN MAR MAY JUL SEP NOV
Cents Per Pound
Avg.2003-07
2008
2009
M-P-0909/17/10Data Source: BLS & USDA-ERS, Compiled by LMIC

Livestock Marketing Information Center
CONSUMER PRICE INDEX - ALL ITEMS1982-1984 Base, Monthly
190
195
200
205
210
215
220
225
Jan Feb Mar Apr May Jun Jul Aug Sep Oct Nov Dec
Index
Avg.2004-08
2009
2010
09/17/10

SOUTHERN PLAINS CORN PRICESWeekly
2.75
3.25
3.75
4.25
4.75
5.25
JAN
APRJU
LOCT
$ Per Bu.
Avg.2004-08
2009
2010
G-P-0410/07/10Data Source: USDA-AMS, Compiled by LMIC
Corn Futures 10/11 (10 am CST) • Dec (10’): 5.68; Dec (11’): 5.27; Dec (12’): 5.09
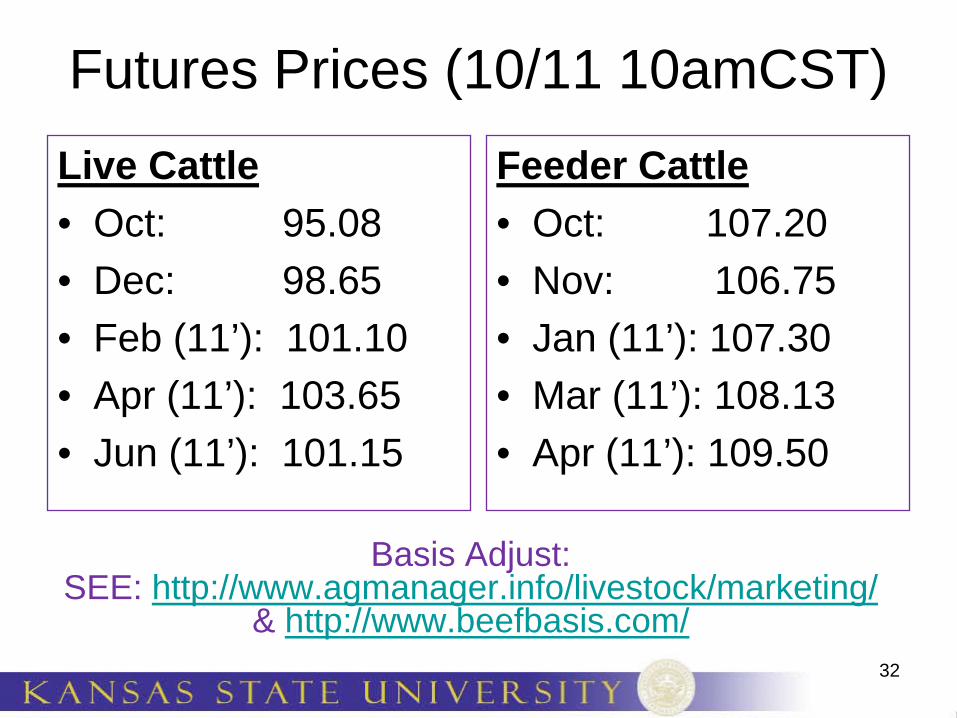
Futures Prices (10/11 10amCST)Live Cattle • Oct: 95.08• Dec: 98.65• Feb (11’): 101.10• Apr (11’): 103.65• Jun (11’): 101.15
Feeder Cattle • Oct: 107.20• Nov: 106.75• Jan (11’): 107.30• Mar (11’): 108.13• Apr (11’): 109.50
32
Basis Adjust: SEE: http://www.agmanager.info/livestock/marketing/
& http://www.beefbasis.com/


QUARTERLY CATTLE & BEEF FORECASTS (LMIC: 9/28)
35
% Chg. Average % Chg. Comm'l % Chg.Year Comm'l from Dressed from Beef fromQuarter Slaughter Year Ago Weight Year Ago Production Year Ago
2010I 8,167.50 2.40 765.34 (2.30) 6,250.90 0.05 II 8,683.00 0.93 754.20 (1.71) 6,548.70 (0.80) III 8,943.42 4.99 753.29 (4.08) 6,737.00 0.71 IV 8,176.58 (0.78) 779.42 (0.05) 6,373.00 (0.83) Year 33,970.50 1.90 762.71 (2.07) 25,909.60 (0.21)
2011I 8,046.60 (1.48) 778.47 1.72 6,264.00 0.21 II 8,347.36 (3.87) 764.07 1.31 6,378.00 (2.61) III 8,490.37 (5.07) 780.65 3.63 6,628.00 (1.62) IV 7,813.93 (4.44) 783.86 0.57 6,125.00 (3.89) Year 32,698.26 (3.75) 776.65 1.83 25,395.00 (1.99)
2012I 7,877.51 (2.10) 786.16 0.99 6,193.00 (1.13) II 7,939.83 (4.88) 770.67 0.86 6,119.00 (4.06) III 8,100.96 (4.59) 788.55 1.01 6,388.00 (3.62) IV 7,626.19 (2.40) 789.91 0.77 6,024.00 (1.65) Year 31,544.49 (3.53) 783.78 0.92 24,724.00 (2.64)
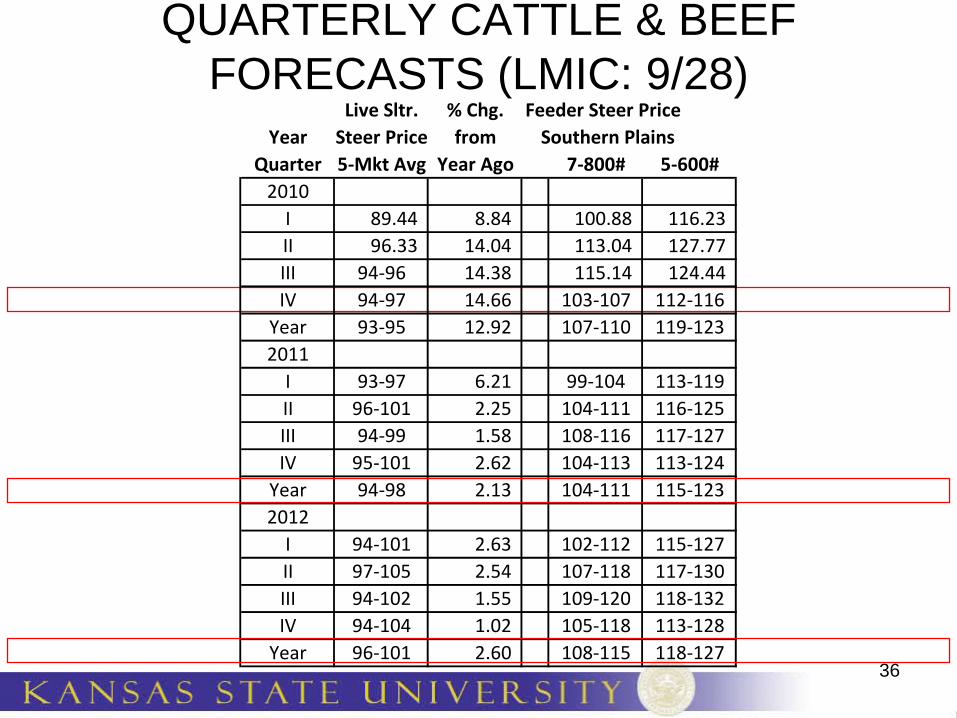
QUARTERLY CATTLE & BEEF FORECASTS (LMIC: 9/28)
36
Live Sltr. % Chg. Feeder Steer PriceYear Steer Price from Southern Plains
Quarter 5-Mkt Avg Year Ago 7-800# 5-600#2010
I 89.44 8.84 100.88 116.23 II 96.33 14.04 113.04 127.77 III 94-96 14.38 115.14 124.44 IV 94-97 14.66 103-107 112-116
Year 93-95 12.92 107-110 119-1232011
I 93-97 6.21 99-104 113-119II 96-101 2.25 104-111 116-125III 94-99 1.58 108-116 117-127IV 95-101 2.62 104-113 113-124
Year 94-98 2.13 104-111 115-1232012
I 94-101 2.63 102-112 115-127II 97-105 2.54 107-118 117-130III 94-102 1.55 109-120 118-132IV 94-104 1.02 105-118 113-128
Year 96-101 2.60 108-115 118-127

Livestock Marketing Information Center
C-P-6008/30/10
BUY/SELL MARGINSS. Plains, Mar. 7-800 lb. Steer as % of Nov. 5-600 lb.
Steer
75
80
85
90
95
100
105
110
1991 1993 1995 1997 1999 2001 2003 2005 2007 2009
Percent
1991-2010 Average
C-P-6008/30/10
BUY/SELL MARGINSS. Plains, Mar. 7-800 lb. Steer as % of Nov. 5-600 lb.
Steer
75
80
85
90
95
100
105
110
1991 1993 1995 1997 1999 2001 2003 2005 2007 2009
Percent
1991-2010 Average
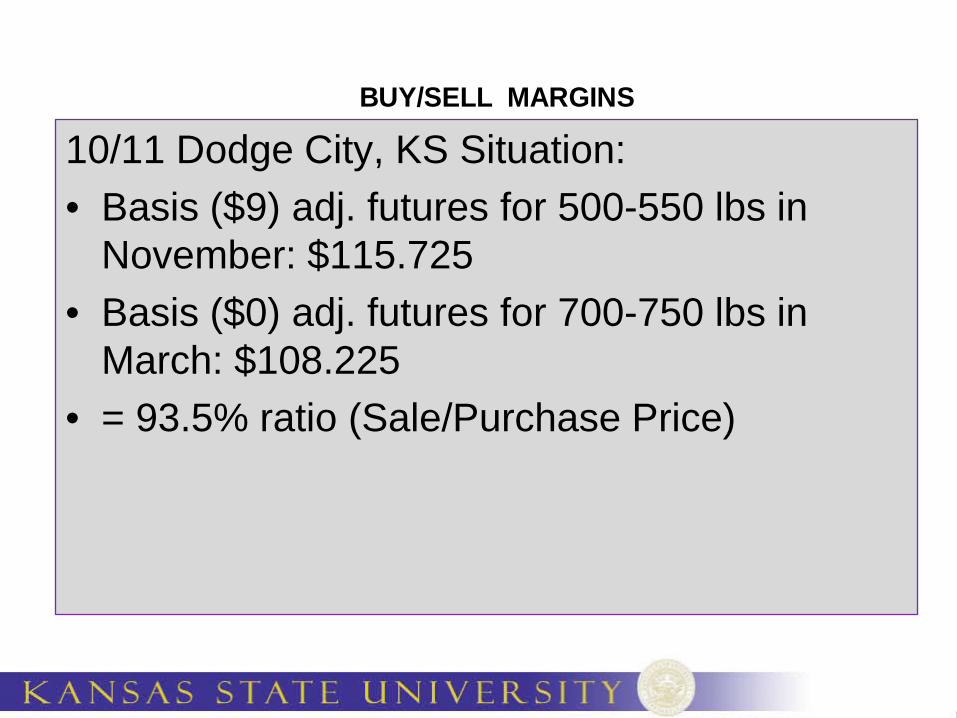
10/11 Dodge City, KS Situation:• Basis ($9) adj. futures for 500-550 lbs in
November: $115.725 • Basis ($0) adj. futures for 700-750 lbs in
March: $108.225• = 93.5% ratio (Sale/Purchase Price)

Kevin Dhuyvetter’s “Buy-Sell” spreadsheet tool (http://www.agmanager.info/livestock/budgets/production/beef/cattlebuysell.swf)
Breakeven Selling Price Worksheet
Purchase weight (lbs) 500Purchase price ($/cwt) $115.73 Average Daily Gain (pay-to-pay) 2.00Feeding cost of gain ($/cwt) $65.00Interest rate on feeder and feeding cost of gain 8.00%Percent death loss* 1.50%Costs per head (trucking, etc.)** $12.00Desired profit per head $0.00* Enter ONLY if death loss is NOT included in feeding cost of gain, otherwise enter zero.** Do not enter any costs included in feeding cost of gain.

Kevin Dhuyvetter’s “Buy-Sell” spreadsheet tool (http://www.agmanager.info/livestock/budgets/production/beef/cattlebuysell.swf)
Expected Sales Price: $108.23/cwt ;Expected Return (750 lbs) of +/- $4.82/cwt; +/-$36/head
Selling $109.73 $111.73 $113.73 $115.73 $117.73 $119.73 $121.73Weight1
600 105.95 107.66 109.37 111.08 112.79 114.51 116.22650 103.34 104.93 106.52 108.11 109.69 111.28 112.87700 101.13 102.61 104.10 105.58 107.06 108.54 110.02750 99.24 100.63 102.02 103.41 104.80 106.19 107.58800 97.61 98.92 100.23 101.54 102.85 104.16 105.47850 96.19 97.43 98.67 99.91 101.15 102.39 103.63900 94.94 96.12 97.30 98.48 99.65 100.83 102.01
1 Enter the minimum selling (pay) weight you want to consider.2 Based on a feeding cost of gain of $65/cwt.
Purchase Price
Breakeven Selling Price2

Summary• Duration of supply situation:
– Cow herd liquidation continuing in face of excellent pasture conditions & exp. profit…
– 2011 hog expansion MAY be tempered w/ recent feed cost escalation
• Duration of demand situation: – Domestic concerns may persist– Export growth vital both in short run & long run
• Stocker Placements this Fall:– May be profitable – but competition over calves
may grow diminishing expected profits…

Looking Beyond Today’s Ps & Qs
42

Additional Demand Drivers/Issues in need of Evaluation:
• Animal welfare – “social pressures” are here to stay …– beef/cattle are not immune:
• Recent analysis suggests meat expenditures reallocate to non-meat in response to increasing media attention…
• Differentiation of niche products = stigmatizing conventional products?
• Convenience– Strong driver of beef demand reductions (08’ Beef Board study) – Today’s twenty-somethings are particularly looking for quick &
easy meals that are low cost• Unemployment for adults under 30 was 19.5% in 2nd quarter of 2010 • These habits may persist and shape lifetime consumption habits…
43

Global Comparative Advantage Assessment is Needed
• State of National Animal ID & Traceability
– Current & future roles in trade negotiations: • South Korea: has 12/2010 rule of all imported meat
being traceable… • Canada: national program facilitating age
verification…
44

Impacts of New/Potential Policy on Markets is Needed
• Multiple regulation discussions:
– “fair market” proposed rules / “anti-competition” listening sessions …
45

More information available at:AgManager (http://www.agmanager.info/)
Glynn T. TonsorAssistant Professor
Dept. of Agricultural EconomicsKansas State University
46

Notable AgManager Resources(http://www.agmanager.info/livestock/marketing/ )
• Weekly commentary & newsletters
• Current & historical price information
• Risk management/forecasting tools
47

Weekly Email Distribution of AgManager Updates
• http://listserv.ksu.edu/web?SUBED1=AGMANAGERUPDATE&A=1
OR email your request to:• Rich Llewelyn
48

Regular Newsletters & Commentary
• KSU Radio Interview – (http://www.agmanager.info/livestock/marketing/outlook/newsletters/default.asp) – OR (http://www.ksre.k-state.edu/news/DesktopDefault.aspx?tabid=66 )
– Weekly, released on Mondays (Tonsor, Mark, Peel, LMIC)
• “In the Cattle Markets” – (http://www.lmic.info/memberspublic/InTheCattleMarket/CattleMktsframe.html )
– Weekly (Mark, Feuz, Petry, Riley/Anderson)• Recent Cattle Finishing Returns
– (http://www.agmanager.info/livestock/marketing/outlook/newsletters/FinishingReturns/default.asp ); – monthly updates based on Focus on Feedlots newsletter
49

Regular “Situation Update” Commentary: LMIC
• “Chart of the Week” – (http://www.lmic.info/index.shtml)
• “Weekly Price & Production Summary” – (http://www.lmic.info/priprod/pandp.html)
• “Quick Market Reports” – (http://www.lmic.info/quick/quickdr.html)
50

Current Price & Basis Information• Futures Markets
– (http://www.cmegroup.com/trading/commodities/ ) OR
(http://www.agmanager.info/livestock/marketing/futures/default.asp )
– LC, FC, LH & C, SB, S, W• Cash Markets
– http://www.agmanager.info/livestock/marketing/graphs/default.asp#Price Charts – http://www.agmanager.info/livestock/marketing/database/default.asp#Cattle and
Beef Databases• Dodge City, Pratt, & Salina 700-800 lb steer; KS Direct Slaughter steer prices
• Basis (Cash - Futures) Information– http://www.agmanager.info/livestock/marketing/graphs/default.asp#Basis Charts – BeefBasis.com (http://www.beefbasis.com/ )
51

Risk Management and Return Forecasting Tools Available:
• Feeder Cattle Sales Risk Management Tool, – Compare expected sales prices of alternative FC marketing
strategies – (http://www.agmanager.info/livestock/marketing/LRP/default.asp)
• Feedlot Profitability Tool: NAIBER’s Feeding Risk Analyzer – Forecasts feedlot returns and variability in returns for future
placements – (http://www.naiber.org/cattleriskanalyzer/ )
• BeefBasis.com – Decision support for hedging feeder cattle (output for cow-calf; input
for feedlots) – (http://www.beefbasis.com/Home/tabid/53/Default.aspx)
52