livestock marketing channel assessment · heritage breeds conservancy. ... dark cutter, other ......
TRANSCRIPT

Livestock Marketing Channel Assessment
Matt LeRoux, Marketing Specialist

Matt LeRoux
• Marketing Specialist with CCE,
Tompkins County.
• Master’s in Ag/Food Marketing.
• Worked for 5 years for the New
England Livestock Alliance &
Heritage Breeds Conservancy.
• Started 2 brands of Natural & Grass-
fed beef.

Selling to a buyer who
is not the end user.
Selling directly to the
end user.
Farmers’ Market
CSA/Buying Club Grocery/Retail
Freezer Trade
Farm Stand/Store
Restaurant
Distributor
Auction
Institution/Food Service
Web
Packer

Market Channel Selection: Opportunity is knocking…
Meat CSA
Home-based Retail (farm store)
Freezer Trade
Farmers’ Market
Restaurant
Grocery/Specialty Store
Regional brands

Joe, if you bring your beef
to the farmers’ market the
prices are so high you can
sell $500 worth per hour!
That’s great. I
am going to sell
there.
But, it costs $300 per day to
sell there.
…and its only 1
hour per week...
…and it takes 12
hours to prepare...
…and if it rains no
customers come.

Six interacting factors impact the “performance” of a
marketing channel including:
Lifestyle
Preferences
How do you evaluate a market opportunity?
Sales Volume …and its only 1
hour per week...
Labor Requirements …and it takes 12
hours to prepare...
Risk …and if it rains no
customers come.
Price & Profit You can sell $500 worth
per hour!
Associated Costs It costs $300/day
to sell there.

Labor logs
Harvest Process & Pack Travel & Delivery Sales time

Sales Volume by Channel Total Gross Sales Volume
1.0 1.0
1.9
2.6
3.4
8.3
0.0
1.0
2.0
3.0
4.0
5.0
6.0
7.0
8.0
9.0
Watkins FM Restaurant IFM Saturday IFM Tuesday Corning FM CSA
Marketing Channels
No
rmali
zed
Vo
lum
e U
nit
s
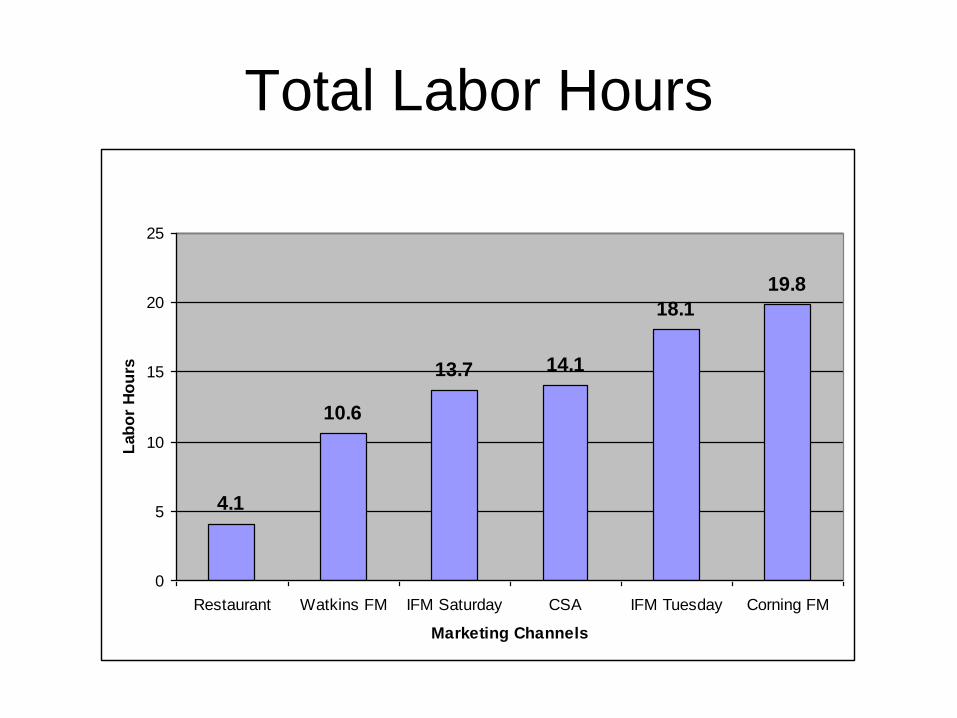
Total Labor Hours
Total Labor Hours
4.1
10.6
13.7 14.1
18.1
19.8
0
5
10
15
20
25
Restaurant Watkins FM IFM Saturday CSA IFM Tuesday Corning FM
Marketing Channels
Lab
or
Ho
urs

Simple Comparison of Labor & Sales
Total Labor Hours
Restaurant
5%Watkins FM
13%
IFM Saturday
17%
CSA
18%
IFM Tuesday
23%
Corning FM
24%
Gross Sales
Watkins FM
5%
Restaurant
6%
IFM Saturday
11%
IFM Tuesday
14%
Corning FM
19%
CSA
45%
CSA: 18% of weekly labor, 45% of weekly gross sales.
Watkins Glen FM: 13% of weekly labor, 5% of weekly gross sales.

Marketing Profit
Profit
0%
10%
20%
30%
40%
50%
60%
70%
80%
90%
100%
Watkins FM IFM Saturday IFM Tuesday Corning FM Restaurant CSA
Marketing Channels
Pro
fit
as %
of
Gro
ss S
ale
s
Profit as % of Gross Sales (with Owner Labor Valued)

Risks & Preferences:
Labor requirements
Price risk
Customer turn-out
Competition
Buyer back-out
Processor is booked
People on the farm
Dark Cutter, other
discounts
Ability to sell the
whole carcass
Customer interaction
Time on the farm
Setting up displays

Based on 5 factors and farmer chosen weights.
Sales Volume Labor Hours Profit Margin Financial Risk Lifestyle
Rank Rank Rank Rank Rank Unweighted Weighted
IFM Tuesday 4.9 5.4 3.9 2.0 1.0 3.4 3.2
IFM Saturday 5.4 4.0 4.1 2.0 1.0 3.3 3.1
Corning FM 4.3 6.0 3.4 2.0 1.0 3.4 3.2
Watkins FM 6.0 3.1 6.0 2.0 1.0 3.6 3.5
CSA 1.0 4.2 1.0 1.0 1.0 1.6 1.6
Restaurant 6.0 1.0 2.4 2.0 1.0 2.5 2.0
Final Scores
Rank & Compare Opportunities for
Performance Factors

LMCAT Factors
• HCW Equivalent Price
• Whole carcass demand, % demanded
• Sales Volume
• Lifestyle Preferences (enjoyment, stress aversion)
• Labor Required
• Risk (financial risk, lost sales, etc…)


Methodology • Collect logs of all marketing labor (from trip to
processor to final sale) for X # of head, for X # of
weeks.
• Collect weights & prices of cuts for 1 typical head.
• Collect gross sales & mileage for the period.
• Collect ranking on lifestyle & risk.

Practical Application: Marketing Decisions
• Reduce participation in weakest
performing channel.
• Increase participation in best performing
channel.
• Maximize lifestyle preferences.
• Adjust channel pricing to improve
performance.
Considering a marketing change, what should it be?

Channel Combination aids inventory management.
High-Demand
High-Value Cuts
Low-Demand
Low-Value Cuts
Restaurant
Farmers’ Market A
CSA
On-farm sales
Restaurant
Farmers’ Market B

Consider Price, Profit & Volume Average
Price/lb.
Hours
spent
Lbs.
sold
Gross
Sales Costs
Marketing
Profit/head
Profit
$/hour
Farmers' Market Retail 429 $7.00 36 429 $3,003 $524 $2,479 $83
Freezer Trade HCW 660 $2.65 6 660 $1,749 $434 $1,315 $219
Live animal HCW 660 $1.45 2 660 $957 $2 $955 $478
Weight selling
price is based
Trucking Kill fee
Cut &
wrap
$0.55/lb.
Assoc.
costs Total
Live animal $0 $0 $0 $2 $2
Freezer Trade $20 $50 $363 $1 $434
Farmers' Market $20 $50 $363 $91 $524
Marketing Costs:
71.4 lbs./4 hour market
6.0 # of markets
6.0 hours/market
$15 Cost/market
Assumptions for Frms' Mrkt:
Other assumptions:
Does not include any production costs.
$1/head to Beef Check-off program.
10 head load for the live animal channel.
$1/head marketing fee for live animal channel.
Selling at a 4 hour farmers' market takes 6 hours.

Cornell Cooperative Extension Beef Yield and Price Estimator & Calculator
Warning: Only type in yellow highlighted fields
STEP ONE: ENTER BASE PRICE & ANY PREMIUM
Price Unit You may want to use the weekly average price based on USDA report (link below).
BASE PRICE: $1.52 lb/HCW Use price for steers, dressed delivered basis, 65-80% choice, high end of range or average.
Premium $0.25 lb/HCW Assume a premium price!
Total: $1.77 lb/HCW http://www.ams.usda.gov/mnreports/lm_ct100.txt

STEP TWO: ENTER OTHER COSTS, CARCASS WEIGHT, & YIELDS
COSTS Rate 1 head price
Animal purchase $1.77 $1,191.21
Trucking $30.00 $30.00 Will you charge for trucking? TIME & MILEAGE
Slaughter $45.00 $45.00 Kill fee
Cut & wrap $0.65 $437.45 Cut & wrap fee
Delivery $20.00 $20.00 Will you charge for delivery? TIME & MILEAGE
Total: $1,723.66
CARCASS WEIGHTS Pounds Yield %
HCW 673 60% Assume 60% yield
Retail 437.45 65% Assume 65% yield
STEP THREE: REVIEW ESTIMATED YIELD FOR PRIMALS
YIELDS % of carcass Pounds
Chuck primals 26.0% 114 Assume primal yields as published by Angus Association
Flank & Short plate primals 9.5% 42
Brisket & Shank 10.0% 44
Trim 1.0% 4
Round primals 27.0% 118
Rib primal 9.5% 42
Short Loin primal 8.0% 35
Sirloin primal 9.0% 39
Total: 100.0% 437.45

Based on the estimated yield and costs, total costs per pound is: $3.94
STEP FOUR: NOW ENTER ACTUAL POUNDS RECEIVED FOR EACH CUT
Pounds
Total Retail
lbs. % of Carcass Cost/lb.
Product
cost
Ground beef 256 431.96 59.3% $3.94 $1,008.70
Stew Meat 37 431.96 8.6% $3.94 $145.79
Top Round 24.88 431.96 5.8% $3.94 $98.03
Ribs (short) 5.48 431.96 1.3% $3.94 $21.59
Prime rib/ Ribeye 17.68 431.96 4.1% $3.94 $69.66
Tenderloin 10.44 431.96 2.4% $3.94 $41.14
Strip loin 26 431.96 6.0% $3.94 $102.45
Sirloin 10.48 431.96 2.4% $3.94 $41.29
Shanks/Soup bones 24 431.96 5.6% $3.94 $94.57
Other 1 0 431.96 0.0% $3.94 $0.00
Other 2 0 431.96 0.0% $3.94 $0.00
Tongue/liver/Ox tail 20 431.96 4.6% $3.94 $78.80
Actual total retail yield: 431.96 100.0% $1,702.03
Estimated total retail yield: 437.45
Difference: (5.5) lbs.

STEP FIVE ENTER DESIRED MARK-UP ABOVE COST (%) 30.0%
$5.12 Avg. $/lb.
Mark-up above farm total cost:
STEP SIX ADJUST PRICING TO MEET GOALS
% of Carcass
(reminder) Mark-up
Extended Mark-
up
Suggested
Pricing:
Breaks-out
to:
Ground beef 59.3% 30.0% $1,311.31 $4.75 $1,216.00
Stew Meat 8.6% 30.0% $189.53 $6.00 $222.00
Top Round 5.8% 30.0% $127.44 $7.75 $192.82
Ribs (short) 1.3% 30.0% $28.07 $7.25 $39.73
Prime rib/ Ribeye 4.1% 30.0% $90.56 $10.50 $185.64
Tenderloin 2.4% 30.0% $53.48 $11.00 $114.84
Strip loin 6.0% 30.0% $133.18 $8.75 $227.50
Sirloin 2.4% 30.0% $53.68 $7.00 $73.36
Shanks/Soup bones 5.6% 30.0% $122.94 $3.50 $84.00
Other 1 0.0% 30.0% $0.00 $0.00 $0.00
Other 2 0.0% 30.0% $0.00 $0.00 $0.00
Tongue/liver/Ox tail 4.6% 30.0% $102.45 $4.00 $80.00
$2,212.64 $5.88 $2,435.89
Average
Difference between target mark-up and current pricing. $223.25
$0 Means you reached your exact mark-up goal.
($) Means you are $ below mark-up goal
($) Shows $ above mark-up goal
$0 Means you reached your exact mark-up goal.
($) Means you are $ below mark-up goal
($) Shows $ above mark-up goal
Marketing Channel Assessment
• Identify goals and lifestyle preferences.
• Keep marketing cost & returns records, if only
for “snapshot” periods.
• Rank & compare opportunities to maximize
profits.
• Combine channels to max sales & reduce risks.
Publications
• Smart Marketing Sept. & Oct. 2010, Oct. 2012
http://marketingpwt.dyson.cornell.edu/publications.html#
smart
• Guide to Marketing Channels
http://ccetompkins.org/sites/all/files/factsheets/factsheet-
1317.pdf

Contact information:
Matthew LeRoux
Agricultural Marketing Specialist
Cornell Cooperative Extension Tompkins Co.
615 Willow Ave., Ithaca, NY 14850
607-272-2292