livestock gross margin insurance: - university of nebraska–lincoln
TRANSCRIPT

EXTENSION
EXTENSION
EXTENSION
4 color
Black/PMS 186
Black
Extension is a Division of the Institute of Agriculture and Natural Resources at the University ofNebraska–Lincoln cooperating with the Counties and the United States Department of Agriculture.
University of Nebraska–Lincoln Extension educational programs abide with the nondiscriminationpolicies of the University of Nebraska–Lincoln and the United States Department of Agriculture.
© 2007, The Board of Regents of the University of Nebraska on behalf of theUniversity of Nebraska–Lincoln Extension. All rights reserved.
EC848
Department of Agricultural EconomicsInstitute of Agriculture and Natural ResourcesUniversity of Nebraska–Lincoln Extension
Darrell R. Mark, Ph.D.Extension Livestock Marketing Specialist
Josie A. Waterbury, B.S.Graduate Research Assistant
Rebecca M. Small, B.S.Graduate Research Assistant
Livestock Gross Margin Insurance:A Self-Study Guide
Fall/Winter 2007

ii ©TheBoardofRegentsoftheUniversityofNebraska.Allrightsreserved.
Funding for this project was provided under a risk management education partnership agreement between the University of Nebraska–Lincoln and the North Central Risk Management Education Center.
©TheBoardofRegentsoftheUniversityofNebraska.Allrightsreserved. iii
PrefaceThis self-study guide is designed to provide cattle
and swine producers, insurance agents, and educators with information regarding USDA’s Risk Management Agency’s Livestock Gross Margin program. Livestock Gross Margin (LGM) Insurance for Cattle provides pro-tection against a decline in the cattle feeding margin by simultaneously hedging the corn and feeder cattle input costs and the fed cattle selling price as a bundled option. Livestock Gross Margin (LGM) Insurance for Swine does the same thing by creating a bundled option by simulta-neously hedging the corn and soybean meal input costs and the swine selling price against a decline in the swine finishing margin.
This study guide is presented in five chapters with each chapter divided into several subsections. The appendix includes example forms in the LGM program. The first chapter provides a general overview and dis-cusses some requirements of the program. Chapter 2 explains how the program works, including terminology unique to LGM, and step-by-step directions for find-ing Expected and Actual Gross Margins, Gross Margin Guarantees, premium rates, and indemnity payments. The third chapter presents rules and policy provisions of LGM, along with advantages and disadvantages the program may have relative to other hedging strategies. Chapter 4 explores LGM basis and how it differs from futures basis, and also illustrates when indemnities are most likely to be paid. The final chapter presents two hedging examples associated with LGM and also explains how to calculate a minimum expected margin and a net margin. A quiz at the end of each chapter can help
readers check their understanding of the material from that chapter. Answers for the quizzes can be found at the back of the guide.
Other resources pertaining to LGM insurance are available online at www.livestockinsurance.unl.edu. This Web site contains links to USDA Risk Management Agency Livestock Gross Margin resources such as the expected and actual gross margin Web site and the agent locator tool. There also is a series of video lectures that correspond to the chapters in this study course. The video lectures include slides along with narration dis-cussing the material presented in this self-study guide. Each video can be downloaded and viewed as a guide complement.
Although the chapters are fully integrated and intended to be studied sequentially, they also can be used individually for producers, educators, or insurance agents with different information needs.
The information contained in this self-study guide is based on the 2008 crop year underwriting rules for Livestock Gross Margin Insurance. Modifications to the LGM insurance program in subsequent years may change the interpretation and use of some information in this guide. Therefore, users should always check with their insurance agents and USDA-RMA underwriting rules for current rules and regulations regarding the use of LGM insurance. Also, updates may be provided online at www.livestockinsurance.unl.edu. While the informa-tion in this self-study guide is believed to be accurate, no guarantee or warranty is made to its accuracy or completeness.

iv ©TheBoardofRegentsoftheUniversityofNebraska.Allrightsreserved.
Glossary of Acronyms
Actual Gross Margin (AGM) — The difference between actual livestock selling prices and actual input prices (feeder cattle and corn for LGM for Cattle and soybean meal and corn for LGM for Swine) based on LGM futures prices and state- and month-specific basis; feeding margin that occurs due to realized, actual prices observed in the market after the 11-month (6-month for swine) insurance period (as determined by RMA).
Chicago Board of Trade (CBOT) — A futures and options exchange, trading 50 different futures and op-tions contracts through open auction and/or electronic order matching. Corn and soybean meal futures prices used to calculate the adjusted futures prices for LGM are established at this exchange.
Chicago Mercantile Exchange (CME) — A futures and options exchange, trading currencies, stock indices, weather derivatives, and livestock products. Live cattle, feeder cattle, and lean hog futures prices used to calculate adjusted futures prices for LGM are established at this exchange.
Dried Distillers Grains with Solubles (DDGS) — Byproduct produced in the dry milling process of etha-nol production and fed to livestock, particularly cattle.
Expected Gross Margin (EGM) — The difference between the expected livestock selling prices and ex-pected input prices (feeder cattle and corn for cattle or soybean meal and corn for swine) based on LGM futures prices and state- and month-specific basis.
Federal Crop Insurance Corporation (FCIC) — A division of the United States Department of Agriculture that oversees and administers the LGM program.
Gross Margin Guarantee (GMG) — The expected gross margin minus the deductible selected by the pro-ducer; feeding margin insured by the producer.
Livestock Gross Margin (LGM) — Insurance prod-uct that offers protection against a decline in the feeding margin for cattle and swine.
Livestock Risk Protection (LRP) — Insurance prod-uct that covers the risk of price declines for feeder cattle, fed cattle, swine, and sheep.
Minimum Expected Margin (MEM) — Equal to the Gross Margin Guarantee (GMG) plus the expected LGM basis margin.
Risk Management Agency (RMA) — An agency within the USDA through which the LGM program is of-fered for sale as a livestock insurance product.
Substantial Beneficial Interest (SBI) — The per-centage of livestock ownership held by any person; must be at least 10 percent to be eligible for LGM insurance.
Segregated Early Weaned (SEW) Finishing Opera-tion — A type of swine operation that specializes in the feeding of swine from the age of approximately 12 to 21 days to slaughter.
Wet Distillers Grains with Solubles (WDGS) — By-product produced in the dry milling process of ethanol production and fed to livestock, particularly cattle.

©TheBoardofRegentsoftheUniversityofNebraska.Allrightsreserved. v
Table of ContentsPreface .......................................................................................................................................................................................... iii
Glossary of Acronyms ............................................................................................................................................................. iv
Chapter 1 — What is Livestock Gross Margin Insurance? 1.1 Introduction .................................................................................................................................................................... 1 1.2 Insurance Period ............................................................................................................................................................. 1 1.3 Qualifying Livestock ....................................................................................................................................................... 2 1.4 Eligible States .................................................................................................................................................................. 3 1.5 Substantial Beneficial Interest ........................................................................................................................................ 3 1.6 Purchasing Coverage ...................................................................................................................................................... 4 1.7 Contract Size ................................................................................................................................................................... 4 1.8 Risk Protection ................................................................................................................................................................ 5 1.9 Summary ......................................................................................................................................................................... 5 Check for Understanding ...................................................................................................................................................... 6
Chapter 2 — How Does Livestock Gross Margin Insurance Work? 2.1 Introduction .................................................................................................................................................................... 7 2.2 Terminology .................................................................................................................................................................... 7 2.3 USDA-RMA Web site ..................................................................................................................................................... 8 2.4 Purchasing LGM — An Example ................................................................................................................................... 9 2.5 Premiums ........................................................................................................................................................................ 12 2.6 Indemnity Payments ....................................................................................................................................................... 13 2.7 Summary ......................................................................................................................................................................... 13 Check for Understanding ...................................................................................................................................................... 14
Chapter 3 — Additional LGM Policy Provisions 3.1 Introduction .................................................................................................................................................................... 15 3.2 Margin Protection Only ................................................................................................................................................. 15 3.3 Livestock Records ............................................................................................................................................................ 16 3.4 Guaranteed Pricing ......................................................................................................................................................... 16 3.5 Coverage Transfer and Indemnity Assignment ............................................................................................................. 16 3.6 Hedging Considerations with LGM............................................................................................................................... 17 3.7 Basis Risk Coverage ........................................................................................................................................................ 18 3.8 Summary ......................................................................................................................................................................... 18 Check for Understanding ...................................................................................................................................................... 19
Chapter 4 — LGM for Cattle Basis Margin and Purchasing Considerations 4.1 Introduction .................................................................................................................................................................... 20 4.2 LGM Basis Margin vs. Futures Basis .............................................................................................................................. 20 4.3 LGM for Cattle Purchasing Opportunities .................................................................................................................... 23 4.4 Summary ......................................................................................................................................................................... 39 Check for Understanding ...................................................................................................................................................... 39
Chapter 5 — Hedging Outcomes with LGM Insurance 5.1 Introduction .................................................................................................................................................................... 40 5.2 Changes in Gross Margin ............................................................................................................................................... 40 5.3 Hedging Outcomes ......................................................................................................................................................... 40 5.4 Final Considerations ....................................................................................................................................................... 44 5.5 Conclusion ...................................................................................................................................................................... 44 Check for Understanding ...................................................................................................................................................... 45

vi ©TheBoardofRegentsoftheUniversityofNebraska.Allrightsreserved.
Appendices Appendix 1 Substantial Beneficial Interest Form ................................................................................................................. 46 Appendix 2 Notice of Probable Loss Form ........................................................................................................................... 48 Appendix 3 Marketings Report Form ................................................................................................................................... 50 Appendix 4 Transfer of Right to Indemnity Form ............................................................................................................... 52 Appendix 5 Assignment of Indemnity Form ....................................................................................................................... 54 Answers to “Check for Understanding” ................................................................................................................................ 56

©TheBoardofRegentsoftheUniversityofNebraska.Allrightsreserved. �
In this chapter, you will learn: what Livestock Gross Margin (LGM) Insurance
is; the length of insurance coverage available with
LGM; which livestock can be insured with LGM; where and when LGM is available; how to purchase LGM; how many head of livestock are insurable under
LGM; and how LGM is useful as a risk management tool.
1.1 Introduction
Livestock Gross Margin (LGM) Insurance is an insurance policy offered for both cattle and swine through USDA’s Risk Management Agency (RMA). Live-stock Gross Margin (LGM) Insurance for Cattle was first offered in January 2006. Livestock Gross Margin (LGM) Insurance for Swine was first available in all 20 states where LGM for Cattle was offered beginning in July 2007. Prior to the release of LGM, Livestock Risk Protec-tion (LRP) Insurance was offered to producers (begin-ning in 2001) as a livestock insurance product. LRP provides single-peril price risk protection for the future selling price of the insured livestock. For more informa-tion on LRP, see EC839. As a separate and distinct policy, LGM provides protection against a decline in the cattle feeding or swine finishing margins by simultaneously hedging the corn and feeder cattle input costs and the fed cattle selling price (LGM for Cattle) or the corn and soy-bean meal input costs and the swine selling price (LGM for Swine) as a bundled option. While LGM is based on futures market prices and provides protection similar to a bundled option on futures contracts, producers using LGM take no futures or option positions themselves and therefore do not need a brokerage account. They must, however, purchase the policy through a licensed crop insurance agent (see Section 1.6). The LGM for Cattle insurance policy is available for both calf finishing and yearling finishing operations, while LGM for Swine is offered for farrow to finish, feeder pig finishing, and seg-regated early weaned (SEW) pig finishing operations.
Essentially, LGM pays insured producers an indem-nity when the spread between the fed cattle sales price and feeder cattle and corn input prices (applicable to LGM for Cattle) or the swine sales price and soybean meal and corn input prices (applicable to LGM for Swine) narrows beyond their insured coverage level due
Chapter 1What is Livestock Gross Margin Insurance?
to changing market conditions. As this feeding margin narrows, the corresponding indemnity payment becomes larger to offset lower revenues and/or increased costs. Indemnity payments are based on a gross margin guar-antee (GMG) and a total actual gross margin (AGM). The GMG is the livestock feeding margin producers insure when they purchase the policy. It is based on expected fed cattle, feeder cattle, and corn prices in the cattle policy and expected swine prices, soybean meal prices, and corn prices in the swine policy. The total AGM is the livestock feeding margin that occurs due to realized, actual prices observed in the market after the 11-month coverage period for cattle or 6-month cover-age period for swine. At the end of the insurance period (11 months for cattle and 6 months for swine), an indem-nity is paid to the producer if the insured GMG for the period exceeds the total AGM. The fed cattle, feeder cattle, and corn prices used to compute the GMG and AGM for cattle are based on futures prices adjusted for state- and month-specific basis levels. The swine and corn prices used to compute the GMG and AGM for swine also are based on futures prices adjusted for state- and month-specific basis levels. However, soybean meal prices used in computing the GMG and AGM for swine are based only on futures prices with no basis adjust-ment.
1.2 Insurance Period
LGM for Cattle can be purchased only on the last business day of each month, while LGM for Swine is available for purchase on the second to last business day of the month, so there are 12 LGM sales periods per year. Each of these has an insurance period of 11 months (6 months for swine), so cattle to be marketed up to 11 months (or swine to be marketed up to 6 months) from the sales closing date can be insured. Coverage begins one full month after the sales closing date, provided the premium for the policy has been paid in full at the time of purchase. No livestock sales are insurable during the first month of any insurance period. For example, if a producer purchased a policy on the sales closing date of Jan. 31, no target marketings will be insurable until March 1 (see Figure 1.1). This restriction is to prevent adverse selection. Because the first month of the insur-ance period is so near, producers could have an idea of whether an indemnity would be due based on prices for those months. Producers can purchase one policy to cov-er the entire insurance period or obtain multiple policies with sales closing dates in different months for cattle or

� ©TheBoardofRegentsoftheUniversityofNebraska.Allrightsreserved.
swine. For example, producers wanting to insure cattle from March to December could insure all 10 months with one policy (purchased at the end of January). Alternatively, they could purchase coverage for each month separately, buying March coverage in January or before, April coverage in February or before, and so on. Any combination of these two transactions could occur. Insurance that is purchased on more deferred months generally receives the most protection against changing margins because future input prices are hedged in addi-tion to cattle or swine sales (see Section 3.4).
1.3 Qualifying Livestock
Livestock eligible to be insured with a LGM policy must be expected to have certain weight specifications and be on feed for a certain amount of time before they are marketed. It is important to note that the livestock must be expected to meet certain weight, time, and feed requirements. However, if livestock do not exactly meet these expectations as outlined in the policy, LGM cover-age is not affected nor is the right to an indemnity. The livestock specifications in the policy allow inclusion of livestock under many common feeding situations.
Two types of cattle feeding operations are insur-able with LGM. A yearling finishing operation assumes a cattle placement weight of 750 lbs and a finished weight of 1,250 lbs. Yearling cattle are assumed to be on feed for five months and consume 57.5 bushels of corn during that time. A calf finishing operation assumes a place-ment weight of 550 lbs and a finished weight of 1,150 lbs. This type of operation is assumed to feed calves for eight months and assumes they will consume 54.5 bushels of corn. So, a typical calf finishing operation that places weaned calves on feed in the fall after weaning can insure cattle with LGM.
Three different types of operations are insur-able with LGM for Swine. A farrow to finish operation assumes that pigs will be marketed at 250 lbs (live weight
Figure 1.1. LGM Insurance Period, Jan. 31 Sales Closing Date.
basis) and consume 13.86 bushels of corn and 196.16 lbs of soybean meal (9.808 percent of one ton of soy-bean meal) per head. Feeder pig finishing and SEW pig finishing operations also are assumed to finish swine to 250 lbs (live weight basis). In the feeder pig finishing operation, hogs are assumed to eat 9.6 bushels of corn and 132 lbs of soybean meal (6.6 percent of one ton of soybean meal) per head. The SEW pig finishing opera-tion assumes that each hog consumes 9.7 bushels of corn and 142 lbs of soybean meal (7.1 percent of one ton of soybean meal).
The weights and quantities used to establish the type of operation are based on industry averages. Iowa State University’s optimal feed ration was used in determining feed quantities for each type of swine operation. Similar-ly, the amount of corn in the ration used for both calves and yearlings was calculated from the 2005 Livestock Enterprise Budgets for Iowa (Ellis, Edwards, and Law-rence). The bushels of corn required for two types of cat-tle rations were averaged to find the number of bushels of corn each type of animal normally consumed in each respective ration. The two types of rations used included a hay and corn ration as well as a silage and corn ration. For yearlings, 63 bushels (hay ration) and 52 bushels (silage ration) of corn were consumed respectively. These amounts were averaged to equal 57.5 bushels of corn for a yearling finishing operation. For calves, 61 bushels (hay ration) and 48 bushels (silage ration) of corn were consumed respectively. These amounts were averaged to equal 54.5 bushels of corn for a calf finishing opera-tion. It is important to note that hay, silage, and other feed costs are not insured with LGM for Cattle. Corn is the only feedstuff included in LGM coverage. Addition-ally, no other feeding costs of gain, including yardage, interest, medications, vaccinations, etc., are insured with LGM. Furthermore, feeding more dried distillers grains with solubles (DDGS) or wet distillers grains with solu-bles (WDGS) will change the amount of corn consumed by cattle or hogs. It is possible for producers to over or
Figure 1.1: LGM Insurance Period, January 31 Sales Closing Date
Jan 31 Feb Mar Apr May Jun Jul Aug Sep Oct Nov Dec
SalesClosing
Date
NoCoverage Available
Cattle Producer Specifies Target Marketings for Each
Swine Producer Specifies Target Marketings for Each

©TheBoardofRegentsoftheUniversityofNebraska.Allrightsreserved. �
under hedge corn consumption if rations vary from the corn averages stated previously due to larger amounts of distillers grains being fed. Distillers grain prices and corn prices are still tied to one another, even though a one-to-one relationship does not exist between the two com-modities. Nonetheless, it generally does not affect the insurability of the cattle if actual placement weights, days on feed, and feed consumption for particular pens of insured cattle differ from the averages. However, produc-ers may over or under hedge if placement weights, days on feed, and feed consumption for their operations dif-fer from the averages established by RMA. To the extent these factors can change marketing dates, consideration should be given to whether actual cattle marketings for an insurance period would drop below the allowable levels (see Section 3.2). This also is true for swine insured with LGM. Because the amount of feed fed and market weight of the animal is used in determining the EGM and AGM, protection will vary if swine are not marketed at the specified weight or if feed consumption varies from the amount outlined in the policy. However, this is not as large an issue as it is with cattle, because feeding hogs has become more standardized.
1.4 Eligible States
LGM for Cattle and Swine is available in 20 states in the 2008 policies: Colorado, Illinois, Indiana, Iowa, Kansas, Michigan, Minnesota, Missouri, Montana, Nebraska, Nevada, North Dakota, Ohio, Oklahoma, South Dakota, Texas, Utah, West Virginia, Wisconsin, and Wyoming (see Figure 1.2). As of 2007, 87.7 percent of the cattle on feed and approximately 77 percent of market hogs in the United States were located in these 20 states. To be eligible for this policy, the insured livestock
must be located in one of these 20 states and be specifi-cally intended for commercial or private slaughter. The livestock owner does not necessarily have to reside in one of the specified 20 states. Therefore it is unnecessary for the owners of the livestock to reside in the eligible state or the state where the livestock are located — only the insured livestock must be located in an eligible state. For example, a feedyard in Nebraska may custom feed cattle owned by a person living in Tennessee. Even though Tennessee is an ineligible state, the owner could purchase LGM for Cattle coverage because the cattle are in Ne-braska.
1.5 Substantial Beneficial Interest
To be eligible for LGM insurance, applicants must have substantial beneficial interest (SBI) in the insured livestock. SBI is tracked in the LGM program because there are limits to the number of livestock any one pro-ducer can insure with LGM insurance during specific time periods. An example of this form can be seen in Appendix 1. To have SBI, the producer must have at least 10 percent ownership of the insured livestock. If the ap-plicant has a spouse, the spouse typically is considered to have SBI in the applicant’s livestock unless specific condi-tions, as outlined by the Federal Crop Insurance Corpo-ration (FCIC) procedures and provisions, can be proven. For instance, the spouse of an insured automatically has the same substantial beneficial interest as the insured, unless the spouse proves the livestock insured are in a completely separate farming operation or the spouse derives no benefit from the insured farming operation. To be considered individual farming entities, spouses typically must prove separate ownership of land and capital as well as accounting of equipment and/or labor
Figure 1.2. States with LGM Insurance, 2008.

� ©TheBoardofRegentsoftheUniversityofNebraska.Allrightsreserved.
costs, management, records maintained, and that neither spouse receives a benefit from the other’s farming opera-tion. The spouse of an applicant generally is considered to have SBI in the livestock to prevent a single household from insuring double the maximum number of head for a given crop year (see Section 1.7).
1.6 Purchasing Coverage
Once producers have been approved for coverage and substantial beneficial interest has been proven, target marketings are established. Target marketings represent the number of slaughter-ready cattle or swine that are expected to be marketed during the insurance period and that the producer wants to insure with LGM. A spe-cific number of cattle (swine) are insured for each target month in the 11-month (6-month) insurance period. Producers are not required to insure all livestock they plan to feed and sell, and can insure any number of live-stock up to program limits. Target marketings insured cannot exceed a producer’s approved target marketings. Approved target marketings are the maximum number of livestock that can be stated as target marketings on the insurance application and are based on the lesser of farm capacity or underwriting capacity for the insurance pe-riod as determined by the insurance company.
LGM is available for purchase from any authorized crop insurance agent licensed to sell LGM. A list of au-thorized agents is available through the Agent Locator Tool found on the USDA-RMA Web site (http://www3.rma.usda.gov/apps/agents). If producers own livestock in two different LGM eligible states, a separate LGM policy must be obtained in each state. As long as an insurance agent is licensed in both of the applicable states, the same agent can handle both policies. Note if producers own both cattle and swine, a different policy must be obtained to insure each type of livestock.
LGM for Cattle is sold on the last business day of ev-ery month, while LGM for Swine is sold on the second to last business day of each month. The sales period com-mences once RMA validates the price data that is used to calculate the Expected Gross Margin (EGM). This veri-fication of data occurs after the futures market closes on the last day of the price discovery period, which is simply the last three days of prices in the corresponding com-modity months (cattle: fed cattle, feeder cattle, corn; and swine: lean hogs, soybean meal, corn) that are used to calculate EGMs for each of the target marketing months. (This process is described in Section 2.4.) The LGM sales period ends at 9 a.m. CST on the next business day. RMA reserves the right to refuse the sale of LGM at any time. If EGMs are not posted on the RMA Web site on the last business day (for cattle) or the second to last busi-ness day (for swine) of a particular month, LGM for that insurance period is unavailable for purchase. The EGMs
and the premium rates posted are based on futures pric-es, and once set, are fixed for the remainder of the sales period (see Section 3.4).
1.7 Contract Size
Target marketings represent the number of slaugh-ter-ready livestock that are expected to be marketed dur-ing the insurance period and that the producer wants to insure with LGM. A specific number of livestock are specified for each target marketing month in the insur-ance period. Producers are not required to insure all livestock they plan to own and sell. They can insure any amount of cattle they own up to a program limit of 5,000 head for any 11-month insurance period and a limit of 10,000 head per crop year, which begins July 1 and ends June 30. Swine producers can insure any amount of swine up to a program limit of 15,000 head for any 6-month insurance period and a limit of 30,000 head per crop year. There is no limit to the number of LGM poli-cies producers can purchase; only the maximum number of head insured is limited (see Table 1.1). Livestock could be insured using multiple policies during one crop year as long as a producer does not exceed the 10,000 head policy limit for cattle or 30,000 head policy limit for swine. Because only the maximum number of head in-sured is limited and producers can insure any amount of livestock up to the program limits, LGM is useful to pro-ducers with smaller feeding or finishing operations who may lack enough livestock to effectively use futures and options contracts to hedge price risk.
Futures and options contracts cover fixed amounts of commodities. For example, one feeder cattle contact covers 50,000 pounds, one fed cattle or swine contract is 40,000 pounds, one corn contract represents 5,000 bushels, and one soybean meal contract equals 100 tons. Many times these amounts are too large to be used ef-fectively in the risk management portfolios of smaller feeding operations. Cattle producers, for instance, may not purchase enough feeder cattle to cover one feeder cattle futures contract or enough corn to represent 5,000 bushels for a particular target marketing month. This, in turn, leaves the producer exposed to more risk because the producer is hedging more than is actually being purchased in the cash market. In addition, the difficulty in using options or futures is compounded by the ratio producers would need to equalize live cattle, feeder cattle, and corn contracts for a cattle operation (lean hogs, soybean meal, and corn contracts for a swine operation) according to production practices so as to not over or under hedge one or more commodities in this three-way spread. The LGM policy combines the three commodi-ties in an equivalent fashion for producers, so they do not have to purchase multiple contracts to be hedged in each commodity. Because there is no minimum number

©TheBoardofRegentsoftheUniversityofNebraska.Allrightsreserved. �
of head to insure with LGM, producers with smaller-sized operations can use LGM without hedging more cattle or swine than they plan to sell.
Table 1.1. LGM Coverage Limits.
Cattle (head) Swine (head)
Per Insurance Period 5,000 15,000
Per Crop Year July 1-June 30 10,000 30,000
1.8 Risk Protection
LGM is a price risk management tool; it is not designed to be a price capture mechanism or profit enhancer. Although LGM does not create a marketing opportunity or a positive margin other than what the market actually offers, LGM does offer useful protection by protecting the gross feeding margin. The program is more useful in preventing large, potentially devastating losses to an operation in the event of a narrowing feed-ing or finishing margin caused by lower revenues and/or increased input costs. A narrowing cattle feeding (swine finishing) margin, as defined by this policy, could be the result of decreasing live cattle prices (swine prices) and/or increasing feeder cattle or corn prices (soybean meal or corn prices). Movements in one, two, or even all three of these markets could cause the feeding or finish-ing margin to narrow. On the other hand, a large adverse price move in one of the markets (for example, feeder cattle or soybean meal) may not trigger a decreased mar-gin and subsequent indemnity if another market (for example, fed cattle or lean hogs) moves favorably (see Section 5.2). LGM for Cattle acts as a bundled set of op-tions protecting live (fed) cattle, feeder cattle, and corn price changes. LGM for Swine does the same, protecting lean hogs, soybean meal, and corn price changes. Even though price risk is reduced with this coverage, it still has its limitations as it does not protect against basis risk or performance or production risk, including death loss. The risk of changes between actual basis levels and the fixed basis in LGM leaves producers partially exposed to cash margin price risk and therefore not completely pro-tected from detrimental price moves (see Section 4.2).
An important factor when considering purchasing
LGM is the time period in which to buy coverage. Premi-ums for a given level of gross margin protection are gen-erally less expensive when gross margins are high and/or increasing (high live cattle prices and low feeder cattle and/or corn prices or high lean hogs prices and low soy-bean meal and/or corn prices). In this situation, it is less likely that the coverage level selected will pay an indem-nity; therefore, insurance coverage may be less expensive. This situation may offer an opportunity to lock in a gross margin near a producer’s break-even gross margin for a relatively inexpensive premium. On the other hand, if gross margins are narrow and/or decreasing, premiums may be more expensive for the same level of coverage. As gross margins for cattle continue to narrow because of lower live cattle prices or increased feeder cattle and/or corn prices, it is more likely that an indemnity will be paid; therefore, coverage becomes more expensive. The same is true for gross margins in swine. Margins will narrow as lean hog prices decrease or soybean meal and/or corn prices increase, thus increasing the chance of receiving an indemnity and paying a higher premium. Waiting until gross margins narrow (and the insurance is in greater demand) may not be the best time to purchase LGM coverage. Rather, periods with higher live cattle prices and lower feeder cattle and/or corn prices may provide the best opportunity to protect a break-even cattle gross margin of production simply because premi-ums may be relatively inexpensive (this is also true with swine).
1.9 Summary
This chapter provided an overview of LGM for Cattle and Swine insurance, what livestock and states are eligible for LGM insurance, and SBI requirements. It also explained how to purchase coverage, contract size limita-tions, the length of the insurance period for both types of livestock, as well as insuring a breakeven margin with LGM. Chapter 2 provides an in-depth example of how LGM works.
References
Ellis S., W. Edwards, J. Lawrence. 2005. Livestock Enterprise Budgets for Iowa — 2005. Iowa State University, University Extension, Ames, IA, FM 1815. www.i-farmtools.org/ref/Ellis_et_al_2005.pdf.

� ©TheBoardofRegentsoftheUniversityofNebraska.Allrightsreserved.
Check for Understanding: Chapter 1
1. T F With LGM, indemnities are based on the actual gross margin (AGM) and gross margin guarantee (GMG).
2. T F Livestock producers hedging with LGM insurance can sign up for (purchase) LGM insurance only once per year.
3. T F If a producer purchases LGM in March, target marketings can be insured for April.
4. T F The owner of eligible livestock can reside in a state not offering LGM as long as the livestock are located in an eligible state.
5. T F A minimum of 10 percent ownership is necessary for a producer to have substantial beneficial interest (SBI) in insured livestock.
6. T F If the owner of cattle purchases LGM insurance for eligible cattle located in two dif-ferent states, the same insurance agent can handle the policies as long as the agent is licensed to sell LGM in both states.
7. T F The maximum number of head insurable through LGM for Cattle in a crop year is 15,000 head.
8. T F LGM can be used to insure any amount of livestock.
9. T F LGM for Swine protects against declining swine finishing margins, not declining prices.
10. T F LGM premiums are typically lower if gross margins are higher and/or increasing.

©TheBoardofRegentsoftheUniversityofNebraska.Allrightsreserved. �
Chapter 2How Does Livestock Gross Margin Insurance Work?
In this chapter, you will learn:
definitions of LGM terminology;how to access Expected and Actual Gross Mar-
gins, Gross Margin Guarantees, and premium rates from USDA-RMA;
the process used by USDA-RMA to determine if an indemnity is paid;
how to calculate LGM premiums; andhow to collect an indemnity from LGM coverage.
2.1 Introduction
Chapter 1 provided a basic description of how LGM insures the gross margin for cattle feeders and swine fin-ishers. Basic program provisions such as eligible livestock and states, substantial beneficial interest, contract size limitations, and the length of the insurance period were covered in the opening chapter. Chapter 1 also explained how to purchase coverage and discussed how LGM can be used as a risk management tool. Chapter 2 focuses on the terminology of LGM as well as indemnity payments and premiums. This section also provides an in-depth example that illustrates the usefulness and practicality of this product.
2.2 Terminology
The LGM insurance program has several unique terms users should be familiar with in order to under-stand how to hedge price risk with LGM. These terms include:
Target Marketings — The number of slaughter-ready livestock that are expected to be marketed during the insurance period and that the producer wants to insure with LGM.
Adjusted Futures Price — The LGM futures price (calculated according to LGM rules) plus state- and month-specific LGM basis.
LGM Basis — An adjustment to the LGM fu-tures price to determine adjusted futures price. It is based on the historical difference between LGM futures price and the local cash price. The state- and month-specific basis numbers for cattle are 10-year averages calculated using price data from the National Agricultural Statistics Service
(NASS). State- and month-specific basis for swine are 5-year averages from NASS. (Soybean meal in LGM for Swine does not include a state- and month-specific basis adjustment.)
Expected Gross Margin (EGM) — The difference between the expected fed cattle or market swine selling price and the expected input prices. The expected input prices for cattle are the expected feeder cattle and corn prices, based on feeder cattle and corn futures markets respectively. The expected fed cattle selling price is based on live cattle futures. The expected input prices for swine are the expected soybean meal and corn prices, which are based on their respective futures con-tracts. The expected swine selling price is based on lean hog futures with a yield factor adjustment. The EGM is the gross margin that is expected at the end of each month of the insurance period at the time it is purchased. Once all EGMs are calcu-lated for each of the 11 target months (for cattle) and 6 target months (for swine), all monthly EGMs are multiplied by their respective monthly target marketings to equal the total EGM (see Sec-tion 2.4 for calculation).
Deductible — The portion of an insured value that producers elect not to insure, ranging from $0 to $150 per head in $10 per head increments for cattle and $0 to $20 per head in $2 per head incre-ments for swine.
Gross Margin Guarantee (GMG) — The total EGM minus a deductible (per head deductible times the number of livestock to be marketed).
Total Actual Gross Margin (AGM) — The dif-ference between the actual fed cattle or market swine selling prices and the actual input prices. The actual input prices for cattle include actual feeder cattle and corn prices based on the futures market. The actual input prices for swine include actual soybean meal and corn prices using futures market prices. (Both the actual and expected fed cattle and lean hog selling prices and the actual and expected input prices are more thoroughly explained in the detailed example in Section 2.4.) Once AGMs are calculated for each of the target months, all monthly AGMs are multiplied by their respective target marketings for those months. The total AGM is compared to the GMG to determine if an indemnity is due.

� ©TheBoardofRegentsoftheUniversityofNebraska.Allrightsreserved.
Figure 2.1. Expected and Actual Gross Margin Web page.
Indemnity — The amount paid by the insurance policy if the GMG, estimated prior to the insur-ance period, is higher than the total AGM realized after the insurance period. The indemnity is equal to the amount by which the GMG exceeds the total AGM. Indemnities are not paid until the end of the 11-month insurance period for cattle and 6-month insurance period for swine. The indem-nity is calculated by subtracting the total AGM from the GMG (both which are aggregated across all target marketings in the insurance period). Thus, indemnities are not paid monthly based on monthly target marketings and prices, but rather on all 11 or 6 months combined.
Yield Factor — A factor of 0.74 included in the swine EGM and AGM calculations to convert the CME lean hog futures price to a live hog equiva-lent price.
To summarize, target marketings are established for each target marketing month at the time of coverage purchase on the sales closing date. An EGM for each tar-get marketing month is also calculated at this time and then multiplied by each month’s respective target mar-
ketings. The GMG is then determined by subtracting the elected deductible from the EGM. After the insurance pe-riod (11 months for cattle and 6 months for swine) ends, an AGM is calculated for each target marketing month. The target marketings originally planned for each month are then multiplied by their respective AGM for each target marketing month. This yields a total AGM which is then used to determine if an indemnity is to be paid to the producer. An indemnity will be paid if the GMG is greater than the total AGM.
2.3 USDA-RMA Web site
The USDA Risk Management Agency (RMA) main-tains a Web site that provides expected and actual gross margins for all eligible states. All target marketing months and expected and actual gross margins have been archived for each eligible state since the program’s inception. It is available at http://www3.rma.usda.gov/apps/livestock_reports/. (Note that although this is a cattle example the concept and Web page is the same for swine.)
To access expected and actual gross margin informa-tion from the USDA-RMA Web site, follow these steps (after each of steps 1 and 2, click the “Next” button):
Row A Row B
Row C
Row D
Figure 2.1: Expected and Actual Gross Margin Webpage

©TheBoardofRegentsoftheUniversityofNebraska.Allrightsreserved. �
1. Select a crop year — When purchasing coverage, the first year listed is the most current year in which there exists target marketing months that are avail-able for coverage. Remember that the insurance crop year begins July 1 and ends June 30. If looking up an expected or actual gross margin from a year other than the current year, select the year in which cover-age was initially purchased from the drop-down list.
2. Select a state — This is the state in which the live-stock to be insured are located (see Section 1.4).
3. Select the commodity — The two commodities available are cattle and swine.
4. Click the “Create Report” button.
The USDA expected and actual gross margin page will look like Figure 2.1. The rows of interest are labeled on the table. The rows include:
Row A — Type of cattle feeding operation selected, either calf finishing or yearling finishing. Remem-ber swine finishing operations that will be listed are farrow to finish, feeder pig finishing, and segregated early weaned (SEW) pig finishing operations. Also included is the specific 11-month insurance period for cattle or 6-month insurance period for swine in which producers have purchased coverage. The beginning and ending months listed will change depending upon which sales closing date the LGM policy is purchased. The first insurance period listed in Figure 2.1 shows the months January through November, implying a Dec. 31 sales closing date. Basically, the sales closing date is one day before the first month of the insurance period listed.
Row B — Months of the insurance period are listed by number, with “1” being the first month of the insurance period (listed in Row A) and “11” being the last month of the insurance period for cattle (“6” will be the last month of the insurance period for swine). In Figure 2.1, the first insurance period listed represents month 1 as January and month 11 as November. Although “1” represents the first month of the insurance period, no coverage is avail-able during this month. Coverage does not begin until the second month of the insurance period, listed as “2” on the Web site (see Section 1.2).
Row C — Expected Gross Margin per head. The EGM per head is posted for each month in which livestock are insurable under the LGM policy of that particular insurance period.
Row D — Actual Gross Margin per head. The AGM per head is posted for each month in which livestock are insurable under the LGM policy of that particular insurance period. The AGMs are posted once RMA validates the price data (usually at the end of each insurable month) used to calculate the AGMs.
2.4 Purchasing LGM — An Example
At the time of coverage purchase, producers must choose the type of operation that best fits their situation. Again, the cattle operations include yearling finishing or calf finishing operations. The three swine operations insured by LGM are farrow to finish, feeder pig finishing, and SEW pig finishing operations. Each type of operation is accompanied with its own set of equations that allow an Expected Gross Margin (EGM) per head to be calculated for each target marketing month. The EGM per head for month t is calculated using one of the following equations:
Yearling Finishing Operation
EGMt = [12.50 cwt × Live Cattle Price
t ] – [7.50 cwt ×
Feeder Cattle Pricet-5
] – [57.5 bu × Corn Pricet-2
] (Equation 2.1)
Where Live Cattle Price is in $/cwt, Feeder Cattle Price is in $/cwt, Corn Price is in $/bu, and t is the target market-ing month.
Calf Finishing Operation
EGMt = [11.50 cwt × Live Cattle Price
t ] – [5.50 cwt ×
Feeder Cattle Pricet-8
] – [54.5 bu × Corn Pricet-4
](Equation 2.2)
Where Live Cattle Price is in $/cwt, Feeder Cattle Price is in $/cwt, Corn Price is in $/bu, and t is the target market-ing month.
Farrow to Finish
EGMt = [2.5 cwt × Swine Price
t × 0.74] – [(196.16 lbs
/ 2000 lbs/ton) × Soybean Meal Pricet-3
] – [13.86 bu × Corn Price
t-3]
(Equation 2.3)
Where Swine Price is in $/cwt, Soybean Meal Price is in $/ton, Corn Price is in $/bu, and t is the target marketing month.
Feeder Pig Finishing
EGMt = [2.5 cwt × Swine Price
t × 0.74] – [(132 lbs / 2000
lbs/ton) × Soybean Meal Pricet-2
] – [9.6 bu × Corn Pricet-2
](Equation 2.4)
Where Swine Price is in $/cwt, Soybean Meal Price is in $/ton, Corn Price is in $/bu, and t is the target marketing month.
SEW Pig Finishing
EGMt = [2.5 cwt × Swine Price
t × 0.74] – [(142 lbs / 2000
lbs/ton) × Soybean Meal Pricet-2
] – [9.7 bu × Corn Pricet-2
](Equation 2.5)
Where Swine Price is in $/cwt, Soybean Meal Price is in $/ton, Corn Price is in $/bu, and t is the target marketing month.

�0 ©TheBoardofRegentsoftheUniversityofNebraska.Allrightsreserved.
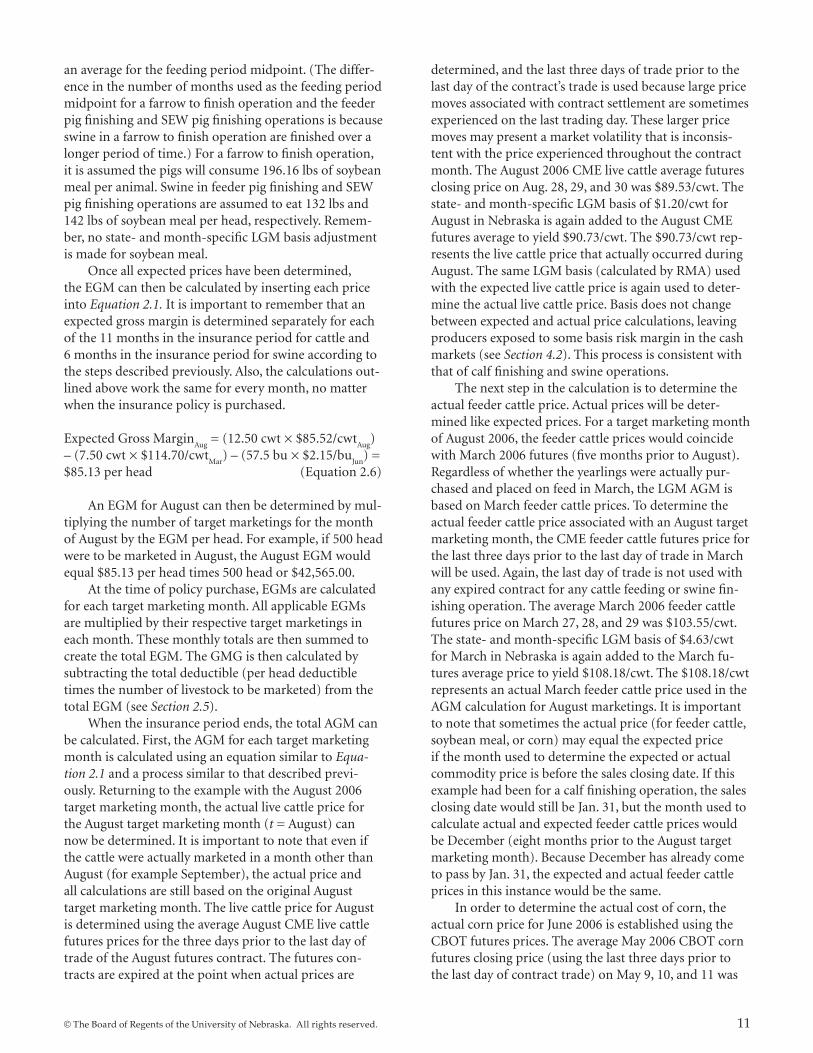
To calculate the EGM per head, consider, for exam-ple, a yearling finishing operation in Nebraska and a sales closing date of Jan. 31, 2006. To determine the expected live cattle price associated with an August target mar-keting month (t = August), the August CME live cattle closing futures price for the last three days in January is averaged. The average of the closing August 2006 live cattle futures price on Jan. 27, 30, and 31 was $84.32/cwt. (Note that because the sales closing date for swine is the second to last business day of the month, Jan. 26, 27, and 30 would be used to determine the average lean hog futures price.) The state- and month-specific LGM basis of $1.20/cwt for August in Nebraska is then added to the August futures average to yield $85.52/cwt. This basis number changes yearly and can be found on the RMA Web site at http://www.rma.usda.gov/livestock/. The $85.52/cwt represents the live cattle price expected in August as of Jan. 31. A different sales closing date, say February 2006, would have a different expected live cattle price for August 2006 because it would be based on the August live cattle futures average in the last three days of February. The same process is used for a calf finishing operation with an August target marketing month. The process for swine is also very similar. The only difference is that swine are finished and marketed sooner, so with a January sales closing date, the last target marketing month under any of the three swine operations would be July.
The next step in the calculation is to determine the expected feeder cattle price. Expected feeder cattle prices will be determined based on a standardized feeding period that is assumed to be 240 days for a calf finishing operation and 150 days for a yearling finishing operation. So, for a calf finishing operation, the expected feeder cattle price will be eight months prior to marketing (t – 8) and for a yearling finishing operation, five months (t – 5). Continuing the previous example of a yearling finishing operation with an August 2006 target market-ing month, the expected feeder cattle price would co-incide with March 2006 CME feeder cattle futures (five months before August). To determine the expected feed-er cattle price associated with an August target marketing month and Jan. 31 sales closing date, the March CME feeder cattle closing futures price for the last three days in January is averaged. The average March 2006 CME feeder cattle futures closing price on Jan. 27, 30, and 31 was $110.07/cwt. The state- and month-specific LGM basis of $4.63/cwt for March in Nebraska is then added to the March futures price to yield $114.70/cwt. The $114.70/cwt represents the feeder cattle price expected in March as of Jan. 31. For a calf finishing operation, the same pro-cess is done to calculate an expected feeder cattle price. However, in this case, December would be the placement month, and because there is no December feeder cattle futures, the average of November and January is used.
In order to determine the cost of corn, the expected corn price is established using the Chicago Board of Trade (CBOT) futures prices. For a calf finishing opera-tion, it is assumed the cattle will consume 54.5 bushels of corn per animal. Yearlings are assumed to eat 57.5 bushels of corn. For a farrow to finish operation, it is assumed the pigs will consume 13.86 bushels of corn per animal. Swine in feeder pig finishing and SEW pig finish-ing operations are assumed to eat 9.6 and 9.7 bushels of corn per head, respectively. These estimates are based on Iowa State University budgets and feed rations (see Sec-tion 1.3). Because livestock consume corn continuously throughout the feeding period and corn may be pur-chased on an as-needed basis, the midpoint of the feed-ing period (4 months for calves, 2 months for yearlings, 3 months for pigs in a farrow to finish operation, and 2 months for both feeder pigs and SEW pigs), is used as an average. In our example with a target marketing month of August 2006, the corn price would coincide with June 2006 prices for the yearling finishing operation (two months prior to August). Although the LGM policy calls for a June futures price for the August target marketing month, the CBOT does not have a June corn futures con-tract. Therefore, an average of the January closing prices for the futures months before and after June (May and July) is used. The average May 2006 corn futures price on Jan. 27, 30, and 31 was $2.28/bu. The average July 2006 corn futures price on Jan. 27, 30, and 31 was $2.37/bu. To determine the average June corn futures price for LGM, an average is calculated using May and July fu-tures, giving a June price of $2.33/bu (1/2 × $2.28/bu + 1/2 × $2.37/bu). The state- and month-specific LGM basis of -$0.18/bu for June in Nebraska is then added to the June futures average to yield $2.15/bu. The $2.15/bu represents the corn price expected in June as of Jan. 31. It is important to note that the average calculation in this case (and for fed cattle, feeder cattle, swine, and soybean meal) is actually a weighted average. The weights are based on the unequal time difference between the month being calculated and the surrounding contract months, allowing “closer” months to be more heavily weighted in the average. This is significant when calculating an aver-age corn price for a month like February where one of the surrounding months (December in this case) is two months prior to February. A simple average cannot be used, but instead a weighted average (1/3 × December Price + 2/3 × March Price) is used to determined the February futures price.
When calculating the EGM and AGM for swine, soy-bean meal prices are included in a way similar to the corn calculation described previously. Like corn, soybean meal is consumed continuously during the feeding period and may be purchased on an as-needed basis. Therefore, three months for pigs in a farrow to finish operation, and two months for both feeder pigs and SEW pigs is used as
©TheBoardofRegentsoftheUniversityofNebraska.Allrightsreserved. ��
an average for the feeding period midpoint. (The differ-ence in the number of months used as the feeding period midpoint for a farrow to finish operation and the feeder pig finishing and SEW pig finishing operations is because swine in a farrow to finish operation are finished over a longer period of time.) For a farrow to finish operation, it is assumed the pigs will consume 196.16 lbs of soybean meal per animal. Swine in feeder pig finishing and SEW pig finishing operations are assumed to eat 132 lbs and 142 lbs of soybean meal per head, respectively. Remem-ber, no state- and month-specific LGM basis adjustment is made for soybean meal.
Once all expected prices have been determined, the EGM can then be calculated by inserting each price into Equation 2.1. It is important to remember that an expected gross margin is determined separately for each of the 11 months in the insurance period for cattle and 6 months in the insurance period for swine according to the steps described previously. Also, the calculations out-lined above work the same for every month, no matter when the insurance policy is purchased.
Expected Gross MarginAug
= (12.50 cwt × $85.52/cwtAug
) – (7.50 cwt × $114.70/cwt
Mar) – (57.5 bu × $2.15/bu
Jun) =
$85.13 per head (Equation 2.6)
An EGM for August can then be determined by mul-tiplying the number of target marketings for the month of August by the EGM per head. For example, if 500 head were to be marketed in August, the August EGM would equal $85.13 per head times 500 head or $42,565.00.
At the time of policy purchase, EGMs are calculated for each target marketing month. All applicable EGMs are multiplied by their respective target marketings in each month. These monthly totals are then summed to create the total EGM. The GMG is then calculated by subtracting the total deductible (per head deductible times the number of livestock to be marketed) from the total EGM (see Section 2.5).
When the insurance period ends, the total AGM can be calculated. First, the AGM for each target marketing month is calculated using an equation similar to Equa-tion 2.1 and a process similar to that described previ-ously. Returning to the example with the August 2006 target marketing month, the actual live cattle price for the August target marketing month (t = August) can now be determined. It is important to note that even if the cattle were actually marketed in a month other than August (for example September), the actual price and all calculations are still based on the original August target marketing month. The live cattle price for August is determined using the average August CME live cattle futures prices for the three days prior to the last day of trade of the August futures contract. The futures con-tracts are expired at the point when actual prices are
determined, and the last three days of trade prior to the last day of the contract’s trade is used because large price moves associated with contract settlement are sometimes experienced on the last trading day. These larger price moves may present a market volatility that is inconsis-tent with the price experienced throughout the contract month. The August 2006 CME live cattle average futures closing price on Aug. 28, 29, and 30 was $89.53/cwt. The state- and month-specific LGM basis of $1.20/cwt for August in Nebraska is again added to the August CME futures average to yield $90.73/cwt. The $90.73/cwt rep-resents the live cattle price that actually occurred during August. The same LGM basis (calculated by RMA) used with the expected live cattle price is again used to deter-mine the actual live cattle price. Basis does not change between expected and actual price calculations, leaving producers exposed to some basis risk margin in the cash markets (see Section 4.2). This process is consistent with that of calf finishing and swine operations.
The next step in the calculation is to determine the actual feeder cattle price. Actual prices will be deter-mined like expected prices. For a target marketing month of August 2006, the feeder cattle prices would coincide with March 2006 futures (five months prior to August). Regardless of whether the yearlings were actually pur-chased and placed on feed in March, the LGM AGM is based on March feeder cattle prices. To determine the actual feeder cattle price associated with an August target marketing month, the CME feeder cattle futures price for the last three days prior to the last day of trade in March will be used. Again, the last day of trade is not used with any expired contract for any cattle feeding or swine fin-ishing operation. The average March 2006 feeder cattle futures price on March 27, 28, and 29 was $103.55/cwt. The state- and month-specific LGM basis of $4.63/cwt for March in Nebraska is again added to the March fu-tures average price to yield $108.18/cwt. The $108.18/cwt represents an actual March feeder cattle price used in the AGM calculation for August marketings. It is important to note that sometimes the actual price (for feeder cattle, soybean meal, or corn) may equal the expected price if the month used to determine the expected or actual commodity price is before the sales closing date. If this example had been for a calf finishing operation, the sales closing date would still be Jan. 31, but the month used to calculate actual and expected feeder cattle prices would be December (eight months prior to the August target marketing month). Because December has already come to pass by Jan. 31, the expected and actual feeder cattle prices in this instance would be the same.
In order to determine the actual cost of corn, the actual corn price for June 2006 is established using the CBOT futures prices. The average May 2006 CBOT corn futures closing price (using the last three days prior to the last day of contract trade) on May 9, 10, and 11 was

�� ©TheBoardofRegentsoftheUniversityofNebraska.Allrightsreserved.
$2.32/bu. The average July 2006 CBOT corn futures clos-ing price (using the last three days prior to the last day of contract trade) on July 11, 12, and 13 was $2.55/bu. To determine the average June corn futures price, an average using May and July CBOT corn futures is calculated, giv-ing a June price equal to $2.44/bu (1/2 × $2.32/bu + 1/2 × $2.55/bu). The state- and month-specific LGM basis of -$0.18/bu for June in Nebraska is again added to the June futures average to yield $2.26/bu. This is the same basis used in the expected corn price calculation. The $2.26/bu represents an actual June corn price used in the AGM calculation for August marketings.
Once all actual prices have been determined, the AGM can then be calculated by inserting each price into Equation 2.7.
Actual Gross MarginAug
= (12.50 cwt × $90.73/cwtAug
) – (7.50 cwt × $108.18/cwt
Mar) – (57.5 bu × $2.26/bu
Jun) =
$192.83 per head (Equation 2.7)
The AGM for August can then be determined by multiplying the number of target marketings for the month of August by the AGM per head. In this example, 500 head were targeted to be marketed in August, mak-ing the total AGM equal to $192.83 per head times 500 head or $96,415.00.
An indemnity will be paid if the GMG is higher than the total AGM. In this example, no indemnity is paid be-cause the GMG ($42,565.00) is less than the total AGM ($96,415.00). No indemnity was paid due to the way that the fed cattle, feeder cattle, and corn prices moved from January to August and essentially changed the gross mar-gin. The fed cattle price actually increased from $85.52/cwt to $90.73/cwt over the insurance period. Feeder cat-tle prices made a favorable move as well, decreasing from $114.70/cwt to $108.18/cwt. Unlike the other two com-modities, corn made an undesirable move in the market, increasing from $2.15/bu to $2.26/bu. The favorable moves in the fed cattle and feeder cattle markets more than compensated for the unfavorable move in the corn market, resulting in no indemnity payment because the AGM was higher than the insured GMG.
2.5 Premiums
At the time of policy purchase, producers can elect to not insure a portion of their expected gross margin by selecting a deductible between $0 and $150 per head in $10 per head increments for cattle and $0 to $20 per head in $2 per head increments for swine. Like any insurance policy, as deductibles increase, premiums decrease. Premiums depend on a number of factors, including the amount of coverage selected, a producer’s marketing plan (the number of livestock in various tar-get marketing months), the level of the futures prices,
and the amount of price volatility. Because the premiums are based on actual market prices, the cost of LGM insur-ance and available coverage levels vary each sales closing period.
The premiums are determined through a statistical simulation and not by a simple step-by-step equation. A determinant Monte Carlo simulation is used to calculate simulated losses from 5,000 random draws. These ran-dom draws are the same for every insured. Inputs into this simulation are projected monthly gross margin lev-els, 5,000 monthly gross margin draws, a marketing plan that shows the number of cattle marketed in each of the ten months (or the number of swine marketed in each of the five months), and a deductible level. RMA first calcu-lates the total EGM and GMG as explained in Section 2.4. A simulated total AGM for the insurance period is then determined and compared to the GMG to find simulated losses. The average of the simulated losses is then mul-tiplied by 1.03 to determine the total premium that will be paid by the producer. Further information regarding LGM for Cattle premium calculations can be accessed from RMA’s Web site at http://www.rma.usda.gov/poli-cies/2008/lgm/08LGMCattlePremCalc.pdf, and LGM for Swine premium calculations are available at http://www.rma.usda.gov/policies/2008/lgm/08LGMSwinePremCalc.pdf.
Producers cannot calculate the premiums them-selves. However, premiums and associated GMGs can be accessed from RMA’s online calculator at http://www.rma.usda.gov/apps/premcalc/. To access LGM premiums and GMGs via the USDA Web site, follow these steps:
1. New users must obtain a Login ID and Password. No fees are associated with setting up a new account, which can be set up by clicking on the words “New users click here.” Fill in the appropriate account and security information and return to the main menu. Once an account is set up, a list of choices will be displayed. Click “start a new calculation.”
2. Select a crop year — When purchasing coverage, the first year listed is the most current year in which there exists target marketing months available for coverage. Select the year in which coverage was ini-tially purchased from the drop-down list.
3. Select a state — This is the state in which the live-stock to be insured are located (see Section 1.4).
4. Select a county — This is the county in which the livestock to be insured are located. Premiums for LGM do not actually vary across counties within a state. USDA-RMA’s crop insurance premium pricing Web site is set up for this for crop insurance policies that do vary by county (e.g. Multi-Peril Crop Insur-ance, Crop Revenue Coverage, and Revenue Assur-ance).

©TheBoardofRegentsoftheUniversityofNebraska.Allrightsreserved. ��
5. Select an insurance plan — Choose Livestock Gross Margin.
6. Select the appropriate commodity — Choose either cattle or swine. Select the type of operation (calf or yearling for cattle, farrow to finish, finishing, or SEW pig finishing for swine) and the corresponding insurance period. Next enter the number of head corresponding to the appropriate target marketing month(s). A zero must be entered for the months
higher than the total AGM), the insurance company will issue a notice of probable loss (see Appendix 2) approxi-mately 10 days after all AGMs in the 11-month (cattle) or 6-month (swine) insurance period are released by RMA. Within 15 days of receipt of this notice, the producer must then submit a marketings report (see Appendix 3) and packer sales receipts to document that the livestock actually were marketed and sold in order to receive the indemnity payment.
2.7 Summary
This chapter covered technical terminology specific to the LGM policy such as target marketings, EGM, GMG, and total AGM. This chapter also explained ad-ditional LGM policy provisions and how actual and expected prices and margins are calculated. Premiums and deductibles were also discussed, and the chapter concluded with determining indemnities. Chapter 3 will provide additional detail on LGM policy provisions.
in which no livestock will be marketed. Choose the appropriate deductible and click “process quotes.” (It will take a few minutes for the quote to be pro-cessed.)
7. The following screen will appear after the quote is processed. A GMG and a producer premium are provided. Clicking on the “Detail Worksheet” or the “Producer Worksheet” will provide further informa-tion regarding the GMG and producer premium.
The premium for the initial insurance period must be paid in full at the time the application is due, other-wise the application will not be accepted. The premium for all subsequent insurance periods must be fully paid by the applicable sales closing date for each policy. Oth-erwise, all target marketings will be reduced to zero for each month of the insurance period (that the premium is not paid), and a producer will have no coverage for any livestock under that unpaid policy.
2.6 Indemnity Payments
Indemnities are not paid until the end of the insur-ance period and are based on the total AGM and GMG, so a loss in one particular month may be offset by gains in another month. The differences between the GMG and the total AGM are calculated, and an indemnity is paid if the actual is less than the guarantee. Because of this, it is possible for months when the AGM exceeds the GMG to offset those where the GMG is greater than the AGM. In the event that an indemnity is due (GMG is

�� ©TheBoardofRegentsoftheUniversityofNebraska.Allrightsreserved.
Check for Understanding: Chapter 2
1. T F The only difference between the total EGM and GMG is the amount of the deductible.
2. T F If the total AGM is greater than the GMG at the end of the insurance period, an indem-nity is paid.
3. When determining the EGM/AGM for a calf finishing operation, feeder cattle are assumed to have entered the feedlot ___ months before the planned target marketing month, whereas in a yearling operation, the feeder cattle are assumed to have entered the feedlot ___ months before the planned target marketing month.
4. T F The EGM for a particular month may change depending on when the coverage is pur-chased.
5. If the target marketing month for a SEW pig finishing operation is May, corn is priced using _________________ as the contract month.
6. T F When calculating the AGM/EGM and one of the inputs (feeder cattle, soybean meal, and/or corn) happens to be priced during a month in which there is no commodity contract traded (i.e., June for corn), the weighted average of the two contract months surrounding the month that the input is priced in (i.e., May and July corn) is used in-stead.
7. T F The state- and month-specific LGM basis (according to LGM rules) does not change when determining the EGM and AGM.
8. T F The higher the deductible chosen, the higher the premium that will be paid.
9. T F The premium and the application are due at the same time.
10. T F A producer does not need documented proof that insured livestock were sold in order to receive an indemnity.

©TheBoardofRegentsoftheUniversityofNebraska.Allrightsreserved. ��
Chapter 3Additional LGM Policy Provisions
In this chapter, you will learn:
specific perils protected by LGM insurance;livestock ownership and record keeping require-
ments of LGM;how LGM provides flexibility and guaranteed
premium pricing to producers;how to transfer coverage or assign an indemnity;
andhow LGM can reduce basis margin risk.
3.1 Introduction
Chapter 2 discussed the basic mechanics of LGM, in-cluding a description of terminology associated with the policy and step-by-step directions for finding Expected and Actual Gross Margins, Gross Margin Guarantees, and premium rates. The previous chapter also provided an in-depth example, which led to a discussion regarding how indemnities are determined and collected. This chap-ter focuses on the rules and policy provisions of LGM and addresses how these regulations affect producers.
3.2 Margin Protection Only
Recall from Chapter 1 that LGM provides protection against a decline in the cattle feeding and swine finish-ing margin by simultaneously hedging the input costs of corn and feeder cattle and the fed cattle selling price (LGM for Cattle) or the input costs of corn and soybean meal and the swine selling price (LGM for Swine) as a sort of bundled option. LGM insurance pays an in-demnity if the actual gross margin (AGM) established through a series of calculations by RMA (explained in Section 2.4) falls below the insured gross margin selected by the producer for the insurance period. LGM for Cattle is margin insurance that provides protection against de-creasing feed margins caused by live cattle price declines and/or feeder cattle price and corn price increases, while LGM for Swine provides protection against the decreas-ing finishing margins caused by lean hog prices dropping and/or soybean meal and corn prices rising. No other type of loss is covered by LGM, including mortality, condemnation, physical damage, changes in local basis, or poor animal performance. For example, if livestock do not gain or perform as well as the producer expected when insuring the livestock, the lower production is not insured. For example, assume a cattle feeder plans to sell 1,250 pound steers (the standardized LGM finished
weight for a yearling finishing operation) when pur-chasing LGM coverage, but the steers only weigh 1,150 pounds when marketed. The total value of the lower pro-duction (weight) is not insured; however, any indemnity paid (the difference between the GMG and the AGM) will be calculated based on the originally insured 1,250 pound steers. The 100 pound difference in the insured weight (1,250 pounds) and the actual weight (1,150 pounds) is not covered through LGM insurance.
Any death loss of insured livestock that occurs does not need to be reported to the insurance agent (this is different than LRP where death loss must be reported within 72 hours). If total actual marketings (livestock that are insured under LGM and actually sold) are less than 75 percent of total target marketings (number of slaughter-ready livestock that are expected to be mar-keted in an insurance period and that are insured with LGM) for the 11-month (cattle) or 6-month (swine) insurance period, a producer’s indemnity will be reduced by the percent that the total actual marketings for the insurance period fall below the total target marketings for the period (the premium will not be reduced). For example, if 500 head of cattle are to be marketed during the 11-month insurance period, but the producer reports only sale receipts for 350 head due to a large death loss, only 70 percent of the slated target marketings were sold. This in turn reduces the producer’s indemnity by 30 per-cent. This adjustment to the indemnity is for the entire 11-month insurance period, not individual target mar-keting months. On the other hand, as long as the produc-er markets at least 75 percent of the marketings during the insurance period (even though some death loss does occur), the insurance coverage remains unchanged and indemnities are not reduced. Returning to the previous example with 500 head being marketed, if the producer sold only 400 head due to death loss (80 percent of target marketings), the insurance coverage and any indemnity payments are still determined as though the producer marketed 500 head in the target marketing months that he/she originally assigned cattle. So, adjustments are made only if producers market less than 75 percent of the total head during the insurance period. Note, how-ever, that LGM does not insure the total value of animals that die, but it is possible to collect an indemnity on those animals if there was one due as a result of the total AGM being less than the GMG.
Another issue to consider regarding livestock owner-ship is the cash sale date of the cattle or swine. It may be difficult for a cattle feeder or swine finisher to time the selling of the insured livestock within the specified target

�� ©TheBoardofRegentsoftheUniversityofNebraska.Allrightsreserved.
marketing month. This may be due to production issues, such as the livestock gaining weight faster or slower than expected. However, as long as the cattle feeder or swine finisher markets at least 75 percent of the proposed tar-get marketings during the 11-month or 6-month insur-ance period, respectively, the insurance coverage remains unchanged and indemnities are not reduced. Basically, it does not matter if the actual marketing date of livestock differs by a month (or more) from the target marketing month(s) specified in the LGM insurance policy as long as producers market at least 75 percent of the proposed target marketings in the insurance period. Although indemnity calculations are unaffected and made accord-ing to the planned target marketing month, producers may experience a fluctuating price spread (between the AGM and cash gross margin) depending upon the sale date of the livestock. If cattle or swine are not sold in the specified target marketing month, cash gross mar-gins in the previous or latter months may be higher or lower than the cash gross margin of the target market-ing month. This would lead to varying price spreads that are not insured depending upon when the livestock were actually marketed. This is less of an issue in swine because standardized feeding has allowed for better mar-ket and slaughter timing (see Section 1.3).
The LGM policy does not prohibit a policy holder from obtaining separate insurance coverage for any other peril such as lightning, drowning, or full mortality. How-ever, in order to protect against any of these losses, cattle feeders and swine finishers must obtain a separate prop-erty and casualty insurance policy because these are not losses insured by LGM.
3.3 Livestock Records
As Section 1.5 discussed, the producer purchasing LGM coverage must have substantial beneficial interest (SBI) in the insured livestock. An example of this form can be seen in Appendix 1. Producers must also keep accurate records regarding livestock insured with LGM. Certified by the producer, target marketings are subject to inspection by the insurance agent in order to verify the marketings. All records relating to the feeding, finishing, and sale of the cattle, or the breeding, farrowing, feeding, finishing, and sale of the swine, as well as an examina-tion of the livestock themselves, are subject to inspection. Producers must retain all records for three years after the 11-month insurance period for cattle or 6-month insur-ance period for swine has ended. These records include, but are not limited to, purchase, feeding, shipment, sale, or other documents of transfers of all livestock insured and not insured. RMA may also request records relat-ing to the insured livestock from anyone who may have custody of the records, including packers, financial institutions, shippers, sale barns, terminals, cooperatives,
associations, or accountants. It is the producer’s respon-sibility to assist in obtaining all records from third parties requested by RMA.
3.4 Guaranteed Pricing
One important distinction between LGM insur-ance and futures and options contracts is the process by which prices, and essentially indemnities, are deter-mined. Futures and options prices are negotiated in the market; whereas, LGM prices are established according to pricing and basis regulations established by RMA (see Section 2.4). The prices associated with LGM are still based on the futures and options markets though. Gen-erally speaking, the options market has a relatively low volume of trades, particularly for deferred months (those contracts several months in the future). This implies that when buying an option, it is unlikely that a cattle feeder or swine finisher will necessarily be able to buy at the price most recently traded, but rather may have to “move the market” to fill his/her order between the last traded/quoted price and the new fill price. The reason for this difference is that a bid/ask spread exists in the options market (as well as the futures market) because prices are negotiated by buyers and sellers. The bid/ask spread refers to the difference between the bid price (how much buyers are offering to pay) and the asking price (how much sellers want in order to sell). Because the options market may be lightly traded, buying an option may require the buyer to bid higher than the current market price to get the order filled and buy the contract. For example, if a given put option is trading at a cost of $0.90/cwt, a potential buyer may have to bid at $0.95/cwt to find a willing seller; the buyer has to bid the price higher to buy the options contract depending on market conditions. This means someone wanting to hedge with options contracts might not know exactly how much the price coverage will cost until after the purchase is made (when using a market order).
LGM insurance premiums are established by RMA on the sales closing date of each month. Once set, the expected gross margins for specific target marketing months and premiums are guaranteed and will not change. This allows feeders and finishers to know pre-cisely what price level will be insured and how much the coverage will cost.
3.5 Coverage Transfer and Indemnity Assignment
At times it may be advantageous to be able to grant the right to receive an LGM indemnity payment to another person or entity, like a lender. LGM provides two alternatives for doing so. One method involves transfer-ring ownership of the insured livestock and LGM insur-

©TheBoardofRegentsoftheUniversityofNebraska.Allrightsreserved. ��
ance policy, while the second involves assigning only the indemnity payment — ownership of the livestock does not change. With the first type, if an insured party trans-fers ownership of any portion of the covered livestock, the insurance coverage for that portion of the livestock can be transferred as well, so long as the new owner is eligible for LGM insurance. To transfer coverage, a Transfer of Right to Indemnity Form must be filed with the current owner’s insurance agent and approved by the company before the transfer takes effect. An example of this form is in Appendix 4. A logical question might be whether the livestock being sold are worth more because they are insured. The answer depends on the insured gross margin, current market conditions, and the amount of time left until the end of the insurance period. If the insured gross margin is substantially higher than the current gross margin and the expiration date is near, the seller may be able to have part of the insurance’s expected indemnity bid into a higher price. However, if the current gross margin is higher than the insured gross margin, there may be little added value in the insurance on the livestock.
Assigning the right to collect the indemnity does not involve a change in ownership of the insured livestock and policy. Instead, the owner transfers the right to col-lect an indemnity payment from the insurance coverage. The insured owner files an Assignment of Indemnity Form with the insurance company, and, once approved, the party assigned the right to the indemnity (the as-signee) has all rights to claim any indemnity that may be due. If any indemnity is due, the actual owner of the livestock can still file a marketings report within 15 days of receiving a notice of probable loss. If the actual owner fails to do so, the assignee may submit the market-ing report no later than 15 days after the initial 15-day period has expired. Assigning an indemnity payment to another party may be useful if the second party has a collateral interest in the cattle or swine, such as a lender that provided financing. See Appendix 5 for an example of an Assignment of Indemnity Form. Filing a claim for an indemnity was discussed in Section 2.6. In order for the assignee to collect the indemnity, the livestock owner (who holds the policy) must not violate any policy pro-visions that might void the coverage as discussed in the next section.
3.6 Hedging Considerations with LGM
One aspect of LGM that differentiates it from futures or options hedging is LGM’s status as an insurance prod-uct. Unlike futures or options contracts, LGM is techni-cally not considered a derivative product even though the coverage is similar to that available in the derivatives market (i.e., options market). LGM is reinsured by the Federal Crop Insurance Corporation (FCIC), and
although no producer premium subsidy is available for this insurance program like that offered through crop insurance programs, all administrative and policy expenses incurred by the crop insurance companies are paid by the federal government rather than insured producers. Therefore, cattle feeders and swine finishers purchase LGM without commission or administrative fees; with futures or options hedging, each trade has an associated commission fee.
Insuring cattle or swine with both Livestock Risk Protection (LRP) Insurance and LGM is prohibited. A producer can, however, insure livestock with LRP, and once the policy is lifted, insure the same livestock with LGM. For example, a producer may choose to back-ground 550 pound calves on pasture before placing them into the feedlot. In this instance, the 550 pound calves could be insured with LRP. Once the LRP policy is lifted (assume calves are now 750 pounds and in the feedlot), the producer could insure the same cattle with LGM. Interestingly, producers can use offsetting transactions in the futures and options markets to effectively lift an LGM hedge. This can be accomplished by reversing the protection provided by LGM for Cattle through the use of short feeder cattle and corn calls and short fed cattle puts. Using short soybean meal and corn calls and short lean hog puts would reverse the protection LGM for Swine offers. It is important to note that the insured party cannot sell the LGM coverage back to the insur-ance company to recover any premiums. This restriction means that LGM coverage cannot be lifted using the latter method. Once the coverage is purchased, it will remain in place until the end of the insurance period and the coverage expires. (The policy will continue in force for each succeeding 11-month or 6-month insur-ance period purchased unless canceled or terminated by way of written notice on or before the cancellation date from either the insurance agent or the insured.) This means the only date the coverage has value is on the end date when an indemnity is determined. A lender or other party with collateral interest in the insured livestock may view this restriction favorably. However, some producers may prefer the flexibility provided by futures or options contracts, because they can be bought or sold any time the markets are trading. If the hedged livestock are sold earlier than expected, the futures or options hedge can be lifted at that time. Also, a futures hedge can be lifted early if markets have moved such that a profit on the hedging instrument can be captured. For example, if a producer is short live cattle at $96.00/cwt, and the market drops to $90.00/cwt, the producer can capture the $6.00/cwt profit in the futures market and then speculate on the cash price from there.
While LGM is based on futures market prices and provides protection similar to a bundled option on futures contracts, producers using LGM take no futures
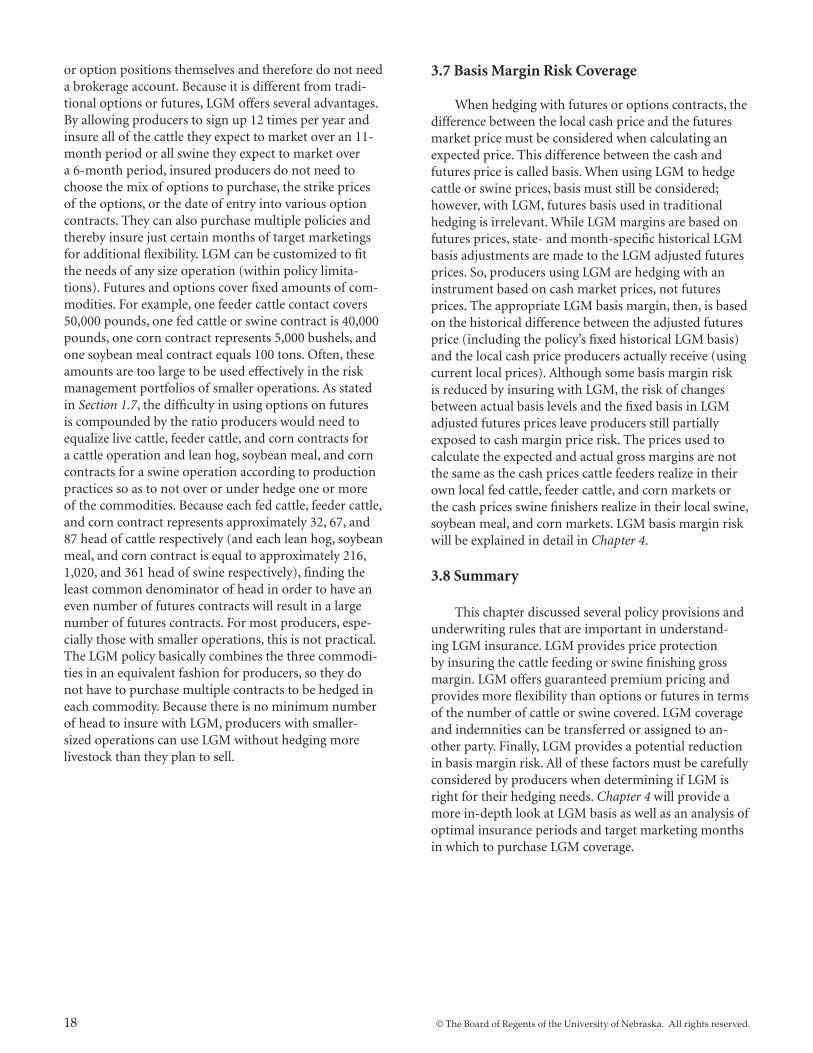
�� ©TheBoardofRegentsoftheUniversityofNebraska.Allrightsreserved.
or option positions themselves and therefore do not need a brokerage account. Because it is different from tradi-tional options or futures, LGM offers several advantages. By allowing producers to sign up 12 times per year and insure all of the cattle they expect to market over an 11-month period or all swine they expect to market over a 6-month period, insured producers do not need to choose the mix of options to purchase, the strike prices of the options, or the date of entry into various option contracts. They can also purchase multiple policies and thereby insure just certain months of target marketings for additional flexibility. LGM can be customized to fit the needs of any size operation (within policy limita-tions). Futures and options cover fixed amounts of com-modities. For example, one feeder cattle contact covers 50,000 pounds, one fed cattle or swine contract is 40,000 pounds, one corn contract represents 5,000 bushels, and one soybean meal contract equals 100 tons. Often, these amounts are too large to be used effectively in the risk management portfolios of smaller operations. As stated in Section 1.7, the difficulty in using options on futures is compounded by the ratio producers would need to equalize live cattle, feeder cattle, and corn contracts for a cattle operation and lean hog, soybean meal, and corn contracts for a swine operation according to production practices so as to not over or under hedge one or more of the commodities. Because each fed cattle, feeder cattle, and corn contract represents approximately 32, 67, and 87 head of cattle respectively (and each lean hog, soybean meal, and corn contract is equal to approximately 216, 1,020, and 361 head of swine respectively), finding the least common denominator of head in order to have an even number of futures contracts will result in a large number of futures contracts. For most producers, espe-cially those with smaller operations, this is not practical. The LGM policy basically combines the three commodi-ties in an equivalent fashion for producers, so they do not have to purchase multiple contracts to be hedged in each commodity. Because there is no minimum number of head to insure with LGM, producers with smaller-sized operations can use LGM without hedging more livestock than they plan to sell.
3.7 Basis Margin Risk Coverage
When hedging with futures or options contracts, the difference between the local cash price and the futures market price must be considered when calculating an expected price. This difference between the cash and futures price is called basis. When using LGM to hedge cattle or swine prices, basis must still be considered; however, with LGM, futures basis used in traditional hedging is irrelevant. While LGM margins are based on futures prices, state- and month-specific historical LGM basis adjustments are made to the LGM adjusted futures prices. So, producers using LGM are hedging with an instrument based on cash market prices, not futures prices. The appropriate LGM basis margin, then, is based on the historical difference between the adjusted futures price (including the policy’s fixed historical LGM basis) and the local cash price producers actually receive (using current local prices). Although some basis margin risk is reduced by insuring with LGM, the risk of changes between actual basis levels and the fixed basis in LGM adjusted futures prices leave producers still partially exposed to cash margin price risk. The prices used to calculate the expected and actual gross margins are not the same as the cash prices cattle feeders realize in their own local fed cattle, feeder cattle, and corn markets or the cash prices swine finishers realize in their local swine, soybean meal, and corn markets. LGM basis margin risk will be explained in detail in Chapter 4.
3.8 Summary
This chapter discussed several policy provisions and underwriting rules that are important in understand-ing LGM insurance. LGM provides price protection by insuring the cattle feeding or swine finishing gross margin. LGM offers guaranteed premium pricing and provides more flexibility than options or futures in terms of the number of cattle or swine covered. LGM coverage and indemnities can be transferred or assigned to an-other party. Finally, LGM provides a potential reduction in basis margin risk. All of these factors must be carefully considered by producers when determining if LGM is right for their hedging needs. Chapter 4 will provide a more in-depth look at LGM basis as well as an analysis of optimal insurance periods and target marketing months in which to purchase LGM coverage.

©TheBoardofRegentsoftheUniversityofNebraska.Allrightsreserved. ��
Check for Understanding: Chapter 3
1. T F LGM does not insure against production losses (e.g., poor feeding performance).
2. T F Livestock death loss must be reported to the insurance agent when using LGM.
3. T F An indemnity would be reduced if less than 75 percent of total marketings were sold for the insurance period.
4. T F When insuring livestock with LGM, producers can use other insurance policies to protect against other perils such as lightning.
5. T F Calculation of an indemnity is based on the month the livestock are actually sold rather than the planned target marketing month.
6. T F When granting the right to receive an indemnity payment to another party under LGM provisions, one alternative involves giving up ownership of the livestock and the LGM policy, and the other involves the right to collect the indemnity payment.
7. T F LGM premiums are subsidized by the federal government.
8. T F Livestock insured with LGM cannot be insured with LRP at the same time.
9. T F It is possible to offset LGM by selling the policy back to the insurance company at any time during the insurance period.
10. T F LGM does not insure against basis margin risk.

�0 ©TheBoardofRegentsoftheUniversityofNebraska.Allrightsreserved.
Chapter 4LGM for Cattle Basis Margin and Purchasing Considerations
In this chapter you will learn:how LGM basis margin differs from traditional
futures basis; andoptimal times to purchase LGM insurance based
on historical prices.
4.1 Introduction
Chapter 3 discussed many of the advantages and disadvantages related to LGM insurance. By describing several rules and policy provisions associated with the program, producers can better understand how the regu-lations affect their operation and risk management deci-sions. Chapter 4 focuses on optimal insurance periods and target marketing months to purchase coverage as well as LGM basis margin considerations for both calf and yearling finishing operations. Note that even though the chapter focuses on the two cattle feeding operations covered by LGM, the same concepts may be applied to the farrow to finish, feeder pig finishing, and SEW pig finishing operations. However, price, basis, and indem-nity payment patterns will be different.
4.2 LGM Basis Margin vs. Futures Basis
As described in the previous three chapters, LGM for Cattle insurance protects against adverse price movements associated with the cattle feeding margin by simultaneously hedging live cattle, feeder cattle, and corn. Figure 4.1 shows monthly average futures prices for these three commodities from January 1995 to May 2007. As the graph shows, all three markets have seen significant movement throughout the last several years. Not only have the three respective prices changed consid-erably over time, but the relationship or spread between them has changed. Because this spread influences cattle feeding profits, the use of LGM insurance to protect this spread is appropriate to consider. Remember, however, that LGM insurance indemnifies feeding margins by using adjusted futures prices (three-day average futures prices adjusted for a state- and month-specific LGM ba-sis). Therefore, LGM insurance uses a cash price equiva-lent in hedging margins. But, LGM insurance leaves
producers partially exposed to cash margin price risk, more specifically the risk of changes between their actual selling and purchase prices (their actual margin) and the LGM selling and purchase prices (the EGM and AGM).
When using traditional options or futures contracts to protect against price level changes, hedgers remain exposed to basis risk, a change in the difference between their local cash price and the futures price at which they bought or sold. However, hedging is an effective risk management strategy because basis is typically much less variable than price level. Hedging eliminates price risk, but it does not eliminate futures basis risk, the difference between producers’ selling or purchase price and futures price. Similar to using futures or options, cattle produc-ers using LGM insurance to hedge feeding margins are also exposed to a type of basis risk. The prices used to calculate the expected and actual gross margins for cattle feeding are not the same as the cash prices producers re-alize in their own local fed cattle, feeder cattle, and corn markets. Even though LGM prices and margins are ad-justed to the monthly historical cash prices for the state, a producer’s actual margin realized by selling and buying in the cash market will be different. This is because LGM adjustments are based on historical cash prices, not cash prices for that year. The difference between actual cash prices the producer pays and receives in a particular year (i.e., the actual cash margin) differs from the relation-ship between the historical cash prices and LGM adjusted futures prices used in the LGM for Cattle policy. This difference is called LGM basis margin. To the extent that LGM basis margin changes, producers have margin risk even with LGM hedging.
Figures 4.2 and 4.4 illustrate the LGM AGM and the Nebraska cash AGM for both yearling and calf finishing operations from December 1994 to January 2007. The corresponding difference between the LGM AGM and Nebraska cash AGM, or LGM basis margin, is shown in Figures 4.3 and 4.5. Although the LGM AGM closely follows the Nebraska cash AGM for both types of opera-tions, the fact that the LGM AGM does not identically mirror the Nebraska cash AGM implies that LGM insur-ance leaves producers exposed to basis margin risk. And, the LGM basis margin risk appears to have increased over time.

©TheBoardofRegentsoftheUniversityofNebraska.Allrightsreserved. ��
Feeder Cattle, Live Cattle, and Corn Average Monthly Futures Prices, January 1995 to May 2007
35
45
55
65
75
85
95
105
115
125
Jan-95
Jul-9
5
Jan-96
Jul-9
6
Jan-97
Jul-9
7
Jan-98
Jul-9
8
Jan-99
Jul-9
9
Jan-00
Jul-0
0
Jan-01
Jul-0
1
Jan-02
Jul-0
2
Jan-03
Jul-0
3
Jan-04
Jul-0
4
Jan-05
Jul-0
5
Jan-06
Jul-0
6
Jan-07
Date
Cat
tle P
rice
($/c
wt)
1.50
2.00
2.50
3.00
3.50
4.00
4.50
5.00
5.50
Cor
n Pr
ice
($/b
u)
Feeder CattleLive CattleCorn
Source: CRB and University of Nebraska-Lincoln
Figure 4.1.
Source: University of Nebraska–Lincoln
LGM Actual Gross Margin and Nebraska Cash Actual Gross Margin, Yearling Finishing Operation, 1994-2007
$0
$100
$200
$300
$400
$500
$600
Dec-94 Dec-95 Dec-96 Dec-97 Dec-98 Dec-99 Dec-00 Dec-01 Dec-02 Dec-03 Dec-04 Dec-05 Dec-06
Date
Act
ual G
ross
Mar
gin/
Hea
d
LGM AGMNE Cash AGM
Source: University of Nebraska-Lincoln
Figure 4.3
-$100
-$50
$0
$50
$100
$150
$200
$250
Dec-94 Dec-95 Dec-96 Dec-97 Dec-98 Dec-99 Dec-00 Dec-01 Dec-02 Dec-03 Dec-04 Dec-05 Dec-06
Date
LGM
Bas
is ($
/hea
d)
Source: University of Nebraska-Lincoln
LGM Basis, Yearling Finishing Operation, 1994-2007
Figure 4.2.
Source: University of Nebraska–Lincoln
Act
ual G
ross
Mar
gin
($/h
ead)

�� ©TheBoardofRegentsoftheUniversityofNebraska.Allrightsreserved.
LGM Actual Gross Margin and Nebraska Cash Actual Gross Margin, Yearling Finishing Operation, 1994-2007
$0
$100
$200
$300
$400
$500
$600
Dec-94 Dec-95 Dec-96 Dec-97 Dec-98 Dec-99 Dec-00 Dec-01 Dec-02 Dec-03 Dec-04 Dec-05 Dec-06
Date
Act
ual G
ross
Mar
gin/
Hea
d
LGM AGMNE Cash AGM
Source: University of Nebraska-Lincoln
Figure 4.3
-$100
-$50
$0
$50
$100
$150
$200
$250
Dec-94 Dec-95 Dec-96 Dec-97 Dec-98 Dec-99 Dec-00 Dec-01 Dec-02 Dec-03 Dec-04 Dec-05 Dec-06
Date
LGM
Bas
is M
argi
n ($
/hea
d)
Source: University of Nebraska-Lincoln
LGM Basis Margin, Yearling Finishing Operation, 1994-2007
Source: University of Nebraska–Lincoln
Figure 4.3.
LGM Actual Gross Margin and Nebraska Cash Actual Gross Margin, Calf Finishing Operation, 1994-2007
$0
$100
$200
$300
$400
$500
$600
Dec-94 Dec-95 Dec-96 Dec-97 Dec-98 Dec-99 Dec-00 Dec-01 Dec-02 Dec-03 Dec-04 Dec-05 Dec-06
Date
Act
ual G
ross
Mar
gin
($/H
ead)
LGM AGMNE Cash AGM
Source: University of Nebraska-Lincoln
Figure 4.5
-$100
-$50
$0
$50
$100
$150
$200
Dec-94 Dec-95 Dec-96 Dec-97 Dec-98 Dec-99 Dec-00 Dec-01 Dec-02 Dec-03 Dec-04 Dec-05 Dec-06
Date
LGM
Bas
is ($
/hea
d)
Source: University of Nebraska-Lincoln
LGM Basis, Calf Finishing Operation, 1994-2007
Source: University of Nebraska–Lincoln
Figure 4.4.
Act
ual G
ross
Mar
gin
($/h
ead)

©TheBoardofRegentsoftheUniversityofNebraska.Allrightsreserved. ��
-$100
-$50
$0
$50
$100
$150
$200
Dec-94 Dec-95 Dec-96 Dec-97 Dec-98 Dec-99 Dec-00 Dec-01 Dec-02 Dec-03 Dec-04 Dec-05 Dec-06
Date
LGM
Bas
is M
argi
n ($
/hea
d)
Source: University of Nebraska-Lincoln
LGM Basis Margin, Calf Finishing Operation, 1994-2007
Source: University of Nebraska–Lincoln
Figure 4.5.
4.3 LGM for Cattle Purchasing Opportunities
In each month of an insurance period, excluding the first month, producers are able to insure a specified number of livestock up to LGM program limits. An in-demnity will be paid if the insured GMG for the insur-ance period is greater than the total AGM at the end of the insurance period. Recall that LGM can be purchased at the end of each month to insure cattle marketings over the next 11-month time period. Depending upon which month LGM is purchased, the EGM for a particular month, and therefore the GMG, may be different. For example, if a feeder purchases LGM insurance in Janu-ary to insure cattle to be marketed in August and another feeder also insures August marketings but buys LGM in March, the EGM will be different because different sales closing dates are used. As a result, the producers could have different GMGs for their insurance period due to differences in the EGM (even with the same deductible). Therefore, it is important for producers to consider the “best” or “optimal” time to purchase LGM insurance. For many, an appropriate risk management strategy is to routinely hedge all marketings long before the feeder cat-tle are purchased. Others may try to implement a strat-egy that has a higher probability of paying an indemnity.
Figures 4.6-4.17 and Figures 4.20-4.31 for yearling finishing operations and calf finishing operations, re-spectively, illustrate the average indemnities for each target marketing month by sales closing date from 1996 to 2006. Using Figure 4.6 as an example, the graph shows
the indemnities associated with a January target mar-keting month (t) for the sales closing dates the previ-ous November (t-2) back through February (t-11). The indemnities shown for the November sales closing date are the average indemnities paid from 1996 to 2006 for January target marketings (assuming no other cattle in the insurance period) for just those years with a posi-tive indemnity (the blue or dark bars) and for all years including those with a zero indemnity (the red or light bars). The numbers across the top show the number of years out of 11 (1996-2006) in which an indemnity was available. So, for January marketings with a November sales closing date, an indemnity was paid 7 out of the 11 years. This analysis is shown for all target marketing months (January through December) according to every possible sales closing date for both yearling (Figures 4.6-4.17) and calf finishing (Figures 4.20-4.31) operations. It is important to note that indemnities paid to produc-ers are not determined on a monthly basis like shown in these graphs, but rather at the end of the 11-month insurance period based on the GMG and the total AGM. Therefore, these scenarios imply that target marketings are specified in only one month of the 11 month insur-ance period. These graphs do not imply that every target marketing month is accompanied with an indemnity, but rather some months may be more likely to have an EGM that is higher than the AGM based on historical prices, depending upon which sales closing date is chosen.
While the information in Figures 4.6-4.17 and 4.20-4.31 should be used with caution as historical indemni-

�� ©TheBoardofRegentsoftheUniversityofNebraska.Allrightsreserved.
ties do not necessarily imply payment of indemnities in the future, the information can be helpful in gaining perspective on when to purchase LGM insurance. For example, indemnity payments generally tended to be largest for winter target marketing months and smallest for summer target marketing months. Additionally, for some target marketing months (e.g., January), indemnity payments are larger when LGM insurance is purchased several months before the target marketing month. It is also important to consider the likelihood of the payout along with the level of indemnity paid. For example, the largest average indemnity (for years when one was paid) for September target marketings (Figure 4.14) was for the May sales closing date. However, this nearly $70/head indemnity is based on only two years out of eleven hav-ing an indemnity. Average indemnities across all years was highest for the December sales closing date for Sep-tember marketings. However, February and March sales closing dates had the largest payout ratio for September marketings (Figure 4.14).
Figures 4.18 (yearling finishing) and 4.32 (calf finish-ing) reinforce the previous discussion by portraying the difference between the EGM and the AGM according to the sales closing month when LGM was purchased for each target marketing month from December 1995 to January 2007. The top of the vertical line represents the largest difference between the EGM and AGM, or the largest indemnity that was paid for that target marketing month (if positive), depending on when the insurance was purchased. Similarly, the bottom of the line is the smallest difference between the EGM and AGM. If the AGM exceeded the EGM, the difference is negative and no indemnity would have been paid. The horizontal dash attached to the right side of the vertical line (and found between the minimum and maximum points) represents the average indemnity for the specified target market-ing month across all applicable sales closing dates. This value includes the dates where the EGM was higher or lower than the AGM for the specified target marketing month. In December 1995 (Figure 4.18), for example, the maximum indemnity for the December target marketing month across all applicable sales closing dates (January 1995 to October 1995) was $15.70/head, implying that the EGM was higher than the AGM at the maximum and
an indemnity would be paid at this level. The minimum for December 1995 was -$35.33/head, implying that the EGM was actually less than the AGM at the minimum, and no indemnity would have been paid. In the Decem-ber 1995 example, the average difference between the EGM and AGM was -$19.02/head. This means that the EGM, on average, was less than the AGM for the Decem-ber 1995 target marketing month across its applicable sales closing dates. The trends evident in Figure 4.18 and 4.32 indicate that indemnities would be paid for certain periods of time. These times (when the difference be-tween the EGM and AGM were positive) correspond to times of low cattle feeding margins and profitability.
Again, it is important to remember that indemni-ties for the insurance period are not determined on a monthly basis as shown in the figures in this chapter, but rather at the end of the insurance period based on the GMG and the total AGM. Figures 4.19 (yearling fin-ishing) and 4.33 (calf finishing) show the indemnities paid (assuming a $0 deductible) from 1996 to 2005 by sales closing date for the succeeding 11-month insur-ance period with one head insured in each of the target marketing months. In many instances, no indemnity was paid because the total AGM was greater than the insured GMG for the insurance period. In many of the previous graphs (shown on a monthly basis), the EGM was of-ten higher than the AGM, suggesting that an indemnity would be paid at the end of the insurance period if the majority of individual months in the insurance period are accompanied with an EGM that is higher than the AGM. But, in some cases, it is possible for target mar-keting months in the insurance period, when the AGM exceeds the EGM, to offset those months when the EGM is greater than the AGM. Because indemnities are based on an insured GMG and an AGM that are totaled across eleven months, the payment of an indemnity is averaged out over the insurance period, weighted according to the insured target marketings for each month. The idea that individual months have an accompanied indemnity pay-ment is irrelevant (unless target marketings are insured for only one month) because indemnities are not paid on a monthly basis, but rather at the end of the 11-month insurance period.

©TheBoardofRegentsoftheUniversityofNebraska.Allrightsreserved. ��
Figure 4.6.
Source: University of Nebraska–Lincoln
Source: University of Nebraska–Lincoln
Figure 4.7.
Average Yearling LGM Indemnities for January, By Sales Closing Date, 1996-2006
434353457 4
0
20
40
60
80
100
120
140
Nov Oct Sep Aug Jul Jun May Apr Mar Feb
Sales Closing Date
Inde
mni
ties
($/h
ead)
Indemnity (Years With Indemnity)Indemnity (All Years)
Years With Indemnity Payouts (out of 11)
Source: University of Nebraska-Lincoln
Average Yearling LGM Indemnities for February, By Sales Closing Date, 1996-2006
6654545654
0
20
40
60
80
100
120
140
Dec Nov Oct Sep Aug Jul Jun May Apr Mar
Sales Closing Date
Inde
mni
ties
($/h
ead)
Indemnity (Years With Indemnity)Indemnity (All Years)
Years With Indemnity Payouts (out of 11)
Source: University of Nebraska-Lincoln

�� ©TheBoardofRegentsoftheUniversityofNebraska.Allrightsreserved.
Source: University of Nebraska–Lincoln
Figure 4.8.
Source: University of Nebraska–Lincoln
Figure 4.9.
Average Yearling LGM Indemnities for April, By Sales Closing Date, 1996-2006
56 6 6 4 4 4 4 5 5
0
20
40
60
80
100
120
140
Feb Jan Dec Nov Oct Sep Aug Jul Jun May
Sales Closing Date
Inde
mni
ties
($/h
ead)
Indemnity (Years With Indemnity)Indemnity (All Years)
Years With Indemnity Payouts (out of 11)
Source: University of Nebraska-Lincoln
Average Yearling LGM Indemnities for March, By Sales Closing Date, 1996-2006
55 4 5 5 5 5 5 5 5
0
20
40
60
80
100
120
140
Jan Dec Nov Oct Sep Aug Jul Jun May Apr
Sales Closing Date
Inde
mni
ties
($/h
ead)
Indemnity (Years With Indemnity)Indemnity (All Years)
Years With Indemnity Payouts (out of 11)
Source: University of Nebraska-Lincoln

©TheBoardofRegentsoftheUniversityofNebraska.Allrightsreserved. ��
Source: University of Nebraska–Lincoln
Figure 4.10.
Figure 4.11.
Source: University of Nebraska–Lincoln
Average Yearling LGM Indemnities for May, By Sales Closing Date, 1996-2006
44 7 5 7 5 4 4 4 4
0
20
40
60
80
100
120
140
Mar Feb Jan Dec Nov Oct Sep Aug Jul Jun
Sales Closing Date
Inde
mni
ties
($/h
ead)
Indemnity (Years With Indemnity)Indemnity (All Years)
Years With Indemnity Payouts (out of 11)
Source: University of Nebraska-Lincoln
Average Yearling LGM Indemnities for June, By Sales Closing Date, 1996-2006
63 5 7 7 7 7 6 5 7
0
20
40
60
80
100
120
140
Apr Mar Feb Jan Dec Nov Oct Sep Aug Jul
Sales Closing Date
Inde
mni
ties
($/h
ead)
Indemnity (Years With Indemnity)Indemnity (All Years)
Years With Indemnity Payouts (out of 11)
Source: University of Nebraska-Lincoln
Figure 4.12
Average Yearling LGM Indemnities for July, By Sales Closing Date, 1996-2006
45 3 5 4 5 5 5 4 4
0
20
40
60
80
100
120
140
May Apr Mar Feb Jan Dec Nov Oct Sep Aug
Sales Closing Date
Inde
mni
ties
($/h
ead)
Indemnity (Years With Indemnity)Indemnity (All Years)
Years With Indemnity Payouts (out of 11)
Source: University of Nebraska-Lincoln

�� ©TheBoardofRegentsoftheUniversityofNebraska.Allrightsreserved.
Figure 4.12.
Source: University of Nebraska–Lincoln
Figure 4.13.
Source: University of Nebraska–Lincoln
Average Yearling LGM Indemnities for June, By Sales Closing Date, 1996-2006
63 5 7 7 7 7 6 5 7
0
20
40
60
80
100
120
140
Apr Mar Feb Jan Dec Nov Oct Sep Aug Jul
Sales Closing Date
Inde
mni
ties
($/h
ead)
Indemnity (Years With Indemnity)Indemnity (All Years)
Years With Indemnity Payouts (out of 11)
Source: University of Nebraska-Lincoln
Figure 4.12
Average Yearling LGM Indemnities for July, By Sales Closing Date, 1996-2006
45 3 5 4 5 5 5 4 4
0
20
40
60
80
100
120
140
May Apr Mar Feb Jan Dec Nov Oct Sep Aug
Sales Closing Date
Inde
mni
ties
($/h
ead)
Indemnity (Years With Indemnity)Indemnity (All Years)
Years With Indemnity Payouts (out of 11)
Source: University of Nebraska-Lincoln
Average Yearling LGM Indemnities for August, By Sales Closing Date, 1996-2006
44 5 4 5 4 4 4 4 3
0
20
40
60
80
100
120
140
Jun May Apr Mar Feb Jan Dec Nov Oct Sep
Sales Closing Date
Inde
mni
ties
($/h
ead)
Indemnity (Years With Indemnity)Indemnity (All Years)
Years With Indemnity Payouts (out of 11)
Source: University of Nebraska-Lincoln
Figure 4.14
Average Yearling LGM Indemnities for September, By Sales Closing Date, 1996-2006
33 3 2 3 4 4 3 3 3
0
20
40
60
80
100
120
140
Jul Jun May Apr Mar Feb Jan Dec Nov Oct
Sales Closing Date
Inde
mni
ties
($/h
ead)
Indemnity (Years With Indemnity)Indemnity (All Years)
Years With Indemnity Payouts (out of 11)
Source: University of Nebraska-Lincoln

©TheBoardofRegentsoftheUniversityofNebraska.Allrightsreserved. ��
Average Yearling LGM Indemnities for August, By Sales Closing Date, 1996-2006
44 5 4 5 4 4 4 4 3
0
20
40
60
80
100
120
140
Jun May Apr Mar Feb Jan Dec Nov Oct Sep
Sales Closing Date
Inde
mni
ties
($/h
ead)
Indemnity (Years With Indemnity)Indemnity (All Years)
Years With Indemnity Payouts (out of 11)
Source: University of Nebraska-Lincoln
Figure 4.14
Average Yearling LGM Indemnities for September, By Sales Closing Date, 1996-2006
33 3 2 3 4 4 3 3 3
0
20
40
60
80
100
120
140
Jul Jun May Apr Mar Feb Jan Dec Nov Oct
Sales Closing Date
Inde
mni
ties
($/h
ead)
Indemnity (Years With Indemnity)Indemnity (All Years)
Years With Indemnity Payouts (out of 11)
Source: University of Nebraska-Lincoln
Figure 4.14.
Source: University of Nebraska–Lincoln
Figure 4.15.
Source: University of Nebraska–Lincoln
Average Yearling LGM Indemnities for October, By Sales Closing Date, 1996-2006
42 3 1 2 2 3 4 4 4
0
20
40
60
80
100
120
140
Aug Jul Jun May Apr Mar Feb Jan Dec Nov
Sales Closing Date
Inde
mni
ties
($/h
ead)
Indemnity (Years With Indemnity)Indemnity (All Years)
Years With Indemnity Payouts (out of 11)
Source: University of Nebraska-Lincoln
Figure 4.16
Average Yearling LGM Indemnities for November, By Sales Closing Date, 1996-2006
33 2 3 3 3 3 3 3 3
0
20
40
60
80
100
120
140
Sep Aug Jul Jun May Apr Mar Feb Jan Dec
Sales Closing Date
Inde
mni
ties
($/h
ead)
Indemnity (Years With Indemnity)Indemnity (All Years)
Years With Indemnity Payouts (out of 11)
Source: University of Nebraska-Lincoln

�0 ©TheBoardofRegentsoftheUniversityofNebraska.Allrightsreserved.
Average Yearling LGM Indemnities for October, By Sales Closing Date, 1996-2006
42 3 1 2 2 3 4 4 4
0
20
40
60
80
100
120
140
Aug Jul Jun May Apr Mar Feb Jan Dec Nov
Sales Closing Date
Inde
mni
ties
($/h
ead)
Indemnity (Years With Indemnity)Indemnity (All Years)
Years With Indemnity Payouts (out of 11)
Source: University of Nebraska-Lincoln
Figure 4.16
Average Yearling LGM Indemnities for November, By Sales Closing Date, 1996-2006
33 2 3 3 3 3 3 3 3
0
20
40
60
80
100
120
140
Sep Aug Jul Jun May Apr Mar Feb Jan Dec
Sales Closing Date
Inde
mni
ties
($/h
ead)
Indemnity (Years With Indemnity)Indemnity (All Years)
Years With Indemnity Payouts (out of 11)
Source: University of Nebraska-Lincoln
Figure 4.16.
Source: University of Nebraska–Lincoln
Source: University of Nebraska–Lincoln
Figure 4.17.
Average Yearling LGM Indemnities for December, By Sales Closing Date, 1996-2006
46 6 4 3 4 4 3 3 4
0
20
40
60
80
100
120
140
Oct Sep Aug Jul Jun May Apr Mar Feb Jan
Sales Closing Date
Inde
mni
ties
($/h
ead)
Indemnity (Years With Indemnity)Indemnity (All Years)
Years With Indemnity Payouts (out of 11)
Source: University of Nebraska-Lincoln
Figure 4.18
Difference Between EGM and AGM, LGM for Cattle Yearling Finishing Operation,
By Target Marketing Month, December 1995 to January 2007
-400
-300
-200
-100
0
100
200
300
Dec-95
Jun-96
Dec-96
Jun-97
Dec-97
Jun-98
Dec-98
Jun-99
Dec-99
Jun-00
Dec-00
Jun-01
Dec-01
Jun-02
Dec-02
Jun-03
Dec-03
Jun-04
Dec-04
Jun-05
Dec-05
Jun-06
Dec-06
Target Marketing Month
Inde
mni
ty ($
/hea
d)
Source: University of Nebraska-Lincoln

©TheBoardofRegentsoftheUniversityofNebraska.Allrightsreserved. ��
LGM for Cattle Yearling Finishing Operation Indemnities,
By Sales Closing Date, 1996 to 2005
0
100
200
300
400
500
600
700
800
900
1000
Jan-96
Jul-9
6
Jan-97
Jul-9
7
Jan-98
Jul-9
8
Jan-99
Jul-9
9
Jan-00
Jul-0
0
Jan-01
Jul-0
1
Jan-02
Jul-0
2
Jan-03
Jul-0
3
Jan-04
Jul-0
4
Jan-05
Jul-0
5
Sales Closing Date
Inde
mni
ty ($
/11-
mon
th in
sura
nce
perio
d)
Source: University of Nebraska-Lincoln
Figure 4.20
Average Calf LGM Indemnities for January, By Sales Closing Date, 1996-2006
48 5 4 2 4 3 3 3 4
0
20
40
60
80
100
120
140
Nov Oct Sep Aug Jul Jun May Apr Mar Feb
Sales Closing Date
Inde
mni
ties
($/h
ead)
Indemnity (Years With Indemnity)Indemnity (All Years)
Years With Indemnity Payouts (out of 11)
Source: University of Nebraska-Lincoln
Average Yearling LGM Indemnities for December, By Sales Closing Date, 1996-2006
46 6 4 3 4 4 3 3 4
0
20
40
60
80
100
120
140
Oct Sep Aug Jul Jun May Apr Mar Feb Jan
Sales Closing Date
Inde
mni
ties
($/h
ead)
Indemnity (Years With Indemnity)Indemnity (All Years)
Years With Indemnity Payouts (out of 11)
Source: University of Nebraska-Lincoln
Figure 4.18
Difference Between EGM and AGM, LGM for Cattle Yearling Finishing Operation,
By Target Marketing Month, December 1995 to January 2007
-400
-300
-200
-100
0
100
200
300
Dec-95
Jun-96
Dec-96
Jun-97
Dec-97
Jun-98
Dec-98
Jun-99
Dec-99
Jun-00
Dec-00
Jun-01
Dec-01
Jun-02
Dec-02
Jun-03
Dec-03
Jun-04
Dec-04
Jun-05
Dec-05
Jun-06
Dec-06
Target Marketing Month
Inde
mni
ty ($
/hea
d)
Source: University of Nebraska-LincolnSource: University of Nebraska–Lincoln
Figure 4.18.
Source: University of Nebraska–Lincoln
Figure 4.19.

�� ©TheBoardofRegentsoftheUniversityofNebraska.Allrightsreserved.
Average Calf LGM Indemnities for February, By Sales Closing Date, 1996-2006
44 5 7 5 3 4 3 4 4
0
20
40
60
80
100
120
140
Dec Nov Oct Sep Aug Jul Jun May Apr Mar
Sales Closing Date
Inde
mni
ties
($/h
ead)
Indemnity (Years With Indemnity)Indemnity (All Years)
Years With Indemnity Payouts (out of 11)
Source: University of Nebraska-Lincoln
Figure 4.22
Average Calf LGM Indemnities for March, By Sales Closing Date, 1996-2006
45 4 5 6 4 4 3 3 4
0
20
40
60
80
100
120
140
Jan Dec Nov Oct Sep Aug Jul Jun May Apr
Sales Closing Date
Inde
mni
ties
($/h
ead)
Indemnity (Years With Indemnity)Indemnity (All Years)
Years With Indemnity Payouts (out of 11)
Source: University of Nebraska-Lincoln
Figure 4.20.
Source: University of Nebraska–Lincoln
Source: University of Nebraska–Lincoln
Figure 4.21.
LGM for Cattle Yearling Finishing Operation Indemnities,
By Sales Closing Date, 1996 to 2005
0
100
200
300
400
500
600
700
800
900
1000
Jan-96
Jul-9
6
Jan-97
Jul-9
7
Jan-98
Jul-9
8
Jan-99
Jul-9
9
Jan-00
Jul-0
0
Jan-01
Jul-0
1
Jan-02
Jul-0
2
Jan-03
Jul-0
3
Jan-04
Jul-0
4
Jan-05
Jul-0
5
Sales Closing Date
Inde
mni
ty ($
/11-
mon
th in
sura
nce
perio
d)
Source: University of Nebraska-Lincoln
Figure 4.20
Average Calf LGM Indemnities for January, By Sales Closing Date, 1996-2006
48 5 4 2 4 3 3 3 4
0
20
40
60
80
100
120
140
Nov Oct Sep Aug Jul Jun May Apr Mar Feb
Sales Closing Date
Inde
mni
ties
($/h
ead)
Indemnity (Years With Indemnity)Indemnity (All Years)
Years With Indemnity Payouts (out of 11)
Source: University of Nebraska-Lincoln

©TheBoardofRegentsoftheUniversityofNebraska.Allrightsreserved. ��
Source: University of Nebraska–Lincoln
Figure 4.22.
Figure 4.23.
Source: University of Nebraska–Lincoln
Average Calf LGM Indemnities for February, By Sales Closing Date, 1996-2006
44 5 7 5 3 4 3 4 4
0
20
40
60
80
100
120
140
Dec Nov Oct Sep Aug Jul Jun May Apr Mar
Sales Closing Date
Inde
mni
ties
($/h
ead)
Indemnity (Years With Indemnity)Indemnity (All Years)
Years With Indemnity Payouts (out of 11)
Source: University of Nebraska-Lincoln
Figure 4.22
Average Calf LGM Indemnities for March, By Sales Closing Date, 1996-2006
45 4 5 6 4 4 3 3 4
0
20
40
60
80
100
120
140
Jan Dec Nov Oct Sep Aug Jul Jun May Apr
Sales Closing Date
Inde
mni
ties
($/h
ead)
Indemnity (Years With Indemnity)Indemnity (All Years)
Years With Indemnity Payouts (out of 11)
Source: University of Nebraska-Lincoln
Average Calf LGM Indemnities for April, By Sales Closing Date, 1996-2006
46 6 6 4 4 4 4 4 4
0
20
40
60
80
100
120
140
Feb Jan Dec Nov Oct Sep Aug Jul Jun May
Sales Closing Date
Inde
mni
ties
($/h
ead)
Indemnity (Years With Indemnity)Indemnity (All Years)
Years With Indemnity Payouts (out of 11)
Source: University of Nebraska-Lincoln
Figure 4.24
Average Calf LGM Indemnities for May, By Sales Closing Date, 1996-2006
44 7 5 5 4 4 4 4 4
0
20
40
60
80
100
120
140
Mar Feb Jan Dec Nov Oct Sep Aug Jul Jun
Sales Closing Date
Inde
mni
ties
($/h
ead)
Indemnity (Years With Indemnity)Indemnity (All Years)
Years With Indemnity Payouts (out of 11)
Source: University of Nebraska-Lincoln

�� ©TheBoardofRegentsoftheUniversityofNebraska.Allrightsreserved.
Figure 4.24.
Source: University of Nebraska–Lincoln
Source: University of Nebraska–Lincoln
Figure 4.25.
Average Calf LGM Indemnities for April, By Sales Closing Date, 1996-2006
46 6 6 4 4 4 4 4 4
0
20
40
60
80
100
120
140
Feb Jan Dec Nov Oct Sep Aug Jul Jun May
Sales Closing Date
Inde
mni
ties
($/h
ead)
Indemnity (Years With Indemnity)Indemnity (All Years)
Years With Indemnity Payouts (out of 11)
Source: University of Nebraska-Lincoln
Figure 4.24
Average Calf LGM Indemnities for May, By Sales Closing Date, 1996-2006
44 7 5 5 4 4 4 4 4
0
20
40
60
80
100
120
140
Mar Feb Jan Dec Nov Oct Sep Aug Jul Jun
Sales Closing Date
Inde
mni
ties
($/h
ead)
Indemnity (Years With Indemnity)Indemnity (All Years)
Years With Indemnity Payouts (out of 11)
Source: University of Nebraska-Lincoln
Average Calf LGM Indemnities for June, By Sales Closing Date, 1996-2006
33 5 7 6 6 5 5 4 4
0
20
40
60
80
100
120
140
Apr Mar Feb Jan Dec Nov Oct Sep Aug Jul
Sales Closing Date
Inde
mni
ties
($/h
ead)
Indemnity (Years With Indemnity)Indemnity (All Years)
Years With Indemnity Payouts (out of 11)
Source: University of Nebraska-Lincoln
Figure 4.26
Average Calf LGM Indemnities for July, By Sales Closing Date, 1996-2006
45 3 5 5 4 4 5 3 3
0
20
40
60
80
100
120
140
May Apr Mar Feb Jan Dec Nov Oct Sep Aug
Sales Closing Date
Inde
mni
ties
($/h
ead)
Indemnity (Years With Indemnity)Indemnity (All Years)
Years With Indemnity Payouts (out of 11)
Source: University of Nebraska-Lincoln

©TheBoardofRegentsoftheUniversityofNebraska.Allrightsreserved. ��
Average Calf LGM Indemnities for August, By Sales Closing Date, 1996-2006
34 5 4 5 4 3 4 4 3
0
20
40
60
80
100
120
140
Jun May Apr Mar Feb Jan Dec Nov Oct Sep
Sales Closing Date
Inde
mni
ties
($/h
ead)
Indemnity (Years With Indemnity)Indemnity (All Years)
Years With Indemnity Payouts (out of 11)
Source: University of Nebraska-Lincoln
Figure 4.28
Average Calf LGM Indemnities for September, By Sales Closing Date, 1996-2006
33 3 3 3 4 4 4 4 4
0
20
40
60
80
100
120
140
Jul Jun May Apr Mar Feb Jan Dec Nov Oct
Sales Closing Date
Inde
mni
ties
($/h
ead)
Indemnity (Years With Indemnity)Indemnity (All Years)
Years With Indemnity Payouts (out of 11)
Source: University of Nebraska-Lincoln
Source: University of Nebraska–Lincoln
Figure 4.26.
Figure 4.27.
Source: University of Nebraska–Lincoln
Average Calf LGM Indemnities for June, By Sales Closing Date, 1996-2006
33 5 7 6 6 5 5 4 4
0
20
40
60
80
100
120
140
Apr Mar Feb Jan Dec Nov Oct Sep Aug Jul
Sales Closing Date
Inde
mni
ties
($/h
ead)
Indemnity (Years With Indemnity)Indemnity (All Years)
Years With Indemnity Payouts (out of 11)
Source: University of Nebraska-Lincoln
Figure 4.26
Average Calf LGM Indemnities for July, By Sales Closing Date, 1996-2006
45 3 5 5 4 4 5 3 3
0
20
40
60
80
100
120
140
May Apr Mar Feb Jan Dec Nov Oct Sep Aug
Sales Closing Date
Inde
mni
ties
($/h
ead)
Indemnity (Years With Indemnity)Indemnity (All Years)
Years With Indemnity Payouts (out of 11)
Source: University of Nebraska-Lincoln

�� ©TheBoardofRegentsoftheUniversityofNebraska.Allrightsreserved.
Figure 4.28.
Source: University of Nebraska–Lincoln
Figure 4.29.
Source: University of Nebraska–Lincoln
Average Calf LGM Indemnities for August, By Sales Closing Date, 1996-2006
34 5 4 5 4 3 4 4 3
0
20
40
60
80
100
120
140
Jun May Apr Mar Feb Jan Dec Nov Oct Sep
Sales Closing Date
Inde
mni
ties
($/h
ead)
Indemnity (Years With Indemnity)Indemnity (All Years)
Years With Indemnity Payouts (out of 11)
Source: University of Nebraska-Lincoln
Figure 4.28
Average Calf LGM Indemnities for September, By Sales Closing Date, 1996-2006
33 3 3 3 4 4 4 4 4
0
20
40
60
80
100
120
140
Jul Jun May Apr Mar Feb Jan Dec Nov Oct
Sales Closing Date
Inde
mni
ties
($/h
ead)
Indemnity (Years With Indemnity)Indemnity (All Years)
Years With Indemnity Payouts (out of 11)
Source: University of Nebraska-Lincoln
Average Calf LGM Indemnities for October, By Sales Closing Date, 1996-2006
32 3 2 2 2 2 4 3 3
0
20
40
60
80
100
120
140
Aug Jul Jun May Apr Mar Feb Jan Dec Nov
Sales Closing Date
Inde
mni
ties
($/h
ead)
Indemnity (Years With Indemnity)Indemnity (All Years)
Years With Indemnity Payouts (out of 11)
Source: University of Nebraska-Lincoln
Figure 4.30
Average Calf LGM Indemnities for November, By Sales Closing Date, 1996-2006
23 3 3 4 3 2 2 3 3
0
20
40
60
80
100
120
140
Sep Aug Jul Jun May Apr Mar Feb Jan Dec
Sales Closing Date
Inde
mni
ties
($/h
ead)
Indemnity (Years With Indemnity)Indemnity (All Years)
Years With Indemnity Payouts (out of 11)
Source: University of Nebraska-Lincoln

©TheBoardofRegentsoftheUniversityofNebraska.Allrightsreserved. ��
Source: University of Nebraska–Lincoln
Figure 4.30.
Source: University of Nebraska–Lincoln
Figure 4.31.
Average Calf LGM Indemnities for October, By Sales Closing Date, 1996-2006
32 3 2 2 2 2 4 3 3
0
20
40
60
80
100
120
140
Aug Jul Jun May Apr Mar Feb Jan Dec Nov
Sales Closing Date
Inde
mni
ties
($/h
ead)
Indemnity (Years With Indemnity)Indemnity (All Years)
Years With Indemnity Payouts (out of 11)
Source: University of Nebraska-Lincoln
Figure 4.30
Average Calf LGM Indemnities for November, By Sales Closing Date, 1996-2006
23 3 3 4 3 2 2 3 3
0
20
40
60
80
100
120
140
Sep Aug Jul Jun May Apr Mar Feb Jan Dec
Sales Closing Date
Inde
mni
ties
($/h
ead)
Indemnity (Years With Indemnity)Indemnity (All Years)
Years With Indemnity Payouts (out of 11)
Source: University of Nebraska-Lincoln
Average Calf LGM Indemnities for December, By Sales Closing Date, 1996-2006
35 6 5 3 4 3 3 3 3
0
20
40
60
80
100
120
140
Oct Sep Aug Jul Jun May Apr Mar Feb Jan
Sales Closing Date
Inde
mni
ties
($/h
ead)
Indemnity (Years With Indemnity)Indemnity (All Years)
Years With Indemnity Payouts (out of 11)
Source: University of Nebraska-Lincoln
Figure 4.32
Difference Between EGM and AGM, LGM for Cattle Calf Finishing Operation,
By Target Marketing Month, December 1995 to January 2007
-400
-300
-200
-100
0
100
200
300
Dec-95
Jun-96
Dec-96
Jun-97
Dec-97
Jun-98
Dec-98
Jun-99
Dec-99
Jun-00
Dec-00
Jun-01
Dec-01
Jun-02
Dec-02
Jun-03
Dec-03
Jun-04
Dec-04
Jun-05
Dec-05
Jun-06
Dec-06
Target Marketing Month
Inde
mni
ty ($
/hea
d)
Source: University of Nebraska-Lincoln

�� ©TheBoardofRegentsoftheUniversityofNebraska.Allrightsreserved.
LGM for Cattle Calf Finishing Operation Indemnities, By Sales Closing Date, 1996 to 2005
0
100
200
300
400
500
600
700
800
900
1000
1100
Jan-96
Jul-9
6
Jan-97
Jul-9
7
Jan-98
Jul-9
8
Jan-99
Jul-9
9
Jan-00
Jul-0
0
Jan-01
Jul-0
1
Jan-02
Jul-0
2
Jan-03
Jul-0
3
Jan-04
Jul-0
4
Jan-05
Jul-0
5
Sales Closing Date
Inde
mni
ty ($
/11-
mon
th in
sura
nce
perio
d)
Source: University of Nebraska-Lincoln
Average Calf LGM Indemnities for December, By Sales Closing Date, 1996-2006
35 6 5 3 4 3 3 3 3
0
20
40
60
80
100
120
140
Oct Sep Aug Jul Jun May Apr Mar Feb Jan
Sales Closing Date
Inde
mni
ties
($/h
ead)
Indemnity (Years With Indemnity)Indemnity (All Years)
Years With Indemnity Payouts (out of 11)
Source: University of Nebraska-Lincoln
Figure 4.32
Difference Between EGM and AGM, LGM for Cattle Calf Finishing Operation,
By Target Marketing Month, December 1995 to January 2007
-400
-300
-200
-100
0
100
200
300
Dec-95
Jun-96
Dec-96
Jun-97
Dec-97
Jun-98
Dec-98
Jun-99
Dec-99
Jun-00
Dec-00
Jun-01
Dec-01
Jun-02
Dec-02
Jun-03
Dec-03
Jun-04
Dec-04
Jun-05
Dec-05
Jun-06
Dec-06
Target Marketing Month
Inde
mni
ty ($
/hea
d)
Source: University of Nebraska-Lincoln
Figure 4.32.
Source: University of Nebraska–Lincoln
Source: University of Nebraska–Lincoln
Figure 4.33.

©TheBoardofRegentsoftheUniversityofNebraska.Allrightsreserved. ��
4.4 Summary
Chapter 4 explained how LGM basis margin is dif-ferent from futures basis producers receive with cash sales, as well as basis margin risk assumed by producers who purchase LGM. Indemnities and when they were most likely to be paid based on historical price pat-terns were illustrated on a monthly basis. The chapter showed how EGMs may differ across sales closing dates for the same target marketing month. Also shown was the difference between the EGM and AGM. Finally, the chapter explained how the GMG and the total AGM for the entire insurance period are the determinants of an indemnity. Chapter 5 will illustrate how to hedge cattle feeding margins using LGM insurance.
Check for Understanding: Chapter 4
1. T F LGM basis margin is equal to the futures basis received.
2. T F Futures basis is the difference between the cash price received and the futures price.
3. T F Basis is more variable than prices.
4. T F Like hedging in the futures market, LGM insurance does not protect producers from basis margin risk.
5. T F Indemnities are determined at the end of the insurance period, not on a monthly basis.
6. T F Two producers who buy LGM insurance on different sales closing dates for the same number of cattle with the same deductible will have the same EGM.
7. T F If the total EGM is greater than the total AGM, an indemnity will be paid.
8. T F The total dollar amount the GMG differs from the total AGM will determine whether an indemnity is paid, not the number of months the EGM exceeds the AGM.

�0 ©TheBoardofRegentsoftheUniversityofNebraska.Allrightsreserved.
Chapter 5Hedging Outcomes with LGM Insurance
In this chapter, you will learn:how price changes affect gross margins;how to calculate the minimum expected margin
and the net margin on livestock hedged with LGM under various market conditions; and
some final considerations when purchasing LGM.
5.1 Introduction
Chapter 4 discussed how LGM basis margin differs from the futures basis producers realize in local markets and the basis margin risk associated with LGM. Chapter 4 also illustrated when the EGM was most likely to be greater than the AGM and when indemnities were most likely to be paid based on historical prices. Chapter 3 focused on the policies and provisions in LGM that us-ers need to know to understand the program. Terminol-ogy and EGM calculations were the topics of Chapter 2, and Chapter 1 provided a basic understanding of LGM. Chapter 5 will use all this information to demonstrate two hedging outcomes under different market conditions and provide a discussion surrounding commodity price moves and their effect on gross margins and indemnities.
5.2 Changes in Gross Margin
As discussed in previous chapters, LGM Insurance for Cattle and Swine is designed to protect the feeding or finishing margins in a number of different operations. The cattle feeding margin is affected by the corn and feeder cattle input prices and the fed cattle selling price. The swine finishing margin is determined by the prices of soybean meal and corn as well as the swine selling price. Recall also that indemnities are paid to producers when the gross margin narrows as a result of price move-ments in the respective commodity markets such that the GMG is greater than the total AGM. The gross feeding or finishing margin can increase or decrease depending on which commodity’s price increases, decreases, or remains unchanged. For example, the cattle feeding margin will increase if the fed cattle selling price increases and the feeder cattle and corn prices decrease. However, the gross margin may also increase if the fed cattle selling price increases and the feeder cattle and corn prices do not change. So, the gross margin is also affected by the size of the price changes relative to the other two commodi-ties. For instance, if the fed cattle selling price decreases but the decrease is offset by a larger decrease in either
the feeder cattle or corn prices (or both), the gross mar-gin may still increase. Figure 5.1 summarizes the effects these commodity prices have on the gross margin. The up arrow () indicates a price increase while the down arrow () indicates a price decrease. The horizontal arrow ( ) represents a constant price. Note that not all possible combinations of price moves are included in Figure 5.1, because the gross margin is based on the price move of one commodity relative to the other two that are hedged with LGM.
5.3 Hedging Outcomes
Understanding how the gross margin is affected by price moves in the underlying commodities is impor-tant. It is also important to understand how to calculate a minimum expected margin and a total net margin received with LGM under different prices.
Tables 5.1 and 5.2 present an organized format that can be used to keep track of important transactions and prices when using LGM insurance. Producers can use these tables to track all of their transactions associated with a particular target marketing month. The rows included in the table represent the dates the applicable feeder cattle, corn, and live cattle transactions take place in the cash market and for LGM. The relevant dates include when LGM insurance is purchased, when feeder cattle are purchased, when corn is purchased, the fed cattle selling date, and the date the insurance period ends. The columns represent the markets where these transactions take place, including the difference between the cash market and the LGM price (i.e., the LGM basis margin). Remember that although a yearling operation is used in all of the following examples, the concepts are similar for LGM for Cattle’s calf finishing operation and the farrow to finish, feeder pig finishing, and SEW pig finishing operations included in LGM for Swine.
Suppose on Jan. 31, 2006 a cattle feeder purchased LGM for Cattle Insurance for a yearling finishing opera-tion and specified target marketings only for August 2006. (It is important to note that the following calcula-tions are presented on a per head basis for ease of com-parison, but the example is easily extended to multiple head insured.) Thus, this example assumes only one head insured. On Jan. 31, the producer learns that the EGM for August target marketings is $85.13/head using RMA’s online calculator (Section 2.3 and 2.5) The feeder also decides on a $0 per head deductible, so the GMG is also $85.13/head. The calculations associated with the LGM adjusted live cattle, feeder cattle, and corn prices used to

©TheBoardofRegentsoftheUniversityofNebraska.Allrightsreserved. ��
determine the EGM and GMG are explained in detail in Section 2.4. Remember that these prices in the first row of Table 5.1 are adjusted for the historical LGM basis as explained in Section 2.4. Realize, though, that these are not the prices the feeder will realize in the corn, feeder cattle, and live cattle cash markets. So, another basis (LGM basis margin) exists — the difference between actual cash prices and the LGM adjusted futures prices.
On Jan. 31, note that the producer takes no action in the cash market, but does determine an expected LGM basis margin for live cattle, feeder cattle, and corn for those transactions that will take place at a later date. These expected LGM basis margin figures are based on historical differences between the feeder’s cash price and the LGM adjusted futures price. So, on Jan. 31, 2006 the expected live cattle, feeder cattle, and corn LGM basis margin are $1.83/cwt, $1.00/cwt, and $0.09/bu, respec-tively. According to LGM for Cattle rules, an August target marketing month means that feeder cattle will be purchased in March (t-5) and corn in June (t-2) while live cattle will be marketed in August (see Equation 2.1). March and June are only expected input purchase months (according to LGM policy regulations), and most operations will vary from these expected dates. Note that the expected basis margin is a prediction made for the commodity’s respective purchase/sell date. For example, the expected live cattle basis margin is for Aug. 31 (the month cattle will be marketed).
The expected LGM basis margin of $10.20/head (in the LGM Basis Margin box for 1/31/06) is calculated by inserting each commodity’s expected LGM basis margin in place of the commodity’s price in Equation 2.1 (be sure to use the appropriate equation for a calf operation or any of the three swine operations). So, with the hedge initiated by purchasing LGM with the GMG of $85.13/head, the minimum expected margin (MEM) the pro-ducer can expect to receive can be determined by add-ing the expected LGM basis margin to the GMG. Thus, the MEM is $95.33/head ($85.13/head + $10.20/head = $95.33/head). In other words, the feeder expects to net a margin of at least $95.33/head (note this is before paying the premium). If the actual LGM basis margin turns out to be different than the expected LGM basis margin, the net margin actually realized will be higher or lower.
Suppose the cattle feeder purchased 750 lb yearlings on March 31, 2006 (as is assumed in the LGM policy) at a cash price of $121.07/cwt (note that these are not real prices for that date, but are used for the example). Then suppose that on June 30, 2006 the cattle feeder buys corn for $2.15/bu in the cash market and sells the live cattle on Aug. 31, 2006 for $81.27/cwt in the cash market. No action is taken with LGM insurance on the feeder cattle and corn purchase dates and the live cattle selling date. The difference between the feeder cattle, corn, and live cattle prices in the cash market and the LGM adjusted fu-tures prices (realized after August) is the actual LGM ba-
Figure 5.1: Changes in the Gross Margin Due to Commodity Price Changes
Gross Margin Increases Gross Margin Decreases
Fed Cattle Feeder Cattle Corn Fed Cattle Feeder Cattle Corn
Swine Soybean Meal Corn Swine Soybean Meal Corn
Large Small Small Large Small Small
Small Large Large Small Large Large
Figure 5.1. Changes in the Gross Margin Due to Commodity Price Changes.

�� ©TheBoardofRegentsoftheUniversityofNebraska.Allrightsreserved.
sis margin for feeder cattle, corn, and live cattle reported in the last column of Table 5.1. Note here that the actual feeder cattle LGM basis margin was $2.82/cwt, $1.82/cwt stronger than expected. This results in a smaller feeding margin. Conversely, the actual corn LGM basis margin was -$0.32/bu, $0.41/bu weaker than expected on Jan. 31, 2006. This results in a lower than expected corn price and a larger feeding margin. The actual live cattle LGM basis margin in August was $4.56/cwt weaker than ex-pected, leading to a smaller feeding margin.
The cash gross margin, after the fed cattle are sold, is found by inserting the cash prices for the com-modities into Equation 2.7. The cash gross margin of -$15.775/head is the margin the producer realizes in the cash market without using LGM insurance (Table 5.1). In this particular example, the adjusted live cattle price decreased $1.52/cwt to $84.00/cwt, the feeder cattle price increased $3.55/cwt to $118.25/cwt, and the corn price also increased $0.32/bu to $2.47/bu. Thus, the AGM for these August marketings was $21.10/head (Equation 2.7). Again, please note that the LGM adjusted futures prices comprising the AGM in Table 5.1 and this example were hypothetical to show when an indemnity is paid. The adjusted futures prices that actually occurred are in Equation 2.7 and follow in Table 5.2.
Because in this example the AGM is lower than the GMG, an indemnity of $64.03/head is paid ($85.13/head
- $21.10/head = $64.03/head). The net margin the feeder realizes is $48.255/head. This is the cash margin plus the indemnity (-$15.775/head + $64.03/head = $48.255/head). If the producer did not have the LGM insur-ance, the net margin received would have simply been the cash margin, or -$15.775/head. Here, the producer’s net margin is improved by the amount of the insurance indemnity ($64.03/head). However, the net margin the feeder receives, $48.255/head, is $47.075/head less than the minimum expected margin insured ($95.33/head). This difference is not due to how LGM performed, but rather the changes in the LGM basis margin. Note that the actual LGM basis margin (-$36.875/head) declined $47.075/head from the expected LGM basis margin. This difference is equal to the difference between the net mar-gin and the MEM. (Had the actual and expected LGM basis margins been equal, the net margin would equal the MEM.) Table 5.1 illustrates this particular hedging outcome when feeder cattle and corn prices increase and the live cattle price decreases.
Table 5.2 is similar to Table 5.1; however, Table 5.2 shows the LGM adjusted live cattle, feeder cattle, and corn prices that were actually realized in 2006. Notice that the feeder cattle price decreased from January 2006 through the end of the insurance period. The LGM adjusted live cattle price increased to $90.73/cwt. Both resulted in the margin improving. However, the LGM
Table 5.1. Hedging Outcome with Feeder Cattle (FC) and Corn (C) Prices Increasing and Live Cattle (LC) Price Decreasing.
Date Cash LGM Insurance LGM Basis Margin
1/31/06 No Action Buy LGM Insurance Exp. 8/31 LC Basis = $1.83/cwt Adj. LC Price = $85.52/cwt Exp. 3/31 FC Basis = $1.00/cwt Adj. FC Price = $114.70/cwt Exp. 6/30 C Basis = $0.09/bu Adj. C Price = $2.15/bu Exp. Basis Margin = $10.20/hd
GMG = $85.13/hd (Deductible = $0/hd)
3/31/06 Buy FC @ $121.07/cwt No Action Act. 3/31 FC Basis = $2.82/cwt
6/30/06 Buy C @ $2.15/bu No Action Act. 6/30 C Basis = -$0.32/bu
8/31/06 Sell LC @ $81.27/cwt No Action Act. 8/31 LC Basis = -$2.73/cwt
12/31/06 Cash GM = -$15.775/hd Adj. LC Price = $84.00/cwt Act. Basis Margin = -$36.875/hd Adj. FC Price = $118.25/cwt Exp. Basis Margin = $10.20/hd Adj. C Price = $2.47/bu
AGM = $21.10/hd Difference = -$47.075/hd $64.03/hd Indemnity GMG>AGM

©TheBoardofRegentsoftheUniversityofNebraska.Allrightsreserved. ��
adjusted corn price increased $0.11/bu, which lowers the margin. Thus, the AGM at the end of the insurance period was $192.83/head (Table 5.2). As before, the feed-er’s minimum expected margin of $95.33/head is equal to the expected LGM basis margin plus the GMG. The cash purchase prices for feeder cattle and corn actually realized in the cash markets are equal to their respective LGM adjusted prices, plus the actual LGM basis margin for March feeder cattle and June corn respectively. The live cattle cash sale price is also calculated by adding the adjusted LGM live cattle price plus the actual LGM live cattle basis margin for Aug. 31, 2006. The feeder cattle cash price ($111.00/cwt), corn cash price ($1.94/bu), and the live cattle cash price ($88.00/cwt) inserted into Equation 2.7 are used to determine the cash gross margin of $155.95/head, the margin the feeder receives without LGM insurance. Because the live cattle price increase and the feeder cattle price decrease were enough to offset the corn price increase, the AGM of $192.83/head is greater than the GMG; therefore, no indemnity is paid (note the AGM here was the same as calculated in Equation 2.7 in Section 2.4). The expected and actual LGM basis margin were the same as in the previous example, so the expect-ed basis margin is equal to $10.20/head and the actual basis margin is -$36.875/head, yielding a difference in the LGM basis margins of -$47.075/head.
The feeder’s net margin in the example in Table 5.2 is equal to the cash margin of $155.95/head and the indemnity, which was $0.00/head because the AGM exceeded the GMG. In this case, having the insurance did not improve the feeder’s net margin; in fact, having the insurance protection would have lowered the margin by the amount of premium paid for the coverage. The dif-ference between the net margin and minimum expected margin in this example is not attributable exclusively to basis margin changes, as was the case in Table 5.1. In this scenario, the difference between the net margin and minimum expected margin ($155.95/head - $95.33/head = $60.62/head) is equal to the difference between the AGM and the GMG, plus the difference between the actual and expected LGM basis margins ($192.83/head - $85.13/head + -$47.075/head = $60.62/head). In the first hedging example, the difference between the net margin and minimum expected margin was due to the change between the actual and expected LGM basis margins. In this example, the difference between the net margin and minimum expected margin is due to the change between the actual and expected LGM basis margins plus the change between the AGM and the GMG (which repre-sents the margin increase). The net margin is $60.62/head higher than the minimum expected margin. This is a desirable outcome; the net margin turned out better
Table 5.2. Hedging Outcome with Feeder Cattle (FC) Price Decreasing and Corn (C) and Live Cattle (LC) Prices Increasing.
Date Cash LGM Insurance LGM Basis
1/31/06 No Action Buy LGM Insurance Exp. 8/31 LC Basis = $1.83/cwt Adj. LC Price = $85.52/cwt Exp. 3/31 FC Basis = $1.00/cwt Adj. FC Price = $114.70/cwt Exp. 6/30 C Basis = $0.09/bu Adj. C Price = $2.15/bu Exp. Basis Margin = $10.20/hd
GMG = $85.13/hd (Deductible = $0/hd)
3/31/06 Buy FC @ $111.00/cwt No Action Act. 3/31 FC Basis = $2.82/cwt
6/30/06 Buy C @ $1.94/bu No Action Act. 6/30 C Basis = -$0.32/bu
8/31/06 Sell LC @ $88.00/cwt No Action Act. 8/31 LC Basis = -$2.73/cwt
12/31/06 Cash GM = $155.95/hd Adj. LC Price = $90.73/cwt Act. Basis Margin = -$36.875/hd Adj. FC Price = $108.18/cwt Exp. Basis Margin = $10.20/hd Adj. C Price = $2.26/bu
AGM = $192.83/hd Difference = -$47.075/hd $0/hd Indemnity GMG<AGM

�� ©TheBoardofRegentsoftheUniversityofNebraska.Allrightsreserved.
than expected because live cattle and feeder cattle prices moved in the feeder’s favor. Remember, that if an indem-nity was paid (like in the first example) only the mini-mum expected margin would be realized (or something less as when the LGM basis margin weakens).
To summarize, the feeder receives a higher net mar-gin when no indemnity is paid. This is because an in-demnity is paid only to bring the margin up to the GMG (the minimum expected margin level before LGM basis margin adjustments) when the total AGM decreases be-low a specified point. However, a higher total AGM that does not trigger an indemnity payment usually translates into a higher net margin. For example, in Table 5.1, when an indemnity is paid, the net margin is $48.255/head, while in Table 5.2 no indemnity is paid and the net mar-gin is $155.95/head. It is also important to note that these examples show net margins before premiums for LGM insurance have been subtracted. Inclusion of pre-miums will lower the minimum expected margin and net margin but will not affect the differential between the two.
5.4 Final Considerations
Before deciding to purchase LGM insurance, a few limitations of the program must be considered. Section 1.6 explains when LGM for Cattle and Swine is avail-able for sale. Under certain circumstances, LGM may not be available at those specified times. LGM will not be available for sale if the CME lean hog or live cattle fu-tures contract prices decrease by their daily limit for two consecutive days when the EGM is being determined. If one of the input commodity’s futures price (corn and feeder cattle or corn and soybean meal) increases by their respective limits for two consecutive days while the EGM is calculated, LGM will be unavailable.
LGM sales can be suspended if a news report, announcement, or other event occurs during or after trading hours that is believed by the Secretary of Ag-riculture or RMA staff to significantly change market
conditions from those on which LGM insurance for that day is rated. This is designed to prevent adverse selec-tion by preventing producers from purchasing LGM with prior knowledge of how market prices are likely to trade the following day. Also, LGM sales may be stopped for a period of time if there is not enough underwriting capacity available.
5.5 Conclusion
LGM insurance is a program that may be useful to livestock producers wishing to establish a minimum feeding margin for their livestock. For producers with smaller herds who may not be able to use futures or options contracts, the flexibility of LGM may be espe-cially beneficial. As an insurance product, LGM may be attractive to producers who may not understand or may not be comfortable trading in the futures or op-tions markets. The program has other advantages over futures and options hedging. Once LGM is priced for a given day, the prices are guaranteed and will not change for that day. Also, LGM is available after normal market trading hours, allowing producers to purchase price coverage at times previously unavailable. LGM does not completely eliminate basis risk. Producers using LGM must be aware of their exposure to basis risk. Addition-ally, once a hedge is established with LGM, it cannot be lifted or sold back to recapture some of the premium cost. Although livestock does not have to be sold dur-ing the target marketing month, marketing the livestock before or after the specified month exposes the policy holder to price risk. Similarly, not purchasing the com-modity inputs at the same time when LGM insurance values them can expose users to temporal price risk. Futures and options can be used simultaneously with LGM; however, there are restrictions on using LGM and LRP coverage on the same livestock at the same time. This may limit some producers’ marketing strategies. All these factors are important to consider when evaluating LGM as a hedging tool.
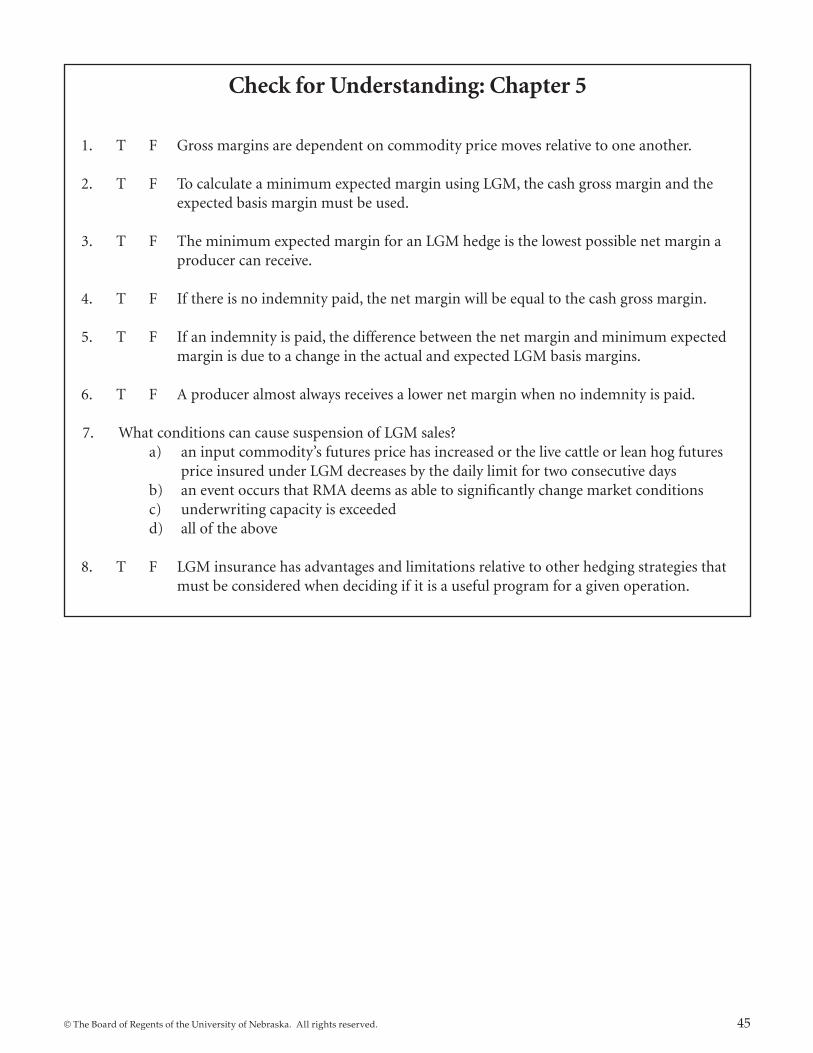
©TheBoardofRegentsoftheUniversityofNebraska.Allrightsreserved. ��
Check for Understanding: Chapter 5
1. T F Gross margins are dependent on commodity price moves relative to one another.
2. T F To calculate a minimum expected margin using LGM, the cash gross margin and the expected basis margin must be used.
3. T F The minimum expected margin for an LGM hedge is the lowest possible net margin a producer can receive.
4. T F If there is no indemnity paid, the net margin will be equal to the cash gross margin.
5. T F If an indemnity is paid, the difference between the net margin and minimum expected margin is due to a change in the actual and expected LGM basis margins.
6. T F A producer almost always receives a lower net margin when no indemnity is paid.
7. What conditions can cause suspension of LGM sales? a) an input commodity’s futures price has increased or the live cattle or lean hog futures price insured under LGM decreases by the daily limit for two consecutive days b) an event occurs that RMA deems as able to significantly change market conditions c) underwriting capacity is exceeded d) all of the above
8. T F LGM insurance has advantages and limitations relative to other hedging strategies that must be considered when deciding if it is a useful program for a given operation.

�� ©TheBoardofRegentsoftheUniversityofNebraska.Allrightsreserved.
Appendix 11
Substantial Beneficial Interest Form for Cattle
1This is the USDA form for the 2008 crop year. Revisions may be made in subsequent crop years. Additionally, variations of the form may be used by different insurance companies.
LGM for Cattle Insurance Handbook – Page 7
B. Substantial Beneficial Interest Form
LIVESTOCK GROSS MARGIN FOR CATTLE INSURANCE Substantial Beneficial Interest Form
NAME OF APPLICANT/INSURED CONTRACT NUMBER
SSN EIN OTHER (Check One)
SOCIAL SECURITY NUMBER OR EMPLOYER IDENTIFICATION NUMER ADDRESS OF AGENT
AGENT NAME AGENT CODE NUMBER COMPANY NAME
List persons and/or entities with 10 percent or more interest in the insurance entity identified above as the Applicant/Insured.
NAME(Print or Type)
COMPLETE ADDRESS (St., R.R., P.O. Box, Zip, etc.)
SSN/EIN (Check One & Enter No.)
TELEPHONENUMBER
ENTITY TYPE
SHARE
SSN EIN OTHER
( )
SSN EIN OTHER
( )
SSN EIN OTHER
( )
SSN EIN OTHER
( )
SSN EIN OTHER
( )
SSN EIN OTHER
( )
SSN EIN OTHER
( ) SIGNATURE OF APPLICANT/INSURED DATE

©TheBoardofRegentsoftheUniversityofNebraska.Allrightsreserved. ��
Substantial Beneficial Interest Form for Swine
LGM for Swine Insurance Handbook – Page 8
B. Substantial Beneficial Interest Form
LIVESTOCK GROSS MARGIN FOR SWINE INSURANCE Substantial Beneficial Interest Form
NAME OF APPLICANT/INSURED CONTRACT NUMBER
SSN EIN OTHER (Check One)
SOCIAL SECURITY NUMBER OR EMPLOYER IDENTIFICATION NUMER ADDRESS OF AGENT
AGENT NAME AGENT CODE NUMBER COMPANY NAME
List persons and/or entities with 10 percent or more interest in the insurance entity identified above as the Applicant/Insured.
NAME(Print or Type)
COMPLETE ADDRESS (St., R.R., P.O. Box, Zip, etc.)
SSN/EIN (Check One & Enter No.)
TELEPHONENUMBER
ENTITY TYPE
SHARE
SSN EIN OTHER
( )
SSN EIN OTHER
( )
SSN EIN OTHER
( )
SSN EIN OTHER
( )
SSN EIN OTHER
( )
SSN EIN OTHER
( )
SSN EIN OTHER
( ) SIGNATURE OF APPLICANT/INSURED DATE

�� ©TheBoardofRegentsoftheUniversityofNebraska.Allrightsreserved.
Appendix 21
Notice of Probable Loss Form for Cattle
1This is the USDA form for the 2008 crop year. Revisions may be made in subsequent crop years. Additionally, variations of the form may be used by different insurance companies.
LGM for Cattle Insurance Handbook – Page 12
D. Notice of Probable Loss Form
LIVESTOCK GROSS MARGIN FOR CATTLE INSURANCE NOTICE OF PROBABLE LOSS
Policy Number 1 Claim Number
(Company Use) 2
According to our records, you may be entitled to an indemnity under the above policy endorsement based on the information presented below. The calculation of the indemnity is shown in Section 4 below. In order to receive an indemnity, your signed Marketings Report and marketing receipts are required to certify that the terms and conditions of the policy have been met. Please contact your livestock insurance agent to receive a Marketings Report form or if the information shown in Sections 1, 2, or 3 is not correct.
Assignment of Indemnity? 3 Yes No Transfer of Right to Indemnity? 4 Yes No
Section 1. INSURED Section 2. INSURANCE AGENCY
Insured’s Name SSN EIN Insurance Agency Name Agency Code 5 6 13 14
Name of Farm/Ranch or Business Insurance Agent’s Name Agent’s Code 7 15 16
Street or Mailing Address Street or Mailing Address 8 17
City County
State
Zip Code
CityState Zip Code
9 18 Insured’s Phone
Fax E-mail Address
Agent’s Phone Fax E-mail Address
10
11 12 19 20 21
Section 3. ASSIGNMENT OF INDEMNITY/ TRANSFER OF RIGHT TO INDEMNITY
Assignee’s Name Assignee’s SSN / EIN (circle one and enter number)22 25
Street or Mailing Address Assignee’s Phone Fax 23 26 27
City State Zip Code
24
Section 4. INDEMNITY CALCULATION
If the actual gross margin is less than the expected gross margin, an indemnity is due.
Insurance Period: Eleven-Month Insurance Period Beginning (Month, Year) 28
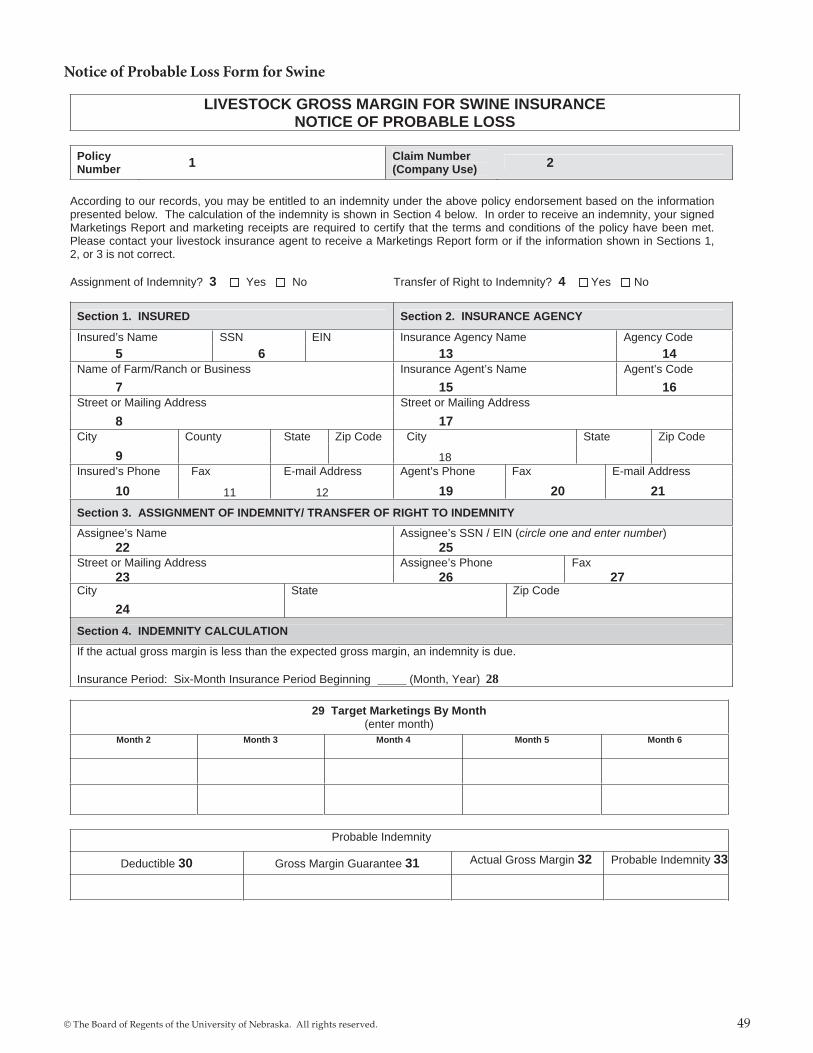
©TheBoardofRegentsoftheUniversityofNebraska.Allrightsreserved. ��
Notice of Probable Loss Form for Swine
LGM for Swine Insurance Handbook – Page 14
D. Notice of Probable Loss Form
LIVESTOCK GROSS MARGIN FOR SWINE INSURANCE NOTICE OF PROBABLE LOSS
Policy Number 1 Claim Number
(Company Use) 2
According to our records, you may be entitled to an indemnity under the above policy endorsement based on the information presented below. The calculation of the indemnity is shown in Section 4 below. In order to receive an indemnity, your signed Marketings Report and marketing receipts are required to certify that the terms and conditions of the policy have been met. Please contact your livestock insurance agent to receive a Marketings Report form or if the information shown in Sections 1, 2, or 3 is not correct.
Assignment of Indemnity? 3 Yes No Transfer of Right to Indemnity? 4 Yes No
Section 1. INSURED Section 2. INSURANCE AGENCY
Insured’s Name SSN EIN Insurance Agency Name Agency Code 5 6 13 14
Name of Farm/Ranch or Business Insurance Agent’s Name Agent’s Code 7 15 16
Street or Mailing Address Street or Mailing Address 8 17
City County State Zip Code City State Zip Code
9 18 Insured’s Phone Fax E-mail Address Agent’s Phone Fax E-mail Address
10 11 12 19 20 21Section 3. ASSIGNMENT OF INDEMNITY/ TRANSFER OF RIGHT TO INDEMNITY
Assignee’s Name Assignee’s SSN / EIN (circle one and enter number)22 25
Street or Mailing Address Assignee’s Phone Fax 23 26 27
City State Zip Code
24
Section 4. INDEMNITY CALCULATION
If the actual gross margin is less than the expected gross margin, an indemnity is due.
Insurance Period: Six-Month Insurance Period Beginning (Month, Year) 28
29 Target Marketings By Month (enter month)
Month 2 Month 3 Month 4 Month 5 Month 6
Probable Indemnity
Deductible 30 Gross Margin Guarantee 31 Actual Gross Margin 32 Probable Indemnity 33

�0©
TheB
oardofR
egentsoftheUn
iversityofNebraska.A
llrightsreserved.
App
end
ix 31
Marketin
gs Rep
ort Form for C
attle
1Th
is is the U
SDA
form for th
e 2008 crop year. Revision
s may be m
ade in su
bsequen
t crop years. Addition
ally, variations of
the form
may be u
sed by different in
suran
ce compan
ies.
LGM for Cattle Insurance Handbook – Page 3
A. LGM FOR CATTLE APPLICATION, TARGET MARKETINGS, AND CHANGE FORM
Policy # 1 State 2 Reinsurance Year
3
Page # 4 of
Confirmation Number 5
LIVESTOCK GROSS MARGIN FOR CATTLE INSURANCE POLICY APPLICATION, TARGET MARKETINGS, AND CHANGE FORM
Applicant’s Name 6 Agency Name 16
Street or Mailing Address 7 Agency/Agent Street or Mailing Address 17
City and State 8 Zip Code City and State 18 Zip Code
Applicant’s E-Mail Address 9 Applicant’s Fax # Agent’s E-Mail Address/Fax # 19
New Applicant 23 Name Change Address Change Policy Cancellation
__ *Reason for Cancellation Correct Spelling of Insured Name Successor-In-Interest & Effective Ins.
Period ______
Transfer Additional Insurance
Period Policy Change Correct Tax ID Cancellation In-House Transfer Add/Change Insured’s
Auth. Rep.*
Phone # 10 Phone # 20
Tax Identification # 11 Agency Code 21Check One SSN EIN Other 12
Spouse’s Tax ID # 13 Type of Entity 14 Applicant’s Authorized Representative (Submit Completed Power of Attorney Form)
Is applicant at least 18 years old? Yes No 15 22
CERTIFICATION 24 YES NO (a) I certify that the Target Marketings stated in this
application reflect cattle that I own or plan to own and feed to finish weight using facilities that I control.
YES NO (b) I certify that I control adequate facilities to feed and finish the number of cattle reflected by the Target Marketings stated in this application.
YES NO (c) I understand that, in the event of a claim, my coverage will be reduced to the number of cattle sold and no premium will be refunded if the number of cattle sold is less than 75% of the Target Marketings stated in this application.
(Complete for Transfer Only) Current Insurer and Policy Number 25YES NO I REQUEST INSURANCE COVERAGE FOR ALL CATTLE SPECIFIED BELOW. (Complete for Application and Additional Insurance Periods) 26
30 Target Marketings by Month (Enter Month) Month 2 Month 3 Month 4 Month 5 Month 6 Month7 Month 8 Month 9 Month 10 Month 11 Type of Operation County 27
Approved Marketings
28Deductible
($/head) 29
Yearling Finishing
Calf Finishing
31 CONDITIONS OF ACCEPTANCE: This application is accepted and insurance attaches in accordance with the policy unless: (1) The Risk Management Agency determines that livestock insurance capacity limitations in accordance with the Federal Crop Insurance Act have been reached and this policy will exceed the limitations; (2) any material fact is omitted, concealed, or misrepresented in this application and endorsement or in the submission of this application; (3) you have failed to provide complete and accurate information required by this application; (4) the answer to any of the following questions is “yes.”
YES NO (a) Are you now indebted, and the debt is delinquent, for crop insurance coverage under the Federal Crop Insurance Act? YES NO (b) Have you ever had crop insurance terminated for violation of the terms of the contract or regulations, or for failure to pay your indebtedness? YES NO (c) Are you disqualified or debarred under the Federal Crop Insurance Act, or the Regulations of the Federal Crop Insurance Corporation, or the United States Department of
Agriculture? YES NO (d) Have you in the last five years been convicted under Federal or State law of planting, cultivating, growing, producing, harvesting, or storing a controlled substance? YES NO (e) Have you ever entered into an agreement with the Federal Crop Insurance Corporation or the Department of Justice that you would refrain from participating in the crop insurance
program and that agreement is still effective? YES NO (f) Do you have like insurance on any of the above livestock?
For Office Use Only
ITS __________
Audit ________
Keyed _______
Upload _______
I understand Livestock Gross Margin for Cattle insurance may not be purchased for the month immediately following the application date. I also understand that only a limited number of applications for Livestock Gross Margin for Cattle Insurance coverage will be accepted and that I will have no Livestock Gross Margin for Cattle insurance coverage for the cattle described in this application unless the insurance company issues a written summary of insurance to me. I certify that the information on this application is complete and accurate; that none of the reasons for rejection in items 1 through 4 of the “Conditions of Acceptance” apply; and that I am aware of and understand the requirements of the Collection of Information and Data (Privacy Act), as well as all other provisions contained on this application.
REMARKS 36Applicant’s Signature 32
Date 33
Licensed Agent’s Signature 34
AgentCode35
SEE REVERSE SIDE OF FORM FOR COMPLIANCE STATEMENTS AND THE STATEMENT REQUIRED BY THE PRIVACY ACT OF 1974

©T
heBoard
ofRegentsoftheU
niversityofN
ebraska.Allrightsreserved.
��
Marketin
gs Rep
ort Form for Sw
ine
LGM for Swine Insurance Handbook – Page 3
A. LGM FOR SWINE APPLICATION, TARGET MARKETINGS, AND CHANGE FORM
Policy # 1 State 2 Reinsurance Year
3
Page # 4 of
Confirmation Number 5
LIVESTOCK GROSS MARGIN FOR SWINE INSURANCE POLICY APPLICATION, TARGET MARKETINGS, AND CHANGE FORM
Applicant’s Name 6 Agency Name 16
Street or Mailing Address 7 Agency/Agent Street or Mailing Address 17
City and State 8 Zip Code City and State 18 Zip Code
Applicant’s E-Mail Address 9 Applicant’s Fax # Agent’s E-Mail Address/Fax # 19
New Applicant 23 Name Change Address Change Policy Cancellation
__ *Reason for Cancellation Correct Spelling of Insured Name Successor-In-Interest & Effective Ins.
Period ______
Transfer Additional Insurance
Period Policy Change Correct Tax ID Cancellation In-House Transfer Add/Change Insured’s
Auth. Rep.*
Phone # 10 Phone # 20
Tax Identification # 11 Agency Code 21Check One SSN EIN Other 12
Spouse’s Tax ID # 13 Type of Entity 14 Applicant’s Authorized Representative (Submit Completed Power of Attorney Form)
Is applicant at least 18 years old? Yes No 15 22
CERTIFICATION 24 YES NO (a) I certify that the Target Marketings stated in this
application reflect swine that I own or plan to own and feed to finish weight using facilities that I control.
YES NO (b) I certify that I control adequate facilities to feed and finish the number of swine reflected by the Target Marketings stated in this application.
YES NO (c) I understand that, in the event of a claim, my coverage will be reduced to the number of swine sold and no premium will be refunded if the number of swine sold is less than 75% of the Target Marketings stated in this application.
(Complete for Transfer Only) Current Insurer and Policy Number 25YES NO I REQUEST INSURANCE COVERAGE FOR ALL SWINE SPECIFIED BELOW. (Complete for Application and Additional Insurance Periods) 26
30 Target Marketings by Month (Enter Month) Month 2 Month 3 Month 4 Month 5 Month 6 Type of Operation County 27
Approved Marketings
28Deductible
($/head) 29
Farrow to Finish
Segregated Early Wean (SEW) to Finish
Feeder to Finish
31 CONDITIONS OF ACCEPTANCE: This application is accepted and insurance attaches in accordance with the policy unless: (1) The Risk Management Agency determines that livestock insurance capacity limitations in accordance with the Federal Crop Insurance Act have been reached and this policy will exceed the limitations; (2) any material fact is omitted, concealed, or misrepresented in this application and endorsement or in the submission of this application; (3) you have failed to provide complete and accurate information required by this application; (4) the answer to any of the following questions is “yes.”
YES NO (a) Are you now indebted, and the debt is delinquent, for crop insurance coverage under the Federal Crop Insurance Act? YES NO (b) Have you ever had crop insurance terminated for violation of the terms of the contract or regulations, or for failure to pay your indebtedness? YES NO (c) Are you disqualified or debarred under the Federal Crop Insurance Act, or the Regulations of the Federal Crop Insurance Corporation, or the United States Department of
Agriculture? YES NO (d) Have you in the last five years been convicted under Federal or State law of planting, cultivating, growing, producing, harvesting, or storing a controlled substance? YES NO (e) Have you ever entered into an agreement with the Federal Crop Insurance Corporation or the Department of Justice that you would refrain from participating in the crop insurance
program and that agreement is still effective? YES NO (f) Do you have like insurance on any of the above livestock?
For Office Use Only
ITS __________
Audit ________
Keyed _______
Upload _______
LGM for Swine Insurance Handbook – Page 4
I understand Livestock Gross Margin for Swine insurance may not be purchased for the month immediately following the application date. I also understand that only a limited number of applications for Livestock Gross Margin for Swine Insurance coverage will be accepted and that I will have no Livestock Gross Margin for Swine insurance coverage for the swine described in this application unless the insurance company issues a written summary of insurance to me. I certify that the information on this application is complete and accurate; that none of the reasons for rejection in items 1 through 4 of the “Conditions of Acceptance” apply; and that I am aware of and understand the requirements of the Collection of Information and Data (Privacy Act), as well as all other provisions contained on this application.
REMARKS 36Applicant’s Signature 32
Date 33
Licensed Agent’s Signature 34
AgentCode35
SEE REVERSE SIDE OF FORM FOR COMPLIANCE STATEMENTS AND THE STATEMENT REQUIRED BY THE PRIVACY ACT OF 1974

�� ©TheBoardofRegentsoftheUniversityofNebraska.Allrightsreserved.
Appendix 41
Transfer of Right to Indemnity Form for Cattle
1This is the USDA form for the 2008 crop year. Revisions may be made in subsequent crop years. Additionally, variations of the form may be used by different insurance companies.
LGM for Cattle Insurance Handbook – Page 19
F. Transfer of Right to an Indemnity Form
LIVESTOCK GROSS MARGIN FOR CATTLE INSURANCE TRANSFER OF RIGHT TO AN INDEMNITY
Policy Number Crop Year Effective Date of Transfer Nature of Transfer 1 2 3 4
TRANSFEROR (INSURED) TRANSFEREE (S) Transferor Name
5Transferee Name
8Street or Mailing Address
6Street or Mailing Address
9City, State, Zip Code
10City, State, Zip Code
7SSN/EIN (circle one and enter number)
11
12 Are all the insured cattle and all the insured share in the livestock being transferred?
Yes Make checks payable to Transferee(s) only. Check will be mailed to Transferee’s address shown above
No Make check payable jointly to Insured and Transferee(s). Check will be mailed to Insured’s address shown above (unless an assignmentof indemnity is on file.
Target Marketings by Month (enter name of month and number of head)Deductible
($ per head)Month 2 Month 3 Month 4 Month 5 Month 6
Premium Guarantee
Total: 13 14 15 16
Transferred: 17 18 19 20
Retained: 21 22 23 24Target Marketings by Month (enter name of month and number of head)
Month 7 Month 8 Month 9 Month 10 Month 11
15 16
19 20
23 241. Acceptance by the Insurance Provider of the above-described transfer shall transfer the Insured’s right to an indemnity to the above named
Transferee subject to: a. Receipt by the Insurance Provider of satisfactory evidence that said transfer occurred before the end of the insurance period; i.e., (1) the last month of the insurance period in which you have target marketings, (2) the sale of the cattle, or (3) as otherwise specified in the policy. b. The terms of the above-identified insurance contract, including any outstanding assignment of indemnity made by the Transferor prior to the date of transfer. c. All other terms and provisions set forth herein. 2. The Insurance Provider shall not be liable for any more indemnity than existed before the transfer occurred. 3. The insurance contract of the Transferor covers the share hereby transferred only to the end of the insurance period for the current crop year. 4. The Transferee and the Transferor shall be jointly and severally liable for any unpaid premium earned for the current crop year on the acreage
and share transferred.
The premium for the coverage has been paid. 25 Yes No Agency Name 28
Agency Code 29
Transferor’s (Insured’s) Signature 26 Date 27 Authorized Representative’s Signature 32
Date 33

©TheBoardofRegentsoftheUniversityofNebraska.Allrightsreserved. ��
Transfer of Right to Indemnity Form for Swine
LGM for Swine Insurance Handbook – Page 20
F. Transfer of Right to an Indemnity Form
LIVESTOCK GROSS MARGIN FOR SWINE INSURANCE TRANSFER OF RIGHT TO AN INDEMNITY
Policy Number Crop Year Effective Date of Transfer Nature of Transfer 1 2 3 4
TRANSFEROR (INSURED) TRANSFEREE (S) Transferor Name
5Transferee Name
8Street or Mailing Address
6Street or Mailing Address
9City, State, Zip Code
10City, State, Zip Code
7SSN/EIN (circle one and enter number)
11
12 Are all the insured swine and all the insured share in the livestock being transferred?
Yes Make checks payable to Transferee(s) only. Check will be mailed to Transferee’s address shown above
No Make check payable jointly to Insured and Transferee(s). Check will be mailed to Insured’s address shown above (unless an assignmentof indemnity is on file.
Target Marketings by Month (enter name of month and number of head)Deductible
($ per head)Month 2 Month 3 Month 4 Month 5 Month 6
Premium Guarantee
Total: 13 14 15 16
Transferred: 17 18 19 20
Retained: 21 22 23 24Target Marketings by Month (enter name of month and number of head)
Deductible($ per head)
Month 2 Month 3 Month 4 Month 5 Month 6 Premium Guarantee
Total: 13 15 16
Transferred: 17 19 20
Retained: 21 23 241. Acceptance by the Insurance Provider of the above-described transfer shall transfer the Insured’s right to an indemnity to the above named
Transferee subject to: a. Receipt by the Insurance Provider of satisfactory evidence that said transfer occurred before the end of the insurance period; i.e., (1) the last month of the insurance period in which you have target marketings, (2) the sale of the cattle, or (3) as otherwise specified in the policy. b. The terms of the above-identified insurance contract, including any outstanding assignment of indemnity made by the Transferor prior to the date of transfer. c. All other terms and provisions set forth herein. 2. The Insurance Provider shall not be liable for any more indemnity than existed before the transfer occurred. 3. The insurance contract of the Transferor covers the share hereby transferred only to the end of the insurance period for the current crop year. 4. The Transferee and the Transferor shall be jointly and severally liable for any unpaid premium earned for the current crop year on the acreage
and share transferred.
The premium for the coverage has been paid. 25 Yes No Agency Name 28
Agency Code 29
Transferor’s (Insured’s) Signature 26 Date 27 Authorized Representative’s Signature 32
Date 33

�� ©TheBoardofRegentsoftheUniversityofNebraska.Allrightsreserved.
Appendix 51
Assignment of Indemnity Form for Cattle
1This is the USDA form for the 2008 crop year. Revisions may be made in subsequent crop years. Additionally, variations of the form may be used by different insurance companies.
LGM for Cattle Insurance Handbook – Page 16
E. Assignment of Indemnity Form
LIVESTOCK GROSS MARGIN FOR CATTLE INSURANCE APPLICATION FOR ASSIGNMENT OF INDEMNITY
CROP YEAR 1.
AGENCY NAME 5.
POLICY NO. 2.
AGENCY CODE 6.
COUNTY 3.
AGENCY ADDRESS 7.
COMMODITY(S) 4.
CITY 8.
STATE ZIP CODE
INSURED INFORMATION (Please Print) LENDER OR CREDITOR (herein “Lender”) INSURED’S NAME 9. LENDER’S NAME 14.
SOCIAL SECURITY NUMBER/TAX I.D. # 10.ADDRESS 11.CITY 12.
STATE ZIP CODE ADDRESS 15.
INSURED’S AUTHORIZED REPRESENTATIVE 13.
CITY 16.
STATE ZIP CODE
The undersigned Insured assigns to the Lender the right and interest of any indemnity payment(s) which may be payable to the insured under the insurance policy for the commodity(s) and crop year shown above. CONDITIONS1) This assignment will be binding upon the person(s) who succeed the Insured’s interest in the insurance policy. 2) Indemnity payments made under the insurance policy will be subject to a deduction for any indebtedness due this insurance
provider by the Insured. 3) This assignment will not grant the Lender any greater rights than originally held by the Insured. 4) The Lender’s interest will be recognized upon the insurance provider’s approval of this assignment and the Lender will have the
right to submit the loss notices and other forms as required by the Policy. 5) The insurance provider will determine the person(s) entitled to any indemnity payment(s) and the payments(s) will be issued by
joint check. 6) Cancellation of this assignment prior to the crop year stated above will be accepted by the insurance provider only upon
notification in writing by the above identified Lender. It is understood and agreed that this assignment will be subject to the terms and conditions of the insurance policy.
Signature of Insured/Authorized Representative 17.
Date Signature of Lender 18.
Date
WITNESS SIGNATURE 19.
Date WITNESS SIGNATURE 20.
Date
FILING APPROVAL This assignment was filed with the insurance provider on The insurance provider hereby approves the foregoing assignment.
21.at 22.
a.m.p.m.
(Date, Year) (Hour) Company Name 23.
Signature of Insurance Provider/Authorized Representative 24.
Date
Address 25.
SEE REVERSE SIDE OF FORM FOR STATEMENT REQUIRED BY PRIVACY ACT OF 1974 LGM AAI (4/16/02)

©TheBoardofRegentsoftheUniversityofNebraska.Allrightsreserved. ��
Assignment of Indemnity Form for Swine
LGM for Swine Insurance Handbook – Page 17
E. Assignment of Indemnity Form
LIVESTOCK GROSS MARGIN FOR SWINE INSURANCE APPLICATION FOR ASSIGNMENT OF INDEMNITY
CROP YEAR 1.
AGENCY NAME 5.
POLICY NO. 2.
AGENCY CODE 6.
COUNTY 3.
AGENCY ADDRESS 7.
COMMODITY(S) 4.
CITY 8.
STATE ZIP CODE
INSURED INFORMATION (Please Print) LENDER OR CREDITOR (herein “Lender”) INSURED’S NAME 9. LENDER’S NAME 14.
SOCIAL SECURITY NUMBER/TAX I.D. # 10.ADDRESS 11.CITY 12.
STATE ZIP CODE ADDRESS 15.
INSURED’S AUTHORIZED REPRESENTATIVE 13.
CITY 16.
STATE ZIP CODE
The undersigned Insured assigns to the Lender the right and interest of any indemnity payment(s) which may be payable to the insured under the insurance policy for the commodity(s) and crop year shown above. CONDITIONS1) This assignment will be binding upon the person(s) who succeed the Insured’s interest in the insurance policy. 2) Indemnity payments made under the insurance policy will be subject to a deduction for any indebtedness due this insurance
provider by the Insured. 3) This assignment will not grant the Lender any greater rights than originally held by the Insured. 4) The Lender’s interest will be recognized upon the insurance provider’s approval of this assignment and the Lender will have the
right to submit the loss notices and other forms as required by the Policy. 5) The insurance provider will determine the person(s) entitled to any indemnity payment(s) and the payments(s) will be issued by
joint check. 6) Cancellation of this assignment prior to the crop year stated above will be accepted by the insurance provider only upon
notification in writing by the above identified Lender. It is understood and agreed that this assignment will be subject to the terms and conditions of the insurance policy.
Signature of Insured/Authorized Representative 17.
Date Signature of Lender 18.
Date
WITNESS SIGNATURE 19.
Date WITNESS SIGNATURE 20.
Date
FILING APPROVAL This assignment was filed with the insurance provider on The insurance provider hereby approves the foregoing assignment.
21.at 22.
a.m.p.m.
(Date, Year) (Hour) Company Name 23.
Signature of Insurance Provider/Authorized Representative 24.
Date
Address 25.
SEE REVERSE SIDE OF FORM FOR STATEMENT REQUIRED BY PRIVACY ACT OF 1974 LGM AAI (4/16/02)

�� ©TheBoardofRegentsoftheUniversityofNebraska.Allrightsreserved.
Answers to “Check for Understanding”
Chapter 1
1. True.
2. False. LGM can be purchased 12 times a year for both cattle and swine.
3. False. Target marketings cannot be insured in the first month after the sales closing date.
4. True.
5. True.
6. True. To insure cattle in different states, a policy must be obtained in each applicable state, and one agent can be used as long as the agent is licensed to sell LGM in both applicable states.
7. False. The maximum number of head insurable through LGM for Cattle in a crop year is 10,000 head, while the maximum number of head insured per insurance period is 5,000 head.
8. False. Producers can insure any number of head with LGM, up to program limits.
9. True.
10. True.
Chapter 2
1. True.
2. False. An indemnity is paid when the GMG is greater than the total AGM.
3. 8; 5.
4. True.
5. March.
6. True. When calculating the cattle AGM/EGM for fed cattle, feeder cattle, or corn, (or the swine AGM/EGM for lean hogs, soybean meal, or corn) the weighted average of the two surrounding months is used if the commodity is suppose to be priced in a month that does not offer a commodity contract on the CBOT or CME.
7. True.
8. False. Premiums decrease as higher deductibles are chosen.
9. True. Premiums must be paid in full at the time the application for coverage is due, otherwise protection will not be provided.
10. False. A producer must provide a marketings report and packer sales receipt to prove that the insured live-stock were sold in order to receive an indemnity.

©TheBoardofRegentsoftheUniversityofNebraska.Allrightsreserved. ��
Chapter 3
1. True.
2. False.
3. True.
4. True.
5. False. Calculation of an indemnity is based on the planned target marketing month.
6. True.
7. False.
8. True. Although LRP and LGM cannot be used together, they can be used at separate times to insure the same livestock.
9. False. LGM cannot be lifted prior to expiration (similar to a European option).
10. True. LGM does not protect against changes between the LGM adjusted futures price and the local cash price the producer receives.
Chapter 4
1. False. LGM basis margin and futures basis are not the same. LGM basis margin is the difference between the local cash selling or purchase price and the adjusted futures prices (that include a state- and month-specific LGM basis). Futures basis is the difference between the local cash selling or purchase price and the futures price.
2. True.
3. False. Price moves are generally larger than basis changes, making price level more variable.
4. True. LGM protects against feeding and finishing margins and leaves producers open to LGM basis margin risk.
5. True.
6. False. The EGM changes from sales closing date to sales closing date. Therefore, even if everything else was the same (i.e., number of target marketings in a month and deductible), the EGMs will be different if LGM is purchased in different months.
7. False. If the GMG is greater than the total AGM for the insurance period an indemnity will be paid.
8. True.

�� ©TheBoardofRegentsoftheUniversityofNebraska.Allrightsreserved.
Chapter 5
1. True.
2. False. With LGM, a producer’s minimum expected margin is equal to the GMG plus the expected LGM basis margin.
3. False. The net margin can be lower than the minimum expected margin if the actual LGM basis margin weakens relative to the expected LGM basis margin.
4. True.
5. True.
6. False. A producer’s net margin is generally higher when no indemnity is paid because there are higher cash gross margins available.
7. D.
8. True.
UNL Extension publications are available on-line at http://extension.unl.edu/publications.