livestock and the environment: a national pilot project ...tiaer.tarleton.edu/pdf/pr9304.pdf ·...
TRANSCRIPT

LIVESTOCK AND THE ENVIRONMENT:A NATIONAL PILOT PROJECTDETAILED PROBLEM STATEMENT
Project Task 1.1
by
Ron Jones and Larry FrareyTexas Institute for Applied Environmental Research
Tarleton State UniversityBox T0410, Tarleton StationStephenville, Texas 76402
(817) 968-9567; FAX (817) 968-9568
and
Aziz Bouzaher, Stanley Johnson and Shannon NeibergsCenter for Agricultural and Rural Development
Iowa State UniversityAmes, Iowa 50011
(515) 294-1183: FAX (515) 294-6336
June 1993

CONTENTS
INTRODUCTION..................................................................................................................1THE WATER POLLUTION PROBLEM..............................................................................4LIVESTOCK PRODUCTION TRENDS EXACERBATE THE PROBLEM ......................8ERATH COUNTY, TEXAS: AN EMBODIMENT OF NATIONAL TRENDS..................11CROSS TIMBERS AREA ECONOMY ...............................................................................13EVIDENCE OF ENVIRONMENTAL DEGRADATION IN ERATH COUNTY ...............14
Table 1 - Surface Water Quality Monitoring Results .....................................................18Table 2 - Ortho-Phosphate as Phosphorous (PO4) .........................................................19Table 3 - Nitrate-Nitrogen (NO3) ...................................................................................20
FORMAL EFFORTS TO ADDRESS THE PROBLEM.......................................................22TWC..................................................................................................................................22EPA ...................................................................................................................................24TSSWCB/TIAER..............................................................................................................25
COST OF ENVIRONMENTAL COMPLIANCE.................................................................26NATIONAL PILOT PROJECT PROBLEM STATEMENT ................................................27
Discussion .........................................................................................................................27Environmental Accountability Issues................................................................................27Cross- and Extended-Media Issues ...................................................................................32Institutional Issues.............................................................................................................34Issues Affecting CAFO Location and Production Structure .............................................37
SUMMARY...........................................................................................................................38Figure 1 - Dairy Locations ..............................................................................................39Figure 2 - Number of Dairy Farms and Average Cows per Farm in Erath County ........41Figure 3 - Sample Locations ...........................................................................................43


LIVESTOCK AND THE ENVIRONMENT:A NATIONAL PILOT PROJECT
DETAILED PROBLEM STATEMENT
INTRODUCTION
As the national focus on environmental protection shifts from traditional point sources ofpollution to diffuse, nonpoint sources (NPSs), agriculture has come under the expandingumbrella of environmental regulation. The point source/nonpoint source dichotomy is confusingat best,1 particularly when applied in the agricultural context. While traditional agriculturalsources of pollution generally fall under the NPS category, concentrated animal feedingoperations (CAFOs) have been designated as a "point sources" under the federal Clean Water Act(CWA).2 Point source designation results in United States Environmental Protection Agency(EPA) jurisdiction under the CWA's National Pollutant Discharge Elimination System (NPDES)permitting program.3 In its broadest legal sense, a CAFO is an animal feeding operationcontaining 300 animal units or more which discharges pollutants to surface waters.4
However, animal feeding operations with less than 300 animal units are sometimesreferred to as CAFOs without any reference to EPA point source jurisdiction. To complicatematters further, most small and large animal feeding operations include at least two interrelatedsources of potential water pollution: 1) waste-and process-water containment structures, e.g.,anaerobic lagoons; and 2) manure application fields. The former clearly constitute a point sourceof pollution in practical terms, even where EPA jurisdiction is lacking due to the relatively smallnumber of animals within the operation. On the other hand, manure application fields display allof the attributes of a nonpoint source of pollution,5 although EPA jurisdiction over runoff fromthese fields remains an unresolved question.6 Unless stated otherwise, this problem statement
1 See 2 W. Rodgers, Environmental Law Air and Water § 4.10, at 162 (1986) ("The distinction between
point and nonpoint sources will persist as one of the delightful ambiguities of modern pollution law.").
2 Federal Water Pollution Control Act, 33 U.S.C. §§ 1251-1387 (West 1993).
3 33 U.S.C. § 1342 (West 1993).
4 40 C.F.R. § 122, Appendix B.
5 EPA, Managing Nonpoint Source Pollution, Final Report to Congress on Section 319 of the Clean WaterAct (1989) 5 (1992) ("Nonpoint source pollution generally results from land runoff, precipitation, atmosphericdeposition, drainage, or seepage.").
6 See generally Frarey, Jurisdictional and Enforcement Issues Under the New EPA Region VI GeneralCAFO Permit, Agricultural Law Update, May 1993, at 4.
2
will use the term "CAFO" in a general sense to describe all animal feeding operations, large andsmall. Likewise, "CAFO pollution" will refer to all potential sources of pollution on a CAFO.
EPA has estimated that 76 percent of impaired lake acres and 65 percent of impairedstream miles are affected by NPS pollution.7 Agriculture has been identified as the majorcontributor, impairing 50-70 percent of the assessed surface waters.8 Nonpoint source pollutionposes significant problems in isolating sources and quantifying pollutant loads. Because of itselusive nature, NPS pollution is best addressed on a watershed basis for successful abatement tooccur. A watershed approach allows maximum pollutant load allocations to all potentialpollution sources based on the total maximum daily load (TMDL) for the watershed.9
Surface water quality impairment by CAFOs has occurred in recent years in the UpperNorth Bosque River watershed. This watershed encompasses some 290,000 acres in NorthCentral Texas, and lies within the Brazos River Basin. The majority of the watershed is locatedin Erath County, which is the top milk-producing county in Texas.10 Routine water qualitymonitoring by various state agencies has documented high levels of nutrients and fecal coliformin the North Bosque River.11 In 1989, the Texas State Soil and Water Conservation Boarddesignated the Upper North Bosque River as the top priority for agricultural NPS pollutionabatement efforts.12
Potential ground water contamination by CAFOs represents the greatest long-termpollution threat to Erath County because ground water furnishes virtually all of the county'sdrinking water.13 Wastes generated by the local dairy industry are of particular concern. Sourcesof contamination on dairy operations include confinement corrals, manure application fields,
7 EPA, National Water Quality Inventory: 1986 Report to Congress (1986).
8 Id.
9 See generally EPA, Guidance for Water Quality-based Decisions: The TMDL Process (1991).
10 S. Masud and R. Lacewell, A Descriptive Analysis of Economic and Resource Conditions for the TexasCross Timbers Dairy Region: Growth Trends and Issues 36 (Texas Institute for Applied Environmental Research(TIAER) Staff Paper: SP92-01, 1992).
11 See, e.g., Brazos River Authority of Texas (BRA), Regional Assessment of Water Quality: Brazos RiverBasin Including the Oyster Creek Watershed 78 (1992).
12 Texas State Soil and Water Conservation Board (TSSWCB), Management Program for Agricultural andSilvicultural Nonpoint Source Water Pollution in Texas 2-12 (1989).
13 Texas State Soil and Water Conservation Board (TSSWCB), A Comprehensive Study of TexasWatersheds and Their Impacts on Water Quality and Water Quantity 35 (1991).

3
solid manure storage sites and waste water containment structures.14 Pathogens and solublecontaminants such as ammonium, nitrate, and phosphorus from livestock wastes may migratefrom the soil surface through the vadose zone (the unsaturated soil/rock interface between theroot zone and the water table) into ground water reserves. Pollutants also can move laterally to anoutcrop, resulting in surface water contamination.
Although surface water is not the primary drinking water source for Erath County, surfacewater pollution from CAFOs does affect the downstream users of Lake Waco, who are concernedover high fecal coliform readings in the North Bosque River after heavy rains.15 Waco liesapproximately 80 miles southeast of the mouth of the North Bosque River watershed at Hico.Lake Waco provides drinking water for the City of Waco.16
As Erath County dairy herds have increased in size and number, the issue of nuisanceodor has come to the fore. Texas, like many other states, provides neither quantitative odorlimits for CAFOs,17 nor zoning for agricultural purposes.18 Moreover, Texas Air Control Board(TACB) permitting and enforcement jurisdiction over CAFOs has been seriously challenged inthe Texas Supreme Court's recent opinion in the F/R Cattle case.19
Considering the above, a problem clearly exists in Erath County in determining how thedairy industry can continue to thrive without violating the integrity of local air and waterresources. To resolve this problem, the EPA is sponsoring a multi-disciplinary research effort inErath County called Livestock and the Environment: A National Pilot Project (NPP). The overallobjective of the NPP
is to determine technologies, management methods, policies, andinstitutional settings that can reduce the negative impacts oflivestock production for the environment, and at the same timeresult in a national livestock industry that is economically viableand competitive in increasingly open international markets. Thetask of developing these technologies, management methods,
14 J. Sweeten, C. Baird and L. Manning, Animal Waste Management (undated, TSSWCB/TAEX fact sheet
L-5043).
15 Waco Tribune-Herald, Nov. 27, 1992, at 14.
16 Id.
17 See V.T.C.A., Health & Safety Code § 382.003(3) (1992 & 1993 Supp.); 31 TAC § 101.4 (1989)(providing a nuisance standard for odor enforcement based on an equitable balancing test).
18 See V.T.C.A., Local Government § 231.001 (1988 & 1993 Supp.) (providing no general zoning powerfor counties).
19 F/R Cattle Company, Inc. v. State of Texas, No. D-2481 (Tex., April 21, 1993).

4
policies and institutions is multifaceted. The challenge is findingthe appropriate mix of existing and new agricultural andenvironmental policies and institutions that will be adopted andthat are politically sustainable, and improve the harmony oflivestock production with environmental quality.20
This study will comprehensively analyze the impact of environmental, technological, andpolicy innovations. Because the situation in Erath County is not unique, the NPP intends toproduce policy alternatives and research methodologies that can be applied to similar situationsnationwide. Results from the NPP will assist national, state and local policymakers in efficientlyreaching environmental goals by balancing pollution abatement strategies with effects on CAFOproduction.
The Upper North Bosque watershed provides an excellent opportunity to monitor theeffects of livestock operations on environmental quality. The watershed is rural in character,with major milk-, crop-, and forage-production industries. The monitoring area containsapproximately 86 dairies with a total of 26,000 milking head. Figure 1 (attached at end)identifies the location of dairies within the monitoring area.
THE WATER POLLUTION PROBLEM
In 1972, the United States faced an impending water quality catastrophe which promptedCongress to pass the CWA. In enacting the CWA, Congress set a national goal "to restore andmaintain the chemical, physical, and biological integrity of the Nation's waters."21 In settingpriorities to accomplish that task, Congress targeted the most visible and easily regulated causesof the pervasive water pollution problem: industrial and municipal sources discharging untreatedwaste through discrete pipes directly into the nation's lakes and rivers.22 This end-of-the-pipedischarge was termed "point source pollution," and provided the foundation for regulatory effortsunder the CWA.
Congress charged EPA with developing technology-based effluent standards to controlpoint source discharges, and created the NPDES program to link effluent limitations toindividual, permit-based liability.23 Technology-based regulation imposed on point sourcedischargers under the CWA has had a significant impact on reducing water pollution from those
20 TIAER & Center for Agricultural and Rural Development Iowa State University (CARD), Livestock and
the Environment: A National Pilot Project 1 (1992) (emphasis added).
21 33 U.S.C. § 1251(a) (West 1993).
22 Mandelker, Controlling Nonpoint Source Water Pollution: Can it be Done?, 65 Chi-Kent L. Rev. 479,480 (1989).
23 E.P.A. v. Calif. ex. rel. State Water Res. Control Bd., 426 U.S. 200, 205 (1976).

5
sources.24 However, after 20 years of increasingly stringent point source regulation under theNPDES program--and an estimated annual expenditure of over $33 billion on point sourcecontrols in 1987 alone25--overall water quality in the United States has improved onlymarginally, and in some cases has declined.26
As evidence mounts that point source regulation alone has failed to achieve designatedwater quality standards in many areas of the country, attention has turned to the complement topoint source pollution in the universe of water contamination, nonpoint source pollution.27
"Although nonpoint sources have been described in a number of ways, they are defined assources of water pollution that do not meet the legal definition of 'point source' in section502(14) of the Clean Water Act."28 "Nonpoint sources are any source that is not a point sourceand may, with some exceptions, be roughly analogized to the common law's 'diffused surfacewaters,' comprised mostly of runoff from land."29
Significant evidence now exists to support the allocation of substantial effort andresources to nonpoint source pollution abatement efforts:
Nonpoint sources are responsible for 65% to 75% of the pollutionin the 25% of the waters that remain degraded under state waterquality standards. Nonpoint sources contribute 45% of thepollution to estuaries, 76% of the pollution to lakes, and 65% ofthe pollution to rivers.30
Clearly, the control of nonpoint source pollution represents the greatest remainingchallenge facing the nation in attempting to achieve the water quality goals Congress set in theCWA.
24 Griffin, Kreutzberger & Binney, Research Needs for Nonpoint Source Impacts, Water Environment &
Technology, June 1991, at 60; Twenty-Year-Old Clean Water Act Sees Accomplishments, New Challenges--ACommentary by the Editors, EPA News-Notes, Nov.-Dec. 1992, at 1.
25 EPA, Environmental Investments: The Cost of a Clean Environment 3-3 (1990).
26 Commoner, Failure of the Environmental Effort, 18 ELR 10195 (1988).
27 See 2 W. Rodgers, supra note 1 § 4.10, at 146 (1986).
28 EPA, supra note 5, at 5.
29 Davidson, Thinking About Nonpoint Sources of Water Pollution and South Dakota Agriculture, 34S.D.L. Rev. 20, 21 (1989).
30 Mandelker, supra note 22, at 481.

6
Among the myriad sources of nonpoint pollution that exist, "[a]griculture continues to bethe single largest source of nonpoint source pollution problems in the nation."31 "Soil erosion isundoubtedly the major cause of such nonpoint source pollution and the majority of soil erosioncan now be traced to agricultural practices."32 Annual erosion rates exceeding 100 tons per acrehave been reported in at least one agricultural region of the United States.33 "Agricultural runoffis the cause of impairment of 55 percent of surveyed river miles found to be impaired and 58percent of surveyed lake acres."34 A second report estimates that "[t]wo thirds of the nation'srivers are adversely affected by agricultural nonpoint source pollution."35
Agricultural nonpoint source pollution manifests itself in ground water contamination aswell as in surface water degradation, because "groundwater contamination is, after all, just anonpoint source that soaked into the ground rather than flowed to a surface stream."36
There is increasing evidence of ground water pollution fromfarmers' use of pesticides and fertilizers. For example, nitrogencontamination from agricultural fertilizers is already widespread.High concentrations have been found in the Central Great Plains;the Palouse and the Columbia Basin in Washington; and parts ofArizona, the Corn Belt, Delaware, Maryland, Montana, andPennsylvania.37
Within the broad category of agricultural nonpoint source pollution, livestock wasterepresents a significant portion of the problem:
Many federal and state government reports as well as universitystudies indicate that livestock waste poses a serious threat to manywater resources across the United States. According to a summaryof state nonpoint source water quality assessments prepared in
31 EPA, supra note 5, at 13.
32 Davidson, supra note 29, at 24.
33 R. Roe, Conservation Reserve Program Participation of the Palouse Region, 1986 to 1992, at 1 (undated,Soil Conservation Service, Whitman County, Washington).
34 Water Quality 2000, A National Water Agenda for the 21st Century Final Report 5 (1992).
35 N. Hansen, H. Hope & E. Clark III, Controlling Nonpoint-Source Water Pollution a Citizen's Handbook19 (1988).
36 Davidson, supra note 29, at 22.
37 S. Batie, W. Cox & P. Diebel, Managing Agricultural Contamination of Ground Water: State Strategies 1(1989).

7
1989, over one-third of all agricultural nonpoint source pollutionimpairments in the nation were caused by livestock waste....According to the this [sic] data base, 34 states reported thatlivestock waste impaired over 4500 waterbodies nationwide. Ofthese states, 18 reported at least 30 waterbodies to be impaired.Moreover, six states had at least 400 waterbodies with animalwaste impairment.38
A partial list of waterways around the country seriously impacted by livestock wasteincludes the following: 1) the Pequea and Mill Creeks watershed in southeastern Pennsylvania,where some 58 miles of stream have been degraded by waste runoff from livestock operations; 2)Lake Okeechobee, Florida, where extensive algal blooms have occurred due to high phosphorousconcentrations caused by dairy and beef cattle operations adjacent to the lake; 3) LakePonchartrain, Louisiana, parts of which has been closed to recreational use since 1985, and where"hundreds of miles of scenic rivers and streams on the north shore are fouled by tons of cowexcrement washed into them by dairy farmers"; 4) Lone Star Lake, Kansas; 5) Harrington Lake,Kansas; 6) La Mar Lake, Missouri; 7) Lake Merhl, Maryland, where contamination from a single100-cow dairy has halted swimming in a ten-acre lake which drains a 345-acre watershed; 8)Little Black River Basin, Missouri; and 9) Chesapeake Bay, particularly the Eastern Shore ofMaryland, and the Susquehanna, Potomac, Rappahannock, and James River basins.39 The recentcase of parasite contamination of Milwaukee's water supply is merely the most widely publicizedexample of nonpoint source contamination by livestock waste in recent time.40
A recent New York case underscores the effects of mismanaged animal waste on bothsurface and ground water. There, a jury found a 1,300-cow dairy in violation of the CWA forpolluting the Genesee River, and liable for trespass for contaminating neighbors' wells withnitrates.41 Effluent from the dairy's lagoon reportedly was sprayed on application fields inexcessive amounts. Nitrate ground water contamination from dairy application fields has beendocumented in Pennsylvania as well.42 At least one study has addressed potential seepage from
38 Painter & Long, The Impact of Livestock Waste on Water Resources in the United States, in National
Livestock, Poultry and Aquaculture Waste Management 48, 49 (J. Blake, J. Donald & W. Magette ed. 1992)(emphasis added, citation omitted).
39 C. Long, Livestock Waste Pollution: A Nationwide Problem 5-6 (undated) (unpublished draft, EPAOffice of Policy, Planning and Evaluation).
40 See Chicago Tribune, April 12, 1993, at 2N ("It [a parasite] may have been carried from farms orslaughterhouses after the recent rains, washing into the Milwaukee River and then flowing in to the lake.... It[Congress] must wrestle with devising a strategy to deal with indiscriminate runoff--such things as chemical grimeand salt from city streets, and animal waste, fertilizer and pesticides from farms." (emphasis added)).
41Buffalo News, May 22, 1993, at 11.
42 F. Doran, Occupance of Nitrate in Ground Water Beneath a Dairy Sludge Disposal Field (1987).

8
dairy waste containment structures to ground water,43 and ground water salination from dairyoperations has occurred in the Chino Basin, California.44
LIVESTOCK PRODUCTION TRENDS EXACERBATE THE PROBLEM
Reports over the past decade of severe water pollution from livestock waste correlate witha distinct national trend in all livestock production sectors toward greater consolidation andconcentration, i.e., fewer producers, each raising a large number of animals within a highlyconfined production environment. Both the CWA and the literature generally refer to theseoperations as CAFOs. This movement away from more traditional, holistic farming towardspecialized livestock production under concentrated conditions increases the potential forenvironmental contamination from livestock waste.
For example, in 1980, 98 percent of the cattle feedlots in the Great Plains region of theUnited States contained less than 1,000 head; only one percent of the region's herds containedmore than 32,000 head.45 However, by 1991, only 15 percent of these feedlots contained lessthan 1,000 head, while 32 percent of the feedlots handled over 32,000 head.46 An average 1,000-pound beef cow produces 60 pounds of manure per day, containing 0.34 pounds of nitrogen, 0.11pounds of P2O5 and 0.24 pounds of K2O.47 Thus, a single 32,000-head feedlot produces over 1.9million pounds of manure per day on a relatively small parcel of land.
Similarly, in the swine production sector the number of producers has declined steadilynationally from approximately three million in 1950, to 670,000 in 1980, to 256,000 in 1992.48
However, during that same period, the total number of hogs slaughtered commercially rose from
43 A. Dye et al., Seepage Rates and Ground Water Quality Impacts from Manure Lined Dairy Waste
Lagoons (1986).
44 J. Schneider, G. Anderson, R. Holub, G. Litton, R. Nicklen, G. Stewart & R. Turner, Dairies and TheirRelationship to Water Quality Problems in the Chino Basin (1989).
45 Butcher, Easterling, Frarey, Gill & Jones, Livestock and the Environment: Emerging Issues for the GreatPlains 3, presented at Conservation of Great Plains Ecosystems Current Science, Future Options, Kansas City, MO,April 7-9, 1993.
46 Id.
47 H. Brodie & V. Bandel, Manure Testing Fact Sheet 1 (1990-91) (University of Maryland CooperativeExtension Service, Fact Sheet 430).
48 National Pork Producers Council, A Profile of Today's Pork Industry 1 (undated fact sheet); NationalPork Producers Council, 1992 Pork Facts 10 (1992).
9
79.3 million to 94 million.49 Nearly 80 percent of all hogs raised in the United States come fromonly 16 percent of the nation's hog farms, all of which raise more than 1,000 hogs.50
This trend toward consolidation and concentration holds true in the poultry sector as well.Between 1964 and 1969, poultry flocks containing more than 10,000 birds increased from 5,797to 8,914.51 Today, 55 egg producers, each with more than one million birds, maintain a total of158.8 million layers.52 The largest 20 broiler producers account for 80 percent of total nationalproduction.53
In the dairy sector, the total number of cows in the United States declined by over 50percent between 1930 and 1988, from 22.2 million to 10.2 million, while total annual milkproduction rose from 100 billion pounds to 146 billion pounds.54 The number of dairiesdecreased correspondingly during that period, from 4.5 million to 220,000.55 The averagenumber of cows per dairy increased between 1930-88, from less than five to approximately 46.56
More significantly, the number of dairies nationwide with 500 or more cows almost doubledbetween 1974 and 1987, from 661 to 1,268.57 Because a single dairy cow produces an average of82 pounds of manure per day, containing 0.41 pounds of nitrogen, 0.073 pounds of P2O5 and0.27 pounds of K2O,58 a 500-cow dairy produces about 41,000 pounds of manure per day. Duringthe last decade, a distinct, dichotomous production structure has emerged in the dairy industrycomprised of the following: 1) traditional, holistic dairy farmers, generally with small herds,growing a large percentage of their total feed requirements and applying manure as a crop andpasture fertilizer; and 2) specialized milk producers, generally with large herds and relatively
49 National Pork Producers Council, 1992 Pork Facts 14 (1992).
50 National Pork Producers Council, A Profile of Today's Pork Industry 1 (undated fact sheet).
51 Butcher et al., supra note 45, at 7.
52 Too Many Layers, Too Many Eggs and Too Little Money..., Egg Industry, Nov./Dec. 1992, at 11.
53 Amey, Nation's Broiler Industry, Broiler Industry, December 1992, at 26B.
54 United States General Accounting Office (GAO), Federal Dairy Programs Insights into Their PastProvide Perspectives on Their Future 3 (1990).
55 Id.
56 Id.
57 Butcher et al., supra note 45, at 9.
58 H. Brodie & V. Bandel, supra note 47, at 1.

10
high production per cow, purchasing a high percentage of their feed requirements and growingpasture and crops merely as a by-product of waste application to their fields.59
Economies of scale are often cited for the recent dramatic increase in the number ofCAFOs nationwide. In the beef sector, "[t]otal production estimates for feedlots show a $20/cwt.advantage for larger commercial operations (greater than 1,000 head) of which there are very fewoutside the plains states and Texas. Thus, the small farmer feedlots are unlikely to make acomeback unless environmental (or other) regulations make smaller scale operationscompetitive."60 Swine producers raising more than 10,000 hogs annually realize a 25 percentgain in economies of size over producers with only 3,000 hogs.61 California dairies in the late1970s experienced significant economies of scale by increasing herd size from 375 to 450 cows,and more gradual gains from 450 to 1,200 cows.62
In addition to the marked increase in the number of CAFOs nationwide, regional shifts inlivestock production have created greater contamination risks from livestock waste for particulargeographic areas of the United States. For example, although the Corn Belt continues to lead thenation in hog production, Texas, Colorado, Oklahoma and North Carolina are experiencingsignificant growth.63 In North Carolina, the number of hogs marketed by contract producersincreased phenomenally between 1991 and 1992, from 2.65 million to 4.5 million.64 In the dairysector, the Northwest and Southwest regions of the United States have increased their share oftotal national milk production at the expense of other regions, particularly the Corn Belt.65
Between 1970 and 1988, the Southwest increased its share of United States milk production byabout 60 percent, while the Corn Belt's share declined by about 20 percent.66
Preliminary findings from work conducted by Iowa State University's Center forAgricultural and Rural Development indicate that federal dairy pricing policy may have animpact on the size and location of dairy operations in the United States. Further, a report from
59 Texas Institute for Applied Environmental Research (TIAER), Livestock and the Environment
Rethinking Environmental Policy, Institutions and Compliance Strategies 50 (1992).
60 Hurt, et al., Continuing Transition, Feedstuffs, Sept. 14, 1992, at 1.
61 Hurt et al., Industry Evolution, Feedstuffs, Aug. 24, 1992, at 1.
62 TIAER, supra note 59, at 48 (citing Matulich, Efficiencies in Large-Scale Dairying: Incentives for FutureStructural Change, 60 American Journal of Agricultural Economics 642, 642-47 (1978)).
63 Butcher et al., supra note 45, at 5-6.
64 Marberry, Pork Production Shifts to Larger Farms, Feedstuffs, Nov. 30, 1992, at 1.
65 GAO, supra note 54, at 15-16.
66 Id.
11
the United States General Accounting Office indicates that the federal price support programencourages dairy producers to produce more milk than an unsupported market would warrant,thus creating an incentive for increased herd size:
[I]n 1985 we observed that the price support had gone from $9.00per hundredweight in 1977 to $13.10 in 1980. This increase wasalmost double the rate of inflation. Moreover, despite a surplus ofdairy products, which would normally depress prices and sendsignals to farmers to reduce production, the price support programencouraged additional production by setting the support priceabove the price determined strictly by supply and demand. Theimpact of these increases was particularly pronounced in 1980,when CCC purchases jumped dramatically from the previous year'slevel of about $251 million to about $1.3 billion.67
Due to existing economies of scale, dairy producers can realize significant productiongains by increasing herd size. Thus, by encouraging over-production, the federal price supportprogram may well have provided an important stimulus for increasing dairy herd size nationwideover the past 15 years.
ERATH COUNTY, TEXAS: AN EMBODIMENT OF NATIONAL TRENDS
Erath County, Texas provides a prime example of the relationship outlined abovebetween environmental degradation and the national trend toward increased concentration in thelivestock production industries. Specifically, during the past decade Erath County hasexperienced the following phenomena: significant degradation of surface water, ground waterand air resources; subsequent to a more than 200 percent increase in the number of dairy cowslocated in the county; at least in part as a result of an inter-regional and international shift ofdairy CAFOs from the Western United States and the Netherlands to Erath County. Thus, ErathCounty merits particular attention both because of the necessity to remedy the on-goingenvironmental contamination occurring locally, and because of the potential application oflessons learned in Erath County to similar situations as CAFOs proliferate nationwide.
Erath County has been an important dairy region in Texas for many years, withcommercial production initiating in 1891.68 While for some time the average Erath County dairyhas contained considerably more cows than the national average, as late as 1950 approximately1,800 county dairy producers still milked an average of only five cows each.69 However, by 1974
67 Id. at 29.
68 TIAER, supra note 59, at 53.
69 S. Masud & R. Lacewell, supra note 10, at 40.
12
the number of dairies in the county had dropped to 241, each containing an average of 63 cows.70
The national average that year was only 31 cows per dairy.71 By 1987, the average Erath Countydairy had grown to 189 cows,72 a 76-percent increase over the 1978 average of 107 cows perdairy (see Figure 2 attached at end). In 1991 the average Erath County dairy contained 262cows,73 an increase of almost 39 percent in just four years. By 1992 Erath County was home toover 55,000 dairy cows, a more than 215 percent increase since 1982.74 Those 55,000 dairy cowsproduce approximately 4.5 million pounds of manure per day, or about 823,000 tons of manureper year.
The phenomenal increase in both the total number of milk cows and the average dairysize in Erath County during the 1980s is generally attributed to an influx of large dairy operationsfrom the Western United States and the Netherlands.
During the period of 1980 to 1990, the region experienced a majorexpansion in the size of dairy operations. The main reason for thismovement of dairy cows to the region is favorable price costrelationships in dairying. In the mid 1980's, this dramatic increasein dairy production came from significant movement of largedairies from Arizona, California, and Washington.... Although thesize of these new dairies varies, several of them are very large....The smallest has about 400 cows. The largest in the region isAurora, which has a 3,500 milking cow herd or about 4,200 totalhead.75
Leatham adds that
[e]xpansion of existing dairies and construction of new dairies areoccurring in this area; dairies are relocating in the region. The keyfactors stimulating growth are good markets, technology transferfrom immigrants from other states and countries, dairy pricing
70 Id.
71 TIAER, supra note 59, at 53.
72 S. Masud & R. Lacewell, supra note 10, at 40.
73 Id.
74 Id.
75 Id. at 2-3.

13
policy, dairy infrastructure, and abundant feed supplies. Thesefactors increase cow numbers and production per cow.76
While an impressive number of large dairies located to Erath County during the 1980sand early 1990s, Erath County clearly reflects the dichotomous dairy production structure thatcurrently prevails throughout much of the United States. In 1987, 26 percent of the county'sdairies still had less than 50 cows, and 14 percent of the dairies had 50-100 cows.77 As ofJanuary 1993, Erath County contained a total of 225 dairies: 88 milking more than 250 cows, and137 milking less than 250 cows.78 Thus, not only does Erath County provide an example of thepotential environmental impact represented by an increase in CAFOs, it also furnishes anopportunity to compare and contrast the relative environmental impacts of CAFOs and small,more holistic, dairy operations, and the potential economic policies and abatement strategiesmost appropriate for each group.
For example, during a recent inspection program covering all Erath County dairies, theTexas Water Commission (TWC) found only ten "major deficiencies" from a total of 88permitted dairies inspected.79 All dairies in Texas with 250 milking head or more must obtain anindividual permit. On the other hand, the TWC found a total of 94 major deficiencies among thecounty's 137 unpermitted dairies.80 A "major deficiency" generally involved an unauthorizeddischarge or the complete absence of waste containment structures or a waste management plan.Coupled with data which indicate that environmental compliance costs are generally higher forsmall producers than for large producers,81 the disparity in TWC compliance by large and smallproducers indicates the need to tailor economic and scientific research, policy recommendationsand institutional arrangements to the two types of producers now comprising the dairy productiondichotomy.
CROSS TIMBERS AREA ECONOMY
76 Leatham, Schmucker, Lacewell, Schwart, Lovell & Allen, Our Industry Today Impact of Texas Water
Quality Laws on Dairy Income and Viability, 75 Journal of Dairy Science 2846, 2856 (1992).
77 TIAER, supra, note 59, at 54.
78 Stephenville Empire-Tribune, Jan. 17, 1993, at 1.
79 Id.
80 Id.
81 See EPA Responsiveness Summary, 58 Fed. Reg. 7610 (Feb. 8, 1993); E. Davis, R. Schwart & R.Lacewell, Economic Impacts of Proposed NPDES General Permit on Texas Livestock Industry (undated) (TexasA&M). But cf. Leatham et al., supra note 76, at 2849-50; 2855-56 ("Compliance with water quality laws is estimatedto have a greater impact on the smaller representative dairy, although the additional costs per cow were fewer.").
14
Agriculture plays a major role in the economy of Erath and neighboring counties,collectively know as the Cross Timbers area. The principal commodities produced in the areainclude milk, hay, peanuts, grain sorghum and wheat.82 The Cross Timbers dairy area ranks firstin milk production in Texas, totaling 1.38 billion pounds, or 25.7 percent of the state's totalproduction in 1991.83
Erath County ranks 11th among all counties in the United States in terms of total milkproduction.84 In 1991, the estimated value of milk produced in the Cross Timbers area was$191.3 million.85 About $137.4 million of that total, or 71.8 percent, came from Erath County.86
Agricultural sales in Erath County totaled $190 million in 1990, with milk sales accounting for$140 million.87 From 1981 to 1989, employment in the Cross Timbers area has increased by 180and 747 jobs in the agricultural and service sectors, respectively, principally due to increaseddemand in the dairy sector.88
The Erath County dairy industry enjoys substantial support from the local businesscommunity. Local dairy-service businesses include health and nutrition specialists, dairy facility-construction contractors and input suppliers. These businesses have grown to serve recentincreases in the region's dairy herds, and play an important role in the regional economy.Preliminary results from an economic-impact study conducted by the Texas Institute for AppliedEnvironmental Research (TIAER) and Texas A&M show that total local expenditures associatedwith milk production by dairies in the Cross Timers region amount to an estimated $227 millionper year, based on the 1991 production year.89 Clearly, the Cross Timbers area must confrontdifficult choices in weighing the need for economic growth against effects on environmentalquality.
EVIDENCE OF ENVIRONMENTAL DEGRADATION IN ERATH COUNTY
82 S. Masud & R. Lacewell, supra note 10, at 31.
83 Id. at 36.
84 Stephenville Empire-Tribune, May 6, 1993, at A12.
85 S. Masud & R. Lacewell, supra note 10, at 44.
86 Id.
87 TIAER, supra note 59, at 53.
88 S. Masud & R. Lacewell, supra note 10, at 10.
89 A. Pagano, J. Holt, R. Schwart, K. Gill & H. Jones, Profiles of Representative Erath County Dairies 33(1992) (unpublished draft in progress, TIAER, Texas A&M).

15
The Upper North Bosque River is the principal waterway draining Erath County. TheUpper North Bosque River watershed is comprised of approximately 290,000 acres, or 453square miles.90 Several tributaries feed the Upper North Bosque as it flows from north of theErath County seat of Stephenville southward to the small town of Hico, located just over theErath County line in Hamilton County. Below Hico, the Bosque River flows southeasterly toWaco, where it meets the Brazos River below Lake Waco. The Upper North Bosque Riverwatershed is predominantly rural, Stephenville being its largest community with approximately15,500 inhabitants.91 Dublin, with 2,700 inhabitants, is located on the central-western edge ofthe watershed; Hico, with a population of about 1,400, is located at the mouth of the watershed.92
Stormwater runoff from Stephenville flows directly into the North Bosque River, as doestreated effluent from the city's waste treatment plant. In fact, the North Bosque River is anephemeral waterway, the waste treatment effluent providing the only steady flow throughoutmuch of the year.93 Current estimated land use in the watershed is as follows: nine percentcropland, 24 percent pasture, 59.5 percent rangeland, 0.5 percent feedlots, one percent water,with six percent not categorized.94 As of 1992, approximately 121 diaries were located in theUpper North Bosque River watershed, with a combined herd of 38,500 cows.95
Mounting evidence exists that Erath County's surface water, ground water and airresources are significantly impaired by waste from dairy operations. On October 1, 1992, theBrazos River Authority of Texas released an assessment of the river undertaken pursuant to theTexas Clean Rivers Act.96 The report identified the North Bosque River segment as one of onlytwo "high action priority" segments out of a total of 54 segments in the river system.97 "The highAction Potential classification implies a high Impairment Potential due to a combination ofexceptional habitat characteristics, observed contraventions of water quality standards, and
90 Texas Agricultural Extension Service (TAEX), Soil Conservation Service (SCS), Agricultural
Stabilization and Conservation Service (ASCS) & Texas State Soil and Water Conservation Board (TSSWCB),Upper North Bosque River Hydrologic Unit Project 1 (1992).
91 Id.
92 Id.
93 TWC, Use Attainability Analysis of North, Middle, and South Bosque Rivers Segments 1226 and 124611 (1989).
94 TAEX et al., supra note 90, at 1.
95 Id.
96 BRA, supra note 11.
97 Id. at ES-3.

16
recorded or documented instances of specific water quality concerns or problems."98 Accordingto the report, the TWC has documented five fish kills in the river segment, all attributed todepressed levels of dissolved oxygen.99 The report cites a variety of other water quality problemsin the river segment: elevated fecal levels, with 50 percent of sampling sites exceeding waterquality criteria; elevated nutrients; high algal growth; high levels of chlorides and sulfates; andelevated total dissolved solids.100
A November 2, 1992 report on the Upper North Bosque River Hydrologic Unit Project,produced jointly by the Texas Agricultural Extension Service (TAEX), the USDA SoilConservation Service (SCS), the Agricultural Stabilization and Conservation Service (ASCS)and Texas State Soil and Water Conservation Board (TSSWCB), observed the following aboutthe North Bosque River watershed:
The lack of adequate treatment and proper disposal of animal wastefrom dairies is a conspicuous problem in the watershed andadjacent areas. Due to local awareness, media coverage, and ageneral interest by residents in the watershed and vicinity, there is acommon knowledge that an extensive water pollution potentialexists. The confinement of cattle, especially the larger dairies, hasgenerally created conditions conducive to accumulation of largequantities of animal waste. Many milking barns and corrals arelocated on ridges and knolls of Maloterre-Purves-Dugout soilswhich provide the parameters for rapid runoff and acceleratederosion on inadequately protected soil surfaces.... Runoff from asingle rain has transported untreated solid waste from barn andcorral areas, leaving deposits on roads and in roadside drains. Inmany cases, feeding and watering facilities are located within closeproximity of stream channels which increases the potential forsurface runoff pollution. Application of manure and wastewater asa source of nutrients on cropland is also potentially a problemrelative to excessive nitrogen and phosphorous and possiblyinsecticide contamination.101
Routine monitoring of the watershed began in April 1991 when the EPA approvedTIAER's Quality Assurance Project Plan. Sampling sites were selected to provide baselinecontrols, evaluate areas impacted by various agricultural activities, and to distinguish these
98 Id.
99 Id. at 77.
100 Id. at 78.
101 TAEX et al., supra note 90, at 2.

17
impacts from traditional municipal sources. Figure 3 (attached at end) shows the 24 samplingsites throughout the watershed. Six sites are located in reservoirs to provide a stable samplingbody in an area where streams are almost exclusively intermittent. These reservoirs act assettling basins and nutrient sinks for agricultural runoff, and, where heavily impacted, exhibit thecharacteristic effects of cumulative pollution loading. The 18 stream sites include 15 intermittentand three perennial stream sites. Sites above reservoirs are monitored to determine nutrientcontributions to the water body. Downstream sites are monitored to observe releases from thereservoirs and to assess the reservoirs' role in the downstream attenuation of pollutant loads.
Table 1 presents the average surface water quality monitoring results from March 1991 toMay 1992. These data establish baseline information on existing water quality in the basin. Thedata collected emphasize conventional parameters characterizing organic contaminants andbiochemical responses. These parameters were found to be highly variable, and thus have wideconfidence intervals.
Phosphorus and nitrogen are critical to the life sustaining potential of surface water.However, large concentrations of these nutrients stimulate production of aquatic plants anddisturb the balance of the ecosystem. Elevated concentrations of phosphorus can result inexcessive aquatic plant growth and a depletion of oxygen in streams. Aquatic habitats areimpaired when concentrations of total phosphates exceed 0.05 mg/L in lakes or reservoirs and0.10 mg/L in streams.102 TWC considers dissolved phosphorus (ortho-Phosphate) concentrationsabove 0.1 mg/L as elevated for screening purposes.103 While nitrate concentrations greater than10 mg/L are considered a health risk in public water supplies,104 surface water concentrations farbelow the drinking water limit may result in significant eutrophication. In fact, TWC considersammonia plus nitrate nitrogen values above 1.0 mg/L as elevated.105
102 EPA, Quality Criteria for Water PB 263943 (1986).
103 TWC, The State of Texas Water Quality Inventory 159 (1990).
104 Texas Water Commission (TWC), Ground Water Contamination Potential in Erath County, Texas 57(Greene & Klemt ed. 1992) (Draft Report 92-01).
105 TWC,.supra note 103, at 159.

Table 1 - Surface Water Quality Monitoring ResultsMarch 1991 to May 1992T
Ammonia as N (mg/L) Nitrate as N (mg/L) Ortho-Phosphate as P (mg/L)Site Min Max Mean SD Min Max Mean SD Min Max Mean SD Min
South Fork
1-IS 0.02 0.27 0.07 0.08 0.01 1.50 0.29 0.49 0.01 0.06 0.03 0.02 0.90
2-R 0.01 0.13 0.05 0.04 0.01 0.08 0.03 0.03 0.01 0.03 0.01 0.01 1.00
3-IS 0.01 0.72 0.29 0.31 0.04 0.12 0.08 0.04 0.09 0.18 0.13 0.04 1.00
4-IS 0.09 5.76 1.46 1.97 0.17 3.46 1.72 1.26 0.67 2.42 1.43 0.83 2.90
5-R 0.00 1.04 0.19 0.31 0.01 0.46 0.12 0.14 0.11 1.35 0.61 0.35 1.90
6-IS 0.03 2.10 0.48 0.64 0.31 8.57 3.23 2.75 0.01 0.72 0.30 0.25 1.90
7-IS 0.01 0.82 0.16 0.21 0.01 4.27 1.39 1.29 0.01 0.91 0.26 0.19 1.80
North Fork
8-IS 0.01 2.73 0.56 0.91 0.01 3.61 1.42 1.45 0.10 2.48 0.62 0.77 2.50
9-R 0.01 0.66 0.11 0.17 0.01 0.56 0.15 0.21 0.11 0.88 0.28 0.19 5.00
10-IS 0.04 0.28 0.13 0.08 0.01 0.51 0.20 0.18 0.01 0.53 0.23 0.18 2.50
11-IS 0.00 1.10 0.23 0.25 0.01 7.09 2.18 2.33 0.02 1.63 0.42 0.35 1.00
Alarm Creek
13-IS 0.01 1.20 0.22 0.38 0.01 1.23 0.30 0.47 0.02 0.72 0.31 0.28 1.00
14-R 0.01 0.46 0.14 0.16 0.01 0.68 0.09 0.21 0.01 0.50 0.23 0.15 4.10
15-IS 0.04 0.62 0.22 0.14 0.01 1.35 0.35 0.35 0.06 1.01 0.29 0.18 2.70
Green Creek
17-IS 0.08 0.08 0.08 0.16 0.16 0.16 1.37 1.37 1.37 2.60
18-R 0.01 0.56 0.12 0.16 0.01 0.29 0.08 0.09 0.01 0.08 0.03 0.02 1.20
19-IS 0.01 0.57 0.14 0.22 0.01 1.58 0.28 0.64 0.03 1.10 0.23 0.43 2.00
20-IS 0.02 0.03 0.06 0.03 0.03 0.80 0.28 0.36 0.04 0.35 0.18 0.16 1.10
21-R 0.01 0.56 0.21 0.19 0.01 0.26 0.05 0.08 0.01 0.07 0.03 0.02 1.10
22-IS 0.01 1.03 0.15 0.33 0.01 0.79 0.16 0.25 0.01 0.47 0.09 0.15 1.00
23-IS 0.00 1.03 0.17 0.24 0.01 1.33 0.79 0.43 0.00 1.30 0.17 0.26 1.30
Main Stem
12-S 0.02 1.40 0.32 0.39 0.62 8.61 5.22 2.71 0.29 2.72 1.30 0.71 1.00
16-S 0.01 0.73 0.13 0.20 0.13 9.06 2.00 2.42 0.22 0.95 0.41 0.25 1.20
24-S 0.01 0.48 0.11 0.12 0.04 2.95 1.14 0.85 0.06 0.47 0.20 0.12 1.20
T The results are the average over multiple depths of measurement. The means are the average over time. The number of observations differ for each site and each parameter measured. Elevated levels of nitrogen are ammonia plus nitrate nitrogen greater than 1 mg/L, O-PO4 greater than 0.1 mg/L, and BOD (5-day) greater than 5.0
mg/L. Intermittent Stream = IS; Perennial Stream = S; Reservoir = R. Only one observation was made at site 17.

19
Table 1 indicates elevated (> 0.1 mg/L) ortho-Phosphate (o-PO4) levels at eighteen sites.All recorded o-PO4 measurements at reservoirs 5 and 9, stream sites 12 and 16, and intermittentstream site 4 exceed the recommended limit. Intermittent stream site 17 shows highly elevatedo-PO4 levels, but only one observation was taken at this site. Further, the mean o-PO4 valueexceeds the recommended level at thirteen sites: 3, 6, 7, 8, 10, 11, 13, 14, 15 ,19, 20, 23 and 24.However, due to the high variation in these data, a one-sided confidence interval was calculatedto examine o-PO4 loadings. Table 2 displays these results. Out of a total of 24 sites (excludingsite 17, for which limited data are available), 12 sites (4, 5, 6, 7, 9, 11, 12,13, 14, 15, 16, and 24)exceed the recommended o-PO4 levels with a 95 percent degree of confidence; sites 8 and 10 arevery close to exceeding the recommended levels. These data indicate that o-PO4 is a pollutionproblem in the Upper North Bosque River watershed.
Table 2 - Ortho-Phosphate as Phosphorous (PO4)One Sided, 95 Percent Degree of Confidence Interval
SiteSample
SizeMean
(mg/L)
StandardDeviation
(mg/L)
LowerConfidence
Limit (mg/L)
3 - IS 4 0.13 0.04 0.08294 - IS 7 1.43 0.83 0.82055 - R 14 0.61 0.35 0.44436 - IS 12 0.30 0.25 0.17047 - IS 35 0.26 0.19 0.20598 - IS 8 0.62 0.77 0.10419 - R 15 0.28 0.19 0.1936
10 - IS 7 0.23 0.18 0.097811 - IS 25 0.42 0.35 0.300212 - S 13 1.30 0.71 0.949113 - IS 11 0.31 0.28 0.157014 - R 10 0.23 0.15 0.143115 - IS 26 0.29 0.18 0.229716 - S 13 0.41 0.25 0.286419 - S 6 0.23 0.43 -0.123720 - IS 4 0.18 0.16 -0.008223 - IS 25 0.17 0.26 0.081024 - S 34 0.20 0.12 0.1575
Formulas to calculate one sided Confidence Interval (C.I.) for small sample sizeare calculated per J. Freund & R. Walpole, Mathematical Statistics 368 (1987).
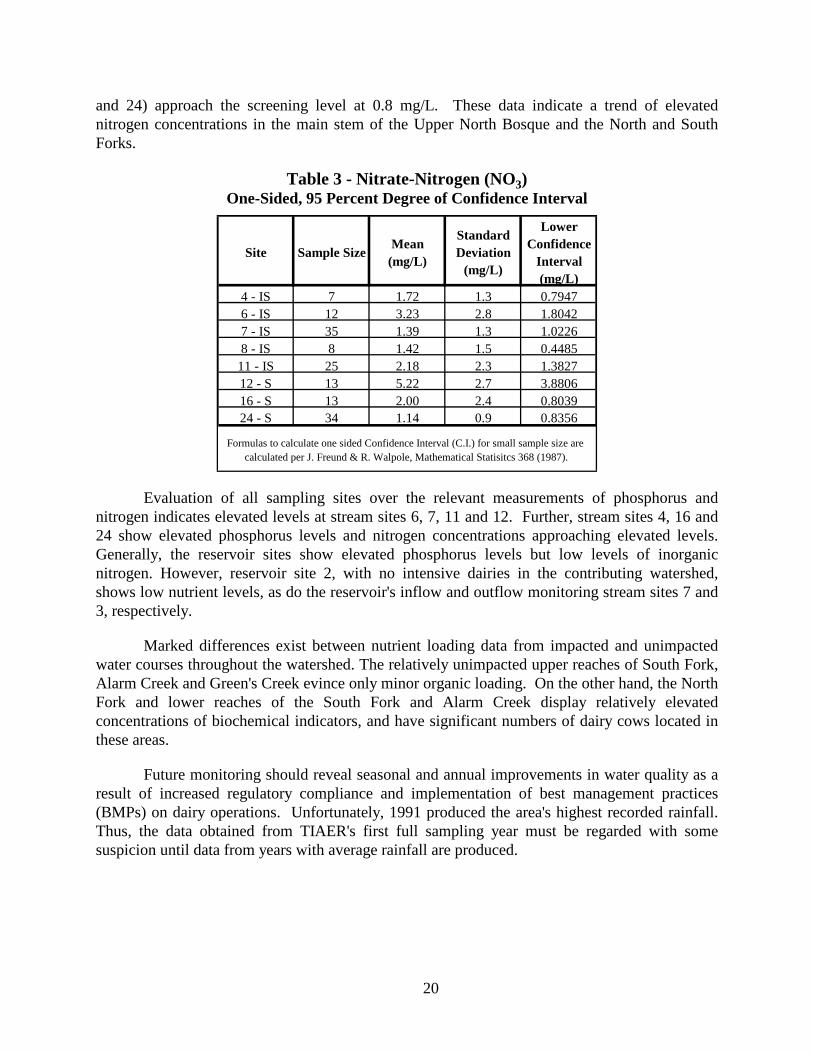
Table 1 indicates elevated nitrogen levels at several sampling sites. A total of eightstream sites have elevated mean nitrate levels greater than 1.0 mg/L. These results areconservative since only nitrate is included in screening for elevated nitrogen rather than ammoniaplus nitrate. At a 95 percent confidence level, stream sites 6, 7, 11 and 12 all exceed thescreening level for elevated nitrogen concentrations (Table 3). Further, three stream sites (4, 16
20
and 24) approach the screening level at 0.8 mg/L. These data indicate a trend of elevatednitrogen concentrations in the main stem of the Upper North Bosque and the North and SouthForks.
Table 3 - Nitrate-Nitrogen (NO3)One-Sided, 95 Percent Degree of Confidence Interval
Site Sample SizeMean
(mg/L)
StandardDeviation
(mg/L)
LowerConfidence
Interval(mg/L)
4 - IS 7 1.72 1.3 0.79476 - IS 12 3.23 2.8 1.80427 - IS 35 1.39 1.3 1.02268 - IS 8 1.42 1.5 0.4485
11 - IS 25 2.18 2.3 1.382712 - S 13 5.22 2.7 3.880616 - S 13 2.00 2.4 0.803924 - S 34 1.14 0.9 0.8356
Formulas to calculate one sided Confidence Interval (C.I.) for small sample size arecalculated per J. Freund & R. Walpole, Mathematical Statisitcs 368 (1987).
Evaluation of all sampling sites over the relevant measurements of phosphorus andnitrogen indicates elevated levels at stream sites 6, 7, 11 and 12. Further, stream sites 4, 16 and24 show elevated phosphorus levels and nitrogen concentrations approaching elevated levels.Generally, the reservoir sites show elevated phosphorus levels but low levels of inorganicnitrogen. However, reservoir site 2, with no intensive dairies in the contributing watershed,shows low nutrient levels, as do the reservoir's inflow and outflow monitoring stream sites 7 and3, respectively.
Marked differences exist between nutrient loading data from impacted and unimpactedwater courses throughout the watershed. The relatively unimpacted upper reaches of South Fork,Alarm Creek and Green's Creek evince only minor organic loading. On the other hand, the NorthFork and lower reaches of the South Fork and Alarm Creek display relatively elevatedconcentrations of biochemical indicators, and have significant numbers of dairy cows located inthese areas.
Future monitoring should reveal seasonal and annual improvements in water quality as aresult of increased regulatory compliance and implementation of best management practices(BMPs) on dairy operations. Unfortunately, 1991 produced the area's highest recorded rainfall.Thus, the data obtained from TIAER's first full sampling year must be regarded with somesuspicion until data from years with average rainfall are produced.
21
At least two reports indicate that Erath County may be experiencing ground watercontamination from excessive nitrogen. In April 1992, TWC released a draft report titled,Ground Water Contamination Potential in Erath County, Texas.3
106 The report discussed contaminants found in water samples from 50 Erath Countywells. Ten percent of the wells sampled contained nitrate levels in excess of the 10 mg/L EPAmaximum contaminant level for drinking water.107 Further, "[s]hallow ground water in thePaluxy Formation contained significant levels of nitrates."108 The report concluded that "ErathCounty is much more sensitive to non-point source or agricultural contamination thancontamination from concentrated forms of pollution."109
Results from a study by Nelson corroborate the potential in Erath County for significantnitrate contamination of ground water.110 Water samples were taken from perched water-bearingsands in the Paluxy formation near dairy wastewater lagoons.111 Drilling was conducted nearlagoons on five different dairies.112 Of the five sites sampled, three showed high ammonium ornitrate levels in the range of 44 ppm NH4-N and 20-50 ppm NO3-N.113
In addition to surface and ground water contamination, several complaints of dairy odorfrom Erath County have been recorded by the TACB Region 8 office in Fort Worth. Anexamination of those complaints reveals the impact that large dairies have had on the dairy odorproblem. From 1984 through 1986, the TACB received no complaints of dairy odor from ErathCounty.114 However, untraditionally large dairies began arriving in Erath County during the mid-1980s. From 1987 through September 1992, the TACB received 50 complaints, excluding those
106 TWC, supra note 104.
107 Id. at 49.
108 Id. at 53-54.
109 Id. at 57.
110 Nelson, Branyan & Flowers, A Preliminary Investigation of Contamination of the Vadose Zone FromDairy Wastewater Lagoons in Erath County, Proceedings of the 95th Annual Meeting of the Texas Academy ofScience, March 6-7, 1992, at 115.
111 Id. at 117.
112 Id.
113 Id. at 120.
114 TACB information sheet, Erath County Dairies--TACB Enforcement, 10/02/92, at 3.
22
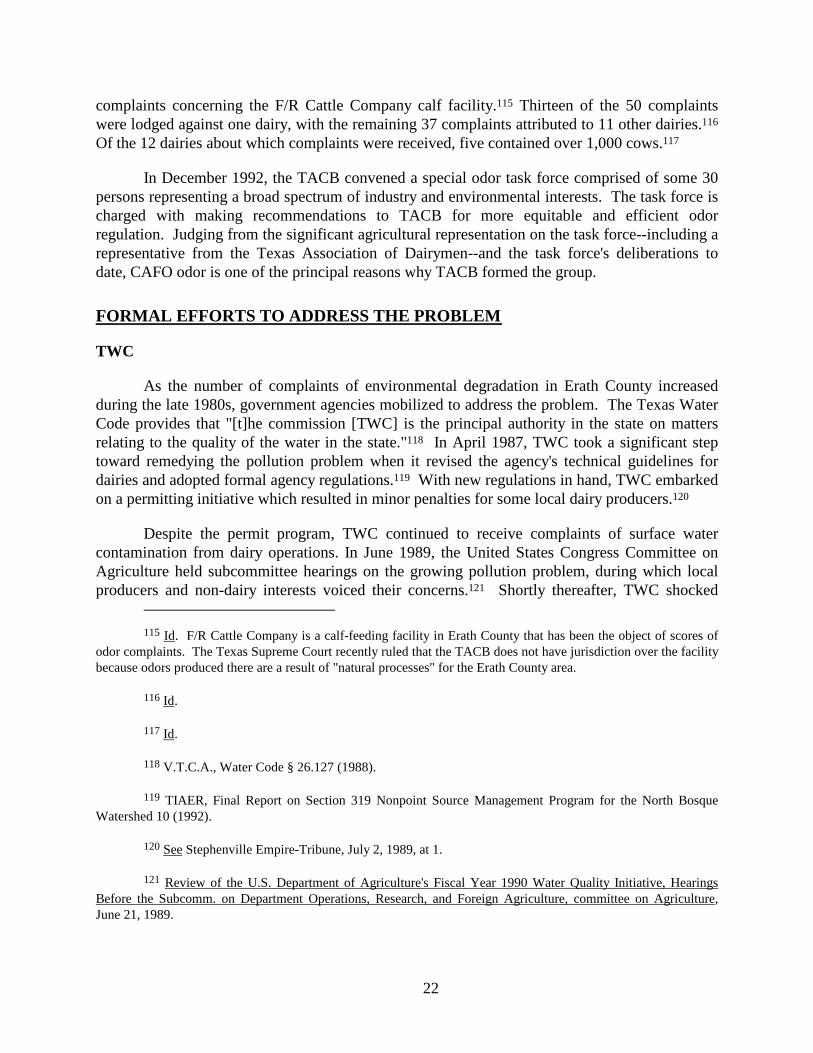
complaints concerning the F/R Cattle Company calf facility.115 Thirteen of the 50 complaintswere lodged against one dairy, with the remaining 37 complaints attributed to 11 other dairies.116
Of the 12 dairies about which complaints were received, five contained over 1,000 cows.117
In December 1992, the TACB convened a special odor task force comprised of some 30persons representing a broad spectrum of industry and environmental interests. The task force ischarged with making recommendations to TACB for more equitable and efficient odorregulation. Judging from the significant agricultural representation on the task force--including arepresentative from the Texas Association of Dairymen--and the task force's deliberations todate, CAFO odor is one of the principal reasons why TACB formed the group.
FORMAL EFFORTS TO ADDRESS THE PROBLEM
TWC
As the number of complaints of environmental degradation in Erath County increasedduring the late 1980s, government agencies mobilized to address the problem. The Texas WaterCode provides that "[t]he commission [TWC] is the principal authority in the state on mattersrelating to the quality of the water in the state."118 In April 1987, TWC took a significant steptoward remedying the pollution problem when it revised the agency's technical guidelines fordairies and adopted formal agency regulations.119 With new regulations in hand, TWC embarkedon a permitting initiative which resulted in minor penalties for some local dairy producers.120
Despite the permit program, TWC continued to receive complaints of surface watercontamination from dairy operations. In June 1989, the United States Congress Committee onAgriculture held subcommittee hearings on the growing pollution problem, during which localproducers and non-dairy interests voiced their concerns.121 Shortly thereafter, TWC shocked
115 Id. F/R Cattle Company is a calf-feeding facility in Erath County that has been the object of scores of
odor complaints. The Texas Supreme Court recently ruled that the TACB does not have jurisdiction over the facilitybecause odors produced there are a result of "natural processes" for the Erath County area.
116 Id.
117 Id.
118 V.T.C.A., Water Code § 26.127 (1988).
119 TIAER, Final Report on Section 319 Nonpoint Source Management Program for the North BosqueWatershed 10 (1992).
120 See Stephenville Empire-Tribune, July 2, 1989, at 1.
121 Review of the U.S. Department of Agriculture's Fiscal Year 1990 Water Quality Initiative, HearingsBefore the Subcomm. on Department Operations, Research, and Foreign Agriculture, committee on Agriculture,June 21, 1989.
23
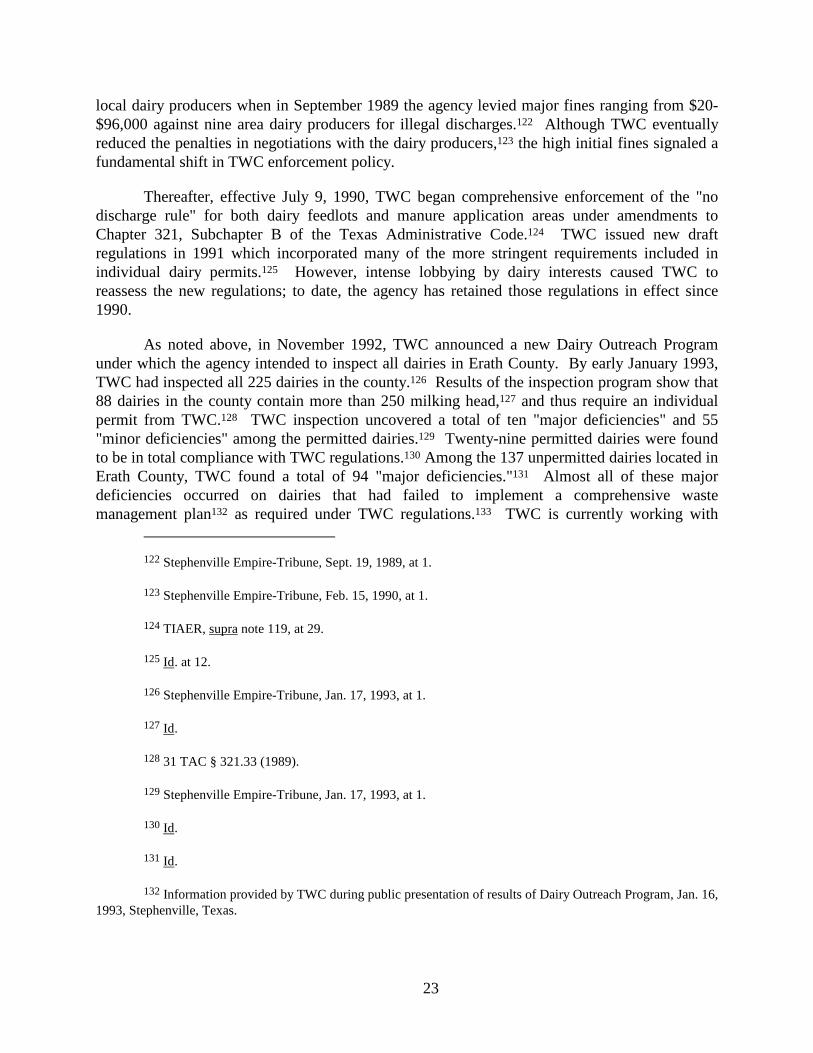
local dairy producers when in September 1989 the agency levied major fines ranging from $20-$96,000 against nine area dairy producers for illegal discharges.122 Although TWC eventuallyreduced the penalties in negotiations with the dairy producers,123 the high initial fines signaled afundamental shift in TWC enforcement policy.
Thereafter, effective July 9, 1990, TWC began comprehensive enforcement of the "nodischarge rule" for both dairy feedlots and manure application areas under amendments toChapter 321, Subchapter B of the Texas Administrative Code.124 TWC issued new draftregulations in 1991 which incorporated many of the more stringent requirements included inindividual dairy permits.125 However, intense lobbying by dairy interests caused TWC toreassess the new regulations; to date, the agency has retained those regulations in effect since1990.
As noted above, in November 1992, TWC announced a new Dairy Outreach Programunder which the agency intended to inspect all dairies in Erath County. By early January 1993,TWC had inspected all 225 dairies in the county.126 Results of the inspection program show that88 dairies in the county contain more than 250 milking head,127 and thus require an individualpermit from TWC.128 TWC inspection uncovered a total of ten "major deficiencies" and 55"minor deficiencies" among the permitted dairies.129 Twenty-nine permitted dairies were foundto be in total compliance with TWC regulations.130 Among the 137 unpermitted dairies located inErath County, TWC found a total of 94 "major deficiencies."131 Almost all of these majordeficiencies occurred on dairies that had failed to implement a comprehensive wastemanagement plan132 as required under TWC regulations.133 TWC is currently working with
122 Stephenville Empire-Tribune, Sept. 19, 1989, at 1.
123 Stephenville Empire-Tribune, Feb. 15, 1990, at 1.
124 TIAER, supra note 119, at 29.
125 Id. at 12.
126 Stephenville Empire-Tribune, Jan. 17, 1993, at 1.
127 Id.
128 31 TAC § 321.33 (1989).
129 Stephenville Empire-Tribune, Jan. 17, 1993, at 1.
130 Id.
131 Id.
132 Information provided by TWC during public presentation of results of Dairy Outreach Program, Jan. 16,1993, Stephenville, Texas.

24
those non-compliant dairies to help arrange technical assistance and financing prior to resortingto formal enforcement proceedings.134
EPA
At the federal level, EPA Region VI recently published a new general NPDES permit forCAFOs which took effect on March 10, 1993.135 The general permit applies to CAFOs in four ofthe five states in Region VI: Texas, Oklahoma, New Mexico and Louisiana.136 Because EPA hasnot delegated NPDES authority to Texas, dairy producers satisfying the appropriate size criteriamust obtain both a TWC discharge permit and an NPDES permit.137 The Texas Legislature iscurrently debating Senate Bill 1047 which would resolve the few remaining issues that haveimpeded NPDES delegation for several years.138
The Responsiveness Summary accompanying the general permit clearly indicates that theCAFO pollution problem in Erath County was one of the driving forces behind publication of thepermit.139 While CAFOs have been subject to NPDES permit requirements since 1974,140 fewCAFOs in Texas had obtained individual NPDES permits prior to publication of the generalpermit.141 The general permit is modeled on current Texas regulations and permitrequirements,142 and prohibits discharge from both animal confinement areas and manure
133 See 31 TAC § 321.43 (1992-93 Supp.).
134 Information provided by TWC during public presentation of results of Dairy Outreach Program, Jan. 16,1993, Stephenville, Texas.
135 National Pollutant Discharge Elimination System General Permit and Reporting Requirements forDischarge from Concentrated Animal Feeding Operations (General Permit), 58 Fed. Reg. 7610 (Feb. 8, 1993).
136 Id.
137 L. Frarey, Of "Moola" and Manure: The Clash of Dairy Production and Environmental Regulation inErath County, Texas 68 n. 236 (TIAER Working Paper 93-5, 1993).
138 Stephenville Empire-Tribune, March 28, 1993, at D-1.
139 Responsiveness Summary, 58 Fed. Reg. 7610, Feb. 8, 1993 (Lexis 1993).
140 Id.
141 Information provided by Paulette Johnsey, EPA Region VI, Livestock and Poultry Manure ManagementConference, February 11, 1993, Austin, Texas.
142 Discussion with Myron Knudson, EPA Region VI, Feb. 24, 1993, Austin, Texas.
25
application fields.143 Both EPA's jurisdiction to prohibit runoff from manure application fields,and its capacity to effectively monitor such runoff are questionable.144
TSSWCB/TIAER
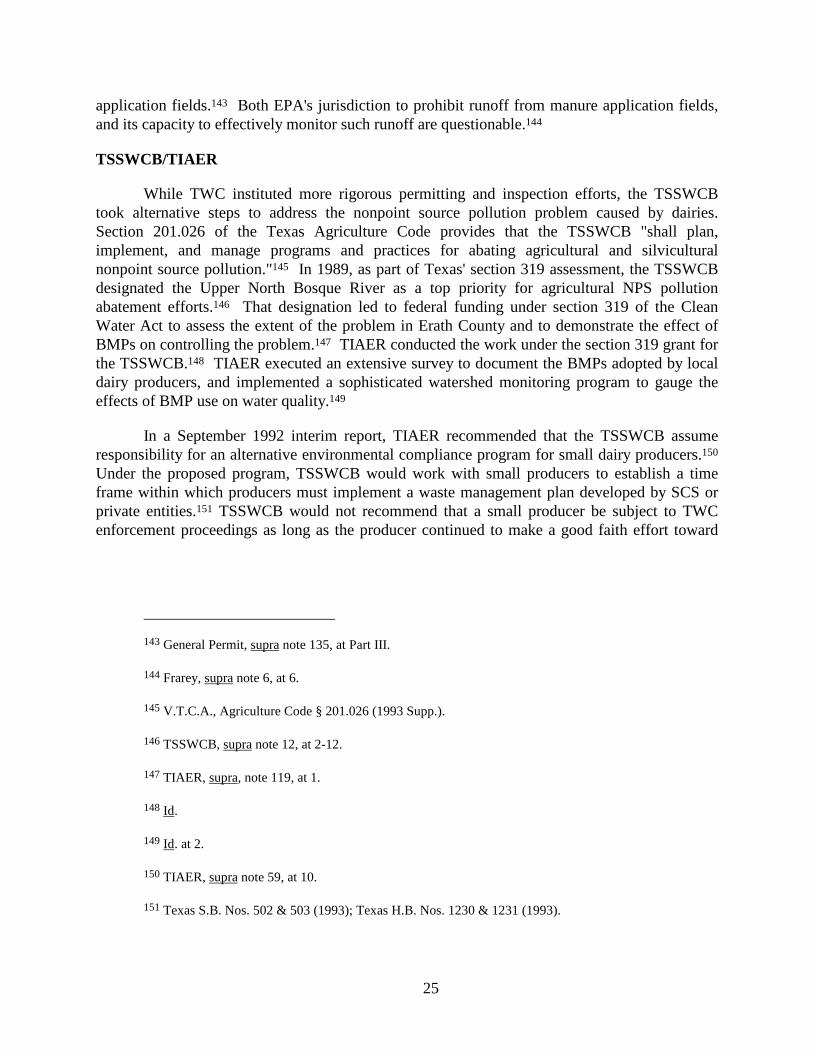
While TWC instituted more rigorous permitting and inspection efforts, the TSSWCBtook alternative steps to address the nonpoint source pollution problem caused by dairies.Section 201.026 of the Texas Agriculture Code provides that the TSSWCB "shall plan,implement, and manage programs and practices for abating agricultural and silviculturalnonpoint source pollution."145 In 1989, as part of Texas' section 319 assessment, the TSSWCBdesignated the Upper North Bosque River as a top priority for agricultural NPS pollutionabatement efforts.146 That designation led to federal funding under section 319 of the CleanWater Act to assess the extent of the problem in Erath County and to demonstrate the effect ofBMPs on controlling the problem.147 TIAER conducted the work under the section 319 grant forthe TSSWCB.148 TIAER executed an extensive survey to document the BMPs adopted by localdairy producers, and implemented a sophisticated watershed monitoring program to gauge theeffects of BMP use on water quality.149
In a September 1992 interim report, TIAER recommended that the TSSWCB assumeresponsibility for an alternative environmental compliance program for small dairy producers.150
Under the proposed program, TSSWCB would work with small producers to establish a timeframe within which producers must implement a waste management plan developed by SCS orprivate entities.151 TSSWCB would not recommend that a small producer be subject to TWCenforcement proceedings as long as the producer continued to make a good faith effort toward
143 General Permit, supra note 135, at Part III.
144 Frarey, supra note 6, at 6.
145 V.T.C.A., Agriculture Code § 201.026 (1993 Supp.).
146 TSSWCB, supra note 12, at 2-12.
147 TIAER, supra, note 119, at 1.
148 Id.
149 Id. at 2.
150 TIAER, supra note 59, at 10.
151 Texas S.B. Nos. 502 & 503 (1993); Texas H.B. Nos. 1230 & 1231 (1993).

26
compliance with the "no discharge rule."152 The governor has recently signed into law TexasSenate Bills 502 and 503, embodying this new protocol for small producer compliance.
COST OF ENVIRONMENTAL COMPLIANCE
In Texas, small and large CAFOs alike now must develop comprehensive wastemanagement plans.153 Large operations must incorporate those plans into TWC and EPAdischarge permits.154 The cost of complying with the "no discharge" rule governing both permitsand waste management plans is an unresolved issue. In a Responsiveness Summaryaccompanying publication of its Region VI general permit, EPA estimates that the cost forinstalling a wastewater lagoon, diversions and monitoring equipment for a 200-cow dairy to beapproximately $20,000, or $100 per cow; the cost is somewhat less per cow for a 700 cow dairy,at $65,000.155 On the other hand, Davis estimates compliance costs to be considerably higher at$863 per cow for a 143-cow dairy.156 Leatham estimates the cost of compliance for Texas dairiesto be $60 and $81 per cow for a 300 and 720 cow dairy, respectively.157 Notably, these resultsconflict with other studies that show the cost of compliance decreases with increasing herd size.
Boggess measured the cost of compliance with the Florida Department of EnvironmentalRegulation's (DER) Dairy Rule in the Lake Okeechobee watershed. Using a survey of affecteddairies, construction expenditures to ensure compliance, and revenue losses from constructionand compliance, averaged $1,534 per cow.158 A cost share program contributed an average of$355 per cow, leaving a dairy an average out-of-pocket expenditure of $1,179 per cow.159 Atleast 19 dairy operators out of 49 have contracted with the Florida Department of Agriculture to
152 Id.
153 Information presented during TWC presentation on dairy outreach program, Jan. 16, 1993, Stephenville,Texas.
154 33 TAC § 321.33 (1989).
155 58 Fed. Reg. 7610, Feb. 8, 1993 (Lexis 1993).
156 E. Davis, R. Schwart & R. Lacewell, Economic Impacts of Proposed NPDES General Permit on TexasLivestock Industry 16 (undated) (Texas A&M).
157 Leatham et al., supra note 76, at 2855.
158 W. Boggess, J. Holt and R. Smithwick, The Economic Impact of the Dairy Rule on Dairies in the LakeOkeechobee Drainage Basin 16 (1991) (Food and Resource Economics Department, SP 91-39, University ofFlorida).
159 Id.

27
terminate operations in the near future due to their inability to finance structural BMPs requiredby the Dairy Rule.160
Finally, Moore reports that dairies in the Tillamook watershed in Oregon spent an averageof $108 per 1,000 pound animal unit for implementation of BMPs.161 These costs represent loanexpenditures amortized over the life of each BMP.162
The costs of compliance cited above are not directly comparable due to differences in theunderlying assumptions on which they are based. However, the variance in these estimatespoints to the need for a definitive study that integrates dairy production and capital investmentacross a portfolio of potential waste management technologies. Results from the study could beused to develop optimal economic strategies to comply with the no discharge regulation, and toanalyze the economic impact of various policy alternatives.
NATIONAL PILOT PROJECT PROBLEM STATEMENT
The clear trend in all major livestock production sectors is toward specialized operations,concentrating large numbers of animals in a relatively confined area, i.e., CAFOs of industrialproportions. This trend stands in contrast to the more traditional, holistic farming operationwhere crop production and animal husbandry coexist in an integrated system. Because of thegreat amount of animal waste they produce, CAFOs have the potential to cause significantsurface and ground water pollution and odor. Current local, state and federal agricultural andenvironmental policies, and the institutions designed to execute those policies, have proveninadequate to support current CAFO production methods while maintaining a generallyacceptable level of environmental quality.
Discussion
After carefully examining the social, economic and environmental issues raised by CAFOpollution in Erath County, and more generally in the United States, the NPP has organized theissues to be addressed by project research under four headings: 1) Environmental accountabilityissues; 2) Cross- and extended-media issues; 3) Institutional issues; and 4) Issues affectingCAFO location and production structure. Specific project objectives to resolve these issues willbe refined by the various NPP working groups.
Environmental Accountability Issues
160 Darling, Status of Florida Regulations of Dairy Farm Waste Management, in National Poultry and
Aquaculure Waste Management 67, 68 (J. Blake, J. Donald & W. Magette ed. 1992).
161 J. Moore, R. Pederson & J. Worledge, Keeping Bacteria Out of the Bay The Tallamook Experience 74(1992) (EPA Seminar Publication, The National Rural Clean Water Program Symposium, EPA/625/R-92/006).
162 Id.
28
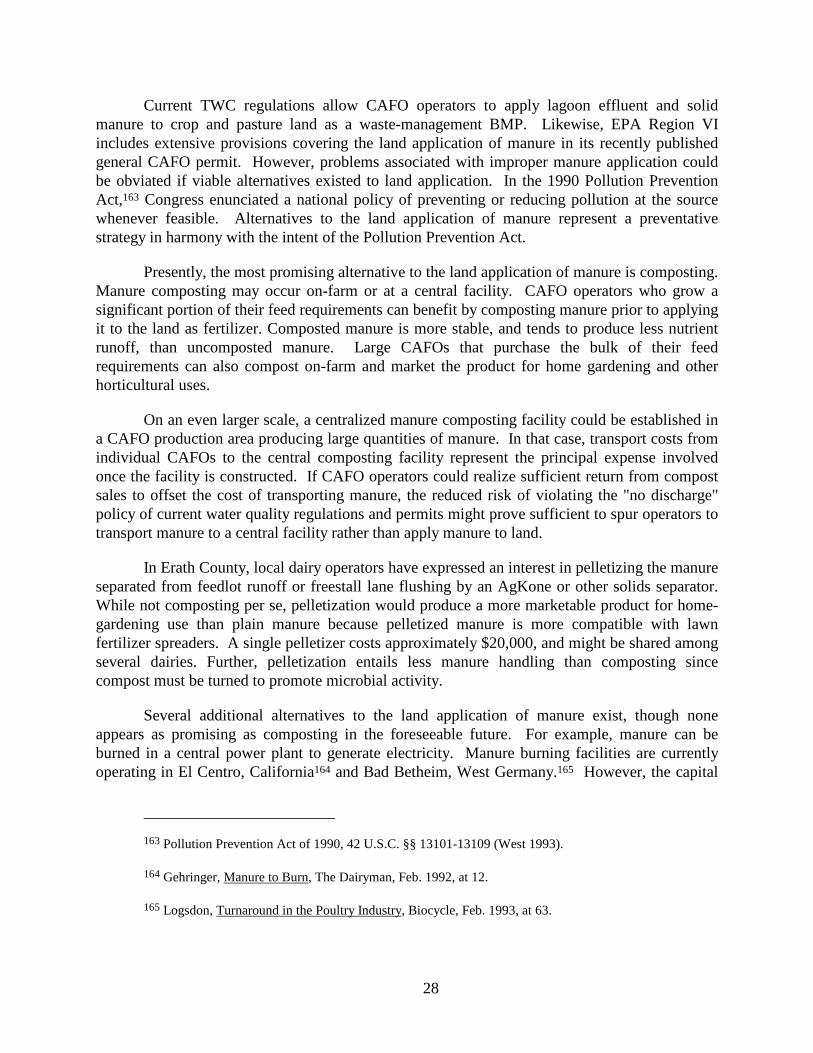
Current TWC regulations allow CAFO operators to apply lagoon effluent and solidmanure to crop and pasture land as a waste-management BMP. Likewise, EPA Region VIincludes extensive provisions covering the land application of manure in its recently publishedgeneral CAFO permit. However, problems associated with improper manure application couldbe obviated if viable alternatives existed to land application. In the 1990 Pollution PreventionAct,163 Congress enunciated a national policy of preventing or reducing pollution at the sourcewhenever feasible. Alternatives to the land application of manure represent a preventativestrategy in harmony with the intent of the Pollution Prevention Act.
Presently, the most promising alternative to the land application of manure is composting.Manure composting may occur on-farm or at a central facility. CAFO operators who grow asignificant portion of their feed requirements can benefit by composting manure prior to applyingit to the land as fertilizer. Composted manure is more stable, and tends to produce less nutrientrunoff, than uncomposted manure. Large CAFOs that purchase the bulk of their feedrequirements can also compost on-farm and market the product for home gardening and otherhorticultural uses.
On an even larger scale, a centralized manure composting facility could be established ina CAFO production area producing large quantities of manure. In that case, transport costs fromindividual CAFOs to the central composting facility represent the principal expense involvedonce the facility is constructed. If CAFO operators could realize sufficient return from compostsales to offset the cost of transporting manure, the reduced risk of violating the "no discharge"policy of current water quality regulations and permits might prove sufficient to spur operators totransport manure to a central facility rather than apply manure to land.
In Erath County, local dairy operators have expressed an interest in pelletizing the manureseparated from feedlot runoff or freestall lane flushing by an AgKone or other solids separator.While not composting per se, pelletization would produce a more marketable product for home-gardening use than plain manure because pelletized manure is more compatible with lawnfertilizer spreaders. A single pelletizer costs approximately $20,000, and might be shared amongseveral dairies. Further, pelletization entails less manure handling than composting sincecompost must be turned to promote microbial activity.
Several additional alternatives to the land application of manure exist, though noneappears as promising as composting in the foreseeable future. For example, manure can beburned in a central power plant to generate electricity. Manure burning facilities are currentlyoperating in El Centro, California164 and Bad Betheim, West Germany.165 However, the capital
163 Pollution Prevention Act of 1990, 42 U.S.C. §§ 13101-13109 (West 1993).
164 Gehringer, Manure to Burn, The Dairyman, Feb. 1992, at 12.
165 Logsdon, Turnaround in the Poultry Industry, Biocycle, Feb. 1993, at 63.
29
investment to build such a plant may prove prohibitive in many cases.166 Moreover, the ElCentro, California plant has reportedly experienced some technical difficulties resulting from thelow temperature at which solid manure burns.
Another alternative use for CAFO manure might be as a component of animal feedrations. Chicken manure has been used extensively in this fashion.167 While cow manure doesnot appear to have engendered the same level of interest as chicken manure as a component ofanimal feed rations, one Erath County entrepreneur has marketed an animal ration containingcow manure.168
Finally, under ideal circumstances anaerobic lagoon effluent could be transported tomunicipal waste treatment plants. While inviting in theory, few municipal waste treatmentfacilities are equipped to handle the additional load represented by the manure produced by 50-100,000 dairy cows--some four to eight million pounds per day. Further, even if a municipalitywere to seriously consider handling CAFO effluent, the cost involved for CAFO operators totransport effluent and reimburse a municipality for increased treatment expenses would likelyprove prohibitive. Considering the substantial cost and technological constraints involved indeveloping many of these alternatives to the land application of manure, the NPP will limitproject purview to manure composting, pelletization or similar processes as viable alternatives toland application.
In the event no viable alternatives exist to the land application of manure solids andlagoon effluent, BMPs must be identified and implemented to insure that CAFO operators applymanure in an environmentally sound manner. A short list of such BMPs includes filter stripsbetween manure application fields and adjacent waterways; application at proper agronomic ratesfor crops growing on the application field, established by soil testing of manure application fieldsand nutrient testing of the manure applied; application on fields with moderate slope;incorporation of manure solids on fallow cropland; and no application of lagoon effluent ormanure solids just prior to or during rain events or on frozen ground. While these BMPs andothers likely reduce surface and ground water contamination from manure application fields, thecorrelation between BMP implementation and nutrient load reduction from manure applicationfields is not well established. Definitively establishing that relationship will likely requireseveral years of in-stream monitoring. Meanwhile, NPP monitoring of application-field runoffand subsequent fate and transport modeling should provide a reliable indication of the pollutionabatement to be expected by BMP implementation over the long term.
166 Id.
167 Id. at 61.
168 TIAER, supra note 119, at 126.

30
Disregarding filter strips, all of the BMPs identified above for manure application fallunder the category of managerial BMPs as opposed to structural BMPs.169 While NPPresearchers understand that structural BMPs like anaerobic lagoons represent potentiallysignificant pollution threats to both surface and ground water, project efforts will focus moreclosely on nutrient runoff from manure application fields since the pollutant contribution fromapplication fields is less understood and more difficult to monitor than surface discharge fromcontainment structures. The NPP will examine potential ground water contamination to theextent permitted by project funding.
Field monitoring for adherence to managerial BMPs is inherently problematic, requiringthe allocation of prohibitive levels of manpower by regulatory agencies. Waste discharges frommanure application fields are unpredictable, occurring irregularly during severe rainfall events orduring dewatering of containment structures. Under current state and federal regulations andpermit requirements, detection of waste discharge from manure application fields wouldnecessitate the presence of an inspector at each application field during storm events ordewatering operations. Excessive nutrient runoff would likely go undetected even in thepresence of an inspector. Similarly, to insure the incorporation of manure solids on fallowcropland as required by many TWC permits, an inspector must be present at the time manure isspread and return 48 hours later; otherwise, the inspector has no way of knowing whether the 48-hour incorporation period has elapsed. Obviously, visual monitoring for adherence to managerialBMPs on manure application fields comports serious drawbacks.170
The same problems associated with visually detecting polluted surface runoff frommanure application fields occur to an even greater extent in detecting ground watercontamination from excessive manure application. No amount of visual inspection can informregulators of the extent of nutrient leaching beyond the root zone on application fields. Nutrientfate and transport within the vadose zone is a complex and site-specific process.
Given the impracticality of visual monitoring of manure application BMPs, twoalternatives exist. One would require CAFO operators to conduct regular soil analyses of manureapplication fields and nutrient analyses of manure solids and lagoon effluent, and to maintainrecords of those analyses on-site as part of a facility's pollution prevention plan. At present, theEPA Region VI general CAFO permit does not require either regular soil or manure testing.However, the EPA guidance published pursuant to section 6217 of the Coastal Zone ActReauthorization Amendments171 indicates that manure and soil testing will become standardprocedure in all coastal areas. Regulators can incorporate information on the size and cropping
169 Logan, Agricultural Best Management Practices and Groundwater Protection, Journal of Soil and Water
Conservation, March-April 1990, at 201, 202.
170 See generally H. Jones, Monitoring Compliance Through Visual Inspection (undated) (draft report,TIAER).
171 Coastal Zone Management Act of 1972, 16 U.S.C. §§ 1451-1464 (West 1993).

31
patterns of manure application fields together with soil and manure analyses to determinewhether sufficient application land exists for a particular facility.
While periodic soil and manure analyses and proper documentation might help alleviateproblems of nutrient saturation in some areas, this alternative does little to solve shortcomingsassociated with manure application during inclement weather, on frozen ground, or withoutincorporating solids into fallow cropland. Application under those conditions can easily result inan undetected discharge that no amount of soil and manure analysis and associated recordkeeping can avoid. Moreover, the Region VI general CAFO permit expressly allows manureapplication beyond proper agronomic rates absent any direct risk of surface runoff to navigablewaters.172 This provision increases the potential for ground water contamination.
A second alternative to the inadequacies of visual monitoring is water quality monitoringon a micro-watershed basis. Once a water quality problem is detected in a particular streamsegment, small portions of the steam can be isolated with automatic sampling equipment toidentify the primary sources of contamination. When combined with appropriate institutionalarrangements for organizing watershed stakeholders, a micro-watershed abatement approach mayrepresent a viable alternative to the difficulties inherent in visually monitoring managerial BMPson manure application fields.
A micro-watershed approach to pollution abatement involves pollutant load allocationsamong watershed stakeholders to achieve a designated TMDL. Nutrient fate and transportmodeling can provide estimates of expected load reductions from implementation of variousmanure-application BMPs. However, these estimates alone do not inform watershedstakeholders whether the proposed BMPs will result in attainment of the micro-watershed's waterquality standard to support the stream's designated use. Consequently, an accurate gauge ofwater quality improvement through nutrient load reduction--a watershed target for success--isnecessary to insure stakeholder cooperation with abatement efforts. A water quality target isparticularly important where voluntary BMP adoption is intended as the primary abatementstrategy. Even taking into account cost share financing for BMP implementation, watershedstakeholders are far more likely to voluntarily implement both structural and managerial BMPs ifimplementation appears to correlate with attainment of a pre-designated standard.
At least two alternatives exist to relying solely on individual nutrient load reductions as atarget for successful pollution abatement within a micro-watershed. The first is a water qualitymodel which uses output data from nutrient fate and transport models. A properly interfacedwater quality model of this type could produce a dissolved oxygen (DO) figure that would be ofdirect benefit to watershed stakeholders and policymakers alike, since DO is one of the fewuniform indicators upon which state water quality standards are based. However, where nutrientor sediment loading are the primary water quality problem in the watershed, other gauges ofsuccessful pollution abatement must be devised.
172 General Permit, supra, note 135, at 34 (page number refers to copy of general permit mailed to
interested parties by EPA Region VI).

32
A second water-quality based alternative involves a comparison between nutrient loadinginto the impacted water body of interest and loading into an unimpacted water body of similarassimilative capacity. The nutrient loads entering the unimpacted body provide a ready load-reduction target for the impacted body. This comparison is inhibited only to the extent waterbodies with similar assimilative capacities cannot be found. In the North Bosque Riverwatershed, paired reservoirs provide an excellent opportunity to gauge load reduction-targetsaccording to a similar water body. A nationwide database of categorized, unimpacted waterbodies would aid many pollution abatement projects in establishing feasible nutrient load-reduction targets.
Given the importance of establishing an accurate water-quality target for successfulpollution abatement, a water quality model, a nutrient load-comparison mechanism or bothshould be included in the NPP. By closely relating BMP implementation to identifiableimprovements in water quality, voluntary abatement programs stand a far greater chance tosucceed.
Cross- and Extended-Media Issues
Surface water contamination from CAFOs provides the focus for much of the NPP'sefforts. However, CAFOs can significantly impair at least two other critical resources as well:air and ground water. Both merit as much attention as project resources permit to develop acomplete picture of the environmental impact of CAFOs. Only in considering all relevantenvironmental impacts can the NPP provide informed policy alternatives to the status quo.
The federal Clean Air Act addresses dust and other particulate pollution from CAFOs, butdoes not regulate CAFO odor in any way. Odor regulation is left to state law, and in TexasCAFO odor regulation has become a salient issue. In Erath County, dairy odor is as divisive anissue as surface and ground water contamination. This fact is clearly evidenced by the TexasSupreme Court's recent decision in the F/R Cattle case, in which the Supreme Court held that theTACB does not have jurisdiction over a 6000-calf feeding facility because calf raising is a"natural process" in Erath County, Texas.
The F/R Cattle case is in large part responsible for the TACB's organization of a specialodor task force to deal with odor regulation. The task force is charged with makingrecommendations to the TACB chairperson on how to produce more equitable and efficient odorregulation in Texas. The large representation by agricultural interests on the odor task forcetestifies to the intense interest CAFO odor regulation has generated. One of the task force's threeworking committees is wholly dedicated to agricultural odor regulation.
Pending legislation in the Texas Legislature provides for a virtual exemption from TACBregulation for CAFOs. Senate Bill 684 calls for TACB permitting and enforcement jurisdictionover agricultural operations only where the TACB can prove that a facility is not operatedaccording to good agricultural practices, and where emissions from the operation "have caused or
33
currently are causing specific bodily injury to a member of the public."173 According to TACBgeneral counsel, the proposed standard will effectively preclude TACB regulation of CAFO odorin virtually all cases.174
Odor regulation is hindered by the subjective nature of odor intensity andobjectionableness. A second shortcoming involves the relatively unsophisticated nature of odormonitoring equipment. A recent survey of odor regulatory agencies around the country by TACBreveals that 15 responding agencies use a scentometer to determine whether a nuisance conditionexists.175 However, the scentometer is inherently unreliable for regulatory purposes.176 Abutanol olfactometer provides a more reliable gauge of odor intensity but, like the scentometer,requires several odor panelists to produce consistent results.
CAFO odor must be addressed in any comprehensive examination of the environmentalimpacts of CAFOs. Wastewater containment structures and manure application fields--both ofwhich are BMPs for surface water pollution protection--often represent the worst sources ofCAFO odor. Thus, optimum management of these BMPs is crucial to avoid a direct trade-offbetween surface water protection and air quality.
The weather, coupled with diurnal and nocturnal variables, likely has a significant effecton the dispersion of odors from CAFO sources. While odor dispersion modeling is in its infancy,tracking the intensity and movement of CAFO odor at various sites is imperative to provide abetter understanding of how manure management BMPs affect CAFO odor. For this reason, theNPP will expend considerable effort in monitoring and modeling odors produced on dairieswithin the watershed.
In addition to examining sources of surface water and odor contamination, the NPP willexamine the effects of CAFO pollution on ground water quality to the greatest extent permittedby project funding. Ground water is particularly important in Erath County and most rural areasof the country as the primary source of drinking water.177 Of special concern is the fact thatground water clean-up is technically difficult and extremely expensive once an undergroundsource becomes contaminated.178
173 Texas S.B. No. 684 (1993).
174 Statement by TACB general counsel at TACB odor task force meeting, Austin, Texas, April 30, 1993.
175 TACB, Nuisance Odor Task Force Survey of State, Regional and Local Nuisance Odor Policies 2(1993).
176 J. Watts & J. Sweeten, Towards a New Regulatory Definition of Odor Nuisance 14 (1993) (submitted toJournal of the Air & Waste Management Association).
177 GAO, USDA Needs to Better Focus its Water Quality Responsibilities 9 (1990).
178 Id.
34
Just as was the case with CAFO odor, BMPs for surface water pollution abatement canexacerbate ground water contamination. An improperly lined wastewater containment structuremight adequately prevent the discharge of waste and process water to nearby streams, but in theprocess permit concentrated nutrients to leach down into aquifers. Nutrient leaching also canoccur as a result of the application of manure effluent and solids beyond agronomic rates.Rigorous manure and soil testing could go far toward limiting this leaching from manureapplication fields.
Many questions exist concerning the movement of nitrogen through the vadose zone toground water supplies. Further study of the paths and rate of movement of nitrogen as it leacheswould help policymakers better understand the risks to ground water posed by the excessiveapplication of manure and improperly designed waste containment structures. In addition,Nitrogen-15 isotope technology permits discrimination between sources of nitrogencontamination. This capability might prove determinative when attempting to isolate two ormore distinct contamination sources within a watershed. Given the importance of ground waterin rural communities nationwide, and the difficulty inherent in reversing ground watercontamination, the NPP will devote as many resources as project funding will permit to theexamination of potential ground water contamination by CAFOs.
Institutional Issues
The status quo agricultural and environmental institutional framework has provenincapable of effectively and efficiently abating CAFO pollution. On the regulatory side, EPAand state counterparts have concentrated on controlling industrial and toxic pollutants since the1972 enactment of the CWA. Active regulation of CAFO point sources is a recent phenomenon,brought about by vocal public concern over the environmental impact of CAFOs on air and waterresources. Because EPA, its state counterparts, and the administrative system they represent weredesigned to handle traditional point sources of pollution, that system should be revisited todetermine whether limited regulatory resources can be better utilized through closer linkageswith traditional farm-service organizations.
USDA and its associated agencies at the federal, state and local levels have a longtradition of "farmer friendly" service. SCS, ASCS, the Extension Service and state and local soiland water conservation organizations have evolved into a complex system through which farmersreceive technical assistance, cost share financing, market price supports and agriculturaleducation. This traditionally close working relationship with farmers could be exploited torealize substantial gains in CAFO pollution abatement.179
Thus, the institutional goal for the NPP is to determine the ideal interface for farm-serviceand regulatory agencies at the local, state and federal levels to insure the greatest pollutionabatement by CAFOs and other agricultural activities at the least cost in terms of regulatoryeffort and productivity. Owing to both significant budget constraints at all levels of government,
179 Id. at 2.

35
and widespread recognition that agriculture represents one of the largest remaining categories ofpollution yet to be controlled, significant activity is currently in course to modify the institutionalstatus quo to facilitate pollution abatement. At the federal level, a move is underway toreorganize the USDA system to provide farm services more efficiently.180 In Texas, the governorhas recently signed into law legislation designed to implement a voluntary BMP abatementprogram directed by TSSWCB. Senate Bill 503 requires the TSSWCB to implement a "waterquality management plan certification program" for watersheds with existing or potentialagricultural NPS pollution problems, or watersheds in the "coastal zone."181 Individual farmplans must comply with state water quality standards for the area in which the operation islocated.182 This new legislation, coupled with a revitalized USDA, offers promise for aneffective watershed-based pollution abatement program based on voluntary BMP adoption.
As currently taking shape in Texas, a new watershed-based institutional arrangementmight function as follows: A local conservation district organizes stakeholders within a problemwatershed to meet to identify pollution sources. Once the greatest sources of pollution areidentified, stakeholders recommend the implementation of BMPs to control those sources. Thelocal conservation district then refers those landowners required to implement BMPs to a newUSDA conservation agency where waste management plans are developed and cost-share isarranged to finance the plans. Regulatory agencies enter the picture only at the point where "badactors" within the problem watershed refuse to cooperate with the voluntary program, thusimpeding the watershed's attainment of the designated water quality goal.183 Senate Bill 503requires the TSSWCB to refer recalcitrant landowners to the Texas Natural ResourceConservation Commission184 when a TSSWCB-developed "corrective action plan" is notsuccessfully implemented.
Most observers believe that a combination of voluntary and regulatory programs isnecessary to effectively control CAFO pollution.185 While the proper mix of regulation andincentives to induce voluntary adoption of BMPs has yet to be determined, agricultural interestsclearly favor voluntary BMP implementation, with command-and-control regulation reserved for
180 See Fort Worth Star-Telegram, Jan. 8, 1993, at A5.
181 Texas S.B. No. 503 (1993).
182 Id.
183 See Odgers, Regulations Bolster Voluntary Programs for Clean Up of Agricultural Nonpoint "BadActors" in Wisconsin, in National Livestock, Poultry and Aquaculture Waste Management 273, 274 (J. Blake, J.Donald & W. Magette ed. 1992).
184 On September 1, 1993, the TWC will join TACB and other state agencies under a new Texas NaturalResource Conservation Commission.
185 See, e.g., Viessman, Water Management Issues for the Nineties, 26:6 Water Resources Bulletin 883,889 (1990).

36
"bad actors." Those favoring greater emphasis on traditional regulation will likely acquiesce ingiving voluntary BMP adoption a chance to succeed simply because regulatory agencies lack theresources to monitor compliance with many CAFO regulations, particularly some of themanagerial BMPs discussed above. Key issues to be resolved at each regulatory/voluntary BMPimplementation interface concern the water-quality criteria by which regulators will judge thesuccess of voluntary BMP implementation, and the amount of time regulators will give voluntarypollution abatement programs to demonstrate success prior to regulatory intervention.Regulators should formalize these points early on so that both producers and institutionsinvolved in voluntary BMP implementation understand the performance expected of them.
Thus, significant institutional change is currently underway to better deal with CAFOpollution problems. Both USDA reorganization and state initiatives like those occurring inTexas offer promise for merging voluntary and regulatory pollution abatement programs. TheNPP will examine these initiatives and others to determine the optimum institutional frameworkfor CAFO pollution abatement. Because the majority of states have created similar regulatoryand farm-service organizations, that framework should be readily transferable to a number ofsites around the country.
Moreover, agencies currently not involved in pollution abatement might be incorporatedinto the process. For example, the Texas Department of Health conducts monthly visits to allstate dairies to certify compliance with regulations controlling milk quality. With little additionaleffort, Health Department inspectors might monitor dairy records required under pollutionprevention plans, or make observations for illegal discharges from containment lagoons andmanure application fields.
While voluntary BMP implementation will often result in CAFO pollution abatement, apermit-based regulatory approach will likely prevail for large operations. In that case, specialattention must be given to the administrative process for obtaining a permit. The currentpermitting system was developed during the 1970s and 80s when traditional industrial pointsources were drawn into the NPDES program. In its present form, attorneys and engineers are anintegral part of that system, resulting in significant costs for permit applicants and opposingparties alike.
Because CAFOs are inherently different from most of the point source industries forwhich the present NPDES permitting system was designed, modification of currentadministrative procedures may be warranted. Many CAFOs are still operated as familybusinesses and require the full-time presence of owners and managers. The cost of hiringrepresentation for lengthy administrative processes is prohibitive for many operators. This issuewas debated at length during the 1993 Texas Legislative session.186 CAFO representativesargued that permitting procedures promoted by the state's attorney general for NPDES delegation
186 Stephenville Empire-Tribune, March 26, 1993, at A1.

37
to Texas allow too much public participation. Opponents argued that broad public participation isnecessary to insure full consideration of all issues bearing on issuance of a permit.
A similar issue exists with respect to dispute resolution for CAFO permit violations.Traditional litigation is costly in virtually all cases. Mediation and other alternative disputeresolution mechanisms may be more appropriate than litigation where violations of CAFOpermits are at issue.

38
Issues Affecting CAFO Location and Production Structure
Both public and private initiatives can produce far-reaching effects on the location andstructure of CAFO operations. For example, the United States milk marketing system has beenunder the strict control of USDA since the 1930s.187 Given the clear trend toward increased herdsize in the nation's dairy industry, questions arise concerning the effects federal milk pricesupports have had on the size of dairy operations. While researchers have observed economies ofscale in the dairy industry, the effects of those economies may well have been exaggerated duringthe past decade by a dairy price support system that rewards excessive production.188
Similarly, the effects of milk marketing orders on the recent movement of dairies to theWestern and Southwest United States remain largely unknown. While several factors have beencited for these interregional shifts in dairy production,189 price advantages afforded by milkmarketing orders may be foremost among them. Consequently, the NPP will conduct an in-depthreview of the effects of milk price supports and marketing orders on the size and location of dairyoperations nationwide.
In the private sector, contract livestock production, particularly in the hog and broilerindustries, may have a significant influence on the size and location of individual operations.Contract production occurs when a livestock processor furnishes stock and feed to CAFOoperators who agree to sell mature animals to the processor at a predetermined contract price.Production bonuses may be paid for efficient animal-weight gain and low animal mortality.North Carolina has recently experienced phenomenal growth in contract hog production.190
Because contract production is predicated on concentrating large numbers of producersnear a central processing facility, contract production may well exacerbate environmentalcontamination by CAFOs. While clusters of producers near a central processing facility is notunique to contract production arrangements, formalization of the process deserves some attentionto discern its environmental effects. Differences in profit margins between contract and non-contract production may signal the relative abilities of producers to assume the costs ofenvironmental compliance.
187 GAO, supra note 54, at 8.
188 See Id. at 29.
189 See Leatham et al., supra note 76, at 2856; S. Masud & R. Lacewell, supra note 10, at 2-3.
190 Marberry, supra note 64, at 1.

39
SUMMARY
Economies of scale in most livestock production sectors have dramatically increased thenumber of CAFOs in the United States. The trend toward increased consolidation andconcentration in the livestock production industry will likely continue. CAFOs increase thepotential for surface and ground water pollution and odor due to the great number of animalsconfined in a relatively small area.
Erath County, Texas has experienced a significant influx of large dairy operations sincethe mid-1980s; increased water and odor pollution in the county correlate with the arrival ofthose dairies. The NPP was initiated to develop policy alternatives and research methodologiesto remedy environmental degradation from CAFO pollution, while maintaining the productivityof all CAFO industries. Research results will be immediately applied in Erath County andtransferred to other areas around the country affected by CAFO pollution.

40
Figure 1 - Dairy Locations

41

42
Figure 2 - Number of Dairy Farms and Average Cows per Farm in Erath County

43

44
Figure 3 - Sample Locations