livelihoods and food security in ural … · livelihoods and food security in myanmar i ......
TRANSCRIPT
LIVELIHOODS AND FOOD SECURITY IN RURAL MYANMAR: SURVEY FINDINGS
A joint Australia-Myanmar project funded through the Australian Research Council
iLivelihoodsandFoodSecurityinMyanmar
CONTENTSAcknowledgements.............................................................................................................................................iv
Scope of the study.................................................................................................................................................5
Objective.................................................................................................................................................................5
Sampling method...............................................................................................................................................6
Data collection method................................................................................................................................7
Comparison to other studies.......................................................................................................................8
Demographics...........................................................................................................................................................9
Housing and material possessions.............................................................................................................12
Household assets.............................................................................................................................................12
Water, sanitation and cooking...............................................................................................................16
Productive assets.............................................................................................................................................20
Livelihoods.................................................................................................................................................................22
Agriculture............................................................................................................................................................22
Livelihood diversity..........................................................................................................................................29
Migration...............................................................................................................................................................33
Household food production..........................................................................................................................36
Own-consumption of home garden and tree/Vine crop production........................36
Own-consumption of animal foods....................................................................................................38
Own consumption of wild foods...........................................................................................................39
Own-consumption of all household own-produced foods.................................................40
Women’s autonomy...........................................................................................................................................42
Household food security and nutrition status....................................................................................44
Method and comparison with other surveys................................................................................44
Household food security: Approach..................................................................................................44
Household food security: Results...........................................................................................................46
Dietary diversity: Approach......................................................................................................................51
Dietary Diversity: Results..............................................................................................................................53
Anthropometry: Approach.......................................................................................................................55
Anthropometry: Results................................................................................................................................57
Conclusion................................................................................................................................................................59
References................................................................................................................................................................60
iiLivelihoodsandFoodSecurityinMyanmar
FIGURESFigure 1. Population pyramids for the sampled population.........................................................10 Figure 2. Highest educational attainment of all persons over 15 in surveyed households.....................................................................................................................................................................11 Figure 3. Ethnic composition of Ayeyarwady sampled villages.................................................11 Figure 4. Household assets – Pakokku (Magway)................................................................................13 Figure 5. Household assets – Yesagyo (Magway)...............................................................................13 Figure 6. Household assets – Kanpetlet (Chin).......................................................................................13 Figure 7. Household assets – Mindat (Chin).............................................................................................14 Figure 8. Household assets - Kyaiklet (Ayeyarwady)..........................................................................14 Figure 9. Household assets - Maubin (Ayeyarwady)..........................................................................14 Figure 10. Distribution of mains electricity across villages in each township.....................16 Figure 11. Sources of drinking water by township................................................................................17 Figure 12. Sanitation systems by village......................................................................................................19 Figure 13. Proportion of households with productive assets - Kyaiklet...................................21 Figure 14. Proportion of households with productive assets - Maubin...................................21 Figure 15. Distribution of average landholding size in Magway and Ayeyarwady townships........................................................................................................................................................................24 Figure 16. Proportion of households that are landholders - Pakokku.....................................24 Figure 17. Proportion of households that are landholders - Yesagyo.....................................24 Figure 18.Proportion of households that are landholders - Kanpetlet...................................25 Figure 19. Proportion of households that are landholders - Mindat........................................25 Figure 20. Proportion of households that are landholders - Kyaiklet.......................................25 Figure 21. Proportion of households that are landholders - Maubin.......................................25 Figure 22. Major crops grown by landholding respondents - Pakokku.................................26 Figure 23.Major crops grown by landholding respondents - Yesagyo..................................26 Figure 24. Major crops grown by landholding respondents - Kanpetlet..............................27 Figure 25. Major crops grown by landholding respondents - Mindat....................................27 Figure 26. Major crops grown by landholding respondents - Kyaiklet...................................28 Figure 27. Major crops grown by landholding respondents - Maubin...................................28 Figure 28. Proportion of land irrigation by township...........................................................................29 Figure 29. Household livelihoods in the Magway townships.........................................................31 Figure 30. Household livelihoods in the Chin townships...................................................................32 Figure 31. Household livelihoods in the Ayeyarwady townships................................................32 Figure 32. Destination of migrants by township.....................................................................................34 Figure 33. Seasonal migration pattern........................................................................................................35 Figure 34. Proportion of households with at least one migrant, by village.........................35 Figure 35. Home gardens by township.......................................................................................................37 Figure 36. Households with livestock for consumption - Chin......................................................38 Figure 37. Households with livestock for consumption - Magway............................................39 Figure 38. Households with livestock for consumption - Ayeyarwady...................................39 Figure 39. Household own-production/sourcing of foods, by townships.............................41
iiiLivelihoodsandFoodSecurityinMyanmar
Figure 40. Average female autonomy score over all six decision-making domains...43 Figure 41. Average female decision-making by individual domain.......................................43 Figure 42. HFIAS by township.............................................................................................................................47 Figure 43. Dietary diversity (number of food groups consumed) per township..............54 Figure 44. Food groups eaten in past 24 hours by respondent households.......................56 Figure 45. Body Mass Index of women of reproductive age.......................................................57 Figure 46. Stunting incidence among infants and children under 5.......................................58 Figure 47. Underweight incidence among infants and children under 5...........................58 Figure 48. Wasting incidence among infants and children under 5.......................................58
TABLESTable 1. Sex of household members in survey..........................................................................................9 Table 2. Average household size....................................................................................................................10 Table 3. Housing quality across the townships (percentage of respondents).................15 Table 4. Incidence of landholding across the townships (our survey)...................................22 Table 5. Incidence of landholding, LIFT 2013 survey..........................................................................22 Table 6. Average landholding size, per township................................................................................23 Table 7. Livelihood classification schema.................................................................................................30 Table 8. Migration rates by township...........................................................................................................34 Table 9. Characteristics of home gardens...............................................................................................37 Table 10. Characteristic of trees/ vines......................................................................................................37 Table 11. Consumption of wild foods (fruits, vegetables and honey) by township......40 Table 12. Consumption of wild foods (animals) by township......................................................40 Table 13. Measuring household food and nutrition security: Comparison of methods in major Myanmar surveys...................................................................................................................................44 Table 14. The HFIAS food security approach..........................................................................................45 Table 15. Household food insecurity detailed data...........................................................................48 Table 16. Relationship between landholding status and anxiety over food, Magway and Ayeyarwady sites...........................................................................................................................................49 Table 17. Food insecurity measured by LIFT (2013).............................................................................51 Table 18. Dietary diversity methodology: our survey and the LIFT survey............................53 Table 19. Average dietary diversity scores: comparison with LIFT 2013 survey................53 Table 20. Percentage of households consuming less than 5 food groups in past 24 hours...................................................................................................................................................................................53 Table 21. 2015-16 DHS anthropometric data for selected State/Divisions..........................59
ivLivelihoodsandFoodSecurityinMyanmar
ACKNOWLEDGEMENTS This report is an output from the Australian Research Council project ‘Explaining Food and Nutrition Insecurity under Conditions of Rapid Economic and Social Change: A Nutrition-Sensitive Analysis of Livelihood Decision-making in rural Myanmar’ (project ID: DP160102063). In addition to the named researchers on the front cover, we wish to thank the team of enumerators, mainly from the University of Community Health, Magway, and the University of Public Health, Yangon. The enumerators conducted themselves diligently and professionally in the often arduous tasks of data collection in remote rural settings. Credit goes not only to the enumerators, but also to the institutions that trained them. This research project has the approval of the Ethics Review Committee of the Department of Medical Research, Government of Myanmar; and the University of Sydney Human Research Ethics Committee. Data presented in this report was presented in preliminary form at the Workshop Food Security, Nutrition and Livelihoods in Transition in Rural Myanmar, held at the University of Public Health, Yangon, on 21 October 2016. The preparation of this report was assisted through the University of Sydney Faculty of Science Summer Scholarships program. We wish to thank the project’s two summer scholarship holders, Omar Elkharouf and Maxine Williams, for their excellent work in analyzing the data and creating the graphs and tables published here. For additional information about the project and this report, contact Professor Bill Pritchard at the University of Sydney, [email protected] Australia-based researchers: Prof Bill Pritchard, University of Sydney Prof Michael Dibley, University of Sydney Prof Anu Rammohan, University of Western Australia Dr Mark Vicol, University of Sydney Dr Myat Pan Hmone, University of Sydney Dr Min Kyaw Htet, University of Sydney Jessica Hall, University of Sydney
Myanmar researchers: Prof Nay Soe Maung, University of Public Health Prof Htin Zaw Soe, University of Community Health, Magway Dr Aye Mya Aung, University of Public Health Dr Kay Khine Linn, University of Public Health Dr Theingi Thwin, Department of Medical Research, Government of Myanmar
To cite this publication: Pritchard, B., Dibley, M., Rammohan, A., Htin, Z.S., Nay, S.M., Thwin, T., Pan Hmone, M., Htet, K., Vicol, M., Aung, A.M., Linn, K.K., Hall, J. (2017) Livelihoods and Food Security in Rural Myanmar: Survey Findings, University of Sydney. ISBN 978-1-74210-403-4 CiP Cover photo, © Bill Pritchard.
5LivelihoodsandFoodSecurityinMyanmar
SCOPE OF THE STUDY
OBJECTIVE The background to this report lies in recent concerns over the pace of international progress in addressing food and nutrition insecurity. During the past decade, improvements in key nutritional indicators among rural populations have lagged other measures of social and economic progress in many developing countries (FAO, WFP & IFAD, 2012). Research from India – where this has certainly been the case (Pritchard et al., 2013) – has proposed that the root of this problem is an agriculture-nutrition disconnect (Gillespie et al, 2012). The argument is that as rural populations turn increasingly to non-agricultural sources of livelihood, including migration of various kinds and durations, their food and nutrition circumstances do not necessarily improve commensurately. As Myanmar undergoes economic and political reform, insights into these questions have key relevance if policies for agriculture, land and natural resource planning are to be aligned with those for health, food and nutrition. In October 2014, the Australian Research Council awarded funding to researchers from the University of Sydney and the University of Western Australia to investigate the existence and dimensions of the agriculture-nutrition disconnect in rural Myanmar. To pursue this objective, in 2015 the researchers established Memoranda of Understandings with the University of Public Health (UPH), Yangon, and the University of Community Health (UCH), Magway. Collectively, these institutions applied for and obtained ethical research clearance from the Department of Medical Research, Government of Myanmar. The specific goals of the approved research were to:
1. Address critical questions about food and nutrition insecurity in Myanmar by generating dietary and anthropometric data from our survey sample;
2. Assess these data against household indicators to propose an explanation of the socio-economic patterns of food and nutrition insecurity in rural Myanmar;
3. Use qualitative interviews to document households’ livelihood decisions and connect these findings to our survey data to generate a conceptual model of livelihood-nutrition pathways;
4. Interpret these findings with a view to informing global theory about the agriculture-nutrition disconnect and nutrition-sensitive development, and
5. Disseminate findings in key national policy-making forums, at this vital moment in Myanmar’s history.
The research plan for the project designates three stages of data collection: 1. A baseline survey with the purpose of collecting data on households’ demographics,
assets, livelihoods and food and nutrition circumstances; 2. A series of qualitative interviews with householders and village-level focus groups for
the purpose of generating detailed information on livelihood change and its implications for food systems in rural Myanmar, and
3. A return panel survey of households from Stage 1, at a different seasonal point, to assess change over time in the context of seasonal variations in food production and livelihood opportunities.
This report presents information collected during Stage 1 of the research, which was undertaken from February-April 2016. The analysis here provides descriptive assessment of
6LivelihoodsandFoodSecurityinMyanmar
survey findings. More sophisticated statistical assessment of relationships between key variables is provided in peer-reviewed scholarly outputs that complement the data presented herein.
SAMPLING METHOD Project capacity and funding provided for household surveys within a sampling frame of three States/Divisions. The selection of these three States/Divisions and Townships was undertaken in the context of advice from NGOs and multilateral research agencies in Myanmar. The goal of State/Division selection was to generate sites that would provide the project with diverse contextual settings from which to assess livelihood-nutrition interactivity in rural Myanmar. Hence, the three States/Districts were selected to represent three major agro-climate zones:
Magway is in the Dry Zone, with agriculture dominated by pulses and maize. Ayeyarwady is in the fertile Delta region, the traditional rice bowl of the country,
and with important fishery resources. Chin State is in the hilly zone, and has traditionally been regarded as the most
food insecure area of Myanmar.
In each State/Division, two Townships were selected. A framing decision was made to select adjacent Townships, in order to mitigate the effects of local agro-climatic difference. This led to the following selections:
In Magway, Yesagyo and Pakokku Townships are both sited on the western bank of the Ayeyarwady River. In each township, some villages have access to river-sourced irrigation, and some are dependent on dry land agriculture.
In Ayeyarwady, Kyaiklet and Maubin are both relatively close to Yangon, and hence may be expected to facilitate peri-urban and urban commuting livelihood opportunities, in addition to traditional agricultural pursuits.
In Chin, Mindat and Kanpetlet Townships are in the extreme south of the State, adjacent to Rakhine State. These Townships were selected largely due to travel and logistical reasons, given the highly isolated and difficult terrain of some of the other parts of Chin.
To generate a representative sample of the rural populations in each of these Townships, a sampling methodology broadly corresponding to the 2015-16 Demographic and Health Survey (DHS) for Myanmar was adopted (Ministry of Health and Sports and ICF International, 2016). Firstly, 20 villages were selected in each Township using a Probability Proportional to Size (PPS) method. The DHS also used PPS methodology, but at the national level to select a stratified sampling frame of 442 ‘clusters’ (enumeration areas or ward/village tracts) from a master frame of 4,000. Both our study and the DHS applied the PPS method using population counts for all villages in each Township were obtained from the 2014 Myanmar Census. The PPS method results in larger sized villages having a bigger probability of being sampled, and hence complies with representativeness at the Township scale. Then, within each village identified to be surveyed via the PPS method, 30 households were selected. Again, this method broadly parallels the DHS, which also selected 30 households per ‘cluster’. The DHS study used information from the 2014 Census to select individual households in the basis of equal probability systematic sampling. In our study, households in
7LivelihoodsandFoodSecurityinMyanmar
each target village were identified using village household lists held by the relevant local District Medical Office, or in cases when this was not available, from midwives or other primary health care workers in villages. Typically, these were not available in electronic versions and so the survey team inputted the data into excel spread sheets for all villages. Some lists contained information about which households had infants or children under 5, and some did not. In cases where they did not, a preliminary survey was undertaken of each village by an ‘Advance Team’ that collected this information. Households in each village were then sorted into two lists. One of these lists was for households containing infants and children under 5, and the other list for households without. A randomization process was then used to select 15 households in the ‘with children’ list, and 15 households in the ‘without children’ list. The purpose of this stratification was to ensure that in each village, at least half (15 out of 30) houses were selected that had infants or children under 5. By meeting this minimum requirement, the sample was assured to contain enough entries to make valid assumptions about the anthropometric status of infants and children under 5 in each village. To compensate for the potential over-sampling of households with children under 5 generated by this method, village-level estimates were then normalized using a re-proportioning countervailing bias. This method provided a target sample of 600 households per township, or 3,600 for the entire survey. The achieved sample was 3,230 households, or approximately 90% of the target, on account of the fact that some of the villages selected by the sampling procedure had fewer than 30 households, notably in Chin. The number of households per township in the sample was: Pakokku (592); Yesagyo (537); Kyaiklet (595); Maubin (573); Mindat (493); Kanpetlet (440).
DATA COLLECTION METHOD The survey questionnaire was loaded onto tablet computers using Commcare mobile platform software. This platform ensures internal consistency within questionnaire responses, eliminating the capacity for many forms of respondent/enumerator error. Additionally, use of Commcare allowed completed surveys to be uploaded to a password-protected server at the end of each working day (or at least, when a 3G data signal was available), removing the potential risk of data loss. Enumerators were recruited mainly from the ranks of recently graduated students from the two Myanmar partner universities. There were two enumerator groups. Enumerators recruited through UCH Magway conducted surveys in the surveyed townships of Magway and Chin. Enumerators recruited through UPH conducted surveys in Ayeyarwady. All enumerators participated in a 2-3 day training session, which had the purpose of ensuring consistency in the ways that respondents’ answers to questions were recorded. Fieldwork teams were accommodated in ‘base camps’, typically in the major population centre of each Township under investigation, and travelled out to villages daily for surveying. (In some villages in remote parts of Chin, however, enumerator teams were required to stay overnight in villages, because of long distances and poor roads.) Lead researchers from the Australian and Myanmar partner universities were always present at the base camps during field work, and frequently accompanied enumerator teams to villages to ensure monitoring and compliance.
8LivelihoodsandFoodSecurityinMyanmar
Prior to the commencement of the survey, respondent consent was required. The Commcare platform was set up so that the survey could not proceed without consent being confirmed by the enumerator. This potentially required two forms of consent:
An informed consent form completed by the household respondent (see below), not the head of household.
An informed consent form for households with women of child-bearing age and children/infants under 5 years of age, which gives permission for anthropometry to take place. For infants/children, it was necessary for a responsible adult to complete this.
Consent was obtained through signature or thumb print. In both cases, the enumerator signed as a witness. All households were recorded by way of respondent name, village and Township, and given a serial number to ensure confidentiality within results.
The respondent to the survey was chosen in the following way: The woman of the household deemed to be most knowledgeable about the work
activities of household members, and household food consumption patterns.
There was one respondent per household. The definition of a household was:
A household is a group of people who usually eat together, including any children or infants under their care. It needs noting that this is a social definition. It may be dissimilar from the house as a physical structure, for example.
COMPARISON TO OTHER STUDIES This study adds to a relatively small but growing collection of livelihood/ food security surveys in Myanmar. Some notable recent contributions include: 2011 and 2013 ‘LIFT’ (Livelihoods and Food Security Trust) surveys of 3,200 households in
200 villages (16 households per village). Villages were selected with the primary objective of enabling LIFT to evaluate its interventions. Hence, 150 villages had a history of LIFT program involvement, and 50 were ‘controls’ with no LIFT involvement (LIFT, 2013: 9);
2009-10 UNDP Integrated Household Living Conditions Assessment [IHLCA] of 18,000 households;
2010-11 ‘Umbrella’ survey in Myanmar’s dry zone of 1,194 households (Griffiths and Soe, 2012), and
2013 Save the Children [StC] survey in Myanmar’s dry zone (1,800 households) (StC et al., 2013).
2015-16 Demographic and Health Survey (DHS), of 13,230 households across 442 ‘clusters’ (enumeration areas or ward/village tracts) nation-wide (Ministry of Health and Sports and ICF International, 2016).
Additionally, in 2014 Myanmar held its first Census of Population and Housing since 1983. Summarising the above, the LIFT and IHLCA surveys seek to be nationally representative, while the Umbrella survey and StC are geographically limited. In the case of LIFT and IHLCA, national representativeness comes at the cost of larger sample sizes within the Township level. In the case of the ‘Umbrella’ and StC surveys, sampling is restricted to one agro-climatic zone. The other survey listed above, the DHS, has national remit, but its interest is restricted to maternal and child health. Hence, although it provides some overlap with the current survey, through the provision of data on nutrition-relevant indicators (child

9LivelihoodsandFoodSecurityinMyanmar
anthropometry, as well as iron deficiency among children and women of child-bearing age), it is not a livelihood survey and hence not directly comparable in all respects to the current study. Hence, the key point of distinction between this study and the others listed directly above is that our survey provides greater sampling depth at the Township level (up to 600 households per Township) and also provides data across different agro-climatic zones. Further to these points, the current survey has more breadth than some of those cited above, because it includes both questionnaire-based data from the respondent and anthropometry from children under 5 and women of child-bearing age.
DEMOGRAPHICS Some 15,871 people resided in the 3,230 households surveyed across the selected 120 villages of this study. Of this number, 15,454 were living at home when the survey was conducted, and 417 “regular household members” were living somewhere else on the day of the survey. Females constituted 52.9% of household members in the sample, with men 47.1%. The sex ratio in favour of females was most pronounced in Magway, and least in Ayeyarwady (Table 1). As discussed in a later section, male migration is a key factor in shaping these data. Average household size was larger in Chin than in Ayeyarwady and Magway (Table 2). These results are broadly consistent with those from the 2014 Myanmar Census, which found average household size of 5.1 persons in Chin, compared to 4.1 persons per household in Magway and Ayeyarwady (Department of Population, Government of Myanmar, 2014). This would appear to be on account of the greater number of children within the Chin population, as indicated in the more ‘bottom-heavy’ population pyramids for Mindat and Kanpetlet (Chin) Townships (Figure 1).
Table 1. Sex of household members in survey
10LivelihoodsandFoodSecurityinMyanmar
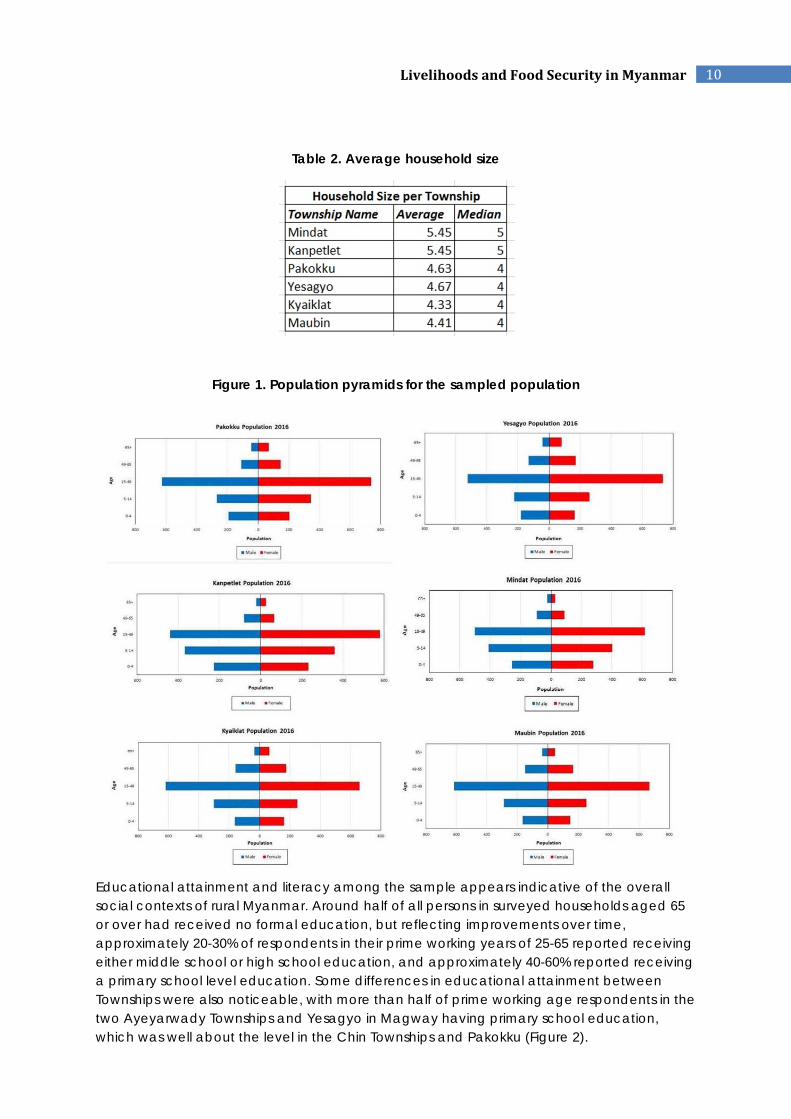
Table 2. Average household size
Figure 1. Population pyramids for the sampled population
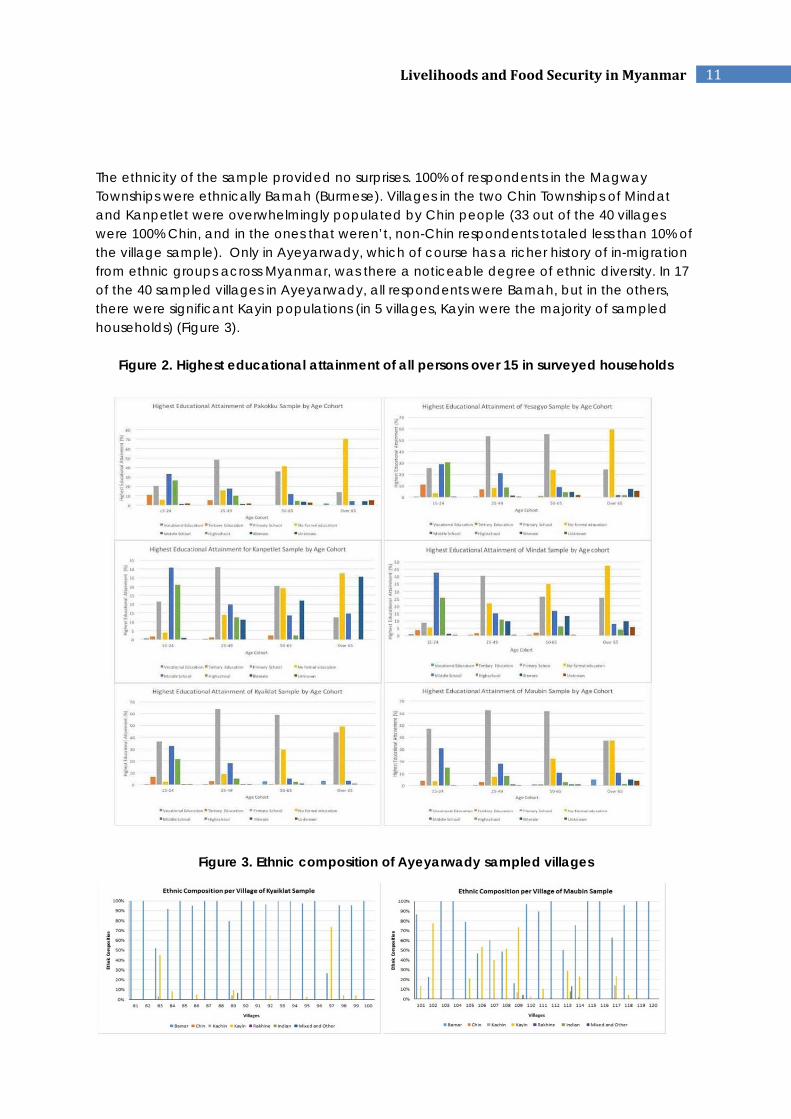
Educational attainment and literacy among the sample appears indicative of the overall social contexts of rural Myanmar. Around half of all persons in surveyed households aged 65 or over had received no formal education, but reflecting improvements over time, approximately 20-30% of respondents in their prime working years of 25-65 reported receiving either middle school or high school education, and approximately 40-60% reported receiving a primary school level education. Some differences in educational attainment between Townships were also noticeable, with more than half of prime working age respondents in the two Ayeyarwady Townships and Yesagyo in Magway having primary school education, which was well about the level in the Chin Townships and Pakokku (Figure 2).
11LivelihoodsandFoodSecurityinMyanmar
The ethnicity of the sample provided no surprises. 100% of respondents in the Magway Townships were ethnically Bamah (Burmese). Villages in the two Chin Townships of Mindat and Kanpetlet were overwhelmingly populated by Chin people (33 out of the 40 villages were 100% Chin, and in the ones that weren’t, non-Chin respondents totaled less than 10% of the village sample). Only in Ayeyarwady, which of course has a richer history of in-migration from ethnic groups across Myanmar, was there a noticeable degree of ethnic diversity. In 17 of the 40 sampled villages in Ayeyarwady, all respondents were Bamah, but in the others, there were significant Kayin populations (in 5 villages, Kayin were the majority of sampled households) (Figure 3).
Figure 2. Highest educational attainment of all persons over 15 in surveyed households
Figure 3. Ethnic composition of Ayeyarwady sampled villages
12LivelihoodsandFoodSecurityinMyanmar
HOUSING AND MATERIAL POSSESSIONS
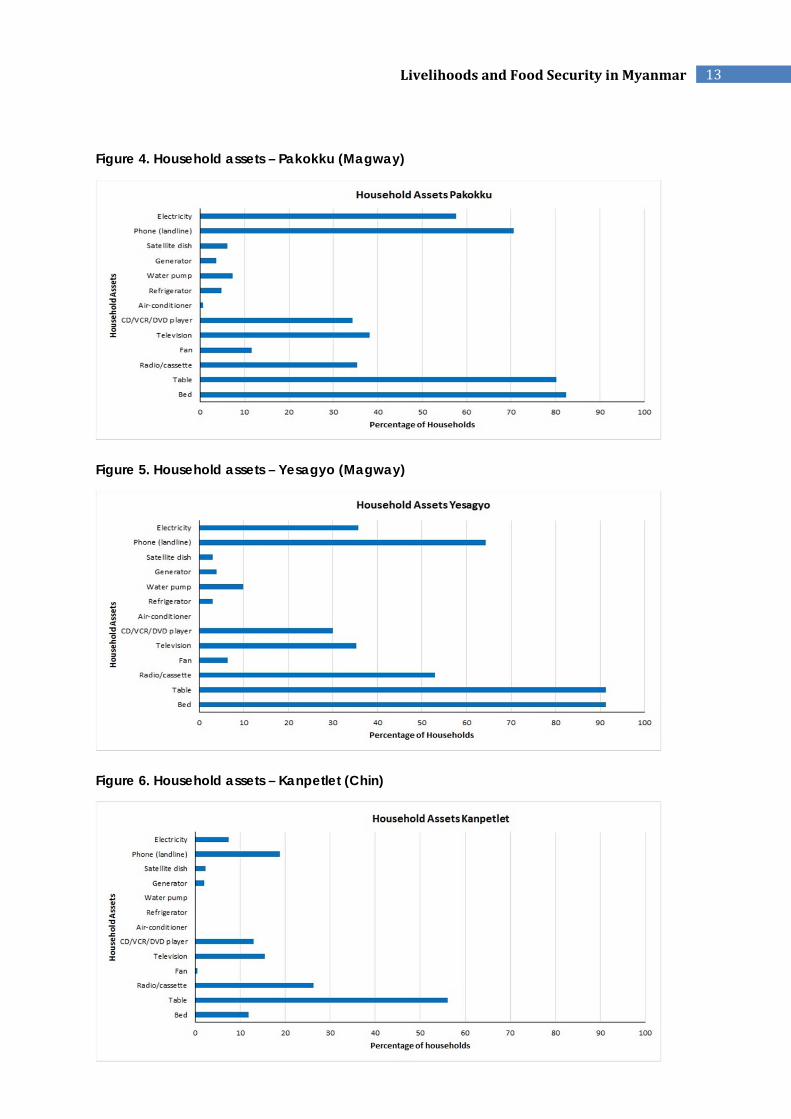
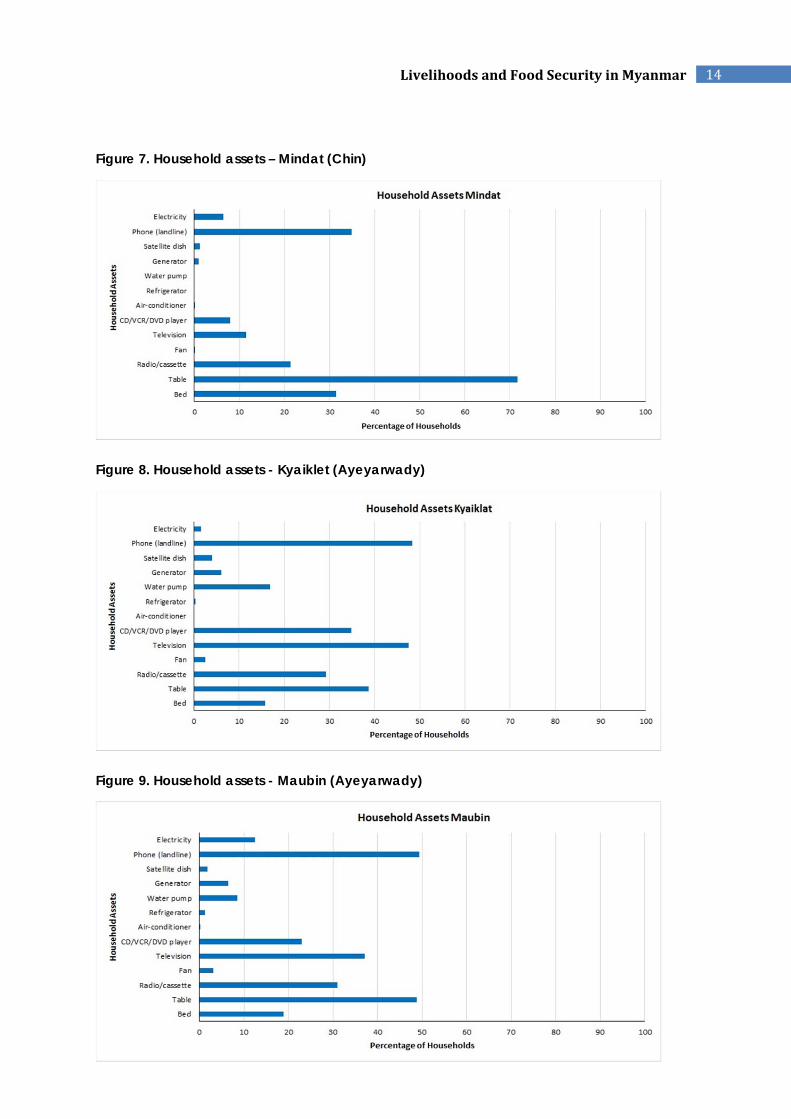
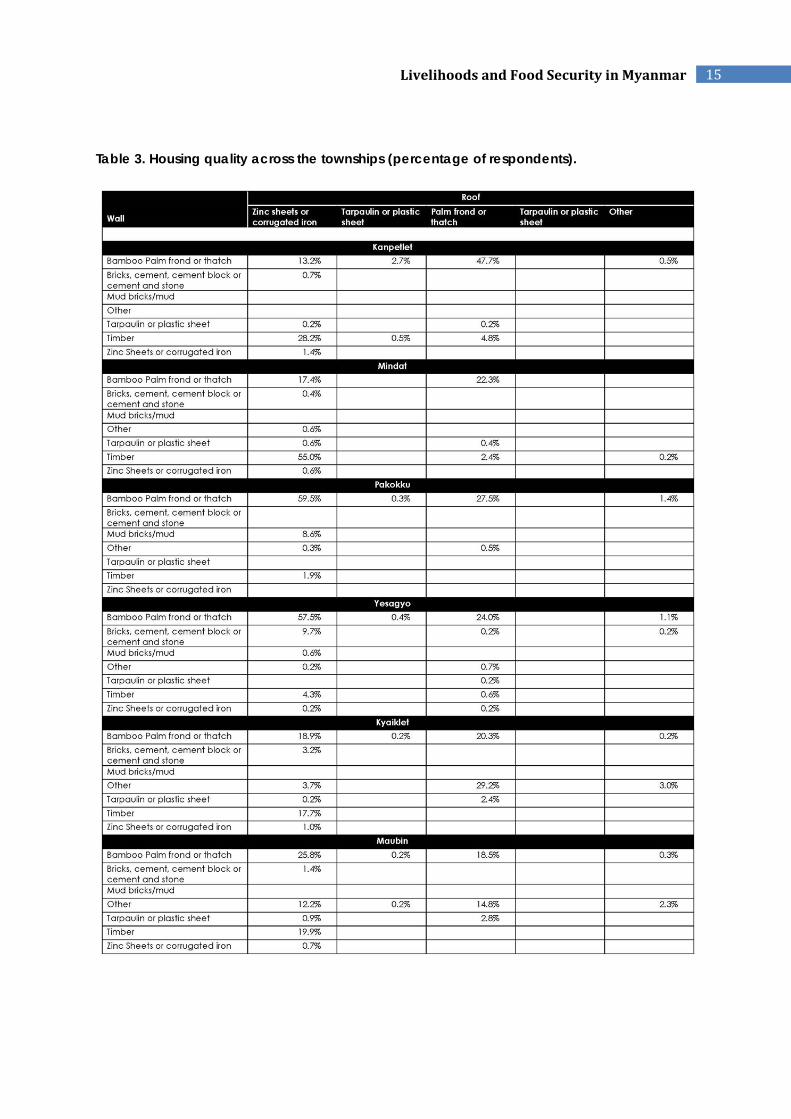
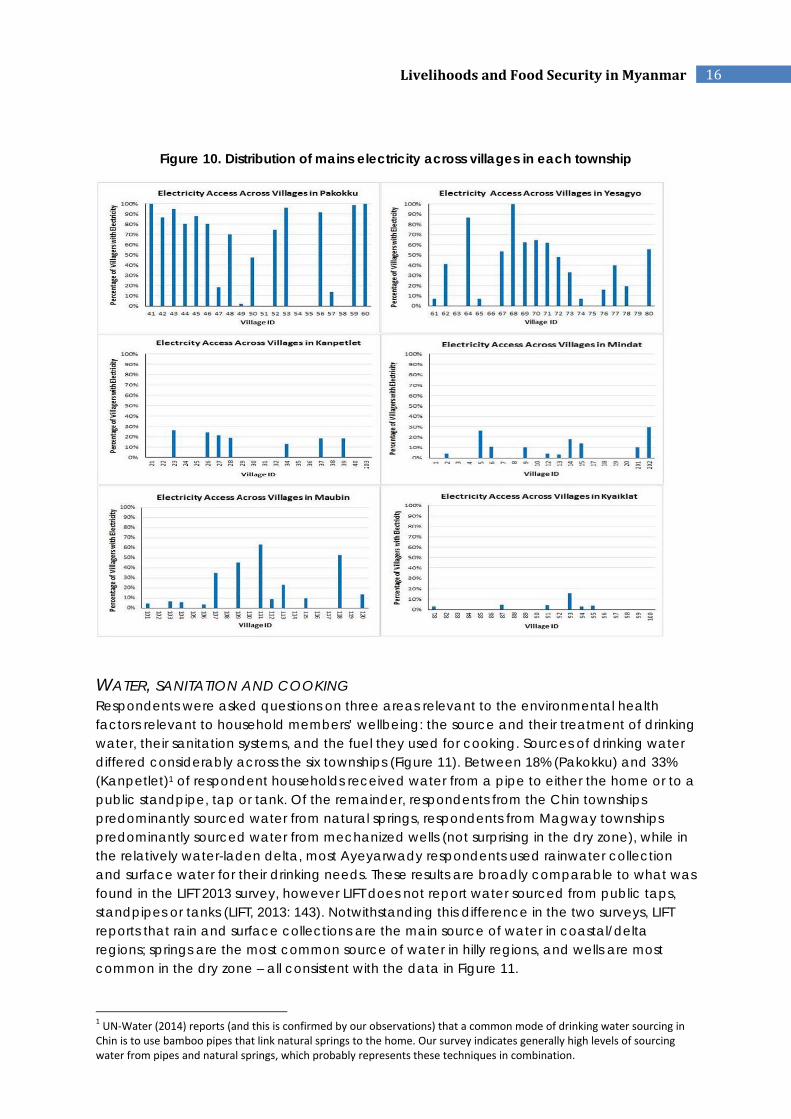
HOUSEHOLD ASSETS The living conditions of many respondent households were characterized by relatively low levels of household assets (Figure 4, Figure 5, Figure 6, Figure 7, Figure 8, Figure 9). Only in the Magway Townships did a sizeable proportion of the sample have basic furniture (beds and tables). Between 30-40% of households in the Magway and Ayeyarwady Townships owned televisions, but in Chin, only slightly more than 10% did. The very low incidence of cooling equipment (fans and air conditioners) in Magway and Ayeyarwady (where summer temperatures regularly reach the mid-40s) presumably speaks to very limited capacity for households to make household investments that improve their day-to-day lives. An absence of mains electricity would not seem to be a constraint to such household purchases. In Ayeyarwady and Chin, more households had television than electricity connections, which points to extensive use of alternative energy arrangements (such as solar panels or batteries). Furthermore with regards to electricity, Figure 10 highlights the vast differences in connectivity between villages both across and within townships. In Pakokku for example, in 10 out of the 20 villages surveyed, more than 80% of respondents indicated they had mains electricity connected. But in three villages, there was no electricity at all. In Chin, the vast majority of respondents had no mains electricity. Not a single respondent reported having mains electricity in 23 of the 40 villages in the two Chin townships, and in the other 17 villages, in only five cases were more than 20% of respondents connected. Whereas low rates of mains electricity connection in Chin can be contextualized by remoteness and rugged terrain, the historical absence of electricity in Ayeyarwady is worth noting, with our results being consistent with findings from the LIFT 2013 survey that found that only 1.5% of villages in the delta/coastal zone had government-operated electricity, and hence were highly reliant on private sector or village-operated schemes (LIFT, 2013: 27). Notwithstanding limitations in households’ access to mains power, mobile phone ownership was high in both Magway and Ayeyarwady. 80% of respondents in Magway and 68% in Ayeyarwady lived in a household with access to a mobile phone. The fact that mobile phone access was higher than basic furniture ownership speaks to how this technology has been incorporated into people’s lives in the very short space of time since mobile telephony was introduced in Myanmar. (The mobile phone sector was liberalized only in 2014. Before that, mobile phones were inordinately expensive and therefore out of reach for poor households (LIFT, 2016: 10)). A contrasting situation exists in Chin. At the time of conducting the survey, only one of Myanmar’s mobile networks had coverage in the two Chin townships, and this was via the relatively expensive CDMA system. Only 41% of respondent households in the two Chin townships had access to mobile phones, and access was highly uneven between villages depending on network coverage. Dominant housing types across the study sites were timber walls and zinc/iron corrugated roofs in Chin; bamboo walls and zinc/iron corrugated roofs in Magway, and more varied housing types in Ayeyarwady (Table 3). Finally, approximately 30% of respondent households in the Magway and Chin townships owned motorbikes, and in Magway, a further 11% in Pakokku and 16% in Yesagyo owned bicycles. (Bicycles were completely non-existent in the hilly Chin townships.) The situation was different in topographically flat Ayeyarwady however, where more households owned bicycles than motorbikes. Car ownership was negligible across all townships.
13LivelihoodsandFoodSecurityinMyanmar
Figure 4. Household assets – Pakokku (Magway)
Figure 5. Household assets – Yesagyo (Magway)
Figure 6. Household assets – Kanpetlet (Chin)
14LivelihoodsandFoodSecurityinMyanmar
Figure 7. Household assets – Mindat (Chin)
Figure 8. Household assets - Kyaiklet (Ayeyarwady)
Figure 9. Household assets - Maubin (Ayeyarwady)
15LivelihoodsandFoodSecurityinMyanmar
Table 3. Housing quality across the townships (percentage of respondents).
16LivelihoodsandFoodSecurityinMyanmar
Figure 10. Distribution of mains electricity across villages in each township
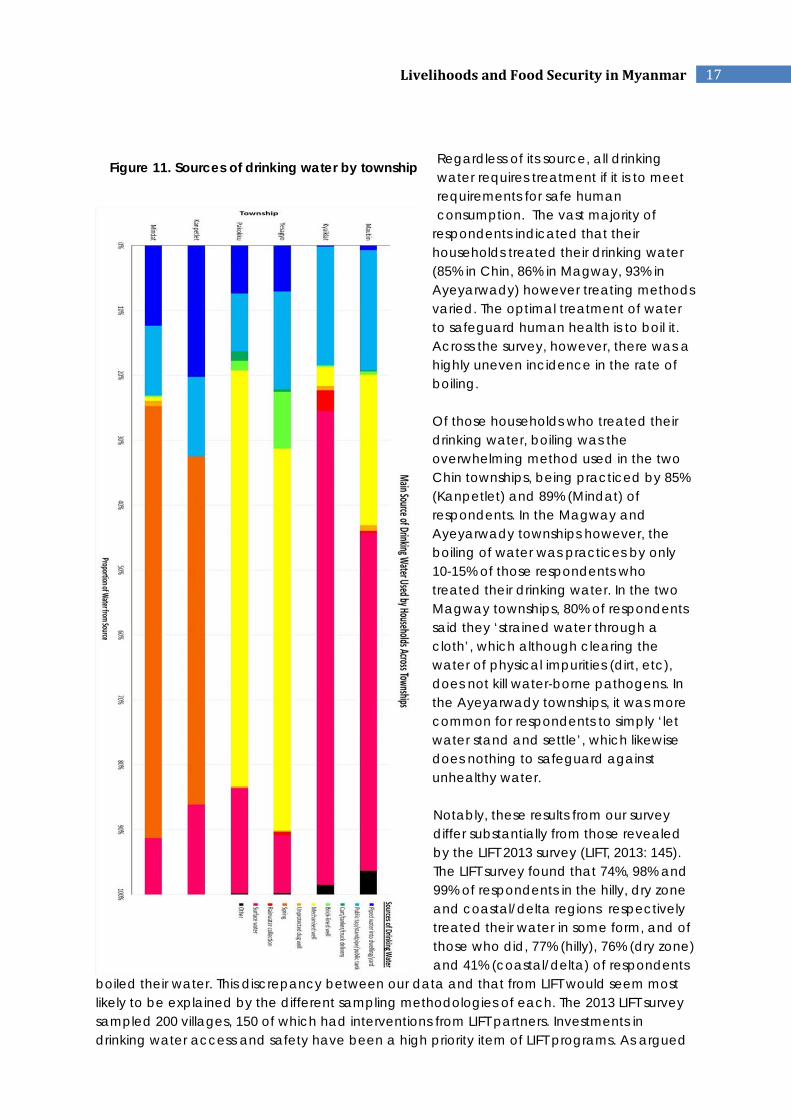
WATER, SANITATION AND COOKING Respondents were asked questions on three areas relevant to the environmental health factors relevant to household members’ wellbeing: the source and their treatment of drinking water, their sanitation systems, and the fuel they used for cooking. Sources of drinking water differed considerably across the six townships (Figure 11). Between 18% (Pakokku) and 33% (Kanpetlet)1 of respondent households received water from a pipe to either the home or to a public standpipe, tap or tank. Of the remainder, respondents from the Chin townships predominantly sourced water from natural springs, respondents from Magway townships predominantly sourced water from mechanized wells (not surprising in the dry zone), while in the relatively water-laden delta, most Ayeyarwady respondents used rainwater collection and surface water for their drinking needs. These results are broadly comparable to what was found in the LIFT 2013 survey, however LIFT does not report water sourced from public taps, standpipes or tanks (LIFT, 2013: 143). Notwithstanding this difference in the two surveys, LIFT reports that rain and surface collections are the main source of water in coastal/delta regions; springs are the most common source of water in hilly regions, and wells are most common in the dry zone – all consistent with the data in Figure 11.
1 UN‐Water (2014) reports (and this is confirmed by our observations) that a common mode of drinking water sourcing in Chin is to use bamboo pipes that link natural springs to the home. Our survey indicates generally high levels of sourcing water from pipes and natural springs, which probably represents these techniques in combination.
17LivelihoodsandFoodSecurityinMyanmar
Regardless of its source, all drinking water requires treatment if it is to meet requirements for safe human consumption. The vast majority of
respondents indicated that their households treated their drinking water (85% in Chin, 86% in Magway, 93% in Ayeyarwady) however treating methods varied. The optimal treatment of water to safeguard human health is to boil it. Across the survey, however, there was a highly uneven incidence in the rate of boiling. Of those households who treated their drinking water, boiling was the overwhelming method used in the two Chin townships, being practiced by 85% (Kanpetlet) and 89% (Mindat) of respondents. In the Magway and Ayeyarwady townships however, the boiling of water was practices by only 10-15% of those respondents who treated their drinking water. In the two Magway townships, 80% of respondents said they ‘strained water through a cloth’, which although clearing the water of physical impurities (dirt, etc), does not kill water-borne pathogens. In the Ayeyarwady townships, it was more common for respondents to simply ‘let water stand and settle’, which likewise does nothing to safeguard against unhealthy water. Notably, these results from our survey differ substantially from those revealed by the LIFT 2013 survey (LIFT, 2013: 145). The LIFT survey found that 74%, 98% and 99% of respondents in the hilly, dry zone and coastal/delta regions respectively treated their water in some form, and of those who did, 77% (hilly), 76% (dry zone) and 41% (coastal/delta) of respondents
boiled their water. This discrepancy between our data and that from LIFT would seem most likely to be explained by the different sampling methodologies of each. The 2013 LIFT survey sampled 200 villages, 150 of which had interventions from LIFT partners. Investments in drinking water access and safety have been a high priority item of LIFT programs. As argued
Figure 11. Sources of drinking water by township

18LivelihoodsandFoodSecurityinMyanmar
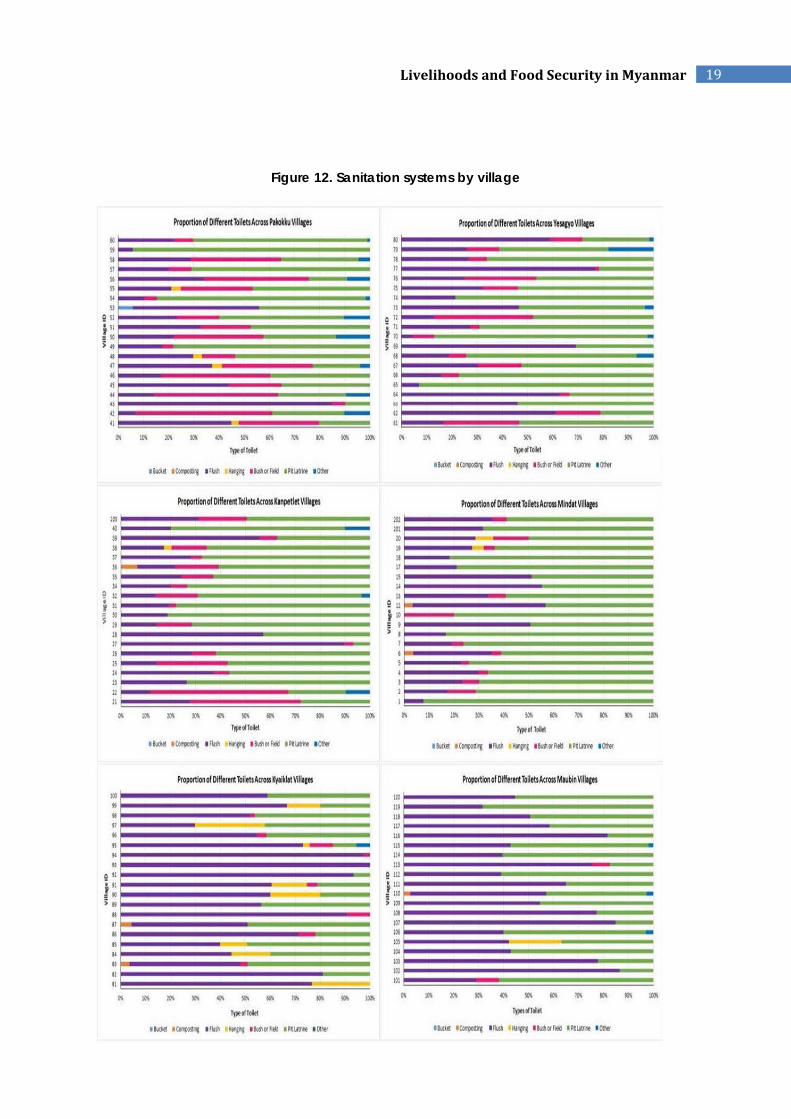
by LIFT (2013: 145), in village-level Focus Group Discussions conducted concomitantly with their survey, themes relating to water access and hygiene were emphasized by participants. The specific targeting in the sample of villages where there had been LIFT program involvement would seem to explain the fact that the LIFT survey reported a more sophisticated level of water treatment compared to our survey. Sanitation data from the survey also point to the potential for poor environmental health contexts impacting upon respondent populations. Flush toilets were present in only 30% and 32% of respondent households in Chin and Magway respectively, compared to 60% of Ayeyarwady respondent households. The proportions of different types of sanitation varied considerably from village to village within each township, moreover (Figure 12). In Pakokku for example, in village number 45 some 85% of respondent households had flush toilets, but in villages 42 and 59, only 7% did. In the Chin and Magway townships, pit latrines was more commonly the norm, with the use of ‘bush or field’ (i.e., open defection) also widespread (8% and 16% respectively in the Chin and Magway townships). By comparison, WHO/UNICEF estimate that across all rural Myanmar in 2015, 6.4% of households practiced open defecation and a further 5.7% had other forms of unimproved sanitation (WHO/UNICEF, 2015). Reconciling our survey with the WHO/UNICEF data is difficult because of definitional inconsistencies. 2However, if the results from our two townships in Magway are typical of the dry zone, and ditto our results from Chin typical of hilly regions across Myanmar, it is not unreasonable to suggest that official statistics may overstate the quality of sanitation across rural Myanmar. The final environmental health indicator collected by the survey relates to cooking fuel. Across all the surveyed townships, wood or charcoal was used overwhelmingly – 100% of respondent households in the two Chin townships, 84% in Magway and 97% in Ayeyarwady. The use of wood and charcoal for indoor cooking has significant implications for respiratory health, if smoke is not funneled properly outside the home (Hutton et al., 2007). The preponderance of wood and charcoal use for cooking is related evidently to electricity access – in villages in the Magway townships with high levels of electricity connection, wood and charcoal use is proportionately lower.
2 WHO/UNICEF (2017) defines pit latrines as potentially being ‘improved sanitation’ or ‘unimproved sanitation’ depending on whether they have a cement platform. Our survey collected data on pit latrines but didn’t make this distinction, hence it is impossible prima facie to determine how many of our respondent households with pit latrines would be classified as having ‘improved’ or ‘unimproved’ sanitation according to the WHO/UNICEF classification.
19LivelihoodsandFoodSecurityinMyanmar
Figure 12. Sanitation systems by village
20LivelihoodsandFoodSecurityinMyanmar
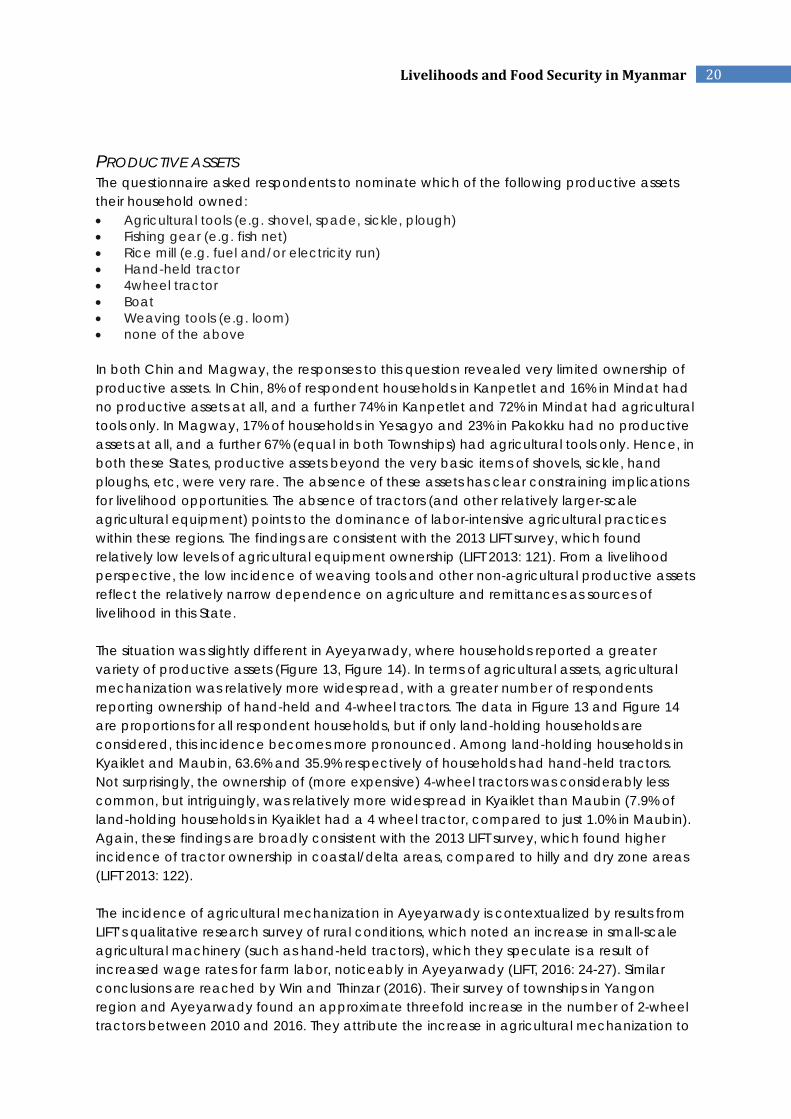
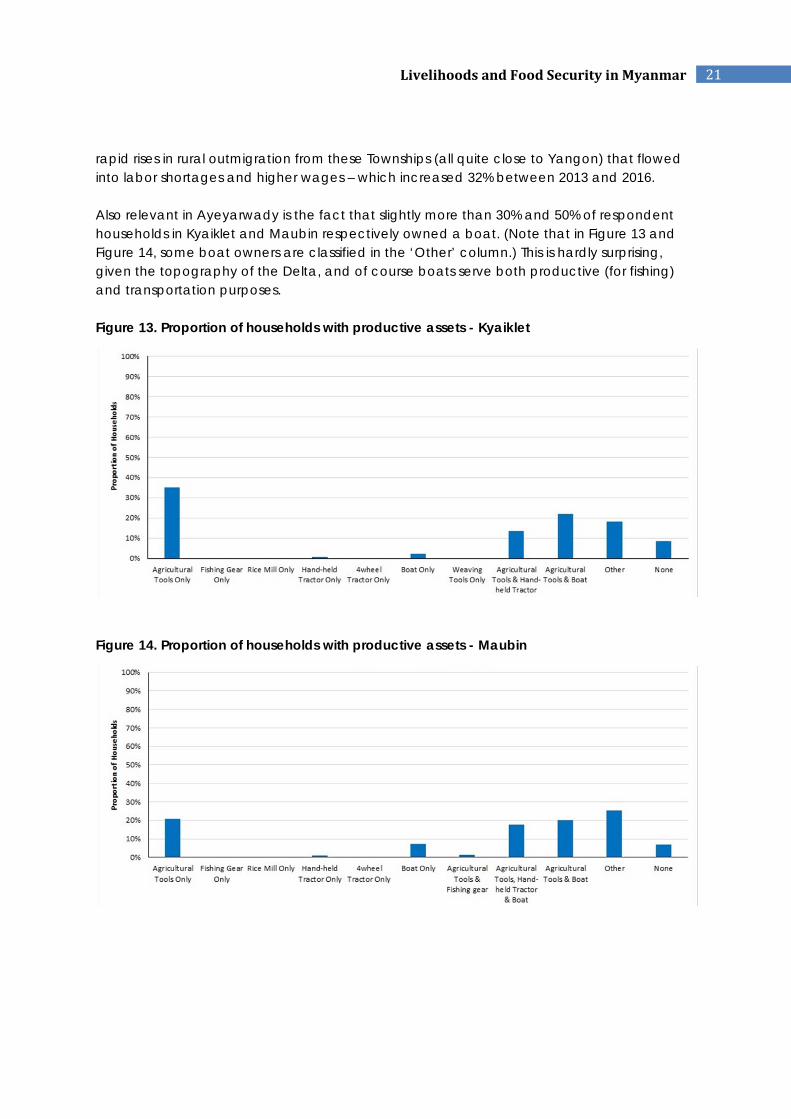
PRODUCTIVE ASSETS The questionnaire asked respondents to nominate which of the following productive assets their household owned: Agricultural tools (e.g. shovel, spade, sickle, plough) Fishing gear (e.g. fish net) Rice mill (e.g. fuel and/or electricity run) Hand-held tractor 4wheel tractor Boat Weaving tools (e.g. loom) none of the above In both Chin and Magway, the responses to this question revealed very limited ownership of productive assets. In Chin, 8% of respondent households in Kanpetlet and 16% in Mindat had no productive assets at all, and a further 74% in Kanpetlet and 72% in Mindat had agricultural tools only. In Magway, 17% of households in Yesagyo and 23% in Pakokku had no productive assets at all, and a further 67% (equal in both Townships) had agricultural tools only. Hence, in both these States, productive assets beyond the very basic items of shovels, sickle, hand ploughs, etc, were very rare. The absence of these assets has clear constraining implications for livelihood opportunities. The absence of tractors (and other relatively larger-scale agricultural equipment) points to the dominance of labor-intensive agricultural practices within these regions. The findings are consistent with the 2013 LIFT survey, which found relatively low levels of agricultural equipment ownership (LIFT 2013: 121). From a livelihood perspective, the low incidence of weaving tools and other non-agricultural productive assets reflect the relatively narrow dependence on agriculture and remittances as sources of livelihood in this State. The situation was slightly different in Ayeyarwady, where households reported a greater variety of productive assets (Figure 13, Figure 14). In terms of agricultural assets, agricultural mechanization was relatively more widespread, with a greater number of respondents reporting ownership of hand-held and 4-wheel tractors. The data in Figure 13 and Figure 14 are proportions for all respondent households, but if only land-holding households are considered, this incidence becomes more pronounced. Among land-holding households in Kyaiklet and Maubin, 63.6% and 35.9% respectively of households had hand-held tractors. Not surprisingly, the ownership of (more expensive) 4-wheel tractors was considerably less common, but intriguingly, was relatively more widespread in Kyaiklet than Maubin (7.9% of land-holding households in Kyaiklet had a 4 wheel tractor, compared to just 1.0% in Maubin). Again, these findings are broadly consistent with the 2013 LIFT survey, which found higher incidence of tractor ownership in coastal/delta areas, compared to hilly and dry zone areas (LIFT 2013: 122). The incidence of agricultural mechanization in Ayeyarwady is contextualized by results from LIFT’s qualitative research survey of rural conditions, which noted an increase in small-scale agricultural machinery (such as hand-held tractors), which they speculate is a result of increased wage rates for farm labor, noticeably in Ayeyarwady (LIFT, 2016: 24-27). Similar conclusions are reached by Win and Thinzar (2016). Their survey of townships in Yangon region and Ayeyarwady found an approximate threefold increase in the number of 2-wheel tractors between 2010 and 2016. They attribute the increase in agricultural mechanization to
21LivelihoodsandFoodSecurityinMyanmar
rapid rises in rural outmigration from these Townships (all quite close to Yangon) that flowed into labor shortages and higher wages – which increased 32% between 2013 and 2016. Also relevant in Ayeyarwady is the fact that slightly more than 30% and 50% of respondent households in Kyaiklet and Maubin respectively owned a boat. (Note that in Figure 13 and Figure 14, some boat owners are classified in the ‘Other’ column.) This is hardly surprising, given the topography of the Delta, and of course boats serve both productive (for fishing) and transportation purposes. Figure 13. Proportion of households with productive assets - Kyaiklet
Figure 14. Proportion of households with productive assets - Maubin
22LivelihoodsandFoodSecurityinMyanmar
LIVELIHOODS
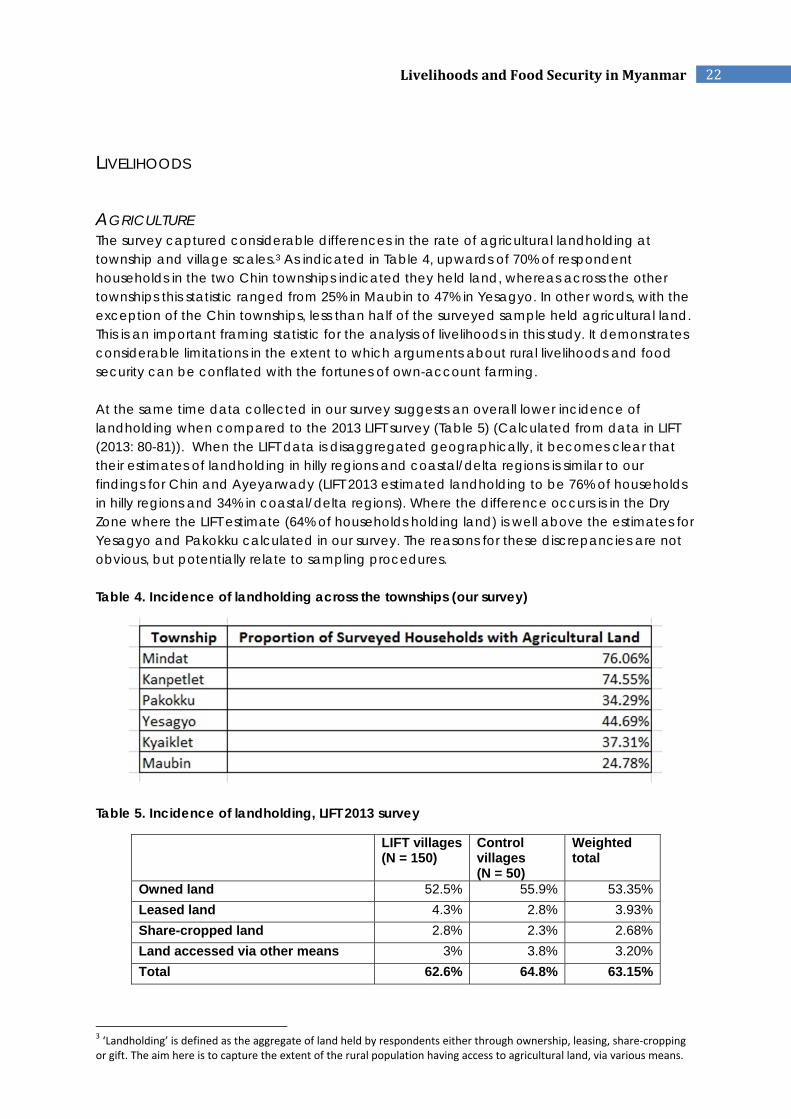
AGRICULTURE The survey captured considerable differences in the rate of agricultural landholding at township and village scales.3 As indicated in Table 4, upwards of 70% of respondent households in the two Chin townships indicated they held land, whereas across the other townships this statistic ranged from 25% in Maubin to 47% in Yesagyo. In other words, with the exception of the Chin townships, less than half of the surveyed sample held agricultural land. This is an important framing statistic for the analysis of livelihoods in this study. It demonstrates considerable limitations in the extent to which arguments about rural livelihoods and food security can be conflated with the fortunes of own-account farming. At the same time data collected in our survey suggests an overall lower incidence of landholding when compared to the 2013 LIFT survey (Table 5) (Calculated from data in LIFT (2013: 80-81)). When the LIFT data is disaggregated geographically, it becomes clear that their estimates of landholding in hilly regions and coastal/delta regions is similar to our findings for Chin and Ayeyarwady (LIFT 2013 estimated landholding to be 76% of households in hilly regions and 34% in coastal/delta regions). Where the difference occurs is in the Dry Zone where the LIFT estimate (64% of households holding land) is well above the estimates for Yesagyo and Pakokku calculated in our survey. The reasons for these discrepancies are not obvious, but potentially relate to sampling procedures. Table 4. Incidence of landholding across the townships (our survey)
Table 5. Incidence of landholding, LIFT 2013 survey
LIFT villages(N = 150)
Control villages (N = 50)
Weighted total
Owned land 52.5% 55.9% 53.35%
Leased land 4.3% 2.8% 3.93%
Share-cropped land 2.8% 2.3% 2.68%
Land accessed via other means 3% 3.8% 3.20%
Total 62.6% 64.8% 63.15%
3 ‘Landholding’ is defined as the aggregate of land held by respondents either through ownership, leasing, share‐cropping or gift. The aim here is to capture the extent of the rural population having access to agricultural land, via various means.

23LivelihoodsandFoodSecurityinMyanmar
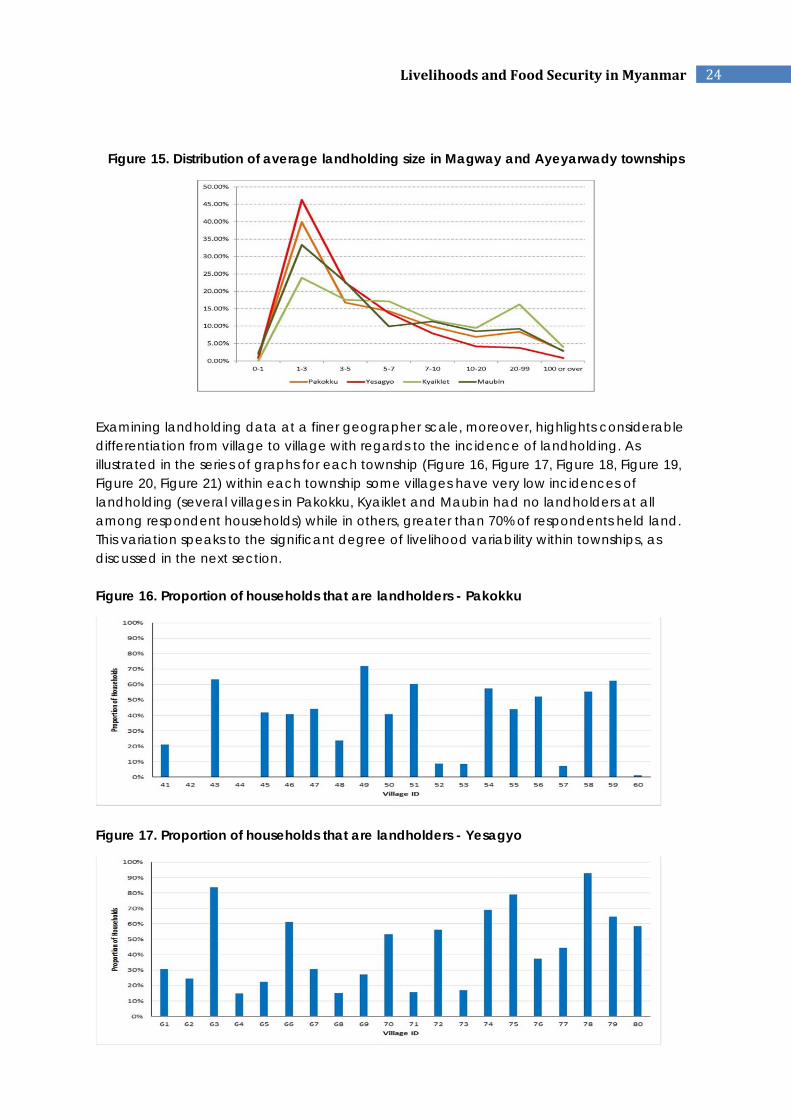
Examination of average landholding sizes (Table 6) brings into focus two key aspects of the political economy of agriculture in each township.4 Firstly, landholders in the Ayeyarwady townships of Kyaiklet and Maubin tend to have slightly larger average landholdings than in the Magway townships of Pakokku and Yesagyo. At first glance, this would appear somewhat anomalous, given that the greater fecundity and higher population density of the delta vis-à-vis the dry zone would seem to suggest landholdings in Magway would be larger than Ayeyarwady. However, when viewed in combination with Table 4 and Figure 15, what seems to be the case is that in the survey townships in the dry zone, there is a higher proportion of households holding land overall, and a larger number of these have small parcels of 1-3 acres. This is observable in Figure 15 by the sharper spike in the 1-3 acre category for the Magway townships (colored red and orange) compared with the Ayeyarwady townships (colored in green shades.) In the Ayeyarwady townships, relatively fewer households have landholdings, but for those that do, average holding sizes are larger, on average. This interpretation is broadly consistent with other data reported here that is suggestive of generally higher levels of inequality in the Ayeyarwady townships, on account of a dichotomy between relatively better-off landholders, and relatively worse-off landless households. In Magway, this dichotomy is somewhat muted by the greater presence of a larger number of smallholders, with holdings less than 3 acres. Secondly, the data from Chin requires careful and nuanced interpretation. The customary land tenure systems of Chin State pose problems for estimation of the proportion of landholding in a population. In Kanpetlet and Mindat townships of southern Chin, farming predominately takes place via a regime of shifting cultivation, with rights over land defined in community-based terms. As described recently by an analyst of Chin land tenure regimes, in southern Chin: “chiefs and their descendants continue to claim ownership of large parcels of land. This is corroborated by a recent study on Chin customary land systems which found that certain clans around Mindat Township in the south claim historical ownership to large swathes of land, to which access is granted in exchange for rents” (Mark, 2017: 143). More generally, the rules for customary tenure vary “from village to village and…[as]… unwritten, they defined the right-holders and their rights with regard to the land (Mark, 2017: 145).5 Likewise, data in Table 6 are best understood as representing the average area of land that landholding households had access to for cultivation. Table 6. Average landholding size, per township
Township Average holding size (acres)
Pakokku (Magway) 5.6
Yesagyo (Magway) 3.9
Kanpetlet (Chin) 3.5
Mindat (Chin) 2.9
Kyaiklet (Ayeyarwady) 7.7
Maubin (Ayeyarwady) 5.7
4 Data are calculated only for those households with agricultural land. Note that there was one household in Maubin which reported owning 1000 acres. This outlier has been removed in the calculation of average landholding sizes. 5 Also of note under the 2012 Vacant, Fallow, Virgin Land Law, land used for shifting cultivation is deemed ‘unoccupied’ and hence remains potentially open for private tenure titling (Mark, 2017: 137)
24LivelihoodsandFoodSecurityinMyanmar
Figure 15. Distribution of average landholding size in Magway and Ayeyarwady townships
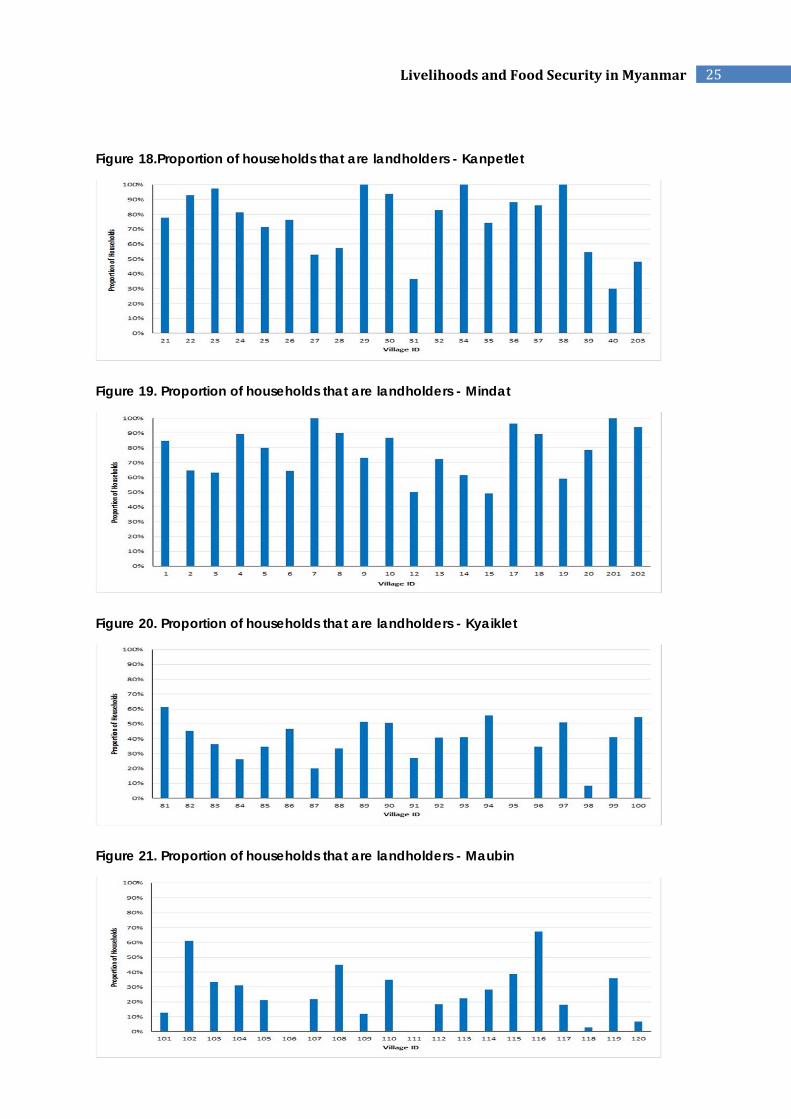
Examining landholding data at a finer geographer scale, moreover, highlights considerable differentiation from village to village with regards to the incidence of landholding. As illustrated in the series of graphs for each township (Figure 16, Figure 17, Figure 18, Figure 19, Figure 20, Figure 21) within each township some villages have very low incidences of landholding (several villages in Pakokku, Kyaiklet and Maubin had no landholders at all among respondent households) while in others, greater than 70% of respondents held land. This variation speaks to the significant degree of livelihood variability within townships, as discussed in the next section. Figure 16. Proportion of households that are landholders - Pakokku
Figure 17. Proportion of households that are landholders - Yesagyo
25LivelihoodsandFoodSecurityinMyanmar
Figure 18.Proportion of households that are landholders - Kanpetlet
Figure 19. Proportion of households that are landholders - Mindat
Figure 20. Proportion of households that are landholders - Kyaiklet
Figure 21. Proportion of households that are landholders - Maubin
26LivelihoodsandFoodSecurityinMyanmar
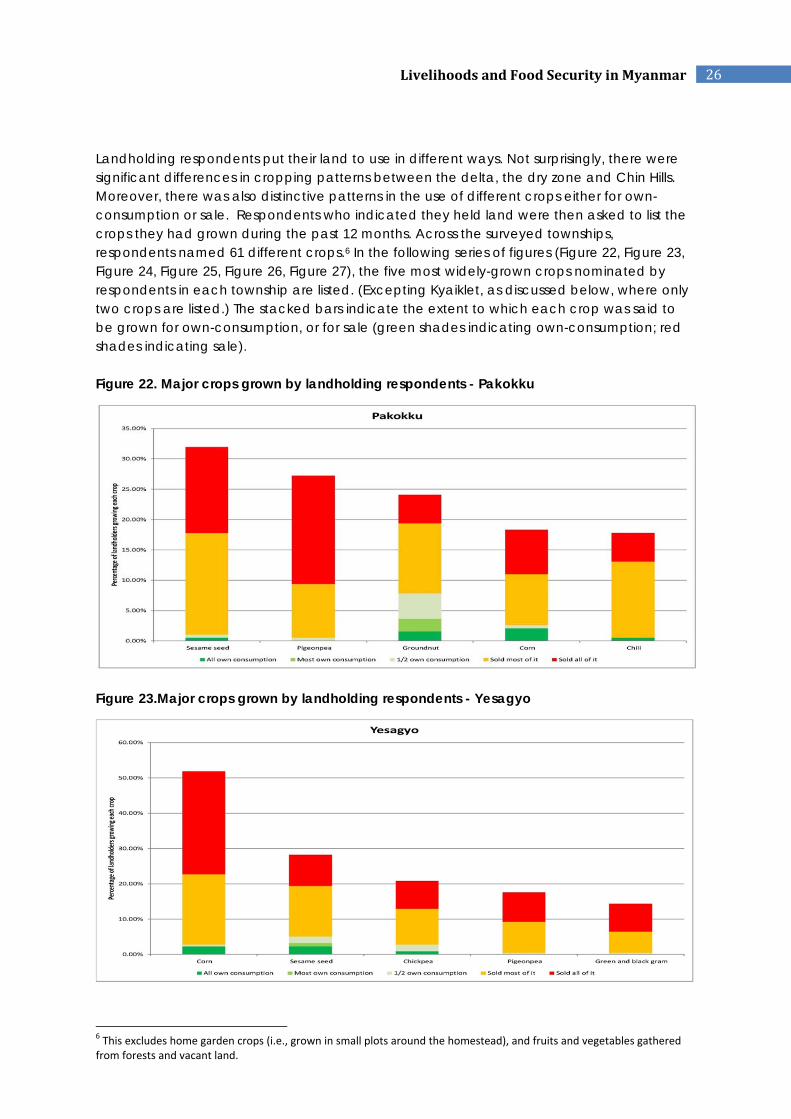
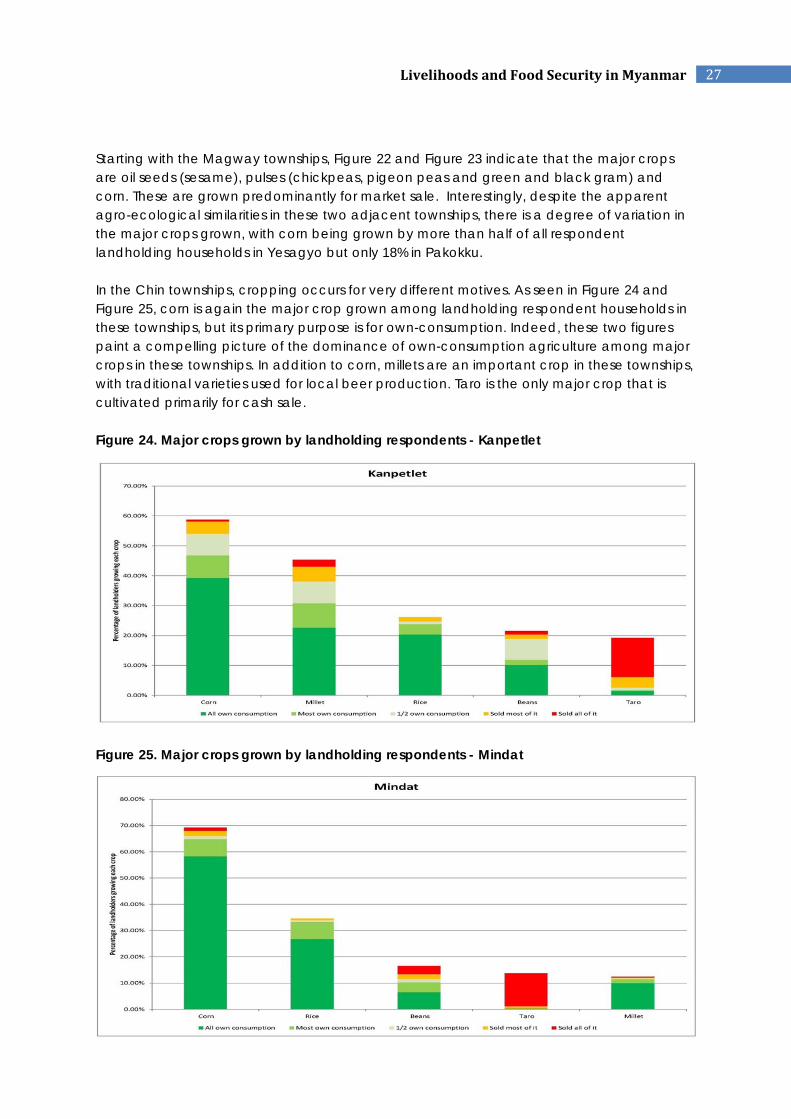
Landholding respondents put their land to use in different ways. Not surprisingly, there were significant differences in cropping patterns between the delta, the dry zone and Chin Hills. Moreover, there was also distinctive patterns in the use of different crops either for own-consumption or sale. Respondents who indicated they held land were then asked to list the crops they had grown during the past 12 months. Across the surveyed townships, respondents named 61 different crops.6 In the following series of figures (Figure 22, Figure 23, Figure 24, Figure 25, Figure 26, Figure 27), the five most widely-grown crops nominated by respondents in each township are listed. (Excepting Kyaiklet, as discussed below, where only two crops are listed.) The stacked bars indicate the extent to which each crop was said to be grown for own-consumption, or for sale (green shades indicating own-consumption; red shades indicating sale). Figure 22. Major crops grown by landholding respondents - Pakokku
Figure 23.Major crops grown by landholding respondents - Yesagyo
6 This excludes home garden crops (i.e., grown in small plots around the homestead), and fruits and vegetables gathered from forests and vacant land.
27LivelihoodsandFoodSecurityinMyanmar
Starting with the Magway townships, Figure 22 and Figure 23 indicate that the major crops are oil seeds (sesame), pulses (chickpeas, pigeon peas and green and black gram) and corn. These are grown predominantly for market sale. Interestingly, despite the apparent agro-ecological similarities in these two adjacent townships, there is a degree of variation in the major crops grown, with corn being grown by more than half of all respondent landholding households in Yesagyo but only 18% in Pakokku. In the Chin townships, cropping occurs for very different motives. As seen in Figure 24 and Figure 25, corn is again the major crop grown among landholding respondent households in these townships, but its primary purpose is for own-consumption. Indeed, these two figures paint a compelling picture of the dominance of own-consumption agriculture among major crops in these townships. In addition to corn, millets are an important crop in these townships, with traditional varieties used for local beer production. Taro is the only major crop that is cultivated primarily for cash sale. Figure 24. Major crops grown by landholding respondents - Kanpetlet
Figure 25. Major crops grown by landholding respondents - Mindat
28LivelihoodsandFoodSecurityinMyanmar
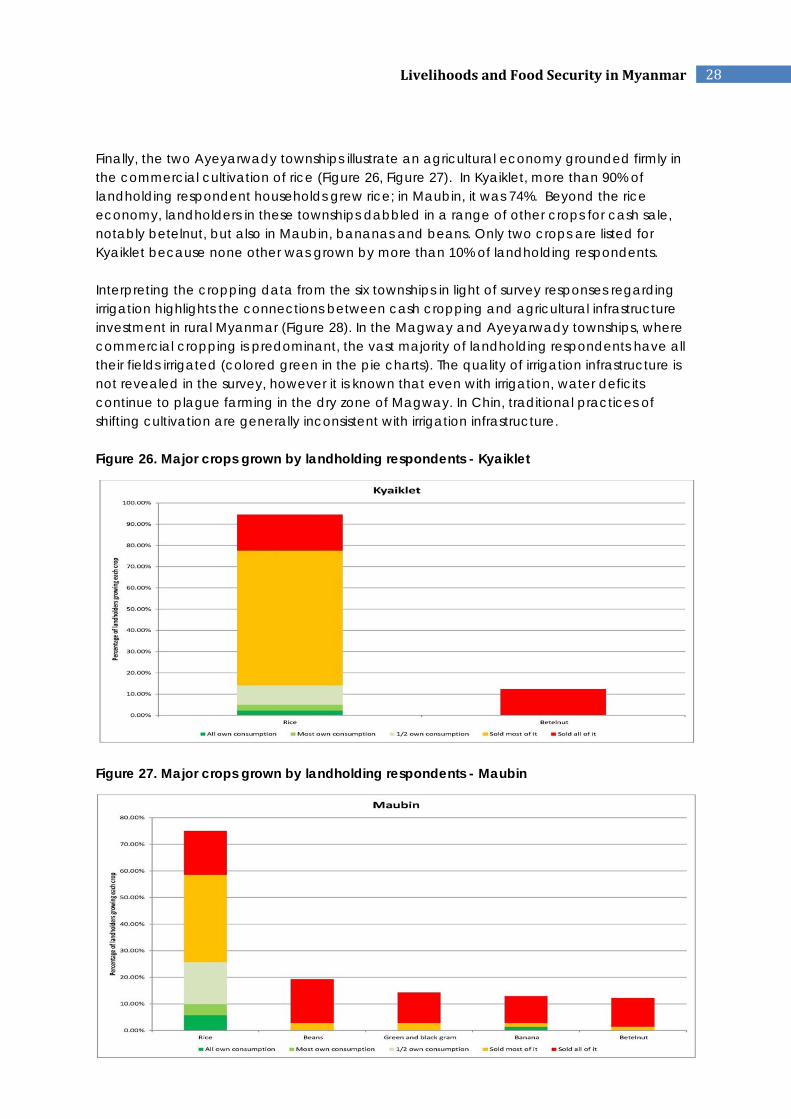
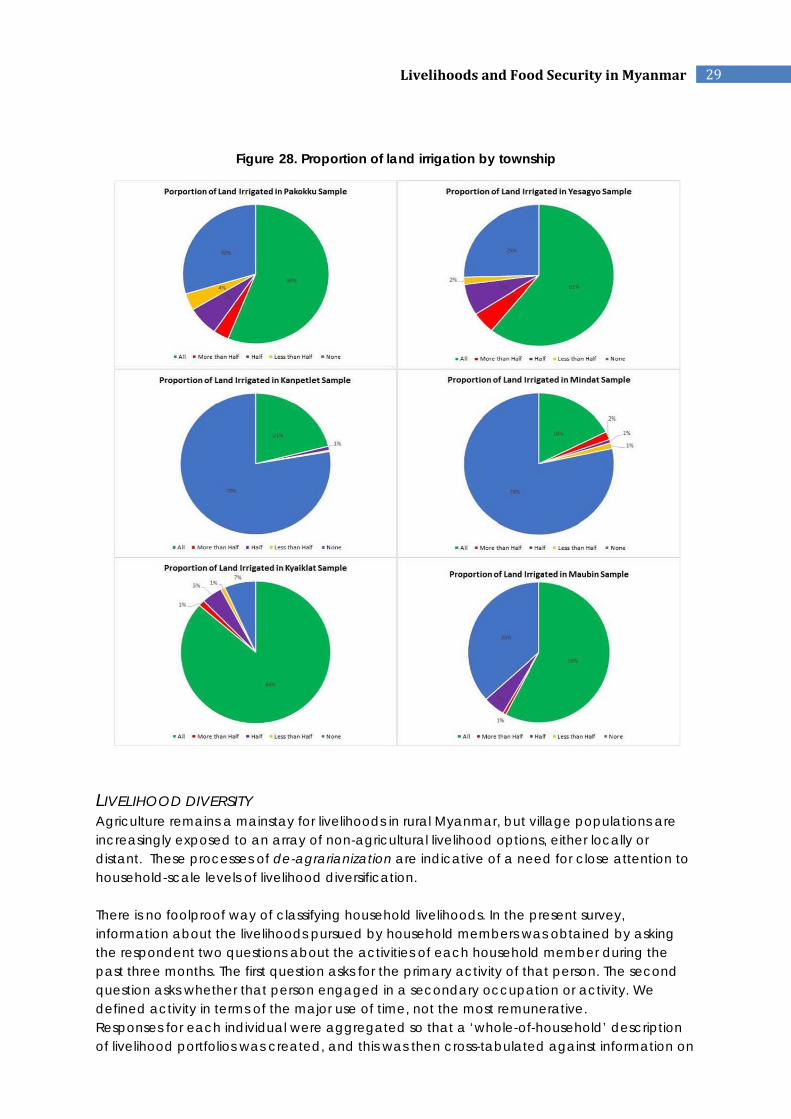
Finally, the two Ayeyarwady townships illustrate an agricultural economy grounded firmly in the commercial cultivation of rice (Figure 26, Figure 27). In Kyaiklet, more than 90% of landholding respondent households grew rice; in Maubin, it was 74%. Beyond the rice economy, landholders in these townships dabbled in a range of other crops for cash sale, notably betelnut, but also in Maubin, bananas and beans. Only two crops are listed for Kyaiklet because none other was grown by more than 10% of landholding respondents. Interpreting the cropping data from the six townships in light of survey responses regarding irrigation highlights the connections between cash cropping and agricultural infrastructure investment in rural Myanmar (Figure 28). In the Magway and Ayeyarwady townships, where commercial cropping is predominant, the vast majority of landholding respondents have all their fields irrigated (colored green in the pie charts). The quality of irrigation infrastructure is not revealed in the survey, however it is known that even with irrigation, water deficits continue to plague farming in the dry zone of Magway. In Chin, traditional practices of shifting cultivation are generally inconsistent with irrigation infrastructure. Figure 26. Major crops grown by landholding respondents - Kyaiklet
Figure 27. Major crops grown by landholding respondents - Maubin
29LivelihoodsandFoodSecurityinMyanmar
Figure 28. Proportion of land irrigation by township
LIVELIHOOD DIVERSITY Agriculture remains a mainstay for livelihoods in rural Myanmar, but village populations are increasingly exposed to an array of non-agricultural livelihood options, either locally or distant. These processes of de-agrarianization are indicative of a need for close attention to household-scale levels of livelihood diversification. There is no foolproof way of classifying household livelihoods. In the present survey, information about the livelihoods pursued by household members was obtained by asking the respondent two questions about the activities of each household member during the past three months. The first question asks for the primary activity of that person. The second question asks whether that person engaged in a secondary occupation or activity. We defined activity in terms of the major use of time, not the most remunerative. Responses for each individual were aggregated so that a ‘whole-of-household’ description of livelihood portfolios was created, and this was then cross-tabulated against information on
30LivelihoodsandFoodSecurityinMyanmar
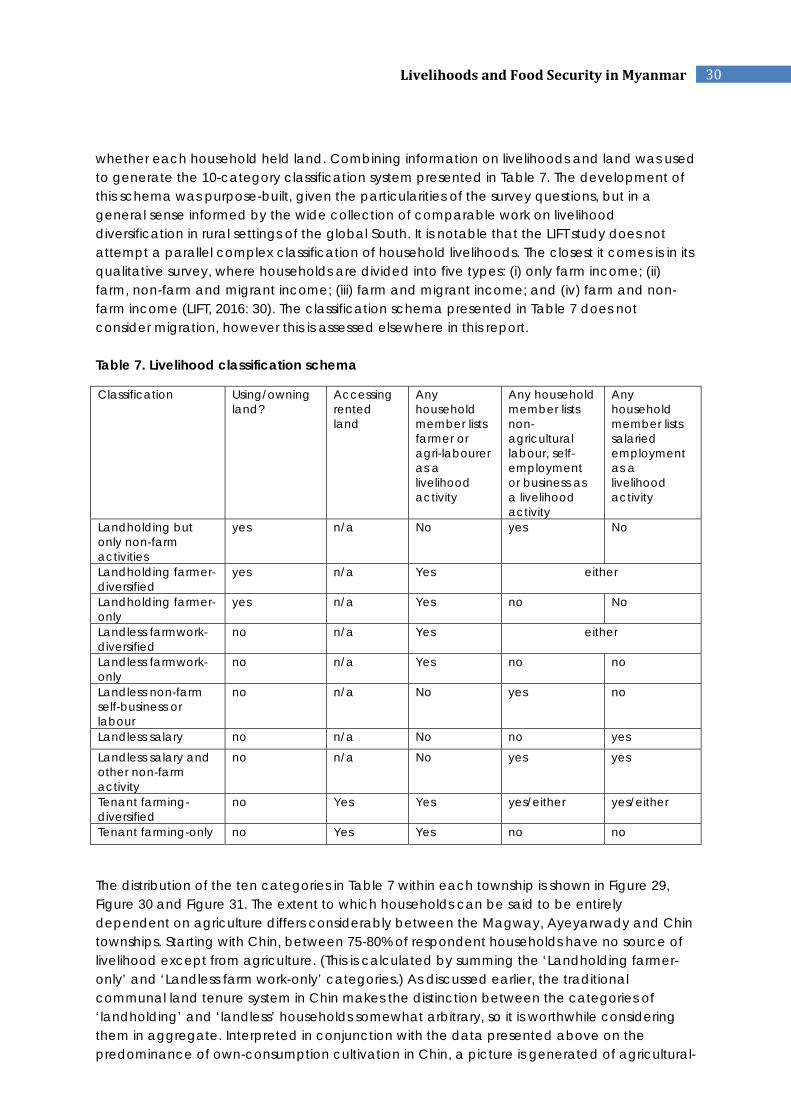
whether each household held land. Combining information on livelihoods and land was used to generate the 10-category classification system presented in Table 7. The development of this schema was purpose-built, given the particularities of the survey questions, but in a general sense informed by the wide collection of comparable work on livelihood diversification in rural settings of the global South. It is notable that the LIFT study does not attempt a parallel complex classification of household livelihoods. The closest it comes is in its qualitative survey, where households are divided into five types: (i) only farm income; (ii) farm, non-farm and migrant income; (iii) farm and migrant income; and (iv) farm and non-farm income (LIFT, 2016: 30). The classification schema presented in Table 7 does not consider migration, however this is assessed elsewhere in this report. Table 7. Livelihood classification schema
Classification Using/owning land?
Accessing rented land
Any household member lists farmer or agri-labourer as a livelihood activity
Any household member lists non-agricultural labour, self-employment or business as a livelihood activity
Any household member lists salaried employment as a livelihood activity
Landholding but only non-farm activities
yes n/a No yes No
Landholding farmer-diversified
yes n/a Yes either
Landholding farmer-only
yes n/a Yes no No
Landless farmwork-diversified
no n/a Yes either
Landless farmwork-only
no n/a Yes no no
Landless non-farm self-business or labour
no n/a No yes no
Landless salary no n/a No no yes
Landless salary and other non-farm activity
no n/a No yes yes
Tenant farming-diversified
no Yes Yes yes/either yes/either
Tenant farming-only no Yes Yes no no
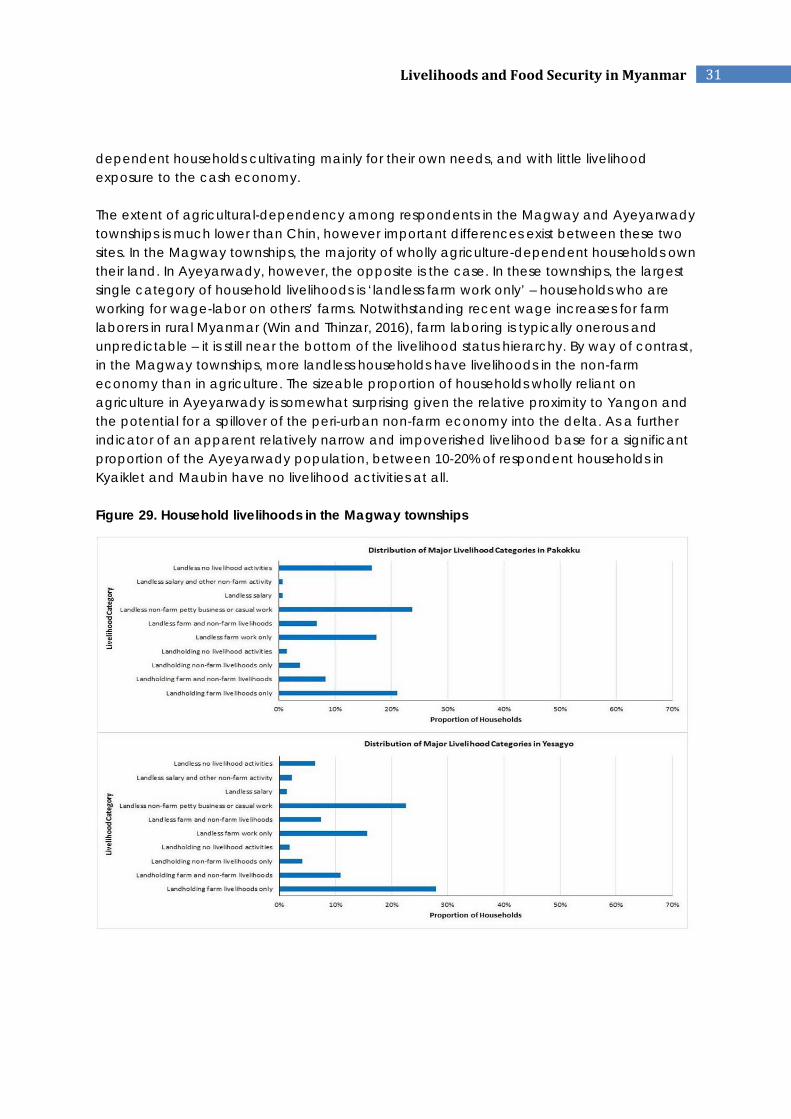
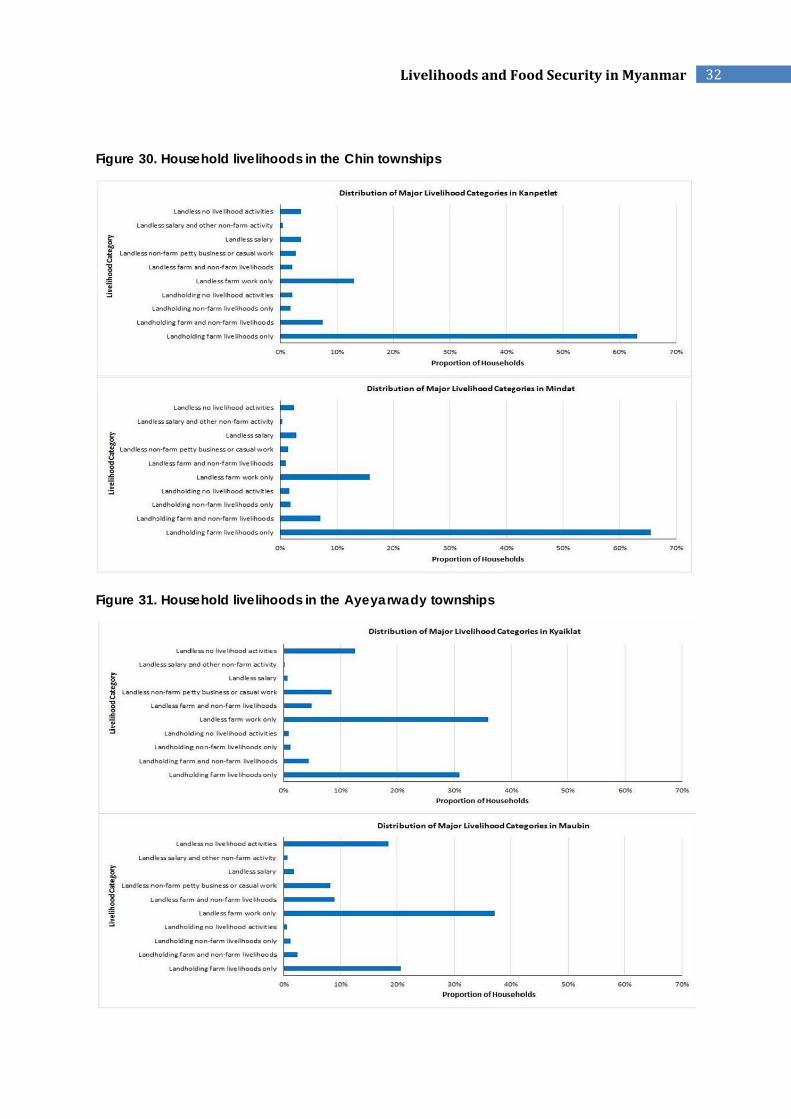
The distribution of the ten categories in Table 7 within each township is shown in Figure 29, Figure 30 and Figure 31. The extent to which households can be said to be entirely dependent on agriculture differs considerably between the Magway, Ayeyarwady and Chin townships. Starting with Chin, between 75-80% of respondent households have no source of livelihood except from agriculture. (This is calculated by summing the ‘Landholding farmer-only’ and ‘Landless farm work-only’ categories.) As discussed earlier, the traditional communal land tenure system in Chin makes the distinction between the categories of ‘landholding’ and ‘landless’ households somewhat arbitrary, so it is worthwhile considering them in aggregate. Interpreted in conjunction with the data presented above on the predominance of own-consumption cultivation in Chin, a picture is generated of agricultural-
31LivelihoodsandFoodSecurityinMyanmar
dependent households cultivating mainly for their own needs, and with little livelihood exposure to the cash economy. The extent of agricultural-dependency among respondents in the Magway and Ayeyarwady townships is much lower than Chin, however important differences exist between these two sites. In the Magway townships, the majority of wholly agriculture-dependent households own their land. In Ayeyarwady, however, the opposite is the case. In these townships, the largest single category of household livelihoods is ‘landless farm work only’ – households who are working for wage-labor on others’ farms. Notwithstanding recent wage increases for farm laborers in rural Myanmar (Win and Thinzar, 2016), farm laboring is typically onerous and unpredictable – it is still near the bottom of the livelihood status hierarchy. By way of contrast, in the Magway townships, more landless households have livelihoods in the non-farm economy than in agriculture. The sizeable proportion of households wholly reliant on agriculture in Ayeyarwady is somewhat surprising given the relative proximity to Yangon and the potential for a spillover of the peri-urban non-farm economy into the delta. As a further indicator of an apparent relatively narrow and impoverished livelihood base for a significant proportion of the Ayeyarwady population, between 10-20% of respondent households in Kyaiklet and Maubin have no livelihood activities at all. Figure 29. Household livelihoods in the Magway townships
32LivelihoodsandFoodSecurityinMyanmar
Figure 30. Household livelihoods in the Chin townships
Figure 31. Household livelihoods in the Ayeyarwady townships
33LivelihoodsandFoodSecurityinMyanmar
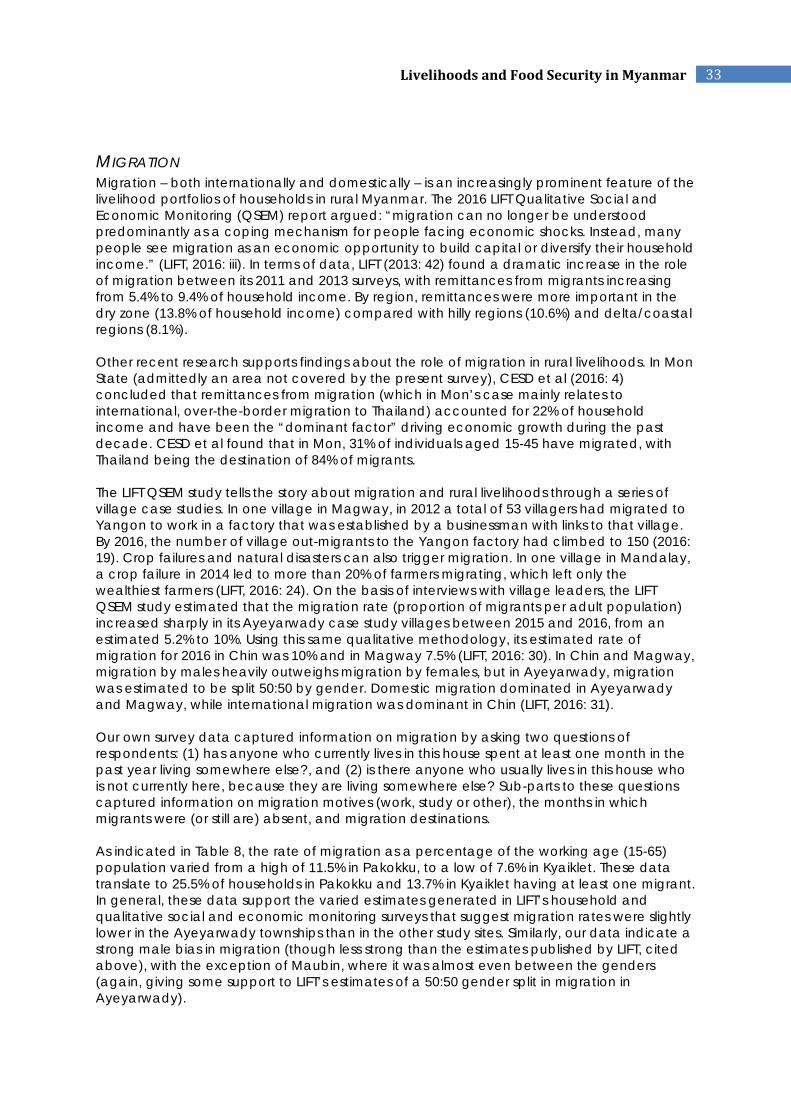
MIGRATION Migration – both internationally and domestically – is an increasingly prominent feature of the livelihood portfolios of households in rural Myanmar. The 2016 LIFT Qualitative Social and Economic Monitoring (QSEM) report argued: “migration can no longer be understood predominantly as a coping mechanism for people facing economic shocks. Instead, many people see migration as an economic opportunity to build capital or diversify their household income.” (LIFT, 2016: iii). In terms of data, LIFT (2013: 42) found a dramatic increase in the role of migration between its 2011 and 2013 surveys, with remittances from migrants increasing from 5.4% to 9.4% of household income. By region, remittances were more important in the dry zone (13.8% of household income) compared with hilly regions (10.6%) and delta/coastal regions (8.1%). Other recent research supports findings about the role of migration in rural livelihoods. In Mon State (admittedly an area not covered by the present survey), CESD et al (2016: 4) concluded that remittances from migration (which in Mon’s case mainly relates to international, over-the-border migration to Thailand) accounted for 22% of household income and have been the “dominant factor” driving economic growth during the past decade. CESD et al found that in Mon, 31% of individuals aged 15-45 have migrated, with Thailand being the destination of 84% of migrants. The LIFT QSEM study tells the story about migration and rural livelihoods through a series of village case studies. In one village in Magway, in 2012 a total of 53 villagers had migrated to Yangon to work in a factory that was established by a businessman with links to that village. By 2016, the number of village out-migrants to the Yangon factory had climbed to 150 (2016: 19). Crop failures and natural disasters can also trigger migration. In one village in Mandalay, a crop failure in 2014 led to more than 20% of farmers migrating, which left only the wealthiest farmers (LIFT, 2016: 24). On the basis of interviews with village leaders, the LIFT QSEM study estimated that the migration rate (proportion of migrants per adult population) increased sharply in its Ayeyarwady case study villages between 2015 and 2016, from an estimated 5.2% to 10%. Using this same qualitative methodology, its estimated rate of migration for 2016 in Chin was 10% and in Magway 7.5% (LIFT, 2016: 30). In Chin and Magway, migration by males heavily outweighs migration by females, but in Ayeyarwady, migration was estimated to be split 50:50 by gender. Domestic migration dominated in Ayeyarwady and Magway, while international migration was dominant in Chin (LIFT, 2016: 31). Our own survey data captured information on migration by asking two questions of respondents: (1) has anyone who currently lives in this house spent at least one month in the past year living somewhere else?, and (2) is there anyone who usually lives in this house who is not currently here, because they are living somewhere else? Sub-parts to these questions captured information on migration motives (work, study or other), the months in which migrants were (or still are) absent, and migration destinations. As indicated in Table 8, the rate of migration as a percentage of the working age (15-65) population varied from a high of 11.5% in Pakokku, to a low of 7.6% in Kyaiklet. These data translate to 25.5% of households in Pakokku and 13.7% in Kyaiklet having at least one migrant. In general, these data support the varied estimates generated in LIFT’s household and qualitative social and economic monitoring surveys that suggest migration rates were slightly lower in the Ayeyarwady townships than in the other study sites. Similarly, our data indicate a strong male bias in migration (though less strong than the estimates published by LIFT, cited above), with the exception of Maubin, where it was almost even between the genders (again, giving some support to LIFT’s estimates of a 50:50 gender split in migration in Ayeyarwady).
34LivelihoodsandFoodSecurityinMyanmar
Table 8. Migration rates by township
Percent of persons aged 15-65 who have migrated in past 12 months
Percent of households with at least one migrant
Percent of male migrants
Percent of female migrants
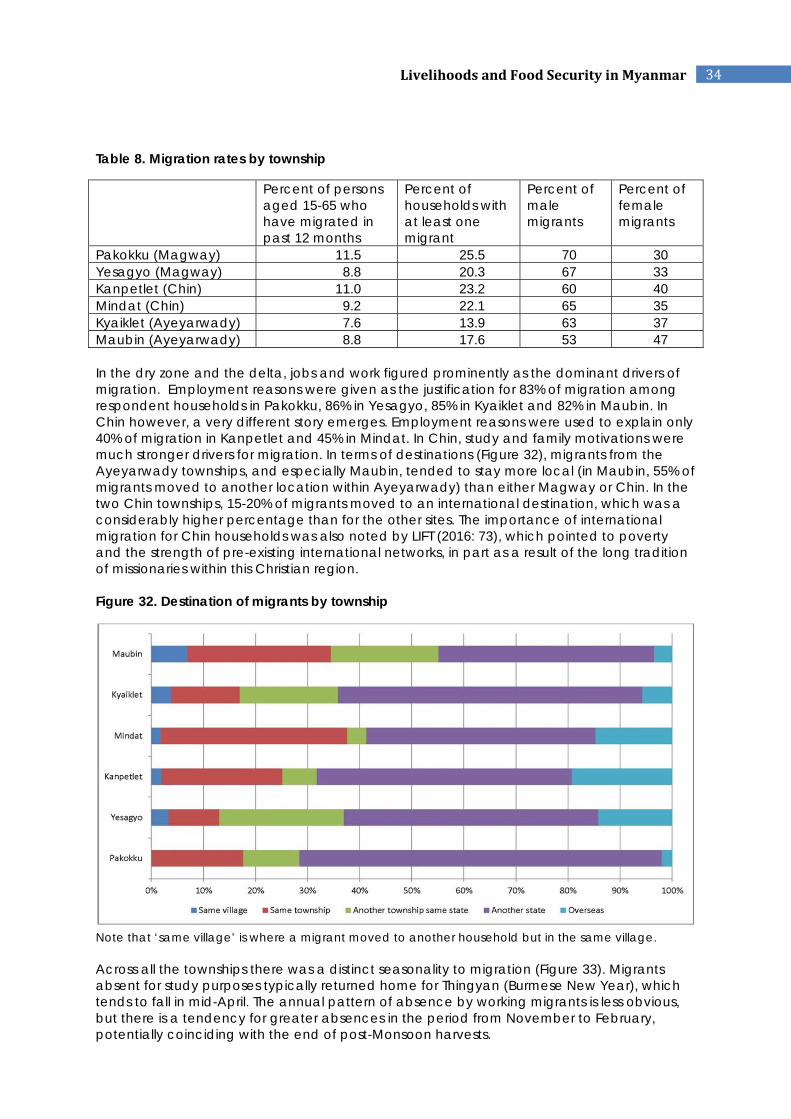
Pakokku (Magway) 11.5 25.5 70 30 Yesagyo (Magway) 8.8 20.3 67 33 Kanpetlet (Chin) 11.0 23.2 60 40 Mindat (Chin) 9.2 22.1 65 35 Kyaiklet (Ayeyarwady) 7.6 13.9 63 37 Maubin (Ayeyarwady) 8.8 17.6 53 47 In the dry zone and the delta, jobs and work figured prominently as the dominant drivers of migration. Employment reasons were given as the justification for 83% of migration among respondent households in Pakokku, 86% in Yesagyo, 85% in Kyaiklet and 82% in Maubin. In Chin however, a very different story emerges. Employment reasons were used to explain only 40% of migration in Kanpetlet and 45% in Mindat. In Chin, study and family motivations were much stronger drivers for migration. In terms of destinations (Figure 32), migrants from the Ayeyarwady townships, and especially Maubin, tended to stay more local (in Maubin, 55% of migrants moved to another location within Ayeyarwady) than either Magway or Chin. In the two Chin townships, 15-20% of migrants moved to an international destination, which was a considerably higher percentage than for the other sites. The importance of international migration for Chin households was also noted by LIFT (2016: 73), which pointed to poverty and the strength of pre-existing international networks, in part as a result of the long tradition of missionaries within this Christian region. Figure 32. Destination of migrants by township
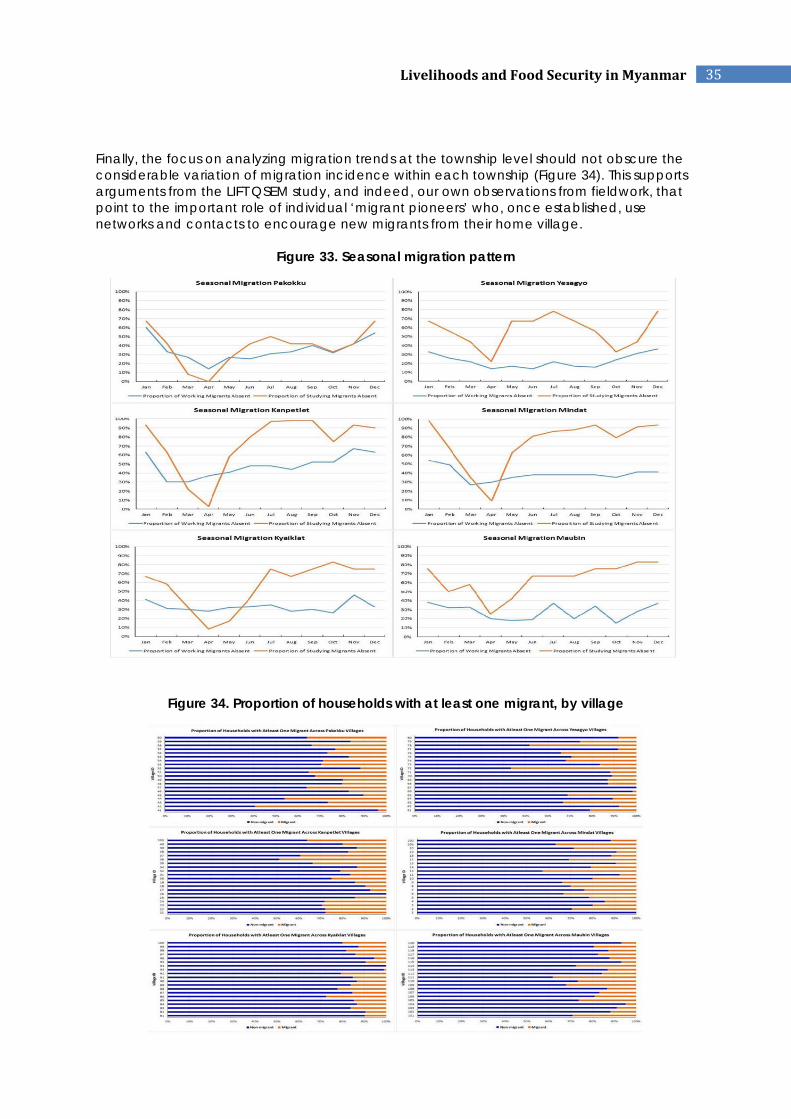
Note that ‘same village’ is where a migrant moved to another household but in the same village. Across all the townships there was a distinct seasonality to migration (Figure 33). Migrants absent for study purposes typically returned home for Thingyan (Burmese New Year), which tends to fall in mid-April. The annual pattern of absence by working migrants is less obvious, but there is a tendency for greater absences in the period from November to February, potentially coinciding with the end of post-Monsoon harvests.
35LivelihoodsandFoodSecurityinMyanmar
Finally, the focus on analyzing migration trends at the township level should not obscure the considerable variation of migration incidence within each township (Figure 34). This supports arguments from the LIFT QSEM study, and indeed, our own observations from fieldwork, that point to the important role of individual ‘migrant pioneers’ who, once established, use networks and contacts to encourage new migrants from their home village.
Figure 33. Seasonal migration pattern
Figure 34. Proportion of households with at least one migrant, by village
36LivelihoodsandFoodSecurityinMyanmar
HOUSEHOLD FOOD PRODUCTION An important objective of the study was to generate data on the extent to which respondent households satisfied their food consumption needs through own-production. To this end, the questionnaire asked respondents to list all the plant-based and animal foodstuffs as per the following categories:
1. crops grown in fields or paddocks owned or controlled by households; 2. plant-based foods grown in home gardens or on trees/vines in and around
homesteads; 3. livestock kept by households; 4. fish held in ponds or caught in waterways, and 5. plant and animal foods obtained through hunting and foraging.
Of the list above, the following discussion does not cover (1), as this was assessed in an earlier section of this report. In all cases, the data represent whether the respondent household has eaten food from this source within the last 12 months.
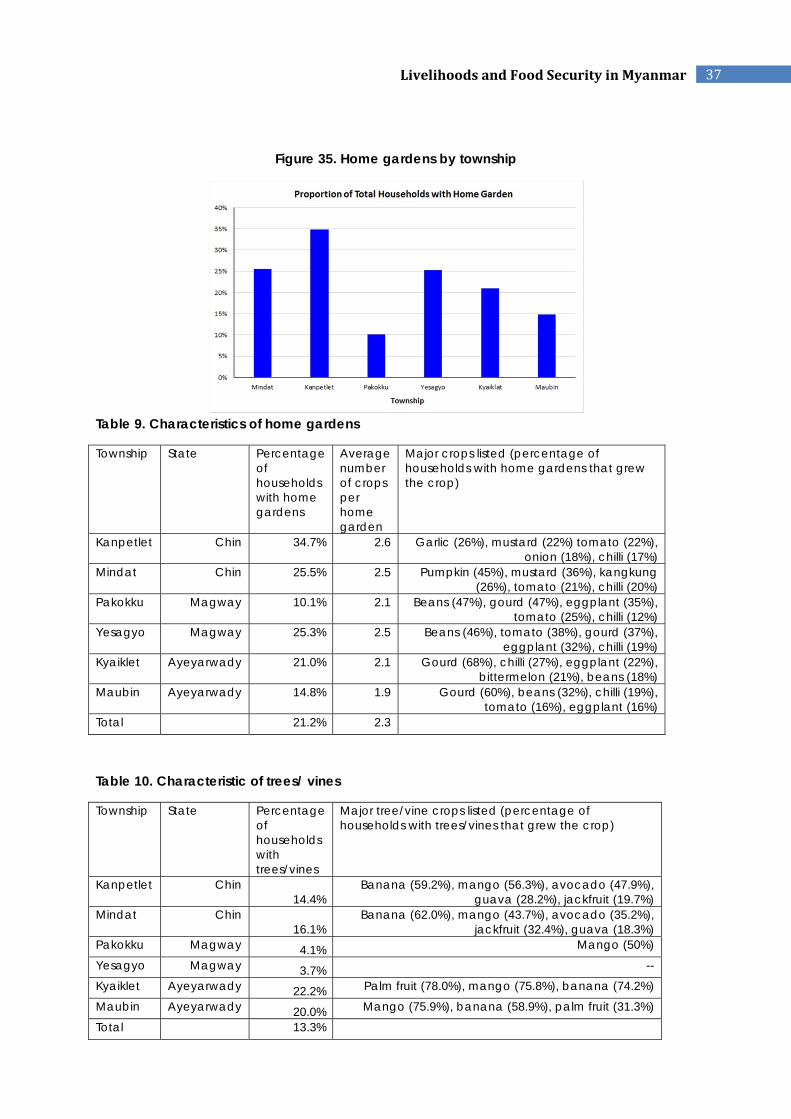
OWN-CONSUMPTION OF HOME GARDEN AND TREE/VINE CROP PRODUCTION The importance of home gardens for households’ food security and wellbeing is increasingly recognized within agricultural, nutritional and health research (Haider and Bhutta, 2008). In our survey, respondents were asked whether they had a home garden, and also whether they consumed foods from trees or vines they grew on their own land. Across the entire six townships, 21.2% of respondents had home gardens (Figure 35; Table 9), and 13.3% consumed foods from trees or vines (Table 10). Taken together, 31.7% had consumed food in the past 12 months from either or both a home garden or trees/vines. Home gardens were relatively more prevalent in the Chin townships. In the two Magway townships, there was a striking (and difficult to explain) difference between their incidence in Yesagyo and Pakokku. International research into home gardens often points to their high levels of plant diversity (Kumar and Nair, 2004). In our survey however, plant diversity was relatively low – on average, only 2.3 different plant foods were grown per home garden. This would seem to point to the fact that for most home garden practitioners in the survey, investments in their gardens were relatively modest. Cucurbita (including pumpkins, squash and gourds) were the most commonly grown crops in home gardens. They were frequently complemented by vegetable crops such as eggplant, beans and tomatoes. Chilli and garlic was also common in home gardens. Tree/vine crops were more prevalent among respondent households in the Ayeyarwady sites, and quite rare in the Magway townships. Major tree crops, not surprisingly, were banana and mango, with palm fruit very widely grown in Kyaiklet.
37LivelihoodsandFoodSecurityinMyanmar
Figure 35. Home gardens by township
Table 9. Characteristics of home gardens
Township State Percentage of households with home gardens
Average number of crops per home garden
Major crops listed (percentage of households with home gardens that grew the crop)
Kanpetlet Chin 34.7% 2.6 Garlic (26%), mustard (22%) tomato (22%), onion (18%), chilli (17%)
Mindat Chin 25.5% 2.5 Pumpkin (45%), mustard (36%), kangkung (26%), tomato (21%), chilli (20%)
Pakokku Magway 10.1% 2.1 Beans (47%), gourd (47%), eggplant (35%), tomato (25%), chilli (12%)
Yesagyo Magway 25.3% 2.5 Beans (46%), tomato (38%), gourd (37%), eggplant (32%), chilli (19%)
Kyaiklet Ayeyarwady 21.0% 2.1 Gourd (68%), chilli (27%), eggplant (22%), bittermelon (21%), beans (18%)
Maubin Ayeyarwady 14.8% 1.9 Gourd (60%), beans (32%), chilli (19%), tomato (16%), eggplant (16%)
Total 21.2% 2.3
Table 10. Characteristic of trees/ vines
Township State Percentage of households with trees/vines
Major tree/vine crops listed (percentage of households with trees/vines that grew the crop)
Kanpetlet Chin 14.4%
Banana (59.2%), mango (56.3%), avocado (47.9%), guava (28.2%), jackfruit (19.7%)
Mindat Chin 16.1%
Banana (62.0%), mango (43.7%), avocado (35.2%), jackfruit (32.4%), guava (18.3%)
Pakokku Magway 4.1% Mango (50%)
Yesagyo Magway 3.7% --
Kyaiklet Ayeyarwady 22.2% Palm fruit (78.0%), mango (75.8%), banana (74.2%)
Maubin Ayeyarwady 20.0% Mango (75.9%), banana (58.9%), palm fruit (31.3%)
Total 13.3%
38LivelihoodsandFoodSecurityinMyanmar
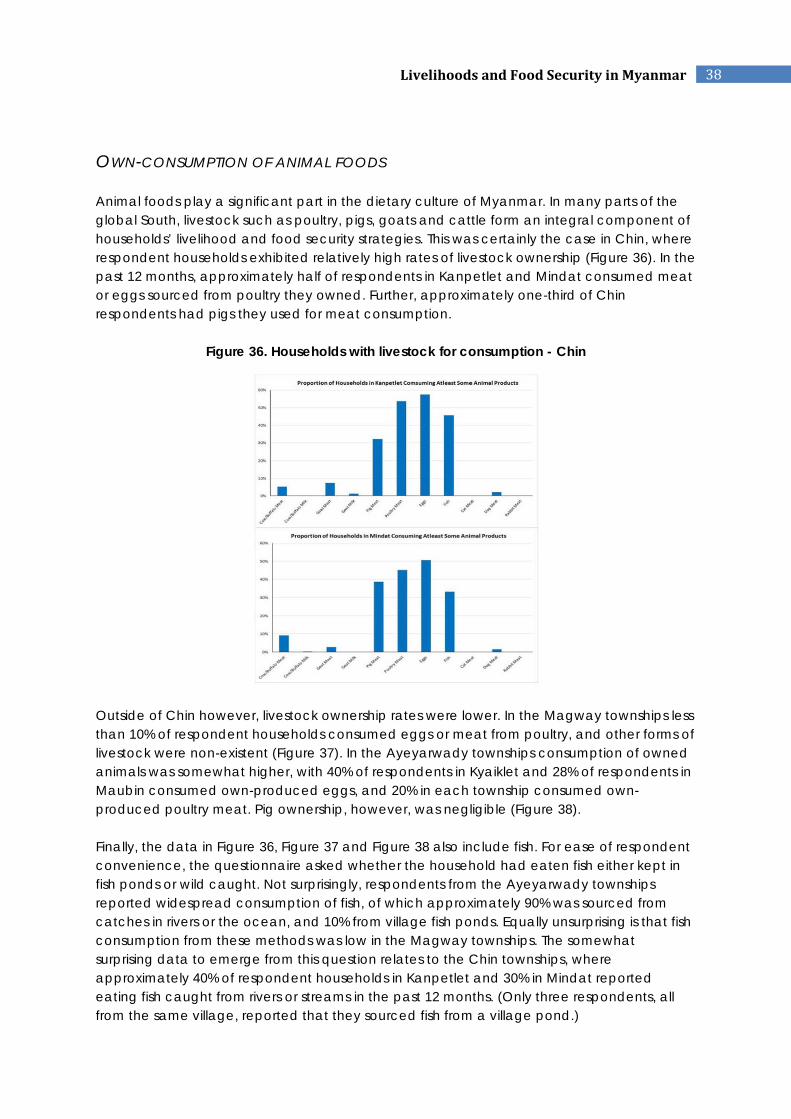
OWN-CONSUMPTION OF ANIMAL FOODS Animal foods play a significant part in the dietary culture of Myanmar. In many parts of the global South, livestock such as poultry, pigs, goats and cattle form an integral component of households’ livelihood and food security strategies. This was certainly the case in Chin, where respondent households exhibited relatively high rates of livestock ownership (Figure 36). In the past 12 months, approximately half of respondents in Kanpetlet and Mindat consumed meat or eggs sourced from poultry they owned. Further, approximately one-third of Chin respondents had pigs they used for meat consumption.
Figure 36. Households with livestock for consumption - Chin
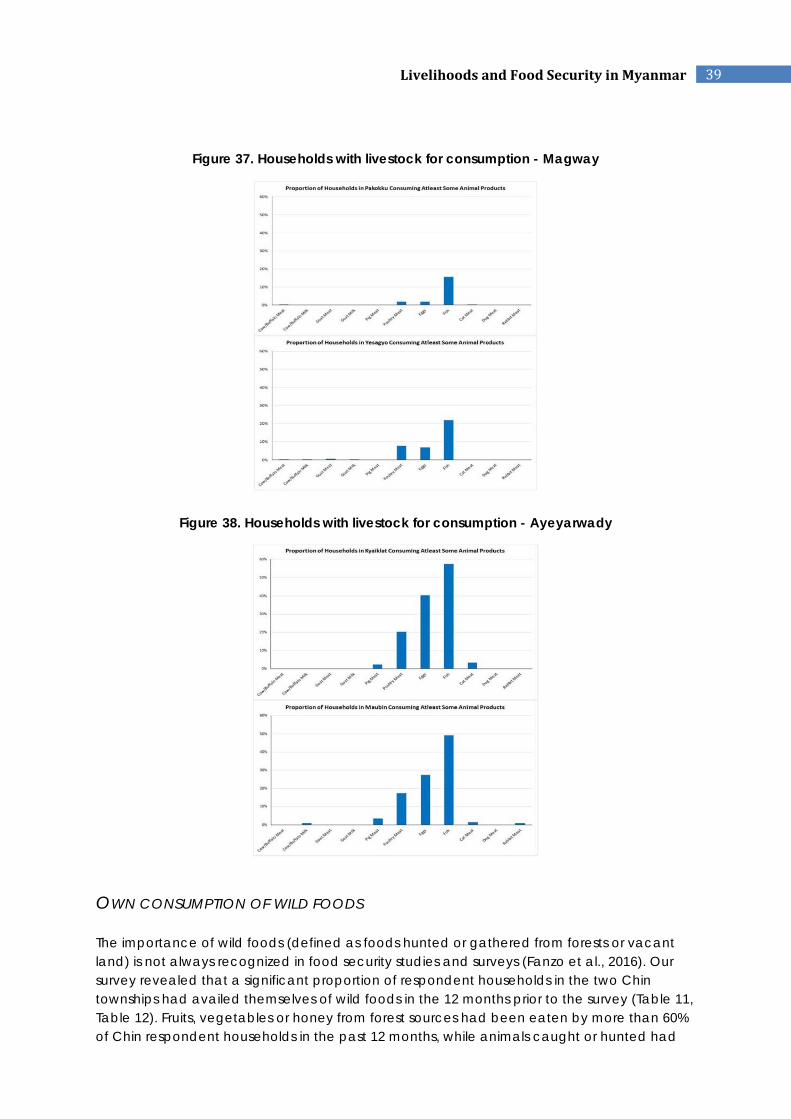
Outside of Chin however, livestock ownership rates were lower. In the Magway townships less than 10% of respondent households consumed eggs or meat from poultry, and other forms of livestock were non-existent (Figure 37). In the Ayeyarwady townships consumption of owned animals was somewhat higher, with 40% of respondents in Kyaiklet and 28% of respondents in Maubin consumed own-produced eggs, and 20% in each township consumed own-produced poultry meat. Pig ownership, however, was negligible (Figure 38). Finally, the data in Figure 36, Figure 37 and Figure 38 also include fish. For ease of respondent convenience, the questionnaire asked whether the household had eaten fish either kept in fish ponds or wild caught. Not surprisingly, respondents from the Ayeyarwady townships reported widespread consumption of fish, of which approximately 90% was sourced from catches in rivers or the ocean, and 10% from village fish ponds. Equally unsurprising is that fish consumption from these methods was low in the Magway townships. The somewhat surprising data to emerge from this question relates to the Chin townships, where approximately 40% of respondent households in Kanpetlet and 30% in Mindat reported eating fish caught from rivers or streams in the past 12 months. (Only three respondents, all from the same village, reported that they sourced fish from a village pond.)
39LivelihoodsandFoodSecurityinMyanmar
Figure 37. Households with livestock for consumption - Magway
Figure 38. Households with livestock for consumption - Ayeyarwady
OWN CONSUMPTION OF WILD FOODS The importance of wild foods (defined as foods hunted or gathered from forests or vacant land) is not always recognized in food security studies and surveys (Fanzo et al., 2016). Our survey revealed that a significant proportion of respondent households in the two Chin townships had availed themselves of wild foods in the 12 months prior to the survey (Table 11, Table 12). Fruits, vegetables or honey from forest sources had been eaten by more than 60% of Chin respondent households in the past 12 months, while animals caught or hunted had
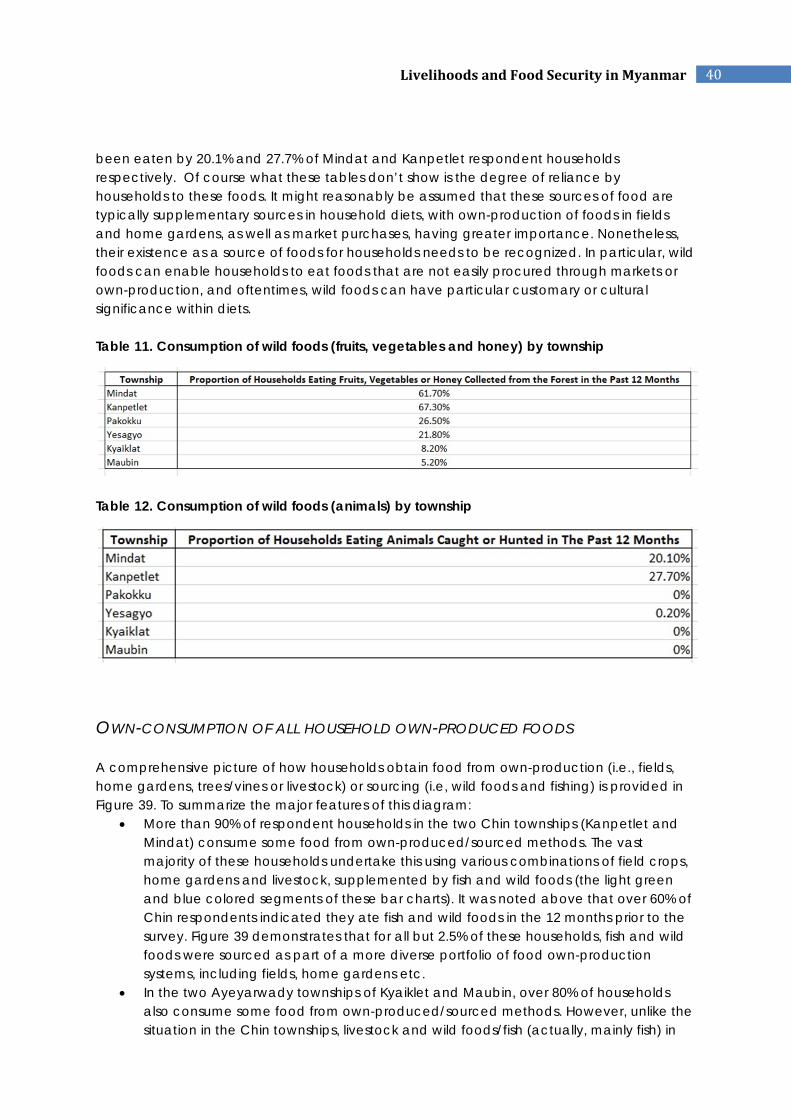
40LivelihoodsandFoodSecurityinMyanmar
been eaten by 20.1% and 27.7% of Mindat and Kanpetlet respondent households respectively. Of course what these tables don’t show is the degree of reliance by households to these foods. It might reasonably be assumed that these sources of food are typically supplementary sources in household diets, with own-production of foods in fields and home gardens, as well as market purchases, having greater importance. Nonetheless, their existence as a source of foods for households needs to be recognized. In particular, wild foods can enable households to eat foods that are not easily procured through markets or own-production, and oftentimes, wild foods can have particular customary or cultural significance within diets. Table 11. Consumption of wild foods (fruits, vegetables and honey) by township
Table 12. Consumption of wild foods (animals) by township
OWN-CONSUMPTION OF ALL HOUSEHOLD OWN-PRODUCED FOODS A comprehensive picture of how households obtain food from own-production (i.e., fields, home gardens, trees/vines or livestock) or sourcing (i.e, wild foods and fishing) is provided in Figure 39. To summarize the major features of this diagram:
More than 90% of respondent households in the two Chin townships (Kanpetlet and Mindat) consume some food from own-produced/sourced methods. The vast majority of these households undertake this using various combinations of field crops, home gardens and livestock, supplemented by fish and wild foods (the light green and blue colored segments of these bar charts). It was noted above that over 60% of Chin respondents indicated they ate fish and wild foods in the 12 months prior to the survey. Figure 39 demonstrates that for all but 2.5% of these households, fish and wild foods were sourced as part of a more diverse portfolio of food own-production systems, including fields, home gardens etc.
In the two Ayeyarwady townships of Kyaiklet and Maubin, over 80% of households also consume some food from own-produced/sourced methods. However, unlike the situation in the Chin townships, livestock and wild foods/fish (actually, mainly fish) in
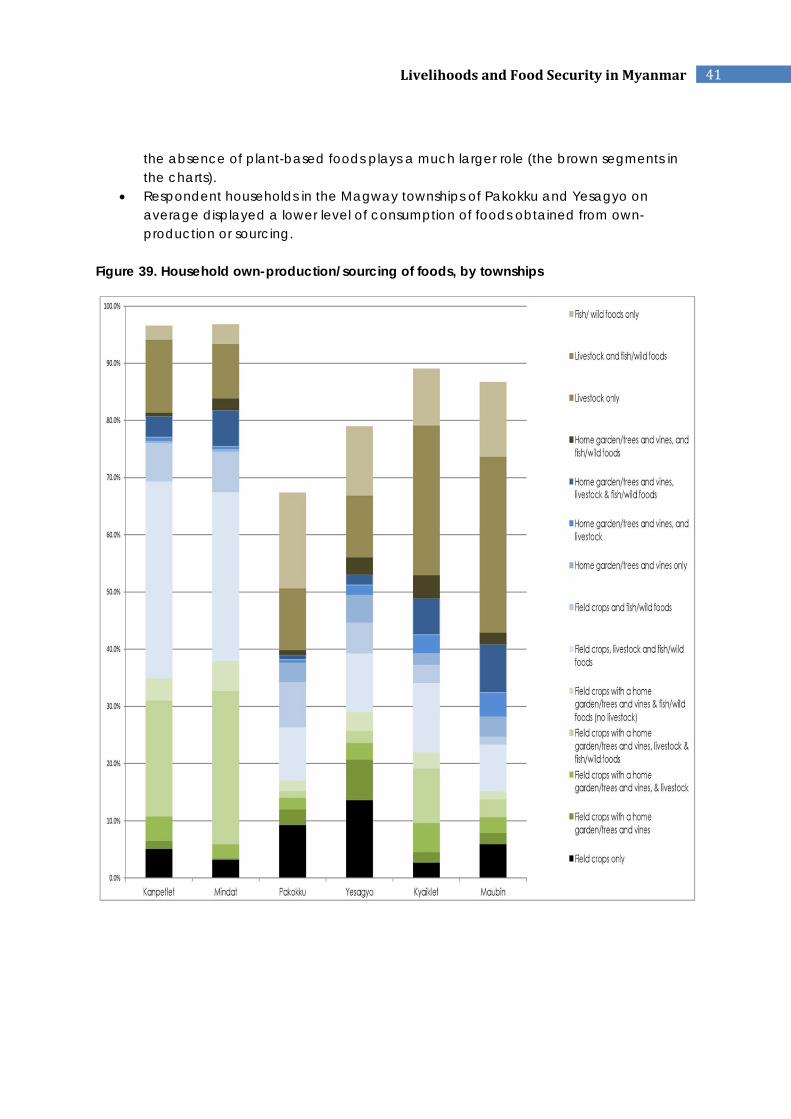
41LivelihoodsandFoodSecurityinMyanmar
the absence of plant-based foods plays a much larger role (the brown segments in the charts).
Respondent households in the Magway townships of Pakokku and Yesagyo on average displayed a lower level of consumption of foods obtained from own-production or sourcing.
Figure 39. Household own-production/sourcing of foods, by townships
42LivelihoodsandFoodSecurityinMyanmar
WOMEN’S AUTONOMY Recent research has highlighted connections between the women’s autonomy in household decision-making on the one hand, and household food and nutrition outcomes, on the other, especially with regards to infant and child health (Rammohan, 2016). In cultures with highly patriarchal cultural norms, such as in some parts of India, limitations in women’s household decision-making can be associated with lesser relative household expenditure on food, education and health-care, and can reinforce gender-discriminatory intra-household food allocations (Quisumbing and Maluccio, 2003; Prakash et al., 2011). To assess the level of women’s autonomy, the current survey asked respondents (all female) six questions about how household decisions were made:
Who has the final say on matters relating to the respondent’s own health care? Who has the final say on large household purchases? (large household purchases are
those that are not made on a daily basis and cost a larger sum of money. (e.g car, motorbike, fridge, tv, fan etc).
Who has the final say on daily household purchases? Who has the final say on visits (including overnight stay) to family or relatives? Who has the final say on what food is to be cooked? Who has the final say on deciding what to do with money in the household?
Enumerators were instructed to ask these questions out of earshot from male household members. In each case, respondents were asked to reply ‘Respondent alone’; ‘Respondent and husband/ another male’; ‘husband/another male alone’; ‘Some other arrangement’, or ‘Not sure’. Data were coded so that if a respondent indicated the decision was made by her alone, a score of 2 was allocated; if the decision was made jointly with her husband or another male, a score of 1 was allocated; and if the decision was made solely by her husband or another male, a score of zero was allocated. ‘Some other arrangements’ or ‘not sure’ responses were excluded. Hence, in the figures below, the highest possible score is 2, which would indicate all respondents were the sole decision-makers over the topic in question. Figure 40 shows the average levels of female autonomy for each township expressed as an average of responses to all six questions. Figure 41 displays these same data, broken down by individual question. The fact that all bars across the series of graphs lie in the range between 1-2 illustrates that female control over decision-making, either singly or in partnership with a husband or other male household member, was the norm. On average, female autonomy was slightly lower in the two Chin townships than in other regions, however differences are relatively slight. Not surprisingly, female respondents had overwhelmingly sole control over cooking and daily household purchases, with other decisions tending to have a higher propensity to be made jointly.
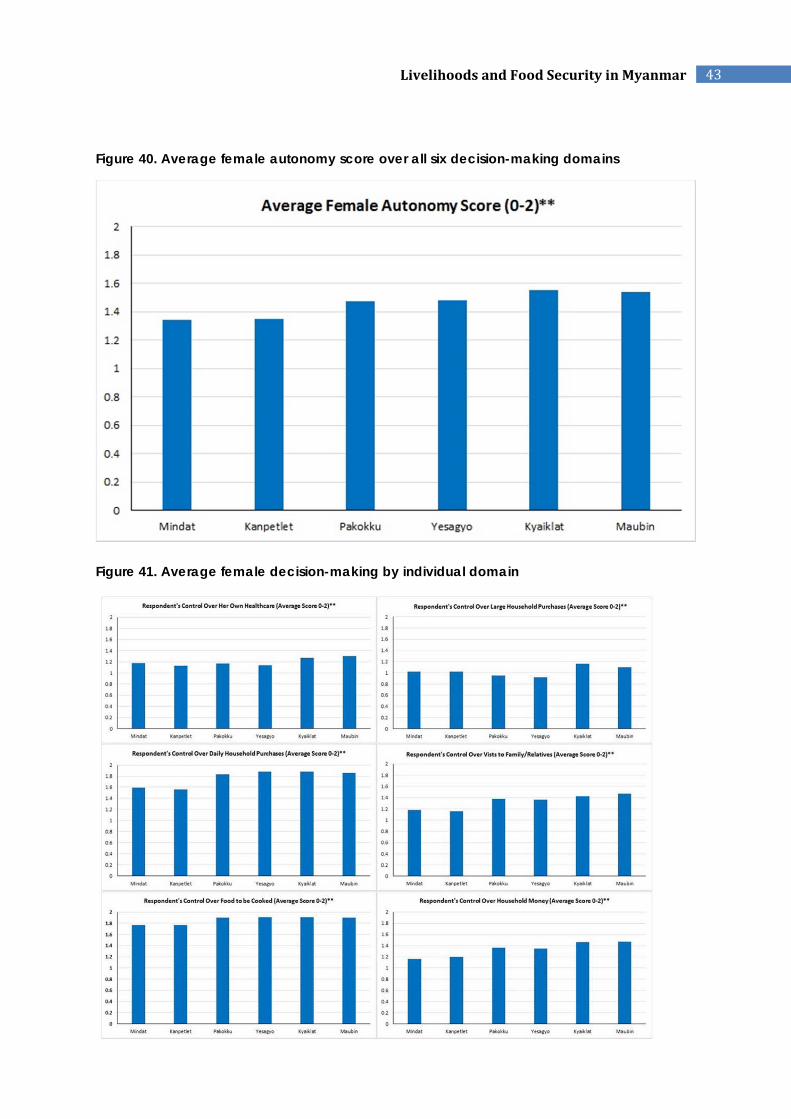
43LivelihoodsandFoodSecurityinMyanmar
Figure 40. Average female autonomy score over all six decision-making domains
Figure 41. Average female decision-making by individual domain
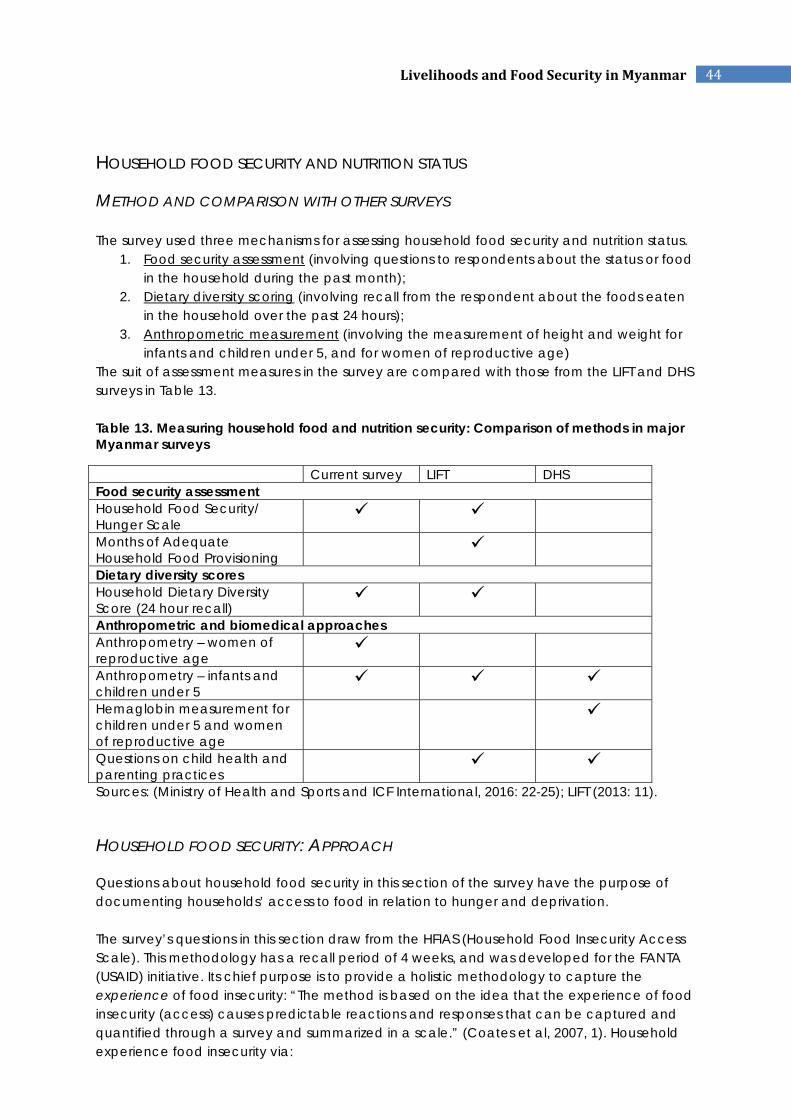
44LivelihoodsandFoodSecurityinMyanmar
HOUSEHOLD FOOD SECURITY AND NUTRITION STATUS
METHOD AND COMPARISON WITH OTHER SURVEYS The survey used three mechanisms for assessing household food security and nutrition status.
1. Food security assessment (involving questions to respondents about the status or food in the household during the past month);
2. Dietary diversity scoring (involving recall from the respondent about the foods eaten in the household over the past 24 hours);
3. Anthropometric measurement (involving the measurement of height and weight for infants and children under 5, and for women of reproductive age)
The suit of assessment measures in the survey are compared with those from the LIFT and DHS surveys in Table 13. Table 13. Measuring household food and nutrition security: Comparison of methods in major Myanmar surveys
Current survey LIFT DHS Food security assessment Household Food Security/ Hunger Scale
Months of Adequate Household Food Provisioning
Dietary diversity scores Household Dietary Diversity Score (24 hour recall)
Anthropometric and biomedical approaches Anthropometry – women of reproductive age
Anthropometry – infants and children under 5
Hemaglobin measurement for children under 5 and women of reproductive age
Questions on child health and parenting practices
Sources: (Ministry of Health and Sports and ICF International, 2016: 22-25); LIFT (2013: 11).
HOUSEHOLD FOOD SECURITY: APPROACH Questions about household food security in this section of the survey have the purpose of documenting households’ access to food in relation to hunger and deprivation. The survey’s questions in this section draw from the HFIAS (Household Food Insecurity Access Scale). This methodology has a recall period of 4 weeks, and was developed for the FANTA (USAID) initiative. Its chief purpose is to provide a holistic methodology to capture the experience of food insecurity: “The method is based on the idea that the experience of food insecurity (access) causes predictable reactions and responses that can be captured and quantified through a survey and summarized in a scale.” (Coates et al, 2007, 1). Household experience food insecurity via:
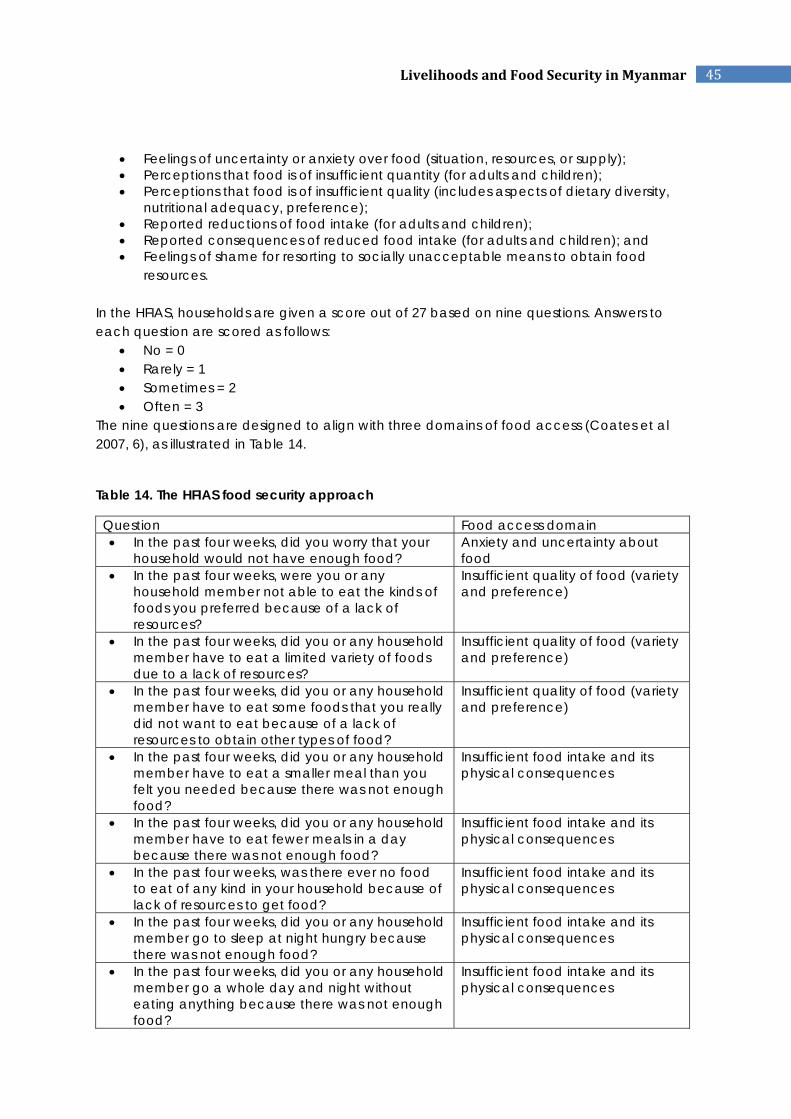
45LivelihoodsandFoodSecurityinMyanmar
Feelings of uncertainty or anxiety over food (situation, resources, or supply); Perceptions that food is of insufficient quantity (for adults and children); Perceptions that food is of insufficient quality (includes aspects of dietary diversity,
nutritional adequacy, preference); Reported reductions of food intake (for adults and children); Reported consequences of reduced food intake (for adults and children); and Feelings of shame for resorting to socially unacceptable means to obtain food
resources. In the HFIAS, households are given a score out of 27 based on nine questions. Answers to each question are scored as follows:
No = 0 Rarely = 1 Sometimes = 2 Often = 3
The nine questions are designed to align with three domains of food access (Coates et al 2007, 6), as illustrated in Table 14.
Table 14. The HFIAS food security approach
Question Food access domain In the past four weeks, did you worry that your
household would not have enough food? Anxiety and uncertainty about food
In the past four weeks, were you or any household member not able to eat the kinds of foods you preferred because of a lack of resources?
Insufficient quality of food (variety and preference)
In the past four weeks, did you or any household member have to eat a limited variety of foods due to a lack of resources?
Insufficient quality of food (variety and preference)
In the past four weeks, did you or any household member have to eat some foods that you really did not want to eat because of a lack of resources to obtain other types of food?
Insufficient quality of food (variety and preference)
In the past four weeks, did you or any household member have to eat a smaller meal than you felt you needed because there was not enough food?
Insufficient food intake and its physical consequences
In the past four weeks, did you or any household member have to eat fewer meals in a day because there was not enough food?
Insufficient food intake and its physical consequences
In the past four weeks, was there ever no food to eat of any kind in your household because of lack of resources to get food?
Insufficient food intake and its physical consequences
In the past four weeks, did you or any household member go to sleep at night hungry because there was not enough food?
Insufficient food intake and its physical consequences
In the past four weeks, did you or any household member go a whole day and night without eating anything because there was not enough food?
Insufficient food intake and its physical consequences
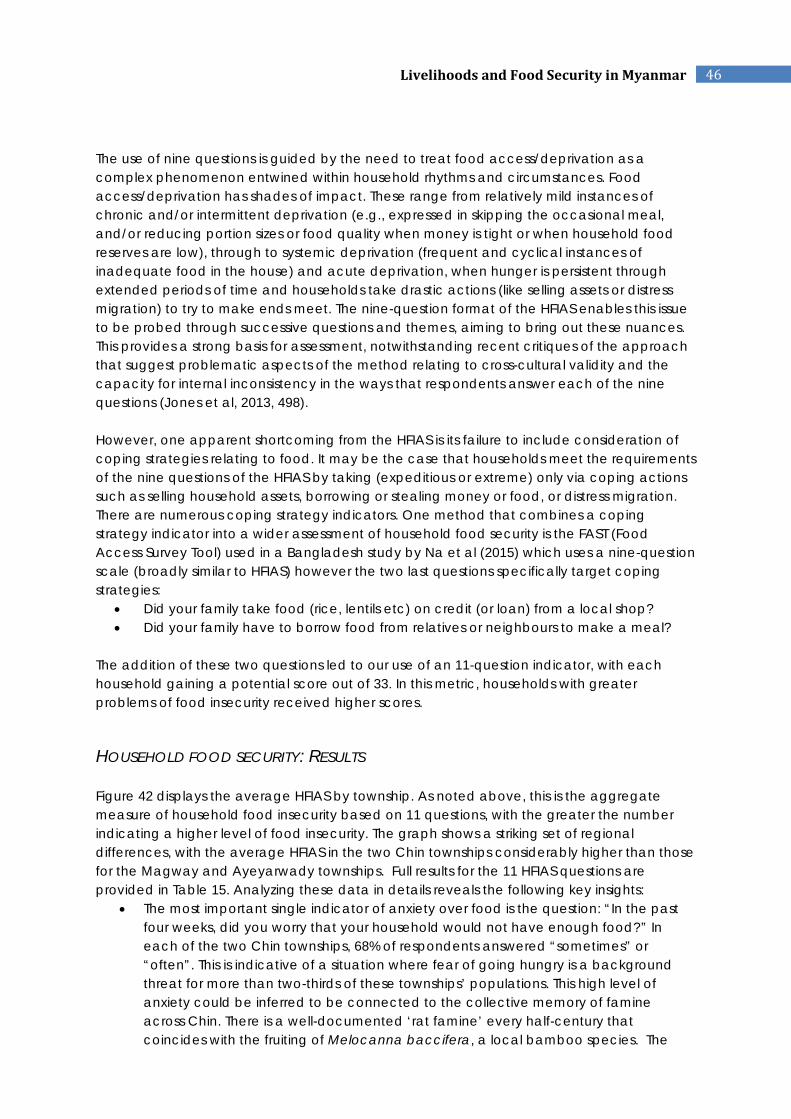
46LivelihoodsandFoodSecurityinMyanmar
The use of nine questions is guided by the need to treat food access/deprivation as a complex phenomenon entwined within household rhythms and circumstances. Food access/deprivation has shades of impact. These range from relatively mild instances of chronic and/or intermittent deprivation (e.g., expressed in skipping the occasional meal, and/or reducing portion sizes or food quality when money is tight or when household food reserves are low), through to systemic deprivation (frequent and cyclical instances of inadequate food in the house) and acute deprivation, when hunger is persistent through extended periods of time and households take drastic actions (like selling assets or distress migration) to try to make ends meet. The nine-question format of the HFIAS enables this issue to be probed through successive questions and themes, aiming to bring out these nuances. This provides a strong basis for assessment, notwithstanding recent critiques of the approach that suggest problematic aspects of the method relating to cross-cultural validity and the capacity for internal inconsistency in the ways that respondents answer each of the nine questions (Jones et al, 2013, 498). However, one apparent shortcoming from the HFIAS is its failure to include consideration of coping strategies relating to food. It may be the case that households meet the requirements of the nine questions of the HFIAS by taking (expeditious or extreme) only via coping actions such as selling household assets, borrowing or stealing money or food, or distress migration. There are numerous coping strategy indicators. One method that combines a coping strategy indicator into a wider assessment of household food security is the FAST (Food Access Survey Tool) used in a Bangladesh study by Na et al (2015) which uses a nine-question scale (broadly similar to HFIAS) however the two last questions specifically target coping strategies:
Did your family take food (rice, lentils etc) on credit (or loan) from a local shop? Did your family have to borrow food from relatives or neighbours to make a meal?
The addition of these two questions led to our use of an 11-question indicator, with each household gaining a potential score out of 33. In this metric, households with greater problems of food insecurity received higher scores.
HOUSEHOLD FOOD SECURITY: RESULTS Figure 42 displays the average HFIAS by township. As noted above, this is the aggregate measure of household food insecurity based on 11 questions, with the greater the number indicating a higher level of food insecurity. The graph shows a striking set of regional differences, with the average HFIAS in the two Chin townships considerably higher than those for the Magway and Ayeyarwady townships. Full results for the 11 HFIAS questions are provided in Table 15. Analyzing these data in details reveals the following key insights:
The most important single indicator of anxiety over food is the question: “In the past four weeks, did you worry that your household would not have enough food?” In each of the two Chin townships, 68% of respondents answered “sometimes” or “often”. This is indicative of a situation where fear of going hungry is a background threat for more than two-thirds of these townships’ populations. This high level of anxiety could be inferred to be connected to the collective memory of famine across Chin. There is a well-documented ‘rat famine’ every half-century that coincides with the fruiting of Melocanna baccifera, a local bamboo species. The
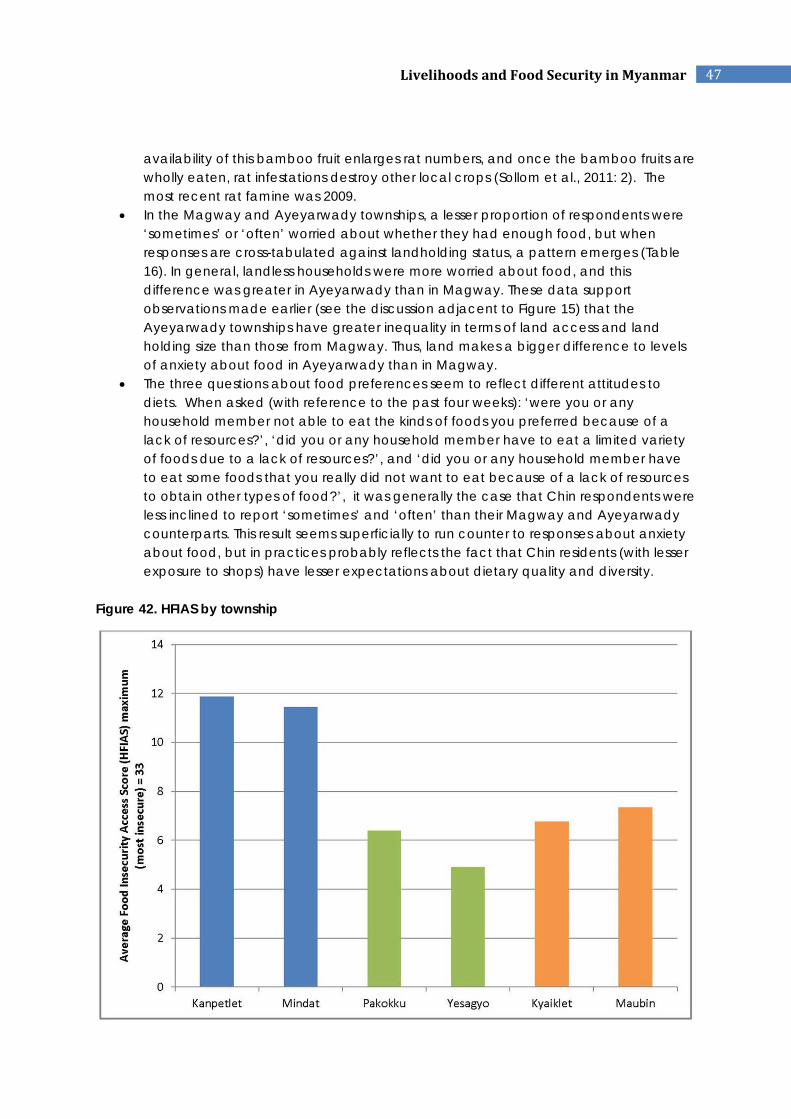
47LivelihoodsandFoodSecurityinMyanmar
availability of this bamboo fruit enlarges rat numbers, and once the bamboo fruits are wholly eaten, rat infestations destroy other local crops (Sollom et al., 2011: 2). The most recent rat famine was 2009.
In the Magway and Ayeyarwady townships, a lesser proportion of respondents were ‘sometimes’ or ‘often’ worried about whether they had enough food, but when responses are cross-tabulated against landholding status, a pattern emerges (Table 16). In general, landless households were more worried about food, and this difference was greater in Ayeyarwady than in Magway. These data support observations made earlier (see the discussion adjacent to Figure 15) that the Ayeyarwady townships have greater inequality in terms of land access and land holding size than those from Magway. Thus, land makes a bigger difference to levels of anxiety about food in Ayeyarwady than in Magway.
The three questions about food preferences seem to reflect different attitudes to diets. When asked (with reference to the past four weeks): ‘were you or any household member not able to eat the kinds of foods you preferred because of a lack of resources?’, ‘did you or any household member have to eat a limited variety of foods due to a lack of resources?’, and ‘did you or any household member have to eat some foods that you really did not want to eat because of a lack of resources to obtain other types of food?’, it was generally the case that Chin respondents were less inclined to report ‘sometimes’ and ‘often’ than their Magway and Ayeyarwady counterparts. This result seems superficially to run counter to responses about anxiety about food, but in practices probably reflects the fact that Chin residents (with lesser exposure to shops) have lesser expectations about dietary quality and diversity.
Figure 42. HFIAS by township
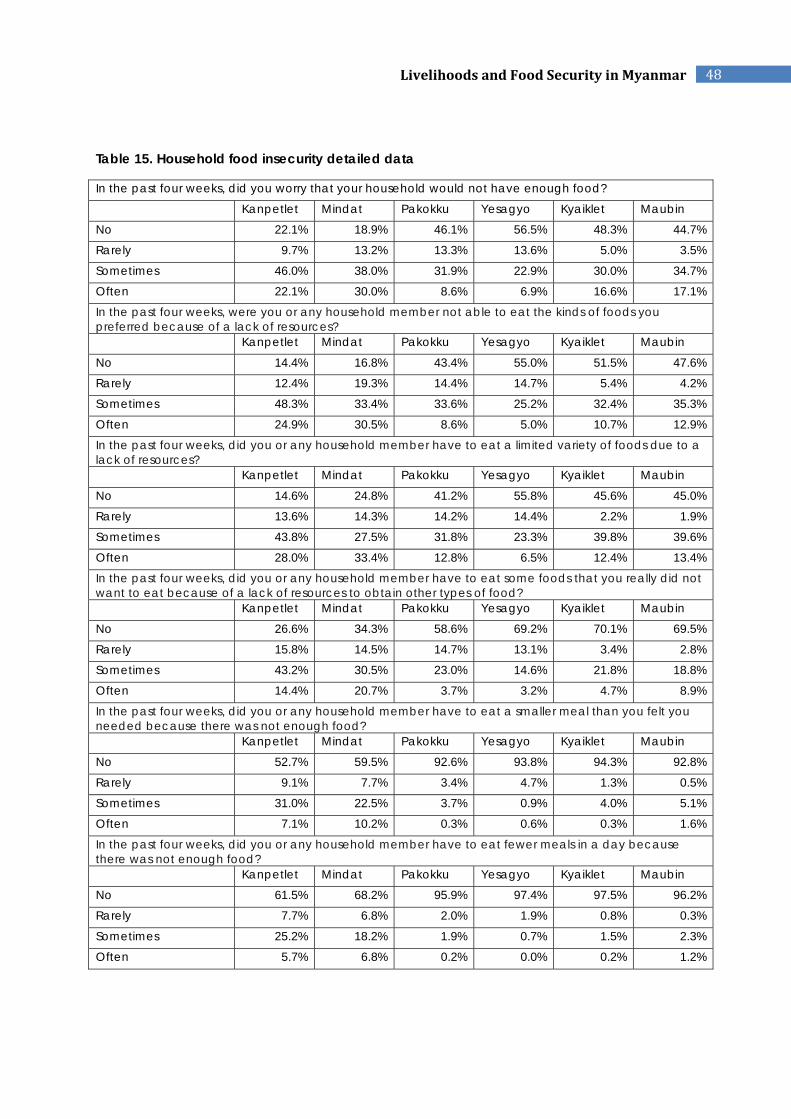
48LivelihoodsandFoodSecurityinMyanmar
Table 15. Household food insecurity detailed data
In the past four weeks, did you worry that your household would not have enough food?
Kanpetlet Mindat Pakokku Yesagyo Kyaiklet Maubin
No 22.1% 18.9% 46.1% 56.5% 48.3% 44.7%
Rarely 9.7% 13.2% 13.3% 13.6% 5.0% 3.5%
Sometimes 46.0% 38.0% 31.9% 22.9% 30.0% 34.7%
Often 22.1% 30.0% 8.6% 6.9% 16.6% 17.1%
In the past four weeks, were you or any household member not able to eat the kinds of foods you preferred because of a lack of resources? Kanpetlet Mindat Pakokku Yesagyo Kyaiklet Maubin
No 14.4% 16.8% 43.4% 55.0% 51.5% 47.6%
Rarely 12.4% 19.3% 14.4% 14.7% 5.4% 4.2%
Sometimes 48.3% 33.4% 33.6% 25.2% 32.4% 35.3%
Often 24.9% 30.5% 8.6% 5.0% 10.7% 12.9%
In the past four weeks, did you or any household member have to eat a limited variety of foods due to a lack of resources? Kanpetlet Mindat Pakokku Yesagyo Kyaiklet Maubin
No 14.6% 24.8% 41.2% 55.8% 45.6% 45.0%
Rarely 13.6% 14.3% 14.2% 14.4% 2.2% 1.9%
Sometimes 43.8% 27.5% 31.8% 23.3% 39.8% 39.6%
Often 28.0% 33.4% 12.8% 6.5% 12.4% 13.4%
In the past four weeks, did you or any household member have to eat some foods that you really did not want to eat because of a lack of resources to obtain other types of food? Kanpetlet Mindat Pakokku Yesagyo Kyaiklet Maubin
No 26.6% 34.3% 58.6% 69.2% 70.1% 69.5%
Rarely 15.8% 14.5% 14.7% 13.1% 3.4% 2.8%
Sometimes 43.2% 30.5% 23.0% 14.6% 21.8% 18.8%
Often 14.4% 20.7% 3.7% 3.2% 4.7% 8.9%
In the past four weeks, did you or any household member have to eat a smaller meal than you felt you needed because there was not enough food? Kanpetlet Mindat Pakokku Yesagyo Kyaiklet Maubin
No 52.7% 59.5% 92.6% 93.8% 94.3% 92.8%
Rarely 9.1% 7.7% 3.4% 4.7% 1.3% 0.5%
Sometimes 31.0% 22.5% 3.7% 0.9% 4.0% 5.1%
Often 7.1% 10.2% 0.3% 0.6% 0.3% 1.6%
In the past four weeks, did you or any household member have to eat fewer meals in a day because there was not enough food? Kanpetlet Mindat Pakokku Yesagyo Kyaiklet Maubin
No 61.5% 68.2% 95.9% 97.4% 97.5% 96.2%
Rarely 7.7% 6.8% 2.0% 1.9% 0.8% 0.3%
Sometimes 25.2% 18.2% 1.9% 0.7% 1.5% 2.3%
Often 5.7% 6.8% 0.2% 0.0% 0.2% 1.2%
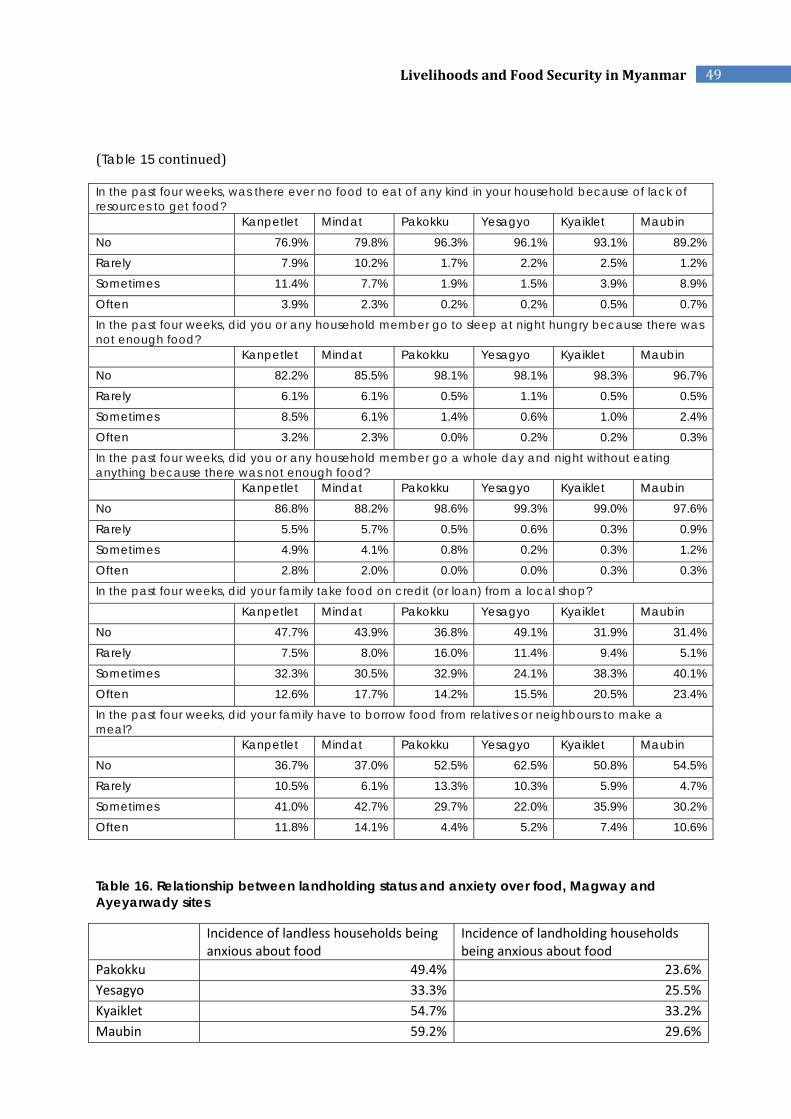
49LivelihoodsandFoodSecurityinMyanmar
(Table 15continued)
In the past four weeks, was there ever no food to eat of any kind in your household because of lack of resources to get food? Kanpetlet Mindat Pakokku Yesagyo Kyaiklet Maubin
No 76.9% 79.8% 96.3% 96.1% 93.1% 89.2%
Rarely 7.9% 10.2% 1.7% 2.2% 2.5% 1.2%
Sometimes 11.4% 7.7% 1.9% 1.5% 3.9% 8.9%
Often 3.9% 2.3% 0.2% 0.2% 0.5% 0.7%
In the past four weeks, did you or any household member go to sleep at night hungry because there was not enough food? Kanpetlet Mindat Pakokku Yesagyo Kyaiklet Maubin
No 82.2% 85.5% 98.1% 98.1% 98.3% 96.7%
Rarely 6.1% 6.1% 0.5% 1.1% 0.5% 0.5%
Sometimes 8.5% 6.1% 1.4% 0.6% 1.0% 2.4%
Often 3.2% 2.3% 0.0% 0.2% 0.2% 0.3%
In the past four weeks, did you or any household member go a whole day and night without eating anything because there was not enough food? Kanpetlet Mindat Pakokku Yesagyo Kyaiklet Maubin
No 86.8% 88.2% 98.6% 99.3% 99.0% 97.6%
Rarely 5.5% 5.7% 0.5% 0.6% 0.3% 0.9%
Sometimes 4.9% 4.1% 0.8% 0.2% 0.3% 1.2%
Often 2.8% 2.0% 0.0% 0.0% 0.3% 0.3%
In the past four weeks, did your family take food on credit (or loan) from a local shop?
Kanpetlet Mindat Pakokku Yesagyo Kyaiklet Maubin
No 47.7% 43.9% 36.8% 49.1% 31.9% 31.4%
Rarely 7.5% 8.0% 16.0% 11.4% 9.4% 5.1%
Sometimes 32.3% 30.5% 32.9% 24.1% 38.3% 40.1%
Often 12.6% 17.7% 14.2% 15.5% 20.5% 23.4%
In the past four weeks, did your family have to borrow food from relatives or neighbours to make a meal? Kanpetlet Mindat Pakokku Yesagyo Kyaiklet Maubin
No 36.7% 37.0% 52.5% 62.5% 50.8% 54.5%
Rarely 10.5% 6.1% 13.3% 10.3% 5.9% 4.7%
Sometimes 41.0% 42.7% 29.7% 22.0% 35.9% 30.2%
Often 11.8% 14.1% 4.4% 5.2% 7.4% 10.6%
Table 16. Relationship between landholding status and anxiety over food, Magway and Ayeyarwady sites
Incidence of landless households being anxious about food
Incidence of landholding households being anxious about food
Pakokku 49.4% 23.6%
Yesagyo 33.3% 25.5%
Kyaiklet 54.7% 33.2%
Maubin 59.2% 29.6%

50LivelihoodsandFoodSecurityinMyanmar
The HFIAS method asks three questions about food intake: ‘did you or any household member have to eat a smaller meal than you felt you needed because there was not enough food?’, ‘did you or any household member have to eat fewer meals in a day because there was not enough food?’ and ‘was there ever no food to eat of any kind in your household because of lack of resources to get food?’ Again, our results show clear differences between Chin townships on the one hand, and those from Magway and Ayeyarwady on the other. More than 90% of respondents in Magway and Ayeyarwady had not eaten smaller meals or had skipped meals (due to lack of resources) in the past month. In the two Chin townships however, this had been the experience of between 40-50% of respondents in the past month. When asked whether there was ‘no food to eat’ in respondents’ households in the past month, more than 98% of Yesagyo, Pakokku, and Kyaiklet answered ‘no’, but the proportion was less in Maubin, where 8.9% of respondents indicated that sometimes there was no food to eat. In the Chin townships, 20-25% of respondents indicated that there were occasions in the past month where there was no food to eat in the house.
Extreme lack of access to food, defined by the question: ‘In the past four weeks, did you or any household member go a whole day and night without eating anything because there was not enough food?’ was experienced by 2.8% of respondents’ households in Kanpetlet and 2.0% in Mindat. It was zero or negligible elsewhere.
The final two questions in our adapted HFIAS related to coping strategies about food. They indicate that approximately half of all respondents in the Chin townships didn’t take credit from a local shop to buy food, but between 60-70% borrowed food from neighbors of family members. This difference would seem to mainly reflect the relatively low incidence of the cash economy in rural Chin. Across the other townships, taking food on loan from local shops or borrowing from neighbors or family was widespread, and slightly more prevalent in the Ayeyarwady townships than in Magway.
There is considerable merit in comparing the results from our survey to those from LIFT (2013). The 2013 LIFT survey asked six questions explicitly about hunger and food security, and several additional questions about coping strategies. Responses to the food security and hunger questions (Table 17) would superficially suggest that problems of hunger are minimal in rural Myanmar. More than 98% of respondents indicated they had no problems of food access in the past month, and more than 90% did not have to reduce their meal portion sizes. Responses to the question of whether households changed their diets to cheaper foods suggest some degree of stress over food access, however as discussed above, interpreting this question is contingent on assumptions about households’ dietary preferences. In terms of coping strategies, between 40-60% of LIFT respondents indicated they took loans from shops or borrowed food from neighbors or family members. The fact that LIFT documented a considerably more food secure scenario than suggested by our survey begs enquiry. Two factors would seem relevant to interpreting the differences. First, the sampling method used by LIFT, as noted previously, may have led to more positive results being measured, as a portion of villages were selected on the basis as having LIFT interventions. Second, LIFT used a truncated question-set about these issues compared to the one used on our survey, which picked up more dimensions and detail.
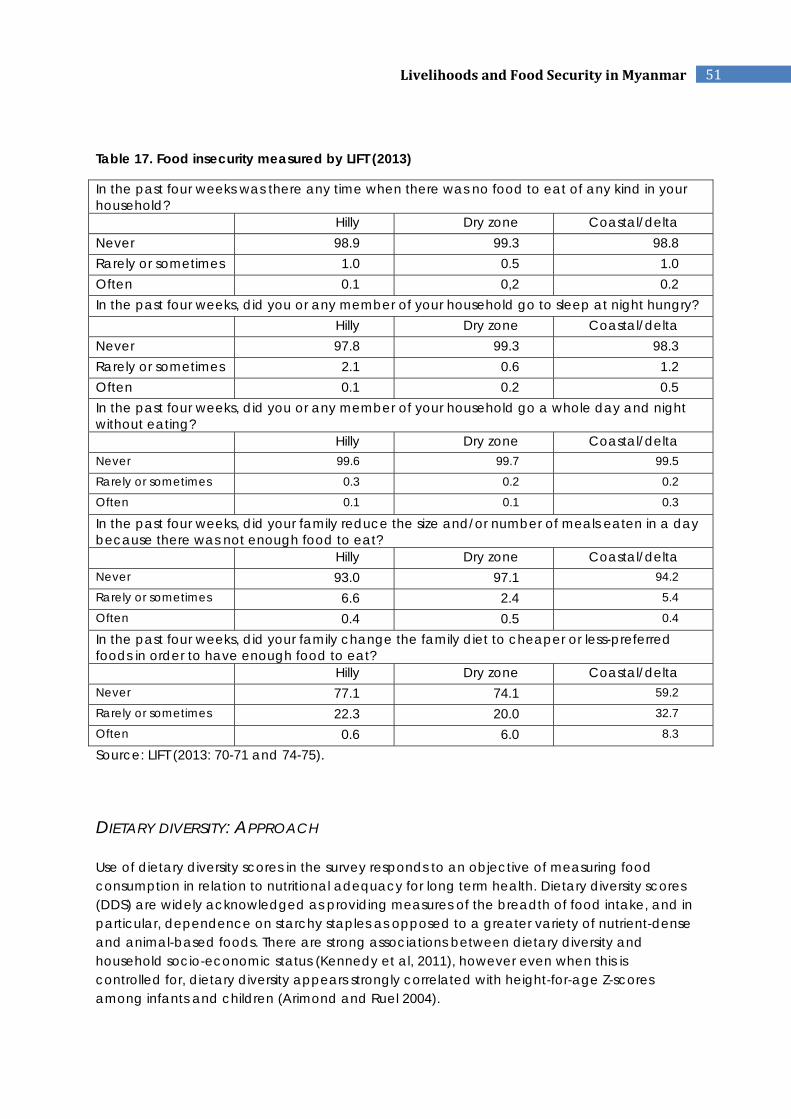
51LivelihoodsandFoodSecurityinMyanmar
Table 17. Food insecurity measured by LIFT (2013)
In the past four weeks was there any time when there was no food to eat of any kind in your household? Hilly Dry zone Coastal/delta Never 98.9 99.3 98.8 Rarely or sometimes 1.0 0.5 1.0 Often 0.1 0,2 0.2 In the past four weeks, did you or any member of your household go to sleep at night hungry? Hilly Dry zone Coastal/delta Never 97.8 99.3 98.3 Rarely or sometimes 2.1 0.6 1.2 Often 0.1 0.2 0.5 In the past four weeks, did you or any member of your household go a whole day and night without eating? Hilly Dry zone Coastal/delta Never 99.6 99.7 99.5
Rarely or sometimes 0.3 0.2 0.2
Often 0.1 0.1 0.3
In the past four weeks, did your family reduce the size and/or number of meals eaten in a day because there was not enough food to eat? Hilly Dry zone Coastal/delta Never 93.0 97.1 94.2
Rarely or sometimes 6.6 2.4 5.4
Often 0.4 0.5 0.4
In the past four weeks, did your family change the family diet to cheaper or less-preferred foods in order to have enough food to eat? Hilly Dry zone Coastal/delta Never 77.1 74.1 59.2
Rarely or sometimes 22.3 20.0 32.7
Often 0.6 6.0 8.3
Source: LIFT (2013: 70-71 and 74-75).
DIETARY DIVERSITY: APPROACH Use of dietary diversity scores in the survey responds to an objective of measuring food consumption in relation to nutritional adequacy for long term health. Dietary diversity scores (DDS) are widely acknowledged as providing measures of the breadth of food intake, and in particular, dependence on starchy staples as opposed to a greater variety of nutrient-dense and animal-based foods. There are strong associations between dietary diversity and household socio-economic status (Kennedy et al, 2011), however even when this is controlled for, dietary diversity appears strongly correlated with height-for-age Z-scores among infants and children (Arimond and Ruel 2004).
52LivelihoodsandFoodSecurityinMyanmar
The usual reference period for a DDS is the previous 24 hours. A FAO toolkit suggests that respondents are asked to describe all the food that was eaten over the past 24 hours (breakfast; snacks; lunch; snacks; dinner; snacks) and then the research team codes this information by way of 16 food groups (Kennedy et al 2011, 7-8). Multi-item meals are coded according to protocols developed by the FAO. We follow this approach for data capture. A key question in dietary diversity measurement is whether an individual or the household is the target of interest. Kennedy et al (2011, 9) set out the differences between household-scale and individual-scale DDS. If the chief source of interest is economic access to food, then the household is the appropriate target. The shortcomings of the household scale however, is that it does not inform researchers of the intra-household distribution of food, and poses methodological limitations in that one household respondent may not necessarily know what all household members ate the previous 24 hours. The merit of obtaining data on dietary diversity is to gain insight into the quality of diets, and in particular, the probably of micronutrient inadequacies. To this end, a more appropriate methodology is to use an individual as the target for dietary diversity, and in particular, an adult woman. The focus on women reflects both the need to take into account the gendering of food insecurity, and the fact that women have been shown to provide good proxies for household-level measurements of dietary diversity (Kennedy et al 2011, 9). Considerable work has gone into the question of measuring women’s dietary diversity in recent years, via the Women’s Dietary Diversity Project I (WDDP-I), 2005-10, and Women’s Dietary Diversity Project II (WDDP-II), 2010-2015, both associated with the FANTA initiative of USAID. In this study, the respondent will be the focus for our application of an individual-based DDS. At the conclusion of WDDP-I, Arimond et al (2010, 2061S) presented the merits of four different groups of dietary diversity indicators: a 6-food group indicator; a 9-food group indicator; a 13-food group indicator, and a 21-food group indicator. A conclusion from their analysis was that there was “a consistent and moderately strong relationship between very simple indicators of food group diversity and micronutrient adequacy of the diet for women of reproductive age in 5 resource-poor settings” (p.2065S). In other words, probability of identifying micronutrient adequacy/inadequacy was robust with fewer, rather than more, food group categories. This finding significantly influenced the development of the Minimum Dietary Diversity – Women (MDD-W) Score, in 2014. This is a 10-food group score, quite similar to the 9-food group score presented by Arimond et al (2010). The MDD-W score identifies a woman as potentially subject to micronutrient inadequacy if 5 out of 10 categories were not eaten in the previous 24 hours. The 10 food groups used in the MDD-W methodology, and applied in our survey, are listed in Table 18. By comparison, in the 2011 and 2013 LIFT surveys, a 14 food group methodology was applied (also in Table 18). Side-by-side comparison of these two methodologies highlights how the approach used in our survey classified dietary diversity in terms of nutritional categories, whereas the approach taken by LIFT classified food groups in a looser way based around prominent foods and eating habits. Accordingly, our survey is not directly comparable to the LIFT surveys.
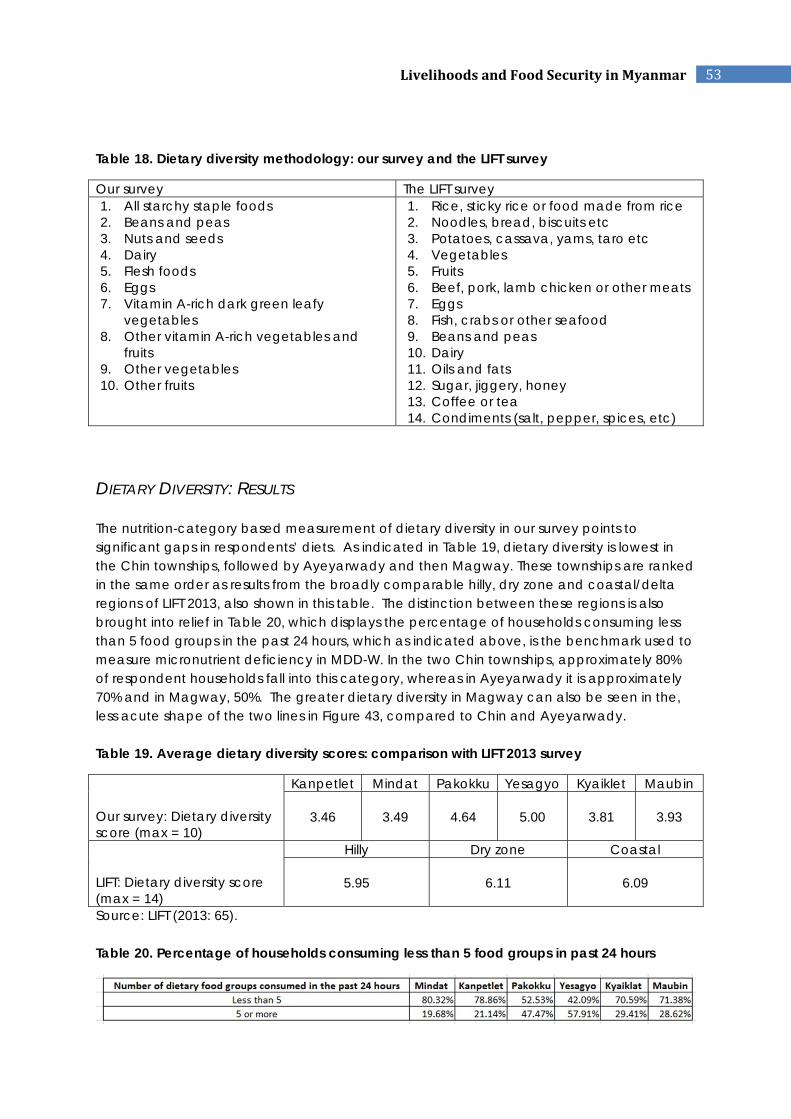
53LivelihoodsandFoodSecurityinMyanmar
Table 18. Dietary diversity methodology: our survey and the LIFT survey
Our survey The LIFT survey 1. All starchy staple foods 2. Beans and peas 3. Nuts and seeds 4. Dairy 5. Flesh foods 6. Eggs 7. Vitamin A-rich dark green leafy
vegetables 8. Other vitamin A-rich vegetables and
fruits 9. Other vegetables 10. Other fruits
1. Rice, sticky rice or food made from rice 2. Noodles, bread, biscuits etc 3. Potatoes, cassava, yams, taro etc 4. Vegetables 5. Fruits 6. Beef, pork, lamb chicken or other meats 7. Eggs 8. Fish, crabs or other seafood 9. Beans and peas 10. Dairy 11. Oils and fats 12. Sugar, jiggery, honey 13. Coffee or tea 14. Condiments (salt, pepper, spices, etc)
DIETARY DIVERSITY: RESULTS The nutrition-category based measurement of dietary diversity in our survey points to significant gaps in respondents’ diets. As indicated in Table 19, dietary diversity is lowest in the Chin townships, followed by Ayeyarwady and then Magway. These townships are ranked in the same order as results from the broadly comparable hilly, dry zone and coastal/delta regions of LIFT 2013, also shown in this table. The distinction between these regions is also brought into relief in Table 20, which displays the percentage of households consuming less than 5 food groups in the past 24 hours, which as indicated above, is the benchmark used to measure micronutrient deficiency in MDD-W. In the two Chin townships, approximately 80% of respondent households fall into this category, whereas in Ayeyarwady it is approximately 70% and in Magway, 50%. The greater dietary diversity in Magway can also be seen in the, less acute shape of the two lines in Figure 43, compared to Chin and Ayeyarwady. Table 19. Average dietary diversity scores: comparison with LIFT 2013 survey
Our survey: Dietary diversity score (max = 10)
Kanpetlet Mindat Pakokku Yesagyo Kyaiklet Maubin
3.46
3.49
4.64
5.00
3.81
3.93
LIFT: Dietary diversity score (max = 14)
Hilly Dry zone Coastal
5.95
6.11
6.09
Source: LIFT (2013: 65). Table 20. Percentage of households consuming less than 5 food groups in past 24 hours
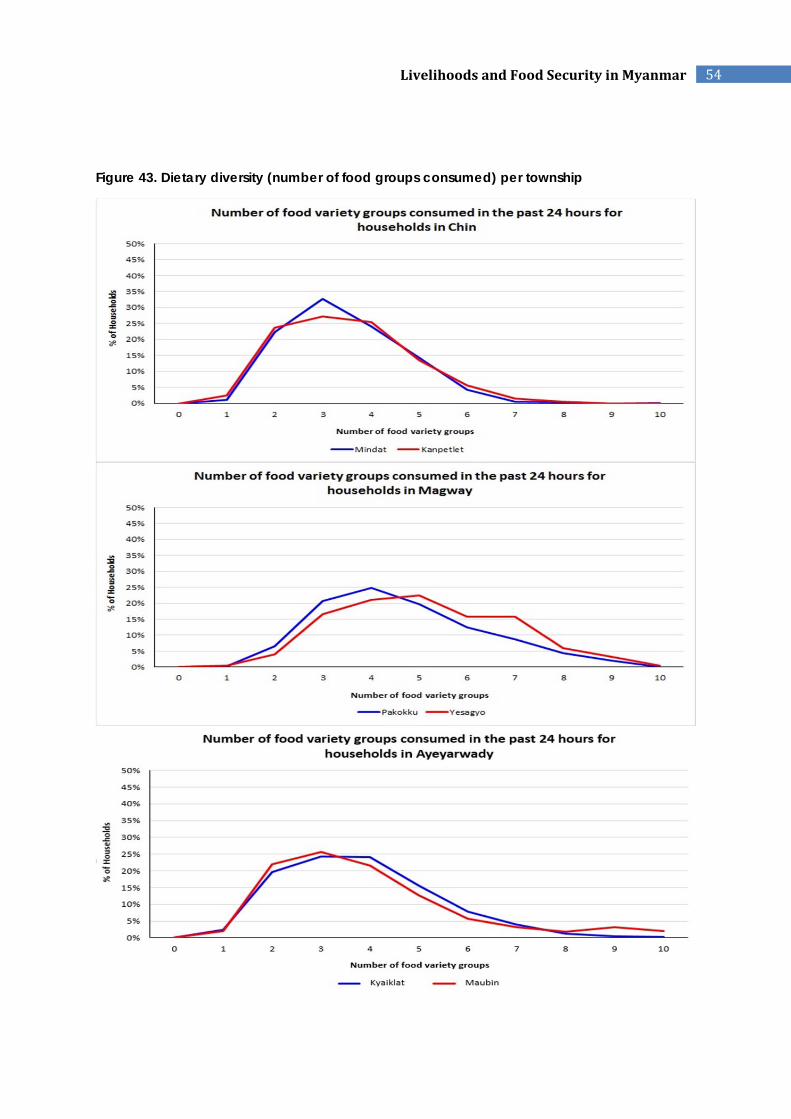
54LivelihoodsandFoodSecurityinMyanmar
Figure 43. Dietary diversity (number of food groups consumed) per township
55LivelihoodsandFoodSecurityinMyanmar
The specific food groups that constitute average levels of dietary diversity are illustrated in Figure 44 for each township. The first point to be made from these diagrams is the similarity of the shape of each of the two townships in each state/division. This patterning points to similar dietary cultures that pervade each study site. In the Chin townships, starchy staples (mainly rice) are eaten universally and almost 80% of respondent households had consumed dark leafy vegetables in the past 24 hours. Beyond this, diets were narrow. In particular, the relatively low intake of meat (flesh foods) is surprising, given the important cultural significance of meat within this tribally-based society. The somewhat more diverse diets of Magway respondent households are featured by a wider variety of vegetables, and more meat, compared to Chin. The results from Ayeyarwady are significant in their identification of the high level (approximately 80% of respondent households) of flesh food (mainly fish) consumption. Offsetting the effects of fish consumption for dietary diversity, however, is a low incidence of vegetables and fruit consumption.
ANTHROPOMETRY: APPROACH Height and weight was measured for all infants and children under 5 and women of child-bearing age (defined as aged from 15-49) that were present in surveyed households at the time of the survey. Of the 2,365 infants and children under 5 in surveyed households, we obtained height and weight assessments for 2,317 (97.9% of the total). There were 3,999 women of child-bearing age in surveyed households, and we obtained height and weight measurements for 3,412 (85.3% of the total). Consistent with international practice, we identify and distinguish three nutrition-related indicators deriving from anthropometric measurement:
Stunting (height-for-age). This is “a measure of linear growth. A child who is below minus two standard deviations from the reference median for height-for-age is considered short for his or her age, or stunted, a condition reflecting the cumulative effect of chronic malnutrition.”
Wasting (weight-for-height). This “describes current nutritional status. A child who is below minus two standard deviations from the reference median for weight-for-height is considered too thin for his or her height, or wasted, a condition reflecting acute or recent nutritional deficits.”
Underweight (weight-for-age). This is “a composite index of weight-for-height and height-for-age and thus does not distinguish between acute malnutrition (wasting) and chronic malnutrition (stunting). Children can be underweight for their age because they are stunted, wasted, or both. Weight-for-age is an overall indicator of a population’s nutritional health.” (Ministry of Health and Sports and ICF International, 2016: 21-23)
In the data that follows, moderate stunting/wasting/underweight is defined as any result that is between -2 to -3 standard deviations below reference norms, while severe stunting/ wasting/underweight is a result that is more than -3 standard deviations below reference norms.

56LivelihoodsandFoodSecurityinMyanmar
Figure 44. Food groups eaten in past 24 hours by respondent households
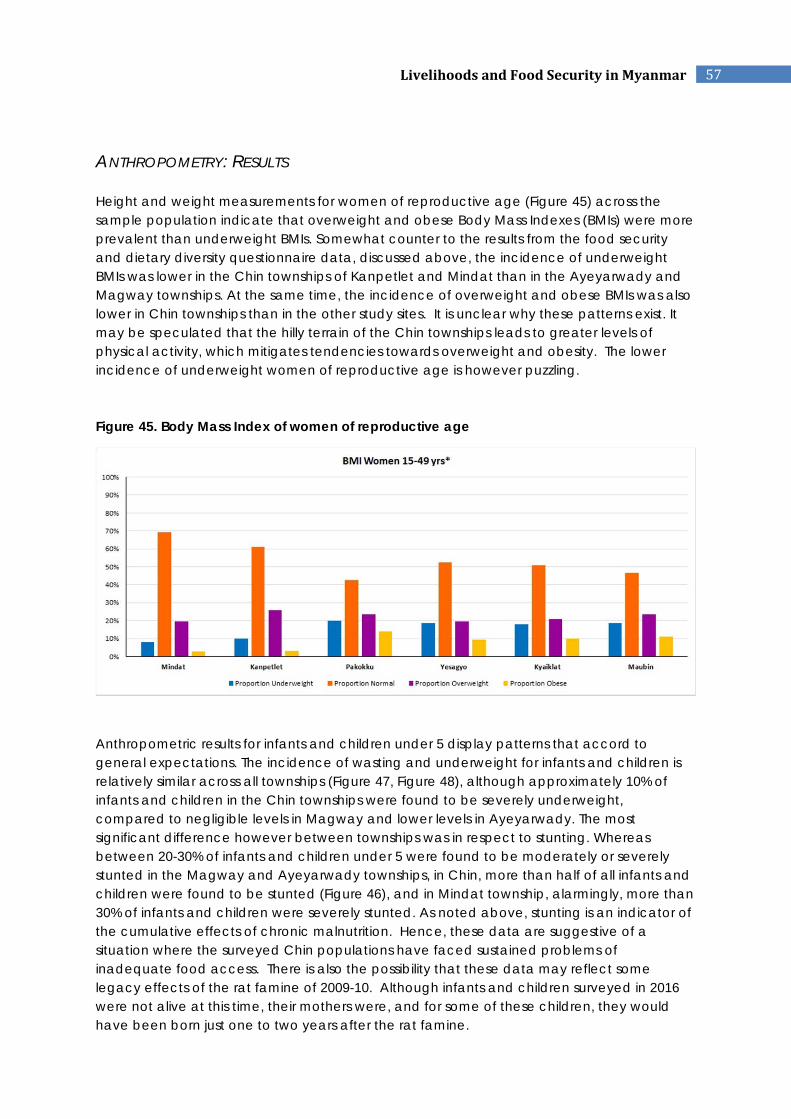
57LivelihoodsandFoodSecurityinMyanmar
ANTHROPOMETRY: RESULTS Height and weight measurements for women of reproductive age (Figure 45) across the sample population indicate that overweight and obese Body Mass Indexes (BMIs) were more prevalent than underweight BMIs. Somewhat counter to the results from the food security and dietary diversity questionnaire data, discussed above, the incidence of underweight BMIs was lower in the Chin townships of Kanpetlet and Mindat than in the Ayeyarwady and Magway townships. At the same time, the incidence of overweight and obese BMIs was also lower in Chin townships than in the other study sites. It is unclear why these patterns exist. It may be speculated that the hilly terrain of the Chin townships leads to greater levels of physical activity, which mitigates tendencies towards overweight and obesity. The lower incidence of underweight women of reproductive age is however puzzling. Figure 45. Body Mass Index of women of reproductive age
Anthropometric results for infants and children under 5 display patterns that accord to general expectations. The incidence of wasting and underweight for infants and children is relatively similar across all townships (Figure 47, Figure 48), although approximately 10% of infants and children in the Chin townships were found to be severely underweight, compared to negligible levels in Magway and lower levels in Ayeyarwady. The most significant difference however between townships was in respect to stunting. Whereas between 20-30% of infants and children under 5 were found to be moderately or severely stunted in the Magway and Ayeyarwady townships, in Chin, more than half of all infants and children were found to be stunted (Figure 46), and in Mindat township, alarmingly, more than 30% of infants and children were severely stunted. As noted above, stunting is an indicator of the cumulative effects of chronic malnutrition. Hence, these data are suggestive of a situation where the surveyed Chin populations have faced sustained problems of inadequate food access. There is also the possibility that these data may reflect some legacy effects of the rat famine of 2009-10. Although infants and children surveyed in 2016 were not alive at this time, their mothers were, and for some of these children, they would have been born just one to two years after the rat famine.
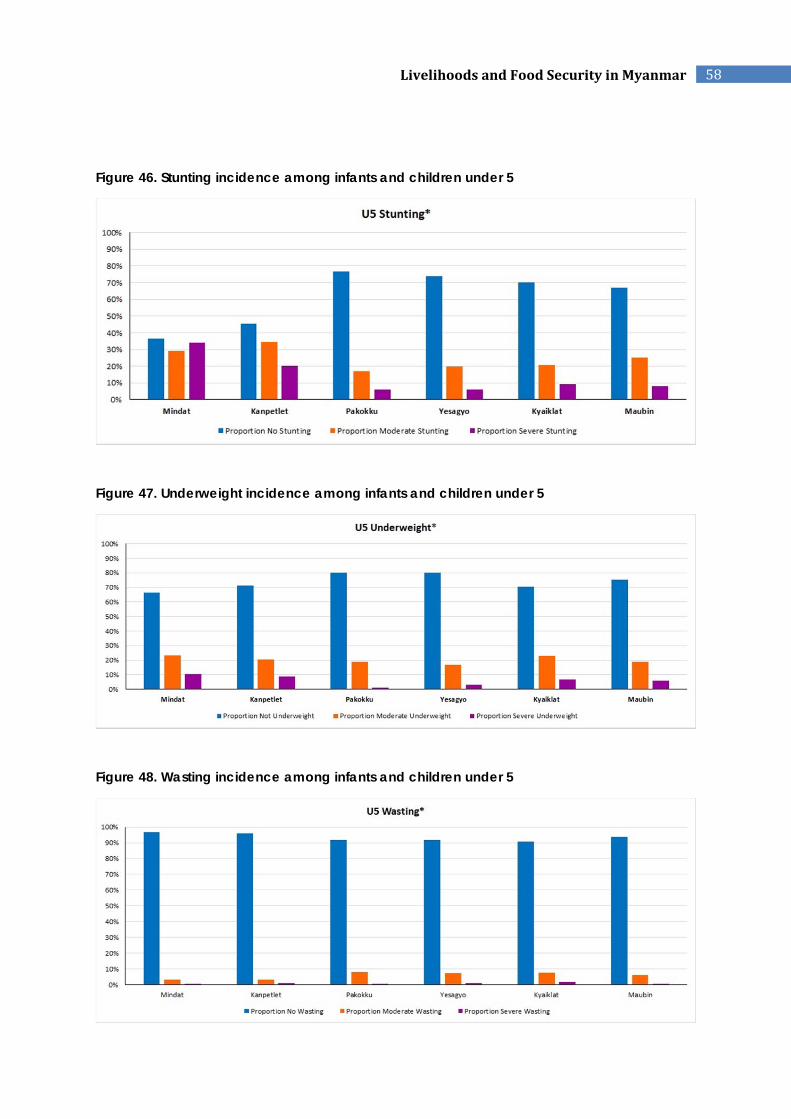
58LivelihoodsandFoodSecurityinMyanmar
Figure 46. Stunting incidence among infants and children under 5
Figure 47. Underweight incidence among infants and children under 5
Figure 48. Wasting incidence among infants and children under 5
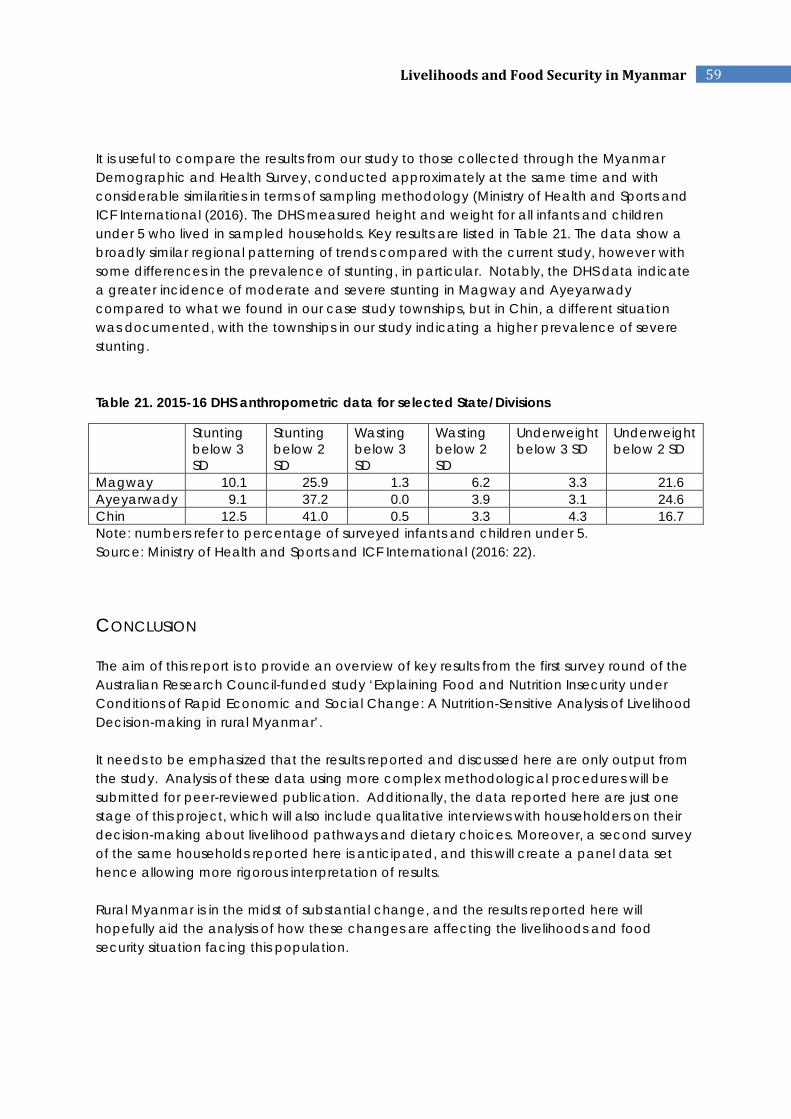
59LivelihoodsandFoodSecurityinMyanmar
It is useful to compare the results from our study to those collected through the Myanmar Demographic and Health Survey, conducted approximately at the same time and with considerable similarities in terms of sampling methodology (Ministry of Health and Sports and ICF International (2016). The DHS measured height and weight for all infants and children under 5 who lived in sampled households. Key results are listed in Table 21. The data show a broadly similar regional patterning of trends compared with the current study, however with some differences in the prevalence of stunting, in particular. Notably, the DHS data indicate a greater incidence of moderate and severe stunting in Magway and Ayeyarwady compared to what we found in our case study townships, but in Chin, a different situation was documented, with the townships in our study indicating a higher prevalence of severe stunting. Table 21. 2015-16 DHS anthropometric data for selected State/Divisions
Stunting below 3 SD
Stunting below 2 SD
Wasting below 3 SD
Wasting below 2 SD
Underweight below 3 SD
Underweight below 2 SD
Magway 10.1 25.9 1.3 6.2 3.3 21.6 Ayeyarwady 9.1 37.2 0.0 3.9 3.1 24.6 Chin 12.5 41.0 0.5 3.3 4.3 16.7 Note: numbers refer to percentage of surveyed infants and children under 5. Source: Ministry of Health and Sports and ICF International (2016: 22).
CONCLUSION The aim of this report is to provide an overview of key results from the first survey round of the Australian Research Council-funded study ‘Explaining Food and Nutrition Insecurity under Conditions of Rapid Economic and Social Change: A Nutrition-Sensitive Analysis of Livelihood Decision-making in rural Myanmar’. It needs to be emphasized that the results reported and discussed here are only output from the study. Analysis of these data using more complex methodological procedures will be submitted for peer-reviewed publication. Additionally, the data reported here are just one stage of this project, which will also include qualitative interviews with householders on their decision-making about livelihood pathways and dietary choices. Moreover, a second survey of the same households reported here is anticipated, and this will create a panel data set hence allowing more rigorous interpretation of results. Rural Myanmar is in the midst of substantial change, and the results reported here will hopefully aid the analysis of how these changes are affecting the livelihoods and food security situation facing this population.
60LivelihoodsandFoodSecurityinMyanmar
REFERENCES
Arimond et al. 2010. “Simple food group diversity indicators predict micronutrient adequacy of women’s diets in 5 diverse, resource-poor settings.” Journal of Nutrition, 140(11):2059S–69S
Arimond, M. & Ruel, M.T. (2004) Dietary diversity is associated with child nutritional status: Evidence from 11 demographic and health surveys, Journal of Nutrition, 134, 2579-2585.
Centre for Economic and Social Development (CESD), International Food Policy Research Institute (IFPRI) and Michigan State University (MSU) (2016) Revitalized agriculture for balanced growth and resilient livelihoods: Toward a rural development strategy for Mon State, Food Security Policy Research Report, 6 (CESD/IFPRI & MSU, Yangon). https://mdricesd.files.wordpress.com/2016/08/report-fsp-mon-state-rural-dev-strategy-11-aug-2016.pdf (accessed 8 February 2017.)
Coates, J. Swindale, A. & Bilinsky, P. (2007) Household Food Insecurity Access Scale (HFIAS) for Measurement of Household Food Access: Indicator Guide (v. 3). Washington, D.C.: Food and Nutrition Technical Assistance Project, Academy for Educational Development. http://www.fao.org/fileadmin/user_upload/eufao-fsi4dm/doc-training/hfias.pdf
Department of Population, Government of Myanmar (2014) The Population and Housing Census of Myanmar: Summary of Provisional Results. At: www.data.unhcr.org/thailand/download.php?id=318 (accessed 30 January 2017).
Fanzo, J., Remans, R. & Termote, C. (2016) Smallholders, agro-biodiversity and mixed cropping and livestock systems, pp. 299-318 in: Pritchard, B., Ortiz, R. & Shekar, M. (eds) The Handbook of Food and Nutrition Security, Routledge, London.
FAO (2010) Guidelines for measuring Household and Individual dietary Diversity, FAO, Rome. ISBN 978-92-5-106749-9
FAO, WFP & IFAD (2012) The State of Food Insecurity in the World 2012. Economic Growth is Necessary but not Sufficient to Accelerate Reduction of Hunger and Malnutrition. Rome, FAO.
Gillespie, S., Harris, J. & Kadiyala, S. (2012) The agriculture-nutrition disconnect in India IFPRI Discussion Paper 001187.
Griffiths, M. & Soe, U.S.K.Z. (2012) Household Vulnerability Mapping: Tools to Increase the Effectiveness of CBR in Poverty Reduction, Social Policy and Poverty Research Group, Yangon.
Haider, B.A. & Bhutta, Z.A. (2008) Web Appendix 16 – Dietary diversification strategies including home gardening, livestock farming and dietary modifications, The Lancet, 371: 417–40.
Hutton, G., Rehfuess, E., & Tediosi, F. (2007) Evaluation of the costs and benefits of interventions to reduce indoor air pollution. Energy for Sustainable Development, 11(4), 34-43.
Jones, A.D., Ngure, F.M., Pelto, G. & Young, S.L. (2013) What are we assessing when we measure food security? A compendium and review of current metrics, Advances in Nutrition, 4, 481-505.
Kennedy, G., Ballard, T. & Dop, MC. (2011) Guidelines for measuring household and individual dietary diversity, FAO, Rome.
Kumar, B.M., and P.K.R. Nair. 2004. The enigma of tropical homegardens. Agroforestry Systems, 61: 135-152

61LivelihoodsandFoodSecurityinMyanmar
LIFT (Livelihoods and Food Security Trust Fund) (2013) Household Survey 2013, LIFT, Yangon. At: http://www.lift-fund.org/sites/lift-fund.org/files/publication/LIFT_HH_Survey_2013_0.pdf (accessed 31 January 2017).
LIFT (Livelihoods and Food Security Trust Fund) (2016) Qualitative Social and Economic Monitoring: Round 5 Report, LIFT, Yangon, At: http://www.lift-fund.org/sites/lift-fund.org/files/publication/QSEM%205%20%28English%29%20LOW%20RES%20FINAL.pdf (accessed 2 February 2017).
Mark, S.S. (2017) Fragmented sovereignty” over property institutions: Developmental impacts on the Chin Hills communities, Independent Journal of Burmese Scholarship, 1(1), 131-160.
Ministry of Health and Sports (MOHS) and ICF International (2016) Myanmar Demographic and Health Survey 2015-16: Key Indicators Report. Ministry of Health and Sports and ICF International Nay Pyi Taw, Myanmar, and Rockville, Maryland, USA. At: http://www.moh.gov.mm/file/MDHS%202015-16%20KIR.pdf (accessed 31 January 2017).
Na, M., Gross, A.L. & West, K.P. (2015) Validation of the food access survey tool to assess household food insecurity in rural Bangladesh, BMC Public Health 15:863 DOI 10.1186/s12889-015-2208-1
Prakash, R., Singh, A., Pathak, K. P. and Parasuraman, S. 2011. Early marriage, poor reproductive health status of mother and child well-being in India. Journal of Family Planning Reproductive Health Care, 37(3): 136-45.
Quisumbing, A.R. and Maluccio, J.A. 2003. Resources at marriage and intrahousehold allocation: Evidence from Bangladesh, Ethiopia, Indonesia, and South Africa. Oxford Bulletin of Economics and Statistics, 65:283–327.
Pritchard, B., Rammohan, A., Sekher, M., Parasuraman, S. & Choithani, C. (2013) Feeding India: Livelihoods, Entitlements and Capabilities, Earthscan, London.
Rammohan, A. (2016) Food and Nutrition Security within the household: Gender and access, pp. 368-78 in: Pritchard, B., Ortiz, R. & Shekar, M. (eds) The Handbook of Food and Nutrition Security, Routledge, London.
Save the Children, World Food Program, and Ministry of Livestock, Fisheries & Rural Development (2013) A Nutrition and Food Security Assessment of the Dry Zone of Myanmar, unpublished document provided to the authors, 16 February 2014.
Sollom R, Richards AK, Parmar P, Mullany LC, Lian SB, et al. (2011) Health and Human Rights in Chin State, Western Burma: A Population-Based Assessment Using Multistaged Household Cluster Sampling. PLoS Med 8(2): e1001007. doi:10.1371/journal.pmed.1001007
Win, M.T. and Thinzar, A.M. (2016) Agricultural mechanization and structural transformation in Myanmar’s Ayeyarwady delta, Food Security Policy Research Highlights, 2. www.fsg.afre.msu.edu/fsp/burma/Research_highlight_2.pdf (Accessed 3 February 2017).
WHO/UNICEF (2015) Water Supply Statistics (online database) https://knoema.com/WHOWSS2014/who-unicef-water-supply-statistics-2015?location=1001540-myanmar (Accessed 6 February 2017).
WHO/UNICEF (2017) Access to water and sanitation: A few definitions, https://www.unicef.org/wcaro/overview_2570.html (Accessed 6 February 2017).
UN-Water (2014) Myanmar – Global Analysis and Assessment of Sanitation and Drinking Water, WHO & UN-Water, Geneva. http://www.who.int/water_sanitation_health/monitoring/investments/myanmar-10-nov.pdf (Accessed 6 February 2017).