live stock to 2020
TRANSCRIPT

Food, Ag ri cul ture,and the En vi ron mentDis cus sion Pa per 28
Live stock to 2020The Next FoodRevolution
Chris to pher Del gadoMark RosegrantHen ning Ste in feldSimeon EhuiClaude Cour bois
IN TERNATIONALFOODPOL ICYRESEARCHINSTI TUTE
FOOD ANDAG RI CUL TUREOR GANI ZA TIONOF THEUNITED NA TIONS
IN TER NA TIONALLIVE STOCKRE SEARCHIN STI TUTE

“A 2020 Vi sion for Food, Ag ri cul ture, and the En vi ron ment” is an ini tia tive of theIn ter na tional Food Pol icy Re search In sti tute (IFPRI) to de velop a shared vi sion anda con sen sus for ac tion on how to meet fu ture world food needs while re duc ing pov -erty and pro tect ing the en vi ron ment. It grew out of a con cern that the in ter na tionalcom mu nity is set ting pri ori ties for ad dress ing these prob lems based on in com pletein for ma tion. Through the 2020 Vi sion ini tia tive, IFPRI is bring ing to gether di ver -gent schools of thought on these is sues, gen er at ing re search, and iden ti fy ing rec om -men da tions.
This dis cus sion pa per se ries pres ents tech ni cal re search re sults that en com pass awide range of sub jects drawn from re search on policy- relevant as pects of ag ri cul -ture, pov erty, nu tri tion, and the en vi ron ment. The dis cus sion pa pers con tain ma te rial that IFPRI be lieves is of key in ter est to those in volved in ad dress ing emerg ing foodand de vel op ment prob lems. The views ex pressed in the pa pers are those of theauthors, and not nec es sar ily en dorsed by IFPRI. These dis cus sion pa pers un dergore view but typi cally do not pres ent fi nal re search re sults and should be con sid ered as works in prog ress.

Food, Ag ri cul ture, and the En vi ron ment Dis cus sion Pa per 28
Live stock to 2020The Next Food
Revolution
Chris to pher Del gadoMark Rosegrant
Hen ning Ste in feldSimeon Ehui
Claude Cour bois
In ter na tional Food Pol icy Re search In sti tute2033 K Street, N.W., Wash ing ton, D.C. 20006- 1002 U.S.A.
Food and Agriculture Organization of the United NationsViale delle Terme di Caracalla, 00100 Rome, Italy
International Livestock Research InstituteP.O. Box 30709, Nairobi, Kenya
May 1999

Copyright 1999 In ter na tio nal Food Po licyRe search Ins ti tu te
All rights re ser ved. Sec tions of this re port may bere pro du ced without the ex press per mis sion of butwith ackno wledg ment to the In ter na tio nal FoodPo licy Re search Ins ti tu te.
ISBN 0- 89629-632-6

iii
Con tents
Fore word vii
Acknowledgments viii
1. The Live stock Revo lu tion 1
2. Re cent Trans for ma tion of Live stock Food De mand 5
3. Ac com pa ny ing Trans for ma tion of Live stock Sup ply 13
4. Pro jec tions of Future De mand and Sup ply to 2020 21
5. Im pli ca tions of the Live stock Revo lu tion for World Trade and Food Prices 31
6. Nu tri tion, Food Se cu rity, and Pov erty Al le via tion 37
7. En vi ron men tal Sus tain abil ity 44
8. Pub lic Health 49
9. Tech no logy Needs and Prospects 52
10. Tak ing Stock and Mov ing For ward 59
Ap pen dix: Re gional Clas si fi ca tion of Coun tries Used in this Paper 66
Ref er ences 67

iv
Ta bles
1. In crease in food con sump tion of meat, milk, fish, and major ce re als, 1971–95 2
2. Per cap ita meat and milk con sump tion by re gion, 1983 and 1993 6
3. Per cent of calo ries and pro tein from ani mal prod ucts, 1983 and 1993 6
4. Past popu la tion, urban popu la tion, and GNP per cap ita growth rates 7
5. An nual per cap ita con sump tion of se lected live stock foor prod ucts and per centof total calo ries con sumed from each prod uct, 1973 and 1993 9
6. Con sump tion of meat and milk by re gion, 1982–94 9
7. Trends in the food con sump tion of vari ous live stock prod ucts, 1982–94 10
8. De mand elas tici ties for major food prod ucts of ani mal ori gin from across- country, sys tems es ti ma tion, 1970–95, de vel op ing re gions 11
9. Pro duc tion trends of vari ous live stock prod ucts, 1982–94 13
10. Trends in the pro duc tion of meat and milk, by re gion, 1982–94 14
11. Shares of total world pro duc tion of meat and milk, by re gion, 1983 and 1993 14
12. Dis tri bu tion of the world’s live stock ani mals, 1983 and 1993 15
13. Growth rates of live stock out put and number of ani mals slaugh tered or milked,1982–94 16
14. Pro duc tiv ity by re gion and ani mal type, 1992–94, and pro duc tiv ity growth rate,1982–94 17
15. Trends in the use of ce real as feed, 1982–94 20
16. Pro jected trends in the food con sump tion of vari ous live stock prod ucts,1993–2020 24
17. Pro jected trends in meat and milk con sump tion, 1993–2020 24
18. Pro jected trends in meat and milk pro duc tion, 1993–2020 25
19. Pro jected trends in pro duc tion of vari ous live stock prod ucts, 1993–2020 26
20. Pro jected trends in use of ce re als as feed, 1993–2020 26
21. Changes in IM PACT’s base line as sump tions: a se vere Asian cri sis and highIn dian meat con sump tion 27
22. Dif fer ence be tween base line pro jec tions and pro jec tions of ag gre gatecon sump tion in 2020 due to changes in as sump tions about the Asian cri sisand In dian con sump tion 28
23. Dif fer ence be tween base line pro jec tions and pro jec tions of ag gre gatecon sump tion in 2020 due to changes in as sump tions about feed con ver sion 29
24. Net ex ports of vari ous live stock prod ucts in 1993 and 2020, baseline scenario 32

v
25. Dif fer ence be tween base line pro jec tions of net ex ports in 2020 and pro jec tionswith changes in as sump tions about the Asian cri sis and In dian con sump tion 32
26. Dif fer ence be tween base line pro jec tions of net ex ports in 2020 and pro jec tionswith changes in as sump tions about feed con ver sion ef fi ciency 34
27. Past trends in real prices of se lected crop, feed, and live stock prod ucts 34
28. Real prices of se lected crop and live stock prod ucts as pro jected bythe IM PACT model 35
29. The place of live stock in the in come of the rich and poor 40
Il lus tra tions1. Per cap ita con sump tion of meat and milk, de vel op ing and de vel oped
coun tries, 1983 and 1993 5
2. The re la tion ship be tween meat con sump tion and in come 6
3. Trends in the prices of major ce real and meat com modi ties, 1970–72 to 1994–96 8

vii
Fore word
The com bined per cap ita con sump tion of meat, eggs, and milk in devel op ing coun tries grew byabout 50 per cent from the early 1970s to the early 1990s. As incomes rise and cit ies swell, peo -ple in the devel op ing world are diver si fy ing their diets to include a vari ety of meats, eggs, anddairy prod ucts. This trend toward diver si fied eat ing hab its is likely to con tinue for some time tocome and it has led to con sid er able con tro versy about the risks and oppor tu ni ties involved.Some observ ers fear that greatly increased demand for feed grains will raise the price of cere alsto the poor. Oth ers are con cerned that higher con cen tra tion of live stock pro duc tion near cit iesadds to pol lu tion. Still oth ers worry about the pub lic health effects of increased con sump tion ofani mal fats and the rap idly increas ing inci dence of dis eases pass ing from ani mals to humans. On the other hand, many ana lysts point to the nutri tional bene fits of increased con sump tion of ani -mal prod ucts for popu la tions that are still largely defi cient in intake of pro tein and micro nu tri -ents. Fur ther more, live stock tra di tion ally have been an impor tant source of income for the ruralpoor in devel op ing coun tries. Finally, increased demand for live stock prod ucts may pro vide anengine for sus tain able inten si fi ca tion of small holder food and feed pro duc tion sys tems.
A team of research ers from the Inter na tional Food Pol icy Research Insti tute (IFPRI), the Food and Agri cul tural Organi za tion of the United Nations (FAO), and the Inter na tional Live stockResearch Insti tute (ILRI) col labo rated to pro duce this com pre hen sive and even- handed attempt atdefin ing the nature, extent, scope, and impli ca tions of what they term the “Live stock Revo lu tion”in devel op ing coun tries. Look ing for ward to 2020, they argue con vinc ingly that the struc turalshifts in world agri cul ture being brought about by shifts in developing- country demand for foodsof ani mal ori gin will con tinue and that increas ingly global mar kets have the abil ity to sup ply bothcereal and ani mal prod ucts in desired quan ti ties with out undue price rises. They empha size, how -ever, that pol icy deci sions taken for the live stock sec tor of devel op ing coun tries will deter minewhether the Live stock Revo lu tion helps or harms the world’s poor and mal nour ished. The reportempha sizes the impor tance of con tin ued invest ment in both research on and devel op ment of ani -mal and feed grain pro duc tion and proc ess ing, and the need for pol icy action to help small, poorlive stock pro duc ers become bet ter inte grated with com mer cial live stock mar ket ing and proc ess -ing. It details a host of require ments in the area of tech nol ogy devel op ment for pro duc tion andproc ess ing of live stock prod ucts, poten tial bene fits from new tech nolo gies, and criti cal pol icyissues for envi ron mental con ser va tion and pro tec tion of pub lic health.
Per Pinstrup- Andersen, Di rec tor Gen eralIn ter na tional Food Pol icy Re search In sti tute
Ab dou laye Sa wa dogo, As sis tant Director- General, Ag ri cul ture De part mentFood and Ag ri cul tural Or gani za tion of the United Na tions
Hank Fitz hugh, Di rec tor Gen eralInternational Livestock Research Institute

viii
Ac knowl edg ments
The ambi tious and mul ti dis ci plin ary topic of this paper hints at the extent to which the authorshad to rely on help from col leagues with a wide vari ety of dis ci pli nary and geo graphic exper -tise. They are too numer ous to men tion indi vidu ally, but sev eral col leagues stand out becauseof the degree of their sup port for this col labo ra tive proj ect and the depth of their insights onpre vi ous drafts. Per Pinstrup- Andersen and Rajul Pandya- Lorch, direc tor gen eral and head ofthe 2020 Vision ini tia tive, respec tively, of the Inter na tional Food Pol icy Research Insti tute(IFPRI), pro vided an insti tu tional frame work for the proj ect, con stant encour age ment, anddetailed and insight ful com ments through out the process. Abdou laye Sawa dogo, assis tantdirector- general of the Food and Agri cul ture Organi za tion of the United Nations (FAO),quickly rec og nized the value of this col labo ra tion, dis cussed issues with the team, and facili -tated the con di tions for effec tive FAO par tici pa tion. Hank Fitz hugh, direc tor gen eral of theInter na tional Live stock Research Insti tute (ILRI), con sis tently sought to inte grate ILRI’sbroad strengths with respect to live stock issues in devel op ing coun tries with our activi ties andfacili tated ILRI’s effec tive par tici pa tion.
A number of for mal and infor mal exter nal review ers of ear lier drafts of the report greatlyimproved the final prod uct. Par ticu lar men tion should be made of the very detailed and help ful com ments of Cees de Haan of the World Bank and Mag gie Gill of Natu ral Resources Inter na -tional (U.K.) in this regard. While the tech ni cal live stock pro duc tion aspects of this report,authored as it is by econo mists, proba bly still falls short of their high stan dards, there is nodoubt that they sub stan tially improved it over what it would have been oth er wise. Cath er ineGeissler of King’s Col lege, Lon don, helped improve the nutri tional insights of the report; theremain ing defi cien cies are entirely the respon si bil ity of the authors. The lat ter would also liketo express their thanks for very help ful writ ten com ments to Mercy Agcaoili- Sombilla of theInter na tional Rice Research Insti tute (IRRI), Jan Slin gen bergh of FAO, Steve Staal of ILRI,Clau dia Ringler of IFPRI, Bob Have ner of the World Food Prize Office, and Tjaart Schill hornVan Veen of the World Bank. Finally, they would like to commend Uday Mohan, an IFPRIedi tor, on his cheer ful and suc cess ful strug gle under time pres sure to turn our col lec tivelyauthored, care fully hedged prose into a read able final report.

1. The Live stock Revo lu tion
A revo lu tion is tak ing place in global agri cul turethat has pro found impli ca tions for our health, live -li hoods, and envi ron ment. Popu la tion growth,urbani za tion, and income growth in devel op ingcoun tries are fuel ing a mas sive global increase indemand for food of ani mal ori gin. The result ingdemand comes from changes in the diets of bil lions of peo ple and could pro vide income growth oppor -tu ni ties for many rural poor. It is not inap pro pri ateto use the term “Live stock Revo lu tion” to describethe course of these events in world agri cul ture over the next 20 years. Like the well- known GreenRevo lu tion, the label is a sim ple and con ven ientexpres sion that sum ma rizes a com plex series ofinter re lated processes and out comes in pro duc tion, con sump tion, and eco nomic growth. As in the case of cere als, the stakes for the poor in devel op ingcoun tries are enor mous. And not unlike the GreenRevo lu tion, the “revo lu tion ary” aspect comesfrom the par tici pa tion of devel op ing coun tries on a large scale in trans for ma tions that had pre vi ouslyoccurred mostly in the tem per ate zones of devel -oped coun tries. But the two revo lu tions dif fer inone fun da men tal respect: the Green Revo lu tionwas supply- driven, whereas the Live stock Revo lu -tion is driven by demand.
The Live stock Revo lu tion will stretch the ca pac -ity of ex ist ing pro duc tion and dis tri bu tion sys temsand ex ac er bate en vi ron mental and pub lic healthprob lems. Gov ern ments and in dus try must pre parefor this con tinu ing trans for ma tion with long- runpoli cies and in vest ments that will sat isfy con sumerde mand, im prove nu tri tion, di rect in come growthop por tu ni ties to those who need them most, and al le -vi ate en vi ron mental and pub lic health stress.
The 23 per cent of the world’s popu la tion liv ingin devel oped coun tries pres ently con sume three tofour times the meat and fish and five to six times the milk per cap ita as those in devel op ing coun tries1
(Del gado, Cour bois, and Rosegrant 1998). But mas -sive annual increases in the aggre gate con sump tionof ani mal prod ucts are occur ring in devel op ing coun -tries. From the early 1970s to the mid 1990s, con -sump tion of meat in devel op ing coun tries grew by70 mil lion met ric tons, whereas con sump tion indevel oped coun tries grew by only 26 mil lion met rictons (Table 1).2 In value and caloric terms, meat con -sump tion in devel op ing coun tries increased by morethan three times the increases in devel oped coun tries. Milk con sump tion in the devel op ing world increased by more than twice as much as milk consumption inthe devel oped world in terms of quan tity, moneyvalue, and calo ries.
Even more re veal ing is the com pari son be -tween developing- country in creases in meat, milk,and fish con sump tion dur ing the 1971–95 pe riodwith the in crease in ce real con sump tion (Table 1).The pe riod spans the well known Green Revo lu tion, when seed- fertilizer in no va tions in ce real pro duc -tion dra mati cally in creased wheat, rice, and maizeout put in de vel op ing coun tries, mak ing more foodavail able and in creas ing farm in comes. But dur ingthe same pe riod there was also a dra matic, if oftenover looked, rise in con sump tion of animal- originfood prod ucts in de vel op ing coun tries. On a quan -tity basis, the ad di tional meat, milk, and fish con -sumed be tween 1971 and 1995 in de vel op ing coun -tries was two- thirds as im por tant as the in crease inwheat, rice, and maize con sumed (Table 1). TheGreen Revo lu tion pro vided many more calo ries
1
1 Fish con sump tion and pro duc tion are also un der go ing revo lu tion ary changes, but this is out side the scope of the cur rent pa per. In -ter ested read ers are re ferred to Wil liams (1996) and Westlund (1995).2 All tons are met ric tons in this re port.

than the co in cid ing in crease in meat con sump tion,but the ad di tional meat con sumed was worth al most three times the in crease in ce real con sump tion atcon stant world prices.
Fur ther more, if the con sump tion pat terns indevel oped coun tries are an indi ca tion of wheredevel op ing coun tries are going, future growth incereal con sump tion as food is likely to be muchsmaller than that in meat. Dur ing 1971–95 addi -tional con sump tion of meat, milk, and fish in thedevel oped coun tries was much larger than that ofcereal in terms of weight and value. In devel op ingcoun tries many peo ple will soon be reach ing satia -tion in their con sump tion of cere als, while meat and milk con sump tion is likely to con tinue to grow even more robus tly into the next cen tury.
Not sur pris ingly, major trans for ma tions of the mag ni tude of the Live stock Revo lu tion are notwith out prob lems. Although domes ti cated ani -mals have been a source of human food, cloth ing,tools, trans por ta tion, and farm power since pre -his toric times, the cur rent rapid changes indemand for ani mal foods in devel op ing coun triesare put ting unprece dented stress on the resourcesused in live stock pro duc tion. The com bi na tion ofhigher demand, more peo ple, and less space israp idly lead ing to a global trans for ma tion of thelive stock sec tor, from one that mobi lizes sur plusand waste resources (back yard slops, remote pas -
tures, and grasses indi gesti ble by humans) to onethat actively seeks new resources for the pro duc -tion of ani mal food prod ucts (Ste in feld, de Haan,and Black burn 1997).
The recent rapid expan sion of live stock foodpro duc tion in devel op ing coun tries resulted pri -mar ily from increased num bers of ani mals ratherthan higher car cass weight per ani mal. In devel op -ing coun tries this has con trib uted to large con cen -tra tions of ani mals in urban envi ron ments wherethe regu la tory frame work gov ern ing live stockpro duc tion is weak (for exam ple, Addis Ababa,Bei jing, Lima, and Mum bai). Larger con cen tra -tions of ani mals have also led to deg ra da tion ofrural graz ing areas and the clear ing of for est.Grow ing con cen tra tions of ani mals and peo ple inthe major cit ies of devel op ing coun tries also leadto rapid increases in the inci dence of zoono tic dis -eases, such as sal mo nella, E-coli, and avian flu,which can only be dealt with through enforce ment of zon ing and health regu la tions.
Other pub lic health is sues raised by the Live -stock Revo lu tion are also of major im por tance. Thein ten si fi ca tion of live stock pro duc tion is lead ing inmany parts of the world to a build- up of pes ti cidesand an ti bi ot ics in the food chain. Fur ther more, asthe scale of out put in creases, es pe cially in the trop -ics, food safety risks from mi cro bial con tami na tionare be com ing more preva lent.
2
Table 1—In crease in food con sump tion of meat, milk, fish, and major ce re als, 1971–95
Con sump tion in crease Value of con sump tion in creaseaCa loric value of
con sump tion in crease
Com mod ity De vel oped De vel op ing De vel oped De vel op ing De vel oped De vel op ing
(mil lion met ric tons) (bil lion 1990 US$) (tril lion ki lo calo ries)
Meatb 26 70 37 124 38 172Milk 50 105 14 29 22 64Fishc 5 34 27 68 4 20Ma jor ce re alsd 25 335 3 65 82 1,064
Sources: The changes in quan ti ties and in calo ries are from FAO 1998. Money val ues are com puted for the dis ag gre gated com modi ties (shown inthe notes below) us ing the 1990–92 av er age price. The com mod ity prices used for beef, sheep and goat meat, pork, poul try, wheat, rice,and maize are de tailed in Ta ble 28. Dis ag gre gated fish prices are 1990–92 av er age im port unit val ues cal cu lated from FAO (1998) im portdata. Developed- country im port unit val ues are used for developed- country con sump tion and developing- country im port unit val ues areused for developing- country con sump tion.
Notes: Cal cu la tions rep re sent ag gre gate changes be tween three- year av er ages cen tered on 1971 and 1995.aCal cu lated us ing 1990 world prices ex pressed in con stant, av er age 1990–92 US$.bBeef, sheep and goat meat, pork, and poul try.cMa rine and fresh wa ter fin fish, cepha lo pods, crus ta ceans, mol luscs, and other ma rine fish.dWheat, rice, and maize used di rectly as hu man food.

Over con sump tion of ani mal food prod ucts raises an other con cern. A grow ing con scious ness of thedan gers of large amounts of satu rated ani mal fats indiets ex ists in most de vel oped coun tries. Some ex -perts have con cluded that poli cies should pre vent asimi lar over- consumption in de vel op ing coun tries by dis cour ag ing pub lic in vest ment in live stock pro duc -tion (Brown and Kane 1994; Geissler forth com ing;Good land 1997; Pi men tel 1997).
In creas ing live stock con sump tion may also af -fect ce real prices. Be cause ru mi nant live stock suchas cat tle, sheep, and goats con sume grain, andmonogas tric live stock such as pigs and poul try de -pend on grain in the in dus trial pro duc tion sys temsof de vel oped coun tries, some ana lysts argue that the high de mand for live stock prod ucts in de vel opedcoun tries and rap idly in creas ing de mand and pro -duc tion in de vel op ing coun tries de plete the grainavail able for di rect con sump tion by peo ple.
Live stock pro duc tion and con sump tion havepro po nents as well. Live stock pro duc tion is an especially im por tant source of in come for the ruralpoor in de vel op ing coun tries. It en ables poor andlandless farm ers to earn in come using pub lic,common- property re sources such as open range -land. Live stock con sume many crop by- productsthat would oth er wise be come waste, they often canbe raised on land that has no other sus tain able ag ri -cul tural use, and they can em ploy labor dur ing pe ri -ods of slack in other ag ri cul tural ac tivi ties. Poorwomen in par ticu lar often rely on the cash in comefrom a dairy cow or a few chick ens kept in thehouse hold. As live stock con sump tion in creasesthere is con sid er able in ter est in how the poor can retain their mar ket share of live stock production.
Live stock prod ucts are an ap peal ing and con -ven ient nu tri ent source. Pro tein and mi cro nu tri entde fi cien cies re main wide spread in de vel op ingcoun tries be cause peo ple sub sist on diets that are
al most en tirely made up of starchy sta ples. The addition of milk and meat pro vides pro tein, cal -cium, vi ta mins, and other nu tri ents that go lack ingin diets that are ex clu sively made up of sta plessuch as ce re als.
Be sides pro vid ing food, the driv ing force be -hind in creased live stock pro duc tion, live stock haveother valu able uses. Live stock re main the most im -por tant if not the sole form of non hu man poweravail able to poor farm ers in much of the de vel op ing world. The poor, in par ticu lar, use fer til izer fromlive stock op era tions, es pe cially when ris ing pe tro -leum prices make chemi cal fer til iz ers un af ford able. Live stock also store value and pro vide in sur ancefor peo ple who have no other fi nan cial mar ketsavail able to them. Skins, wool, oil, and other re -sources are used as in puts in other in dus tries.
This re port will ex am ine in de tail the in ter- relationships over time be tween sup ply and de -mand for live stock and feed grain, using IFPRI’sIM PACT model.3 It will in ves ti gate the plau si bil -ity of the pro jected de mand in creases for live stockprod ucts and the im pli ca tions of these in creasesfor world mar kets in feed, milk, and meat. Thepaper will argue that world grain mar kets cur rently have suf fi cient ca pac ity to han dle the ad di tionalde mand for feed com ing from in creas ing live stockpro duc tion, even under a va ri ety of dif fer ent sce -nar ios for tech no logi cal de vel op ment and globaleco nomic per form ance.
The paper will argue fur ther that the struc turalshift in developing- country diets to ward ani malpro teins is a given that must be dealt with. It will re -view the evi dence on the im pact of live stock prod -ucts on nu tri tion in de vel op ing coun tries and on thefood de mand and in come growth of the poor. Thein dus tri ali za tion of live stock pro duc tion in de vel -op ing coun tries can harm the wel fare of the poor ifother poli cies ar ti fi cially re duce the cost of in dus -
3
3 The model was de vel oped by Rosegrant and col leagues (Rosegrant, Agcaoili- Sombilla, and Perez 1995; Rosegrant et al. 1997;Rosegrant, Leach, and Ger pa cio 1998; and Rosegrant and Ringler 1998). It is global in na ture and bal ances sup ply and de mandwithin ag ri cul ture with market- clearing prices for ma jor ag ri cul tural com modi ties, in clud ing live stock prod ucts and feed. Start ingwith ex oge nously speci fied trends in na tional in comes for 37 coun try groups, the model traces food de mand, feed de mand, and sup -ply lev els for 18 com modi ties, it er at ing to market- clearing prices for ma jor com modi ties an nu ally through 2020. The re sults arebased on a large number of pa rame ter as sump tions taken from the lit era ture, in clud ing as sump tions about the open ness to trade. The model is use ful for il lus trat ing how demand- led shocks in Asia, for ex am ple, work them selves out in mar kets around theworld. It also il lus trates that in sys tems of in ter linked global mar kets for live stock prod ucts and feed, the net ef fect of price- mediatedpol icy in ter ven tions can be quite dif fer ent from what was en vis aged.

trial turn- key op era tions and oth er wise frus trate thepar tici pa tion of small farm ers. The paper will sug -gest that un der stand ing the op por tu ni ties and dan -gers of the Live stock Revo lu tion is criti cal to de -sign ing poli cies that pro mote the in cor po ra tion ofthe rural poor into eco nomi cally and en vi ron men -tally sus tain able growth pat terns.
The rapid in crease in de mand for live stockprod ucts in de vel op ing coun tries pres ents cru ciallyim por tant pol icy di lem mas that must be re solvedfor the well- being of both rural and urban peo ple inde vel op ing coun tries. These di lem mas in volvecom plex en vi ron mental and pub lic health is sues inthe con text of weak regu la tory en vi ron ments.Taken to gether, the many op por tu ni ties and dan gers of the Live stock Revo lu tion sug gest that it would be fool ish for de vel op ing coun tries to adopt a lais sezfaire pol icy for live stock de vel op ment. Many spe -cific rec om men da tions for con crete ac tion are given in chap ters ahead. The over all focus of the paper,how ever, is on the four broad pil lars on which tobase a de sir able live stock de vel op ment strat egy forde vel op ing coun tries. These are (1) re mov ing pol -icy dis tor tions that ar ti fi cially mag nify econo miesof scale in live stock pro duc tion; (2) build ing par -
tici pa tory in sti tu tions of col lec tive ac tion for small- scale farm ers that allow them to be ver ti cally in te -grated with live stock proc es sors and input sup- pliers; (3) cre at ing the en vi ron ment in which farm -ers will in crease in vest ment in ways to im provepro duc tiv ity in the live stock sec tor; and (4) pro mot -ing ef fec tive regu la tory in sti tu tions to deal with thethreat of en vi ron mental and health cri ses stem mingfrom live stock.
Tech no logi cal prog ress in the pro duc tion, proc -ess ing, and dis tri bu tion of live stock prod ucts willbe cen tral to the posi tive out come of the Live stockRevo lu tion. Rapid ad vances in feed im prove mentand ge netic and re pro duc tive tech nolo gies offerscope for over com ing many of the tech ni cal prob -lems posed by in creased live stock pro duc tion. In sti -tu tional and regu la tory de vel op ment will also becriti cal to se cur ing de sir able en vi ron mental andpub lic health out comes. In sum, the demand- drivenLive stock Revo lu tion is one of the larg est struc tural shifts to ever af fect food mar kets in de vel op ingcoun tries and how it is han dled is cru cial for fu turegrowth pros pects in de vel op ing coun try ag ri cul ture, for food se cu rity and the live li hoods of the ruralpoor, and for en vi ron mental sus tain abil ity.
4

2. Re cent Trans for ma tion of Live stockFood De mand
Per Cap ita Con sump tion
Pro gres sive eco nomic dif fer en tia tion be tweencoun tries over the last few cen tu ries, has led to asitua tion where peo ple in de vel oped coun triestypi cally con sume three to four times the meat andfive to six times the milk as do those in de vel op ingcoun tries (Fig ure 1). But this pat tern is chang ing.Peo ple in de vel op ing coun tries have in creasedtheir con sump tion of ani mal food prod ucts overthe past 20 years, and the fac tors driv ing those in -creases are ro bust and un likely to sub side in thenear fu ture.4 Be tween 1983 (av er age of 1982–84)and 1993 (av er age of 1992–94) per cap ita an nualmeat con sump tion rose from 14 to 21 kilo gramsand milk con sump tion grew from 35 to 40 kilo -grams. Dur ing the same pe riod per cap ita con -sump tion of meat in de vel oped coun tries rose only2 kilo grams and per cap ita milk con sump tion fell.
At the regional level, Asia wit nessed the mostdra matic increases in per cap ita con sump tion ofani mal food prod ucts. In China per cap ita con sump -tion of meat and milk dou bled between 1983 and1993 (Table 2). Per cap ita meat con sump tion alsoincreased in Other East Asia, South east Asia, andLatin Amer ica. Per cap ita milk con sump tionincreased in India, Other South Asia, and LatinAmer ica. In Sub- Saharan Africa and West Asia and North Africa (WANA) per cap ita con sump tionof meat and milk stag nated or declined (see theAppen dix for the regional clas si fi ca tion of coun -tries used in this paper).
The rela tive im por tance of ani mal food prod -ucts in the diets of peo ple in de vel op ing coun triesrose as well. Con sum ers ob tained a greater share ofcalo ries and pro tein from ani mal food prod ucts in1993 than in 1983 (Table 3). Through out Asia theshare of calo ries and pro tein com ing from ani malfood prod ucts in creased, al most dou bling in China,in di cat ing that many con sum ers are in creas ing con -
5
Fig ure 1—Per capita consumption of meat andmilk, developing and developedcountries, 1983 and 1993
4 Through out this pa per, “food” is used to dis tin guish di rect food con sump tion by hu mans from uses of ani mal prod ucts as feed, fuel,cos met ics, or cov er ings. Sta tis ti cal data in this pa per are taken from the FAO Sta tis ti cal Da ta base (FAO 1997, 1998), un less oth er -wise iden ti fied, and the world is clas si fied into nine coun tries or coun try ag gre gates, with de tails given in the Ap pen dix. The years1983 and 1993 in all ta bles and fig ures re fer to three- year mov ing av er ages cen tered on the years shown.

sump tion of ani mal food prod ucts more rap idlythan they are of other foods such as ce re als.
But there re mains a great dis par ity be tween theper cap ita ani mal food con sumed in de vel oped andde vel op ing coun tries. Na tional in come is a criti calde ter mi nant of this dis par ity. Fig ure 2 dis plays theposi tive, curved re la tion ship be tween na tional per
cap ita in come and per cap ita meat con sump tion.Within this trend cer tain coun tries dif fer en ti atethem selves for cul tural or other rea sons. China, forex am ple, lies above the trend, re flect ing the im por -tance of pork in Chi nese diets, and India lies belowthe trend be cause of re lig ious pref er ences againstmeat. At higher in comes, per cap ita con sump tion of meat lev els off be cause peo ple reach satu ra tion.This ex plains why de vel oped coun tries have hadmuch smaller in creases in per cap ita meat and milkcon sump tion over the past 20 years com pared to developing coun tries.
Coun tries at lower in come lev els are far fromreach ing the meat con sump tion sa tia tion point de -spite re cent in creases. In the first half of the 1990s,peo ple in de vel oped coun tries con sumed 76 kilo -grams of meat per cap ita per year as food, withhigher amounts in the United States and loweramounts in some of the Euro pean coun tries(Table 2). Milk con sump tion in de vel oped coun -tries was 192 kilo grams per cap ita. Peo ple in de vel -op ing coun tries con sumed on av er age 21 kilo gramsof meat and 40 kilo grams of milk.
In Latin Amer ica, peo ple con sume 46 kilo -grams of meat and 100 kilo grams of milk per cap ita, lev els that are much higher than else where in thedevel op ing world, though still about half thedeveloped- country aver age. Per cap ita meat con -sump tion in Other East Asia (44 kilo grams per cap-
6
Table 2—Per cap ita meat and milk con sump tionby re gion, 1983 and 1993
Meat Milk
Re gion 1983 1993 1983 1993
(kilo grams)China 16 33 3 7Other East Asia 22 44 15 16In dia 4 4 46 58Other South Asia 6 7 47 58South east Asia 11 15 10 11Latin Amer ica 40 46 93 100 WANA 20 20 86 62Sub- Saharan Af rica 10 9 32 23De vel op ing world 14 21 35 40De vel oped world 74 76 195 192 United States 107 118 237 253 World 30 34 76 75
Source: FAO 1997.Notes: Con sump tion re fers to di rect use as food, meas ured as un -
cooked weight, bone in. Meat in cludes beef, pork, mut ton,goat, and poul try. Each number is a three- year mov ing av er -age cen tered on the two years listed. Milk is cow and buf falomilk and milk prod ucts in liq uid milk equiva lents.WANA isWest Asia and North Af rica.
Table 3—Per cent of calo ries and pro tein fromani mal prod ucts, 1983 and 1993
Calo ries fromani mal prod ucts
Pro tein fromani mal prod ucts
Re gion 1983 1993 1983 1993
(per cent)China 8 15 14 28Other East Asia 11 15 29 38In dia 6 7 14 15Other South Asia 7 9 19 22South east Asia 6 8 23 25Latin Amer ica 17 18 42 46WANA 11 9 25 22Sub- Saharan Af rica 7 7 23 20De vel op ing world 9 11 21 26De vel oped world 28 27 57 56World 15 16 34 36
Source: FAO 1997.Notes: Each number is a three- year mov ing av er age cen tered on the
two years listed. Ani mal prod ucts, us ing the FAO defi ni tion,in clude meat, dairy, egg, and fresh wa ter and ma rine ani malprod ucts. WANA is West Asia and North Af rica.
Fig ure 2—The relationship between meatconsumption and income
Note: Each dot is an ob ser va tion for 1 of 78 de vel op ing and de vel opedcoun tries ex am ined. The solid line is a sta tis ti cally sig nifi canttrend.

ita) does come close to the Latin Ameri can aver ageand exceeds the Chi nese aver age. Sub- SaharanAfrica has some of the low est per cap ita con sump -tion lev els: 9 kilo grams of meat and 23 kilo grams of milk per cap ita per year.
The share of calo ries and pro tein com ing frommeat is also much lower in de vel op ing coun triesthan in de vel oped ones (Table 3). In de vel opedcoun tries peo ple ob tain an av er age of 27 per cent oftheir calo ries and 56 per cent of their pro tein fromani mal food prod ucts. The av er ages for de vel op ingcoun tries are 11 per cent and 26 per cent, re spec -tively. Peo ple in Sub- Saharan Af rica, WANA,South east Asia, Other South Asia, and India get athird or less than a third as many calo ries and halfas much pro tein from ani mal prod ucts as peo ple inde vel oped coun tries.
These low con sump tion lev els give an in di ca -tion of how far ani mal food prod uct con sump tion in de vel op ing coun tries could grow. The Live stockRevo lu tion of the past 20 years will begin to lookmod est in com pari son to the one to come if the fac -tors that pro mote meat and milk con sump tion exerttheir full in flu ence.
De ter mi nants of Changes inPer Cap ita Con sump tionThe growth rate of per cap ita con sump tion of ani malfood prod ucts is de ter mined by eco nomic fac torssuch as in comes and prices and life style changes that cause peo ple’s die tary pat terns to evolve in quali ta -tive ways. Per cap ita con sump tion in creased in there gions where in comes grew rap idly dur ing the1980–95 pe riod. For de vel op ing coun tries as awhole, GNP per cap ita grew at 2.1 per cent per year(Ta ble 4). In China, which had the most dra matic in -creases in per cap ita meat and milk con sump tion,GNP per cap ita grew at the ex traor di nary rate of8.6 per cent per year. In dia and South east Asiaalso had high in come growth rates, fu el ing in creasesin per cap ita ani mal food prod uct con sump tion.Latin Ameri can in come growth was about zero(– 0.4 per cent), but the re gion still man aged a slightin crease in per cap ita meat and milk con sump tion.Sub- Saharan Af ri ca’s per cap ita GNP fell sig nifi -cantly, ex plain ing the re gion’s drop in per cap itacon sump tion of meat and milk dur ing the pe riod.
Prices of major meat and ce real food com -modi ties have trended down ward over the past20 years, mak ing food more af ford able to con sum -ers of all in comes (Fig ure 3). Real ce real prices fell 38– 46 per cent (de pend ing on the grain in ques -tion) be tween the early 1980s and early 1990s,while de flated liq uid milk prices fell 37 per centand real meat prices fell 23–35 per cent. Al thoughce real prices fell faster than meat and milk prices,many con sum ers have begun to di ver sify theirdiets into meat and milk be cause they are nearlysa ti ated with ce re als. Some have even re ducedtheir con sump tion of ce re als.
The most im por tant life style change oc cur ringin re cent years is ur bani za tion. Con sum ers in urbanareas are more likely to di ver sify their diets intomeat and milk (Huang and Bouis 1996; An der sonet al. 1997). Urban con sum ers have greater foodchoices and more di verse die tary and cul tural in flu -ences than those typi cally found in rural areas.Urban con sum ers also often pre fer foods that offerva ri ety and con ven ience rather than maxi mum caloric con tent.
Urban popu la tion growth has been sub stan tialthrough out the de vel op ing world in re cent years(Table 4). Be tween 1970 and 1995 cit ies in Asiagrew 3 per cent per year and higher. The high estrate of urban growth, 5 per cent, oc curred in Af rica. The av er age for all de vel op ing coun tries was3.8 per cent, more than three times the developed- country rate.
7
Table 4—Past popu la tion, urban popu la tion,and GNP per capita growth rates
Re gionPopu la tion
1970–95
Ur banpopu lation
1970–95
GNPper cap ita1980–95
(per cent change per year)
China 1.6 3.8 8.6In dia 2.1 3.3 3.2Other East Asia 1.6 3.0 n.a.South east Asia 2.1 4.0 4.3Latin Amer ica 2.1 3.0 – 0.4Sub- Saharan Af rica 2.9 5.0 –1.3De vel op ing world 2.1 3.8 2.1De vel oped world 0.7 1.1 1.7World 1.7 2.6 0.9
Source: UNDP 1998.Note: n.a. in di cates not avail able. De vel oped world is the UNDP
indus trial coun tries. Data for WANA were un avail able.

In ad di tion to in come growth, price changes,and ur bani za tion, cul tural dif fer ences have playedan im por tant role in con sump tion pat terns. Poul trymeat and eggs are the most ac cept able live stockcom modi ties through out the world. Lactose- intolerance, found par ticu larly in East Asia, haslim ited milk con sump tion. Pork, while par ticu larlyval ued by East Asians and peo ple of Euro pean descent, is ex cluded from the diet of a large share of the world’s popu la tion, es pe cially Mos lems in the
Near East, Asia, and Sub- Saharan Af rica. SouthAsia has lower lev els of meat con sump tion than low in come alone would sug gest be cause of cul tural and re lig ious rea sons. Grow ing health con scious ness inde vel oped coun tries has in creased con sump tion oflean meats such as poul try and lim ited growth in the of con sump tion of red meat. These pref er ences arere flected in the ag gre gate changes in per cap ita con -sump tion be tween 1973 and 1993 (Table 5).
Total Con sump tionThe im por tance of even small in creases in per cap -ita con sump tion is com pounded by rap idly in creas -ing popu la tions in many de vel op ing re gions. On average, popu la tion in de vel op ing coun tries grewby 2.1 per cent per year be tween 1970 and 1995(Table 4). The popu la tion in Sub- Saharan Af ricagrew the most—al most 3 per cent per year dur ingthe pe riod. Rapid popu la tion growth cou pled within creased per cap ita con sump tion re sulted in dra -matic in creases in the total con sump tion of ani malfood prod ucts through out the de vel op ing world(Table 6). For de vel op ing coun tries as a whole, total meat con sump tion grew 5.4 per cent per year andtotal milk con sump tion grew 3.1 per cent. The com -pa ra ble fig ures for de vel oped coun tries were1.0 per cent for meat and 0.5 per cent for milk. Chinaex pe ri enced an ex tremely high meat con sump tiongrowth rate of 8.6 per cent, a value that is dis puted.Chi na’s role as the fast est grow ing mar ket for live -stock prod ucts in the world is not in dis pute, but itsgrowth rate may not have been so far ahead of thenext fast est grow ing re gion, Other East Asia. Theissue is con tro ver sial be cause China con sti tutes alarge com po nent of world de mand.
The food con sump tion fig ures used in this re -port are from the FAO sta tis ti cal da ta base (FAO1997, 1998). For China, as for most coun tries, thenum bers are taken from food bal ance sheets pre -pared from na tional sources and are based pri mar ily on es ti mates of pro duc tion and net trade to de rivees ti mates of con sump tion. Re cently, the use of thismeth od ol ogy for es ti mat ing live stock pro duc tionfig ures in China in the 1990s—but not in the1980s—has been chal lenged (Ke 1997).
Al though there is some un cer tainty here, in de -pend ent es ti mates of con sump tion based on house -hold sur veys and feed use sug gest that meat con -
8
Fig ure 3—Trends in the prices of major cerealand meat commodities, 1970–72 to1994–96
Sources: Past data are from ERS 1997, IMF 1997, USDA 1997, andWorld Bank 1993. World Bank pro jec tions and the Manu fac -tur ing Unit Value in dex used for ex press ing val ues in con -stant 1990 US dol lars are from World Bank 1997.
Notes: Wheat is U.S. no. 1, hard red win ter, or di nary pro tein, ex portprice de liv ered at Gulf ports for ship ment within 30 days.Rice is Thai 5 per cent bro ken, WR, milled in dica tive sur veyprice, gov ern ment stan dard, f.o.b. Bang kok. Maize is U.S.no. 2, yel low, f.o.b. U.S. Gulf ports. Soy beans are U.S. c.i.f.Rot ter dam. Soy meal is any ori gin, Ar gen tina 45–46 per centex trac tion, c.i.f. Rot ter dam, prior to 1990, U.S. 44 per cent.Fish meal is any ori gin, 64–65 per cent, c.i.f. Ham burg, n.f.s.Beef is Aus tra lian/New Zea land, cow fore quar ters, fro zenbone less, 85 per cent chemi cal lean, c.i.f. U.S. port (EastCoast), ex dock. Pork is Euro pean Comu nity pork, slaugh terwhole sale price. Poul try is broil ers, twelve- city com po sitewhole sale price, read to cook, de liv ered. Lamb is New Zea -land, fro zen whole car casses, whole sale price, Smith fieldmar ket, London. Milk is U.S. whole milk sold to plants anddeal ers, U.S. De part ment of Ag ri cul ture.

sump tion in the early 1990s in China proba bly rancloser to 30 mil lion met ric tons (25 kilo grams percap ita) than the 38 mil lion met ric tons (33 kilo -grams per cap ita) given in the ta bles in this re port(Ke 1997). If the lower fig ure is cor rect, the ac tualgrowth rate of meat con sump tion in China from the
early 1980s to the early 1990s would be 6.3 per cent, closer to the 5.4 per cent per year ob served in therest of Asia.
Whether the true growth rate of meat con sump -tion in China was ex ceed ingly high (6.3 per cent peryear) or as tro nomi cally high (8.3 per cent per year),
9
Table 5—An nual per cap ita con sump tion of selected livestock food products and per cent of totalcalo ries consumed from each prod uct, 1973 and 1993
De vel oped coun tries De vel op ing coun tries
Com mod ity 1973 1993 1973 1993
(kilo grams) (per cent) (kilo grams) (per cent) (kilograms) (per cent ) (kilo grams) (per cent )
Beef 26 3 25 3 4 1 5 1Mut ton and goat 3 1 3 1 1 0 1 0Pork 26 4 29 5 4 2 9 3Poul try 11 1 20 2 2 0 5 1Eggs 13 2 13 2 2 0 5 1Milk and prod ucts ex clud ing butter 188 9 195 9 29 2 40 3Four meats 67 10 78 11 11 3 21 6Four meats, eggs, and milk 268 20 285 21 42 6 65 9
Source: FAO 1997.Notes: Four meats in cludes beef, pork, mut ton and goat, and poul try. Val ues are three- year mov ing av er ages cen tered on the two years shown;
per cent ages are cal cu lated from three- year mov ing av er ages. Milk is cow and buf falo milk and milk prod ucts in liq uid milk equiva lents.Food is used to dis tin guish di rect food con sump tion by hu mans from uses of ani mal prod ucts as feed, fuel, cos met ics, or cov er ings.
Table 6—Con sump tion of meat and milk by re gion, 1982–94
An nual growthrate of to tal meat
con sump tion To tal meat con sump tion To tal milk con sump tion
Re gion 1982–94 1983 1993 1983 1993
(per cent) (mil lion met ric tons) (mil lion met ric tons)
Chinaa 8.6 16 38 3 7Other East Asia 5.8 1 3 1 2In dia 3.6 3 4 34 52Other South Asia 4.8 1 2 11 17South east Asia 5.6 4 7 4 5Latin Amer ica 3.3 15 21 35 46WANA 2.4 5 6 21 23Sub- Saharan Af rica 2.2 4 5 12 14De vel op ing world 5.4 50 88 122 168De vel oped world 1.0 88 97 233 245World 2.9 139 184 355 412
Sources: An nual growth rate of to tal meat con sump tion for 1982–94 is the growth rate from re gres sions fit ted to FAO an nual data (FAO 1998).To tal milk and meat con sump tion for 1983 and 1993 are three- year mov ing av er ages cal cu lated from FAO 1998.
Notes: Con sump tion re fers to di rect use as food, meas ured as un cooked weight, bone in. Meat in cludes beef, pork, mut ton, goat, and poul try. Milkis milk and milk prod ucts in liq uid milk equiva lents. Met ric tons are three- year mov ing av er ages cen tered on the two years shown. Milk iscow and buf falo milk and milk prod ucts in liq uid milk equiva lents. WANA is West ern Asia and North Af rica.
aSee text for quali fi ca tion on China. A lower es ti mate of 6.3 per cent per year growth, closer to the 5.4 per cent ob served in the rest of Asia, may bemore ac cu rate. This would mean a 1993 to tal meat con sump tion of 30 mil lion met ric tons.

the total amount in con ten tion is less than 5 per centof es ti mated an nual world meat con sump tion in theearly 1990s. It should also be noted that the con tro -versy does not in clude the dis tri bu tion of con sump -tion among meats in China, nor does it in volve international trade in meat, be cause the down wardre vi sion in the pro duc tion fig ures is matched by acor re spond ing down ward re vi sion in the con sump -tion num bers.
Ac cord ing to FAO, the total quan tity of meatcon sumed world wide rose by 45 mil lion met ric tons be tween 1983 and 1993 (Table 6). Total milk con -sump tion rose by 57 mil lion met ric tons in liq uidmilk equiva lents. In 1983 de vel op ing coun triescon sumed 36 per cent of all meat and 34 per centof all milk con sumed world wide. By 1993 thoseper cent ages had risen to 48 per cent and 41 per cent,re spec tively.
The break down of the growth rates of con sump -tion of par ticu lar com modi ties (Table 7) shows thatin de vel oped coun tries total con sump tion grewslowly for all com modi ties ex cept poul try. In the developing coun tries poul try led the field as wellwith 7.6 per cent growth in con sump tion per year.Beef and milk grew at about 3 per cent, and pork con -sump tion grew at 6.2 per cent.
Quan ti fy ing the Ef fects ofGrowth Fac torsQuan ti fy ing the effects of indi vid ual forces that aredriv ing real con sump tion requires a mod el ingapproach to sta tis ti cal esti ma tion that is capa ble ofsort ing out the simul ta ne ous influ ences of a host ofdeter mi nants in order to iso late the con tri bu tion ofeach ele ment. Research ers typi cally use a mul ti ple-regres sion economet ric approach, although thedegree of com plex ity in their mod els var ies greatly.The end objec tive is the esti ma tion of robust elas -tici ties that meas ure the effect on con sump tion of a1 per cent increase in the deter mi nant in ques tion.These esti mates often are obtained from a cross- section of house holds in a par ticu lar region at a par -ticu lar time, yield ing elas tici ties that are usu allyquite sat is fac tory for the time period and regioncon cerned, but which are too spe cific to use acrosscoun tries or over long time peri ods.
Elas tici ties from na tional data over long timepe ri ods are rarely es ti mated be cause of the dif fi -culty in gath er ing data sets that sat isfy the eco nomic and economet ric as sump tions of the un der ly ing de -mand model. Such es ti ma tion can, how ever, pro -vide a bet ter fore cast of the evo lu tion of na tional
10
Table 7—Trends in the food con sump tion of vari ous live stock prod ucts, 1982–94
An nual growthrate of to talcon sump tion To tal con sump tion Per cap ita con sump tion
Re gion/product 1982–94 1983 1993 1983 1993
(per cent) (mil lion met ric tons) (kilo grams)De vel oped world
Beef – 0.0* 32 32 27 25Pork 0.6 34 36 29 28Poul try 3.1 19 26 16 20Meat 1.0 88 97 74 76Milk 0.5 233 245 195 192
De vel op ing worldBeef 3.2 16 22 5 5Pork 6.2 20 38 6 9Poul try 7.6 10 21 3 5Meat 5.4 50 88 14 21Milk 3.1 122 168 35 40
Sources: An nual growth rate of to tal con sump tion 1982–94 is the growth rate from re gres sions fit ted to FAO an nual data (FAO 1998). To tal and percap ita con sump tion for 1983 and 1993 are cal cu lated from FAO 1998.
Notes: Con sump tion re fers to di rect use as food, meas ured as un cooked weight, bone in. Meat in cludes beef, pork, mut ton, goat, and poul try. Milkis cow and buf falo milk and milk prod ucts in liq uid milk equiva lents. Met ric tons and kilo grams are three- year mov ing av er ages cen teredon the two years shown. WANA is West ern Asia and North Af rica.
*Not sig nifi cantly dif fer ent from zero at the 10 per cent level.

con sump tion pat terns over time. De spite the dif fi -cul ties, Schroe der, Bar kley, and Schroe der (1995)es ti mated the ef fects of na tional per cap ita in comegrowth on na tional per cap ita con sump tion, usingan nual data from 32 coun tries for 1975–90. Theauthors found that the larg est ef fect of a US$1 in -crease in in come on meat con sump tion oc curred incoun tries with the low est lev els of na tional in comeand meat con sump tion. As coun tries got richer theim pact of an in crease in in come on meat con sump -tion got weaker.
Schroe der, Bar kley, and Schroe der (1995) foundthat for coun tries with an nual per cap ita in comes in the neigh bor hood of US$1,000 (at 1985 prices),each 1 per cent in crease in per cap ita in come would increase con sump tion of pork by 1 per cent, poul try by nearly 2 per cent, beef by more than 2 per cent,and lamb by more than 3 per cent. At per cap ita in -come lev els above US$10,000, a 1 per cent in -crease in in come would in crease per cap ita con -sump tion of any of the com modi ties by ap prox i -mately 1 per cent or less. These re sults in di catefirst, that an in crease in in come in a richer coun trywill have a sub stan tially smaller im pact on meatcon sump tion than the same in crease will have inpoorer coun tries. Sec ond, the re sults in di cate thatin coun tries with low but ris ing per cap ita in comes, per cap ita con sump tion of most meat com modi tiesis likely to grow faster than growth of per cap ita in come.
Schroe der, Bar kley, and Schroe der did not re -port price elas tici ties or the ef fects of other struc -tural changes on per cap ita con sump tion. Del gadoand Cour bois (1998) es ti mated ex pen di ture, price,and ur bani za tion elas tici ties based on data from64 de vel op ing coun tries for 1970–95. They used asys tem of equa tions that sorted out rela tive price effects among ani mal prod ucts and that con trolledfor many cul tural, geo graphic, physi cal, and eco -nomic dif fer ences be tween coun tries.
The re sult ing ex pen di ture elas tici ties (Table 8)es ti mate the per cent age in crease in the weight ofbeef, pork and mut ton, poul try, or milk con sumeddue to a 1 per cent in crease in total ex pen di ture onall ani mal food prod ucts in the de vel op ing coun tries in the sam ple. Thus the whole- sample ex pen di tureelas tic ity of 1.36 for milk sug gests that the rela tiveshare of milk in total ani mal prod uct con sump tionin creases as real ex pen di ture on ani mal food prod -ucts in creases across coun tries and over time, oncethe ef fects of rela tive prices, ur bani za tion, and other fac tors are taken into ac count. The 0.27 co ef fi cientfor poul try sug gests that its share de creases with a1 per cent in crease in total ex pen di ture on all ani malfood prod ucts,
A com pari son of the poor est third of coun triesto the rich est third at subsam ple means sug geststhat the pref er ence for ad di tional milk and beef de -creases mar gin ally when mov ing from poorer toricher de vel op ing coun tries. Pref er ence for poul try
11
Table 8—De mand elas tici ties for major food prod ucts of ani mal ori gin from a cross- country,sys tems es ti ma tion, 1970–95, de vel op ing re gions
Ex pen di ture elas tic ityaUr ban
Com mod ityPoor estb thirdof coun tries
Wholesam ple
Rich estb thirdof coun tries
Own price elas tic ity
population shareelasticity
Beef 0.72 0.65 0.57 –0.14 –0.20Pork and mut ton 0.96 1.10 1.30 –0.39 0.46Poul try 0.28 0.27 0.26 –0.17 0.38Milk 1.43 1.36 1.26 –0.86 –0.17
Source: Del gado and Cour bois 1998.Notes: These pa rame ters were es ti mated as a sys tem (with other ex plana tory vari ables and ex clu sions not shown) for 64 coun tries us ing an nual
data. N=1,143 and McEl roy’s mul tie qua tion R2 (Judge et al. 1985, 477) was 0.86. All co ef fi cients were sta tis ti cally sig nifi cant at a 10 per -cent level or bet ter.
aEx pen di ture is the to tal ex pen di ture on ani mal food prod ucts in cluded in the study. Ex pen di ture elas tici ties are cal cu lated at the subsam ple mean, toproxy for in come elas tici ties for spe cific sub groups.bMean per cap ita gross do mes tic prod uct dur ing the 1970–95 pe riod was used to clas sify all coun tries into one of three groups: poor est (<$800), mid -dle ($800–$3,000), and rich est (>$3,000). The sam ple was di vided into thirds, with each third hav ing the same number of coun tries.

is re marka bly sta ble across wealth groups of coun -tries. Pref er ence for pork and mut ton rises with in -creas ing in come.5 The last re sult may hide changes in the qual ity of meat prod ucts con sumed whenmov ing to richer coun tries, es pe cially given thelarge varia tion in qual ity in pork/mut ton meats.Fur ther more, while these elas tici ties are use ful forin di cat ing the rela tive re spon sive ness of con sump -tion of dif fer ent prod ucts to in come, de mand forin di vid ual prod ucts in in di vid ual coun tries may bemore or less re spon sive than these mul ti coun tryes ti mates in di cate. De mand would de pend in largepart on whether the coun try in ques tion ex hib itedmore or less income- responsiveness for ani malprod ucts as a group.
The own- price elas tici ties in Table 8 meas urethe change in con sump tion of vari ous ani mal prod -ucts in re sponse to rela tive price changes within thegroup of ani mal prod ucts. As ex pected, price risesfor a given com mod ity are as so ci ated with de -creased con sump tion of that com mod ity, otherthings being equal. The es ti mated price re spon sive -ness for both beef and poul try is rather mod est. Theprice re spon sive ness of pork and mut ton is higher,but still ine las tic. Only milk among the major live -stock food items is some what price re spon sive inthe cross- country re gres sions.
It would be an error, how ever, to infer that thereis lit tle scope for price poli cies to slow down thegrowth in de mand for meat. Del gado and Cour bois(1998) briefly sur veyed elas tici ties from sev eral rig -or ous economet ric de mand analy ses that in cludeddis ag gre gated ani mal prod uct de mand using mul ti -year sam ples and na tional level data for in di vid ualcoun tries. They found a con sump tion re sponse toown prices for meats of – 0.5 to –1.0, sug gest ing that price re spon sive ness within coun tries is muchhigher than across coun tries.
The cross- country re gres sion sys tem re portedin Table 8 in volved doz ens of vari ables to con trolfor the many dif fer ences across time and coun triesthat af fect con sump tion of ani mal food prod ucts.
Most im por tant among these was the meas ure of urbanization. The ur bani za tion elas tici ties sug gestthat as the per cent age of the popu la tion liv ing in cities in creased, so did the im por tance of pork,mut ton, and poul try in ani mal food prod uct con -sump tion, while the im por tance of beef and milkde creased.
The two key mes sages of the data and analy sissum ma rized in this chap ter are that ani mal foodprod uct demand has increased dra mati cally in thepast and that it is very likely to increase in thefuture. The same fac tors that drove the enor mousincreases in total meat con sump tion are expected toexert their influ ence into the next cen tury. Popu la -tion is pro jected to grow more mod estly but still atan aver age of 1.5 per cent per year in devel op ingcoun tries (UNDP 1998).
With that rate of popu la tion growth, even with -out a change in per cap ita con sump tion, de mand forani mal foods will grow enor mously. But per cap itacon sump tion is also ex pected to in crease. In the next 15 years, urban popu la tions are ex pected to grow2.9 per cent per year on av er age for all de vel op ingcoun tries (UNDP 1998). Per cap ita in come will also grow. Pro vided the poor bene fit from these trends,they will sig nifi cantly in crease their de mand for animal food prod ucts with that new in come. Otherfac tors may fur ther boost de mand. Greater trade and com mu ni ca tions, for ex am ple, will ex pose peo pleeven in re mote areas to other cul tures and foods.
Whether the world has the capac ity to meetthis surg ing new demand with increased animalfood produc tion will be a major ques tion for therest of this report. The next chap ter will look at theevolu tion of supply systems over the past two decades lead ing up to the Live stock Revo lu tion.Subse quent chap ters will exam ine whether futuredemand trends coin cide with future resource avail -abil ity and at what cost. Finally, the paper willaddress simi lar ques tions more quali ta tively andlook at envi ron mental, health, nutri tional, foodsecu rity, and tech no logi cal issues.
12
5 Pork and mut ton are com bined since most coun tries con sume a large amount of one or the other, but not both. De pend ing on thecoun try, ei ther pork or mut ton is the main sub sti tute for beef.

3. Accompanying Transformationof Livestock Supply
Pro duc tion of ani mal food prod ucts grew most rap -idly in the same re gions where con sump tion did.Total meat pro duc tion in de vel op ing coun tries grew at 5.4 per cent per year be tween 1982 and 1994, al -most five times the developed- country rate(Table 9). The high est pro duc tion growth rates formeat oc curred in Asia, es pe cially in China wheretotal meat pro duc tion in creased by at least 6.3 per -cent and pos si bly as much as 8.4 per cent an nu ally(Table 10).6
Per cap ita meat and milk pro duc tion rose be -tween 1983 and 1993 in all re gions ex cept Sub-
Saharan Af rica and WANA (where milk pro duc tionfell mar gin ally), in di cat ing that do mes tic sup ply keptup with popu la tion growth in most areas (Table 10).In 1993 both Other East Asia and WANA had sub -stan tial dis crep an cies be tween per cap ita meat con -sump tion and pro duc tion, in di cat ing that those re -gions im ported large amounts of meat to keep up with grow ing de mand (Ta bles 2 and 10). South east Asiaand Sub- Saharan Af rica had sub stan tially higher percap ita milk con sump tion than pro duc tion in 1993.
Poul try had the fast est total pro duc tion growthrate in both de vel op ing and de vel oped coun tries
13
Table 9—Pro duc tion trends of vari ous live stock prod ucts, 1982–94
An nual growth ofto tal pro duc tion
To tal pro duc tion Per cap ita pro duc tion
Re gion/product 1982–94 1983 1993 1983 1993
(per cent) (mil lion met ric tons) (kilo grams)De vel oped world
Beef 0.1* 36 35 27 26Pork 0.7* 35 37 29 29Poul try 3.2 19 27 16 21Meat 1.1 90 100 76 78Milk – 0.4* 365 348 305 272
De vel op ing worldBeef 3.1 16 22 5 5Pork 6.1 21 39 6 9Poul try 7.8 9 21 3 5Meat 5.4 51 88 15 21Milk 3.7 113 164 32 39
Sources: An nual growth of to tal pro duc tion 1982–94 is the growth rate from re gres sions fit ted to FAO an nual data (FAO 1998). To tal and per cap itapro duc tion 1983 and 1993 are cal cu lated from FAO 1998.
Notes: Beef in cludes meat from cat tle and buf falo. Poul try in cludes all fowl listed in FAO 1998. Meat in cludes beef, pork, mut ton, goat, and poul -try car cass weights. Milk is cow and buf falo milk and milk prod ucts in liq uid milk equiva lents. Met ric tons and kilo grams are three- yearmov ing av er ages cen tered on the two years shown.
*Not sig nifi cantly dif fer ent from zero at the 10 per cent level.
6 See dis cus sion of China data in Chap ter 2. The more likely fig ure of 6.3 per cent per year is still the high est in the world. Meat pro -duc tion grew at a mod est 2.9 per cent in Latin Amer ica and just 2.1 per cent in Sub- Saharan Af rica. In China, Other East Asia, LatinAmer ica, and Sub- Saharan Af rica to tal meat pro duc tion grew less than to tal meat con sump tion, though for de vel op ing coun tries as awhole pro duc tion grew at the same rate as con sump tion.

between 1982 and 1994 (Table 9). Pro duc tion grewslowly in de vel oped coun tries for all other live stock prod ucts, with total and per cap ita out put of beefand milk fal ling. In de vel op ing coun tries total meatand milk pro duc tion grew rap idly, es pe cially porkand poul try. Even the growth of beef pro duc tion,which was near zero in de vel oped coun tries,amounted to a ro bust 3.1 per cent per year in de vel -op ing coun tries. Per cap ita pro duc tion of pork,
poul try, and milk in creased for de vel op ing coun -tries as a group.
The large dis crep an cies be tween de vel op ing-and developed- country total pro duc tion growth ratesare shift ing world ani mal pro duc tion, with all itsbene fits and costs, from de vel oped to de vel op ingcoun tries (Table 11). In one dec ade the de vel op ing-coun try share of world meat and milk pro duc tionrose from 36 to 47 per cent and from 24 to 32 per cent,
14
Table 10—Trends in the pro duc tion of meat and milk, by re gion, 1982–94
An nual growthof to tal meatpro duc tion Per cap ita meat pro duc tion Per cap ita milk pro duc tion
Re gion 1982–94 1983 1993 1983 1993
(per cent) (kilo grams) (kilo grams)China 8.4 16 33 3 6Other East Asia 5.0 16 24 15 30In dia 3.7 4 5 51 66Other South Asia 4.8 6 8 50 62South east Asia 5.7 11 16 2 3Latin Amer ica 2.9 43 48 94 101WANA 3.9 14 16 58 57Sub- Saharan Af rica 2.1 10 9 19 19De vel op ing world 5.4 15 21 32 39De vel oped world 1.1 76 78 305 272World 2.9 30 34 102 93
Sources: An nual growth of to tal meat pro duc tion 1982–94 is the growth rate from re gres sions fit ted to FAO an nual data (FAO 1998). Per cap itameat and milk pro duc tion for 1983 and 1993 are cal cu lated from FAO 1998.
Notes: Meat in cludes beef, pork, mut ton, goat, and poul try car cass weights. Milk is cow and buf falo milk and milk prod ucts in liq uid milk equiva -lents. Kilo grams are three- year mov ing av er ages cen tered on the two years shown. WANA is West Asia and North Af rica.
Table 11—Shares of total world pro duc tion of meat and milk, by re gion, 1983 and 1993
Beef Pork Poul try Meat Milk
Re gion 1983 1993 1983 1993 1983 1993 1983 1993 1983 1993
(per cent)
China 1 4 25 38 5 12 12 20 1 1Other East Asia 0 1 1 1 1 1 1 1 0 0In dia 4 5 1 1 0 1 2 2 8 12Other South Asia 2 2 0 0 1 1 1 1 2 4South east Asia 2 2 3 4 5 6 3 4 0 0Latin Amer ica 19 20 6 4 13 15 12 12 8 9WANA 2 2 0 0 5 5 3 3 3 4Sub- Saharan Af rica 5 4 0 1 2 2 3 3 2 2De vel op ing world 34 41 37 51 32 44 36 47 24 32De vel oped world 66 59 63 49 68 56 64 53 76 68
(mil lion met ric tons)
World 48.8 55.0 55.7 75.5 28.8 47.3 141.4 188.0 477.4 511.8
Source: FAO 1998.Notes: Meat in cludes beef, pork, mut ton, goat, and poul try car cass weights. Milk is cow and buf falo milk and milk prod ucts in liq uid milk equiva -
lents. Val ues are cal cu lated from three- year mov ing av er ages cen tered on the two years shown. WANA is West Asia and North Af rica.

re spec tively. Chi na’s share of global meat sup plyrose from 12 to 20 per cent. Milk pro duc tion ismainly con cen trated in the de vel oped world, butIndia in creased its share of world pro duc tion from8 to 12 per cent dur ing the pe riod. At the rate that pro -duc tion has been shift ing to developing coun tries, itis likely that more than 50 per cent of the world’smeat is now pro duced in the de vel op ing world andthat the same will be true for milk by 2020.
Sources of Growth in the Outputof Livestock Food ProductsThe geo graphic dis tri bu tion of the world’s live -stock ani mals reflects dif fer ent con sump tion pref er -ences and trends (Table 12). Cat tle and buf falo arefound where beef and milk are con sumed in largeamounts, pri mar ily the devel oped world and LatinAmer ica, which are high beef- consuming regions,and South Asia, which is a high milk- consumingregion. Growth in num bers of cat tle and buf falooccurred through out the devel op ing world, withmost devel op ing regions increas ing their share.
Pigs are con cen trated in the key pork- consuming coun tries of East and South east Asia.Chi na’s share of the world’s pigs rose from 38 to44 per cent be tween 1983 and 1993, and the ma jor -ity of the world’s pigs re side now in Asia. Num bersof chicken and other fowl grew rap idly be tween
1983 and 1993, es pe cially in Asia where 40 per centof all chick ens and other fowl were lo cated in 1993.China had the larg est in crease in num bers ofchicken and other fowl as well. Sheep and goatswere most highly rep re sented in WANA and Sub- Saharan Af rica. The re gional dis tri bu tion of sheepand goat num bers shifted lit tle from 1983 to 1993.
In de vel op ing coun tries rap idly in creas ing meat and milk pro duc tion co in cided with rap idly in creas -ing num bers of ani mals. The developing- countryshare of the world’s stock of ani mals rose to two- thirds of all pigs, fowl, sheep, and goats, and three- quarters of all cat tle and buf falo in 1993. By con -trast, num bers of cat tle and pigs fell be tween 1983and 1993 in the de vel oped coun tries, de spite in -creased beef and pork out put. In de vel oped coun -tries growth in num bers of ani mals was im por tantonly for poul try out put. In creased out put in de vel -oped coun tries was made pos si ble pri mar ily by in -creased pro duc tiv ity per ani mal, de fined as greateramounts of meat or milk out put per ani mal and perunit of in puts.
Com par ing the lo ca tion of the world’s live stock in Table 12 to out put shares in Table 11 pro vides anin di ca tion of the rela tive pro duc tiv ity lev els of there gions. Al though three- quarters of the world’s cat -tle and two- thirds of the world’s pigs, poul try,sheep, and goats lived in de vel op ing coun tries in1993, those coun tries pro duced less than half of theworld’s meat and a third of the world’s milk.
15
Table 12—Dis tri bu tion of the world’s live stock ani mals, 1983 and 1993
Cat tle and buf falo Pigs Chickens/fowl Sheep and goats
Re gion 1983 1993 1983 1993 1983 1993 1983 1993
(per cent)
China 5 7 38 44 15 24 11 12Other East Asia 0 0 1 1 1 1 1 1In dia 19 20 1 2 3 2 9 10Other South Asia 5 5 0 0 2 2 6 7South east Asia 3 4 5 5 7 11 1 2Latin Amer ica 22 23 10 9 12 12 9 8WANA 3 2 0 0 6 7 14 13Sub- Saharan Af rica 11 12 1 2 5 5 15 16De vel op ing world 69 74 57 64 52 65 65 69De vel oped world 31 26 43 36 48 35 35 31
(mil lion head)
World 1,378 1,457 776 878 8,680 12,936 1,607 1,722
Source: FAO 1998.Note: WANA is West Asia and North Af rica.

Table 13 com pares growth rates of ani malsslaugh tered or milked with growth rates in meat and milk out put, giv ing an in di ca tion of the ex tent towhich pro duc tiv ity and in creased num bers of ani -mals con trib uted to out put growth. Coun tries in therela tively land- abundant Latin Amer ica and Sub- Saharan Af rica re lied mostly on growth in num bersof ani mals for their in creased live stock pro duc tion.In Latin Amer ica and Sub- Saharan Af rica, thenumber of cat tle that were slaugh tered or milkedgrew at rates nearly equal to, or above, the growthrate of beef and milk out put, in di cat ing that numberof ani mals was more im por tant than pro duc tiv ity inpro vid ing the ad di tional meat. Pig num bers grew atabout the same rate as pork out put in both re gions,in di cat ing lit tle pro duc tiv ity growth. The number of chick ens grew at about the same rate as poul try out -put in Af rica. In Latin Amer ica the number ofchick ens grew more slowly than poul try out put,sug gest ing the ex is tence of pro duc tiv ity growth inpoul try out put.
In Asia, where land is scarce, growth in num -bers of ani mals made up a smaller pro por tion ofout put growth for beef and pork. Pro duc tiv itygrowth was rela tively more im por tant. Not in clud -ing China, where re ported pro duc tiv ity growth waseven greater, cat tle num bers grew less than 2 per -
cent per year be tween 1982 and 1994, while bothmilk and beef out put grew by more than 3 per cent.Also in Asia with out China, pig num bers grew atabout four- fifths the rate of pork out put, in di cat inga small amount of pro duc tiv ity growth. Less pro -duc tiv ity growth oc curred in poul try pro duc tion, aschicken num bers grew at ap proxi mately the samerate as out put.
Pro duc tiv ity is much higher in de vel oped coun -tries than that typi cally found in de vel op ing coun -tries. Table 14 pres ents the number of kilo grams ofmeat or milk pro duced per ani mal. Pro duc tiv ity bythis yard stick was clearly higher in de vel oped coun -tries, es pe cially for beef and milk. Pork and poul trypro duc tiv ity lev els showed greater simi lar ity across re gions.
Cer tain de vel op ing re gions ap pear to be catch -ing up with developed- country rates for per ani malpro duc tiv ity. Pro duc tiv ity growth rates in some de -vel op ing coun tries ex ceed those in de vel oped coun -tries for some com modi ties (Table 14). Beef pro -duc tiv ity through out Asia has been grow ing at rateshigher than the 0.9 per cent growth rate in the de vel -oped world. Milk pro duc tiv ity growth rates in Asia,with the ex cep tion of China, also ex ceeded those inde vel oped coun tries. Beef and milk pro duc tiv ity inLatin Amer ica and Sub- Saharan Af rica fell in creas-
16
Table 13—Growth rates of live stock out put and number of ani mals slaugh tered or milked, 1982–94
Cat tle Milk Pigs Chickens
Re gion Out put Slaugh tered Out put Milked Out put Slaugh tered Out put Slaugh tered
(percent growth per year)
China 20.0 15.5 10.0 11.6 7.2 5.8 13.1 10.3Other East Asia 3.3 2.0* 8.1 3.0 5.6 3.5 8.9 8.4In dia 3.6 2.2 6.4 1.6 2.8 2.8 11.9 11.9Other South Asia 2.4 0.7 2.9 1.7 4.9 3.8 8.2 6.3South east Asia 4.2 3.4 4.4 2.1 5.7 4.8 7.1 7.5Asia, ex clud ing China 3.4 1.8 4.2 1.8 5.7 4.6 7.5 7.4Latin Amer ica 2.1 1.8 2.5 1.8 0.1* – 0.4* 6.6 5.5WANA 3.0 0.3* 2.7 1.2 5.9 5.8 5.9 5.6Sub- Saharan Af rica 0.3 0.8 2.9 2.3 7.8 7.7 4.0 4.1De vel op ing world 3.0 2.5 3.8 2.0 6.1 4.8 7.7 6.9De vel op ing world, exclud ing China 2.1 1.6 3.6 1.8 3.3 2.9 6.6 6.2De vel oped world 0.1 – 0.8 – 0.4 –1.7 0.7 0.3 2.7 1.9World 1.1 0.6 0.5 0.3 3.1 2.5 4.7 4.0
Source: Es ti mated from FAO 1998 data.Notes: As dis cussed later in the re port, the of fi cial China pro duc tion fig ures for the mid- 1990s are cur rently un der re vi sion and may be re duced.
China has been ex cluded from the Asia fig ures to avoid any bias this may in tro duce.*Not sig nifi cantly dif fer ent from zero at the 10 per cent level.

ingly be hind the de vel oped coun tries. Pork pro duc -tiv ity growth rates ex ceeded developed- countrylev els in Asia. Poul try pro duc tiv ity growth was onav er age more rapid in de vel oped coun tries than inde vel op ing coun tries ex clud ing China.
Sources of Productivity GrowthPro duc tiv ity growth in de vel oped re gions mainlyoc curs through fur ther tech no logi cal prog ress.Farm ers can raise many more ani mals per unit ofland by using capital- intensive mecha ni za tion thatre duces labor re quire ments, by in creas ing per ani -mal feed use and feed qual ity, and by in vest ing inim proved ani mal ge net ics and health. Nearly 37per cent of the world’s meat sup ply comes from in -dus tri al ized live stock pro duc tion (FAO 1995b). Inre cent years, in dus trial live stock pro duc tion grewglob ally at twice the rate (4.3 per cent) of more tra -di tional, mixed- farming sys tems (2.2 per cent), andmore than six times the rate of graz ing sys tem (0.7per cent) (Sere and Ste in feld 1996).
In dus trial live stock pro duc tion is knowl edge-and management- intensive, es pe cially when de liv -
er ing prod ucts for an in creas ingly quality- consciousurban popu la tion. In dus trial live stock pro duc tionmaxi mizes the use of scarce re sources, no ta blyland, labor, and feed, and it in volves the de vel op -ment of geno types, ap pli ca tion of bio tech nol ogy,gen eral im prove ment in ani mal hus bandry and veterinary care, and ad vances in the back ward andfor ward link ages of live stock out put (such as meatmar ket ing sys tems, feed mills). Pro duc tion costsof monogas trics, such as pigs and poul try, tend tofall faster than those for ru mi nants in land- scarcesitua tions be cause monogas trics re quire less spaceand are more ef fi cient at con vert ing feed con cen -trates to meat.
Live stock pro duc tion in de vel op ing coun triesre lies much more on tra di tional op era tions. A quar -ter of the world’s land is used for graz ing, whichsus tains about 10 per cent of world meat pro duc tion(FAO 1995b). Graz ing sys tems typi cally in creasepro duc tion by in creas ing the number of heads andthe land area used. As land be comes scarce, graz ing sys tems lead to ei ther land deg ra da tion and eco -nomic de cline or mixed or in dus trial live stock pro -duc tion sys tems.
17
Table 14—Pro duc tiv ity by re gion and ani mal type, 1992–94, and productivity growth rate, 1982–94
Beef from cat tle Milk Pork Poultry
Re gionPro duc-
tiv ityGrowth
ratePro duc-
tiv ityGrowth
ratePro duc-
tiv ityGrowth
ratePro duc-
tiv ityGrowth
rate
(kilo grams/head)
(per cent/ year)
(kilo grams/head)
(per cent/year)
(kilo grams/head)
(per cent/year)
(kilo grams/head)
(per cent/year)
China 149 4.5 1,530 –1.6 76 1.4 1.3 2.8Other East Asia 207 1.3H 1,983 5.1 72 2.1 1.1 0.5*H
In dia 103 1.4 973 4.8 35 . . . 0.9 0.0Other South Asia 111 1.7 538 1.2H 37 1.1 1.0 1.9South east Asia 170 0.9H 628 2.4 58 0.8 1.1 –0.3Asia, de vel op ing coun tries, ex clud ing China 147 1.5 672 2.3 61 1.1 1.1 0.0*Latin Amer ica 194 0.2 1,137 0.7 71 0.5H 1.4 1.1H
WANA 135 2.7 1,236 1.5H 69 0.1*H 1.1 0.2Sub- Saharan Af rica 132 –0.5 340 0.6 45 0.1 0.9 –0.1*De vel op ing world 162 0.5 896 1.9 72 1.2 1.2 0.8H
De vel op ing world, ex clud ing China 164 0.5 879 1.8 63 0.5H 1.2 0.5De vel oped world 242 0.9 3,739 1.3 82 0.4 1.4 0.8World 204 0.5 2,073 0.2 76 0.6 1.3 0.7
Source: FAO (1998) fig ures on to tal food com mod ity pro duc tion per re gion and item are di vided by the cor re spond ing number of ani mals slaugh -tered (or milked) from FAO 1998. Growth rates of pro duc tiv ity are from re gres sions fit ted to an nual es ti mates of pro duc tiv ity ob tainedthrough this means. WANA is West Asia and North Af rica.
*Not sig nifi cantly dif fer ent from zero at the 10 per cent level.HNot sig nifi cantly dif fer ent from de vel oped world at the 10 per cent level.

Mixed live stock and crop pro duc tion is themost com mon form of live stock op era tion in de vel -op ing coun tries, pro vid ing more than 50 per cent ofthe meat pro duced in the world (FAO 1995b). Thecrop com po nent of the farm pro vides resi dues forrough age, while the live stock com po nent pro videsani mal trac tion, fer til izer, ani mal fi bers, a form ofsav ings or col lat eral, and a role in so cial func tions.Live stock kept in mixed sys tems are pri mar ily large and small ru mi nants be cause they are ef fi cient atcon vert ing pas tures, crop resi dues, and other rough -ages into meat. Such fi brous ma te ri als and grasseshave lit tle or no al ter na tive use. Large ru mi nantscan also pro vide farm power.
Cur rently an es ti mated 250 mil lion work ingani mals pro vide draft power for mixed farms thatcover about 28 per cent of the world’s ar able land.Ap proxi mately 52 per cent of avail able crop land inde vel op ing coun tries is farmed using ani mal draftpower. The use of ani mal draft power in creased inthe 1970s and 1980s in those parts of West Af ricawhere the tech nol ogy was rela tively new, dis easewas being con trolled, and in tro duc tion of new cropssuch as cot ton and maize re quired added farmpower (Pin gali, Bigot, and Binswan ger 1987).East ern and South ern Af rica and South Asia inpar ticu lar have longer tra di tions in the use of draftani mals and are likely to con tinue to use them forsome time to come.
Mecha ni za tion is rap idly oc cur ring in otherareas, such as East and South east Asia (Ste in feld1998). In these areas mixed farm ing is evolv ing asthe food value of ani mals in creases and the value oftheir other uses de clines. The dif fu sion of ma chin -ery, fer til izer, syn thetic fi bers, and fi nan cial serv -ices re duces the value of live stock’s other roles.Mecha ni za tion im proves the pro duc tiv ity of ani mal food pro duc tion be cause ani mals no longer need tobe kept into adult hood for draft power, ena blingmore rapid slaugh ter rates. Mecha ni za tion alsomakes pos si ble a shift from large and small ru mi -nants to ani mals such as pigs and chick ens that re -quire less time and space for pro duc tion.
In past dec ades live stock de vel op ment in Asiasuf fered from an ex treme short age of land and qual -ity feed but en joyed a rela tive abun dance of laborand water. Capi tal, first in short sup ply, be came less of a lim it ing fac tor as rapid in dus trial de vel op menttook place and in comes in creased. Pro gress in de -
vel op ment led to the adop tion of a number of tech -nolo gies that dealt first with land scar city and thenre placed labor with capi tal.
The first set of in no va tions in tro duced intoAsian mixed- farming sys tems in cluded basic ani malhealth care, such as con trol of in fec tious dis eases and para sites. Next came the pro vi sion of ad di tional feed, first from crop by prod ucts, but then in creas inglyfrom ce re als and other con cen trates. In In do ne siaand else where, cut and carry sys tems, es sen tially acom bi na tion of for age cul ti va tion and stall feed ing,de vel oped for milk pro duc tion. Breed ing con tin uedto be based on local se lec tion for pre ferred traits;cross breed ing was prac ticed to some ex tent.
As demand for live stock foods expanded rap -idly, mixed- farming sys tems could not keep up.Feed require ments could no longer be met fromdomes tic sup plies of cere als and other con cen trates. Asia began to import large amounts of feed grains,mainly from the devel oped coun tries. At this pointthe indus trial pro duc tion of pork, poul try, and eggsthat emerged was more effi cient at using importedfeeds. Indus trial sys tems make use of imported live -stock genetic mate rial and sophis ti cated feed ingprac tices, such as phased feed ing, the use of feedaddi tives, and, at an even more advanced stage,syn thetic amino- acids. As of this writ ing, in early1999, these sys tems appear to have been dis pro por -tion ately dis ad van taged by the Asian eco nomic cri -sis, which raised the cost of imported feeds anddepressed urban demand.
WANA ex hib its dif fer ent trends. Land is not alim it ing fac tor per se but ag ri cul tural po ten tial is,given the scar city of water. Tra di tional pas tor al ismand, to a lim ited ex tent, mixed farm ing con tinue toexist, but oil reve nues and the re sult ing eco nomic ex -pan sion since 1973 have in tro duced im ported in dus -trial pro duc tion units, for poul try and dairy in par -ticu lar. These units have state- of the- art tech nol ogybut re quire many im ported in puts and the do mes ticpro duc tion of oth ers (for ex am ple, for age pro duc tion for dairy cows). For the most part they can not com -pete with world mar kets but are main tained throughpro tec tion as a mat ter of po liti cal choice.
Be cause of the emer gence of these sub si dizedin dus trial pro duc tion sys tems, as well as othermajor dis tor tions in the food mar ket, lit tle tech no -logi cal change has oc curred in the graz ing andsmall mixed- farming sec tors in WANA. Feed lots
18

for small ru mi nants have de vel oped to some ex tent,mainly in re sponse to the mar ket re quire ments ofthe re gion. These re quire ments in clude the sea sonal de mand for whole ani mals dur ing re lig ious holi -days. In more ecol ogi cally fa vor able en vi ron ments,no ta bly the Nile val ley in Egypt, com peti tive dairysys tems have emerged that use a mix ture of do mes -tic and im ported feed re sources and in ter me di atelabor- intensive tech nol ogy.
The rela tive abun dance of land and ex tremescar city of capi tal re sulted in lit tle pro duc tiv ity in -crease per ani mal in Sub- Saharan Af rica over thepast two dec ades. With out sig nifi cant per cap ita in -come growth the re gion lacked the stim uli and themeans for adopt ing meat pro duc tion tech nol ogyout side the poul try sec tor in large coastal mar kets.Dump ing of live stock prod ucts from de vel opedcoun tries dur ing the late 1970s and through out the1980s also dis cour aged pro duc tion in no va tion, asdid over val ued ex change rates that fa vored im ports.
Sub- Saharan Af ri ca’s live stock sec tor con tin -ues to be largely made up of ru mi nants lo cated intsetse- free areas and fed lo cally avail able feed.By and large health care is ru di men tary and onlysim ple feed sup ple ments, such as min er als, are pro -vided. Close to urban cen ters, and where agro- ecological con di tions per mit, semi- intensive andin ten sive dairy ing has de vel oped using cul ti vatedfod der and agro- industrial by- products. Poul trypro duc tion has begun to in dus tri al ize. Apart fromlow in come and a short age of qual ity feed, live stock pro duc tion tech nol ogy in Af rica con tin ues to be severely con strained by dis ease, es pe cially try pano -somia sis, which is spread by the tsetse fly (Al ex an -dra tos 1995). Cat tle pro duc tion is dif fi cult in areasin fested with the tsetse fly. Other dis eases must becon trolled as well be fore wide spread in ten si fi ca tion of pork and poul try pro duc tion can occur.
Latin Amer ica is char ac ter ized by an abun -dance of land. The re gion ex pe ri enced con sid er ablelive stock de vel op ment prior to the 1960s. Ur bani -za tion had al ready ad vanced by that point, un like inthe rest of the de vel op ing world. In come stag na tionin the 1970s and early 1980s and low world mar ketprices for meat slowed pro duc tiv ity growth andtech nol ogy adop tion. It was gen er ally cheaper toex pand live stock pro duc tion into new areas than invest in new tech nol ogy. Pas tures con tinue to beun im proved, ex cept for areas close to con sumer
cen ters, and the tech nol ogy used in ex ten sive ranch -ing only in volves such basic meas ures as fenc ing,dis ease pre ven tion and treat ment, and some ge neticde vel op ment.
Re cently, in ten sive poul try pro duc tion and, tosome ex tent, dairy ing have de vel oped in LatinAmer ica. These live stock sys tems took ad van tageof the tra di tion ally high ur bani za tion rate and a resurgence of eco nomic growth in the 1990s. In ten -sive in na ture, these sys tems use many of the samebasic tech nolo gies found in de vel oped coun tries but use them at lower lev els of in ten si fi ca tion.
Feed UseRecent rapid increases in meat pro duc tion causedglobal use of cereal as feed to rise at 0.7 per centannu ally between 1982 and 1994. This growth ratereflects neg li gi ble growth in use of cereal as feed inthe devel oped coun tries and a more than 4 per centper year growth rate in the devel op ing coun tries(Table 15). Despite the higher growth rate, devel op -ing coun tries still use less than half as much cerealfor feed as do devel oped coun tries. In 1990–92 con -cen trated cereal feed pro vided between 59 and80 per cent of the nutri tion pro vided to ani mals inthe devel oped world. By con trast, cere als accounted for only 45 per cent of total con cen trate feed inSouth east Asia, the devel op ing region with the most inten sive use of feed grains.
As out put of live stock prod ucts grows in devel -op ing regions, ani mal pro duc tion meth ods and feed -ing pat terns are shift ing rap idly. Graz ing sys temsare rap idly dimin ish ing in impor tance through outthe world. Land avail able for graz ing is caught in asqueeze. Urbani za tion and crop pro duc tion areencroach ing on tra di tional graz ing areas. Pres er va -tion efforts are lim it ing expan sion of graz ing opera -tions into vir gin areas.
Mixed- farming sys tems also face lim its. In no -va tions in crop pro duc tion have re duced crop resi -dues and non grain bio mass avail able for feed ing.Crop re search has largely ig nored the feed value ofcrop resi dues. Un im proved va rie ties in low ex ter nal input sys tems typi cally pro duce three to four timesas much non grain bio mass as grain, whereas mod -ern hy brids often pro duce an equal share or lessnon grain bio mass as grain.
19

House hold food waste, such as tuber skins,stems, and leaf tops, has tra di tion ally been an otherim por tant feed re source, for back yard monogas tric
pro duc tion in par ticu lar. But small- scale back yardop era tions are dis ap pear ing be cause of low re turnsto labor and in creased com pe ti tion from large- scalepro duc ers. Al though each back yard op era tion issmall, at the ag gre gate level such sys tems act asmajor trans form ers of waste into meat and milk.Be cause large op era tions are un likely to find itcost- effective to col lect small amounts of wastefrom many house holds, this source of ani mal feedmay be un der used in in dus trial sys tems.
The use of ce re als as feed has been fast est inAsia, where out put growth has risen the most andland is scarce (Table 15). In Other East Asia, South -east Asia, and Sub- Saharan Af rica, ce real use asfeed grew faster than meat pro duc tion, in di cat ingthat those re gions are in ten si fy ing their use of feedper unit of meat out put (Ta bles 10 and 15).
Most of Asia, WANA, and Sub- Saharan Af ricalack the ca pac ity to pro duce sub stan tial amounts offeed grain at com peti tive prices. The grow ingamounts of feed grains im ported into these re gionsat test to this de fi ciency. Given that many de vel op -ing coun tries can not ex pand crop area, two pos si -bili ties re main: in ten si fi ca tion of ex ist ing land re -sources and im por ta tion of feed. Be cause much ofthe gain from in ten si fi ca tion will proba bly go to -ward meet ing the in creas ing de mand for food crops, sub stan tially more feed grains will have to be im -ported by de vel op ing coun tries in the fu ture. Willfeed grain avail abil ity, the in fra struc ture for mov ing large amounts of grain, and other access- relatedfac tors keep up with pro jected surges in de mand?
20
Table 15—Trends in the use of ce real as feed,1982–94
An nual growth ratesTo tal ce realuse as feed
To tal ce realpro duc tion,
To tal ce realuse as feed,
Re gion 1982–94 1982–94 1983 1993
(per cent) (mil lionmet ric tons)
China 2.1 5.8 40a 84Other East Asia –2.3 6.8 3 7In dia 3.0 3.5 2 3Other South Asia 2.0 0.9 1 1South east Asia 2.4 7.2 6 12Latin Amer ica 0.9 2.6 40 55WANA 3.7 1.9 24 29Sub- Saharan Af rica 4.0 5.2 2 3De vel op ing world 2.3 4.2 128 194De vel oped world 0.2* –0.5* 465 442World 1.2 0.7 592 636
Sources: Pro duc tion and use growth rates for 1982–94 are from re gres -sions fit ted to FAO an nual data (FAO 1998). To tal use for1983 and 1993 is cal cu lated from FAO 1998.
Notes: Ce re als in clude wheat, maize, rice, bar ley, sor ghum, mil let,rye, and oats. Met ric tons are three- year mov ing av er agescen tered on the two years shown. WANA is West Asia andNorth Af rica.
aSimp son, Cheng, and Mi yazaki (1994) report 40 mil lion met ric tonsfrom U.S. De part ment of Ag ri cul ture data. That fig ure is used here be -cause it is more con sis tent with the feed quan ti ties and feed/meat con -ver sion ratios in Rosegrant et al. 1997. FAO (1998) re ports 49 mil lionmet ric tons.*Not sig nifi cantly dif fer ent from zero at the 10 per cent level.

4. Projections of Future Demandand Supply to 2020
Trends dur ing the past 15 years sug gest that the developing coun tries are in the midst of a demand- driven Live stock Revo lu tion that al ready has in -creased the shares of world live stock prod ucts con -sumed in those coun tries by a sub stan tial mar gin.Even more im por tant ef fects are ex pected in thefore see able fu ture. These fu ture changes are of such mag ni tude that they can not occur in a vac uum.They will af fect the global econ omy and in turn beaf fected by it.
This chap ter and the next will ex am ine thelikely mag ni tude of the changes, the fea si bil ity ofthe changes given the world’s ca pac ity to pro ducelive stock and feed, the like li hood of the re quiredpro duc tion in creases oc cur ring in de vel op ing or developed coun tries, and the im pli ca tions for worldprices of meat, milk, and ce re als. This chap ter pres -ents both an ap proach to ad dress ing these ques tionsand some an swers in the form of base line re sultsfrom a global eco nomic model. It also looks at what some plau si ble changes in fu ture sce nar ios mighten tail for world milk and meat. Chap ter 5 ex am inesthe pro jected im pact of the Live stock Revo lu tion on world trade in meat and milk and world food pricesunder dif fer ent sce nar ios.
Global eco nomic mod els are sub ject to manyun cer tain ties and are typi cally speci fied at such ahigh level of prod uct ag gre ga tion (meat and milkare usu ally lumped in with “food”), that they are not very use ful for the pur pose at hand. For tu nately, the authors have at their dis posal a model de vel oped at
IFPRI (Rosegrant, Agcaoili- Sombilla, and Perez1995; Rosegrant et al. 1997; Rosegrant, Leach, andGer pa cio 1998; and Rosegrant and Ringler 1998)that is par ticu larly ap pro pri ate for look ing at theseis sues and as sess ing the sen si tiv ity of re sults to different as sump tions. The tool in ques tion is theIn ter na tional Model for Pol icy Analy sis of Ag ri cul -tural Com modi ties and Trade (IM PACT), June1998 ver sion.7 (For fur ther in for ma tion on themodel, see the box.)
Projected ConsumptionTrends to 2020 in theBaseline ScenarioThe base line sce nario rep re sents the most re al is tic set of as sump tions gov ern ing in ter na tional andna tional econo mies. With the sole ex cep tions ofbeef in the de vel oped coun tries and milk in the developing coun tries, con sump tion of food prod -ucts of ani mal ori gin is pro jected to grow at a sub -stan tially lower an nual rate over the 1993–2020pe riod than it did in the 1982–94 pe riod (Ta bles16 and 7). The pro jected rates of growth to 2020are ex pected to be about half those ob served in the last 15 years in most cases. Three fac tors pro ducethese lower growth rates to 2020. First, re centrapid growth in con sump tion means that the basefor pro ject ing growth be yond 1993 is larger thanthat in 1983. Thus a given ab so lute an nual in cre -
21
7 The June 1998 ver sion of IMPACT in cor po rates pa rame ters and as sump tions that re flect lower ex pected over all eco nomicgrowth in Asia rela tive to the as sump tions in prior ver sions, in ad di tion to up dated pa rame ter es ti mates for Af rica (Rosegrantand Ringler 1998). De mand and sup ply pa rame ters for milk have also been ex ten sively re viewed and re vised in this ver sion;milk was in cluded pre vi ously, but not re ported on sepa rately. Read ers in ter ested in the struc ture of model equa tions, whichhave not changed, are re ferred to the ap pen dix of Rosegrant, Agcaoili- Sombilla, and Perez (1995), pub lished in the same se riesas the pres ent pa per.

ment ac counts for an in creas ingly smaller per -cent age in cre ment. Sec ond, slow downs in the rate of over all in come and ur bani za tion growth willoccur for the same rea son. Third, con sum ersbegin to get sa ti ated as the im por tance of meat intheir diets in creases.
Even by 2020, per cap ita con sump tion of milkprod ucts in de vel op ing coun tries is ex pected to beon av er age only one- third that of de vel oped coun -tries (up from less than one- fifth in the early 1990s). Per cap ita con sump tion of meat in de vel op ingcoun tries is pro jected to be 36 per cent of that in
developed coun tries in 2020, up from 28 per cent inthe early 1990s. Yet in ag gre gate terms 62 per centof the world’s meat and 60 per cent of milk con -sump tion will take place in the de vel op ing coun -tries in 2020. This is a major change from the early1990s, when 52 per cent of the world’s meat and59 per cent of the world’s milk were con sumed bythe de vel oped world.
The con sump tion trends by re gion and the annual growth rates to 2020 are given in Table 17. The pro jected con sump tion growth rates forChina of 3 per cent for meat and 2.8 per cent for
22
The Base line IM PACT Model
IM PACT is a global food model that di vides the worldinto 37 coun tries or coun try groups. Its base line ver sionrep re sents the most re al is tic set of as sump tions ac cord -ing to the model team. The coun tries and groups can becon ven iently ag gre gated into re gions that are com pati -ble with FAO defi ni tions (see the Ap pen dix). Fan andAgcaoili- Sombilla (1998) com pared the re sults of earlyver sions of the model and other in ter na tional mod els for ce real pro duc tion and con sump tion in China in 2010and 2020. They found that the pro jec tions from the IMPACT model are mid dle of the road in out look andnei ther pes si mis tic nor bull ish with re spect to the is suesraised at the be gin ning of this chap ter.
The IM PACT model cov ers 18 com modi ties, in -clud ing beef, pork, poul try, sheep meat, goat meat, bo -vine milk, and eggs. The base data used in the cur rentver sion are av er ages of the 1992–94 an nual data fromthe FAO Sta tis ti cal Da ta base (the same source used forthe ta bles in pre vi ous chap ters, with 1993 data ex actlyequiva lent to the IM PACT base year). Since each of the37 coun try groups pro duces and/or con sumes at leastsome of each com mod ity, lit er ally thou sands of sup plyand de mand pa rame ters had to be speci fied (in come,price, and cross- price elas tici ties of de mand; pro duc tion pa rame ters in clud ing crop area, yield growth trends,and herd size and pro duc tiv ity; price re sponse pa rame -ters; ini tial lev els and trends in feed con ver sion; tradedis tor tion pa rame ters; and so on). Pa rame ter es ti mateswere drawn from economet ric analy sis, as sess ment ofpast and chang ing trends, ex pert judge ment, and syn the -sis of the ex ist ing lit era ture. The myr iad as sump tions
are too de tailed to re port here, but at ten tion is given tothose pa rame ters that mat ter the most, such as the de -tailed struc tural pa rame ters of shift ing meat de mand inChina, taken from Huang and Bouis (1996).
Na tional in come, popu la tion, and ur ban growthrates are also as sumed for each coun try group, alongwith an tici pated changes in these rates over time. Themodel uses the re vised United Na tions medium- variant pro jec tions for 1996 for demo graphic as sump -tions. Na tional in come pro jec tions are es ti mated based on a re view of pro jec tions drawn from sources such asthe World Bank. The model is solved on an an nual basis by link ing each coun try model to the rest of theworld through com mod ity trade. The market- clearingcon di tion solves for the set of world prices that clearsin ter na tional com mod ity mar kets, so that the to tal im -ports of each com mod ity equals to tal ex ports. Worldprices of com modi ties thus act as the equili brat ingmecha nism and main tain the model in equi lib rium.When an ex oge nous shock is in tro duced in the model,such as an in crease in crop yields from higher in vest -ment in crop re search, the world price will ad just andeach ad just ment is passed back to the ef fec tive pro -ducer and con sumer prices. Changes in do mes ticprices sub se quently af fect the sup ply and de mand ofthe com modi ties, ne ces si tat ing their it era tive re ad just -ments un til world sup ply and de mand are in bal anceand world net trade again equals zero.
The out come of this an nu al ized it era tive pro cess isan es ti mated an nual se ries of pro jected market- clearingprices, con sump tion lev els by com mod ity and coun try

milk are on the low side of the lit era ture (Ke1997).8 They are fully com pa ra ble to those pro -jected for other parts of Asia, but are sig nifi cantly
above the 0.6 and 0.2 per cent av er ages pro jectedfor de vel oped coun tries as a whole. Per cap itameat con sump tion in 2020 is pro jected to re main
23
group, feed- use lev els, pro duc tion area, yield and pro -duc tion lev els by com mod ity and re gion, and net tradeacross coun try groups by com mod ity. The analy sis ex -tends to the year 2020. The in creas ing globali za tion ofag ri cul tural mar kets is rep re sented in the model by itsset of en doge nous world prices es ti mated through an -nual it era tive so lu tions. Events af fect ing net ex portsfrom one coun try group will af fect prices in oth ers, inturn chang ing sup ply, de mand, and net trade, even tu ally con verg ing to a so lu tion.
An im por tant ad van tage of a mod el ing ap proachsuch as IM PACT is that it can be used to in ves ti gatethe fea si bil ity of pro duc tion in creases si mul ta ne ouslywith the de ter mi na tion of pro duc tion costs and out putprices. Ac tual pro duc tion of com modi ties in the modelre quires the use of suf fi cient quan ti ties of all neededin puts in the coun try and year con cerned. Par ticu lar attention is de voted to cereal- based feeds. Ce real feedde mand in IM PACT is driven by live stock pro duc tion,ce real feed ra tios, own- and cross- price re la tion shipsamong feed crops, and an ex oge nously speci fied “ef fi -ciency pa rame ter” that can be used to model ex oge -nous tech ni cal prog ress or other secu lar changes af -fect ing feed de mand.
The mix of feeds used for a spe cific live stock prod -uct starts from actual aver ages in the 1992–94 baseperiod. For each live stock prod uct, the feed ing ratio foreach main feed com mod ity in the model—maize, othercoarse grains, wheat, oil cakes, cas sava, sweet pota toes,and pota toes—is speci fied for the base period. What hap -pens to the amount of each com mod ity fed after the base
period is modi fied by the rela tive price move ments offeeds, which change in the model depend ing on bothhuman and ani mal demand and by the speci fied rates ofchange in feed ing effi ciency due to tech ni cal prog ress.Browse, back yard slops, and other non ce real, non- oilcake feeds are implic itly costed as free, and are thusnot explic itly mod eled. Report ing focuses on cere alsused as feed, since this is the aspect of feed use that iscon tro ver sial and it is also in all like li hood the bind ingcon straint in pro duc ing ade quate mixed feed rations.
The approach has the draw back that where pro -duc tion sys tems are shift ing from low cereal use sys -tems (as in back yard poul try or range- fed rumi nants)to indus trial feed lots, cur rent ratios of cereal feed tospe cific meat prod ucts may under es ti mate futureratios. The exoge nous feed ratio effi ciency parame terin the feed demand equa tion is speci fied to com pen sate for this in some coun tries. It also allows fur ther sen si -tiv ity test ing in this area.
The ra tio of to tal ce real feed use to to tal meat pro -duc tion (with feed use for milk and eggs net ted out) inthe early 1990s was 1.40 to 1.00 in China and 3.64 to1.00 in the United States. Be tween 1983 and 1993,feed con ver sion ef fi ciency in the United States in -creased by about 15 per cent across all meats, with thein creases for poul try out strip ping those for beef(CAST forth com ing). The pro por tion ately greater useof natu ral pas tures, house hold wastes, roots, tu bers,and by prod ucts for feed ing in de vel op ing coun tries ex -plains why their ce real feed ra tios are lower than thosein de vel oped coun tries.
8 As noted in Chap ter 2, the FAO con sump tion and pro duc tion fig ures for meat in China in the early 1990s, used here for the 1992–94 base, may over state ac tual con sump tion and pro duc tion by up to 30 per cent (Ke 1997). Ke stud ied the dis crep ancy be tween food- balance- sheetand sur vey es ti ma tions of meat con sump tion in China in de tail. He con cludes that ac tual to tal de mand for meat is only likely to grow at 3 to5 per cent per year in China in the fore see able fu ture, a lower rate than that pre dicted by “some” (un speci fied) per sons. While theIMPACT- estimated level of meat de mand in China in 2020 might be seen as some what high be cause of a base pe riod es ti mate of meatcon sump tion that is “too high,” the IMPACT es ti ma tion is also the re sult of pro jected an nual growth over 27 years that is “low” be cause ofthe con ser va tive as sump tions built into the model. There is also lit tle con cern about the ef fect of an over es ti mate of Chi nese live stock pro -duc tion in the base pe riod (1992–94) on im ports in IMPACT be cause the over es ti mate of pro duc tion, if there is one, is bal anced by anover es ti mate of con sump tion. There does not ap pear to be a com pel ling rea son to re vise the es ti mates for China given here.

low in Sub- Saharan Af rica, par tially vege tar ianIndia, and other coun tries in South Asia. The assumptions con cern ing tastes for meat in Indiawill be tested below as part of the sen si tiv ityanaly sis, as will as sump tions about pro duc tiv itygrowth and the se ver ity of the Asian fi nan cial crisis.
Projected ProductionTrends to 2020Pro jected pro duc tion trends for meat to 2020closely fol low those pro jected for con sump tion,with the ex cep tion of WANA (Ta bles 17 and 18).Gen er ally IM PACT proj ects that in 2020 defi cit
24
Table 16—Projected trends in the food consumption of various livestock products, 1993–2020
Pro jected an nualgrowth of to tal con sump tion,
1993–2020
To talcon sump tion
An nual per cap itacon sump tion
Re gion/Product 1993 2020 1993 2020
(per cent) (mil lion met ric tons) (kilo grams)De vel oped world
Beef 0.4 32 36 25 26Pork 0.3 36 41 28 29Poul try 1.0 26 34 20 25Meat 0.6 97 115 76 83Milk 0.2 245 263 192 189
De vel op ing worldBeef 2.8 22 47 5 7Pork 2.8 38 81 9 13Poul try 3.1 21 49 5 8Meat 2.8 88 188 21 30Milk 3.3 168 391 40 62
Sources: To tal and per cap ita con sump tion for 1993 are cal cu lated from FAO 1998. Pro jec tions are up dated fig ures fol low ing the same for mat asthat re ported in Rosegrant et al. 1997.
Notes: Con sump tion re fers to di rect use as food, meas ured as un cooked weight, bone in. Meat in cludes beef, pork, mut ton, goat, and poul try. Milkis cow and buf falo milk and milk prod ucts in liq uid milk equiva lents. Met ric tons and kilo grams are three- year mov ing av er ages cen teredon the two years shown.
Table 17—Pro jected trends in meat and milk con sump tion, 1993–2020
Pro jected an nual growthof to tal con sump tion,
1993–2020
To talcon sump tion
in 2020
Per cap itacon sump tion
in 2020
Re gion Meat Milk Meat Milk Meat Milk
(per cent) (mil lion met ric tons) (kilo grams)
China 3.0 2.8 85 17 60 12Other East Asia 2.4 1.7 8 2 67 20In dia 2.9 4.3 8 160 6 125Other South Asia 3.2 3.4 5 41 10 82South east Asia 3.0 2.7 16 11 24 16Latin Amer ica 2.3 1.9 39 77 59 117WANA 2.8 3.0 15 51 24 80Sub- Saharan Af rica 3.5 3.8 12 31 11 30De vel op ing world 2.8 3.3 188 391 30 62De vel oped world 0.6 0.2 115 263 83 189World 1.8 1.7 303 654 39 85
Sources: Pro jec tions are up dated fig ures fol low ing the same for mat as that re ported in Rosegrant et al. 1997. Notes: Con sump tion re fers to di rect use as food, meas ured as un cooked weight, bone in. Meat in cludes beef, pork, mut ton, goat, and poul try. Milk
is cow and buf falo milk and milk prod ucts in liq uid milk equiva lents. Met ric tons and kilo grams are three- year mov ing av er ages cen teredon the two years shown. WANA is West Asia and North Af rica.

coun tries will im port feed rather than meat. Thiscon tra dicts the con ven tional wis dom that it ischeaper to trade the com mod ity with the highervalue- added (meat as op posed to bulk ce re als). Butit is con sis tent with cur rent trade pat terns and withthe ex pe ri ence of rap idly de vel op ing coun tries such as Tai wan. These live stock trade pat terns may re -flect the re ali ties of rela tive over all costs and bene -fits of pro duc ing and trad ing strate gies bet ter than asim ple com pari son of value to bulk.
Com pari son of pro jected milk pro duc tion andcon sump tion in 2020 shows a some what dif fer entstory. Un like meat, milk is it self a major input intodo mes tic live stock pro duc tion. The con sump tionfig ures in Table 17 in clude only what is con sumedby hu mans, but milk pro duc tion fig ures in cludemilk used as feed. Milk pro duc tion in 2020 in thede vel oped coun tries is pro jected to ex ceed milkcon sump tion by 108 mil lion met ric tons (or 29 per -cent of pro jected pro duc tion). Seventy- seven mil -lion met ric tons of milk will be used as feed and there main ing sur plus will be ex ported to de vel op ingcoun tries. Only 41 mil lion met ric tons (10 per centof pro jected pro duc tion) are likely to be used asfeed in de vel op ing coun tries, de spite a herd sizelarger than that in the de vel oped coun tries.
In de vel oped coun tries the an nual growth rateof pro duc tion through 2020 is pro jected to be 0.7
per cent or less for each of the major live stock foodcom modi ties other than poul try (Table 19). In thede vel op ing coun tries the pro jected an nual rates ofgrowth are 2.7 per cent for meat and 3.2 per cent formilk. The ma jor ity share of live stock pro duc tionwill take place in de vel op ing coun tries, even though per cap ita pro duc tion lev els will be much higher inthe de vel oped coun tries.
Projected Cereal FeedUse to 2020The trends in ce real feed use since the early 1980s(Table 15) high lighted the fact that the growth ratesof ce real feed use ex ceeded ce real pro duc tiongrowth rates in all re gions of the world ex ceptWANA. Com pari son of pro jected and his tori calgrowth rates of ce real feed use shows a slow downthrough 2020 in China, Other East Asia, South eastAsia, and Sub- Saharan Af rica (Ta bles 15 and 20).But feed use ac cel er ates in India, Other South Asia,and WANA, largely due to fast- growing milk pro -duc tion.
Per cap ita ce real use as feed in creases by only8.1 per cent in ag gre gate from the early 1990s to2020 in de vel oped coun tries, but rises by 44 per cent in de vel op ing coun tries. Given this stag na tion in
25
Table 18—Pro jected trends in meat and milk production, 1993–2020
Pro jected an nual growthof to tal pro duc tion,
1993–2020To tal pro duc tion
in 2020Per cap ita pro duc tion
in 2020
Re gion Meat Milk Meat Milk Meat Milk
(per cent per year) (mil lion met ric tons) (kilo grams)
China 2.9 3.2 86 19 60 13Other East Asia 2.4 3.9 7 3 55 29In dia 2.8 1.6 8 172 6 135Other South Asia 2.6 3.1 4 46 9 92South east Asia 3.1 2.9 16 3 25 5Latin Amer ica 2.2 2.0 39 80 59 121WANA 2.5 2.6 11 46 18 72Sub- Saharan Af rica 3.4 4.0 11 31 10 30De vel op ing world 2.7 3.2 183 401 29 63De vel oped world 0.7 0.4 121 371 87 267World 1.8 1.6 303 772 39 100
Sources: Pro jec tions are up dated fig ures fol low ing the same for mat as that re ported in Rosegrant et al. 1997.Notes: Meat in cludes beef, pork, mut ton, goat, and poul try. Milk is cow and buf falo milk and milk prod ucts in liq uid milk equiva lents. Met ric
tons and kilo grams are three- year mov ing av er ages cen tered on the two years shown. WANA is West Asia and North Af rica.

de vel oped coun tries, which pres ently have high ce -real feed use, global ce real feed use is pro jected toin crease by only 46 per cent by 2020. This trans lates to a 1.4 per cent com pounded an nual rate of growth,no ticea bly higher than the 0.7 per cent an nualgrowth rate ob served from the early 1980s to theearly 1990s. Ce real pro duc tion is pro jected to growby 1.3 per cent per year through 2020.
An ad di tional 292 mil lion met ric tons of ce re als will be used as feed in 2020 com pared to the early1990s. For fur ther com pari son, a nor mal U.S. maize crop in the early 1990s to taled around 200 mil lionmet ric tons of grain. The in crease in grain use asfeed will be met pri mar ily through ex pan sion ofyields in the tra di tional ex port ing coun tries and ex -pan sion of cul ti vated area in South and East Asia.
26
Table 19—Projected trends in production of various livestock products, 1993–2020
Pro jected an nual growthof to tal pro duc tion, To tal pro duc tion Per cap ita pro duc tion
Re gion/product 1993–2020 1993 2020 1993 2020
(per cent) (mil lion met ric tons) (kilo grams)De vel oped world
Beef 0.6 35 38 26 28Pork 0.4 37 41 29 29Poul try 1.2 27 36 21 26Meat 0.7 100 121 78 87Milk 0.4 348 371 272 267
De vel op ing worldBeef 2.6 22 44 5 7Pork 2.7 39 81 9 13Poul try 3.0 21 47 5 7Meat 2.7 88 183 21 29Milk 3.2 164 401 39 63
Sources: To tal and per cap ita pro duc tion for 1993 are cal cu lated from FAO 1998. Pro jec tions are up dated fig ures, fol low ing the same for mat as thatre ported in Rosegrant et al. 1997.
Notes: Meat in cludes beef, pork, mut ton, goat, and poul try. Milk is cow and buf falo milk and milk prod ucts in liq uid milk equiva lents. Met rictons and kilo grams are three- year mov ing av er ages cen tered on the two years shown. WANA is West Asia and North Af rica.
Table 20—Pro jected trends in use of cereals as feed, 1993–2020
Re gion
Pro jected an nualgrowth rate of to talce real use as feed
1993–2020
To tal ce realuse as feed
Per cap ita ce realuse as feed
1993 2020 1993 2020
(per cent) (mil lion met ric tons) (kilo grams)
China 3.4 84 178 62 125Other East Asia 2.2 7 20 116 167In dia 5.0 3 14 4 11Other South Asia 2.9 1 4 6 7South east Asia 2.7 12 30 32 45Latin Amer ica 2.0 55 92 116 140WANA 2.5 29 66 93 104Sub- Saharan Af rica 3.5 3 5 4 5De vel op ing world 2.8 194 409 45 65De vel oped world 0.6 442 519 346 374World 1.4 636 928 115 120
Sources: To tal and per cap ita use for 1993 is cal cu lated from FAO 1998. Pro jec tions are up dated fig ures fol low ing the same for mat as that inRosegrant et al. 1997.
Notes: Ce re als in cludes wheat, maize, rice, bar ley, sor ghum, mil let, rye, and oats. Met ric tons and kilo grams are three- year mov ing av er ages cen -tered on the two years shown. WANA is West Asia and North Af rica.

Feed grain cul ti va tion has been of rela tively minorim por tance in South and East Asia com pared tofood grain cul ti va tion, but maize pro duc tion is in -creas ing rap idly while rice pro duc tion is slow ing.
Sensitivity of Projections toChanges in AssumptionsFour ex peri ments that test some of the as sump tionsin IM PACT and take into ac count some majorchanges that might occur in the world are dis cussedhere: (1) a pro longed de cline in eco nomic growth in Asia; (2) a struc tural change in tastes in India to -ward in creased con sump tion of milk and meat; (3) a broad, secu lar in crease over time in feed con ver sion ef fi ciency (due to tech no logi cal prog ress, per haps);and (4) a broad secu lar de crease in ce real feed con -
ver sion ef fi ciency over time (due per haps to in -creas ing use of ce real feeds as live stock pro duc tionin ten si fies).
What Happens in the Event of aLong-Run Economic Crisis in Asia?
Be cause de mand from de vel op ing coun tries, pri -mar ily in East Asia, drives the Live stock Revo lu -tion, a pro longed Asian eco nomic cri sis could havea major ef fect on live stock trends through 2020.9
The sce nario for a more se vere out come in Asia islaid out in Table 21. The sce nario in cludes an en -dur ing de pre cia tion of Asian ex change rates and alast ing de crease in in come growth rates. De pend ing on the coun try, price wedges be tween do mes tic andworld prices are in creased by 5 to 13 per cent. An -nual GDP growth rates are cut by 30 to 45 per cent.
27
Table 21—Changes in IMPACT’s baseline as sump tions: A severe Asian crisis and high Indianmeat con sump tion
Sce narioPhe nome non
being mod eled Mecha nism
Na ture, mag ni tude,and du ra tion of
changed pa rame ters
Se vere Asian cri sis En dur ing de pre cia tion of Asianex change rates
In ser tion of ad di tional wedgebe tween do mes tic and worldcom mod ity prices for Asiancoun tries
Last ing one- shot in crease inwedge of 5 to 13 percent ofworld prices de pend ing oncoun try
Lower non agricultural in comegrowth in Asia
De crease in ex oge nouslyspeci fied growth rates of GDPfor Asia
Last ing de crease of 30 to 45percent in GDP growth rates,de pend ing on coun try
High In dian meatcon sump tion
Shift of In dian tastes to wardani mal foods in clud ing beef
In come elas tic ity for ani malfoods raised for In dia
Last ing rise in elasticity to 1.5to 2.0, de pend ing on thecom mod ity
Pro duc tion re sponse of In dianherds
Per ma nent in crease in the trendof In dian herd growth rates
Fixed in ter cepts shift up wardby 0.3 to 0.7 percent bycom mod ity
In crease in ce re al feed use inIn dia
Pro gres sive up ward shift in feedcon ver sion ra tios (kilogram ofce re al/kilogram of ani mal food)
By 2020, In dia has ra tios higherthan most other de vel op ingcoun tries, but lower thande vel oped coun tries
Source: The sce nario for a se vere Asian cri sis is de scribed in Rosegrant and Ringler 1998.
9 The June 1998 base line used here al ready in cor po rates less op ti mis tic as sump tions about Asian growth than pre vi ous ver sions ofIMPACT. See Rosegrant and Ringler (1998) for a de tailed dis cus sion. The cur rent base line as sumes that long- term non ag ri cul turalGDP will grow at 5.5 per cent per year in China, 4.5 per cent in In do ne sia, 5 per cent in Ma lay sia, 3.5 per cent in Ko rea, 5 per cent in In -dia, and 5 per cent in Thai land.

This sce nario, pre sented in de tail in Rosegrant andRingler (1998), is a “worst- case” pes si mis tic sce -nario, es pe cially be cause the ef fects are as sumed tolast until 2020. The re sults are pre sented here to il -lus trate the ro bust ness of the Live stock Revo lu tion,even in the face of a last ing slow down in Asia.
A com pari son of the re sults of the se vere Asiansce nario to those of the base line model are given inTable 22. A se vere Asian cri sis would cause meat,milk, and feed con sump tion to fall, most no ta bly inChina and India. But even where con sump tion de -clines by 20 per cent rela tive to the base line, thebase line pro jec tions of 200–300 per cent growth formeat and milk in India and China by 2020 mean that con sump tion will grow 160–240 per cent in thosecoun tries, still a large increase.
Even with a se vere Asian cri sis, the pros pectsfor long- term live stock ex pan sion in Asia and theworld are quite ro bust. In Latin Amer ica and Sub- Saharan Af rica the se vere Asian sce nario in creasesmeat and milk con sump tion slightly be cause ofprice ef fects (cheaper world prices for meat andfeed). For the world as a whole, con sump tion oflive stock com modi ties de clines by 8 per cent or less
rela tive to the base line, a neg li gi ble change con sid -er ing it is spread over 27 years.
What Hap pens if Peo ple in IndiaDra mati cally In crease Their MeatCon sump tion?
An other major struc tural change that could af fectthe global live stock econ omy is a shift in In diantastes that ac cel er ates meat con sump tion (Bhalla,Ha zell, and Kerr 1998). Ur bani za tion, in comegrowth, and secu lari za tion could cause peo ple inIndia to in crease their meat con sump tion at a ratesimi lar to high milk con sump tion growth rates.Total milk con sump tion in India grew by 53 per cent be tween the early 1980s and 1990s (Table 6).
This sce nario as sumes that In dian in come elas -tici ties in crease to be tween 1.5 and 2.0, de pend ingon the prod uct (Table 21). It also as sumes that In -dian pro duc tion sys tems change in tan dem, withper ma nent in creases of 0.3–0.7 per cent in the trendof In dian herd- size growth rates. Fi nally, the sce -nario as sumes that live stock pro duc tion in land- scarce India in creases pri mar ily through in ten si fi -
28
Table 22—Difference between baseline projections and pro jec tions of ag gre gate con sump tion in2020 due to changes in as sump tions about the Asian crisis and Indian consumption
Se vere Asian cri sis High In dian meat con sump tion
Re gionBeef andmut ton
Pork andpoul try Milk
Ce realused as feed
Beef andmut ton
Pork andpoul try Milk
Ce realused as feed
(per cent dif fer ence be tween new sce nario and base line)
China –20 –19 –18 –13 – 3 – 2 – 7 4In dia –14 –17 – 27 –16 343 505 154 250Other Asia (in clud ing WANA) –8 –13 – 5 –1 – 4 – 3 – 9 7Latin Amer ica 1 4 2 – 5 – 3 – 4 – 4 8Sub- Saharan Af rica 2 4 4 – 4 – 4 – 2 – 8 5De vel op ing world – 6 –13 –13 – 8 33 6 59 14De vel oped world – 2 2 0 – 2 0 0 – 2 3World – 4 – 8 – 8 – 5 19 4 34 8
Notes: The se vere Asian cri sis in cor po rates lower pro jected in come growth and de pre cia tion in ex change rates for coun tries in Asia. De pend ing onthe coun try, in come growth pro jec tions are 30 – 45 per cent lower than in the base line sce nario, and ex change rate de pre cia tion re sults in5 –13 per cent higher do mes tic prices. The high In dian meat con sump tion sce nario in cor po rates a shift in tastes to ward con sump tion of ani mal foods and in creases in pro duc -tion and feed use ra tios by In dian live stock pro duc ers. In come elas tici ties for ani mal prod ucts rise to be tween 1.5 and 2.0, de pend ing on thecom mod ity. The trend growth rate of In dian herd size rises by 0.3 – 0.7 per cent (de pend ing on the com mod ity), and feed con ver sion ra tiosrise above those typi cal in de vel op ing coun tries. Mut ton in cludes sheep and goat meat. Milk in cludes all dairy prod ucts in liq uid milk equiva lents. The large per cent age changes for meat and feed in In dia re flect a low ini tial base. Pro jected beef con sump tion in 2020, for ex am ple, isstill only 31 kilo grams per cap ita un der the high meat sce nario, less than in China to day. WANA is West Asia and North Af rica.

ca tion and that the amount of ce real feed re quiredper kilo gram of meat rises as a con se quence.
The high In dian meat con sump tion sce nariopulls in the op po site di rec tion from the se vere Asiancri sis sce nario. The ef fect on the growth of In diancon sump tion is huge in both ab so lute and per cent -age terms, but still rela tively mod est in per cap itaterms (Table 22). Milk con sump tion and ce real feeduse rise the most in ab so lute terms. For the world asa whole, milk con sump tion in 2020 would ex ceedthe base line by 34 per cent and feed use by 8 per cent.
Scenarios with Different Rates of FeedConversion EfficiencyFeed can make up to three- quarters of the vari ablecost of live stock pro duc tion in in ten sive sys tems(Sere and Ste in feld 1996). Changes in the feed requirements of meat and milk pro duc tion play anim por tant role in de ter min ing the final cost of live -stock pro duc tion. Tech no logi cal in no va tions thatin crease the amount of meat ob tained per unit ofhigh en ergy feed and in ten si fi ca tion of pro duc tion(sub sti tu tion of ce re als for browse or slops) bothcan change the amount of ce real used per unit ofmeat and milk pro duced. Two op po site sce nar iosare pre sented: an in crease in the rate that feed useef fi ciency im proves and a de crease in that rate.These are both mod eled in some what ex treme formto test the sen si tiv ity of re sults to changes in the
as sumed con ver sion ra tios in ei ther di rec tion. Thebase line sce nario ba si cally as sumes that these twoef fects can cel each other out.
In the first, “op ti mis tic” sce nario, feed con ver -sion ra tios im prove pro gres sively. About 1 per centmore meat per year is pro duced per kilo gram offeed in de vel op ing coun tries, with a com poundedef fect over time. This mir rors the rapid tech no logi -cal prog ress ob served in the de vel oped coun triesfrom the early 1980s to the early 1990s. Under theop ti mis tic sce nario, feed con ver sion ef fi ciency inde vel oped coun tries im proves by only 0.5 per centper year. This lower rate re flects less scope foradopt ing tech nol ogy from other re gions. The re sultis that in 2020 de vel op ing coun tries pro duce ap -proxi mately 60 per cent more meat per kilo gram offeed than they do in the base line pro jec tions. Theef fect is half as large in de vel oped coun tries.
In the sec ond, “pes si mis tic” sce nario, feed con -ver sion ra tios worsen pro gres sively. About 1 per -cent less meat per year is pro duced per kilo gram offeed in de vel op ing coun tries, with the ef fect com -pound ing over time. This sce nario re flects in creas -ing shifts from back yard pro duc tion to more in ten -sive feed ing in lots. Be cause in ten si fied feed ingprac tices have already taken hold in de vel opedcoun tries for the most part, the wors en ing con ver -sion ratio for de vel oped coun tries is as sumed to beonly 0.5 per cent per year. The re sult is that in 2020
29
Table 23—Difference between baseline projections and pro jec tions of ag gre gate con sump tion in2020 due to changes in as sump tions about feed conversion
In creas ing feed con ver sion ef fi ciency De creas ing feed con ver sion ef fi ciency
Re gionBeef andmut ton
Pork andpoul try Milk
Ce realused as feed
Beef andmut ton
Pork andpoul try Milk
Ce realused as feed
(per cent dif fer ence be tween new sce nario and base line)China 0 0 0 –15 0 0 0 17In dia 0 1 0 – 9 0 0 –1 11Other Asia (in clud ing WANA) 0 1 1 –10 –1 0 –1 12Latin Amer ica 1 1 0 –15 0 –1 –1 19Sub- Saharan Af rica 0 0 0 –12 0 0 0 14De vel op ing world 0 1 0 –13 0 0 –1 16De vel oped world 0 0 0 – 2 0 0 0 2World 0 0 0 – 7 0 0 0 8
Notes: The in creas ing feed con ver sion ef fi ciency sce nario as sumes an in crease in the ef fi ciency of con vert ing maize to meat. This re sults in a de -creased rate of in crease for con ver sion ra tios in re gions where they are in creas ing, and an in creased rate of de crease for con ver sion ra tios inre gions where they are de creas ing. The de creas ing feed con ver sion ef fi ciency sce nario as sumes a de crease in the ef fi ciency of con vert ing maize to meat. This re sults in anin creased rate of in crease for con ver sion ra tios in re gions where they are in creas ing, and a de creased rate of de crease for con ver sion ra tios inre gions where they are de creas ing. Mut ton in cludes sheep and goat meat. Milk in cludes all dairy prod ucts in liq uid milk equiva lents. WANA is West Asia and North Af rica.

de vel op ing coun tries pro duce ap proxi mately 60per cent less meat per kilo gram of feed than they doin the base line pro jec tions. The ef fect is half aslarge in de vel oped coun tries.
Table 23 shows the ef fects of the op ti mis tic andpes si mis tic feed con ver sion sce nar ios on con sump -tion in 2020. The most strik ing re sult is that largechanges in ei ther di rec tion have vir tu ally no im pacton live stock prod uct con sump tion. Large changes,how ever, are as so ci ated with dif fer ences in theamount of ce real used to pro duce live stock prod -ucts. Al though not shown, changes in feed con ver -sion ra tios also cause changes in the lo ca tion of live -stock pro duc tion in a com peti tive mar ket sys tem.A cru cial point to note in Table 23 is that the amount of ce real used for feed in 2020 changes by only2 per cent in de vel oped coun tries and 13 to 16 per -cent in de vel op ing coun tries, rela tive to the base line. The change is small be cause in creased feed ef fi -ciency leads to fal ling ce real feed prices, which encourages sub sti tu tion back into ce real feedsamong all pro duc ers, less en ing the over all ef fect ofchanges in ef fi ciency.
Pro gres sively lower feed ef fi ciency raises theworld price of ce real feed to the point where sub sti -tutes be come cost- effective. Pro duc tion shifts fromre gions and com modi ties that can not un der take thesesub sti tu tions at low enough cost to those that can.Coun tries such as Ar gen tina, with large pro duc tionca pac ity on ranges, are fa vored in the “pes si mis tic”sce nario be cause they can com pete more eas ily, withmore ex pen sive lot- fed beef, for ex am ple. The re verse is true under the “op ti mis tic” sce nario. Higher feedef fi ciency (lower con ver sion ra tios) tends to en cour -age in creased use of ce re als as feed and favor thosecoun tries where ce real sup ply is rela tively cheap andce real feed ing prac tices are well- established.
A strik ing re sult is that as long as ce re als areavail able world wide in rela tively elas tic sup ply, feed con ver sion does not play a criti cal ele ment in de ter -min ing human con sump tion of live stock prod ucts,al though it does af fect the com peti tive ness of in di -vid ual pro duc ers of live stock prod uct. Feed ef fi -ciency and rela tive ce real prices, there fore, are likelyto be quite im por tant in de ter min ing the geo graphicdi rec tion of trade.
30

5. Implications of the Livestock Revolutionfor World Trade and Food Prices
An emerg ing, cen tral fea ture of world mar kets formeat, milk, and feed is that they are in creas ingly in -ter linked. IM PACT im plic itly takes this in ter link -age into ac count with its an nual market- clearingfea ture, which al lows prices to move until sup plyand de mand are in bal ance. Do mes tic mar kets arecleared in the model through back ward and for ward it era tions be tween sets of do mes tic and worldprices. World prices dif fer from do mes tic ones bymeans of fixed price wedges speci fied for eachcoun try group that catch the ef fect of pro tec tion istpoli cies or major trans port costs to re mote mar kets.
Do mes tic prices in equi lib rium may al ways beabove or below world prices for meat and feed, de -pend ing on the coun try group in ques tion, but theyare al ways af fected in the model by move ments inworld prices. This in ter linked move ment of pricesis a bet ter ap proxi ma tion of re al ity than de linkedmar kets. In IM PACT, changes in de mand for live -stock prod ucts in Asia, for ex am ple, af fect live stock and ce real feed prices eve ry where. No part of theworld will be un af fected by the events in Asia orIndia or changes in feed use ef fi ciency.
Trade flows are mod eled in IM PACT as the netan nual re sid ual be tween pro duc tion and con sump -tion at world market- clearing prices for each coun trygroup and com mod ity, lead ing to ei ther net ex portsor net im ports (nega tive net ex ports) for that com -mod ity and coun try group in the year in ques tion.The model does not de ter mine trad ing part ners, butthe world wide sum of net ex ports for a given com -mod ity is zero for each year in equi lib rium.
Projected Trade in Livestock Food Products and Feed to 2020Net ex ports of spe cific com modi ties by re gion aregiven in Table 24, for 1993 and 2020. World beef
trade was mini mal in the early 1990s. Roughly 0.4mil lion met ric tons flowed on a net basis from thede vel oped to the de vel op ing world. WANA im -ported the most, while Latin Amer ica ac counted for 18 per cent of net world ex ports of beef. De vel opedcoun tries im ported a net total of 0.7 mil lion met rictons of pork from de vel op ing coun tries in the early1990s, much of it from China. De vel oped coun trieshad net ex ports of 0.5 mil lion met ric tons of poul -try, al most 19 mil lion met ric tons of milk, and a lit -tle more than 93 mil lion met ric tons of ce re als.
Beef is pro jected to be come the most sig nifi -cant meat im port of de vel op ing coun tries in 2020,at 2.7 mil lion met ric tons net. Pork will re main a net ex port of de vel op ing coun tries, though only mar -gin ally. Poul try im ports will rise to 1.8 mil lion met -ric tons. Milk will al most dou ble in size as a net ex -port of the de vel oped world. Cere als will con tinueto be the most sig nifi cant net agricultural ex portfrom the de vel oped to the de vel op ing world. Com -pared to 1993, net ex ports from de vel oped to de vel -op ing coun tries are pro jected to rise by 133 mil lionmet ric tons, an amount equiva lent to ap proxi mately60 per cent of the en tire U.S. av er age corn crop inthe early 1990s (FAO 1998).
Changes in Net Exports underChanged Asian AssumptionsThe live stock and feed trade pic ture in 2020changes sig nifi cantly under the se vere Asian cri sisand high In dian meat con sump tion sce nar ios(Table 25). The ex treme as sump tions in the Asiancri sis sce nario do not change ag gre gate live stockcon sump tion by much. How ever, they do pro motelarge changes in pro jected world ce real feed flows.The changes in feed flows are in fact the most sig -
31

32
Table 24—Net ex ports of vari ous live stock prod ucts in 1993 and 2020, baseline scenario
Beef Pork Poul try Milk Ce re als
Re gion 1993 2020 1993 2020 1993 2020 1993 2020 1993 2020
(mil lion met ric tons)
China 0.1 0.1 0.7 0.3 0.1 0.3 – 0.9 0.5 –0.9 –46.2Other East Asia – 0.4 – 0.6 0.0 – 0.1 – 0.3 – 0.6 – 0.5 – 0.4 –20.0 –31.9In dia 0.1 0.1 0.0 – 0.1 0.0 0.0 0.0 0.1 1.3 –7.1Other South Asia 0.0 – 0.3 0.0 0.0 0.0 – 0.3 – 0.6 – 2.8 –4.5 –21.9South east Asia – 0.2 – 0.6 0.2 0.6 0.1 0.5 – 4.0 –7.8 –3.2 –5.4Latin Amer ica 0.7 0.6 – 0.2 – 0.2 0.1 – 0.1 – 5.7 – 5.6 –16.0 –13.0WANA – 0.7 –1.7 0.0 0.0 – 0.4 –1.3 – 5.0 –12.2 –37.7 –74.6Sub- Saharan Af rica 0.0 – 0.2 0.0 – 0.1 – 0.1 – 0.2 –1.5 –1.8 –11.6 –24.9De vel op ing world – 0.4 – 2.7 0.7 0.2 – 0.5 –1.8 –18.7 – 30.9 –93.3 –226.1De vel oped world 0.4 2.7 – 0.7 – 0.2 0.5 1.8 18.7 30.9 93.3 226.1
Source: Pro jec tions are from IM PACT. Notes: Net trade in 2020 is pro jected pro duc tion mi nus con sump tion for the com mod ity and re gion shown. Met ric tons are three- year mov ing av er -
ages cen tered on the two years shown and, for meat, re fer to car cass weight. Milk is cow and buf falo milk and milk prod ucts in liq uid milkequiva lents. Ce re als in clude wheat, maize, rice, bar ley, sor ghum, mil let, rye, and oats. Net ex port fig ures may not sum to zero over all be -cause of round ing. WANA is West Asia and North Af rica. Mi nus signs in di cate im ports.
Table 25—Difference between baseline pro jec tions of net ex ports in 2020 and projections withchanges in as sump tions about the Asian crisis and Indian consumption
Se vere Asian cri sis High In dian meat con sump tion
Re gionBeef andmut ton
Pork andpoul try Milk Ce re als
Beef andmut ton
Pork andpoul try Milk Ce re als
(per cent dif fer ence be tween new sce nario and base line)
China 211 556 62 27 169 612 321 – 2In dia 86 53 18,857 19 – 4,038 – 2,719 – 55,464 – 480Other Asia (in clud ing WANA) 21 293 13 –1 28 66 30 4Latin Amer ica –172 – 527 –55 4 168 176 95 – 2Sub- Saharan Af rica –112 –119 – 90 –15 141 24 157 33De vel op ing world 2.9 261 43 4 – 47 4 – 83 –10De vel oped world – 2.9 – 261 – 43 – 4 47 – 4 83 10
Notes: The se vere Asian cri sis in cor po rates lower pro jected in come growth and de pre cia tion in ex change rates for coun tries in Asia. De pend ing onthe coun try, in come growth pro jec tions are 30 – 45 per cent lower than in the base line sce nario, and ex change rate de pre cia tion re sults in5 –13 per cent higher do mes tic prices. The high In dian meat con sump tion sce nario in cor po rates a shift in tastes to ward con sump tion of ani mal foods and in creases in pro duc -tion and feed use ra tios by In dian live stock pro duc ers. In come elas tici ties for ani mal prod ucts rise to be tween 1.5 and 2.0, de pend ing on thecom mod ity. The trend growth rate of In dian herd size rises by 0.3 – 0.7 per cent (de pend ing on the com mod ity), and feed con ver sion ra tiosrise above those typi cal in de vel op ing coun tries. Mut ton in cludes sheep and goat meat and edi ble prod ucts. Milk in cludes all dairy prod ucts in liq uid milk equiva lents. The large per cent age changes for meat and feed in In dia re flect a low ini tial base. WANA is West Asia and North Af rica.

nifi cant re sult of the se vere Asian cri sis as sump -tions, es pe cially be cause the ab so lute amounts offeed traded in the base line sce nario are al readylarge. Base line live stock trade is rela tively mod est,which should be borne in mind when in ter pret ingthe large per cent age changes shown for live stockitems in most cases.
Geo graphi cally the se vere Asian cri sis sce nario sharply de creases pro jected net im ports of live stock foods and de creases pro jected net ex ports fromLatin Amer ica and Sub- Saharan Af rica.10 Pro jec -tions of net im ports of feed grains by Asia also de -cline ap pre cia bly, by as much as 27 per cent inChina. Net ce real feed im ports by de vel op ing coun -tries de cline by 4 per cent. Net Chi nese meat ex ports rise by 3.4 mil lion met ric tons and milk ex ports riseby 0.3 mil lion met ric tons.
For Asia other than China and India, the se vereAsian cri sis sce nario changes the re gion from a netmeat im porter in 2020 to a net ex porter of 3.2 mil -lion met ric tons. The re gion’s net milk im ports de -crease by 5.3 mil lion met ric tons. The ef fects of theAsian cri sis de crease do mes tic de mand and in -crease com peti tive ness in world mar kets. India re -mains a minor par tici pant in world trade of live -stock prod ucts in 2020 under the base line and Asian cri sis sce nar ios. Coun tries out side Asia tend to in -crease their im ports of live stock prod ucts under se -vere Asian cri sis as sump tions be cause of lowerworld prices.
The high In dian meat (and milk) con sump tionsce nario turns India into a major world im porter ofmeat, milk, and ce real feed in 2020, a sub stan tialshift from its minor trad ing role in the base line pro -jec tions (Table 25). Other re gions of the world in -crease their net ex ports of meat and milk, al thoughChina and Latin Amer ica ac tu ally mar gin ally in -crease their im ports of ce real feed in re sponse to the ex panded meat and milk ex port op por tu ni ties. Thevery large per cent age changes for India are causedby the very low pro jected trade lev els in the base -line pro jec tion. Base line net ex ports of 77,000 met -ric tons of liq uid milk equiva lents in 2020 turns into 42.6 mil lion met ric tons of net im ports in the highIn dian meat con sump tion sce nario. Even in the face
of the un re al is tic as sump tions of the high In diansce nario, the world sys tem is flexi ble enough to ad -just with out major dis lo ca tions in con sump tion.
Changes in Net Exports underChanged Assumptions aboutFeed EfficiencyThe pre vi ous chap ter as sessed the sen si tiv ity ofbase line re sults to as sump tions about feed con ver -sion ra tios and found that con sump tion pat terns oflive stock prod ucts did not change much, but ce realuse as feed rose or fell de pend ing on whether ef fi -ciency de creased or in creased. The re sults are dif -fer ent for trade, as shown by the wide geo graphicvaria tion in trade pro jec tions rela tive to the base line (Table 26).
An equal per cent age increase in feed con ver sionef fi ciency ap plied to all de vel op ing coun tries leadsto dif fer ing re sults in dif fer ent coun tries, in clud ing a25 per cent in crease in net ex ports of beef from Indiaand a 9 per cent de cline in net beef ex ports fromChina. The price changes that re sult from de creas ingfeed con ver sion ef fi ciency work to in crease net ex -ports of ce real feed from the de vel oped coun tries,India, and Sub- Saharan Af rica, and in crease net im -ports of ce real feed by China and Latin Amer ica. The small per cent age of trade in total base line pro duc tion and con sump tion causes the large percentage tradere sponses seen in some cases.
Past Trends in Real World Pricesfor Crop and Livestock Productsand Projections to 2020 underDifferent ScenariosDe bates over the use of ce re als as feed need to becast in the con text of stead ily lower re turns to feed -ing cat tle for meat pro duc tion over the past 25years. Real world ag ri cul tural prices have slippedstead ily rela tive to manu fac tured goods prices since the early 1970s (Table 27). Clearly, live stock
33
10 The con cept of “net ex ports” could equally well be ex pressed in this case as in creas ing net ex ports from Asia or de creas ing net imports by Latin Amer ica and Sub- Saharan Af rica.

producers have felt the pain in re cent years. Beef in1994–96 was priced at only 34 per cent of itsinflation- adjusted level in 1970–72, while maizewas 54 per cent of its inflation- adjusted price in thesame pe riod.
Fur ther more, the 10 per cent global ex pan sionof ce real feed use by weight be tween the early
1980s and 1990s (Table 15) oc curred at a timewhen maize and soy beans de clined in price by more than one- third. This lends sup port to the ar gu mentthat ad di tional con cen trate feeds will be sup pliedwith lit tle real in crease in price. This ar gu ment istested by the IM PACT model, which pro duces a se -ries of market- clearing world prices in equi lib rium
34
Table 26—Difference between baseline pro jec tions of net ex ports in 2020 and projections withchanges in as sump tions about feed conversion efficiency
In creas ing feed con ver sion ef fi ciency De creas ing feed con ver sion ef fi ciency
Re gionBeef andmut tonc
Pork andpoul try Milk Ce re als
Beef andmut ton
Pork andpoul try Milk Ce re als
(per cent dif fer ence be tween new sce nario and base line)
China – 9 16 – 6 46 7 – 21 5 – 53In dia 25 2 –1,075 – 32 – 26 – 2 1,075 36Other Asia (in clud ing WANA) –1 – 3 8 5 1 3 – 9 – 6Latin Amer ica – 5 –14 1 26 6 14 –1 – 40Sub- Saharan Af rica – 3 8 46 – 31 1 –11 – 50 34De vel op ing world – 2 2 6 9 2 – 3 –7 –12De vel oped world 2 – 2 – 6 – 9 – 2 3 7 12
Notes: The in creas ing feed con ver sion ef fi ciency sce nario as sumes an in crease in the ef fi ciency of con vert ing maize to meat. This re sults in a de -creased rate of in crease for con ver sion ra tios in re gions where they are in creas ing, and an in creased rate of de crease for con ver sion ra tios inre gions where they are de creas ing. The de creas ing feed con ver sion ef fi ciency sce nario as sumes a de crease in the ef fi ciency of con vert ing maize to meat. This re sults in anin creased rate of in crease for con ver sion ra tios in re gions where they are in creas ing, and a de creased rate of de crease for con ver sion ra tios inre gions where they are de creas ing. Mut ton in cludes sheep and goat meat and edi ble prod ucts. Milk in cludes all dairy prod ucts in liq uid milk equiva lents. WANA is WestAsia and North Af rica.
Table 27—Past trends in real prices of se lected crop, feed, and live stock prod ucts
Year Wheat Rice Maize Soy beans Soy meal Fish meal Beef Pork Poul try Lamb Milk
(con stant 1990 US$/met ric ton)
1970–72 232 524 215 476 415 750 5,144 n.a. n.a. 3,248 4851980–82 236 534 169 384 338 615 3,536 2,344 1,474 3,730 4131990–92 135 288 104 234 195 444 2,585 1,781 1,139 2,440 2801994–96 156 270 116 238 192 424 1,761 n.a. 1,113 2,474 261
World Bank pro jec tions2000 135 279 102 230 189 n.a. 1,773 n.a. n.a. n.a. n.a.2010 118 262 92 236 196 n.a. 1,629 n.a. n.a. n.a. n.a.
Sources:Past data are from USDA 1997a and b, IMF 1997, and World Bank 1993. World Bank pro jec tions and the Manu fac tur ing Unit Value in dexused for ex press ing val ues in con stant 1990 U.S. dol lars are from World Bank 1997.
Notes: Wheat is U.S. no. 1, hard red win ter, or di nary pro tein, ex port price de liv ered at Gulf ports for ship ment within 30 days. Rice is Thai 5 per -cent bro ken, WR, milled, in dica tive sur vey price, gov ern ment stan dard, f.o.b. Bang kok. Maize is U.S. no. 2, yel low, f.o.b. U.S. Gulf ports.Soy beans are U.S. c.i.f. Rot ter dam. Soy meal is any ori gin, Ar gen tine 45 – 46 percent ex trac tion, c.i.f. Rot ter dam, prior to 1990, U.S. 44 per -cent. Fish meal is any ori gin, 64 – 65 percent, c.i.f. Ham burg, n.f.s. Beef is Aus tra lian/New Zea land, cow fore quar ters, fro zen bone less,85 per cent chemi cal lean, c.i.f. U.S. port (East Coast), ex- dock. Pork is Euro pean Com mu nity pork, slaugh ter whole sale price. Poul try isbroil ers, twelve- city com pos ite whole sale price, ready- to- cook, de liv ered. Lamb is New Zea land, fro zen whole car casses, whole sale price,Smith field mar ket, Lon don. Milk is U.S. whole milk sold to plants and deal ers, U.S. De part ment of Ag ri cul ture. n.a. in di cates that com pa -ra ble prices for those years are not avail able.

(Table 28). For com pari son, single- equation pricepro jec tions to 2010 by the World Bank are re portedat the bot tom of Table 27.
Com pared to the World Bank pro jec tions to2010, the IM PACT base line pro jec tions show 38per cent higher maize prices and 3.5 per cent higherbeef prices. The global food sup ply and de mand ap -proach of IM PACT cap tures the ef fect of the Live -stock Revo lu tion on ce re als prices, whereas single- equation meth od ol ogy does not. Even so, IM PACTproj ects that real world maize prices in 2010 will beonly about 10 per cent above ac tual 1994–96 prices,which were his tori cally low. Thus, the Live stockRevo lu tion pre vents ce real prices in the base line pro -jec tions from fal ling fur ther from their cur rently lowlev els, and per haps even in creases them slightly, butno where near their level in the early 1980s.
The se vere Asian cri sis as sump tions de creasereal world prices in 2020 by 7 per cent for maize and 5 per cent for beef. These are sig nifi cant ef fects, butthe as sump tions for this sce nario are ex treme be -cause they posit that the cri sis lasts though 2020.The high In dian meat sce nario in creases worldmaize prices by 13 per cent and world beef prices by 9 per cent. Chang ing tastes in India have evengreater ef fects on world live stock mar kets than does
a se vere eco nomic cri sis in Asia, but in the op po sitedi rec tion.
In creas ing feed con ver sion ef fi ciency low ersreal world maize prices by 17 per cent rela tive tobase line pro jec tions for 2020. De creas ing feed con -ver sion ef fi ciency in creases maize prices by 21 per -cent. Live stock prices, on the other hand, are hardlyaf fected. Ce real pro duc ers and con sum ers clearlyhave a lot at stake in feed con ver sion ef fi ciency.Live stock pro duc ers in in di vid ual coun tries have alot at stake as well, even if tech nol ogy is shared byall pro duc ers, be cause in creas ing feed ef fi ciency fa -vors some pro duc ers while de creased feed ef fi -ciency fa vors oth ers. Live stock con sum ers havesur pris ingly lit tle at stake, at least as far as the costof live stock food prod ucts is con cerned.
Why Is the Livestock RevolutionNot Likely to Raise World CerealPrices Significantly?Com pari son of the IM PACT price pro jec tionsunder vari ous sce nar ios with the his tori cal rate ofde crease of real food prices in the last quar ter cen -tury sug gests that the rate of de cline of food prices
35
Table 28—Real prices of se lected crop and live stock prod ucts as pro jected by the IM PACT model
Year Wheat Rice Maize Soy beans Beef Pork Poul try Lamb Milk
(con stant 1990 US$/met ric ton)Base line prices
1992–94 148 275 126 263 2,023 1,366 1,300 2,032 234Base line pro jec tions
2010 146 293 127 244 1,835 1,260 1,175 1,915 2172020 133 252 123 234 1,768 1,209 1,157 1,842 199
Se vere Asian cri sis sce nario pro jec tions
2020 124 248 114 221 1,676 1,104 1,074 1,807 187High In dian meat con sump tion sce nario pro jec tions
2020 148 268 139 267 1,927 1,287 1,259 2,203 219In creas ing feed con ver sion ef fi ciency sce nario pro jec tions
2020 126 243 102 228 1,738 1,188 1,134 1,817 196De creas ing feed con ver sion ef fi ciency sce nario pro jec tions
2020 141 262 149 242 1,802 1,233 1,183 1,870 202
Sources:The up dated IM PACT base line pro jec tions and the se vere Asian cri sis s ce nario are from Rosegrant et al. 1997 and Rosegrant and Ringler 1998.Notes: The sce nar ios are in de pend ent of each other. The IM PACT baseline prices in 1992–94 are fully com pa ra ble to the ac tual se ries given in Ta ble 27.

dur ing the next quar ter cen tury is likely to be muchweaker than in the past. This is un doubt edly a re sult of the Live stock Revo lu tion. Real ce real prices,how ever, are not likely to rise very much by 2020,con trary to the fears of some re ported in Chap ter 1.
The pri mary ex pla na tion for IM PACT’s pro -jec tion that ce real prices will con tinue to be loweven as de mand for both food and feed in creases isthat the world is thought to have con sid er able re -serve ca pac ity for ad di tional ce real pro duc tion.This as sump tion not only fits the evi dence of thepast 25 years, dur ing which world pro duc tion out -put changed in re sponse to price, but also ac cordswith the doz ens of price re sponse pa rame ters for ce -re als (for 37 coun tries and re gions times a halfdozen crops) built into the model and mostly takenfrom in de pend ent sources (Rosegrant, Agcaoili- Sombilla, and Perez 1995; Pinstrup- Andersen,Pandya- Lorch, and Rosegrant 1997).
The tra di tional ex pla na tion for the high sup plyre spon sive ness of ce re als found in the em piri cal lit -era ture is that the large grain- exporting coun tries,such as Aus tra lia, Can ada, and the United States,have the abil ity to bring large amounts of land typi -cally not sown to grain into ce real pro duc tion asprices rise. Fur ther more, ce real cul ti va tion by thelarge grain ex port ers usu ally is less input- intensivethan in many im port ing coun tries. Av er age wheatyields in Brit ain, for ex am ple, are much higher thanin the United States. This leaves con sid er able scopefor ex port ing coun tries to in crease pro duc tionthrough higher fer til izer use, which be comes prof it -able when ce real prices are high. The tre men douspro duc tiv ity in creases in ce re als in re cent years alsoat test to the spur of prices. These in creases have
come about to a large ex tent in re sponse to the higher ce real prices that made in vest ing in pro duc tion in no -va tions eco nomic (Hayami and Rut tan 1985).
An other ex pla na tion of the high sup ply re spon -sive ness of ce re als is that in a sys tem of global mar -kets, where ac tors all over the world re spond tochang ing price in cen tives, in di vid ual shocks aresmoothed out over time through myr iad ad just -ments through out the sys tem. In other words, worldsup ply will be more price- responsive than in di vid -ual coun try sup ply, a phe nome non well- captured inIM PACT.
A final phe nome non of di rect rele vance to ce -real sup ply is that in areas con tain ing a sig nifi cantshare of the world’s poor, the rise in the con sump -tion of calo ries from ani mal prod ucts is matched bya de crease in calo ries from starchy sta ples. Peo plein Chi na’s rural areas, for ex am ple, con sumednearly 200 kilo grams per cap ita of grain di rectly asfood in 1991, while peo ple in the richer urban areascon sumed an av er age of 130 kilo grams per cap ita, a fig ure much closer to av er age con sump tion lev elselse where in the de vel op ing world (Huang andBouis 1996). Rice and wheat are the grains typi -cally con sumed in China. These grains have sig nifi -cantly lower av er age yields per hec tare than maize,a feed grain in creas ingly cul ti vated by Chi nesefarm ers. Thus, sub sti tu tion of meat and milk forgrain in the diet lib er ates some grain from di rectcon sump tion as food, and the con se quent in creasein ag gre gate grain sup ply is am pli fied by the rela -tively higher yields of feed grains per hec tare. All ofthis sug gests that the Live stock Revo lu tion is in ti -mately wrapped up with nu tri tional and food se cu -rity, the sub ject of the next chap ter.
36

6. Nu tri tion, Food Se cu rity, and Pov erty Al le via tion
The trends noted in the pre vi ous chap ters stronglysug gest that live stock con sump tion pat terns in de -vel op ing coun tries are rap idly con verg ing withthose in de vel oped coun tries, put ting se vere pres -sure on pro duc tion sys tems in de vel op ing coun triesto do the same. The con sid er able con tro versy inboth the popu lar and sci en tific lit era ture about thede sir abil ity of live stock con sump tion and pro duc -tion pat terns in the richer coun tries raises con cernsabout what the Live stock Revo lu tion por tends forhuman wel fare in the poorer coun tries. It seemsprob able, for ex am ple, that mas sively largeramounts of ce re als will be used as feed to pro duceitems con sumed pri mar ily by better- off urban peo -ple in coun tries where out right lack of food is stillcom mon (Brown and Kane 1994; Good land 1997;Pi men tel 1997).
These con cerns raise com plex nu tri tional, foodse cu rity, and pov erty al le via tion is sues. Nu tri tionalis sues in this con text in clude the ef fect of con sump -tion of spe cific ani mal food prod ucts on health andwell- being in spe cific situa tions. Food se cu rity is -sues en com pass the abil ity of peo ple to se cureenough food on a regu lar basis for healthy and pro -duc tive lives. Pov erty al le via tion is sues in clude theex tent to which the pro duc tion and sale of ani malprod ucts might lead to wide spread net im prove -ment in the live li hood of the rural poor.
The IM PACT pro jec tions shed light on likelytrends in ce real and ani mal prod uct prices under dif -fer ent sce nar ios for the Live stock Revo lu tion. Theim pact of live stock on the pur chas ing power of thepoor, the other side of the ce real af forda bil ity issue,must be as sessed with highly dis ag gre gated data.As will be seen below, evi dence from house holdstud ies around the de vel op ing world sug gests thatin many cases the rural poor, es pe cially women, geta larger share of their in come from live stocksources than do the rela tively wealthy. These find -ings raise ques tions about the mo ral ity of blan ket
“anti- livestock” po si tions in poli cy mak ing. Butwhether the tra di tional live stock en ter prises of therural poor can co ex ist with in creased in dus tri ali za -tion of live stock pro duc tion is an open ques tion. Fi -nally, in creas ing in ten si fi ca tion of pro duc tion raisesother ethi cal is sues, in clud ing con cerns about ani mal wel fare and the un pleas ant ness suf fered by thosewho live down wind from major in dus trial hog farms.
As with other struc tural changes in the foodsec tor that are im por tant to human wel fare, such asthe Green Revo lu tion in ce re als, popu lar dis cus sionof the ef fect of the Live stock Revo lu tion on de vel -op ing coun tries is oc ca sion ally highly emo tionaland often im per fectly grounded in facts. The ob jec -tive of this chap ter is to show how the re search pre -sented in the rest of this paper re lates to the dis cus -sion of wel fare is sues.
The Livestock Revolution andNutrition in Developing CountriesThe dis cus sion of nu tri tional is sues in this sec tiondoes not ad dress the health ef fects of con sum ingcon tami nated food prod ucts. Those ef fects are dis -cussed in Chap ter 8. Even if con tami na tion can bedealt with, is in creased con sump tion of meat andmilk a good thing? Con cerns about medi cal prob -lems clearly as so ci ated with very high meat andmilk con sump tion in so cie ties such as the UnitedStates must be taken se ri ously (Bar nard, Nichol son, and How ard 1995). But some times these con cernsare ex trapo lated di rectly to de vel op ing coun tries infairly blan ket fash ion (Good land 1997; Pi men tel1997) and some times se lec tively, as in the case ofChi na’s cit ies (Geissler forth com ing).
Sci en tific con clu sions about the ef fects ani malprod ucts can have on nu tri tion in de vel op ing coun -tries not only de pend on the demo graph ics and in -come lev els of tar get groups and the com modi ties
37

under study (CAST 1997a), but they vary also be -cause of the meth od olo gies em ployed (Hu and Wil -lett 1998). And ran dom ized clini cal end point tri alsor other forms of in ves ti ga tion de signed to con trolfor spu ri ous cor re la tions when com par ing long- term “be fore” and “after” con di tions may be dif fi -cult to con duct.
One often- cited ap proach to study ing the linkbe tween meat con sump tion and health re lies on cor -re la tions be tween dis ease rates and pat terns of live -stock prod uct con sump tion across lo ca tions. Apromi nent ex am ple is a study that looks at such cor -re la tions across 65 coun ties of rural China (Chen etal. 1990). Yet while this ap proach raises is suesquickly and ex ploits large amounts of data, its re li -abil ity is open to ques tion as Chen et al. (1990)them selves point out. The China study could notfully con trol for other vari ables that might also ex -plain the re sults (Hu and Wil lett 1998).
Hu and Wil let re cently (1998) con ducted a thor -ough re view of the re la tion ship be tween con sump -tion of ani mal prod ucts and the risk of chronic dis -ease for the World Bank. The goal was to sortthrough con flict ing evi dence in order to pro videguid ance to the World Bank’s in vest ment poli cies inde vel op ing coun tries. They drew in evi dence fromall over the world, as sum ing that while diets and nu -tri tional needs change across en vi ron ments and work re gimes, human bi ol ogy proba bly does not.
Hu and Wil lett found that red meat (beef, pork,lamb) con sump tion be yond a low thresh old levelproba bly in creases the risks of coro nary heart dis -ease (CHD); dairy prod ucts may also do so but to alesser ex tent; eggs are proba bly un re lated to CHDup to one egg a day; and poul try and fish proba blyde crease CHD. Mod er ate red meat in take, how ever, may re duce the risk of hem or rhagic stroke in caseswhere ini tial in take lev els are very low. High lev elsof red meat in take may in crease the risk of vari ousforms of can cer, but sub sti tu tion of poul try and fishfor red meat proba bly re duces the risk. Dairy prod -ucts may be a risk fac tor in pros tate can cer. Hu andWil lett con clude that health pol icy in de vel op ingcoun tries should dis tin guish poul try and fish frombeef and pork be cause the former proba bly pro videgreater nu tri tional bene fit than the lat ter. Hu andWil lett also see bene fits from ex pan sion of egg anddairy con sump tion where con sump tion lev els are as low as they are in de vel op ing coun tries.
Authori ta tive lit era ture on human nu tri tion inthe de vel op ing world stresses the wide spreadpreva lence of mild to mod er ate protein- energy mal -nu tri tion af fect ing up to one- third of all chil drenand per haps a higher share of preg nant or lac tat ingwomen. The lit era ture em pha sizes the criti cal roleade quate bal ance and ade quate lev els of bioa vail -able pro tein, calo ries, and key mi cro nu tri ents (suchas vi ta min A, io dine, and iron) play in men tal andphysi cal de vel op ment (Cal lo way 1995; Sharma etal. 1996; Latham 1997; Neu mann and Har ris 1999;Geissler forth com ing). Re search also shows thatade quate, bal anced nu tri tion helps pre vent mor bid -ity. Ani mal prod ucts are por trayed in this lit era tureas ex cel lent sources of ab sorb able forms of iron,zinc, vi ta min B12, and re ti nol. Cer tain meats andmilk prod ucts are cited as vari ously being goodsources of thia min, cal cium, vi ta min B6, ri bo fla vin,vi ta min A, and other min er als re quired in higheramounts dur ing growth pe ri ods (Cal lo way 1995;Latham 1997; Neu mann and Har ris 1999).
Al though a large com bi na tion of crop- basednu tri ents could also pro vide the nec es sary aminoacids and trace nu tri ents to meet nu tri tional needs,se cur ing such a bal ance through out the year withvege ta ble mat ter alone is not easy for the rural poorin de vel op ing coun tries. On the other hand, in -creased con sump tion of even a rela tively small ad -di tional amount of meat and milk would sup ply thenec es sary pro tein and mi cro nu tri ents and a fairshare of needed ad di tional calo ries, es pe cially tochil dren, and would do so with a much less var iedvegetable- matter diet than using crops alone(Latham 1997; Hu and Wil let 1998; Geissler forth -com ing; Neu mann and Har ris 1999).
For all these rea sons the Live stock Revo lu tionap pears to have many po ten tial bene fits for nu tri -tion in de vel op ing coun tries. At pres ent these po -ten tial bene fits proba bly out weigh the po ten tial nu -tri tional costs. Whether nu tri ent bal ance is se curedthrough a wide va ri ety of crops or a smaller va ri etyof crop and ani mal prod ucts, good nu tri tion clearlyre quires the over all in take of an ade quate amount of food. The pri mary nu tri tional issue for most poorpeo ple in most de vel op ing coun tries proba bly re -mains se cur ing both an ade quate amount of food anda bal anced diet.
Once a per son regu larly con sumes ex cess foodcalo ries, the sorts of health prob lems as so ci ated
38
with ex cess con sump tion of cho les terol and satu -rated fatty acids in the de vel oped coun tries willproba bly be come more preva lent in de vel op ingcoun tries, es pe cially among the rela tively wealthyin urban areas. How ever, av er age per cap ita con -sump tion of meat and milk in de vel op ing coun triesin 2020 are pro jected to be less than half the pres entdeveloped- country av er age (see Table 16). At lev -els that low in 2020, the ma jor ity of peo ple on theplanet are un likely to face the prob lem of ex cessmeat and milk con sump tion for quite some time.
The pos si bil ity that the peo ple who could mostbene fit from in creased meat con sump tion may notshare in the Live stock Revo lu tion should be agreater con cern than over con sump tion. Whetherthey do bene fit will de pend prin ci pally on the evo -lu tion of food prices and the in comes of the needy,top ics dis cussed in the fol low ing sec tion.
The Livestock Revolution andFood Security of the PoorBoth ecolo gists and ani mal sci en tists, un like econo -mists, tend to view the ef fect of in creased ani malpro duc tion on food sup plies in de vel op ing coun -tries as a trade- off be tween using ce re als (and theland and water used to pro duce them) as food orfeed. Cal cu la tions are then pre sented to arguewhether extra pro duc tion of ani mal prod ucts addsor sub tracts from a hy po theti cal calo rie bal anceavail able for hu mans (CAST 1994; Pi men tel et al.1997; Good land 1997; Brown and Kane 1997).
Pro- livestock authors tend to stress that ru mi -nant ani mals in de vel op ing coun tries mostly usenatu ral grasses and other feed with lit tle use asfood. They also stress the im por tant non food uses of live stock (Fitz hugh 1998; CAST forth com -ing). “Anti- livestock” authors em pha size thatmonogas tric live stock ac count for much of thegrowth of pro duc tion under the Live stock Revo -lu tion, that these ani mals re quire high en ergyfeed such as ce re als, and that they do not fully re -place the ce real calo ries used to pro duce them.These authors also argue that because live stockfood prod uct con sump tion increases rap idly within come, the rich proba bly will bid away the food -stuffs of the poor in the mar ket place (Pi men tel1997; Brown and Kane 1997).
Econo mists tend to re duce the issue to whetherin creased ani mal pro duc tion in creases or de creasesce real and meat and milk prices rela tive to the in -comes of poor peo ple, other things being equal.This ap proach has the merit of de fin ing food se cu -rity in terms of the abil ity peo ple have to pur chasefood sta ples. But it does not ad dress fully whetherall mem bers of the house hold have physi cal ac cessto food at av er age world prices or whether peo plewho are sick can use fully ab sorb that food at alltimes. As sess ing the im pact of in creased live stockpro duc tion on house hold in comes and food prices is an im prove ment over non en ti tle ment ap proachesand about the best that can be done here.
The pre vi ous chap ter showed that the sim ple in -fer ence that in creased live stock con sump tion willsig nifi cantly raise ce real prices by 2020 does notmesh with the rather dif fer ent and com plex pic turedrawn by the IM PACT pro jec tions. Re call thatbase line, inflation- adjusted rice and wheat prices in2020 are pro jected to be 8 to 10 per cent below lev -els in the first half of the 1990s. Maize prices arepro jected to de cline by only 2 per cent. Fur ther more, av er age world ce real prices in the mid- 1990s wereonly about two- thirds (maize) to half (rice) their av -er age inflation- adjusted prices in the early 1980s(Table 27).
In the “worst- case” sce nario in ves ti gated byIM PACT, rice and wheat prices ex ceed theirinflation- adjusted lev els in 1992–94 by only 8–11per cent (Table 28). The price of maize goes up 21per cent. IM PACT also proj ects mod est long- termde clin ing price trends for vari ous meats and milk.The con sump tion pat terns of the rich may pre ventlive stock prod ucts from be com ing even more af -ford able to the poor, but they do not ap pear to belikely to raise the price of live stock prod ucts muchabove their cur rent lev els.
In sum, food prices have been de creas ing overthe long term, de spite rapid in creases in the use ofce real feeds. The Live stock Revo lu tion is likely toslow this de creas ing trend some what by 2020. Butthe trend re verses only under ex treme con di tions,and even if it does, the price in creases are ex pectedto be small rela tive to the real price de clines seensince the early 1980s. The Live stock Revo lu tion’sef fect on the food se cu rity of poor peo ple, throughce real prices, is likely to be far less im por tant thanits ef fect on the in come of the poor.
39
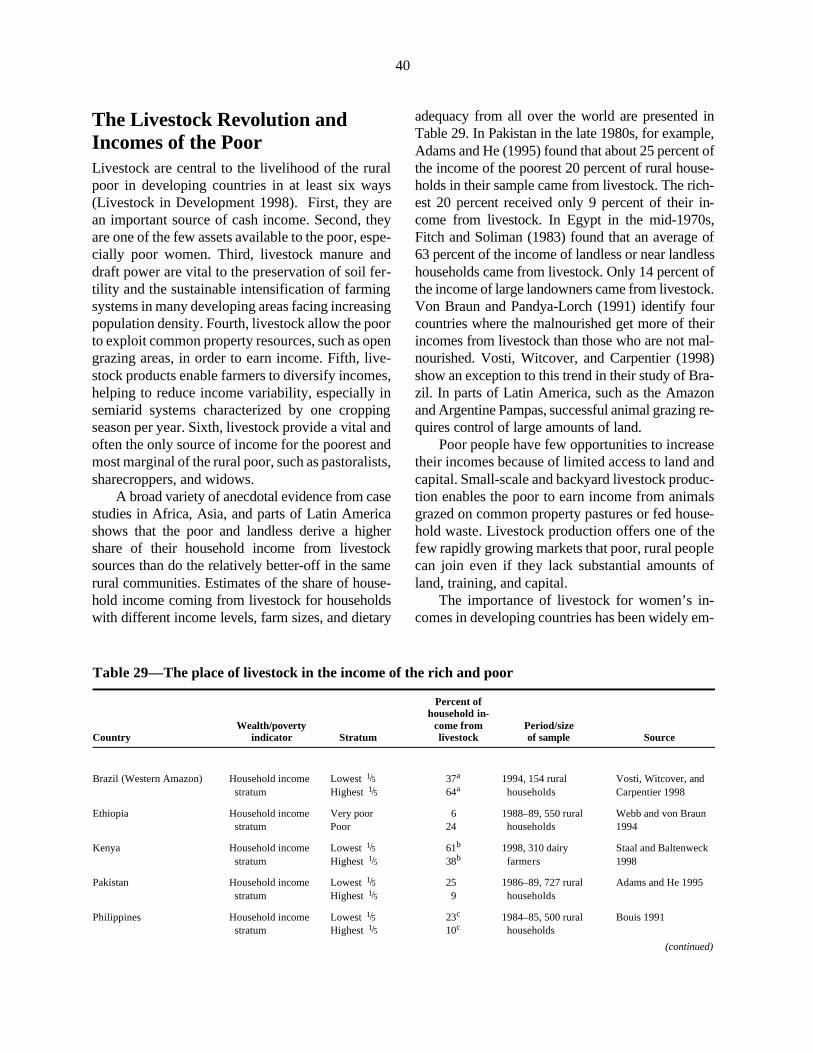
The Livestock Revolution andIncomes of the PoorLive stock are cen tral to the live li hood of the ruralpoor in de vel op ing coun tries in at least six ways(Live stock in De vel op ment 1998). First, they arean im por tant source of cash in come. Sec ond, theyare one of the few as sets avail able to the poor, es pe -cially poor women. Third, live stock ma nure anddraft power are vital to the pres er va tion of soil fer -til ity and the sus tain able in ten si fi ca tion of farm ingsys tems in many de vel op ing areas fac ing in creas ing popu la tion den sity. Fourth, live stock allow the poor to ex ploit com mon prop erty re sources, such as open graz ing areas, in order to earn in come. Fifth, live -stock prod ucts en able farm ers to di ver sify in comes,help ing to re duce in come vari abil ity, es pe cially insemi arid sys tems char ac ter ized by one crop pingsea son per year. Sixth, live stock pro vide a vital andoften the only source of in come for the poor est andmost mar ginal of the rural poor, such as pas tor al ists, share crop pers, and wid ows.
A broad va ri ety of an ec do tal evi dence from casestud ies in Af rica, Asia, and parts of Latin Amer icashows that the poor and landless de rive a highershare of their house hold in come from live stocksources than do the rela tively better- off in the samerural com mu ni ties. Es ti mates of the share of house -hold in come com ing from live stock for house holdswith dif fer ent in come lev els, farm sizes, and die tary
ade quacy from all over the world are pre sented inTable 29. In Paki stan in the late 1980s, for ex am ple,Adams and He (1995) found that about 25 per cent ofthe in come of the poor est 20 per cent of rural house -holds in their sam ple came from live stock. The rich -est 20 per cent re ceived only 9 per cent of their in -come from live stock. In Egypt in the mid- 1970s,Fitch and So liman (1983) found that an av er age of63 per cent of the in come of landless or near landlesshouse holds came from live stock. Only 14 per cent ofthe in come of large land own ers came from live stock. Von Braun and Pandya- Lorch (1991) iden tify fourcoun tries where the mal nour ished get more of theirin comes from live stock than those who are not mal -nour ished. Vosti, Wit cover, and Car pen tier (1998)show an ex cep tion to this trend in their study of Bra -zil. In parts of Latin Amer ica, such as the Ama zonand Ar gen tine Pam pas, suc cess ful ani mal graz ing re -quires con trol of large amounts of land.
Poor peo ple have few op por tu ni ties to in creasetheir in comes be cause of lim ited ac cess to land andcapi tal. Small- scale and back yard live stock pro duc -tion en ables the poor to earn in come from ani malsgrazed on com mon prop erty pas tures or fed house -hold waste. Live stock pro duc tion of fers one of thefew rap idly grow ing mar kets that poor, rural peo ple can join even if they lack sub stan tial amounts ofland, train ing, and capi tal.
The im por tance of live stock for women’s in -comes in de vel op ing coun tries has been widely em -
40
Table 29—The place of live stock in the in come of the rich and poor
CountryWealth/pov erty
in di ca tor Stra tum
Per cent ofhouse hold in -
come fromlive stock
Pe riod/sizeof sample Source
Bra zil (West ern Ama zon) House hold in come stra tum
Low est 1/5High est 1/5
37a
64a1994, 154 ru ral house holds
Vosti, Wit cover, andCar pen tier 1998
Ethio pia House hold in come stra tum
Very poorPoor
624
1988– 89, 550 rural house holds
Webb and von Braun1994
Kenya House hold in come stra tum
Low est 1/5High est 1/5
61b
38b1998, 310 dairy farm ers
Staal and Bal ten weck1998
Paki stan House hold in come stra tum
Low est 1/5High est 1/5
259
1986– 89, 727 ru ral house holds
Ad ams and He 1995
Phil ip pines House hold in come stra tum
Low est 1/5High est 1/5
23c
10c1984–85, 500 ru ral house holds
Bouis 1991
(con tin ued)
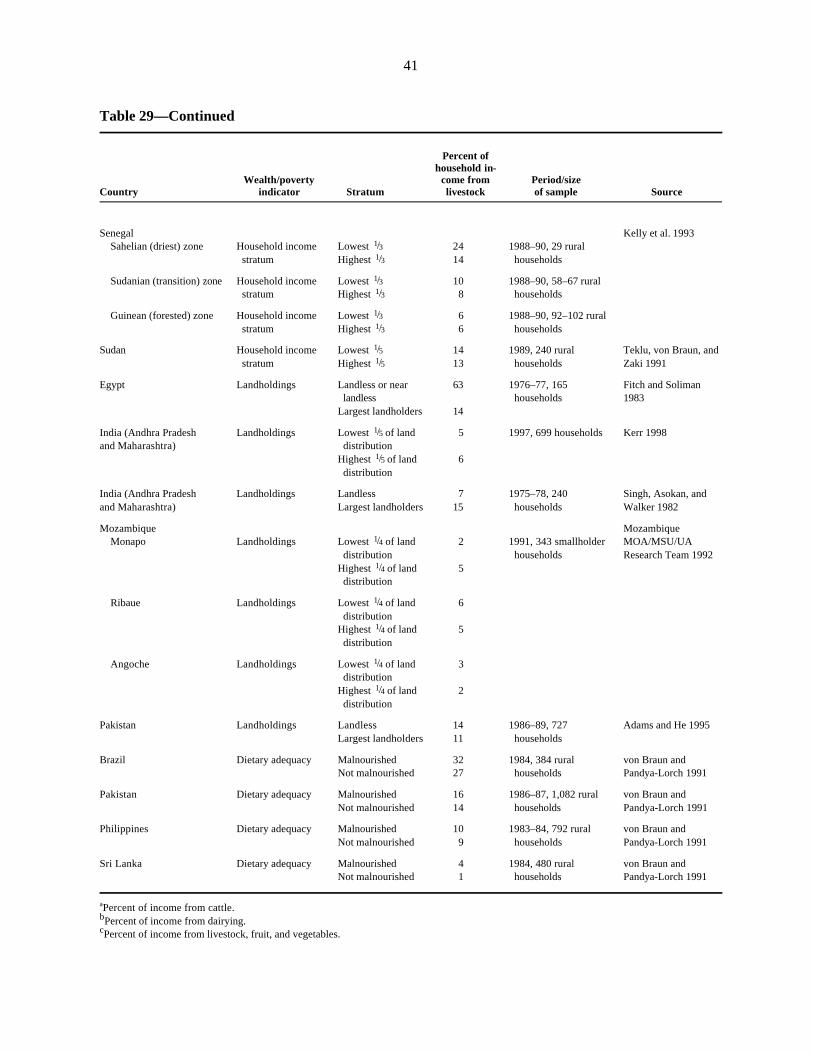
41
CountryWealth/pov erty
in di ca tor Stra tum
Per cent ofhouse hold in -
come fromlive stock
Pe riod/sizeof sample Source
Sene gal Sa he lian (dri est) zone House hold in come
stra tumLow est 1/3High est 1/3
2414
1988– 90, 29 ru ral house holds
Kelly et al. 1993
Su da nian (tran si tion) zone House hold in come stra tum
Low est 1/3High est 1/3
108
1988– 90, 58– 67 ru ral house holds
Guinean (for ested) zone House hold in come stra tum
Low est 1/3High est 1/3
66
1988– 90, 92– 102 ru ral house holds
Su dan House hold in come stra tum
Low est 1/5High est 1/5
1413
1989, 240 rural house holds
Teklu, von Braun, andZaki 1991
Egypt Land hold ings Landless or near landlessLargest landholders
63
14
1976–77, 165 households
Fitch and Soliman1983
In dia (Andhra Pradeshand Ma harash tra)
Land hold ings Low est 1/5 of land distributionHighest 1/5 of land distribution
5
6
1997, 699 households Kerr 1998
In dia (Andhra Pradeshand Ma harash tra)
Land hold ings LandlessLargest landholders
715
1975–78, 240 households
Singh, Asokan, andWalker 1982
Mo zam bique Monapo Landholdings Lowest 1/4 of land
distributionHighest 1/4 of land distribution
2
5
1991, 343 smallholder households
MozambiqueMOA/MSU/UAResearch Team 1992
Ribaue Landholdings Lowest 1/4 of land distributionHighest 1/4 of land distribution
6
5
Angoche Landholdings Lowest 1/4 of land distributionHighest 1/4 of land distribution
3
2
Pakistan Landholdings LandlessLargest landholders
1411
1986–89, 727 households
Adams and He 1995
Brazil Dietary adequacy MalnourishedNot malnourished
3227
1984, 384 rural households
von Braun andPandya-Lorch 1991
Pakistan Dietary adequacy MalnourishedNot malnourished
1614
1986–87, 1,082 rural households
von Braun andPandya-Lorch 1991
Philippines Dietary adequacy MalnourishedNot malnourished
109
1983–84, 792 rural households
von Braun andPandya-Lorch 1991
Sri Lanka Dietary adequacy MalnourishedNot malnourished
41
1984, 480 rural households
von Braun andPandya-Lorch 1991
aPer cent of in come from cat tle. bPer cent of in come from dairy ing.cPer cent of in come from live stock, fruit, and vege ta bles.
Table 29—Continued

pha sized (Quisumbing et al. 1995; Val di via, Dunn,and Sher bourne 1995). Dairy co op era tives have infact been a major means of bring ing women in poorareas suc cess fully into the cash econ omy in EastAf rica (Brok ken and Sey oum 1992), India (Schnei -der 1995), and Bo livia (Val di via, Dunn, and Sher -bourne 1995).
A pat tern that shows that the poor earn a highershare of their in come from live stock than do thewealthy raises the pos si bil ity that the Live stockRevo lu tion will be good for the poor. The revo lu -tion of fers two main rea sons for op ti mism. First, the poor can more eas ily im prove their in comes whenthey have a major stake in a sec tor that is grow ing.Sec ond, the cur rent rapid in ten si fi ca tion of ani malpro duc tion comes at a time when the rural poor des -per ately need higher re turns to their shrink ing landthan field crops alone can offer.
The main rea son for con cern is that in creasedin ten si fi ca tion might make small op era tors un com -peti tive com pared to large pro duc ers. But trueecono mies of scale in live stock pro duc tion may notbe great once ex plicit and im plicit gov ern ment sub -si dies to larger pro duc ers are taken into ac count.Large pro duc ers in many areas enjoy capi tal sub si -dies, tax holi days, free gov ern ment serv ices, ex on -era tion from cer tain pol lu tion and health re quire -ments, and sub si dies on pub lic graz ing land rentedin large units. Elimi na tion of sub si dies or their re di -rec tion to ward small- scale pro duc ers could shift the mar ket in favor of the poor.
A less trac ta ble prob lem is that large pro duc ersoften find it eas ier to con tract or ver ti cally in te gratewith proc es sors than do small pro duc ers in de vel op -ing coun tries, and there are major econo mies ofscale in the proc ess ing of per ish able prod ucts.Trade in per ish ables bene fits greatly from proc ess -ing ar range ments that stan dard ize qual ity and makethe quan tity sup plied plen ti ful and re li able. Largepro duc ers also bene fit greatly from mar ket ing in fra -struc ture that al le vi ates the need to sell per ish ablesthe same day to the end user, as is tra di tion ally thecase in the de vel op ing trop ics.
Small op era tors can over come these bar ri ersby join ing in sti tu tions of col lec tive ac tion, suchas out grower schemes or par tici pa tory pro ducerco op era tives (Staal, Del gado, and Nichol son1997; Del gado 1998). But the es tab lish ment ofsuch in sti tu tions re quires or gani za tion and
investment that does not cur rently exist in mostde vel op ing coun tries.
Op por tu ni ties for rapid growth are rare in poorrural areas. Live stock pro duc tion may pro vide onesuch op por tu nity. The poor around the world haveshown their abil ity to pro duce live stock, and the fu -ture for the sec tor as a whole looks good. How ever,poli cy mak ers and re search ers ur gently need to findthe best market- oriented means for en sur ing thatsmall op era tors bene fit from growth in the live stocksec tor. To ac com plish this, poli cies will have tofocus on rural or gani za tion. Live stock pro duc tionmay pro vide one of the major op era tional themes inef fec tive rural pov erty al le via tion dur ing the next 20years, but things could also go the other way. Fail ureto ad dress how poli cies have tended to skew live -stock de vel op ment in favor of overly large pro duc -tion units, and fail ure to pro mote the ver ti cal co or di -na tion of small op era tors with proc es sors, will leadto a major missed op por tu nity. Worse, those whoneed the ac tiv ity most could be driven out of live -stock pro duc tion.
Other Ethical Issues Raised byTrends in Livestock ProductionSome non food ethi cal is sues as so ci ated with theLive stock Revo lu tion can not be ne glected. To datethese is sues have mani fested them selves pri mar ily in de vel oped coun tries, where in ten si fi ca tion has pro -ceeded the most. But there is no rea son to think thatthese con cerns will not show up else where soon.
Ani mal wel fare is a grow ing ethi cal con cern inthe era of mas sive hog fac to ries and in dus trialchicken houses (CAST 1997b). As pro duc tion in -ten si fies in de vel op ing coun tries, con cerns overani mal wel fare will surely sur face. Evi dence forthis is sug gested by cul tural at ti tudes to ward cowsin India, by the strong re lig ious views on rit ualslaugh ter held in many parts of the world, and bythe es teem that tra di tional stock rais ers eve ry wherehold for their cat tle.
The air and water pol lu tion that in ten sive ani -mal in dus tries oc ca sion ally cre ate for their neigh -bors, es pe cially in pe ri ur ban areas with lit tle par tici -pa tory gov ern ment, is also likely to bring in creasedcon flict. Pure mar ket forces in the ab sence of ef fec -tive po liti cal back lash could cre ate hog la goons
42

along side resi den tial neigh bor hoods. Ad vanceplan ning and ap pro pri ate regu la tion by ac count ablegov ern ment authori ties can help over come the factthat mar kets do not al ways re flect the full costsborne by all par ties, in clud ing neigh bors.
Fi nally, ge netic en gi neer ing could push the lim -its of ethi cal de bates in the next 20 years (see Chap -ter 9 for a dis cus sion of the tech nol ogy). Clon ing ofani mals raises un der stand able con cerns about pos si -ble abuses, par ticu larly given the temp ta tion to work
next on hu mans. Yet the in ser tion of human genesinto trans genic live stock in order to mass pro ducehuman pro teins in ani mal milk may be es sen tial forlow er ing the pro duc tion costs of nu mer ous phar ma -ceu ti cals that re main out of reach for all but the rela -tively rich. Such ex peri ments may also lead to thede vel op ment of new drugs, for ex am ple for the treat -ment of cys tic fi bro sis (Gil lis 1999). Re gard less of the view point adopted, few peo ple any where who areaware of the is sues will re main mor ally in dif fer ent.
43

7. Environmental Sustainability
Rap idly in creas ing live stock pro duc tion can causese ri ous dam age to the en vi ron ment, but it can alsobe har mo ni ous with or even bene fi cial to the en vi -ron ment when ap pro pri ate types and lev els of pro -duc tion are in place.11 Tech no logi cal prog ress canfur ther re duce dam ag ing ef fects while in creas ingout put. This chap ter will iden tify the en vi ron -mental prob lems that are now or likely to be comethe most se vere and the poli cies that ex ac er batethese prob lems. It will also iden tify tech nolo giesand poli cies that can en hance the en vi ron mentalsus tain abil ity of live stock pro duc tion as the Live -stock Revo lu tion un folds.
Livestock-EnvironmentCompatibilityHis tori cally, live stock have played a criti cal role inthe pro cess of ag ri cul tural in ten si fi ca tion. Live -stock re cy cle nu tri ents on the farm, pro duce valu -able out put from land that is not suit able for sus -tained crop pro duc tion, and pro vide en ergy andcapi tal for suc cess ful farm op era tions. The in te gra -tion of live stock and crop op era tions is still themain ave nue for sus tain able in ten si fi ca tion of ag ri -cul ture in many re gions of the de vel op ing world.This is es pe cially true in semi arid and sub hu mid sa -vanna areas re ceiv ing 600 to 1,200 mil li me ters ofan nual rain fall. Much of the in te rior of West, East,and South ern Af rica, north east Bra zil, and much ofSouth Asia be long to this agro cli matic cate gory.
Live stock can help main tain soil fer til ity insoils lack ing ade quate or ganic con tent or nu tri ents(Ehui et al. 1998). Add ing ma nure to the soil in -creases the nu tri ent re ten tion ca pac ity (or cation- exchange ca pac ity), im proves the soil’s physi cal
con di tion by in creas ing its water- holding ca pac ity,and im proves soil struc ture. Ani mal ma nure alsohelps main tain or cre ate a bet ter cli mate for microflora and fauna in soils. Graz ing ani mals im provesoil cover by dis pers ing seeds, con trol ling shrubgrowth, break ing up soil crusts, and re mov ing bio -mass that oth er wise might be fuel for brush fires.These ac tivi ties stimu late grass til ler ing and im -prove seed ger mi na tion, and thus im prove landqual ity and vege ta tion growth.
Live stock en able farm ers in the resource- poorareas of de vel op ing coun tries to al lo cate plant nu tri -ents across time and space. Land that can not sus tain crop pro duc tion can be used for graz ing to pro ducema nure that can make other land more pro duc tive.Graz ing live stock can ac cel er ate trans for ma tion ofnu tri ents in crop by prod ucts to fer til izer, speed ingthe pro cess of land re cov ery be tween crops.
Large parts of the de vel op ing world, es pe -cially in sub hu mid Af rica, are only now be gin -ning to gain the bene fits of farm ing that mixescrops and live stock. As dis ease con straints are re -moved, large live stock ani mals can be in te gratedinto crop op era tions, pro vid ing farm power andma nure. In other parts of the world, such as Asia,high crop ping and land- use in ten si ties have beensus tained over cen tu ries by in te grat ing crop andlive stock ac tivi ties. Live stock con tinue to be kept for ma nure and power in these areas, but foodpro duc tion is be com ing more promi nent with in -creas ing com mer ciali za tion.
Mixed live stock and crop farm ing takes on adif fer ent form in the more in ten si fied pro duc tionsys tems in both de vel oped and de vel op ing coun -tries. Crop and live stock op era tions are in te gratedinto a local sys tem where waste from each op era -tion is proc essed and trans ported to be come a cheap
44
11 This chap ter draws on Ste in feld, de Haan, and Black burn (1997) and de Haan, Ste in feld, and Black burn (1997).

input for the other. Re gion wide in te gra tion of live -stock and crop op era tions emerges fairly soon inmixed farm ing. Small- scale rural in fra struc ture,such as feeder roads and light mo tor ized or ani maltrans port, fa cili tate this in te gra tion. In more in ten -sive in dus trial farm ing sys tems, the po ten tial forover load ing fields with nu tri ents from farm ma nurebe comes a prob lem.
Environmental Problems in theLow-Intensity Livestock Systemsof Developing CountriesTra di tional, low- intensity live stock pro duc tionmeth ods re main in many re gions of the world. Pro -duc tion lev els in these sys tems are de ter mined bylo cally avail able re sources. In creased de mand pres -sure can push these sys tems to pro duce be yond their ca pac ity. This can bring them into con flict with theen vi ron ment, ne ces si tat ing changes in tra di tionalprac tices to re duce dam age.
Live stock graze on about 26 per cent of theworld’s land area. Graz ing sys tems in de vel op ing re -gions mainly rely on na tive grass land and are onlypar tially mixed with crops. These sys tems usu ally do not in volve in puts from out side the sys tem. Over -graz ing can cause soil com pac tion and ero sion, andcan de crease soil fer til ity, or ganic mat ter con tent,and water in fil tra tion and stor age. Over graz ing inhilly en vi ron ments can ac cel er ate ero sion.
The United Na tions En vi ron ment Pro -gramme (UNEP) es ti mates that since 1945 about680 mil lion hec tares, or 20 per cent of the world’sgraz ing lands, have been sig nifi cantly de graded(Olde man, Hak keling, and Som broek 1991). Re -cent evi dence sug gests, how ever, that graz ingsys tems are more re sil ient than once thought,even in the worst cases, where drought has ex -tended des ert mar gins. Sat el lite im agery showsre cent vege ta tion grow ing in the West Af ri canSahel at the same north ern lim its where it oncegrew be fore the big droughts of the 1970s and1980s (Tucker, Dregne, and New comb 1991).
Arid graz ing sys tems have extremely lim itedpoten tial for increas ing pro duc tiv ity and greatpoten tial for suf fer ing last ing dam age. Pro duc tionin these areas has adapted con tinu ously to highlyvari able rain fall and feed avail abil ity (Behnke,
Scoones, and Ker ven 1993). Where irri ga tion orcrop pro duc tion have inter fered with live stockresources and move ment pat terns, ecol ogi callysound sys tems often have been dis rupted. Popu la -tions have become sed en tary around water points in many cases. The result ing over graz ing and landdeg ra da tion have threat ened the live li hood of pas -toral com mu ni ties.
Flexi bil ity and mo bil ity are es sen tial forachiev ing sus tain able range land use in arid areas.Un for tu nately, both were se ri ously im paired in thepast by poli cies that set tled pas tor al ists and at -tempted to regu late stock ing rates from aboverather than in con sul ta tion with stock rais ers. Well- intentioned changes often dis rupt tra di tional sys -tems and some times make them un sus tain able. Forex am ple, new water points in duce set tle ment oflarge ani mal and human popu la tions in dry areas.They also make pos si ble year- round graz ing in stead of al low ing stock ing lev els to fluc tu ate so that theyare low dur ing the dry sea son. The re sult ing over -load of ani mals on the range se verely de gradesgraz ing re sources around the new source of water.
Semi arid zones can sus tain more in ten sive ag ri -cul ture than arid zones, mak ing pos si ble greaterhuman and live stock popu la tions. Crop en croach -ment on pas tures, de for es ta tion through fu el woodcol lec tion, and over graz ing of re main ing pas turescan then ensue. Crop en croach ment on mar ginalland not only ex poses the soil di rectly to the ero siveef fects of winds and heavy rains, but it ham pers theflexi bil ity of ani mal move ment by oblit er at ing pas -sages be tween wet- and dry- season graz ing areas.Drought emer gency pro grams that hand out sub si -dized con cen trate feed fur ther con trib ute to rangedeg ra da tion by ena bling too many ani mals to bemain tained on the range and pre vent ing natu ral re -gen era tion of the range vege ta tion after drought.These feed sub si dies in creas ingly have be come anen ti tle ment for pas tor al ists, es pe cially in North Af -rica and the Mid dle East.
Human popu la tion pres sure is a key con tribu tor to en vi ron mental deg ra da tion in many areas wherelive stock are kept. When in sti tu tional fail ure al lows peo ple to ex tract pri vate goods (live stock pro duc -tion) from pub lic goods (com mon range land) with -out limit, the deg ra da tion is even greater. The situa -tion is ag gra vated fur ther when stock num bers canbe kept high at all times be cause of water de vel op -
45

ment and local crop ping in pre vi ously pas toralareas. These well- intentioned but ecol ogi callyharm ful poli cies often ex plain why deg ra da tiontends to be more se vere in semi arid zones than inarid range lands.
Tropi cal rain for ests cover about 720 mil lionhec tares and con tain ap proxi mately 50 per cent ofthe world’s bio di ver sity. More than 200 mil lionhec tares of tropi cal rain for est have been lost since1950. Con trib ut ing fac tors in clude ranch ing, cropcul ti va tion, and for est ex ploi ta tion. Ranching- associated de for es ta tion has been linked to the lossof some unique plant and ani mal spe cies in Southand Cen tral Amer ica, the world’s rich est source ofbio di ver sity. In Cen tral Amer ica the area under pas -ture has in creased from 3.5 mil lion to 9.5 mil lionhec tares since 1950, and cat tle popu la tions havemore than dou bled from 4.2 mil lion to 9.6 mil lionhead (Kai mo nitz 1995).
Clear ing for est and sa vanna to es tab lish pas -tures in humid areas causes soil nu tri ents to leachout rap idly under high rain fall and high tem pera -tures. Weeds soon dis place grasses and ar ti fi cialpas tures can only be sus tained for a pe riod of up to10 years. More than 50 per cent of the pas ture areasin the Ama zon are now un grazed fal low, with a sig -nifi cant por tion being aban doned be cause of deg ra -da tion. Natu ral re gen era tion of for ests is dif fi cult,es pe cially when the cleared areas are large.
Poli cies that make ti tling of land easy and pro -vide fi nan cial in cen tives for large ranches havebeen the main rea sons for ranch- induced de for es ta -tion (Kai mo nitz 1995). In the late 1960s and 1970s,Bra zil sub si dized ag ri cul tural loans and beef ex -ports, play ing an im por tant role in ranch ex pan sion.These poli cies have now been phased out and in -vest ment in large ranches by ab sen tee own ers hasde clined, and so has the rate of de for es ta tion. InCen tral Amer ica in the 1980s rain for ests dis ap -peared at an an nual rate of 430,000 hec tares peryear. In 1990–94 that rate was 320,000 hec tares an -nu ally. The les son of the 1960s and 1970s is thatsub si diz ing hori zon tal ex pan sion of live stock pro -duc tion can cause great en vi ron mental dam age andcre ate dis in cen tives for in ten si fi ca tion.
In creas ingly evi dent in the Ama zon today aresmall crop farm ers who switch their cleared- forestfields over to live stock graz ing only after the soilnu tri ents nec es sary to raise crops have been ex -
pended (Fami now and Vosti 1998). How thesefarm ers will sur vive on land that is in creas ingly de -graded is un cer tain. No clear al ter na tives exist.
In many re gions farm sizes may shrink be causeof popu la tion pres sure, urban en croach ment, andsub di vi sion among heirs. Ex pand ing farm op era -tions into com mu nal or new land under these con di -tions often leads to de for es ta tion or over graz ing. As com mu nal graz ing and new land be come in creas -ingly scarce, whole farm ing sys tems may lose theirlive stock com po nent. First to go are large stocksuch as cat tle, jeop ard iz ing the nu tri ent bal ance infarms along with farm ers’ live li hoods. Re portednu tri ent defi cits range from about 15 kilo grams ofni tro gen per hec tare per year in Mali, to more than100 kilo grams of ni tro gen per hec tare per year inthe high lands of Ethio pia (de Wit, Wes tra, and Nell1996).
In vir tu ally all tropi cal high land areas (for ex -am ple, the Hi ma la yan hills, Af ri can high lands, An -dean coun tries, and Java) rela tively high humanpopu la tion den si ties are tra di tion ally sus tained bycom plex mixed farm ing sys tems. Fur ther popu la -tion growth in many of these re gions has made itim pos si ble for the tra di tional mixed sys tems to sur -vive. Modi fied mixed small holder farm ing is pos si -ble when mar ket de vel op ment per mits in vest mentin in ten sive tech nolo gies and in puts.
Environmental Problems ofHigh-Intensity IndustrialLivestock ProductionAs live stock pro duc tion in ten si fies, pro duc ersadopt tech nolo gies that mini mize overt di rect costsas so ci ated with land and labor and take maxi mumad van tage of free ac cess to en vi ron mental pub licgoods and capi tal sub si dies. These highly in ten sivein dus trial pro duc tion meth ods are the rule in de vel -oped coun tries and grow ing rap idly in im por tancein the de vel op ing world.
Es ca lat ing de mand for ani mal prod ucts leads toani mal con cen tra tions that are out of bal ance withthe waste ab sorp tion and feed sup ply ca pac ity ofavail able land. High con cen tra tions of ani malsclose to human ag glom era tions often cause enor -mous pol lu tion prob lems. Large areas of West ernEurope (Neth er lands, north west ern Ger many, Brit -
46

tany [France], the Ital ian Po val ley), the north east -ern United States, and, in creas ingly, coastal South -east Asia and large plain areas in China now showenor mous nu tri ent sur pluses that range from 200 tomore than 1,000 kilo grams of ni tro gen per hec tareper year (Ste in feld, de Haan, and Black burn 1997).
Glob ally pig and poul try in dus tries pro duce 6.9mil lion tons of ni tro gen per year, equiva lent to 7per cent of total in or ganic ni tro gen fer til izer pro -duced in the world. Ex cess ni tro gen and phos pho rus leach or run off the land, af fect ing ground wa terqual ity and dam ag ing aquatic and wet land eco sys -tems. Tests in Penn syl va nia have shown that about40 per cent of the soil sam ples from mixed dairy and crop farms ex hib ited ex ces sive phos pho rus and po -tas sium lev els. Sur plus nu tri ents from satu ratedsoils leach into sur face water and pol lute the en vi -ron ment (Nar rod, Reyn nells, and Wells 1994). Asimi lar sce nario is un fold ing in Brit tany, where onein eight dis tricts had soils with ni trate lev els ofmore than 40 mil li grams per liter in the 1980s. Now all eight dis tricts re port such ni trate lev els, whichcan cause ex ten sive dam age to the re gion’s aquaticsys tems (Brand jes et al. 1995).
Ex cess con cen tra tions of live stock and live -stock waste also pro duce gases. Some, such as am -mo nia, re main local. Oth ers, such as car bon di ox ide (CO2), meth ane (CH4), and ni trous oxide (N2O) af -fect the world’s at mos phere by trap ping the sun’sen ergy and con trib ut ing to global warm ing.
There are three main sources of livestock- related car bon di ox ide emis sions. First, do mes ti -cated ani mals emit car bon di ox ide as part of basicmeta bolic func tion ing or res pi ra tion, at an es ti -mated level of 2.8 bil lion met ric tons an nu ally. Sec -ond, car bon di ox ide emis sions re sult from bio massburn ing, part of which can be at trib uted to landclear ing and bush fires on pas ture used to en hancepas ture growth. Third, car bon di ox ide is re leasedwhen fos sil fuels are con sumed for livestock- related manu fac tur ing and trans por ta tion.
Live stock and ma nure man age ment con trib uteabout 16 per cent of the global an nual pro duc tion of550 mil lion tons of meth ane. Ru mi nants mainlypro duce the meth ane as a by- product of di gest inglarge amounts of grasses and other fi brous feeds.Pigs and poul try emit rela tively low amounts ofmeth ane be cause they can not di gest these fi brousfeeds. Meth ane emis sions per unit of prod uct are
high est when feed qual ity is low, which is com mon, es pe cially in the low land trop ics and sub trop ics ofde vel op ing coun tries.
Twenty per cent of meth ane ema nat ing fromani mal pro duc tion comes from ma nure stored under an aero bic con di tions, such as in hold ing ponds(USEPA 1995). The high lev els of meth ane ema -nat ing from an aero bic con di tions are usu ally as so -ci ated with high lev els of pro duc tiv ity and in ten sityand large pro duc tion units.
Ani mal ma nure also pro duces ni trous oxide, the most dam ag ing green house gas (320 times more sothan car bon di ox ide). Ani mal waste con trib utesabout 0.4 mil lion tons of ni tro gen per year, or 7 per -cent of the total global emis sions (Bouwman, Bat -jes, and Bridges 1992).
The feed re quire ments of ex pand ing meat andmilk pro duc tion ex ceed what can be sus tained bytra di tional feed re sources such as graz ing land andcrop by- products. In creas ingly the world live stocksec tor re sorts to ex ter nal in puts, no ta bly high- energy feed such as ce re als and oil cakes. Rough ageis de creas ing in im por tance as feed and being re -placed by ce real and agro- industrial by- products. Acor re spond ing shift to ward pro duc ing monogas tricani mals, mainly poul try and pigs, is tak ing place.While ru mi nant meat ac counted for 54 per cent oftotal meat pro duc tion in the de vel op ing coun tries in1970 (FAO 1995a), it ac counted for 35 per cent inthe early 1990s. This spe cies shift is driven in partby the bet ter con ver sion rates for con cen trate feedsof fered by monogas tric ani mals.
Feed crops dif fer in their pes ti cide needs andpro pen sity to de plete soil mois ture, water, and nu -tri ents. In gen eral, ce real crops (maize in par ticu lar) have the po ten tial to cause greater en vi ron mentaldam age than other crops. Ce re als re quire heavy fer -til izer and pes ti cide use and a great deal of waterand offer poor ground cover in the early stages ofplant de vel op ment. Leg umes, such as soy beans andpulses, gen er ally have the least po ten tial for dam -age. Maize and wheat de plete ni trates and phos -phates the most, while cas sava and sweet po ta toesde plete the most soil nu tri ents.
The Environmental ChallengeIn dus trial live stock pro duc tion is rap idly spring ingup close to urban cen ters in de vel op ing coun tries,
47

be cause of weak in fra struc ture, high trans port costs, and weak regu la tion. Like many cit ies in East andSouth ern Af rica, Dar- es- Salaam, the capi tal of Tan -za nia, now has 20,000 dairy cows kept within thecity lim its. Urban pig ger ies are in creas ingly com -mon in Asia, es pe cially coastal China. Large- scalepoul try op era tions are found in pe ri ur ban areasthrough out the de vel op ing world.
In dus trial and in ten sive mixed farm ing sys tems pres ent the most se vere en vi ron mental chal lenge inthe live stock sec tor. These sys tems have oftenbene fited from pol icy dis tor tions and the ab sence of regu la tions or their lack of en force ment. The regu -la tory vac uum has often given this type of pro duc -tion a com peti tive edge over land- based sys tems.Fur ther more, some poli cies have mis di rected re -source use and en cour aged the de vel op ment oftech nolo gies that are in ef fi cient out side the dis -torted con text. Many de vel op ing coun tries not onlypro vide di rect sub si dies for feed but also for en ergyand capi tal, which con sti tute some of the major di -rect costs of in dus trial pro duc tion. Econo my widepoli cies that offer sub si dies for en ergy and creditoften end up fa vor ing in dus trial pro duc tion overless- intensive mixed farm ing and graz ing.
Tech nol ogy can offer so lu tions to many en vi -ron mental prob lems, es pe cially under in dus trialcon di tions. But most pol icy frame works en able thecheap sup ply of ani mal prod ucts at the ex pense ofthe en vi ron ment. Self- sufficiency in ani mal prod -
ucts and con tinu ous sup ply of high- value food com -modi ties to urban popu la tions are often the over rid -ing pol icy ob jec tives, par ticu larly in de vel op ingcoun tries.
In the de vel oped world the pol lu tion of land,water, and air has raised acute aware ness of the en -vi ron mental prob lems as so ci ated with in dus triallive stock pro duc tion. In many cases this has trig -gered the es tab lish ment of poli cies and regu la torymeas ures that ad dress these prob lems. De vel op ingcoun tries, on the other hand, typi cally ex hibit an ab -sence of ap pro pri ate and en force able regu la tions,to gether with a surge in de mand and a lack of ef fec -tive po liti cal ex pres sion of con cern about grow ingen vi ron mental and health haz ards.
Con cerns about the long- term pro duc tiv ity ofnatu ral re sources, in clud ing land, water, air, andbio di ver sity, will not be re flected in mar ket pricesun less gov ern ments and in ter na tional or gani za tions de fine and es tab lish mecha nisms to re flect the pres -ent and fu ture value of natu ral re sources. In sti tu -tions that pro vide regu la tory frame works need to be de vel oped, local groups need to be em pow ered, and a legal author ity that im ple ments en vi ron mentalpoli cies needs to be es tab lished or re in forced. Pricesshould be ad justed through taxa tion to cor rect for un -charged en vi ron mental costs and en cour age ef fi cient re source use. Ap pro pri ate tech no logi cal change, thekey to solv ing en vi ron mental prob lems, must be fa -cili tated by gov ern ment sup port.
48

8. Public Health
Live stock pro duc tion is a source of risk to humanhealth in both low- and high- in ten sity pro duc tionsys tems. Risks exist not only from the un con trolleden demic dis eases found in de vel op ing re gions, butalso from those that ap pear in highly de vel oped pro -duc tion sys tems when ani mal con cen tra tions arehigh, feeds con tain con tami nants, or meat and milkare im prop erly han dled. Hu mans are ex posed tothese risks through sev eral path ways. Zoono tic dis -eases, those shared by hu mans and ani mals, canmu tate and spread in ani mal hosts be fore pass ing tohu mans. Ani mal wastes can carry dis ease or chemi -cal tox ins into the en vi ron ment. And milk and meatcan ex pose hu mans to dis ease and tox ins con tainedin the ani mals or pro duced by im proper han dlingand proc ess ing.
Al though great prog ress has been made in con -trol ling en demic dis eases of ani mals, in ten si fi ca -tion of both tra di tional and mod ern live stock pro -duc tion sys tems has brought about new risks. Highcon cen tra tions of ani mals, often mov ing be tweenlo ca tions for dif fer ent stages of pro duc tion, can be -come breed ing grounds for dis ease. Prox im ity ofthese fa cili ties to high human popu la tions can mag -nify the po ten tial dam age of an out break.
Live stock pose a par ticu lar risk in de vel op ingre gions, where ani mal con cen tra tions are often lo -cated near and around cit ies be cause of lim itedtrans por ta tion fa cili ties and in fra struc ture. Therisks are com pounded by in ade quate or non ex ist enthealth in fra struc ture, regu la tions, moni tor ing, oren force ment. Zoono tic dis eases such as tu ber cu lo -sis and brucel lo sis, which are nearly or en tirely con -trolled in de vel oped re gions, con tinue to pose major prob lems in these re gions.
Health risks in de vel op ing coun tries are stilloften moni tored only at the house hold level. Aslive stock pro duc tion lev els rise, the abil ity of peo -ple to gauge the qual ity of the ani mal food prod uctsthey pur chase in mar ket places be comes in creas -
ingly dif fi cult. The clas sic worry in de vel op ingcoun tries is the mi cro bial con tami na tion of food.Ba cilli or bac te ria such as Sal mo nella, Escheri chiacoli, Clos trid ium botulinum, and Staphy lo coc cusare the most fre quently ob served causes of food- borne dis eases. They are usu ally re lated to im proper food prepa ra tion or in ade quate re frig era tion.
The World Health Or gani za tion (WHO) re -ports that hun dreds of mil lions of peo ple world -wide suf fer from dis eases caused by con tami -nated food and that prod ucts of ani mal ori ginrank at the top of the list of causes (WHO 1997).More than 3 mil lion chil dren under five years ofage die each year be cause of di ar rhea. Con tami -nated water and food- borne patho gens causemuch of this di ar rhea. Sal mo nella in fec tions arealso on the rise and threaten to be come majorpub lic health con cerns, es pe cially in big Asiancit ies where large bird flocks are kept for foodand fecal con tami na tion is hard to con trol.
Risks from the in tense in dus tri ali za tion of live -stock pro duc tion are also ap pear ing in de vel opedcoun tries. Move ments of ani mals for birth ing,wean ing, and fat ten ing have ag gra vated health risks be cause ani mals from dif fer ent lo ca tions are ex -posed to each other and to hu mans. Risks of trans -mis sion are fur ther in creased by greater in ter na -tional trade of live stock and live stock prod ucts.
In ten sive live stock pro duc tion units can alsobreed new and more viru lent strains of zoono tic dis -eases. An ti bi ot ics used in in ten sive ani mal pro duc -tion of poul try have led to the emer gence of Sal mo -nella, Lis teria, and E. coli re sis tant to an ti bi ot ics.There is in creas ing con cern about new strains of in -flu enza de vel op ing in pigs and chick ens that couldbe trans mit ted to hu mans, such as the avian flustrain that forced eradi ca tion of chick ens in HongKong in 1997. Some re search ers go so far as to saythat the next le thal flu pan demic might emerge from Eu ro pe’s crowded pig barns (MacK en zie 1998).
49

De spite long- established food qual ity as sur ancesys tems in de vel oped coun tries, new food con tami -na tion risks have emerged. Ac cord ing to WHO,seven food- borne patho gens (Cam py lo bac ter je juni,Clos trid ium per frin gens, E. coli O157:H7, Lis teriamono cy to genes, Sal mo nella, Staphy lo coc cus au -reus, and Toxo plasma gon dii) are re spon si ble for anes ti mated 3.3 to 12.3 mil lion in fec tions and 3,900deaths an nu ally in the United States (WHO 1997).Fur ther more, global sur veys by WHO in di cate thatfood- borne dis eases may occur 300- 350 times morefre quently than re ported.
Sal mo nel lae are blamed for more than 50,000cases of bac te rial food poi son ing in the UnitedStates every year (WHO 1997). Trans mis sion ofthis mi crobe usu ally oc curs through in suf fi cientlycooked meats and eggs. Chick ens are a major res er -voir of sal mo nella. In gest ing foods con tami natedwith sig nifi cant amounts of sal mo nella can causein tes ti nal in fec tion.
The in creased size of pro duc tion units and fre -quency of con tact be tween ani mals greatly in -creases the over all im pact of out breaks of ill ness.Six mil lion pigs were de stroyed in Hol land to eradi -cate clas si cal swine fever in 1997. As this re portwas being writ ten, Ma lay sians were in the pro cessof de stroy ing a mil lion pigs in their larg est porkpro duc ing re gion to stem an out break of a new form of viral en cepha li tis that has killed more than 100peo ple in six months (Wash ing ton Post 1999;ProMed 1999).
Use of new feed re sources has also brought new risks. In suf fi cient tem pera tures used in ren der ingani mal tis sue into feed has been clearly linked to the ap pear ance of BSE (bo vine spongi forme en cepha -lo pa thy), or mad- cow dis ease, in cat tle. The in fec -tious pri ons in volved are simi lar to those that causeCJD (Creutzfeldt- Jakob dis ease). More than 20human vic tims in the United King dom are thoughtto have con tracted the dis ease through in ges tion ofani mal nerve tis sue.
In fec tion with Escheri chia coli O157:H7 (E.coli) was first de scribed in 1982. E. coli hasemerged rap idly as a major cause of di ar rhea andacute renal fail ure. The in fec tion is some times fatal, par ticu larly in chil dren. Out breaks, gen er ally as so -ci ated with beef, have been re ported in Aus tra lia,Can ada, Japan, the United States, vari ous Euro peancoun tries, and south ern Af rica (WHO 1997).
Beef that was con tami nated in the slaugh ter -house is the prin ci pal cause of E. coli in fec tion inhu mans. Bac te ria are trans mit ted when in fectedmeat is con sumed raw or un der cooked. Groundmeats, such as ham burg ers, are par ticu larly as so ci -ated with in fec tions be cause the in fected ma te rial ismixed through out the prod uct dur ing the grind ingpro cess.
Hy gi enic slaugh ter ing prac tices will re ducecon tami na tion of car casses but will not guar an teethe ab sence of mi cro bial con tami na tion from prod -ucts. Simi larly, the con tami na tion of raw milk onthe farm can not be com pletely pre vented. The onlyef fec tive method of elimi nat ing dan ger ous mi -crobes is to heat (thor oughly cook or pas teur ize) orir ra di ate food.
Lis teria mono cy to genes (Lm) has been rec og -nized as a risk only re cently. It in fects cheese andmeat that has been re frig er ated for a long time. Lis -teria mono cy to genes in fec tions can cause mis car -riage in women and sep ti ce mia (blood poi son ing)and men in gi tis in in fants and per sons with weak -ened im mune sys tems.
Non mi cro bial con tami na tion of food also poses a risk. Food- borne chemi cal tox ins in creas inglypreva lent in rap idly de vel op ing coun tries in cludepes ti cide resi dues (often con tain ing mer cury or ar -se nic), met als (zinc, cad mium, and cop per), andheavy met als (es pe cially mer cury from pigs eat ingfungicide- treated corn).
Live stock feed ing is partly to blame as well forthe ac cu mu la tion of toxic lev els of heavy met als inthe en vi ron ment. Trace ele ments are often added toani mal feeds to sup ply mi cro nu tri ents and en hancefeed con ver sion ef fi ciency. Cop per and zinc are de -lib er ately added to a va ri ety of ani mal feed con cen -trates, while heavy met als like cad mium are in tro -duced in vol un tar ily via feed phos phates. Dur ingdi ges tion the ele ments are con cen trated, re sult ing in ma nure and slur ries that can con tain high lev els ofthe toxic ele ments. Soils on which pig and poul tryma nure are regu larly ap plied at high rates can ac cu -mu late large amounts of heavy met als, which can in turn con tami nate crops and pose a health risk to hu -mans. High con cen tra tions of toxic ele ments canalso ac cu mu late in the meat of ani mals fed feedswith trace met als.
Resi dues of growth hor mones, an ti bi ot ics, andin sec ti cides are in creas ingly found in the tis sues of
50

ani mals raised in in dus trial pro duc tion sys tems.The pres ence of an ti bi ot ics in ani mal food prod uctscan cause al ler gies. Over doses of an ti bi ot ics areoften used il le gally in feed to pro mote growthwhere en force ment sys tems are weak. Con sid er able de bate (and trade dis pute) also ex ists about thesafety of growth hor mones such as BST (bo vine so -ma to tropin). The il le gal use and mis use of growthpro mot ers such as DES (diethyl- stilbetrol) andclen buterol can also cre ate prob lems.
Tra di tion ally the health risks from live stockand live stock prod ucts have been borne by con -sum ers and farm ers. With in ten si fi ca tion has
come rec og ni tion that many risks can not be con -trolled at the house hold and farm lev els alone.Con sum ers can not ade quately judge the safety offood that was pro duced and proc essed far fromthe house hold. Farm ers act ing in di vidu ally can -not fully pro tect their ani mals from dis eases thatspread from farm to farm. In many cases in sti tu -tions are re quired to de velop, moni tor, and en -force qual ity stan dards across the mar ket ingchain. Un for tu nately, gov ern ment serv ices arebeing cur tailed in this area in many poor coun -tries as the size of the over all pub lic sec tor isbeing re duced.
51

9. Technology Needs and Prospects
In creases in the pro duc tiv ity of ani mal food pro duc -tion come from the de vel op ment and trans fer of ani -mal pro duc tion tech nolo gies, par ticu larly for ani malhealth; im proved feed and feed use; ge netic en -hance ment; and bet ter post har vest han dling. Live -stock tech nol ogy pol icy faces two chal lenges in itsef forts to raise pro duc tiv ity. First, ap pro pri ate ex ist -ing and new tech nolo gies and pro duc tion sys temshave to be adapted and dis semi nated to the de vel op -ing world to elimi nate low pro duc tiv ity. Sec ond, thelim its of live stock pro duc tion tech nol ogy and sys -tems have to be ex tended to in crease ef fi ciency fur -ther and the en vi ron mental and pub lic health prob -lems that have ap peared in high- intensity live stockpro duc tion have to be solved. This chap ter sur veysthe tech nolo gies and poli cies avail able or in de vel op -ment to meet these chal lenges.
Addressing Animal HealthConstraintsIn fec tious and para sitic dis eases af fect ing live stockre main im por tant con straints to prof it able live stockop era tions in many de vel op ing re gions. Dis easesre duce in comes di rectly by caus ing con sid er ablelive stock losses and in di rectly by ne ces si tat inghealth re stric tions on ex ports. In some areas (in -clud ing the former so cial ist coun tries) the prob lemis wors en ing be cause of weak vet eri nary and ad -min is tra tive serv ices, the ab sence of ac count ablelocal gov ern ment, and civil strife.
In fec tious dis eases such as rinderpest, foot andmouth dis ease (FMD), con ta gious bo vine pleu ro -pneu monia (CBPP), and peste des pe tits ru mi nants(PPR) still pose major threats to live stock pro duc -tion in de vel op ing coun tries. These epi zo otic dis -eases, so- called be cause they often mani fest them -selves as epi dem ics af fect ing large num bers ofani mals of the same spe cies in a given area, are
most preva lent in pro duc tion sys tems in which ani -mals move un con trolled and un moni tored overlarge dis tances. Vac ci na tion and sur veil lance pro -grams are needed to keep these dis eases in check.The global eradi ca tion of rinderpest by 2010, forex am ple, re mains an achiev able and im por tant goalfor de vel op ing coun tries.
Live stock dis ease con trol has un der gone apara digm shift in re cent years. More flexi ble con -trol strate gies that focus on re gions of high est re -turns within a coun try are re plac ing coun try wideeradi ca tion pro grams. Risk analy sis and ani malhealth eco nom ics help de ter mine where dis easecon trol in vest ment will have its great est bene fit.The ac cep tance of disease- free or low- risk statusfor re gions (rather than for en tire coun tries) in in ter -na tional agree ments such as the sani tary and phy to -sani tary (SPS) agree ment of the World Trade Or -gani za tion (WTO) il lus trates this trend. The treatymakes pos si ble ex port of meat and other live stockprod ucts from a coun try where a dis ease such asFMD ex ists, as long as the dis ease is ei ther not pres -ent in the re gion where the meat is pro duced or therisk of trans mis sion through mul ti ple con trols is ex -tremely low.
Bio tech nol ogy of fers prom ise for the im -proved di ag no sis and treat ment of ani mal dis -ease. Even as the in ci dence of zoono tic dis easesrises be cause of in creased con cen tra tions of ani -mals near peo ple, live stock health re search bene -fits from the greater re sources avail able to human health re search (Fitz hugh 1998). For ex am ple,ge nom ics is a new sci ence ap pli ca ble to hu mansand live stock that per mits se quenc ing and map -ping of the ge nome (a ge netic map of a liv ing or -gan ism). Ge nom ics takes ad van tage of the workon the ge nomes of dis ease or gan isms and per mitsthe de vel op ment of new gen era tions of vac cines,in clud ing those that use re com bi nant an ti gens topatho logi cal agents. Live stock dis ease or gan isms
52

can also pro vide use ful mod els for study inghuman health (Ole Moi- Yoi 1995).
Af ri can swine fever is a major con straint to ex -pand ing pork pro duc tion in Af rica. In a se ries of re -cent out breaks, pig num bers have been re duced bybe tween 30 and 70 per cent in a wide range ofcoastal Af ri can coun tries. Move ment and sani tarycon trol can limit fu ture out breaks but re quire moreef fec tive vet eri nary in sti tu tions.
Farm ers in de vel op ing re gions typi cally lacklow- cost, easy- to- use di ag nos tics, vac cines, andcon trol strate gies for dis ease or gan isms and vec -tors. Among the para sitic dis eases, try pano somia sis (sleep ing sick ness) trans mit ted by tsetse flies, poses an enor mous con straint to cat tle pro duc tion in mostof the humid and sub hu mid zones of Af rica.
Com bi na tions of aer ial in sec ti cide sprays, ad -he sive py re the roid in sec ti cides, im preg natedscreens and traps, ster ile in sect mat ing, and try -pano cide drugs hold the prom ise of gradu ally re -cov er ing in fested areas for mixed farm ing and in -creased live stock out put. These strate gies also arelikely to im prove crop out put.
Other im por tant para sitic dis ease groups in -clude hel minthia sis and tick- borne dis eases. Hel -minths are rarely fatal, but they limit pro duc tiv ity in many pro duc tion sys tems. They be come a lim it ingfac tor in the in ten si fi ca tion stage but can be con -trolled. Ticks have the ca pac ity to trans mit dis eases, no ta bly east coast fever in East ern and South ern Af -ri can coun tries. An ef fec tive vac cine for this dis -ease may soon be avail able, with a po ten tially largeim pact on ru mi nant pro duc tiv ity in these coun tries(ILRI 1998).
Improving Feed Quantityand QualityA large number of the world’s live stock, par ticu -larly ru mi nants in pas toral and low- input mixed- farming sys tems, suf fer ei ther per ma nent or sea -sonal nu tri tional stress. In many re gions these pres -sures have been al le vi ated through bet ter stor age oflo cally avail able re sources. Stor age and con ser va -tion of for age, use of high- protein le gu mi nous fod -ders and fod der trees in ra tions, treat ment of cropresi dues, and ad di tion of min eral nu tri ents to feedall offer ways to im prove for age in some areas.
The po ten tial to gen er ate lo cally avail able fod -der and ce real feed re sources is great. But gov ern -ments may need to cre ate the sci en tific and trans -por ta tion in fra struc ture nec es sary to reap thebene fits of world feed re sources and new feed tech -nolo gies as they be come avail able. The pro jec tionsin Chap ter 4 in di cate that the nec es sary sup plies offeed con cen trates will be avail able on world mar -kets with out undue price rises. These pro jec tionsde pend on main tain ing trends in tech no logi calprog ress that raise yields of major feed grains suchas maize.
But even if ag gre gate quan ti ties are avail able,en sur ing that hun dreds of mil lions of small pro duc -ers have ac cess to feed mar kets under developing- country con di tions will be no small chal lenge. Chi -na’s port and grain- importation in fra struc ture in di -cates the kinds of prob lems re quir ing rem edy. In1995 China im ported an ad di tional 15 mil lion met -ric tons of grain, put ting con sid er able stress on han -dling and dis tri bu tion fa cili ties (Pinstrup- Andersen, Pandya- Lorch, and Rosegrant 1997). Sig nifi cantbot tle necks oc curred. Yet the base line pro jec tionfor 2020 in di cates that China will im port 45 mil lionmet ric tons more ce re als than in 1993 (Table 24).
Both de vel oped and de vel op ing re gions mustcon tinue to use ra tions more ef fi ciently. The re -quire ments and the qual ity and quan tity of feed re -sources used for ra tions dif fer across spe cies,breeds, sys tems, and re gions. Re search to re ducecosts and im prove ef fi ciency will have to be highlytar geted, but even so it will have spil lo ver ef fects.Re search that de fines chemi cal com po si tion and di -gesti bil ity char ac ter is tics will con trib ute to crop- breeding strate gies, par ticu larly the need to changethe phy to chem is try of pri mary crop prod ucts andresi dues fed to live stock (Fitz hugh 1998).
New tech nolo gies that en hance the quan tity and qual ity of avail able tropi cal feed re sources arebeing as sessed through nu tri tion re search. Theiden ti fi ca tion of suit able traits and their mo lecu larmark ers help im prove the qual ity of tropi cal feedsde rived from food crops. Breed ers use the mark ersto de velop dual- purpose crops with im proved grainyields and pro tein con tent for hu mans and non ru mi -nants and higher- quality crop resi dues for ru mi -nants.
Plant ge nom ics and phy to chem is try will tacklean tinu tri tional fac tors (ANFs) in plants. Some of
53

these ANFs can be poi son ous to ru mi nants. Mi cro -bio logi cal tech niques will help en rich ru mi nanteco sys tems with mi crobes that can bet ter de tox ifyANFs. Maize with re duced phytic acid con tent hasre cently been re ported to im prove feed con ver sionfor chicks by up to 11 per cent (CAST forth com ing).
The abil ity to in crease starch con tent in feed -grains al ready evi dent in the de vel oped world maybe come more at trac tive to de vel op ing coun tries by2020. But these tech nolo gies for maize and sor -ghum are un likely to ex tend feed ing value per unitby more than 15 per cent, even in de vel oped coun -tries. Pul ver iz ing grain with steam be fore feed ingproba bly will offer a more fea si ble and eco nomi calmeans for im prov ing con ver sion ef fi ciency (CASTforth com ing).
In de vel oped coun tries, and in creas ingly also in in ten sive pro duc tion sys tems in de vel op ingcoun tries, a wide range of pro bi otic and an ti bi -otic feed ad di tives are part of the ra tion fed tolive stock. Mi cro bial ac tion can help break downoth er wise hard- to- digest rough age so that nu tri -ents are bet ter ab sorbed.
Find ing bet ter ways to use the vast abun danceof fi brous bio mass avail able in the world of fers apar ticu larly ex cit ing area of re search. Rumen mi -cro bi ol ogy re search fo cuses on the iso la tion offiber- degrading en zymes. Bet ter use of fi brous feedma te ri als will in crease the avail abil ity of feed re -sources in edi ble to hu mans. Chang ing the ca pac ityof the rumen to di gest high- fiber fod ders would dra -mati cally im prove the pros pects of ru mi nant pro -duc tion in the sub hu mid sa van nas of Af rica andLatin Amer ica, where ex tremely large quan ti ties ofbio mass of low feed qual ity are pro duced. In sert ingen hanced cellulase- producing ca pac ity into rumenbac te ria should be pos si ble in the not too dis tant fu -ture (de Haan, Ste in feld, and Black burn 1997; Cun -ning ham 1997). Mi cro bial ge nom ics will in creasethe pace of prog ress in this area of re search (Wal -lace and Lahlou- Kasi 1995; Ode nyo, Osuji, and Ne -gassa 1999).
With the great ad vances tak ing place in ge net -ics, more prog ress should also be made in the feedcon ver sion of monogas trics. Dur ing the past dec ade feed con ver sion rates for pigs and poul try have im -proved by 30-50 per cent, in part through breed ingand in part through ad di tion of en zymes to feeds.Still, monogas trics cap ture only 25 to 35 per cent of
the nu tri ents in their feed. Ge netic im prove mentand bet ter bal anc ing of feed will en able this trend to con tinue. Pre ci sion in ani mal feed ing is fore see ablein de vel oped coun tries. Nu tri ents ex creted by ani -mals will be greatly re duced, so that nu tri entsneeded and sup plied will be fairly equal (CASTforth com ing).
Fi nally, using growth hor mones, such as bo vine so ma to tropin (BST), with high- energy feeds has the po ten tial to in crease milk yields. But the tech nol ogy is likely to bene fit farms in de vel oped coun triesmore than those in de vel op ing coun tries. Es ti matedyield re sponses for BST vary widely, fa vor ingfarms with feeds, breeds, and man age ment prac -tices that are al ready ex tremely pro duc tive (Jar vis1996).The harsh con di tions in de vel op ing coun tries are un likely to pro vide the en vi ron ment nec es saryfor large- scale bene fits from BST. This will changein the long run, how ever, once live stock pro duc tiv -ity in de vel op ing re gions has bene fited from other,less so phis ti cated tech nolo gies (Jar vis 1996).
Improved Reproductive andGenetic TechnologiesAr ti fi cial in semi na tion has been used for more than50 years in de vel oped coun tries, pri mar ily on com -mer cial dairy herds. An es tab lished tech nol ogy, itsfur ther spread is likely to occur pri mar ily throughmar ket pro cesses. In the early 1990s, no more than17 per cent of the 50 mil lion first in semi na tionsgiven an nu ally took place in de vel op ing coun tries.But usage is ad vanc ing rap idly in Asia, es pe ciallyIndia, where grow ing milk de mand has made it eco -nomi cal (Chu pin and Thi bier 1995; Chu pin andSchuh 1993). Ar ti fi cial in semi na tion has con sid era -bly spurred ge netic up grad ing as large- scale test ingof the prog eny of bulls and the sub se quent use ofvalu able breed ers has be come pos si ble. Wide -spread adop tion of ar ti fi cial in semi na tion is likelyto occur in the more fa vored pro duc tion en vi ron -ments of de vel op ing coun tries, such as tem per atehigh lands and peri- urban com mer cial pro duc tionareas. The de mand for milk will pro vide re turns forits in tro duc tion and the nec es sary tech nol ogy andin fra struc ture are be com ing avail able.
The use of em bryo trans fer, al low ing cows ofhigh ge netic po ten tial to pro duce a much larger
54

number of calves than with nor mal re pro duc tion, iscur rently lim ited to only a small part of the com -mer cial herds in some de vel oped coun tries. Thisform of re pro duc tion proba bly will not be comewide spread in the de vel op ing coun tries within thenext 20 years (Cun ning ham 1997).
Cross ing of local breeds in de vel op ing coun trieswith highly pro duc tive va rie ties from the de vel opedcoun tries has be come com mon place for dairy cat tlein the trop ics. Con sid er able gains in pro duc tiv ity perani mal (25 per cent) have been ob tained. Those gainscan be main tained with ju di cious in ter breed ing or ro -ta tional breed ing. How ever, the gains are typi callylost in sub se quent gen era tions (Cun ning ham 1997).Other authors re port gains of up to 50 per cent, butstress the one- shot na ture of the trans fer and the re -stricted number of breeds that can be drawn upon(CAST forth com ing). Se lec tion from local breeds,es pe cially for mut ton and goat meat, may hold con -sid era bly more prom ise.
The char ac teri za tion, con ser va tion, and use oftropi cal ani mal breeds are vital to the abil ity to re -spond to in evi ta bly chang ing pro duc tion en vi ron -ments. Adapted live stock are more re sis tant to dis -ease and en vi ron mental chal lenges. They canmain tain pro duc tiv ity with out the need for high- value in puts, in crease farm in come, and con trib uteto pov erty al le via tion (Rege 1997; Ham mond andLeitch 1995).
Ad vances in ge net ics also offer new means toim prove live stock. Marker- assisted se lec tion andde tec tion of quan ti ta tive trait loci, for ex am ple,com bine re sults from mo lecu lar and quan ti ta tivege netic re search. In ter ac tions be tween ge netic traits and the en vi ron ment need to be ad dressed in orderto em ploy ad ap ta tion traits, such as ge netic re sis -tance to para sites, as pro duc tion traits. As with dis -ease re sis tance, in sights from human ge net ics re -search can be brought to bear on the ge neticim prove ment of live stock (Fitz hugh 1998).
It be came pos si ble dur ing the past dec ade topro duce maps of ge netic link ages in order toiden tify the gene lo ca tions of eco nomi cally im -por tant traits (dis ease re sis tance, per form ance).This tech nol ogy, which is being de vel oped for alarge range of traits by a number of re search in sti -tutes world wide, car ries the prom ise of a short cut to ge netic im prove ment in de vel op ing coun tries.Live stock can be bred for spe cific pro duc tive
traits and the abil ity to adapt to harsh cli matesand re sist dis eases.
Ge netic re search in de vel oped re gions fo cusesless on pro duc ing the hearty ani mals that are nec es -sary in stress ful developing- country en vi ron mentsand more on mak ing ani mals that pro duce higherqual ity prod ucts at mini mum cost. Un der stand ingthe ge netic make- up of ani mals has al lowed par -ticu lar prod uct traits, such as low cho les terol lev elsor the abil ity to pro duce high con cen tra tions of aphar ma ceu ti cal, to be added to ani mals. Re cent ad -vances in clon ing of em bryos could po ten tiallyhave a large im pact on live stock pro duc tion, par -ticu larly of dairy cat tle in de vel oped coun tries. Butthis is still an area where a number of com plex ethi -cal and sci en tific is sues have yet to be re solved(Cun ning ham 1997).
Postharvest Technology:Protecting Public Health andIncreasing the Value of LivestockOutputIn the next 20 years the trans fer of meat and milkproc ess ing tech nol ogy to de vel op ing coun tries bythe pri vate sec tor under pub lic regu la tion is likely to be es pe cially im por tant for food pro duc tion.Growth rates for the out put of proc essed prod uctswill proba bly be even higher than the growth ratesfor meat and milk pro duc tion in de vel op ing coun -tries. An in creas ing share of total food pro duc tion is ex pected to pass through mar ket ing and proc ess ingchan nels.
The es tab lish ment of dairy plants and slaugh -ter houses in pro duc ing areas, to gether with mar ketde vel op ment, will play an im por tant role in stimu -lat ing market- oriented pro duc tion. The in creas ingim por tance of trad ing meat and milk over long dis -tances in tropi cal cli mates will also en cour age tech -nol ogy de vel op ment and trans fer for food com -modi ties such as ultra- pasteurized dairy prod uctsand vacuum- packed meat. Food safety is likely topro vide the major im pe tus for tech nol ogy de vel op -ment over time. Food safety con cerns will oc ca -sion ally con flict with the ob jec tive of small op era -tors to re main com peti tive. Cur rent de bates overmilk pas teuri za tion in East Af rica bear wit ness to
55

this con flict. East Af ri can con sum ers usu ally boilun pas teur ized fresh milk col lected ear lier in the day be cause pas teuri za tion makes prod ucts much moreex pen sive (Staal, Del gado, and Nichol son 1997).
In the de vel oped coun tries risk analy sis is typi -cally used to help evalu ate ex ist ing pro grams forfood safety. The trend to ward globali za tion of trademakes this kind of analy sis in creas ingly im por tant.Risk analy sis will have to be widely in tro duced inde vel op ing coun tries over the next two dec ades. Itin volves an it era tive pro cess with three sets of ele -ments. First is risk as sess ment, es ti mat ing the prob -abil ity and po ten tial se ver ity of dam age re sult ingfrom food haz ards. Sec ond is risk man age ment, thede vel op ment of pol icy for food safety and foodsafety pro grams. Third is risk com mu ni ca tion, pro -duc tive in ter ac tions be tween poli cy mak ers andstake hold ers.
Haz ard Analy sis Criti cal Con trol Points(HACCP) analy sis is pres ently the tool of choice for han dling the risks noted above. It iden ti fies criti calareas in the food chain that must be moni tored toen sure food safety. Four steps are in volved: as sess -ment of risks in the food chain, de ter mi na tion of the criti cal con trol points and criti cal lim its for en sur -ing food safety, de vel op ment of moni tor ing sys -tems, and im ple men ta tion of pro ce dures for veri fi -ca tion. Post har vest meth ods that a short time agoseemed fea si ble only in the con text of developed- country in dus trial proc ess ing are now be com ingcom mon place in the shrimp and high- value fish er -ies ex port sec tor of de vel op ing coun tries. Simi larpro ce dures for high- value meat and milk prod uctsshould fol low suit in the next two dec ades.
Technology to Improve theEnvironmental Effects ofLivestock ProductionLive stock are of ten cited as the source of en vi ron -mental woes (Chap ter 7). Not all of this nega tivepub lic ity is mer ited, es pe cially un der developing- country con di tions. Where the prob lem does ex ist, itis of ten a mat ter of fun da men tal eco nomic struc turesand in sti tu tions that must be ad dressed through pol -icy change rather than tech nol ogy per se. En vi ron -men tal deg ra da tion from de for es ta tion and over -stock ing on the com mons are cases in point. Yet
tech no logi cal de vel op ment can of fer some hope inde vel oped coun tries, and will be in creas ingly use fulin this re gard in de vel op ing coun tries.
Live stock are cited as cul prits in global cli matechange be cause they emit green house gases. In de -vel oped coun tries live stock meth ane emis sions canbe re duced through the use of treated feeds and a ra -tion closer to nu tri tional re quire ments. While emis -sions will con tinue to grow in ab so lute terms in de -vel op ing coun tries, in ten si fi ca tion of pro duc tionwill en hance the di gesti bil ity of feed, re duc ingemis sions per unit of out put.
Live stock also af fect the en vi ron ment by com -pact ing the soil struc ture, which re sults in ac cel er -ated run- off and soil ero sion. High stock ing ratesand un con trolled graz ing cre ate this prob lem, es pe -cially in the hilly areas of de vel op ing coun tries. Inorder to man age the bio mass needs of ani mals atvary ing graz ing in ten si ties and main tain a criti calvege ta tive cover to mini mize soil ero sion, graz ingop tions and pas ture spe cies have to be de fined(Mwen dera and Mo hamed Saleem 1997; Mwen -dera, Mo hamed Saleem, and Woldu 1997). Graz ing sys tems will re main an im por tant source of ani malprod ucts for the fore see able fu ture. To some ex tentthese sys tems can sus taina bly in ten sify pro duc tionwith stronger in sti tu tions, local em pow er ment, andregu la tion of ac cess to re sources.
Mixed farm ing sys tems around the world willcon tinue to in ten sify and grow in size. Graz ing sys -tems may evolve into mixed farm ing sys tems wherethere is po ten tial for mixed farm ing, as there is in thesemi arid and sub hu mid trop ics. Im por tant pro duc tiv -ity gains can be achieved in mixed farm ing by fur -ther en hanc ing nu tri ent and en ergy flows be tweencrops and live stock. In mixed sys tems live stock sub -sti tute for natu ral and pur chased in puts, in ad di tion to pro duc ing meat and milk. The en vi ron mental andeco nomic sta bil ity of mixed sys tems make this formof farm ing in de vel op ing coun tries a prime can di date for tech nol ogy trans fer and de vel op ment.
Novel con cepts are being devel oped to inte -grate crop and live stock pro duc tion in a farm ingarea rather than on indi vid ual farms. Are awidecrop- livestock inte gra tion allows indi vid ual, spe -cial ized enter prises to oper ate sepa rately butenergy for farm ing and flows of organic and min -eral mat ter to be linked by mar kets and regu la -tions. This pro duces the high est effi cien cies at the
56

enter prise level while maxi miz ing social bene fits.A form of are awide mixed farm ing is already fairly com mon in devel op ing coun tries, where manure isbar tered for feed.
In dus trial sys tems usu ally have a com peti tiveedge over land- based sys tems. But in areas withhigh ani mal den si ties, in dus trial sys tems will haveto ab sorb in creased pro duc tion costs as a re sult ofmore strin gent regu la tions and pol lu tion lev ies. Insome cases, this will re move the com peti tive edgeof in dus trial pro duc tion.
Tech nol ogy will play an im por tant role in theproc ess ing of ani mal wastes into use ful prod ucts.Such tech nolo gies, for the pro duc tion of dry- pelletfer til izer from chicken waste, for ex am ple, are be -com ing fairly com mon in de vel oped coun tries(CAST 1996). The eco nom ics of waste dis posal incrowded de vel op ing coun tries are likely to evolvein this di rec tion as well, though proba bly not in thenext 15 years.
Likely Pathways for the Transferof Livestock Technology toDeveloping CountriesA number of im por tant tech no logi cal de vel op ments are tak ing shape, par ticu larly in ge net ics and re pro -duc tion, feed ing, and ani mal health. By 2020 thesede vel op ments proba bly will be widely in use.Demand- driven pro duc tion sys tems in de vel op ingcoun tries will likely adopt these tech nolo gies fairlyrap idly. Most of these sys tems will be in East Asia,pe ri ur ban India, and Latin Amer ica out side the An -dean areas. Where de mand is grow ing lessquickly—most of South Asia, Sub- Saharan Af rica,and the An dean coun tries—tech nol ogy up take willbe slower and im por tant pock ets of tech no logi calstag na tion will re main. Public- sector re search andex ten sion for live stock will have a high pay off inthe fast- growing areas if they com ple ment private- sector ac tiv ity and fa cili tate ac cess to small farm ers. In the slow- growing areas public- sector re searchand ex ten sion will pro vide the main tech no logi calve hi cle for ad dress ing these is sues.
In demand- driven set tings, adop tion usu ally oc -curs through mar ket forces, as long as input pricesre flect the rela tive scar city of in puts and cre ate theap pro pri ate in cen tives. In par ticu lar, tech nolo gies
for in creased pro duc tion of pork and poul try will be largely trans fer able.
Is sues re lat ing to live stock and the en vi ron ment can not be solved with tech ni cal in no va tions alone.A com pre hen sive pol icy frame work is needed to fa -cili tate the adop tion of ef fec tive tech nolo gies.Tech nol ogy re mains the key com po nent be causefu ture de vel op ment, in clud ing that of the live stocksec tor, will de pend upon land- and water- savingtech nol ogy to sub sti tute for use of natu ral re -sources. This trend to ward knowledge- intensivesys tems can be widely ob served. Smart tech nolo -gies, sup ported by as tute poli cies, can help to meetfu ture de mand while main tain ing the in teg rity ofthe natu ral re source base. Bet ter in for ma tion onwhich to base de ci sion mak ing is, there fore, ur -gently re quired.
New forms of com mer cial and spe cial ized pro -duc tion that are based upon the re source en dow -ments of a re gion and that main tain nu tri ent bal -ances will have to be es tab lished. In ten sive sys temsneed to be in te grated into a wider frame work forland use in order to blend resource- saving tech nolo -gies with the ab sorp tive ca paci ties of the sur round -ing land. This is par ticu larly nec es sary for pig andpoul try pro duc tion. New or gan iza tional ar range -ments will have to be found to allow spe cial izedunits to capi tal ize on econo mies of scale. The fu ture is likely to bring a trans for ma tion of family- basedmixed farms into spe cial ized and com mer cial en ter -prises in rural areas.
Poli cies will need to pro mote are awide in te gra -tion (as op posed to in di vid ual farm in te gra tion).This kind of pro duc tion or gani za tion is a long- termob jec tive of en vi ron men tally sus tain able ag ri cul -ture in high- potential zones. In the de vel opedworld, ex ces sive ani mal con cen tra tion is being con -trolled through quan ti ta tive lim its on ani mal num -bers and re lo ca tion of ani mal pro duc tion to areas oflower den sity. Regu la tions for in dus trial pro duc tion sys tems in urban and pe ri ur ban en vi ron ments needto en force vir tu ally zero green house gas emis sionsand re stric tive li cens ing.
To main tain the nu tri ent bal ance in nutrient- deficit mixed farm ing and to en hance crop- livestock in te gra tion in de vel op ing coun tries, poli -cies need to pro vide in cen tives and serv ices fortech nol ogy up take. To re duce nu tri ent sur plus inmixed farm ing sys tems, regu la tions to con trol ani -
57

mal den si ties and waste dis charge and in cen tivesfor waste re duc tion are re quired. Often this im pliesthat sub si dies on con cen trate feed and in puts usedin the pro duc tion of feed need to be re moved.
To ad dress en vi ron mental deg ra da tion in thegraz ing areas of de vel op ing coun tries, poli cies needto fa cili tate local em pow er ment and cre ate prop erty- rights in stru ments, while al low ing for the flexi bil ityof move ment of pas tor al ists. Land- tenure ar range -ments can also help limit the ex pan sion of ranch inginto the rain for est fron tier in Latin Amer ica. Lackof mar ket ac cess also de grades the land and needsto be ad dressed. Other in cen tives may help to re ducegraz ing pres sure in the semi arid zones, for ex am ple,the in tro duc tion of full cost re cov ery for water andani mal health serv ices. Graz ing fees would pro vide
in cen tives. Simi larly, taxa tion for pas ture and crop -land in rain for est areas can dis cour age for est con ver -sion. This needs to be ac com pa nied by regu la tionspro tect ing the most valu able areas in terms of the environment or bio di ver sity.
Fi nally, as poli cy mak ers and de vel op mentpart ners be come in creas ingly aware of the keypov erty al le via tion role of live stock in de vel op -ing coun tries, agen cies charged with fa cili tat ingin creased live stock pro duc tiv ity are likely to putpov erty al le via tion con cerns higher on theiragenda. This in turn is likely to bind tech nol ogyde vel op ment more tightly with co op era tives andother small- producer in sti tu tions that help smallop era tors over come the trans ac tion costs of entryinto a major com mer cial ac tiv ity.
58

10. Taking Stock and Moving Forward
Truly it is not in ap pro pri ate to use the term “Live -stock Revo lu tion” to de scribe events in world ag ri -cul ture in the next 20 years. Like the well- knownGreen Revo lu tion, the label is a sim ple and con ven -ient ex pres sion that sum ma rizes a com plex se ries of in ter re lated pro cesses and out comes. As in the caseof ce re als, the stakes for the poor in de vel op ingcoun tries are enor mous. Not un like the GreenRevo lu tion, the “revo lu tion ary” as pect comes fromthe par tici pa tion of de vel op ing coun tries on a largescale in trans for ma tions that had pre vi ously oc -curred mostly in the tem per ate zones of de vel opedcoun tries. And like the gradu ally but stead ily ris ingce real yields in the 1970s and 1980s that typi fiedthe Green Revo lu tion, the Live stock Revo lu tionstarted off gradu ally and in creased its rate ofgrowth. But the simi lari ties end there.
The Green Revo lu tion for ce re als was asupply- side phe nome non; it rested on fun da men taltech no logi cal change and the ad ap ta tion and ex ten -sion of seed- fertilizer in no va tions in de vel op ingcoun tries. The Live stock Revo lu tion is demand- driven. With no ta ble ex cep tions for milk and poul -try in the de vel oped coun tries, where tech no logi calprog ress ar gua bly pre ceded and pre cipi tatedchanges in de mand through lower prices, the sup ply side of the Live stock Revo lu tion until now hasmostly re sponded—often under dis torted in cen -tives—to rapid in creases in de mand.
This paper shows that the Revo lu tion has sevenspe cific char ac ter is tics, each of which of fers bothdan gers and posi tive op por tu ni ties for human wel -fare and en vi ron mental sus tain abil ity. The sevenare: (1) rapid world wide in creases in con sump tionand pro duc tion of live stock prod ucts; (2) a majorin crease in the share of de vel op ing coun tries in total live stock pro duc tion and con sump tion; (3) on go ingchange in the status of live stock pro duc tion from amul ti pur pose ac tiv ity with mostly non trad able out -put to food and feed pro duc tion in the con text of
glob ally in te grated mar kets; (4) in creased sub sti tu -tion of meat and milk for grain in the human diet;(5) rapid rise in the use of cereal- based feeds;(6) greater stress put on graz ing re sources alongwith more land- intensive pro duc tion closer to cit -ies; and (7) the emer gence of rapid tech no logi calchange in live stock pro duc tion and proc ess ing inin dus trial sys tems.
The dan gers and op por tu ni ties raised by each of the seven char ac ter is tics of the Live stock Revo lu -tion will be ex am ined in turn. Then four major pil -lars on which to base forward- looking poli cy mak -ing for the live stock sec tors of de vel op ing coun tries will be sug gested. Many of the spe cific ac tions aredis cussed in more de tail in the con clu sions to Chap -ters 6 through 9 of the re port.
Char ac ter is tics of the Live stockRevolution
Rapid Increases in Demand That AffectProduction Patterns and TradeRapid de mand growth in de vel op ing coun tries pro -pels the global Live stock Revo lu tion. Ex pand ingde mand is the re sult of a com bi na tion of high realin come growth, swel ling popu la tions, rapid ur bani -za tion, and the on go ing di ver si fi ca tion ofdeveloping- country diets away from very high lev -els of starchy sta ples. Milk con sump tion has grownmore than 3 per cent per year in de vel op ing coun -tries since the early 1980s and is pro jected to groweven faster through 2020. Meat con sump tion hasbeen grow ing about 5 per cent per year and is ex -pected to grow 2.8 per cent per year through 2020.
These developing- country growth rates canbe com pared to the slow fore cast for con sump -tion growth in the de vel oped world: 0.7 per centper year for meat and 0.4 per cent per year formilk through 2020. This low growth in de vel oped
59

coun tries is largely ex plained by slow popu la tiongrowth, slow ing ur bani za tion, sa tia tion of diets,and grow ing health con cerns about high in takesof cho les terol and satu rated fatty acids fromsome ani mal prod ucts.
The rapid growth in con sump tion of food fromani mals has not been and is not likely to be evenlydis trib uted across re gions or even within coun tries.Since the early 1980s, most growth in con sump tionof meat and milk has oc curred in the rap idly de vel -op ing coun tries of East and South east Asia and to alesser ex tent in Latin Amer ica. Af rica has laggedbe hind, as has India in the case of red meat, al -though India has re cently wit nessed rapid growth in milk and poul try con sump tion.
Pro duc tion trends in the de vel op ing coun triesare fol low ing con sump tion trends. By 2020 the de -vel op ing coun tries are ex pected to pro duce 95 mil -lion met ric tons more meat per year and the de vel -oped coun tries 20 mil lion met ric tons morecom pared to pro duc tion lev els ob served in the early 1990s. This pro duc tion level equals an ad di tional15 kilo grams per cap ita of meat in the de vel op ingworld, given ex pected popu la tion in 2020. Thevalue of the an nual in crease in ani mal food pro duc -tion in de vel op ing coun tries cur rently far ex ceedsthat of the growth in pro duc tion of all the major ce -re als com bined. The ca loric value of ani mal live -stock food prod uct in creases will ex ceed the ca loricvalue of ce re als some time in the next 10 years. Thede vel oped coun tries are also ex pected to add an ad -di tional 15 kilo grams per cap ita of an nual meat pro -duc tion by 2020, much of which will be sold to thede vel op ing coun tries.
Such rapid change is cre at ing new op por tu ni -ties for live stock pro duc ers in de vel op ing coun tries, where some of the world’s poor est peo ple live. Thein crease in live stock food prod ucts also holdsprom ise for re liev ing wide spread mi cro nu tri ent and pro tein mal nu tri tion, while mak ing posi tive con tri -bu tions to the sus tain able in ten si fi ca tion of small -holder ag ri cul ture. Yet, sig nifi cant new dan gers arealso aris ing. Some forms of live stock pro duc tionen cour aged by pol icy dis tor tions are lead ing to se ri -ous en vi ron mental and health risks. Fur ther more,in creas ingly global live stock and feed mar kets areshar ing eco nomic pains faster and more di rectly,even as they share eco nomic pros per ity. Un der -
stand ing the stakes in volved helps mo ti vate thosewho seek to meet the emerg ing chal lenges.
World Market Share Steadily Shifts toDeveloping Countries
A steady in crease is under way in the share of de -vel op ing coun tries in the world’s pro duc tion ofmeat and milk. Shares for the lat ter com modi tiesamounted to only 31 and 25 per cent, re spec tively,in the early 1980s. The base line pro jec tions es ti -mate that developing- country shares in 2020 will be 60 per cent and 52 per cent. Clearly the brunt of thebene fits and costs ex pected from the Live stockRevo lu tion will ac crue to the de vel op ing coun tries.
Sen si tiv ity analy sis sug gests that these pro -jected trends are ro bust. Even under the as sump tionof pro longed eco nomic cri sis in Asia, the growth ofag gre gate con sump tion of live stock prod ucts re -mains strong in de vel op ing coun tries. Fur ther more,if tastes in India shift to ward in creased red meatcon sump tion, as they al ready ap pear to have donefor chicken, the nega tive ef fects of a se vere Asianeco nomic cri sis on world live stock mar kets arewiped out.
Change in Status from a Local Multipurpose Activity to a Global Food Activity
Tra di tion ally, live stock in both the de vel opedand de vel op ing coun tries were kept on- farm fora va ri ety of pur poses, in clud ing food, sav ings,ani mal draft power, fiber, hides, and so forth. Inde vel oped coun tries the use of live stock has be -come spe cial ized. The same trend is being ob -served in de vel op ing coun tries be cause the op -por tu nity for sell ing meat and milk has in creased and the share in pro duc tion of spe cial ized foodani mals, such as pigs and poul try, has risen in re -sponse to food de mand.
Live stock food sec tors—tra di tion ally a majorforum for non tar iff bar ri ers—are now un der go ingrapid changes in na tional poli cies, in clud ing tradelib er ali za tion; in vest ment in trade in fra struc ture(roads, ports, re frig era tion fa cili ties); pri va ti za tionof pro duc tion and mar ket ing; de regu la tion of in ter -nal mar kets; and re duced gov ern ment spend ing onre search, ex ten sion, and in spec tion. These changes
60

have spurred con sump tion of live stock prod uctsand in creased trade.
The ex pan sion and globali za tion of world mar -kets for feed and live stock prod ucts in creases theex tent to which de mand and sup ply shocks, and theover all ef fects of eco nomic boom or bust, arespread to feed and meat prices through out theworld. Major ex port ing coun tries such as Ar gen -tina, Aus tra lia, and United States need to pay closeat ten tion to Asia. The 50 per cent fall in prices forfeed grains and meat dur ing 1998 in the mid westernUnited States was largely at trib ut able to mac -roeconomic events in Asia and the former So vietUnion. Even per sons solely in ter ested in the courseof fu ture live stock prices in East Af ri can coun tries,for ex am ple, can not ne glect events af fect ing live -stock in Asia at the pres ent time, al though doing sowould not have been so un think able only a shorttime ago.
Substitution of Meat and Milk for Grain inthe Human Diet Wide spread evi dence ex ists that as so cie ties growwealth ier they sub sti tute higher- priced live stockcalo ries for lower- priced starch calo ries, at a de -creas ing rate as the sub sti tu tion pro ceeds. In ruralChina, for ex am ple, where meat and milk con sump -tion is still very low, peo ple may well re duce theirdi rect an nual per cap ita con sump tion of ce re alsover the next few dec ades by 20 to 30 kilo grams.Their ce real con sump tion lev els will ap proachthose in the wealth ier seg ments of de vel op ing so -cie ties today. On the other hand, the an nual per cap -ita use of ce re als as feed is pro jected to rise by about 60 to 70 kilo grams in China by 2020. This widelyre pro duced trend in de vel op ing coun tries will behard to stop if in come and urban popu la tion growthcon tinue.
Con trary to the situa tion in de vel oped coun -tries—es pe cially the United States, where live stock foods are heav ily con sumed—even small in creasesin the con sump tion of meat and milk would bebene fi cial for most women and chil dren in de vel op -ing coun tries, at least out side the rich est urbanareas. Pro tein and mi cro nu tri ent de fi cien cies re -main wide spread in de vel op ing coun tries, as Chap -ter 6 points out. Some evi dence ex ists that in creased poul try and fish con sump tion would be pref er ableto in creased red meat con sump tion above a cer tain
level. As in come growth and ur bani za tion pro ceeds, the dis eases of af flu ence as so ci ated with ex cesscho les terol in take could well be come more of aprob lem, as they al ready are in much of the de vel -oped world.
Rapidly Rising World Demand forPurchased Feed ConcentratesAvail able evi dence, both from his tori cal trends andfrom in- depth economet ric stud ies, sug gests thatprice re spon sive ness is con sid er able in world ce re -als pro duc tion. Simu la tions under vari ous sce nar ios in di cate that the net ef fect of the Live stock Revo lu -tion on ce real prices in 2020 would be to pre ventthem from fal ling fur ther from their cur rently lowlev els. Under pes si mis tic as sump tions prices mayin crease by 10 to 20 per cent, but no where near thehigh lev els of the 1980s.
This view of ce real prices is con firmed fur therby events in world mar kets dur ing the past 25 years. De mand in creases for meat and milk have largelybeen met through ex pan sion of feed pro duc tion orim ports at world prices that are de clin ing in realterms. His tori cally, the live stock sec tor has helpedsta bi lize world ce real sup ply. Evi dence from ce realprice shocks in the 1970s and 1980s sug gests thatre duc tions in ce real sup ply were largely ab sorbedby re duc tions in feed for live stock.
In any event, IM PACT proj ects that an ad di -tional 292 mil lion met ric tons of ce re als will beused an nu ally as feed by 2020, with mini mal im pact on ce real prices (a 2 per cent in crease in 2020 rela -tive to the early 1990s in the base line simu la tion).In the worst case sce nario, maize prices rise 21 per -cent above the base line pro jec tions for 2020.
Simu la tions test ing the ef fect of changes in theef fi ciency of grain con ver sion to meat or milk show that ef fi ciency and cost mat ter greatly to the rela tive com peti tive ness of in di vid ual coun tries. Live stockex ports in coun tries with ample graz ing re sources,such as Ar gen tina, did well when feed grain priceswere high be cause they use less feed to pro duce aunit of meat. Coun tries with ample feed grain pro -duc tion and feed- intensive pro duc tion prac tices,such as the United States, ex ported more live stockwhen feed grain prices were low. Feed con ver sionef fi ciency also mat tered to the com po si tion of specific feeds used, ce real de mand gen er ally, andworld trade pat terns, but it barely af fected the level
61

and dis tri bu tion of live stock con sump tion acrosscoun tries. In a price- responsive global sys tem ofmar kets, in creased feed de mand will be met within creased sup ply, with mini mal changes in the finalsup ply of meat.
Yet the soar ing feed de mand pro jected underthe Live stock Revo lu tion also raises a major ca -veat. Just be cause world maize and other feed -grain yields ex panded stead ily under sig nifi cantpub lic and pri vate in vest ment in the past, doesnot guar an tee that this will con tinue in the fu ture,es pe cially if pro duc tiv ity re search stops or pub lic pol icy dis cards the yield po ten tial of bio tech nol -ogy. IM PACT pro jec tions show that an nualgrowth in maize yields for most coun tries av er -ages just above 1 per cent through 2020, a ratesig nifi cantly below his tori cal trends. If fu tureyield growth rates fall below those base line pro -jec tions, ce real prices would be higher than pre -dicted. Fur ther more, an un fore seen melt down inglobal maize pro duc tion, per haps due to dis easesspread be cause of de creased ge netic di ver sity inmaize va rie ties, would in crease grain and meatprices in the im me di ate term be cause of the Live -stock Revo lu tion.
Greater Stress on Extensive Resourcesand More Intensive Livestock ProductionCloser to Cities
Demand- led in creases in live stock pro duc tion haveled to the in ten si fi ca tion of pro duc tion near majorurban mar kets and areas with plen ti ful sup plies ofhigh en ergy feed. These in creases have de gradedpro duc tion re sources, such as pas ture. To date, thehigh est lev els of in ten si fi ca tion have oc curred pri -mar ily in the de vel oped coun tries. Developed- country ex pe ri ences may pro vide ex am ples of pit -falls that de vel op ing coun tries can avoid.
The past expan sion of live stock food pro duc -tion in devel op ing coun tries has come pri mar ilyfrom increased herd sizes. Range deg ra da tion has been observed in exten sive pro duc tion areas,such as graz ing land in the Sahel. In for est areassuch as the Ama zon, per verse incen tives led toirre versi ble defor es ta tion by large cat tle ranchesin the 1970s. As the Live stock Revo lu tion pro -ceeds, incre ments to pro duc tion will have tocome increas ingly from higher pro duc tiv ity of
meat and milk per unit of land to avoid fur therdeg ra da tion of exten sive resources.
Thirty- seven per cent of global live stock pro -duc tion al ready oc curs under in dus trial farm ingcon di tions. In creas ing the level of in dus trial pro -duc tion in many cases is lead ing to dif fi cult prob -lems of ma nure dis posal and nu tri ent over loads inad join ing soils and bod ies of water. While theseprob lems have raised con cerns pri mar ily in de vel -oped coun tries, they will soon be come se ri ous prob -lems in a number of fast- growing de vel op ing coun -tries as well.
Grow ing con cen tra tion of ani mals and peo plein the de vel op ing world’s major cit ies (AddisAbaba, Bei jing, Lima, and Mum bai, for ex am ple)are lead ing to rapid in creases in food safety prob -lems. In fec tions from sal mo nella and E. coli, andemerg ing dis eases such as the avian flu ob served inAsia, give much cause for con cern. Pes ti cides andan ti bi ot ics are also build ing up in the food chain be -cause of live stock pro duc tion prac tices in the de vel -oped coun tries and in coun tries where moni tor ingand en force ment are lax. Fur ther more, as the con -sump tion of live stock prod ucts in creases in tropi calcli mates, es pe cially among those popu la tions forwhom eve ry day use of such prod ucts is rela tivelynew, food safety risks from mi cro bial in fec tion be -come more preva lent.
While the list of dan gers above may seemuni formly nega tive, this is also the ap pro pri ateplace to note that the pros pects for sus tain able in -ten si fi ca tion of small holder ag ri cul ture underrain fed con di tions would be much more dif fi cultwith out a dy namic live stock sec tor. Fami lies liv -ing on a hec tare or two can not sur vive eco nomi -cally with crops alone, es pe cially in pe ri ur banareas. More in ten sive live stock pro duc tion onthese farms pro vides both a higher re turn to farm -ers’ labor and land and a source of or ganic ma te -rial and soil nu tri ents gen er ally lack ing in suchsys tems. Women’s small holder dairy de vel op -ment in East Af rica il lus trates the prom ise that anew live stock ac tiv ity can offer to a farm ing sys -tem under eco nomic stress.
An Era of Rapid Technological Progress,Especially for Industrial LivestockAs set out in de tail in Chap ter 9, the last two or three dec ades have seen rapid tech no logi cal prog ress in
62

in dus trial live stock pro duc tion, mostly in de vel -oped coun tries. Pro gress has come in the form ofim proved feed con ver sion, higher out put per ani -mal, and higher qual ity of final prod uct.
In the de vel oped coun tries, tech no logi cal prog -ress for both ru mi nants and monogas tric ani mals in -volved re pro duc tive and ge netic tech nol ogy, in clud -ing ad vances in bio tech nol ogy; feed im prove mentthrough blend ing, proc ess ing, ge netic means, andchemi cal treat ment; use of growth hor mones; andim prove ments in ani mal health main te nance. Someof these in dus trial tech nolo gies, es pe cially for pigsand poul try, have been fairly eas ily trans ferred to de -vel op ing coun tries.
The pri vate sec tor has played an im por tant andoften domi nant role in boost ing live stock pro duc -tiv ity and solv ing en vi ron mental prob lems in in dus -trial sys tems. While live stock sys tems and pro duc -tiv ity lev els in some de vel op ing coun tries havebegun to con verge with those in de vel oped coun -tries, some whole re gions, such as Sub- Saharan Af -rica, have fallen be hind. This raises the ques tion ofhow pro duc tiv ity in creases in those areas are bestde vel oped and propa gated.
Strategic Elements for LivestockPolicy in Developing CountriesTaken to gether, the many op por tu ni ties and dan gersof the Live stock Revo lu tion dis cussed above sug gest that it would be fool ish for de vel op ing coun tries toadopt a lais sez faire pol icy for live stock de vel op -ment. Many spe cific rec om men da tions for con creteac tion are given in the in di vid ual con clu sions toChap ters 6–9. The fo cus here, how ever, is on thefour broad pil lars on which to base a de sir able live -stock de vel op ment strat egy for de vel op ing coun -tries. These are (1) re mov ing pol icy dis tor tions thatar ti fi cially mag nify econo mies of scale in live stockpro duc tion; (2) build ing par tici pa tory in sti tu tions ofcol lec tive ac tion for small- scale farm ers that al lowthem to be ver ti cally in te grated with live stock proc -es sors and in put sup pli ers; (3) cre at ing the en vi ron -ment in which farm ers will in crease in vest ment inways to im prove pro duc tiv ity in the live stock sec tor;and (4) pro mot ing ef fec tive regu la tory in sti tu tions to deal with the threat of en vi ron mental and health cri -ses stem ming from live stock.
Removing Policy Distortions that PromoteArtificial Economies of Scale in LivestockProduction
The po liti cal econ omy in de vel op ing coun triesoften fa vors sys tems that sig nifi cantly bene fit a fewtar geted in di vidu als or in sti tu tions rather than pro -vid ing small in cre ments for large num bers of peo -ple. In ap pro pri ate live stock de vel op ment pat terns,such as high- cost and highly capi tal ized in dus trialpig, milk, and poul try pro duc tion in the pe ri ur banareas of de vel op ing coun tries, are often the re sult of de lib er ate pol icy choices. Ar ti fi cially cre atedecono mies of scale in pro duc tion add to tech no logi -cal econo mies of scale that may exist for poul tryand pigs (though they proba bly do not exist fordairy or ru mi nant meat). The re sult may be a live -stock in dus try domi nated by a few large pro duc ers,with few op por tu ni ties for poor farm ers and lit tlecon trol of en vi ron mental or health risks.
Even in the ab sence of spe cific tax breaks orsub si dies, dis tor tions in do mes tic capi tal mar ketsthat pro vide cheap capi tal to large en ter prises andlim ited or ex pen sive loans to small- scale op era -tions, favor the large over the small and the sub sti -tu tion of capi tal for labor. Poli cies deal ing with in -fra struc ture and ac cess to natu ral re sources canun in ten tion ally bene fit large- scale pro duc ers at theex pense of smaller ones.
Urban pig ger ies and dair ies that do not ade -quately dis pose of waste ma te ri als often op er ate inpoor regu la tory en vi ron ments, under dis tor tions inthe mar ket ing chain that pre vent com pe ti tion fromrural areas, and with out legal ac count abil ity for pol -lu tion. Over graz ing often re sults from in ade quateprop erty rights de vel op ment and en force mentmecha nisms as well as po liti cally mo ti vated sub si -dies to large pro duc ers. The point is that there is ade gree of choice in how gov ern ments pro mote live -stock de vel op ment, and the deck is often stacked infavor of sys tems that harm the en vi ron ment andpro vide lesser bene fits to large num bers of poorrural peo ple.
Al ter na tives to large, in dus trial pro duc tionsys tems might be de vel oped through ver ti cal co -or di na tion of spe cial ized crop and live stock ac -tivi ties in high- potential areas. This would per mit spe cial ized en ter prises to per form ef fi cientlywhile main tain ing the bio physi cal links be tween
63

crops and live stock. Such con tracts be tween spe -cial ized feed and live stock pro duc ers are morelikely to emerge if ver ti cally in te grated com pa -nies in the in dus trial sys tem have to bear the fullcosts of their use of the en vi ron ment.
The main al ter na tive to an in dus trial pro duc tion sys tem in many de vel op ing coun tries is one thatuses the labor and quality- control of many smallfarm ers in pro duc tion, but also bene fits from the ex -per tise, tech nol ogy and as sets of large- scale com pa -nies that are under con tract for input pro vi sion,proc ess ing, and dis tri bu tion of out put. Such ar -range ments in fact char ac ter ize the poul try in dus tryin the United States and cor re spond to con tractfarm ing of high- value crops in many de vel op ingcoun tries. As dis cussed above, many ap par entecono mies of scale are in fact lo cated in input sup -ply and out put proc ess ing and dis tri bu tion. Thissug gests that in sti tu tional in no va tions can allow the poor to enjoy a greater share of the bene fits of theLive stock Revo lu tion.
Building Institutions for Incorporating PoorProducers into the Benefits of the LivestockRevolution
Con sid er able evi dence from field stud ies aroundthe world shows that the rural poor and landlesspres ently earn a higher share of their in come fromlive stock than better- off rural peo ple. Pov erty al le -via tion poli cies must find a way to help the ruralpoor par tici pate in the growth made pos si ble by theLive stock Revo lu tion. The al ter na tive might be that the poor are driven out by in dus trial live stock pro -duc ers, and the one grow ing mar ket they pres entlycom pete in will be closed to them.
Small pro duc ers face many hid den costs underdeveloping- country con di tions. They find it dif fi -cult to gain ac cess to pro duc tive as sets such ascredit and re frig era tion fa cili ties and to in for ma tionsuch as knowl edge of mi cro bial con tami na tion pre -ven tion pro ce dures. In ad di tion, the small pro ducerof per ish ables in the trop ics typi cally is at a bar gain -ing dis ad van tage with mar ket ing agents, be causethe prod uct must be moved im me di ately or lose itsvalue. Con tract in sti tu tions re store the bal ance andalso bene fit dis tribu tors by as sur ing qual ity and re -li able sup ply. The prob able ex is tence of genu ineecono mies of scale in input sup ply to live stock en -
ter prises and in proc ess ing and dis tri bu tion of per -ish able com modi ties gen er ally, sug gests waysshould be found to in te grate small pro duc ers ver ti -cally with live stock food proc es sors who are also ina po si tion to man age input sup ply. In de vel opedcoun tries this has been ac com plished through con -tract farm ing or par tici pa tory pro ducer co op era -tives, es pe cially in the case of milk and poul try.
Gov ern ments and de vel op ment part nersseek ing to in vest in eco nomic capacity- building,while fa cili tat ing the par tici pa tion of the poor incom mer cially vi able ac tivi ties, need to fol low the Live stock Revo lu tion closely. The stakes arehigh and grow ing, and the rap idly ris ing de mandfor out put in creases the prob abil ity of suc cess.The worst thing that well- motivated agen cies can do is to pre vent pub lic in vest ments that could fa -cili tate sus tain able and market- oriented live stock pro duc tion by small pro duc ers. This will not stopthe Live stock Revo lu tion, but it will help en surethat the form it takes is less fa vor able for pov ertyal le via tion and sus tain abil ity.
Creating Urgently Needed Public Goods forLivestock Production Creation in Developing Countries
The bene fits pro vided by tech nol ogy de vel op mentand ex ten sion in the in dus trial live stock sec tors ofde vel oped coun tries largely ac crue in the mar ket -place. The pri vate sec tor, there fore, will con tinue to play the lead ing role in fur ther live stock tech nol ogy de vel op ment and dif fu sion in developed- countryin dus trial sys tems. In dus trial tech nolo gies for pigsand poul try are largely trans fer able to de vel op ingcoun tries, sug gest ing that the need for pub lic goodspro vi sion for these items is mod est. The prob lem isthat tech nol ogy de vel op ment and ex ten sion are also re quired for cat tle and other types of live stock pro -duc tion. The role of the pub lic sec tor be comes anissue here, es pe cially in de vel op ing coun tries,where large pri vate com pa nies rarely op er ate out -side the in dus trial live stock sec tor.
As the stakes rise with the Live stock Revo lu -tion, pol icy re gard ing the costs of live stock pro duc -tion in de vel op ing coun tries be come even morecriti cal than be fore. Edu ca tional, vet eri nary, re -search, ex ten sion, and input pro vi sion are not yetfully pri vat ized and in many cases can not yet be pri -
64

vat ized at pre vail ing stages of de vel op ment. Thepub lic goods as pect of live stock de vel op ment in de -vel op ing coun tries has al ways ex isted. The dif fer -ence now is that be cause the mar ket is grow ing, cre -at ing op por tu ni ties and risks, the pub lic goodsas pect really mat ters, es pe cially in disease- controlfor smallholder- produced ani mals in ver ti cally in te -grated in dus trial systems.
Meat and milk pres ently con trib ute more than40 per cent of the value of food and ag ri cul tural pro -duc tion in the world, but re ceive a dis pro por tion -ately small al lo ca tion of pub lic in vest ments for fa -cili tat ing pro duc tion. Greatly in creased at ten tionmust be given to live stock pro duc tiv ity is sues in de -vel op ing coun tries, in clud ing post har vest proc ess -ing and mar ket ing. Pol icy not only needs to fa cili -tate the shift from in creas ing herd size to in creas ingpro duc tiv ity, but it needs to steer this de vel op mentaway from over in ten si fi ca tion and en vi ron mentaldeg ra da tion.
Above all, pub licly funded re search and ex ten -sion should focus on ag ri cul tural re source man age -ment that com pre hen sively fur thers pol icy goals thatre late to human needs. Rather than em pha siz ing out -put maxi mi za tion above all else, re search and ex ten -sion should find ways to use a dy namic live stocksec tor to im prove food se cu rity and al le vi ate pov ertyand at the same time mini mize ad verse ef fects onpub lic health and the en vi ron ment. The de sign ofpub lic in vest ment must there fore go be yond a stricttech ni cal ori en ta tion and con sider the so cial, eco -nomic, and eco logi cal di men sions of the in ter ac tionof live stock with the bet ter ment of live li hoods.
En hanc ing the de sign of pub lic in vest ment inthe live stock sec tor of de vel op ing coun tries re -quires sub stan tial im prove ments in the crea tion,dis semi na tion, analy sis, and use of policy- relevantin for ma tion con cern ing live stock. Spe cifi cally, anim proved in ven tory and moni tor ing sys tem of thechanges in the avail abil ity, use, and man age ment ofthe ag ri cul tural re source base world wide has to becre ated. Dif fer ences and over laps be tween the eco -logi cal and eco nomic ef fi ciency of live stock pro -
duc tion need to be de fined. These steps will re quirethe com pi la tion and dis semi na tion of ex ten siveeco logi cal and eco nomic data per tain ing to live -stock pro duc tion to com ple ment the ex ten sive tech -ni cal data avail able.
Regulating Environmental andPublic Health Concerns
In the pres ent phase of live stock de vel op ment in the more dy namic de vel op ing coun tries, the size, com -po si tion, and end des ti na tion of live stock pro duc -tion ar gua bly have out grown the lim ited in sti tu -tional ca pac ity of min is tries to cope with re sult ingen vi ron mental and pub lic health is sues. Regu la toryagen cies need to func tion in a way that is com men -su rate with the kinds of prob lems aris ing. For ex -am ple, meat hy giene needs to be bet ter en forced inurban China and graz ing bet ter man aged in WestAf rica. Gen er ally, tech nolo gies that deal with en vi -ron mental and pub lic health dan gers stem mingfrom the Live stock Revo lu tion will not work un lessregu la tory en force ment backs them up. Such in sti -tu tional de vel op ments will likely occur only whenthe po liti cal de mands for bet ter regu la tion be comestrong. Such was the case in an ear lier era in the de -vel oped coun tries. In de vel op ing coun tries, anounce of pre ven tion may elimi nate the need for apound of cure.
In sum, it is un wise to think that the Live stockRevo lu tion will some how go away in re sponse tomoral sua sion by well- meaning de vel op ment part -ners. It is a struc tural phe nome non that is here tostay. How bad or how good it will be for the popu la -tions of de vel op ing coun tries is in tri cately bound up with how coun tries choose to ap proach the Live -stock Revo lu tion. Poli cies can sig nifi cantly im -prove pov erty al le via tion, en vi ron mental sus tain -abil ity, and pub lic health, but only if new ac tionsare un der taken. Fail ing to act risks throw ing awayone of the few dy namic eco nomic trends that can be used to im prove the lives of poor rural peo ple in de -vel op ing coun tries.
65

66
Appendix: Re gional Clas si fi ca tion of Coun triesUsed in this Paper
Re gion Mem ber coun tries
China Main land China
Other East Asia Hong Kong, Ma cau, Mon go lia, North Ko rea, and South Ko rea
In dia In dia
Other South Asia Af ghani stan, Bang la desh, Bhu tan, Mal dives, Ne pal, Paki stan, andSri Lanka
South east Asia Brunei, Cam bo dia, East Timor, In do ne sia, Laos, Ma lay sia,My an mar, Phil ip pines, Sin ga pore, Thai land, and Viet Nam
Latin Amer ica South and Cen tral Amer ica and Car ribean
West ern Asia andNorth Af rica
Al ge ria, Bah rain, Cy prus, Egypt, Gaza Strip, Iran, Iraq, Jor dan,Ku wait, Leba non, Libya, Mo rocco, Oman, Qatar, Saudi Ara bia,Syria, Tu ni sia, Tur key, United Arab Emir ates, West ern Sa hara,and Yemen
Sub- Saharan Af rica Af rica south of the Sa hara ex cept for South Af rica
De vel oped Aus tra lia, Can ada, East ern Europe, Euro pean Un ion, otherWest ern Euro pean coun tries, Is rael, former So viet Un ion, Ja pan,New Zea land, South Af rica, United States
De vel op ing All other coun tries in FAO Sta tis tics Da ta base
World All coun tries in cluded in FAO Sta tis tics Da ta base
Sources: Re gional group ings were cho sen based on FAO 1998, which is con sis tent with clas si fi ca tion in Rosegrant et al. 1997.Note: Data from some small coun tries were not avail able in all se ries in all years. Miss ing val ues for very small coun tries are ig nored with out
note.

References
Ad ams, R. H. Jr., and J. J. He. 1995. Sources of in -come ine qual ity and pov erty in ru ral Paki stan.Re search Re port 102. Wash ing ton, D.C.: In ter -na tional Food Pol icy Re search In sti tute.
Al ex an dra tos, N., ed. 1995. World ag ri cul ture: To -ward 2010. Rome: Food and Ag ri cul ture Or -gani za tion of the United Na tions.
An der son, K., B. Di maranan, T. Hertel, and W.Mar tin. 1997. Asia- Pacific food mar kets andtrade in 2005: A global, economy- wide per -spec tive. Aus tra lian Jour nal of Ag ri cul tural andRe source Eco nom ics 41 (March): 19–44.
Bar nard, N. D., A. Nichol son, and J. L. How ard.1995. The medi cal costs at trib ut able to meatcon sump tion. Pre ven tive Medi cine 24 (No vem -ber): 646–655.
Behnke, R.H., I. Scoones, and C. Ker ven. 1993.Range ecol ogy in dise qui lib rium. Lon don:Over seas De vel op ment In sti tute/In ter na tionalIn sti tute for En vi ron ment and De vel op ment,Com mon wealth Sec re tar iat.
Bhalla, G. S., P. Ha zell, and J. Kerr. 1998. Pros pects for bal anc ing food needs with sus tain able re -sources man age ment in In dia to 2020. In ter na -tional Food Pol icy Re search In sti tute, Wash -ing ton, D.C. Mimeo.
Bouis, H. 1991. The re la tion ship be tween nu tri tionand in come sources for the ru ral poor in asouth ern Phil ip pine prov ince. In In comesources of mal nour ished peo ple in ru ral ar eas:Mi cro level in for ma tion and pol icy im pli ca -tions, ed. Joachim von Braun and Ra julPandya- Lorch. Work ing Pa pers on Com mer -ciali za tion of Ag ri cul ture and Nu tri tion No. 5.Wash ing ton, D.C.: In ter na tional Food Pol icyRe search In sti tute.
Bouwman, A. F., N. H. Bat jes, and E. M. Bridges.1992. Meth od ol ogy and data used to es ti matenatu ral N2O emis sions. Pa per pre sented at anin ter na tional work shop on World In ven tory ofSoil Emis sions Po ten tials, August 24–27,Wagen in gen, The Neth er lands.
Brand jes, P., J. de Wit, H. van Keulen, and H. B. van de Meer. 1995. En vi ron men tal im pact of ma -nure man age ment. Im pact do main study for theFAO/WB study on live stock and the en vi ron -ment. Fi nal Draft. Wagen in gen, The Neth er -lands: In ter na tional Ag ri cul tural Cen tre.
Brok ken, R. G., and S. Sey oum, eds. 1992. Dairymar ket ing in Sub- Saharan Af rica. Pro ceed ings of a sym po sium held at the In ter na tional Live stockCen tre for Af rica, Ad dis Ababa, Ethio pia, 26–30No vem ber 1990. Ad dis Ababa: In ter na tionalLive stock Cen tre for Af rica (now known as theIn ter na tional Live stock Re search In sti tute).
Brown, L. R., and H. Kane. 1994. Full house: Re as -sess ing the earth’s popu la tion car ry ing ca pac -ity. New York: W. W. Nor ton.
Cal lo way, D. H. 1995. Hu man nu tri tion: Food andmi cro nu tri ent re la tion ships. Ag ri cul turalStrate gies for Mi cro nu tri ents Work ing Pa per 1.In ter na tional Food Pol icy Re search In sti tute,Wash ing ton, D.C. Pho to copy.
CAST (Coun cil for Ag ri cul tural Sci ence and Tech -nol ogy). 1994. How much land can ten bil lionpeo ple spare for na ture? Ames, Iowa: CAST.
———. 1996. In te grated ani mal waste man age -ment. Ames, Iowa: CAST.
———. 1997a. Con tri bu tion of ani mal prod ucts tohealth ful di ets. Ames, Iowa: CAST.
———. 1997b. The well- being of ag ri cul tural ani -mals. Ames, Iowa: CAST.
67

———. Forth com ing. Con tri bu tion of ani mal ag ri -cul ture to meet ing global hu man food de mand.Ames, Iowa: CAST.
Chen, J., T. C. Camp bell, J. Li, and R. Peto. 1990.Diet, life style and mor tal ity in China: A study of the char ac ter is tics of 65 Chi nese coun ties. Ith -aca, NY: Cor nell Uni ver sity Press.
Chu pin, D., and H. Schuh. 1993. Sur vey of pres entstatus of the use of ar ti fi cial in semi na tion in de -vel op ing coun tries. World Ani mal Re view 74/75: 26–35.
Chu pin, D., and M. Thi bier. 1995. Sur vey of thepres ent status of the use of ar ti fi cial in semi na -tion in de vel oped coun tries. World Ani mal Re -view 82: 58–68.
Cun ning ham, E. P. 1997. The ap pli ca tion of bio tech -nolo gies to en hance ani mal pro duc tion in dif fer -ent farm ing sys tems. Pa per com mis sioned by theFood and Ag ri cul ture Or gani za tion of the UnitedNa tions in part ner ship with the As so cia tion forSouth ern Af ri can States and the Euro pean As so -cia tion for Ani mal Pro duc tion.
de Haan, C., H. Ste in feld, and H. Black burn. 1997.Live stock and the en vi ron ment: Find ing a bal -ance. Re port of a study co or di nated by the Foodand Ag ri cul ture Or gani za tion of the United Na -tions, the United States Agency for In ter na tionalDe vel op ment, and the World Bank. Brus sels:Euro pean Com mis sion Directorate- General forDe vel op ment.
de Wit, J., P. T. Wes tra, and A. J. Nell. 1996. En vi -ron men tal as sess ment of landless ru mi nantpro duc tion sys tems. Work ing docu ment live -stock and the en vi ron ment: Find ing a bal ance.Rome: Food and Ag ri cul ture Or gani za tion ofthe United Na tions, World Bank, and UnitedStates Agency for In ter na tional De vel op ment.
Del gado, C. 1998. Sources of growth in small holder ag ri cul ture in Sub- Saharan Af rica: The role ofver ti cal in te gra tion with proc es sors of highvalue- added items. Pa per pre sented at theInter- Conference Sym po sium of the In ter na -tional As so cia tion of Ag ri cul tural Econo mists,August 10–16, Bad plaas, South Af rica.
Del gado, C., and C. Cour bois. 1998. Trade- offsamong fish, meat, and milk de mand in de vel op -ing coun tries from the 1970s to the 1990s. Pa -per pre sented at the 9th Bi en nial Con fer ence ofthe In ter na tional In sti tute of Fish er ies Eco nom -ics and Trade—IIFET 98, July 7–11, Tromsö,Nor way.
Del gado, C., C. Cour bois, and M. Rosegrant. 1998.Global food de mand and the con tri bu tion oflive stock as we en ter the new mil len nium. Pa -per pre sented at the Brit ish So ci ety of Ani malScience- Kenya Ag ri cul tural Re search In sti tuteCon fer ence on Food, Lands and Live li hoods:Set ting Re search Agen das for Ani mal Sci ence,Janu ary 27–30, Nai robi, Kenya.
Ehui, S., H. Li- Pun, V. Mares, and B. Shapiro. 1998. The role of live stock in food se cu rity and en vi -ron mental pro tec tion. Out look on Ag ri cul ture27(2): 81–87.
Fami now, M. D., and S. A. Vosti. 1998. Livestock- deforestation links: Pol icy is sues in the west ern Bra zil ian Ama zon. In Live stock and the en vi -ron ment in ter na tional con fer ence, ed. A. J.Nell. Pro ceed ings of the In ter na tional Con fer -ence on Live stock and the En vi ron ment held inEde/Wagen in gen, The Neth er lands, 16–20June, 1997, and or gan ized by the World Bank,Food and Ag ri cul ture Or gani za tion of theUnited Na tions, and the In ter na tional Ag ri cul -ture Cen tre. Wagen in gen: In ter na tional Ag ri -cul tural Cen tre.
Fan, S., and M. Agcaoili- Sombilla. 1998. Why pro -jec tions on Chi na’s fu ture food sup ply and de -mand dif fer. The Aus tra lian Jour nal of Ag ri cul -tural and Re source Eco nom ics 41 (June): 69–90.
FAO (Food and Ag ri cul ture Or gani za tion of theUnited Na tions). 1995a. Pro duc tion year book1994. Rome: FAO.
———. 1995b. World ani mal re view, 84/85. Rome: FAO.
———. 1997. FAO sta tis tics da ta base. http:faostat.fao.org/de fault.htm. Ac cessed Sep tem ber andDe cem ber 1997.
———. 1998. FAO sta tis tics da ta base. http:faostat.fao.org/de fault. htm. Ac cessed Sum mer 1998.
68

Fitch, J. B., and I. A. So liman. 1983. Live stock andsmall farmer la bor sup ply. In Mi gra tion,mecha ni za tion, and ag ri cul tural la bor mar ketsin Egypt, ed. A. Rich ards and P. L. Mar tin.Boul der, Colo.: West view Press.
Fitz hugh, H. A. 1998. Global agenda for live stockre search. Nai robi, Kenya: In ter na tional Live -stock Re search In sti tute.
Geissler, C. Forth com ing. China: The soya pork di -lemma. Pro ceed ings of the Nu tri tion So ci ety 58.
Gil lis, J. 1999. Cows and clones on a VA pharm;Where ani mals make drugs and gene re searchgoes to the fron tier. Wash ing ton Post, Feb ru -ary 28.
Good land, R. 1997. En vi ron men tal sus tain abil ity in ag ri cul ture: Diet mat ters. Eco logi cal Eco nom -ics 23 (De cem ber): 189–200.
Ham mond, K., and H. Leitch. 1995. To ward bet terman age ment of ani mal ge netic re sources.World Ani mal Re view 84/85 (3–4): 48–53.
Hayami, Y., and V. W. Rut tan. 1985. Ag ri cul turalde vel op ment: An in ter na tional per spec tive.Bal ti more, Md., U.S.A.: The Johns Hop kinsUni ver sity Press.
Hu, F. B., and W. C. Wil lett. 1998. The re la tion shipbe tween con sump tion of ani mal prod ucts (beef, pork, poul try, eggs, fish and dairy prod ucts) and risk of chronic dis eases: A criti cal re view. Un -pub lished re port for the World Bank. Har vardSchool of Pub lic Health, Bos ton, Mass., U.S.A.
Huang, J., and H. Bouis. 1996. Struc tural changesin the de mand for food in Asia. Food, Ag ri cul -ture, and the En vi ron ment Dis cus sion Pa per 11. Wash ing ton, D.C.: In ter na tional Food Pol icyRe search In sti tute.
ILRI (In ter na tional Live stock Re search In sti tute).1998. ILRI 1997: Live stock, peo ple and the en -vi ron ment. Nai robi, Kenya: ILRI.
IMF (In ter na tional Mone tary Fund). 1997. In ter na -tional fi nan cial sta tis tics year book. Wash ing -ton, D.C.: IMF.
Jar vis, L. S. 1996. The po ten tial ef fect of two newbio tech nolo gies on the world dairy in dus try.Boul der, Colo.: West view Press.
Judge, G., W. Grif fiths, R. Hill, H. Lut ke pohl, and T.Lee. 1985. The the ory and prac tice of econo met -rics, 2d ed. New York: John Wiley and Sons.
Kai mo nitz, D. 1995. Live stock and de for es ta tion inCen tral Amer ica. To kyo: United Na tions Uni -ver sity Press.
Ke, B. 1997. Re cent de vel op ment in the live stocksec tor of china and changes in live stock/feedre la tion ship. Un pub lished Food and Ag ri cul -ture Or gani za tion of the United Na tions re port,Ani mal and Health Di vi sion (LPT2), Rome.Mimeo.
Kelly, V., T. Re ar don, A. A. Fall, B. Di agana, and L. McNeilly. 1993. Con sump tion and sup ply im -pacts of ag ri cul tural price poli cies in the pea nutba sin and Sene gal ori en tal. In ter na tional FoodPol icy Re search In sti tute, Wash ing ton, D.C.Un pub lished re port. Mimeo.
Kerr, J. 1998. Per sonal com mu ni ca tion, Sep tem -ber 23.
Latham, M. C. 1997. Hu man nu tri tion in the de vel -op ing world. FAO Food and Nu tri tion Se riesNo. 29. Rome: Food and Ag ri cul ture Or gani za -tion of the United Na tions.
Live stock in De vel op ment. 1998. The in te gra tionof live stock in ter ven tions into a sus tain able ru -ral live li hoods ap proach. In Sus tain able ru rallive li hoods: What con tri bu tion can we make?,ed. D. Car ney. Lon don: De part ment for In ter -na tional De vel op ment.
MacK en zie, D. 1998. This lit tle piggy fell ill... NewSci en tist, Sep tem ber 12, 18–19.
Mo zam bique MOA/MSU/UA Re search Team.1992. The de ter mi nants of house hold in comeand con sump tion in ru ral Nam pula Prov ince:Im pli ca tions for food se cu rity and ag ri cul turalpol icy re form. Work ing Pa per No. 6. Mo zam -bique: Min is try of Ag ri cul ture.
Mwen dera, E. J., and M. A. Mo hamed Saleem.1997. In fil tra tion rates, sur face run off, and soilloss as in flu enced by graz ing pres sure in theEthio pian high lands. Soil Use Man age ment 13:29–35.
69

Mwen dera, E. J., M. A. Mo hamed Saleem, and Z.Woldu. 1997. Vege ta tion re sponse to cat tlegraz ing in the Ethio pian high lands. Ag ri cul -ture, Eco sys tems and En vi ron ment 64: 43–51.
Nar rod, C., R. Reyn nells, and H. Wells. 1994. Po -ten tial op tions for poul try waste utili za tion: Afo cus on the Del marva pen in sula. Wash ing ton,D.C.: United States De part ment of Ag ri cul tureand the En vi romen tal Pro tec tion Agency.
Neu mann, C., and D. M. Har ris. 1999. Con tri bu tion of ani mal source foods in im prov ing diet qual -ity for chil dren in the de vel op ing world. Pa perpre pared for the World Bank, Wash ing ton, D.C.
Ode nyo, A. A., P. O. Osuji, and D. Na gassa. Forth -com ing. Mi cro bio logi cal evalua tion of fod derleaves as ru mi nant feed. Asian- AustralasianJour nal of Ani mal Sci ence.
Olde man, L. R., R. T. A. Hak keling, and W. G.Som broek. 1991. World map of the status of hu -man in duced soil deg ra da tion: An ex plana torynote. Wagen in gen, The Neth er lands: In ter na -tional Soil Ref er ence In for ma tion Cen tre/United Na tions En vi ron ment Pro gramme.
Ole Moi Yoi, O. K. 1995. Ca sein Ki nase II in theil -erio sis. Sci ence 267 (5199): 834–836.
Pi men tel, D. 1997. Live stock pro duc tion: En ergyin puts and the en vi ron ment. In Pro ceed ings, ed. S. L. Scott and X. Zhao. Pro ceed ings of the46th An nual Meet ing of the Ca na dian So ci etyof Ani mal Sci ence, July 24–26. Mont real, Can -ada: CSAS.
Pi men tel, D., J. Houser, E. Pre iss, O. White, H.Fang, L. Mesnick, T. Bar sky, S. Tariche,J. Schreck, and S. Alp ert. 1997. Wa ter re -sources: Ag ri cul ture, the en vi ron ment, and so -ci ety. Bio Sci ence 47 (Feb ru ary): 97–106.
Pin gali, P., Y. Bigot, and H. P. Binswan ger. 1987.Ag ri cul tural mecha ni za tion and the evo lu tionof farm ing sys tems in Sub- Saharan Af rica. Bal -ti more, Md., U.S.A.: The Johns Hop kins Uni -ver sity Press.
Pinstrup- Andersen, P., R. Pandya- Lorch, and M.Rosegrant. 1997. The world food situa tion: Re -cent de vel op ments, emerg ing is sues, and long-
term pros pects. Food Pol icy Re port. Wash ing -ton, D.C.: In ter na tional Food Pol icy Re searchIn sti tute.
ProMed. 1999. ProMed- mail post ings. health net.org/pro grams.promed.html. Ac cessed April.
Quisumbing, A., L. Brown, H. S. Feld stein, L. Had -dad, and C. Peña. 1995. Women: The key to food se cu rity. Food Pol icy State ment 21. Wash ing -ton, D.C.: In ter na tional Food Pol icy Re searchIn sti tute.
Rege, J. E. O. 1997. The con tri bu tion of in dige nouslive stock to the econo mies of Af ri can coun -tries, with par ticu lar ref er ence to east ern andsouth ern Af rica. Pa per pre sented at a Semi naron Live stock De vel op ment Poli cies for East ernand South ern Af rica, July 28–August 1. Mba -bane, Swa zi land.
Rosegrant, M. W., and C. Ringler. 1998. Asian eco -nomic cri sis and the long- term global foodsitua tion. Pa per pre pared for the In ter na tionalAg ri cul tural Trade Re search Con sor tium Sym -po sium on Pol icy Re form, Mar ket Sta bil ity,and Food Se cu rity, June 26–27, Al ex an dria,Vir ginia, U.S.A.
Rosegrant, M. W., M. Agcaoili- Sombilla, and N.Perez. 1995. Global food pro jec tions to 2020:Im pli ca tions for in vest ment. Food, Ag ri cul ture, and the En vi ron ment Dis cus sion Pa per 5.Wash ing ton, D.C.: In ter na tional Food Pol icyRe search In sti tute.
Rosegrant, M. W., N. Leach, and R. V. Ger pa cio.1998. Al ter na tive fu tures for world ce real andmeat con sump tion. In ter na tional Food Pol icyRe search In sti tute, Wash ing ton, D.C. Mimeo.
Rosegrant, M. W., M. Agcaoili- Sombilla, R. V. Ger -pa cio, and C. Ringler. 1997. Global food mar ketsand US ex ports in the twenty- first cen tury. Pa perpre sented at the Il li nois World Food and Sus tain -able Ag ri cul ture Pro gram Con fer ence, “Meet ingthe De mand for Food in the 21st Cen tury: Chal -lenges and Op por tu ni ties for Il li nois Ag ri cul -ture,” May 28, Urbana- Champaign.
Schnei der, F., ed. 1995. Sec tor strat egy for pro -gramme de vel op ment in live stock pro duc tion and
70

dairy ing in In dia. Work ing Pa per. Swiss De vel -op ment Co op era tion, Zol liko fen, Swit zer land.
Schroe der, T. C., A. P. Ber kley, and K. C. Schroe -der. 1995. In come growth and in ter na tionalmeat con sump tion. Jour nal of In ter na tionalFood and Ag ri busi ness Mar ket ing 7(3): 15–30.
Sere, C., and H. Ste in feld. 1996. World live stockpro duc tion sys tems: Cur rent status, is sues andtrends. FAO Ani mal Pro duc tion and Health Pa -per 127. Rome: Food and Ag ri cul ture Or gani -za tion of the United Na tions.
Sharma, M., M. Gar cia, A. Qure shi, and L. Brown.1996. Over com ing mal nu tri tion: Is there anecore gional di men sion? Food, Ag ri cul ture, and the En vi ron ment Dis cus sion Pa per 10. Wash -ing ton, D.C.: In ter na tional Food Pol icy Re -search In sti tute.
Simp son, J. R., X. Cheng, and A. Mi yazaki. 1994.Chi na’s live stock and re lated ag ri cul ture: Pro -jec tions to 2025. Wall in gord, U.K.: CAB In ter -na tional.
Singh, R. P., M. Aso kan, and T. S. Walker. 1982.Size, com po si tion, and other as pects of ru ralin come in the semi- arid trop ics of In dia. Eco -nom ics Pro gram Pro gress Re port 33. AndhraPradesh, In dia: In ter na tional Crops Re searchIn sti tute for the Semi- Arid Trop ics.
Staal, S., and I. Bal ten weck. 1998. Ra tio of in comefrom dairy ac tivi ties to in come from all farmac tivi ties. Un pub lished data from the KenyaMin is try of Ag ri cul ture/Kenya Ag ri cul turalRe search In sti tute/In ter na tional Live stock Re -search In sti tute Col labo ra tive Small holderDairy Re search Pro ject. In ter na tional Live -stock Re search In sti tute, Nai robi.
Staal, S., C. Del gado, and C. Nichol son. 1997.Small holder dairy ing un der trans ac tions costsin East Af rica. World De vel op ment 25 (May):779–794.
Ste in feld, H. 1998. Live stock pro duc tion in theAsia and Pa cific re gion: Cur rent status, is suesand trends. World Ani mal Re view 90(1): 14–21.
Ste in feld, H., C. de Haan, and H. Black burn. 1997.Livestock- environment in ter ac tions: Is sues and
op tions. Re port of a study co or di nated by theFood and Ag ri cul ture Or gani za tion of the UnitedNa tions, the United States Agency for In ter na -tional De vel op ment, and the World Bank. Brus -sels: Euro pean Com mis sion Directorate- Generalfor De vel op ment.
Teklu, T., J. von Braun, and E. Zaki. 1991. Droughtand fam ine re la tion ships in Su dan: Pol icy im -pli ca tions . Re search Re port 88. Wash ing ton,D.C.: In ter na tional Food Pol icy Re search In sti -tute.
Tucker, C. J., H. E. Dregne, and W. W. New comb.1991. Ex pan sion and con trac tion of the Sa harades ert from 1980–1990. Sci ence 253: 299.
UNDP (United Na tions De vel op ment Pro gramme). 1998. Hu man de vel op ment re port 1998. NewYork: UNDP.
USDA (United States De part ment of Ag ri cul ture).1997a. Ag ri cul tural sta tis tics. Wash ing ton, D.C.:United States Gov ern ment Print ing Of fice.
———, Eco nomic Re search Serv ice. 1997b. World ag ri cul ture: Trends and in di ca tors: World andre gional data. http://mann77. mann lib.cor -nell.edu/data- sets/in ter na tional/89024/14/World.wk1. Ac cessed De cem ber 1.
USEPA (United States En vi ron men tal Pro tec tionAgency). 1995. Global im pact do main—Meth -ane emis sions. Con sult ant re port for the live -stock and the en vi ron ment study. USEPA,Wash ing ton, D.C.
Val di via, D., E. Dunn, and J. Sher bourne. 1996. Gen -der, live stock and house hold peas ant pro duc tion:Dairy and di ver si fi ca tion in crop- livestock sys -tems of an An dean Com mu nity. In sti tuto Bo livi -ano de Tec nolo gia Agro pecuaria (IBTA) Tech ni -cal Re port 33. http://www.ssu.mis souri.edu/ssu/srcrsp/pa pers/TR33. Ac cessed Sep tem ber 23.
von Braun, J., and R. Pandya- Lorch. 1991. In comesources of mal nour ished peo ple in ru ral ar eas:A syn the sis of case stud ies and im pli ca tions forpol icy. In In come sources of mal nour ished peo -ple in ru ral ar eas: Mi cro level in for ma tion andpol icy im pli ca tions, ed. J. von Braun and R.Pandya- Lorch. Work ing Pa pers on Com mer -ciali za tion of Ag ri cul ture and Nu tri tion, No. 5.
71

Wash ing ton, D.C.: In ter na tional Food Pol icyRe search In sti tute.
Vosti, S. A., J. Wit cover, and C. Car pen tier. 1998.Con venio de coop era cion tec nica re gional nore em bolsable No. ATN/SF- 4827- RG- Programa 1994 de tec nolo gia agro pecuaria re gional enAmer ica Latina y El Car ibe. Fi nal re port to theInter- American De vel op ment Bank (IDB)/ International Food Pol icy Re search In sti tute(IFPRI) Pro ject No. 2475- 000. In ter na tional FoodPol icy Re search In sti tute., Wash ing ton, D.C.
Wal lace, R. J., and A. Lahlou- Kasi. 1995. Ru menecol ogy re search plan ning. Pa per pre sented at a work shop held at the In ter na tional Live stockRe search In sti tute, Ad dis Ababa, Ethio pia.March 13–18.
Wash ing ton Post. 1999. Ma lay sia says deadly vi rusout break over, April 10.
Webb, P., and J. von Braun. 1994. Fam ine and foodse cu rity in Ethio pia: Les sons for Af rica. NewYork: John Wiley.
Westlund, L. 1995. Ap par ent his tori cal con sump -tion and fu ture de mand for fish and fish eryprod ucts—ex plora tory cal cu la tions. Pa perpre sented at the In ter na tional Con fer ence onSus tain able Con tri bu tion of Fish er ies to FoodSe cu rity, De cem ber 4–9, Kyoto, Ja pan.
Wil liams, M. 1996. The tran si tion in the con tri bu -tion of liv ing aquatic re sources to food se cu rity. Food, Ag ri cul ture, and the En vi ron ment Dis -cus sion Pa per No. 13. Wash ing ton, D.C.: In ter -na tional Food Pol icy Re search In sti tute.
World Bank. 1993. Price pros pects for ma jor primary com modi ties, 1990–2005, vol ume 2.Wash ing ton, D.C.: World Bank.
———. 1997. Com mod ity mar kets and the de vel op -ing coun tries, No. 4. Wash ing ton, D.C.: WorldBank.
WHO (World Health Or gani za tion). 1997. Worldhealth sta tis tics quar terly 50 (Nos. 1–2).
72
Chris to pher Del gado and Mark Rosegrant are sen ior re search fel lows and Claude Cour bois is a re searchana lyst at the In ter na tional Food Pol icy Re search Institute. Hen ning Ste in feld is sen ior of fi cer for live stockde vel op ment plan ning at the Food and Ag ri cul ture Or gani za tion of the United Na tions. Simeon Ehui isco or di na tor of the Live stock Pol icy Analy sis Pro ject at the In ter na tional Live stock Re search In sti tute.

Re cent Food, Ag ri cul ture, and the En vi ron ment Dis cus sion Pa pers
27. Soil Deg ra da tion: A Threat to Developing- Country Food Se cu rity by 2020?, bySara J. Scherr, 1999
26. Fostering Global Well- Being: A New Paradigm to Re vi tal ize Agricultural andRu ral Development, by David D. Bathrick, 1998
25. Pest Man age ment and Food Pro duc tion: Look ing to the Future, by Mon ta gueYudel man, Annu Ratta, and David Nygaard, 1998
24. Food from Peace: Break ing the Links between Con flict and Hun ger, by EllenMesser, Marc J. Cohen, and Jashinta D’Costa, 1998
23. Seguri dad Ali men taria y Estrate gias Socia les: Su Con tribu ción a la Seguri dadNutri cional en Areas Urbanas de Amé rica Latina, by María Inés Sánchez- Griñán,1998
22. The Non farm Sec tor and Rural Devel op ment: Review of Issues and Evi dence, byNurul Islam, 1997
21. Chal lenges to the 2020 Vision for Latin Amer ica: Food and Agri cul ture since 1970, by James L. Gar rett, 1997
20. Water Resources in the Twenty- First Cenu try: Chal lenges and Impli ca tions forAction, by Mark W. Rosegrant, 1997
19. Chi na’s Food Econ omy to the Twenty- First Cen tury: Sup ply, Demand, and Trade,by Jikun Huang, Scott Rozelle, and Mark Rosegrant, 1997
18. Rus sia’s Food Econ omy in Tran si tion: Cur rent Pol icy Issues and the Long- TermOut look, by Joachim von Braun, Euge nia Serova, Harm tho Seeth, and OlgaMelyukh ina, 1996
17. The Role of Fer til iz ers in Sus tain ing Food Secu rity and Pro tect ing the Envi ron -ment, by Balu L. Bumb and Car los A. Baan ante, 1996
16. Man ag ing Inter ac tions between House hold Food Secu rity and Pre schooler Health,by Law rence Had dad, Saroj Bhat ta rai, Maar ten Immink, and Shubh Kumar, 1996
15. Poten tial Impact of AIDS on Popu la tion and Eco nomic Growth Rates, by Lynn R.Brown, 1996
14. Land Deg ra da tion in the Devel op ing World: Impli ca tions for Food, Agri cul ture,and the Envi ron ment to the Year 2020, by Sara J. Scherr and Satya Yadav, 1996
13. The Tran si tion in the Con tri bu tion of Liv ing Aquatic Resources to Food Secu rity,by Meryl Wil liams, 1996
12. Mid dle East Water Con flicts and Direc tions for Con flict Reso lu tion, by Aaron T.Wolf, 1996
11. Struc tural Changes in the Demand for Food in Asia, by Jikun Huang and How arthBouis, 1996
10. Over com ing Mal nu tri tion: Is There an Ecore gional Dimen sion? by Mano harSharma, Marito Gar cia, Aamir Qure shi, and Lynn Brown, 1996
9. Agri cul ture, Tech no logi cal Change, and the Envi ron ment in Latin Amer ica: A 2020 Per spec tive, by Edu ardo J. Trigo, 1995
8. Major Natu ral Resource Man age ment Con cerns in South Asia, by Ger ard J. Gill,1995
Note: For titles of ear lier papers within this series, please con tact IFPRI.

IN TER NA TIONAL FOOD POL ICY RE SEARCH INSTITUTE2033 K Street, N.W. • Wash ing ton, D.C. 20006- 1002 • U.S.A. • 1- 202/862- 5600Fax: 1- 202/467- 4439 • E- Mail: [email protected] • Web: www.ifpri.org
FOOD AND AGRICULTURE ORGANIZATION OF THE UNITED NA TIONSViale delle Terme di Caracalla, 00100 Rome, It alyTel: 39- 06/57051 • Fax: 39- 06/57053152 • Telex: 625852/625853/610181 FAO ITele grams: FOODAGRI ROME • Web: www.fao.org
INTERNATIONAL LIVESTOCK RESEARCH INSTITUTEP.O. Box 30709, Nairobi, KenyaTel.: 254-2/630743 • Telex: 22040 • Cable: ILRI • Fax: 254-2/631499E- Mail: [email protected] • Web: www.cgiar.org/ilri