little feast, shepherd’s bush market - home - wmc...
TRANSCRIPT

Annual Report& Financial Statements
For the year ended 31st December 2016
Wellington Market
Chester Northgate New Watford Market, food court
Little Feast, Shepherd’s Bush Market
Cornucopia, Cornwall1940s Day, Wellington Market


Annual Report& Financial Statements
For the year ended 31st December 2016
Registered Office21 Market Street, Wellington,Telford, Shropshire, TF1 1DT
Company Registration Number
00636475

4
To survive in the UK’s ever-changing retail sector, traditional markets are having to evolve. A catalyst for this process of evolution is WMC Retail Partners Plc, a company that is steeped in operational experience gained from the best part of eight-hundred years at the sharp end of the business.
Drawing on this rich seam of knowledge, that can be traced back to the thirteenth century, the company has not only reinvented the way in which its own portfolio of markets operates, but it has also totally transformed itself into the sector’s go-to consultancy for developers and landlords wishing to rejuvenate their retail assets and help re-engage with the demands of contemporary consumers.
Whilst retaining a portfolio of traditional, all-year-round markets, the company is developing innovative concepts for its own sites and those of its consultancy clients, bringing together exciting retail propositions combined with leisure and events activities that drive footfall from a much broader appeal to today’s more discerning shoppers.
With this strong foundation, the company is perfectly placed for delivering a new era of appealing and sustainable retail propositions that are relevant to the communities they serve.
Further information on WMC Retail Partners Plc can be found on the company’s website: www.wmc-retail.com
Welcome
Consultancy Projects and Clients - for further details and case studies, visit www.wmc-retail.com:
Chester Northgate
Cheshire West and Chester Council are moving Chester Market into the new Northgate Development. WMC were engaged to:
• Implement an applications process for tenants to move to the new market
• Produce a Lettings Strategy, target trader list, and brochure for potential new tenants
• Produce a trader consultation plan• Audit of the stalls in the current
market, as well as a review of the current operations, marketing and financial situation
Eagle Market, Derby
WMC have, together with intu, produced a phased three year plan for traders consolidation, footfall and visibility enhancement, daily onsite management, the creation of a food court and events space and the commercialisation of part of the site for options including leisure offer, commercial events etc.Maldon Waterfront Project
The Brunel Centre, Swindon
5
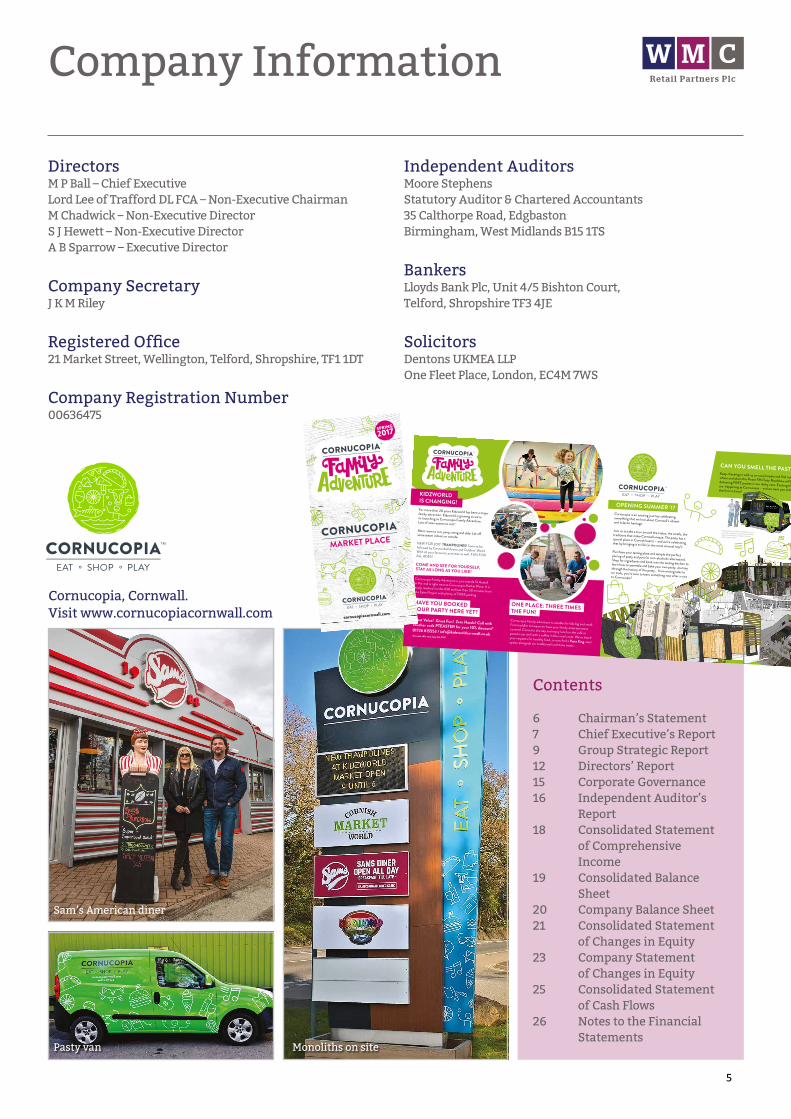
Company Information
DirectorsM P Ball – Chief ExecutiveLord Lee of Trafford DL FCA – Non-Executive ChairmanM Chadwick – Non-Executive DirectorS J Hewett – Non-Executive DirectorA B Sparrow – Executive Director
Company SecretaryJ K M Riley
Registered Office21 Market Street, Wellington, Telford, Shropshire, TF1 1DT
Company Registration Number00636475
Independent AuditorsMoore StephensStatutory Auditor & Chartered Accountants35 Calthorpe Road, EdgbastonBirmingham, West Midlands B15 1TS
BankersLloyds Bank Plc, Unit 4/5 Bishton Court,Telford, Shropshire TF3 4JE
SolicitorsDentons UKMEA LLPOne Fleet Place, London, EC4M 7WS
Contents
6 Chairman’s Statement7 Chief Executive’s Report9 Group Strategic Report12 Directors’ Report15 Corporate Governance16 Independent Auditor’s
Report18 Consolidated Statement
of Comprehensive Income
19 Consolidated Balance Sheet
20 Company Balance Sheet21 Consolidated Statement
of Changes in Equity23 Company Statement
of Changes in Equity25 Consolidated Statement
of Cash Flows26 Notes to the Financial
Statements
Cornucopia, Cornwall.Visit www.cornucopiacornwall.com
Sam’s American diner
Pasty van Monoliths on site
OPENING SUMMER ‘17 Cornucopia is an exciting journey celebrating everything that we love about Cornwall’s vibrant and eclectic heritage.
Join us to take a tour around the tastes, the smells, the traditions that make Cornwall unique. The pasty has a special place in Cornish hearts – and we’re celebrating that by bringing it to life (in the most unusual way!). Purchase your tasting plate and sample the perfect pairing of pasty and pint (or non-alcoholic alternative). Shop for ingredients and book into the tasting kitchen to learn how to assemble and bake your own pasty. Journey through the history of the pasty... from mining tales to tin trails, you’re sure to learn something new after a visit to Cornucopia!
CAN YOU SMELL THE PASTY?Keep checking in with us on social media and find out where and when the Pirate FM Pasty Roadshow will be delivering FREE pasties in our dinky vans. Exciting things are happening at Cornucopia – and we want you to be the first to know!KIDZWORLD
IS CHANGING!For more than 20 years Kidzworld has been a major family attraction. Kidzworld is growing so we’re re-launching as Cornucopia Family Adventure. Lots of new reasons to visit!
More room to run, jump, swing and slide. Let off some steam indoors or outside.
NEW FOR 2017: TRAMPOLINES! Soon to be followed by Cannonball Arena and Toddlers’ World. With all your favourite activities as well. FUN FOR ALL AGES! COME AND SEE FOR YOURSELF, STAY AS LONG AS YOU LIKE!Cornucopia Family Adventure is just outside St Austellin Par and is right next to Cornucopia Market Place. It is easily reached via the A30 and less than 30 minutes from the Eden Project with plenty of FREE parking.
HAVE YOU BOOKED YOUR PARTY HERE YET?Great Value! Great Fun! Zero Hassle! Call with voucher code PTEASTER for your 10% discount*01726 815553 / [email protected]*discount offer ends July 31st 2017
ONE PLACE: THREE TIMES THE FUN!Cornucopia Family adventure is suitable for kids big and small.From toddler to tween we have your family entertainmentcovered. Come for the day and enjoy lunch in the café orparents can chill with a coffee in the crow’s nest. We’ve heardyour requests for healthy food, so now find a Pasta King mealoption alongside our traditional lunchtime treats.
* Illustrations are artistic impression’s only and may change as our projects develop, keep a look out for updates on social media across 2017.
Cornucopia 8 pager V12a 230317.indd 2
24/03/2017 12:35
Designed & print managed by leap.uk.net
Printed on ecycled paper using vegetable
based inks. All information correct at time
of print. Please pass this leaflet on or recycle
once done with.
CCO57 03 2017 #CORNUCOPIACORNWALL
Serving Early Pancake Breakfasts with free pour
Coffee to Classic American Dishes with a Cornish
twist. Local Shellfish, Steaks, Ribs, Dogs, Wings,
Burgers and Shakes. Introducing our new healthy,
Skinny Kitsch Menu. Or simply come grab a
Cocktail or a Craft beer with a Movie and enjoy the
vibe inside or out. samscornwalldiner.co.uk
IF BUDDY HOLLY AND DEMELZA POLDARK
HAD INCREDIBLE TIME TRAVELLING
TWINS – THEY WOULD EAT HERE!
BUSINESS AS USUAL!
CORNUCOPIA MARKET PLACE IS OPEN
EVERY WEDNESDAY, SATURDAY AND
SUNDAY 9AM TO 5PM
Now trading as Cornucopia Market Place, with an exciting
range of stalls, we’re the South West’s largest covered
indoor market.
More than 60 traders under one roof, whatever your
household need – we’ve got it covered.
Soon, some of our traders will be opening seven
days per week to match Cornucopia, which will also
be open every day.
The whole market place is wheelchair friendly and there are
plenty of places to revive yourself during a busy day out!
At Cornucopia Market Place, everything you need is
under one roof.
LOVE LOCAL, LOVE CORNUCOPIA
MARKET PLACEcornishmarket-
TEL: 01726 816200
HOW TO FIND US
CORNUCOPIA FAMILY
ADVENTURE IS OPEN!
Pay us a visit or follow the story on Facebook
(See website for opening days & hours)
Sign up to our mailing list at
www.cornucopiacornwall.com
for your chance to win VIP tickets,
tasting tickets, vouchers and goodie bags.
Want to be one of our Family Ambassadors?
Tell us why on Facebook @cornucopiacornwall
RETAIL ENQUIRIESCornucopia has limited space and priority is being given to
local, independent producers and Cornish lifestyle companies.
Talk to us about bringing your business to Cornucopia
Cornwall. Call Sam Healy on 07979 243 257 or email
CONTACTCornucopia of Cornwall Ltd, St Austell Bay Retail & Leisure Park,
Par Moor Road, St Austell – Sat Nav PL24 3RP
Call : 01726 812544
Email : [email protected]
Press enquiries call Tim Ward on 01743 344197
Follow us on Facebook, Twitter
& Instagram for offers & updates cornucopiacornwall.com
Cornucopia 8 pager V12a 230317.indd 1
24/03/2017 12:35

6
Chairman’s StatementFor The Year Ended 31st December 2016
2016 has been a very significant year for our company. Turning firstly to the financial results themselves you will see that Total Comprehensive Income for the Year was £331,000, substantially greater than the £12,000 reported for the previous year. However, this was primarily due to an upward revaluation of our Luton market – without this we would have reported a small negative trading result.
While our core markets performed to expectations, with continuing high-percentage occupancy, and our investment properties delivered their usual steady rent-roll, the combination of group overheads and interest charges eliminated the positives, despite an increased contribution from our growing consultancy services. With regard to the latter, all credit to executive director Andrew Sparrow and his small team for generating £100,000-plus of income, now working in conjunction with major property companies like U&I and Intu, plus a range of local authorities: Cheshire West and Chester Council currently feature and our team’s project work has extended to Derby, Northwich, Maldon, Manchester and Winsford.
However, it is the major development at our Cornish site which has been the focus of group efforts this year. Shareholders will be aware that for some time we have been working up ideas to more fully utilise our large site at Cornish Market World. Planning permissions and negotiations with our landlord etc., have inevitably taken time. In a circular to shareholders dated October 4th 2016 we set out our plans together with the details of a major funding package totalling £1.96 million - £1.8 million earmarked for Cornwall. In essence, this came from an additional bank loan, a loan from our landlord, plus loan stock subscriptions from companies associated with our two non-executive directors, Michael Chadwick and Sarah Hewett. Shareholders’ approval was given, where necessary, at the General Meeting held on October 21st 2016.
Consequent on the above, I am very pleased to report major progress with this comprehensive development and pay particular tribute to our chief executive Malcolm Ball who is driving it and whose vision it essentially is, to our landlord for his understanding and financial support, coupled with a renegotiated lease, to the local authority, and also to our staff and traders on site who have had to endure major inconvenience and disruption during construction. We are on course to open the transformed site under its new name ‘Cornucopia’ in July, with our visitors – both tourists and locals – hopefully able to “Eat, Shop and Play” on site. Our traditional market is being reconfigured, and the adventure play attraction Kidzworld is being substantially upgraded with exciting new attractions. In addition, a wide range of local Cornish produce will be available with an interactive Cornish Pasty Heritage Centre and tasting experience at its heart, and new retail tenants should be operational. Already a new tenant and its American-influenced diner is open and trading well. All this represents a major commitment in every sense, and its success will clearly have a major bearing on the future of our company.
It is our intention to hold next year’s AGM at Cornucopia, to enable shareholders to see it for themselves. Once again my grateful thanks to all our employees and professional advisors – particularly to our new company secretary Ken Riley who has settled in very well and has made a significant contribution to our deliberations.
Lord Lee of Trafford DL FCAChairmanWMC Retail Partners PlcDate: May 19th 2017

7
Chief Executive’s ReportFor The Year Ended 31 December 2016
INTRODUCTION
2016 has been an interesting year in more ways than one; yes, a disappointing set of figures when viewing our like-for-like trading performance in isolation (as alluded to by our Chairman), yet, behind the scenes, considerable progress has been made. It is our belief that dependence on market rental income alone is not a sustainable business model. As a result, we have pursued a strategy of diversification over the last few years which has included the continued expansion of our work in management and consultancy services. As a result of the successful implementation of our diversification strategy, this company is no longer solely reliant on market trader rental income. Nonetheless, our traditional markets perform in line with budget expectations and Kidzworld, our small visitor attraction in Cornwall, continues to make year-on-year progress and, whilst our traditional markets perform in line with budget expectations, a dependency on market rental income alone is not a sustainable business model. It was also for this reason that your company embarked on a process of change, starting with a new name and eventually looking to relocate its head office to London. We have continued to focus on securing new revenue streams in the process – many of which are outlined below. With us having successfully renegotiated the lease and a loan from the landlord at our Cornish site, coupled with some significant support from our bank and shareholders, our long-awaited plans for the transformation of the site have finally started. Called Cornucopia, the new development is expected to generate several new income streams over the coming years and is cause for much optimism. Consequently, given its strategic importance to our overall business, I propose to focus much of this report on Cornwall and detail how its potential for success could eventually lead to establishing similar Cornucopia-styled attractions in other locations. Having established such strong relationships with several prominent landlords and developers – all of whom are closely following our progress in the South West – allows me to be so bold. CORNUCOPIA … EAT, SHOP AND PLAY (see enclosed marketing literature) This new visitor destination in the heart of Cornwall – which in a full-year’s trading will be looking to attract significant visitor numbers – is programmed to have several build phases. Development of the site has been made particularly challenging because of the need to keep both the market and Kidzworld open for business throughout. Work started in July 2016 and the subsequent approval of the first of our many planning applications enabled our first new retailer (Sam’s of Fowey Ltd) to open for business in time for Christmas. Sam’s is a restaurant operator with a strong brand and more than 30 years’ experience operating in the county. Over the next 12 months, it is planned that some further 15-20 retailers will be operating on a seven-days-per-week basis. As I previously mentioned, we have identified the need to create income streams other than market rental which, for now, in Cornwall at least, only sees the market traders operating three days per week. Under this new business model, traders can and will operate seven days a week, supported by these new leisure and retail offerings – as described below. So what is Cornucopia and what are these other income streams? In essence, Cornucopia – the overall site – will embrace a new-look market, a rebranded Kidzworld (to be known as Cornucopia Family Adventure), a raft of new seven-day retailers and a unique visitor attraction cum food hall. Much of which will be open in the summer of 2017. Very much based on my experience gained from running Vinopolis in London, shoppers and visitors can sample food and beverages (for a small charge), participate in the UK’s first interactive pasty heritage centre or simply shop for Cornish produce.
At night, the 13,000-square-foot space will transform into a 600 to 1,000-capacity evening entertainment venue. A rigid marquee structure owned by WMC Retail Partners (originally purchased to assist with the phasing of the build project) will also be utilised to establish themed food and drink festivals in our adjacent and well-manicured East Field, with the objective of attracting tens of thousands of visitors on any given day. With over 950 free car parking spaces, we are naturally excited by this prospect.

8
Chief Executive’s Report(continued)
CORE MARKETS, NEW BUSNESS, APPRENTICESHIPS, INVESTMENT PROPERTIES AND FINANCE Under the tutelage of Andrew Sparrow, we enjoy occupancy levels in most of our core markets that are better than the industry norm and, like with Cornwall, Andrew and his team are exploring other income streams besides market rental. With the growing popularity of street food, Watford market has staged a few similarly-themed evenings and the possibility of creating another Kidzworld isn’t out of the question. However, our portfolio of consultancy and management services work has to be one of best departures from us being merely an operator of markets. We have enclosed examples of these commissions, which have propelled this company into the higher echelons of the developer fraternity and, why today, this company can obtain new business from both developers and local councils for its expertise. By contrast, our venture into the apprenticeship arena has been less spectacular, dogged by government changes mid-stream, which has severely hampered our enrolment programme for this year. This has seen only a paltry bottom-line contribution for 2016, with the balance of enrolments now falling into 2017. However, given these mid-stream changes whereby employers will be deducted a training levy at source, bringing new relevance of the old adage of ‘use it or lose it’, this provides us with optimism that this business sector will show growth in future years. As for our investment properties, performance has been very much in line with budget. This leaves our relationship with our bank to report upon. It goes without saying that they remain very supportive, particularly given their funding support for our redevelopment in Cornwall. In conclusion, another tough year and, yes, these foundations as alluded to in last year’s report have taken their time to bed-in. That said, Cornish Market World was our biggest concern and, had we not been able to renegotiate terms with our landlord, the haemorrhaging of cash would have continued. We have a chance to reverse that situation and as a result of changes we have made, we are not solely reliant on market trader income.
I would like to thank my fellow colleagues for their unwavering support and loyalty throughout and the faith that both the bank and my non-executive directors have in me to successfully implement our plans. Most of all, I would like to thank our shareholders for their continuing support. I do hope that you as shareholders, all of whom have been incredibly patient in recent years, will continue to support us and that you will join us in Cornwall in 2018 for the company’s AGM as suggested by our Chairman in his address to you all.
Malcolm BallChief Executive WMC Retail Partners PlcDate: 19th May 2017

9
Group Strategic ReportFor The Year Ended 31 December 2016
PRINCIPAL ACTIVITIES
The principal activity of the Group and the Company during the year was the provision of market and retail operations.
BUSINESS REVIEW
The Group’s turnover and operating profit were £4.2m (2015 - £4.3m) and £0.1m (2015 - £0.2m) respectively. The Group has net assets of £3.9m (2015 - £3.6m) at 31 December 2016.
This report should be read in conjunction with the Chairman’s Statement and the Chief Executive’s Report, which provide details of the Group’s trading during the year and an assessment of the Group’s future prospects. These statements are considered by the directors to be part of the Strategic Report.
KEY PERFORMANCE INDICATORS
The directors have established a number of key performance indicators, which are used to measure and monitor the performance of the company in a number of different areas.
Source data is taken from the audited financial statements.
Key performance indicator Note 2016 2015 Return on capital employed (ROCE) 1 2.0% 4.4%Basic adjusted earnings per share 2 (1.67)p 0.45pDividends per share 3 Nil Nil
NOTES TO KPIS
1. Return on capital employed = Operating profit as a percentage of equity shareholders’ funds.2. Adjusted earnings per share = Profit after tax and before impairment of tangible and intangible fixed assets
for the financial year divided by the weighted average number of shares (note 13).3. Dividends per share = dividends paid during the year divided by the weighted average number of shares.
DISCUSSION OF KPIS
Return On Capital Employed (ROCE)The reduction in the return on capital employed reflects those factors highlighted in the chairman’s and Chief Executive’s reports. However overall including the FRS 102 changes there has been a small increase in shareholders equity to £3,911k.
Basic Adjusted Earnings Per ShareThe basic adjusted earnings per share has gone down compared to 2015. This is due to some of the elements highlighted in the Chairman’s and Chief Executive’s Reports.
DividendIn light of the business performance over the year, the Board has regrettably decided to pay £Nil dividends for 2016 (2015 - £Nil).
Preference dividends are paid in equal instalments on 30 June and 31 December. Preference dividends of £23,000 (2015 - £23,000) are disclosed as interest payable (see note 11) rather than dividends following the preference shares being treated as debt.

10
Group Strategic Report(continued)
PRINCIPAL RISKS AND UNCERTAINTIES
This annual report contains certain forward looking statements. These statements are made by the directors in good faith, based on the information available to them up to the time of approval of this report. Actual results may differ to those expressed in such statements depending on a variety of factors. The principal risks and uncertainties facing the business are management and controls around cash and the risk of not meeting loan covenant conditions resulting in the risk of insufficient finance facilities.
Management And Controls Around CashA risk inherent in this industry occurs in cash management and the controls around cash. To mitigate these risks the Group performs internal audit reviews of individual sites. In addition, senior management regularly visit sites and review financial performance against monthly budgets.
Loan Covenant ConditionsAnother principal risk to the Group is the risk of not meeting the loan covenants, to ensure the Group continues to have access to its funding. To mitigate this risk the Group monitors compliance with the covenants on a quarterly basis, including reviewing compliance with the covenants on a forecast basis to highlight any expected instances of non-compliance. The Group has not met its loan covenants in the current or previous financial year, specifically in relation to the repayment cover covenant. The bank has expressed its willingness to continue to support the Group for the foreseeable future and therefore the Diretors consider it reasonable to continue to recognise the bank loan in the same way as in previous years.
Other Risks And UncertaintiesActual results may differ from those expressed in such forward looking statements depending on a variety of factors. These factors include the weather conditions, levels of demand in the market, restrictions to market industry access, competitive pressures on pricing, additional costs to retain or recruit key personnel and overall economic conditions.
Weather ConditionsThe Group operates indoor and outdoor markets. The number of people visiting markets can be materially affected by the weather on a particular day. Furthermore, adverse weather conditions may cause damage to the markets. The Group has a responsive management team to react to any such situations that arise, together with appropriate insurance cover.
Levels Of Demand In The MarketThe Group is seeking to diversify its activities to replace any lost revenue seen in the market industry. This diversification includes events which can be held at market locations and, increasingly, the provision of consultancy and managing agent services for properties and shopping centres. Restrictions To Market Industry AccessThe Group concentrates on indoor freehold and leasehold market sites, which restricts others from entering the industry in these areas. The Group also focuses on upper end indoor markets, which are more stable.
Competitive Pressures On PricingThe Group will seek to increase market rental prices and negotiate favourable contracts with local councils, where possible. The Group also seeks to reduce its cost base to ensure the best possible return.
Overall Economic ConditionsWhilst the economy has seen growth during 2016, shopping patterns continue to change and the Group continues to try to provide consumers with a shopping experience fit for the 21st Century. The out of town shopping centres and growth of online retailing continue to offer challenges and we work to drive footfall to our markets to support the businesses of our customers.

11
Group Strategic Report(continued)
GOING CONCERN
In common with the majority of other companies, the current economic conditions create uncertainty.
The directors have carefully considered the appropriateness of preparing financial statements on a going concern basis. Details of the directors review and conclusion are detailed under the heading ‘Going Concern’ in the principal accounting policies.
FINANCIAL INSTRUMENTS
Financial risk management policies and objectivesThe Group’s principal financial instruments are amounts receivable from customers, cash, bank overdrafts, bank loans and amounts due to suppliers.
The Group’s policy for the financing of its business is principally by the use of a mixture of share capital, retained earnings and bank borrowings.
Credit RiskThe Group relies on maintaining a high quality customer base and places emphasis on good credit management. This is managed by strict control over debtors and application of credit limits.
Interest Rate RiskThe Group’s exposure to market risk for changes in interest rates relates primarily to the Group’s debt obligations. The Group’s exposure to interest rate fluctuations on its bank borrowings is managed by floating security charges.
Liquidity RiskThe Group carefully manages cash flows to ensure the Group continues to operate within its available resources.
The Group’s assets are principally financed by secured floating rate bank loans and overdrafts. The Group’s bank loans are subject to loan covenant conditions. Environmental RiskThe Group’s policy is to ensure that it fully understands and manages the actual and potential environmental impact of its activities. The Group’s operations are conducted in such a manner that it complies with the legal requirements relating to the environment in all areas of the business.
EMPLOYEES
The Group pursues policies designed to encourage employees to identify with the Group and use their knowledge and skills actively towards its success. Managers are encouraged to make employees aware of the financial and economic factors affecting the Group’s performance.
Full consideration is given to employment applications from disabled persons who have the necessary aptitudes and abilities. Where an employee becomes disabled while employed, arrangements are made wherever practicable to maintain employment. The Group seeks to develop the skills of disabled persons by providing appropriate training, taking into account their particular needs.
This report was approved by the board on 19th May 2017 and signed on its behalf by:
Malcolm BallDirectorDate: 19th May 2017

12
Directors’ ReportFor The Year Ended 31 December 2016
The directors present their report and the financial statements for the year ended 31 December 2016.
DIRECTORS’ RESPONSIBILITIES STATEMENT
The directors are responsible for preparing the Group Strategic Report, the Directors’ Report and the financial statements in accordance with applicable law and regulations.
Company law requires the directors to prepare financial statements for each financial year. Under that law the directors have elected to prepare the financial statements in accordance with applicable law and United Kingdom Accounting Standards (United Kingdom Generally Accepted Accounting Practice), including Financial Reporting Standard 102 ‘The Financial Reporting Standard applicable in the UK and Republic of Ireland’. Under Company law the directors must not approve the financial statements unless satisfied that they give a true and fair view of the state of affairs of the Company and the Group and of the profit or loss of the Group for that period. In preparing these financial statements, the directors are required to:
• select suitable accounting policies and then apply them consistently;
• make judgements and accounting estimates that are reasonable and prudent; and
• prepare the financial statements on the going concern basis unless it is inappropriate to presume that the Group will continue in business.
The directors are responsible for keeping adequate accounting records that are sufficient to show and explain the Company’s transactions and disclose with reasonable accuracy at any time the financial position of the Company and the Group and enable them to ensure that the financial statements comply with the Companies Act 2006. They are also responsible for safeguarding the assets of the Company and the Group and hence for taking reasonable steps for the prevention and detection of fraud and other irregularities.
RESULTS AND DIVIDENDS
The loss of £51,000 (2015 – profit of £12,000) has been transferred to reserves.
In 2016 no interim ordinary share dividend was paid (2015 - £nil). No final dividend for 2016 will be paid (2015 - £nil).
Preference dividends of £23,000 (2015 - £23,000) were paid during the year.
DIRECTORS
The directors who served during the year were:
M P Ball M Chadwick S J Hewett Lord Lee of Trafford DL FCAA B Sparrow

13
Directors’ Report(continued)
DIRECTORS’ INTERESTS
Those directors serving at the end of the year had beneficial interests in the share capital of the company at 31 December 2016 as follows:
Ordinary Shares of 5p each
2016 2015
No. No.
Beneficial
Lord Lee Of Trafford 139,000 139,000M P Ball 5,000 5,000S Hewett 52,280 52,280M Chadwick 349,500 349,500A B Sparrow - -
Non-BeneficialM Chadwick 1,074,270 1,074,270Lord Lee Of Trafford 18,000 18,000
Shareholders with shareholdings greater than 3% (excluding those already noted)
Ordinary Shares of 5p each
2016 2015
No. No.
Simons & Co. 736,190 736,190Mrs J Simon 388,367 388,367Mislex Limited 196,010 196,010
DIRECTORS’ SHARE OPTIONS
The Group operates both an approved and unapproved share option scheme. Further information is set out in note 28 of these financial statements and details of the directors’ share options are set out below:
Unapproved Scheme
1January
2016
Grantedduring
year
Expiredduring
year
Exercisedduring
year
31December
2016
Exerciseprice
(p)
Earliestdate forexercise
Latestdate forexercise
M P Ball 25,000 - - - 25,000 50.0p 21 June 2014 20 June 2021M P Ball 2,000 - - - 2,000 50.0p 1 January 2015 31 December 2021M P Ball 50,000 - - - 50,000 50.0p 1 January 2016 31 December 2022

14
Directors’ Report(continued)
DIRECTORS’ SHARE OPTIONS (CONTINUED)
Approved Scheme1
January2016
Grantedduring
year
Expiredduring
year
Exercisedduring
year
31December
2016
Exerciseprice
(p)
Earliestdate forexercise
Latestdate forexercise
M P Ball 50,000 - - - 50,000 66.0p 1 June 2012 31 May 2019M P Ball 25,000 - - - 25,000 52.0p 21 June 2013 20 June 2020M P Ball 50,000 - - - 50,000 50.0p 1 January 2014 31 December 2020M P Ball 50,000 - - - 50,000 50.0p 1 January 2016 31 December 2022M P Ball 48,000 - - - 48,000 50.0p 1 January 2015 31 December 2021A Sparrow 7,500 - - - 7,500 50.0p 24 April 2015 23 April 2022
None of the other directors who served at the year end held any share options in the Company.
The closing mid-price of the shares on 31 December 2016 was 17.5p, reflecting a bid price of 15.0p and an ask price of 20.0p. The high and low for the year were 22.5p and 17.5p respectively.
HEALTH AND SAFETY RISK
The Group fully understands its requirement to ensure that it follows its health and safety regulations and is advised by a firm of health and safety specialists. There have been no significant health and safety incidents arising during the year.
MATTERS COVERED IN THE STRATEGIC REPORT
Information as required by schedule 7 of the Large and Medium sized Companies and Groups (Accounts and Reports) Regulations 2008 has been included in the Strategic Report.
DISCLOSURE OF INFORMATION TO AUDITORS
Each of the persons who are directors at the time when this Directors’ Report is approved has confirmed that:
• so far as that director is aware, there is no relevant audit information of which the Company and the Group’s auditors are unaware, and
• that director has taken all the steps that ought to have been taken as a director in order to be aware of any relevant audit information and to establish that the Company and the Group’s auditors are aware of that information.
POST BALANCE SHEET EVENTS
There have been no significant events affecting the Group since the year end.
AUDITORS
A resolution to appoint Moore Stephens LLP as auditor will be proposed at the forthcoming Group Annual General Meeting.
This report was approved by the board on 15th May 2017 and signed on its behalf by:
J K M RileyCompany Secretary Date: 19th May 2017

15
Corporate GovernanceFor The Year Ended 31 December 2016
As the Company’s shares are traded on the ISDX market, the Company has not complied with the UK Corporate Governance Code June 2010 nor is it required to. The directors acknowledge the importance and value of good corporate governance procedures and accordingly have selected those principles and provisions of the UK Corporate Governance Code June 2010 that they consider relevant and appropriate to the Company given its size, structure and stage of development. An overview of the Company’s corporate governance procedures is given below.
BOARD COMMITTEES
The board has two sub-committees, the audit and the remuneration committees, whose members are the non-executive directors.
THE AUDIT COMMITTEE
The committee is chaired by Mrs S Hewett. The company secretary acts as secretary and the executive directors may attend. The external auditors are invited to attend the meetings and they have direct access to members of the committee. The audit committee may examine any matters relating to the affairs of the Group and Company including reviews of the annual and interim accounts, announcements, internal control procedures and accounting policies.
THE REMUNERATION COMMITTEE
The committee is chaired by Mr M Chadwick. The committee reviews the performance of the executive directors and considers and approves all board and senior executive appointments, remuneration and benefits, including share options and services contracts. During the year, members of the remuneration committee took no part in decisions over matters concerning them personally. The board reviews the level of fees paid to non-executive directors.
INTERNAL CONTROL
The directors are responsible for the Group’s system of internal control, which is designed to provide reasonable, but not absolute, assurance regarding:
• the safeguarding of assets against unauthorised use or disposition;• the minimisation of risk of material loss whilst in pursuit of the Group’s business objectives; and• the maintenance of proper accounting records and the reliability of financial information within the business or for
publication.
As might be expected in a Group of this size a key control procedure during the year was the day to day supervision by the executive directors and senior management team.

16
Independent Auditor’sReport to the Shareholders of WMC Retail Partners PLC
We have audited the financial statements of WMC Retail Partners Plc for the year ended 31 December 2016 which are set out on pages 18 to 42. The financial reporting framework that has been applied in their preparation is applicable law and United Kingdom Accounting Standards (United Kingdom Generally Accepted Accounting Practice).
This report is made solely to the company’s members, as a body, in accordance with Chapter 3 of Part 16 of the Companies Act 2006. Our audit work has been undertaken so that we might state to the company’s members those matters we are required to state to them in an auditor’s report and for no other purpose. To the fullest extent permitted by law, we do not accept or assume responsibility to anyone other than the company and the company’s members as a body, for our audit work, for this report, or for the opinions we have formed.
RESPECTIVE RESPONSIBILITIES OF DIRECTORS AND AUDITORS
As explained more fully in the Directors’ Responsibilities Statement set out on page 12, the directors are responsible for the preparation of the financial statements and for being satisfied that they give a true and fair view. Our responsibility is to audit and express an opinion on the financial statements in accordance with applicable law and International Standards on Auditing (UK and Ireland). Those standards require us to comply with the Auditing Practices Board’s (APB’s) Ethical Standards for Auditors.
SCOPE OF THE AUDIT OF THE FINANCIAL STATEMENTS
An audit involves obtaining evidence about the amounts and disclosures in the financial statements sufficient to give reasonable assurance that the financial statements are free from material misstatement, whether caused by fraud or error. This includes an assessment of: whether the accounting policies are appropriate to the group’s and the parent company’s circumstances and have been consistently applied and adequately disclosed; the reasonableness of significant accounting estimates made by the directors; and the overall presentation of the financial statements. In addition, we read all the financial and non financial information in the group strategic report and the directors’ report to identify material inconsistencies with the audited financial statements and to identify any information that is apparently materially incorrect based on, or materially inconsistent with, the knowledge acquired by us in the course of performing the audit. If we become aware of any apparent material misstatements or inconsistencies we consider the implications for our report.
OPINION ON FINANCIAL STATEMENTS
In our opinion the financial statements:
• give a true and fair view of the state of the group’s and the parent company’s affairs as at 31 December 2016 and of the group’s profit for the year then ended;
• have been properly prepared in accordance with United Kingdom Generally Accepted Accounting Practice; and
• have been prepared in accordance with the requirements of the Companies Act 2006.
OPINION ON OTHER MATTERS PRESCRIBED BY THE COMPANIES ACT 2006
In our opinion, based on the work undertaken in the course of the audit:
• the information given in the Strategic Report and the Directors’ Report for the financial year for which the group financial statements are prepared is consistent with the group financial statements; and
• the Strategic Report and the Directors’ Report have been prepared in accordance with applicable legal requirements.
17
Independent Auditor’sReport to the Shareholders (continued)
MATTERS ON WHICH WE ARE REQUIRED TO REPORT BY EXCEPTION
In the light of the knowledge and understanding of the parent company and its environment obtained in the course of the audit, we have not identified material misstatements in the strategic report or the directors’ report.
We have nothing to report in respect of the following matters where the Companies Act 2006 requires us to report to you if, in our opinion:
• adequate accounting records have not been kept by the parent company, or returns adequate for our audit have not been received from branches not visited by us; or
• the parent company financial statements are not in agreement with the accounting records and returns; or
• certain disclosures of directors’ remuneration specified by law are not made; or
• we have not received all the information and explanations we require for our audit.
Paul Fenner (Senior Statutory Auditor) for and on behalf ofMoore Stephens LLP Chartered Accountants and Statutory Auditor 35 Calthorpe RoadEdgbastonBirminghamWest MidlandsB15 1TSDate: 19th May 2017

18
Consolidated StatementOf Comprehensive Income Year Ended 31 December 2016
2016 2015
Note £000 £000
Turnover 4 4,233 4,307Cost of sales (3,538) (3,516)
Gross profit 695
791
Administrative expenses (614) (809) Other operating income - 12 Fair value movements (5) 165
Operating profit 6 76
159
Interest receivable and similar income 10 - 1 Interest payable and expenses 11 (134) (147)
Profit on ordinary activities before taxation (58)
13
Tax on profit 12 7 (1)
Profit for the year (51)
12
Other comprehensive income:Unrealised surplus on revaluation of tangible fixed assets 466 -Deferred tax on revaluation surplus (84) -
Other comprehensive income for the year 382 -
Total comprehensive income for the year 331 12
Profit for the year attributable to:Owners of the parent company (100) 27 Minority interest 49 (15)
(51)
12
Total comprehensive income attributable to:
Owners of the parent company 186 27 Minority interest 145 (15)
331
12
19
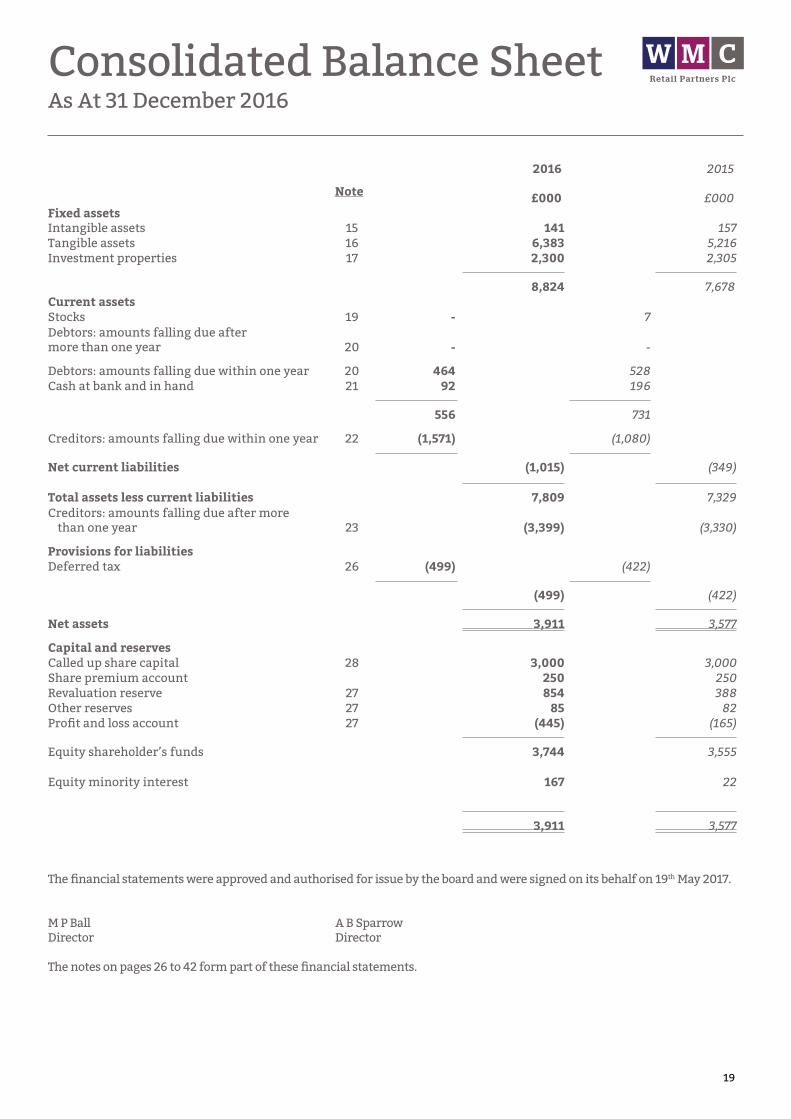
Consolidated Balance SheetAs At 31 December 2016
2016 2015
Note £000 £000Fixed assets Intangible assets 15 141 157Tangible assets 16 6,383 5,216Investment properties 17 2,300 2,305
8,824
7,678
Current assets Stocks 19 - 7 Debtors: amounts falling due aftermore than one year 20 - -
Debtors: amounts falling due within one year 20 464 528Cash at bank and in hand 21 92 196
556
731
Creditors: amounts falling due within one year 22 (1,571) (1,080)
Net current liabilities
(1,015)
(349)
Total assets less current liabilities 7,809
7,329
Creditors: amounts falling due after more than one year 23 (3,399) (3,330)
Provisions for liabilities Deferred tax 26 (499) (422)
(499)
(422)
Net assets 3,911
3,577
Capital and reserves Called up share capital 28 3,000 3,000Share premium account 250 250Revaluation reserve 27 854 388Other reserves 27 85 82Profit and loss account 27 (445) (165)
Equity shareholder’s funds 3,744
3,555
Equity minority interest 167 22
3,911
3,577
The financial statements were approved and authorised for issue by the board and were signed on its behalf on 19th May 2017.
M P Ball A B SparrowDirector Director
The notes on pages 26 to 42 form part of these financial statements.

20
Company Balance SheetAs At 31 December 2016
2016 2015Note £000 £000
Fixed assets Intangible assets 15 80 88Tangible assets 16 2,509 2,574Investment properties 17 2,300 2,305Investments 18 1,532 1,532
6,421
6,499
Current assets Debtors: amounts falling due after more thanone year 20 1,305 1,431Debtors: amounts falling due within one year 20 3,614 2,896Cash at bank and in hand 21 4 42
4,923
4,369
Creditors: amounts falling due within one year 22 (2,753) (2,395)
Net current assets
2,170
1,974
Total assets less current liabilities 8,591
8,473
Creditors: amounts falling due after more than one year 23 (3,399) (3,330)
Provisions for liabilities Deferred tax 26 (250) (247)
(250)
(247)
Net assets 4,942
4,896
Capital and reserves Called up share capital 28 3,000 3,000 Share premium account 250 250 Revaluation reserve 27 345 345Other reserves 27 85 82 Profit and loss account 27 1,262 1,219
4,942
4,896
The company reported a profit for the year to 31 December 2016 of £43,000 (2015 - £219,000).
The financial statements were approved and authorised for issue by the board and were signed on its behalf on 19th May 2017.
M P Ball A B SparrowDirector Director
The notes on pages 26 to 42 form part of these financial statements.

21
Consolidated StatementOf Changes In Equity As At 31 December 2016
Sharecapital
£000
Sharepremium
£000
Revaluationreserve
£000
Otherreserves
£000
Retained earnings
£000
Equity attributable
to owners of parent company
£000
Equity attributable to minority
interest£000
Totalequity
£000
At 1 January 2016 3,000 250 388 82 (143) 3,555 22 3,577
Comprehensive incomefor the yearProfit/(loss) for the year - - - - (51) (100) 49 (51)Surplus on revaluation of leasehold property - - 466 - - 349 117 466Deferred tax in respect of revaluation surpluses - - - - (84) (63) (21) (84)
Total comprehensiveincome for the year - - 466 - (135) 186 145 331
Contributions by and distributions to owners
Transfer to/from profitand loss account
- - - 3 - 3 - 3
Total transactionswith owners
- - - 3 - 3 - 3
At 31 December 2016 3,000 250 854 85 (278) 3,744 167 3,911

22
Sharecapital
£000
Sharepremium
£000
Revaluationreserve
£000
Otherreserves
£000
Retained earnings
£000
Equity attributable
to owners of parent company
£000
Equity attributable to minority
interest£000
Totalequity
£000
At 1 January 2015 3,000 250 388 79 (155) 3,525 37 3,562
Comprehensive incomefor the yearProfit/(loss) for the year - - - - 12 27 (15) 12
Total comprehensiveincome for the year
- - - - 12 27 (15) 12
Contributions by and distributions to owners
Transfer to/from profitand loss account
- - - 3 - 3 - 3
Total transactionswith owners
- - - 3 - 3 - 3
At 31 December 2015 3,000 250 388 82 (143) 3,555 22 3,577
Consolidated StatementOf Changes In Equity As At 31 December 2015
23
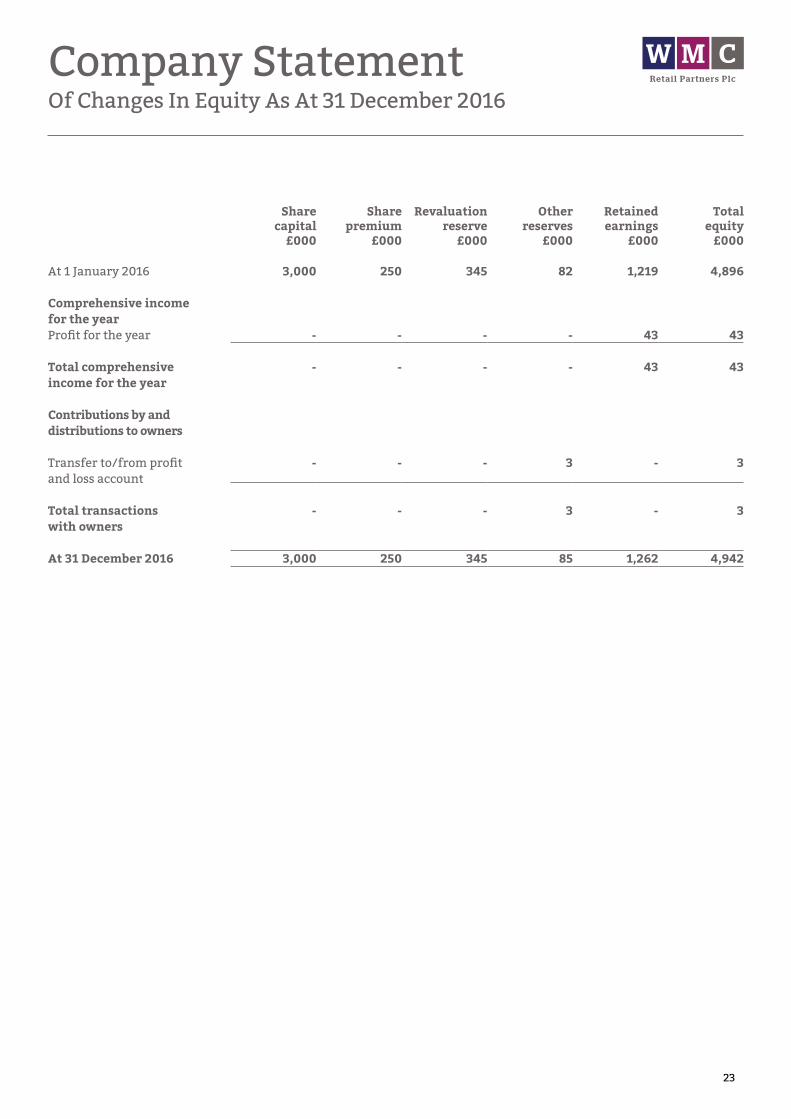
Sharecapital
£000
Sharepremium
£000
Revaluationreserve
£000
Otherreserves
£000
Retained earnings
£000
Totalequity
£000
At 1 January 2016 3,000 250 345 82 1,219 4,896
Comprehensive incomefor the yearProfit for the year - - - - 43 43
Total comprehensiveincome for the year
- - - - 43 43
Contributions by and distributions to owners
Transfer to/from profitand loss account
- - - 3 - 3
Total transactionswith owners
- - - 3 - 3
At 31 December 2016 3,000 250 345 85 1,262 4,942
Company StatementOf Changes In Equity As At 31 December 2016
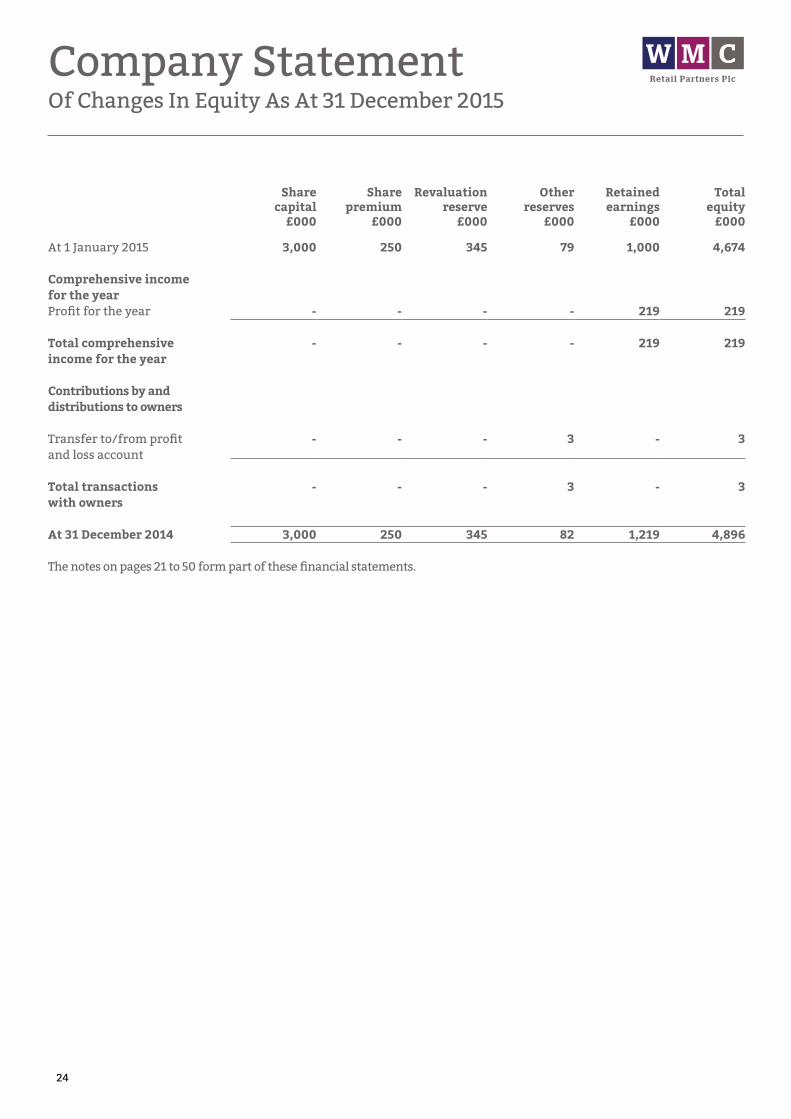
24
Sharecapital
£000
Sharepremium
£000
Revaluationreserve
£000
Otherreserves
£000
Retained earnings
£000
Totalequity
£000
At 1 January 2015 3,000 250 345 79 1,000 4,674
Comprehensive incomefor the yearProfit for the year - - - - 219 219
Total comprehensiveincome for the year
- - - - 219 219
Contributions by and distributions to owners
Transfer to/from profitand loss account
- - - 3 - 3
Total transactionswith owners
- - - 3 - 3
At 31 December 2014 3,000 250 345 82 1,219 4,896
The notes on pages 21 to 50 form part of these financial statements.
Company StatementOf Changes In Equity As At 31 December 2015

25
Consolidated StatementOf Cash Flows Year Ended 31 December 2016
2016£000
2015£000
Cash flows from operating activitiesProfit/(loss) for the financial year (51) 12
Adjustments for:Depreciation of tangible assets 185 183Amortisation of intangible assets 16 18Reversal of impairment losses (243) -(Profit)/loss on disposal of tangible assets (5) (12)Interest received - (1)Interest paid 134 147Corporation tax charge (7) 1Decrease in stocks 7 4Increase in debtors 48 198(increase)/Decrease in creditors 271 (259)Share based payment charge 3 3Fair value movements 5 (165)
Cash for operations 363 129Corporation tax refunded/(paid) 36 (36)
Net cash generated from operating activities 399 93
Cash flows from investing activitiesPurchase of tangible fixed assets (643) (71)Sale of tangible fixed assets 5 452Interest received - 1
Net cash inflow/(outflow) from investing activities (638) 382
Cash flows from financing activitiesInterest paid (111) (125)Preference share dividends paid (23) (23)New bank loans 250 -Repayment of bank loans (281) (282)New other loans received 300 100
Net cash used in financing activities 135 (330)
Net increase / (decrease) in cash and cash equivalents (104) 145
Cash and cash equivalents at beginning of year 196 51
Cash and cash equivalents at the end of year 92 196
Cash at bank and in hand 92 19692 196

26
Financial Statement NotesFor The Year Ended 31 December 2016
1. COMPANY INFORMATION
WMC Retail Partners Plc is a public company limited by shares, incorporated in England & Wales and domiciled in England.
The registered office is 21 Market Street, Wellington, Telford, Shropshire, TF1 1DT.
The principal activity of the Group and the Company during the year is the provision of market and retail operations.
2. ACCOUNTING POLICIES
2.1 Basis Of Preparation Of Financial Statements
The financial statements have been prepared under the historical costs convention as modified by the revaluation of tangible fixed assets and in accordance with Financial Reporting Standard 102, the Financial Reporting Standard applicable in the United Kingdom and the Republic of Ireland and the Companies Act 2006.
The preparation of financial statements in compliance with FRS 102 requires the use of certain critical accounting estimates. It also requires Group management to exercise judgement in applying the Company’s accounting policies (see note 3).
The following principal accounting policies have been applied:
2.2 Basis Of Consolidation
The consolidated financial statements present the results of WMC Retail Partners Plc and its own subsidiaries (“the Group”) as if they formed a single entity. Intercompany transactions and balances between group companies are therefore eliminated in full.
The consolidated financial statements incorporate the results of business combinations using the purchase method. In the Balance Sheet, the acquiree’s identifiable assets, liabilities and contingent liabilities are initially recognised at their fair values at the acquisition date. The results of acquired operations are included in the Consolidated Statement of Comprehensive Income from the date on which control is obtained. They are deconsolidated from the date control ceases.
In accordance with the transitional exemption available in FRS 102, the group has chosen not to retrospectively apply the standard to business combinations that occurred before the date of transition to FRS 102, being 1 January 2014. Therefore, the Group continues to recognise a merger reserve which arose on a past business combination that was accounted for
as a merger in accordance with UK GAAP as applied at that time.
2.3 Going Concern
In common with many companies, the current economic conditions create uncertainty with regards to trading, cash flows and the availability of finance.
The Group is funded by cash reserves.
The Group has prepared forecasts to 31 March 2018 which show that the Group will be able to operate within its available resources.
Accordingly, after making enquiries, including the preparation of forecasts and discussions with the Group’s bankers regarding the extension of the loan facilities, the directors have formed a judgement that, at the time of approving the financial statements, there is a reasonable expectation that the Company and the Group have adequate resources to continue in operational existence for a period of 12 months following the date the financial statements are approved. For this reason, the directors continue to prepare the financial statements on a going-concern basis.
2.4 Revenue
Turnover consists of gross income derived from the management of market facilities and retail outlets net of VAT and is recognised in the period to which it relates.
2.5 Intangible Assets
GOODWILLPurchased goodwill (representing the excess of the fair value of the consideration given over the fair value of the separable net assets acquired) in respect of acquisitions is capitalised. Positive goodwill is amortised to nil by equal annual instalments over its estimated useful life, which is estimated to be the life of the market leases ranging from 21 to 25 years.
Goodwill is reviewed for impairment at the end of the first full financial year following the acquisition and annual impairment reviews are performed at each subsequent balance sheet date where there is an indicator of impairment.
OTHER INTANGIBLE ASSETSIntangible assets are initially recognised at cost. After recognition, under the cost model, intangible assets are measured at cost less any accumulated amortisation and any accumulated impairment losses.
Licences are amortised over the period of the lease.

27
Financial Statement NotesFor The Year Ended 31 December 2016 (Cont.)
2.6 Tangible Fixed Assets
Tangible fixed assets under the cost model, other than investment properties, are stated at historical cost less accumulated depreciation and any accumulated impairment losses. Historical cost includes expenditure that is directly attributable to bringing the asset to the location and condition necessary for it to be capable of operating in the manner intended by management.
The Group adds to the carrying amount of an item of fixed assets the cost of replacing part of such an item when that cost is incurred, if the replacement part is expected to provide incremental future benefits to the Group. The carrying amount of the replaced part is derecognised. Repairs and maintenance are charged to profit or loss during the period in which they are incurred.
Depreciation is charged so as to allocate the cost of assets less their residual value over their estimated useful lives, using the straight line method.
The estimated useful lives range as follows:
Freehold properties 2% on costLeasehold properties - Over the period of the lease or 2% on costPlant and machinery 25% on costMotor vehicles 20% to 33% on cost
The assets’ residual values, useful lives and depreciation methods are reviewed, and adjusted prospectively if appropriate, or if there is an indication of a significant change since the last reporting date.
Gains and losses on disposals are determined by comparing the proceeds with the carrying amount and are recognised within ‘other operating income’ in the Consolidated Statement of Comprehensive Income.
2.7 Revaluation Of Tangible Fixed Assets
FREEHOLD OPERATING PROPERTIESUnder previous UK GAAP the Group had an accounting policy to revalue freehold operating properties. Under section 35.10 of FRS 102 the Group has taken advantage of the opportunity to use the previous carrying value at the transition date, being 1 January 2014, as deemed cost. From this point onwards freehold and leasehold operating properties will be depreciated on this basis.
Prior to the date of transition to FRS 102 all surpluses and deficits arising were taken directly to the revaluation reserve, unless a deficit (or its reversal) on an individual property was expected to be permanent in which case it was charged to the profit and loss account. For this reason the group has chosen to freeze the revaluation reserve in relation to operating
properties at the point of transition.
LEASEHOLD OPERATING PROPERTIESIndividual leasehold operating properties are carried at current year value at fair value at the date of the revaluation less any subsequent accumulated depreciation and subsequent accumulated impairment losses. Revaluations are undertaken with sufficient regularity to ensure the carrying amount does not differ materially from that which would be determined using fair value at the Balance Sheet date.
Fair values are determined from market based evidence normally undertaken by professionally qualified valuers.
Revaluation gains and losses are recognised in the Statement of Comprehensive Income as Other Comprehensive Income unless losses exceed the previously recognised gains or reflect a clear consumption of economic benefits, in which case the excess losses are recognised in profit or loss.
2.8 Operating Leases
AS LESSEERentals paid under operating leases are charged to the profit or loss on a straight line basis over the period of the lease. Lease incentives are recognised over the lease term on a straight line basis.
AS LESSORRentals received under operating leases are charged to the profit or loss on a straight line basis over the period of the lease. Lease incentives are recognised over the lease term on a straight line basis.
2.9 Investment Property
Investment property is carried at fair value determined annually by external valuers and derived from the current market rents and investment property yields for comparable real estate, adjusted if necessary for any difference in the nature, location or condition of the specific asset. No depreciation is provided. Changes in fair value are recognised in profit or loss.
Prior to the date of transition to FRS 102, being 1 January 2014, all surpluses and deficits arising were taken directly to the revaluation reserve, unless a deficit (or its reversal) on an individual investment property is expected to be permanent in which case it is charged to the profit and loss account. On transition to FRS 102 the Group and Company has applied the revised accounting policy above and has therefore transferred the element of the revaluation reserve which relates to the investment properties to the profit and loss account as if the accounting policy had always been in operation.

28
Financial Statement NotesFor The Year Ended 31 December 2016 (Cont.)
2.10 Valuation Of Investments
Investments in subsidiaries are measured at cost less accumulated impairment. Where merger relief is applicable, the cost of the investment in a subsidiary undertaking is measured at the nominal value of the shares issued together with the fair value of any additional consideration paid.
Investments in unlisted company shares, which have been classified as fixed asset investments as the Group intends to hold them on a continuing basis are remeasured to market value at each Balance Sheet date. Gains and losses on remeasurement are recognised in profit or loss for the period.
Investments in listed company shares are remeasured to market value at each Balance Sheet date. Gains and losses on remeasurement are recognised in profit or loss for the period.
2.11 Stocks
Stocks are stated at the lower of cost and net realisable value, being the estimated selling price less costs to complete and sell. Cost is based on the cost of purchase on a first in, first out basis. Work in progress and finished goods include labour and attributable overheads.
At each balance sheet date, stocks are assessed for impairment. If stock is impaired, the carrying amount is reduced to its selling price less costs to complete and sell. The impairment loss is recognised immediately in profit or loss.
2.12 Debtors
Short term debtors are measured at transaction price, less any impairment. Loans receivable are measured initially at fair value, net of transaction costs, and are measured subsequently at amortised cost using the effective interest method, less any impairment.
2.13 Cash And Cash Equivalents
Cash is represented by cash in hand and deposits with financial institutions repayable without penalty on notice of not more than 24 hours. Cash equivalents are highly liquid investments that mature in no more than three months from the date of acquisition and that are readily convertible to known amounts of cash with insignificant risk of change in value.
In the Consolidated Statement of Cash Flows, cash and cash equivalents are shown net of bank overdrafts that are repayable on demand and form an integral part of the Company’s cash management.
2.14 Financial Instruments
The Group only enters into basic financial instruments
transactions that result in the recognition of financial assets and liabilities like trade and other accounts receivable and payable, loans from banks and other third parties, loans to related parties and investments in non puttable ordinary shares.
Debt instruments (other than those wholly repayable or receivable within one year), including loans and other accounts receivable and payable, are initially measured at present value of the future cash flows and subsequently at amortised cost using the effective interest method. Debt instruments that are payable or receivable within one year, typically trade payables or receivables, are measured, initially and subsequently, at the undiscounted amount of the cash or other consideration, expected to be paid or received. However if the arrangements of a short term instrument constitute a financing transaction, like the payment of a trade debt deferred beyond normal business terms or financed at a rate of interest that is not a market rate or in case of an out right short term loan not at market rate, the financial asset or liability is measured, initially, at the present value of the future cash flow discounted at a market rate of interest for a similar debt instrument and subsequently at amortised cost. Investments in non convertible preference shares and in non puttable ordinary and preference shares are measured:
i) at fair value with changes recognised in the statement of comprehensive income if the shares are publicly traded or their fair value can otherwise be measured reliably;
ii) at cost less impairment for all other investments.
Financial assets that are measured at cost and amortised cost are assessed at the end of each reporting period for objective evidence of impairment. If objective evidence of impairment is found, an impairment loss is recognised in profit and loss.
For financial assets measured at amortised cost, the impairment loss is measured as the difference between an asset’s carrying amount and the present value of estimated cash flows discounted at the asset’s original effective interest rate. If a financial asset has a variable interest rate, the discount rate for measuring any impairment loss is the current effective interest rate determined under the contract.
For financial assets measured at cost less impairment, the impairment loss is measured as the difference between an asset’s carrying amount and best estimate, which is an approximation of the amount that the Group would receive for the asset if it were to be sold at the balance sheet date.
Financial assets and liabilities are offset and the net amount reported in the Balance Sheet when there is an enforceable right to set off the recognised amounts and there is an intention to settle on a net basis or to realise the asset and settle the liability simultaneously.

29
Financial Statement NotesFor The Year Ended 31 December 2016 (Cont.)
2.15 Creditors
Short term creditors are measured at the transaction price. Other financial liabilities, including bank loans, are measured initially at fair value, net of transaction costs, and are measured subsequently at amortised cost using the effective interest method.
2.16 Finance Costs
Finance costs are charged to profit or loss over the term of the debt using the effective interest method so that the amount charged is at a constant rate on the carrying amount. Issue costs are initially recognised as a reduction in the proceeds of the associated capital instrument.
2.17 Share Based Payments
Where share options are awarded to employees, the fair value of the options at the date of grant is charged to profit or loss over the vesting period. Non market vesting conditions are taken into account by adjusting the number of equity instruments expected to vest at each Balance Sheet date so that, ultimately, the cumulative amount recognised over the vesting period is based on the number of options that eventually vest. Market vesting conditions are factored into the fair value of the options granted. The cumulative expense is not adjusted for failure to achieve a market vesting condition.
The fair value of the award also takes into account non vesting conditions. These are either factors beyond the control of either party (such as a target based on an index) or factors which are within the control of one or other of the parties (such as the Group keeping the scheme open or the employee maintaining any contributions required by the scheme).
Where the terms and conditions of options are modified before they vest, the increase in the fair value of the options, measured immediately before and after the modification, is also charged to profit or loss over the remaining vesting period.
Where equity instruments are granted to persons other than employees, the Profit and Loss Account is charged with fair value of goods and services received.
2.18 Pensions
DEFINED CONTRIBUTION PENSION PLANThe Group operates a defined contribution plan for its employees. A defined contribution plan is a pension plan under which the Group pays fixed contributions into a separate entity. Once the contributions have been paid the Group has no further payments obligations.
The contributions are recognised as an expense in profit and loss when they fall due. Amounts not paid are shown in accruals as a liability in the Balance Sheet. The assets of the plan are held separately from the Group in independently administered funds.
2.19 Interest Income
Interest income is recognised in profit and loss using the effective interest method.
2.20 Borrowing Costs
All borrowing costs are recognised in profit and loss in the year in which they are incurred.
2.21 Provisions For Liabilities
Provisions are made where an event has taken place that gives the Group a legal or constructive obligation that probably requires settlement by a transfer of economic benefit, and a reliable estimate can be made of the amount of the obligation.
Provisions are charged as an expense to profit and loss in the year that the Group becomes aware of the obligation, and are measured at the best estimate at the Balance Sheet date of the expenditure required to settle the obligation, taking into account relevant risks and uncertainties.
When payments are eventually made, they are charged to the provision carried in the Balance Sheet.
2.22 Current And Deferred Taxation
The tax expense for the year comprises current and deferred tax. Tax is recognised in the Statement of Comprehensive Income, except that a change attributable to an item of income and expense recognised as other comprehensive income or to an item recognised directly in equity is also recognised in other comprehensive income or directly in equity respectively.
The current income tax charge is calculated on the basis of tax rates and laws that have been enacted or substantively enacted by the balance sheet date in the countries where the Company and the Group operate and generate income.
Deferred balances are recognised in respect of all timing differences that have originated but not reversed by the Balance Sheet date, except that:
• The recognition of deferred tax assets is limited to the extent that it is probable that they will be recovered against the reversal of deferred tax liabilities or other future taxable profits;
• Any deferred tax balances are reversed if and when

30
Financial Statement NotesFor The Year Ended 31 December 2016 (Cont.)
all conditions for retaining associated tax allowances have been met; and
• Where they relate to timing differences in respect of interests in subsidiaries, associates, branches and joint ventures and the Group can control the reversal of the timing differences and such reversal is not considered probable in the foreseeable future.
Deferred tax balances are not recognised in respect of permanent differences except in respect of business combinations, when deferred tax is recognised on the differences between the fair values of assets acquired and the future tax deductions available for them and the differences between the fair values of liabilities acquired and the amount that will be assessed for tax. Deferred income tax is determined using tax rates and laws that have been enacted or substantively enacted by the balance sheet date.
3. JUDGMENTS IN APPLYING ACCOUNTING POLICIES AND KEY SOURCES OF ESTIMATION UNCERTAINTY
In preparing the Financial Statements, management is required to make estimates and assumptions which affect reported income, expenses, assets, liabilities and disclosure of contingent assets and liabilities. Use of available information and application of judgement are inherent in the formation of estimates, together with expectations of future events that are believed to be reasonable under the circumstances. Actual results in the future could differ from such estimates.
The directors consider the key area of estimation and judgement is in relation to the carrying value of freehold investments and freehold and leasehold operating properties. Details of the approaches taken to these areas are disclosed in the accounting policies above and in the relevant notes to the financial statements.
4. ANALYSIS OF TURNOVER
An analysis of turnover by activity is as follows:
2016£000
2015£000
Provision of market facilities 4,021 4.094Rents received 212 213
4,233 4,307 All turnover arose within the United Kingdom.
5. OTHER OPERATING INCOME
2016£000
2015£000
Profit on sale of fixed assets 5 125 12
6. OPERATING PROFIT The operating profit is stated after charging/(crediting):
2016£000
2015£000
Depreciation of owned tangible fixed assets
185 184
Amortisation of intangible assets, including goodwill
16 18
Reversal of impairment losses (243) -Share based payments (note 28)
3 3
Fees payable to the Group’s auditor and its associates for the audit of the company’s annual accounts
3 3
Fees payable to the Group’s auditors and its associates for other services to the group
22 19
Operating lease rentals:- Plant and machinery 86 106- Land and buildings 553 811Rents receivable (212) (213)Defined contribution pension cost 39 33
7. AUDITORS’ REMUNERATION
2016£000
2015£000
Fees payable to the Group’s auditor and its associates for the audit of the Group’s annual accounts
3 3
3 3Fees payable to the Group’s auditors and its associates for other services to the group:- Audit of subsidiary undertakings 19 16- Non-audit services: taxation
services3 3
22 19
25 22

31
Financial Statement NotesFor The Year Ended 31 December 2016 (Cont.)
8. EMPLOYEES Staff costs, including directors’ remuneration, were as follows:
2016£000
2015£000
Wages and salaries 992 1,062Social security costs 73 82Cost of defined contribution scheme
39 33
Share based payments 3 21,107 1,179
Pensions costs totalling £3,000 (2015 - £3,000) were payable at the year end and are included in creditors.
The average monthly number of employees, including the directors, during the year was as follows:
2016No.
2015No.
Directors 2 2Administration 5 4Market and retail operations 40 44
47 50
Staff numbers include full and part time, temporary and permanent employees.
9. DIRECTORS’ REMUNERATION
2016£000
2015£000
Amounts paid for directors’ services(including benefits in kind)
186 197
Cost of defined contribution scheme
28 24
214 221
During the year retirement benefits were accruing to two directors (2015 – one) in respect of defined contribution pension schemes. The highest paid director received remuneration of £100,000 (2015 – £104,000). The value of the company’s contributions paid to a defined contribution pension scheme in respect of the highest paid director amounted to £27,000 (2015 - £23,000).
10. INTEREST RECEIVABLE
2016£000
2015£000
Bank and other interest receivable - 1- 1
11. INTEREST PAYABLE AND SIMILAR CHARGES
2016£000
2015£000
On bank loans and overdrafts 111 124Preference dividends paid 23 23
134 147
12. TAXATION
2016£000
2015£000
Corporation TaxCurrent tax on profits for the year - -Adjustments in respect of previous periods
- (21)
Total current tax - (21)
Deferred Tax
Net origin of timing differences 35 (1)Timing differences arising on revaluation surpluses
- 33
Change in tax rates (42) -Adjustments in respect of previous periods - (10)
Total deferred Tax (7) 22
Taxation on profit on ordinary activities
(7) 1
FACTORS AFFECTING TAX CHARGE FOR THE YEARThe tax assessed for the year is higher than (2015 – lower than) the standard rate of corporation tax in the UK of 20% (2015 – 20%).
The differences are explained over:

32
2016£000
2015£000
Profit (loss) on ordinary activities before tax
(58) 13
Profit on ordinary activities multiplied by standard rate of corporation tax in the UK of 20% (2015 – 20%)
(12) 3
Effects of:
Expenses not deductible for tax purposes
2 1
Reversal of impairment losses (49) -Capital allowances for year in excess of depreciation
13 28
Losses carried forward/(carried back)
39 (16)
Prior year over provision - (15)
Total tax charge for the year (7) 1
FACTORS THAT MAY AFFECT FUTURE TAX CHARGESThere were no factors that may affect future tax charges.
13. EARNINGS PER SHARE The calculation of basic earnings per ordinary share is shown below:
2016£000
2015£000
Earnings:Profit after taxation before minority interest
(100) 27
Average number of shares:For basic earnings per share 5,999,449 5,999,449
Earnings per share:Basic (1.67)p 0.45pDiluted (1.67)p 0.45pAdjusted basic (1.67)p 0.45pAdjusted diluted (1.67)p 0.45p
The effect of the share options was anti-dilutive for the basic and adjusted earnings per share as the options are out of the money.
14. PARENT COMPANY STATEMENT OF COMPREHENSIVE INCOME
The Company has taken advantage of the exemption allowed under section 408 of the Companies Act 2006 and has not presented its own Statement of Comprehensive Income in these financial statements.
Financial Statement NotesFor The Year Ended 31 December 2016 (Cont.)

33
15. INTANGIBLE ASSETS
Group Licence fees and similar rights
and assets£000
Goodwill£000
Total£000
Cost
At 1 January 2016 143 243 386
At 31 December 2016 143 243 386
Amortisation and impairmentAt 1 January 2016 100 129 229Charge for the year 5 11 16
At 31 December 2016 105 140 245
At 31 December 2016 38 103 141
At 31 December 2015 43 114 157
Company Licence fees and similar rights
and assets£000
Goodwill£000
Total£000
Cost
At 1 January 2016 144 164 308
At 31 December 2016 144 164 308
Amortisation and impairmentAt 1 January 2016 101 119 220Charge for the year 4 4 8
At 31 December 2016 105 123 228
At 31 December 2016 39 41 80
At 31 December 2015 43 45 88
Financial Statement NotesFor The Year Ended 31 December 2016 (Cont.)

34
16. TANGIBLE FIXED ASSETS
GROUPFreehold
operatingproperties
£000
Leaseholdoperating
properties £000
Fixtures,fittings andequipment
£000
Motorvehicles
£000Total£000
Valuation or deemed costAt 1 January 2016 2,635 2,616 1,370 2 6,623Additions - 610 29 4 643Disposals - - - (2) (2)Revaluation - 375 - - 375
At 31 December 2016 2,635 3,601 1,399 4 7,639
DepreciationAt 1 January 2016 81 297 1,027 2 1,407Charge for the year 53 49 82 1 185Disposals - - - (2) (2)Revaluation - (334) - - (334)
At 31 December 2016 134 12 1,109 1 1,256
At 31 December 2016 2,501 3,589 290 3 6,383
At 31 December 2015 2,554 2,319 343 - 5,216
COMPANY Freeholdoperating
properties£000
Fixtures,fittings and equipment
£000Total£000
Deemed Cost
At 1 January 2016 2,635 372 3,007
At 31 December 2016 2,635 372 3,007
DepreciationAt 1 January 2016 81 352 433Charge for the year 53 12 65
At 31 December 2016 134 364 498
At 31 December 2016 2,501 8 2,509
At 31 December 2015 2,554 20 2,574
Financial Statement NotesFor The Year Ended 31 December 2016 (Cont.)

35
GROUP AND COMPANY
Freehold operating properties are held at their deemed cost based on the carrying values under previous UK GAAP on the Group and Company’s transition date being 1 January 2014. Other tangible fixed assets are stated at cost.
Freehold operating properties were valued independently on an open market basis by Barry Crux & Co. and Aitchison Rafferty at 31 December 2013 in accordance with the Appraisal and Valuation Manual of the Royal Institute of Chartered Surveyors Statement. The company has used this valuation as deemed cost as at 1 January 2014.
Leasehold operating properties were valued independently on an open market basis by Aitchison Rafferty at 29 November 2016 in accordance with the Royal Institute of Chartered Surveyors Valuation – Professional Standards 2014.
If freehold operating and leasehold operating properties had not been revalued and restated as deemed cost at 1 January 2014 they would have been included at the following historical cost:
2016£000
2015£000
Group
Cost 6,360 5,750
Net Book Value 5,231 4,728
2016£000
2015£000
Company
Cost 2,506 2,506
Net Book Value 2,252 2,368
17. INVESTMENT PROPERTY
Group Freehold investment property
£000ValuationAt 1 January 2016 2,305Deficit on revaluation (5)
At 31 December 2016 2,300
Company Freehold investment property
£000ValuationAt 1 January 2016Deficit on revaluation 2,305
(5)
At 31 December 2016 2,300
Freehold investment properties were valued independently on an open market value basis at 19 December 2016 by Halls Commercial at £2.3m in accordance with the Appraisal and Valuation Manual of the Royal Institute of Chartered Surveyors Statement. The directors consider the market value at 31 December 2016 not to be materially different to this valuation.
If the Investment properties had been accounted for under the historic cost accounting rules, the properties would be carried at their historical cost of £1,456,000 (2015 - £1,456,000).
18. FIXED ASSET INVESTMENTS Company Shares in Group
Undertakings£000
Cost and Net Book ValueAt 1 January 2016 1,532
At 31 December 2016 1,532 The Company owns the entire issued ordinary share capital of Town and Country Markets Limited, Activate Assets Limited and Wellington Market Co Ltd. In addition, the Company owns 75% of the issued ordinary share capital of Town and Country Markets (Luton) Limited. These companies are incorporated in England and Wales. Town and Country Markets Limited and Town and Country Markets (Luton) Limited principal activity is to operate markets. The other subsidiary undertakings are dormant.
During the year the Company purchased 100% of the issued share capital of Cornucopia of Cornwall Limited, a company incorporated in England & Wales on 25 January 2016, for £50. The subsidiary has not traded during the period to 31 December 2016.
Financial Statement NotesFor The Year Ended 31 December 2016 (Cont.)
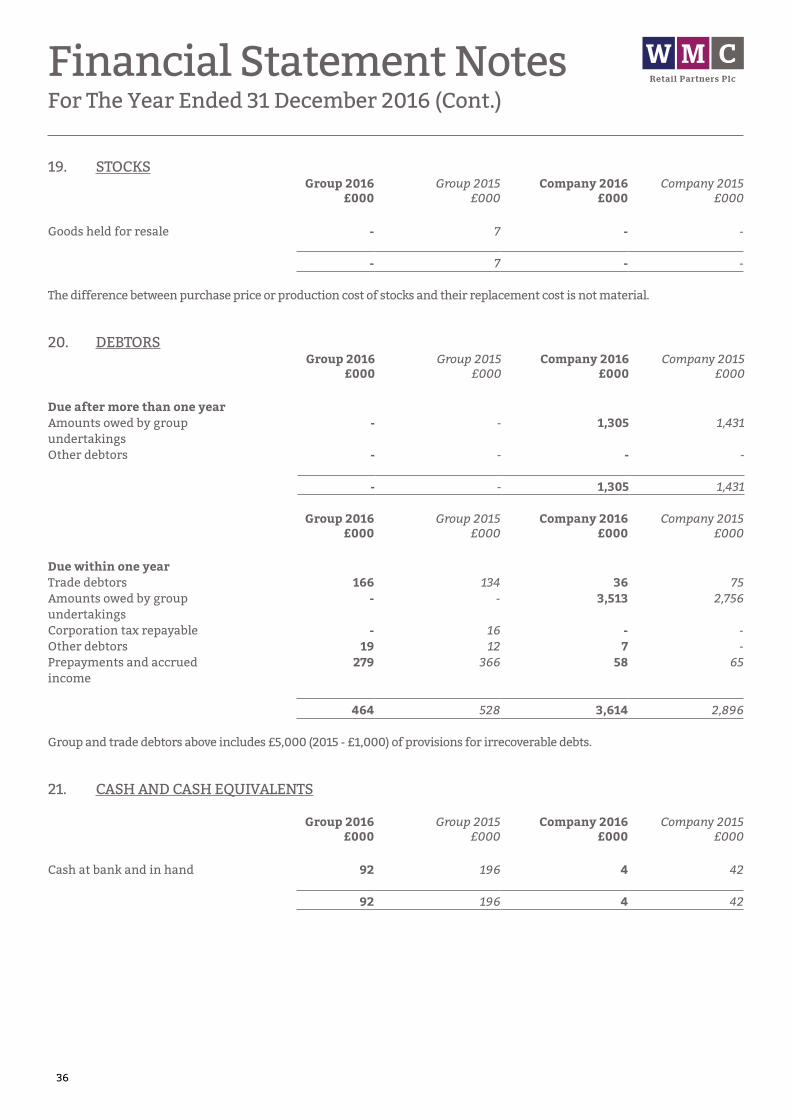
36
19. STOCKSGroup 2016
£000Group 2015
£000Company 2016
£000Company 2015
£000
Goods held for resale - 7 - -
- 7 - -
The difference between purchase price or production cost of stocks and their replacement cost is not material.
20. DEBTORSGroup 2016
£000Group 2015
£000Company 2016
£000Company 2015
£000
Due after more than one yearAmounts owed by group undertakings
- - 1,305 1,431
Other debtors - - - -
- - 1,305 1,431
Group 2016£000
Group 2015£000
Company 2016£000
Company 2015£000
Due within one yearTrade debtors 166 134 36 75Amounts owed by group undertakings
- - 3,513 2,756
Corporation tax repayable - 16 - -Other debtors 19 12 7 -Prepayments and accrued income
279 366 58 65
464 528 3,614 2,896
Group and trade debtors above includes £5,000 (2015 - £1,000) of provisions for irrecoverable debts.
21. CASH AND CASH EQUIVALENTS
Group 2016£000
Group 2015£000
Company 2016£000
Company 2015£000
Cash at bank and in hand 92 196 4 42
92 196 4 42
Financial Statement NotesFor The Year Ended 31 December 2016 (Cont.)

37
22. CREDITORS : AMOUNTS FALLING DUE WITHIN ONE YEAR
Group 2016£000
Group 2015£000
Company 2016£000
Company 2015£000
Bank loans 532 282 532 282Other loans - 50 - 50Trade creditors 582 262 97 55Amounts owed to group undertakings
- - 2,044 1,925
Corporation tax 20 - - -Taxation and social security 21 127 10 16Other creditors 27 28 - -Accruals and deferred income
389 331 70 67
1,571 1,080 2,753 2,395
Details of security on bank loans are disclosed at note 24.
23. CREDITORS : AMOUNTS FALLING DUE AFTER MORE THAN ONE YEAR
Group 2016£000
Group 2015£000
Company 2016£000
Company 2015£000
Bank loans 2,634 2,915 2,634 2,915Other loans - 50 - 50Convertible loan notes 400 - 400 -Share capital treated as debt 365 365 365 365
3,399 3,330 3,399 3,330
Disclosure of the terms and conditions attached to the non equity shares is made in note 28.Disclosure of security on bank loans are disclosed at note 24. During the year other loans totalling £400,000 were re-designated as convertible loan stock. Further details can be found at note 24 below.
24. LOANS
The maturity profile of the Group and Company’s financial liabilities at the year end was as follows:
Group 2016£000
Group 2015£000
Company 2016£000
Company 2015£000
Amounts falling due within one year or on demand:Bank loans 532 282 532 282Other loans - 50 - 50
532 332 532 332
Financial Statement NotesFor The Year Ended 31 December 2016 (Cont.)

38
Group 2016£000
Group 2015£000
Company 2016£000
Company 2015£000
Bank loan obligations falling due:- Between one and two years 282 282 282 282- Between two and five years 846 846 846 846- In more than five years 1,506 1,787 1,506 1,787
Other loans falling due:- Between one and two years - 50 - 50
Convertible loans notes:- Between two and five years 400 - 400 -
Preference shares falling due:- In more than 5 years 365 365 365 365
3,399 3,330 3,399 3,330
3,931 3,662 3,931 3,662
The above loans are repayable over varying periods as follows:
BANK LOANSThe Group’s bank loans are secured by a first legal and fixed charge on the freehold properties. The Group has a term loan of £3.8m repayable over 15 years, which bears an interest rate of 3.04% above base rate and a development loan of £250,000 which is repayable on demand.
As discussed in the Group Strategic Report, the Group has not met its loan covenants in the current or the previous financial year, specifically in relation to the repayment cover covenant. The bank has expressed its willingness to continue to support the Group for the foreseeable future, despite these breaches and have confirmed that the repayments terms will not be accelerated. As a result, the Directors consider it reasonable to continue to recognise the bank loan in the same way as in previous years.
CONVERTIBLE LOAN NOTESIn October 2016 the other loans were redesignated to interest free secured convertible loan stock. These bear zero interest and are not redeemable until 2021. The loan stock is secured by way of a fixed and floating charge against the property and undertakings of the company which has a secondary security ranking behind that of the bank as disclosed above.
PREFERENCE SHARESThe 730,574 preference shares of 50 pence are being shown as creditors amounts falling due after more than one year.
The holders of the preference shares are entitled to be paid, out of the profits available for distribution, a fixed annual cumulative preference dividend at the rate of 3.175 pence (net) per share. On a return of capital on a winding up the holders of the preference shares shall be entitled, in priority to any payment to any other class of shares and pari passu with any further preference shares, to the repayment of the sum of 50 pence per share.
The preference shares entitle the holders to receive notice of every general meeting of the Company, but not to attend, speak or vote at any general meeting unless the business of the meeting includes the consideration of a resolution for winding up the Company or any resolution varying the rights of the preference shares, in which case such holders shall have the right to attend the general meeting, but shall be entitled to speak and vote only on such resolution or unless at the date of the notice convening the meeting the preferential dividend payable on such shares is in arrears for six months or more. The preference shares have no fixed redemption date.
Financial Statement NotesFor The Year Ended 31 December 2016 (Cont.)

39
25. FINANCIAL INSTRUMENTSGroup 2016
£000Group 2015
£000Company 2016
£000Company 2015
£000
Financial assetsFinancial assets measured at fair value through profit and loss
92 196 4 42
Financial assets that are debt instruments measured at amortised cost
185 146 4,861 4,262
277 342 4,865 4,304
Financial liabilitiesFinancial liabilities measured at amortised cost
4,950 4,410 6,152 5,725
Financial assets measured at fair value through profit and loss comprise cash held at bank and in hand.
Financial assets measured at amortised cost comprise trade and other debtors and amounts due from group undertakings.
Financial liabilities measured at amortised cost comprise bank loans, other loans, trade and other creditors, convertible loan notes, amounts owed to group undertakings, preference shares and accruals.
The weighted average interest rate of the fixed rate financial liabilities (the preferences shares) is 3.175p or 6% per share (on a nominal value of 50p). There are no fixed rate financial assets. The weighted average period for which interest rates on the fixed rate financial liabilities (the preference shares) is fixed until the shares are recalled at a point in time at the Company’s discretion. The weighted average period until maturity for financial liabilities on which no interest is paid is approximated by the creditor days as disclosed in the directors report. Trade debtor days are 49 days (2015 - 42 days). The benchmark rate for determining interest payments for the floating rate financial assets and floating rate financial liabilities is the base rate.
The Group does not use derivatives. The Group finances its operations through bank borrowings and cash reserves. The Group had no currency exposure at 31 December 2016 (2015 - none).
26. DEFERRED TAXATIONGroup 2016
£000Group 2015
£000Company 2016
£000Company 2015
£000
Balance At 1 January 422 400 247 214Charged/(credited) to profit or loss account
(7) 22 3 33
Charged through other comprehensive income
84 - - -
Liability at 31 December 499 422 250 247
The provision for deferred taxation is made up as follows:Group 2016
£000Group 2015
£000Company 2016
£000Company 2015
£000
Accelerated capital allowances
174 176 3 -
Timing differences (on revaluation)
325 246 247 247
499 422 250 247
Financial Statement NotesFor The Year Ended 31 December 2016 (Cont.)

40
27. RESERVES
PROFIT AND LOSS RESERVEFair value movements on investment properties have been recognised through the profit and loss account in accordance with FRS 102 section 16. Under previous UK GAAP these changes were recorded in the Statement of Total Recognised Gains and Losses. This accounting treatment has been applied retrospectively and therefore the element of the revaluation reserve relating to investment properties has been transferred to the profit and loss account.Included within the Group and Company profit and loss reserves as at 31 December 2016 is £844,000 (2015 - £849,000) of non distributable reserves as a result of movements in the fair value of investment properties.REVALUATION RESERVEThe revaluation reserve relates to fair value movements recognised on freehold and leasehold operating properties. Prior to the date of transition to FRS 102 all surpluses and deficits arising were taken directly to the revaluation reserve, unless a deficit (or its reversal) on an individual property was expected to be permanent in which case it was charged to the profit and loss account. For this reason the group has chosen to freeze the revaluation reserve in relation to operating properties at the point of transition. Surpluses and deficits on leasehold operating profits continued to be recognised through other comprehensive income and held with the revaluation reserve.OTHER RESERVESOther reserves relate to the share based payment reserve. See note 28 for further details.
28. SHARE CAPITAL2016
No.2016£000
2015No.
2015£000
Shares classified as equity
Allotted, called up and fully paidOrdinary shares of £0.05 each 5,999,449 300 0 0Ordinary shares of £0.50 each - - 5,999,449 3,000Deferred ordinary shares of £0.45 each
5,999,449 2,700 - -
11,998,898 3,000 5,999,449 3,000Shares classified as debtPreference shares of £0.50 each 730,574 365 730,574 365
During the year, shareholders voted to convert the ordinary 50p shares into a 5p ordinary share and a 45p deferred ordinary share.An ordinary resolution was passed during the year which changed the rights associated with the various types of share capital. As such the deferred ordinary shares do not carry any voting rights and are also not entitled to participate in the profits of the company. The voting rights of the £0.05 ordinary shares remain unchanged.Upon any distribution or in the event of winding up of the Company, subject to the rights of the preference shareholders (as disclosed in note 24), the assets of the Company available for distribution amongst the members shall be apllied in the following manner and order of priority:i) first, in paying the holders of the £0.05 ordinary shares the sum of £100,000 per ordinary share,ii) second, in paying to the holders of the Deferred shares the amounts paid up or credited as paid up on such shares (excluding
any premium paid on subscription)iii) third, in distributing the balance amongst the holders of the ordinary shares in proportion to the amounts paid up or
credited as paid up (excluding any premium paid on subscription) on the ordinary shares held by such holders respectively.Under the share options schemes the following share options are still outstanding:
Date of grantExercise
price£
Date fromwhich first exercisable
Expirydate
At 1January 2016
Number
OptionExpired
Grantedduring
year
At 31December
2016Number
Approved SchemeJune 2009 0.66 June 2012 June 2019 50,000 50,000January 2010 0.53 January 2013 January 2020 10,000 10,000 0June 2010 0.52 June 2013 June 2020 25,000 25,000January 2011 0.50 January 2014 January 2021 110,000 10,000 100,000January 2012 0.50 January 2015 December 2021 48,000 48,000April 2012 0.50 April 2015 April 2022 15,000 7,500 7,500
Financial Statement NotesFor The Year Ended 31 December 2016 (Cont.)

41
Unapproved SchemeJune 2011 0.50 June 2014 June 2021 25,000 25,000January 2012 0.50 January 2015 December 2021 2,000 2,000January 2013 0.50 January 2016 December 2022 50,000 50,000
335,000 (27,500) 307,500
Details of the number of share options and the weighted average exercise price (WAEP) outstanding during the year are as follows:2016
No.2016
WAEP £2015
No.2015
WAEP £
Outstanding at the beginning of the year
335,000 0.526 335,000 0.526
Granted during the year - - - -Expired during the year (27,500) 0.511 - -
307,500 0.528 335,000 0.526
Exercisable at the year end 307,500 0.528 238,000 0.537
During the year share options totalling 27,500 shares, to the benefit of Paul Fice, expired when he left the business.
For the options granted in 2009 the model assumes a volatility of 20.5%, expected dividend yield of 2.8% and a risk free rate of 5.8%. On this basis, the fair value of the share options at date of grant was £0.19. The vesting period has been assessed as over 3 years. The options carry no performance conditions.
For the options granted in 2010 the model assumes a volatility of 23.1%, expected dividend yield of 2.8% and a risk free rate of 5.8%. On this basis, the fair value of the share options at date of grant was £0.16. The vesting period has been assessed over three years. The options carry no performance conditions.
For the options granted in 2011 the model assumes a volatility of 17.8%, expected dividend yield of 2.0% and a risk free rate of 5.8%. On this basis, the fair value of the share options at date of grant was £0.15. The vesting period has been assessed over three years. The options carry no performance conditions.
For the options granted in 2012 the model assumes a volatility of 15.1%, expected dividend yield of 2.0% and a risk free rate of 5.8%. On this basis, the fair value of the share options at date of grant was £0.15. The vesting period has been assessed over three years. The options carry no performance conditions.
For the options granted in 2013 the model assumes a volatility of 9.3%, expected dividend yield of 1.6% and a risk free rate of 5.8%. On this basis, the fair value of the share options at date of grant was £0.15. The vesting period has been assessed over three years. The options carry no performance conditions.
At 31 December 2016 a charge of £3,000 has been reflected in the profit and loss within administration expenses (2015 £3,000).
29. CONTINGENT LIABILITIES
The Company has provided an unlimited guarantee in respect of certain bank borrowings of the parent company. The contingent liability under this guarantee at 31 December 2016 amounted to £2,962,000 (2015 £3,300,000). The bank borrowings are secured by a legal charge on the property.
30. PENSION COMMITMENTS
The Group and Company operates two defined contributions pension schemes. The assets of the schemes are held separately from those of the Group and Company in an independently administered fund. The pension cost charge represents contributions payable by the Group and Company to the fund and amounted to £39,000 (2015 - £33,000). Contributions totalling £3,000 (2015 - £2,000) were payable to the fund at the balance sheet date and are included within creditors due within one year.
Financial Statement NotesFor The Year Ended 31 December 2016 (Cont.)

42
31. COMMITMENTS UNDER OPERATING LEASES
AS LESSEEAt 31 December 2016 the Group and the Company had future minimum lease payments, payable under non cancellable operating leases as follows:
Group 2016£000
Group 2015£000
Company 2016£000
Company 2015£000
Land and buildings
Not later than one year 490 545 - -Later than one year and not later than five years
1.910 1,860 - -
Later than five years 5,220 5,685 - -
7,620 8,090 - -
OtherNot later than one year 36 124 - -Later than one year and not later than five years
15 81 - -
Later than five years - - - -
51 205 - -
AS LESSORAt 31 December 2016 the Group and the Company had future minimum lease payments, receivable under non cancellable operating leases as follows:
Group 2016£000
Group 2015£000
Company 2016£000
Company 2015£000
Land and buildings
Not later than one year 109 124 109 124Later than one year and not later than five years
269 184 269 184
Later than five years 153 207 153 207
531 515 531 515
32. Related Party Transactions The Company had the following transactions with Town and Country Markets (Luton) Limited: it paid net interest of £5,000 (2015 - £17,000) and running cost of £nil (2015 - £nil). The net amount owed at 31 December 2016 by WMC Retail Partners Plc to Town and Country Markets (Luton) Limited was £310,000 (2015 - £458,000).
The Company is taken advantage of the exemption available in FRS 102 and has therefore not disclosed transactions with its wholly owned subsidiaries as disclosed in note 18.
Total key management personnel remuneration for the year, including directors, benefits and pension contributions, totalled £285,000 (2015 - £283,000).
At the year end convertible loan stock of £400,000 was held by related party companies. The DLMI Company, a company which has a common director in M Chadwick, held convertible loan stock of £200,000 and Simons & Co Limited, a company which has a common director in S J Hewett, held convertible loan stock of £200,000. The convertible loan stock has no associated interest.
33. Controlling Party
The company is a wholly owned subsidiary of WMC Retail Partners Plc, which is the ultimate controlling party and is incorporated in England and Wales. Copies of the parent company’s financial statements may be obtained from the company’s registered office.
Financial Statement NotesFor The Year Ended 31 December 2016 (Cont.)


Registered Office 21 Market Street, Wellington, Telford, Shropshire, TF1 1DTCompany Registration Number 00636475