lithos - university of texas at dallas
TRANSCRIPT
�������� ����� ��
Interrelations between coeval mafic and A-type silicic magmas from compos-ite dykes in a bimodal suite of southern Israel, northernmost Arabian-NubianShield: Geochemical and isotope constrains
Y. Katzir, B.A. Litvinovsky, B.M. Jahn, M. Eyal, A.N. Zanvilevich,J.W. Valley, Ye Vapnik, Y. Beeri, M.J. Spicuzza
PII: S0024-4937(07)00013-8DOI: doi: 10.1016/j.lithos.2007.01.004Reference: LITHOS 1558
To appear in: LITHOS
Received date: 30 September 2006Revised date: 3 January 2007Accepted date: 3 January 2007
Please cite this article as: Katzir, Y., Litvinovsky, B.A., Jahn, B.M., Eyal, M., Zanvile-vich, A.N., Valley, J.W., Vapnik, Ye, Beeri, Y., Spicuzza, M.J., Interrelations betweencoeval mafic and A-type silicic magmas from composite dykes in a bimodal suite of south-ern Israel, northernmost Arabian-Nubian Shield: Geochemical and isotope constrains,LITHOS (2007), doi: 10.1016/j.lithos.2007.01.004
This is a PDF file of an unedited manuscript that has been accepted for publication.As a service to our customers we are providing this early version of the manuscript.The manuscript will undergo copyediting, typesetting, and review of the resulting proofbefore it is published in its final form. Please note that during the production processerrors may be discovered which could affect the content, and all legal disclaimers thatapply to the journal pertain.

ACC
EPTE
D M
ANU
SCR
IPT
ACCEPTED MANUSCRIPT
2
Interrelations between coeval mafic and A-type silicic magmas from composite1
dykes in a bimodal suite of southern Israel, northernmost Arabian-Nubian2
Shield: geochemical and isotope constrains3
Y. Katzira, B. A. Litvinovskya,*, B. M. Jahnb, M. Eyala, A. N. Zanvilevicha, J. W.4
Valleyc, Ye. Vapnika, Y. Beeri a, M. J. Spicuzzac5
a Dept. of Geological and Environmental Sciences, Ben Gurion University of the6
Negev, Beer Sheva 84105, Israel7
b Institute of Earth Sciences, Academica Sinica, Taipei 11529, Taiwan8
c Dept. of Geology and Geophysics, University of Wisconsin, Madison WI 53706,9
USA10
Abstract11
Late Neoproterozoic bimodal dyke suites are abundant in the Arabian-Nubian12
Shield. In southern Israel this suite includes dominant alkaline quartz porphyry dykes,13
rare mafic dykes, and numerous composite dykes with felsic interiors and mafic14
margins. The quartz porphyry chemically corresponds to A-type granite. Composite15
dykes with either abrupt or gradational contacts between the felsic and mafic rocks16
bear field, petrographic and chemical evidence for coexistence and mixing of basaltic17
and rhyolitic magmas. Mixing and formation of hybrid intermediate magmas18
commenced at depth and continued during emplacement of the dykes. Oxygen isotope19
ratios of alkali feldspar in quartz porphyry (13 to 15‰) and of plagioclase in20
trachydolerite (10–11‰) are much higher than their initial magmatic ratios predicted21
by equilibrium with unaltered quartz (8 to 9‰) and clinopyroxene (5.8‰). The22
elevation of δ18O in alkali feldspar and plagioclase, and extensive turbidization and23
sericitization call for post-magmatic low-temperature (≤ 100 ˚C) water-rock24
interaction. Hydrous alteration of alkali-feldspar, the major carrier of Rb and Sr in the25

ACC
EPTE
D M
ANU
SCR
IPT
ACCEPTED MANUSCRIPT
3
quartz-porphyry, also accounts for the highly variable and unusually high I(Sr) of26
0.71253 to 0.73648.27
The initial 143Nd/144Nd ratios, expressed by εNd(T) values, are probably unaltered28
and show small variation in mafic and felsic rocks within a narrow range from +1.4 to29
+3.3. The Nd isotope signature suggests either a common mantle source for the mafic30
and silicic magmas or a juvenile crust source for the felsic rocks (metamorphic rocks31
from the Elat area). However, oxygen isotope ratios of zircon in quartz porphyry32
[δ18O (Zrn) = 6.5 to 7.2‰] reveal significant crustal contribution to the rhyolite33
magma, suggesting that mafic and A-type silicic magmas are not co-genetic, although34
coeval. Comparison of 18O/16O ratios in zircon allows to distinguish two groups of A-35
type granites in the region: those with mantle-derived source, δ18O(Zrn) ranging from36
5.5 to 5.8‰ (Timna and Katharina granitoids) and those with major contribution of37
the modified juvenile crustal component, δ18O(Zrn) varying from 6.5 to 7.2‰ (Elat38
quartz porphyry dykes and the Yehoshafat alkaline granite). This suggests that A-type39
silicic magmas in the northern ANS originated by alternative processes almost40
coevally.41
Key words: composite dyke; A-type granite; oxygen isotopes; Sr isotopes; Nd42
isotopes; Arabian-Nubian Shield43
1. Introduction44
Composite dykes that are made up of felsic and mafic rocks are abundant45
worldwide (e.g., Vogel and Wilband, 1978; Marshall and Sparks, 1984; Furman and46
Spera, 1985; Stern and Voegeli, 1987; Carrigan and Eichelberg, 1990; Poli and47
Tommazini, 1991; Koyaguchi and Takada, 1994; Litvinovsky et al., 1995a; Titov et48
al., 2000; Jarrar et al., 2004). Composite dykes, like microgranular mafic enclaves49
(MME) and synplutonic basic dykes in felsic igneous rocks, provide unequivocal50

ACC
EPTE
D M
ANU
SCR
IPT
ACCEPTED MANUSCRIPT
4
evidence for coexistent magmas of contrasting composition. Comparative study of51
mafic and felsic rocks in composite dykes can shed light on possible genetic links52
between mafic magmas and contemporaneous silicic melts. In post-orogenic settings53
the felsic rocks of composite dykes exhibit geochemical traits of A-type granite, so54
the felsic rocks may serve as one of key objects for study of the origin of A-type55
granites (Stern and Voegeli, 1987; Jarrar et al., 2004).56
Two different types of composite dykes are distinguished (Snyder et al., 1997;57
Wiebe and Ulrich, 1997): (Type 1) those with felsic margins and mafic interiors; the58
latter are commonly in the form of pillow-like and rounded enclaves or as a net-59
veined essentially mafic dykes; (Type 2) dykes with felsic interiors and mafic60
margins; a main distinctive feature of these dykes is clear zoning with smooth planar61
contacts, both abrupt and gradational, between felsic interior and mafic marginal62
zones.63
Type 1 dykes are less appropriate for reconstruction of the initial magma64
compositions due to the high extent of interaction between the commingling magmas.65
This particularly affects the more mobile elements such as K, Rb, Na, Ba, Ca, Sr66
(Eberz and Nichols, 1990; Holden et al., 1991; Zorpi et al., 1991; Poli and67
Tommazini, 1991; Tindle and Pearce, 1983; Litvinovsky et al., 1995b). It is also68
known that exchange of radiogenic isotopes between two co-eval magmas occurs69
much faster than element diffusion (Snyder and Tait, 1998; and references therein).70
This causes ambiguity in the study of consanguinity of coeval mafic and silicic melts71
and sources of mafic magmas.72
Type 2 composite dykes provide more reliable information on the chemical73
composition of coexisting magmas. The dykes are thought to form in shallow level74
plutonic or subvolcanic systems when basaltic melts ruptured a granitic magma75

ACC
EPTE
D M
ANU
SCR
IPT
ACCEPTED MANUSCRIPT
5
reservoir and injected country rocks forming dykes outside the reservoir; silicic76
magma flowed outward in the center of basaltic dyke prior to its complete77
solidification (Gibson and Walker, 1963; Kanaris-Sotiriou and Gill, 1985; Wiebe and78
Ulrich, 1997). Depending on the time interval between the two successive injections,79
contacts between felsic interiors and mafic margins vary from clearly gradational to80
abrupt. Abrupt contacts, common in many dykes, suggest that interaction of two81
magmas was inhibited due to the high extent of crystallization of the earlier mafic82
magma. In composite dykes with gradational contacts the initial composition of mafic83
rocks could be preserved at least in the outermost parts where the injected mafic melt84
solidified rapidly adjacent to cold country rocks.85
Composite dykes of type 2 are abundant in the northernmost part of the Arabian-86
Nubian shield (ANS), in particular in the Eastern Desert and Sinai (Egypt), in87
southwestern Jordan and in southern Israel (Stern and Voegeli, 1987, 1995; Beyth et88
al., 1994; Iacumin et al., 1998; Mushkin et al., 1999; 2003; Jarrar et al., 2004). These89
dykes are incorporated in bimodal basalt – rhyolite dyke suites forming dyke swarms90
up to tens of kilometers long. The felsic rocks are chemically referred to as typical A-91
type granite (Stern et al., 1988; Kessel et al., 1998; Mushkin et al., 2003). Dykes are92
shown to be genetically linked to bimodal volcanic suites of similar composition93
(Stern et al., 1988; Jarrar et al., 1992).94
Here we present new data on the structure, and the geochemical and isotope95
characteristics of the trachydolerite–quartz porphyry bimodal dyke suite in southern96
Israel including composite dykes both with abrupt and gradational contacts between97
felsic and mafic zones. Particular emphasis has been placed on the magma mixing98
process and its effect on the original chemical composition of the rocks. Comparison99
of oxygen and Sr isotope data suggests that the Rb-Sr isotope system had been100

ACC
EPTE
D M
ANU
SCR
IPT
ACCEPTED MANUSCRIPT
6
significantly disturbed by low-temperature water-rock interaction and, consequently,101
the measured 87Sr/86Sr ratios do not characterize the magmatic process. Despite102
having similar εNd(T) the felsic and mafic rocks are not cogenetic: δ18O values of103
zircon indicate significant contribution of upper crustal sources to the A-type rhyolite104
magma. .105
2. Geological setting106
The study was performed in the Elat area, the largest exposure of Precambrian107
basement in southern Israel. Along with the adjacent Amram and Timna exposures, as108
well as a number of outcrops in Jordan, the Elat area represents the northernmost edge109
of the ANS (Fig. 1, Inset). The shield formed during the Neoproterozoic (ca. 900–550110
Ma) as part of the East African Orogen by accretion of juvenile arc terranes. The111
accretion occurred at ~700 Ma (Stern, 1994 and references therein) and was followed112
by continental collision that resulted in magmatic thickening by intrusion of large113
calc-alkaline granitic batholiths (Stoeser and Camp, 1985). The batholitic stage (stage114
3 of Bentor, 1985) lasted from ~650 Ma until 620–610 Ma. The stage ended with115
regional uplifting and erosion at ~610–600 Ma and formation of molasse deposits116
(Garfunkel, 2000; Jarrar et al., 2003). Late Neoproterozoic crustal evolution (ca. 610–117
540 Ma) in the ANS occurred in an extensional tectonic environment (Stern and118
Hedge, 1985; Bentor and Eyal, 1987; Stern et al., 1988; Baer et al., 1994; Garfunkel,119
2000; Genna et al., 2002) and was accompanied by abundant igneous activity:120
emplacement of alkaline granitoids, eruption of bimodal volcanics, and intrusion of121
dyke swarms, also mostly bimodal (Stern et al., 1984; Stern and Gottfried, 1986;122
Beyth et al., 1994; Jarrar et al, 1992; 2004; Stein et al., 1997; Jarrar, 2001; Moghazi,123
2002).124
Figure 1125

ACC
EPTE
D M
ANU
SCR
IPT
ACCEPTED MANUSCRIPT
7
In southern Israel basement outcrops comprise metamorphic and magmatic rocks126
that represent all of the main stages of the ANS evolution (Bentor, 1985; Garfunkel et127
al., 2000). The Late Neoproterozoic stage included deposition of molasse (Elat128
conglomerate), formatiom of bimodal alkaline plutonic complexes (Timna and129
Amram complexes) and andesite–rhyolite volcanism (for geological map see130
Supplementary data, Fig. 1S).131
Four successive dyke episodes were widely exhibited in southern Israel during the132
second half of the Neoproterozoic, from ~ 615 Ma to 530 Ma (Katzir et al., in press):133
(1) Microdiorite and lamprophyre dyke suite; (2) Dacite porphyry with subordinate134
andesite and rhyolite porphyry; (3) Bimodal dyke suite, rhyolites with small amount135
of trachydolerite and intermediate rocks, mostly in composite dykes; (4) Dolerite,136
commonly high-Ti. Dyke episodes 1, 2 and 3 were separated in time by plutonic,137
volcanic and sedimentation events. The first two suites are timed to the very end of138
the batholitic stage; they are overlain by Elat conglomerate formed at ~600 Ma139
(Garfunkel, 2000). Dykes of the bimodal suite and the youngest dolerite dykes intrude140
all Neoproterozoic igneous and sedimentary rocks (Kessel et al., 1998; Beyth and141
Heimann, 1999; Katzir et al., in press).142
The bimodal dyke suite is the most abundant among the Neoproterozoic dykes in143
southern Israel (Fig. 1). The schematic map of the dykes was compiled based on aerial144
photograph interpretation; however, field observations showed that in a number of145
localities in central and northern Elat area the number of dykes is an order of146
magnitude higher. In the vicinity of Mt. Shelomo, within an area of about 1 by 2 km147
they constitute 50 to 80% of the total rock volume (Gutkin and Eyal, 1998). The148
general trend of the dykes is predominantly NS and changes gradually to N50oE in the149
northern part of the area. In the upper reaches of Wadi Shelomo two trends of dykes150

ACC
EPTE
D M
ANU
SCR
IPT
ACCEPTED MANUSCRIPT
8
are distinguished: N40oW and N30oE. The dykes are few hundred meters to 3 km151
long, commonly vertical and steeply dipping. Their thickness ranges from 1 to 30 m.152
In larger dykes, en echelon arrayed segments, commonly 0.5–1 km long, are153
observed. Felsic rocks, mostly quartz porphyry, are absolutely dominant in the suite.154
The proportion of mafic rocks in the bimodal suite in southern Israel is approximately155
5 vol.%. Trachydolerite and trachyandesite dykes are rare; instead, mafic rocks156
constitute margins in composite dykes that are part of the bimodal dyke suite. About a157
dozen of such dykes were found in the Elat area (Fig. 1), and several dykes were158
mapped immediately to the north, in the Amram and Timna exposures (Beyth et al.,159
1994; Mushkin et al., 1999). Along-strike tracing of some larger quartz porphyry160
dykes often reveals sections with mafic margins. For instance, in dyke #8 that extends161
over 2.5 km several sections with mafic margins of about 1 m wide and 100–600 m162
long were observed (Fig. 1). This suggests that the real number of composite dykes163
may be larger than the dozen mapped ones.164
The composite dykes are mostly subvertical, up to 2.5 km long and commonly 10165
to 20 m wide. The felsic interiors consist of homogeneous quartz porphyry, but in166
some dykes they are contaminated by mafic material. The dyke margins are made up167
of trachydolerite, trachyandesite, and trachydacite. In places the composition of the168
mafic rocks changes along strike from andesite to dacite. The proportion of mafic169
rocks in a composite dyke is generally ≤ 20%. Contacts between the felsic interiors170
and mafic margins are commonly abrupt, without obvious signs of magma-magma171
interaction, but also without evidence of chilling (Fig. 2A). In few dykes the contact is172
highly gradational with heterogeneous mixing between the mafic and silicic magmas173
(Fig. 2B); in some dykes abrupt contact changes along strike to gradational, then back174
to abrupt (dyke #1 in Fig. 1).175

ACC
EPTE
D M
ANU
SCR
IPT
ACCEPTED MANUSCRIPT
9
Figure 2176Evidence of commingling and mixing of basaltic and rhyolitic magmas is177
pictorially manifested in the composite Netafim dyke #2 located in the upper reaches178
of Wadi Netafim (Fig 2B). Its thickness ranges from about 7 to 12 m including179
trachydolerite margins of 0.4–0.9 m wide. The contact between the quartz porphyry180
interior and trachydolerite margins is gradational, with two symmetrical transitional181
zones of about 30–50 cm in width. The transitional zones, in turn, are divided into two182
subzones. In the section adjacent to the quartz porphyry, the color of the rock183
progressively changes from brick red to reddish gray and has trachydacitic184
composition. In the section adjacent to the mafic margin the hybrid rock has dark185
reddish green color and trachyandesitic composition. A blurred transition zone186
between the hybrid trachydacite and trachyandesite can be easily traced for a distance187
of several tens of meters throughout the outcrop. Quartz porphyry of the interior of the188
Netafim dyke contains numerous, but unevenly distributed fine-grained, oval, rounded189
and irregular MME (Inset in Fig. 2B). Enclaves range from few millimeters to 20–25190
cm across and have crenulate, sinuous, lobate and convex outlines. The curved shape191
of some enclaves points to plastic and ductile deformation. Also small mafic schlieren192
are fairly common throughout the quartz porphyry. This shows that the central zone of193
the Netafim dyke shares some traits of Type 1 composite dykes.194
Figure 3195The stratigraphic position and age of the bimodal dyke suite is constrained by field196
relations: dykes intrude all Late Neoproterozoic plutonic, volcanic and sedimentary197
rock units, including a volcanic suite made up of alkaline rhyolite and andesite198
(Mushkin et al., 2003). In turn, they are intersected by dolerite dykes dated to 531 ± 5199
Ma in the Timna area (40Ar/39Ar; Beyth and Heimann, 1999), and to 545 ± 13 Ma in200

ACC
EPTE
D M
ANU
SCR
IPT
ACCEPTED MANUSCRIPT
10
southwestern Jordan (K-Ar; Jarrar, 2001). The dated dolerite dyke from Timna is201
overlain by Early Cambrian sandstone (Beyth and Heimann, 1999).202
Recent U-Pb dating of zircon grains of quartz porphyry and trachydolerite from203
composite dyke #2 (Fig. 2B) yielded ages of 592.7 ± 6 Ma and 593.7 ± 8.4 Ma,204
respectively, which are consistent with the magmas being coeval. (Y. Beeri; in situ205
ion probe analysis in the NORDSIM Facility, Swedish Museum of National History,206
Stockholm). The analytical procedures and results will be described in detail in a207
special paper. The U-Pb zircon ages are similar to a Rb-Sr whole rock age of Late208
Neoproterozoic bimodal swarm and composite dykes in the Northeastern Desert and209
Sinai Peninsula, Egypt (Stern and Hedge, 1985; Stern and Voegeli, 1987, 1995).210
The 593 Ma U-Pb age of the bimodal dyke suite is in conflict with an age estimate211
for volcanic rhyolites in southern Israel, 550 Ma, which is based on a Rb-Sr isochron212
(Bielski, 1982). Our study of rhyolites from the localities sampled by Bielski (Moon213
Valley, northern Ramat-Yotam caldera, Amram area) showed that ultra-K rhyolites214
with K2O content ranging from 8 to 10 wt.% are widespread in these areas. The highly215
unusual composition of the rocks was attributed to extensive metasomatic alteration216
that resulted in dramatic increase of potassium on the expense of sodium (Agron and217
Bentor, 1981). Below, in section 7.4, significant disturbance of the Rb-Sr system,218
even in rhyolite dykes with minimal evidence of metasomatic alteration, is219
demonstrated. Therefore Rb-Sr dating of volcanic rhyolite in southern Israel is highly220
debatable. Since the dykes from the bimodal suites are considered as feeders for221
volcanics (Stern et al., 1988; Jarrar et al., 1992; Mushkin et al., 1999), the latter222
cannot be much older than the dyke rocks.223
3. Analytical methods224
ACC
EPTE
D M
ANU
SCR
IPT
ACCEPTED MANUSCRIPT
11
Whole-rock chemical analyses were performed using a combination of wet225
chemical methods, atomic absorption spectroscopy and titration (major elements), and226
X-ray fluorescence (Rb, Sr, Ba, Y, Zr and Nb) at the Geological Institute, Siberian227
Division of the Russian Academy of Sciences, Ulan-Ude. Rare earth and some228
selected trace elements (Hf, Ta, Th, U, Ga, V, Cu, Pb, Zn, Sc and Cs) were analyzed229
by the ICP-MS method at the National Taiwan University, Taipei and at the Institute230
of Mineralogy and Geochemistry of Rare Elements, Moscow. Analyses are231
considered accurate to within 2–5% for major elements, and better than 10–15% for232
trace elements. The accuracy for all the REE (except Lu) is 1–5%; for Lu, it is 9–10%.233
Electron microprobe mineral analyses were carried out using a modernized four-234
channel MAR-3 electron probe microanalyser at the Geological Institute, Ulan-Ude.235
Analyses were obtained with a beam of 2–3 μm. Operating conditions were 20 kV, 40236
μA beam current, and a counting time of 10 s. The detection limits are 0.05–0.09237
wt.% for Na2O, MgO, Al2O3, and SiO2; 0.01–0.05 wt.% for K2O, CaO, TiO2, MnO238
and FeO.239
For oxygen isotope analysis high purity mineral separates were hand picked from240
crushed and sieved rock samples. Zircon (2.5-3.5 mg per analysis) was separated from241
the 63-200 μm size fraction using standard methods including Wilfley shaking table,242
Frantz magnetic separator and heavy liquids. Zircon concentrates were treated with a243
series of cold acids to remove potential contaminants. Purity of zircon separates was244
ensured by hand picking. Oxygen isotope analysis of minerals and whole-rock245
samples was performed using the laser fluorination technique at the University of246
Wisconsin – Madison (Valley et al., 1995). BrF5 was used as the reagent. Oxygen was247
purified cryogenically and with an inline Hg diffusion pump, converted to CO2 using a248
hot graphite rod, and analyzed on a Finnigan MAT 251 mass spectrometer. Quartz249

ACC
EPTE
D M
ANU
SCR
IPT
ACCEPTED MANUSCRIPT
12
separates (1 to 1.5 mg per analysis) were analyzed using the rapid heating, defocused250
beam technique (Spicuzza et al., 1998a). Plagioclase and alkali feldspar separates and251
whole rock powders, which might react appreciably with BrF5 at room temperature,252
were analyzed (2 to 2.5 mg per analysis) using an ‘air-lock’ sample chamber, which253
allows fluorination of each sample individually (Spicuzza et al., 1998b). The long-254
term reproducibilities for conventionally lased samples and for samples lased in the255
‘air-lock’ chamber in the UW isotope lab are 0.1 and 0.2‰, respectively. On each256
day of analysis at least four aliquots of UW Gore Mountain Garnet standard (UWG-2)257
were analyzed. The overall average for 29 analyses on six days of conventionally258
lased UWG-2 in this study is 5.59 ± 0.13‰. UWG-2 analyzed using the ‘air lock’259
chamber averaged at 5.57 ± 0.18‰ (n = 36). Data for each day of analysis were260
adjusted by an average of 0.21‰ (0.23‰ for ‘air-lock’ analysis days), determined by261
the difference between each day’s UWG-2 value and 5.8‰, the accepted δ18O262
(SMOW) value of UWG-2 (Valley et al., 1995).263
Rb-Sr and Sm–Nd isotope analyses. Sr and Nd isotopic ratios were measured264
using a Finnigan MAT-262 thermal ionization mass spectrometer at the Institute of265
Earth Sciences (IES), Academia Sinica, Taipei. Concentrations of Rb, Sr, Sm and Nd266
were determined by ICP-MS using an Agilent 7500s spectrometer at the National267
Taiwan University. For concentration determination, fused glass beads were268
powdered and dissolved in HF/HNO3 (1:1) mixture in capped Savilex beakers for >2h269
at ca. 100 °C, followed by evaporation to dryness, then refluxing in 7N HNO3 for270
>12h at ca. 100 °C, and finally, diluting the sample solution by 2% HNO3. An internal271
standard solution of 5 ppb Rh and Bi was added and the spiked solution was further272
diluted 2000 times with 2% HNO3 before ICP-MS analysis. The internal standard was273
used for monitoring the signal shift during the measurement. The analytical precision274

ACC
EPTE
D M
ANU
SCR
IPT
ACCEPTED MANUSCRIPT
13
was about ± 3% (2σ). Sr and Nd isotopic compositions were analyzed on unspiked275
samples. Powdered samples were dissolved in Savilex bombs and followed by a series276
of standard procedures until samples were completely dissolved. Isolation of Sr and277
Nd were achieved using a 2-column technique, and Sr fractions were occasionally278
further purified using a third column. The first column was packed with 2.5 ml cation279
exchange resin (Bio-Rad AG50W-X8, 100-200 mesh) and was used to collect Sr and280
REE fractions. The second column used for Sr purification was packed with 1 ml281
cation exchange resin, identical to the above. The second column used for Nd282
isolation was packed with 1 ml Ln-B25-A (Eichron) resin, which was covered283
on top by a thin layer of anion exchange resin (Bio-Rad AG1-X8, 200-400 mesh).284
Mass analyses were performed using a 7-collector Finnigan MAT-262 mass285
spectrometer in dynamic mode. 143Nd/144Nd ratios were normalized against the value286
of 146Nd/144Nd = 0.7219, whereas 87Sr/86Sr ratios were normalized to 86Sr/88Sr =287
0.1194. During the course of analyses, measurements on NBS-987 Sr standard yielded288
87Sr/86Sr = 0.710320 ± 0.000036 (n = 50) using static mode); and = 0.710237 ±289
0.000020 (n = 8) using dynamic mode. The 87Sr/86Sr ratios reported herein (Table 5)290
have been duly adjusted to NBS-987 = 0.710250. Our measurements on La Jolla Nd291
standard yielded 0.511864 ± 0.000006 (n = 4), and on JMC Nd standard, 0.511821 ±292
0.000016 (n = 6). The one-stage model age (TDM-1) is calculated assuming a linear Nd293
isotopic growth of the depleted mantle reservoir from εNd(T) = 0 at 4.56 Ga to +10 at294
the present time.295
TDM-1 = 1 / λ ln[(143Nd/144Nd)s - 0.51315] / [(147Sm/144Nd)s - 0.2137]),296
where s = sample, λ = decay constant of 147Sm (0.00654 Ga-1)297

ACC
EPTE
D M
ANU
SCR
IPT
ACCEPTED MANUSCRIPT
14
The two-stage model age (TDM-2) is obtained assuming that the protolith of the298
granitic magmas has a Sm/Nd ratio (or fSm/Nd value) of the average continental crust299
(Keto and Jacobsen, 1987)300
TDM-2 = TDM1 - (TDM1 - t)(fcc - fs)/(fcc - fDM),301
where fcc, fs, fDM = fSm/Nd are values of the average continental crust, the sample302
and the depleted mantle, respectively. In our calculation, fcc = -0.4 and fDM = 0.08592303
are used, and t = the intrusive age of granite.304
4. Petrography305
Quartz porphyry and subordinate feldspathic rhyolite porphyry are grayish pink306
and brick red homogeneous porphyritic rocks, with very fine-grained and307
microcrystalline matrix. Phenocrysts of quartz, K-rich alkali feldspar and rare albite308
constitute up to 10 vol.%; in rhyolite porphyry quartz phenocrysts are absent. In rocks309
that contain mafic schlieren and microgranular enclaves some alkali feldspar310
phenocrysts are zoned: thin brown rim enriched in albitic component is clearly311
distinguished (Supplementary data, Table 1S). The matrix of microgranophyric,312
cryptocrystalline and spherulitic texture is made up mainly of the same minerals as the313
phenocrysts; flakes of biotite and needles of iron oxides are evenly scattered.314
Accessories are zircon and apatite. The felsic dyke rocks are noticeably altered: biotite315
is almost completely replaced by hematite and chlorite, alkali feldspar phenocrysts are316
turbid, reddish brown, and spotty, and in the matrix alkali feldspar is partly replaced317
by clay minerals.318
Trachydolerite is a dark gray, very fine-grained rock of porphyritic texture.319
Phenocrysts (3 to 5 vol.%) are elongated prisms of unzoned plagioclase (An52–54,320
Table 1S) and subhedral crystals of augite enriched in Mg and Ca (Table 2S). The321
matrix is intragranular: wedge-shaped interstices between plagioclase laths (An41) are322

ACC
EPTE
D M
ANU
SCR
IPT
ACCEPTED MANUSCRIPT
15
occupied by augite and Fe-Ti oxides. Interstitial alkali feldspar is a subordinate323
mineral (Table 1S). Other interstices are filled with hypocrystalline aggregates of324
chlorite. Apatite is a common accessory mineral. The rock is considerably affected by325
alteration as indicated by the abundance of secondary chlorite, actinolite, carbonate,326
epidote and albite and by extensive sericitization of plagioclase.327
Trachyandesite and trachydacite commonly bear evidence of hybrid origin. The328
hybrid rocks were studied in detail in the Netafim dyke #2 that shows gradational329
contacts between the felsic interior and mafic margins (‘Geological setting’). The330
reddish gray trachydacite adjacent to the felsic interior has textural features and331
phenocryst population characteristic of quartz porphyry: euhedral quartz and alkali332
feldspar including grains with brown peripheral zones (Table 1S, samples A197-7 and333
A197-4). However, rare elongated plagioclase prisms, similar in shape to those in the334
trachydolerite, also occur. In the matrix, along with quartz and K-rich alkali feldspar,335
tiny plagioclase laths are observed.336
The trachyandesite from the transitional zone is texturally similar to the adjacent337
trachydolerite, but along with andesine and augite phenocrysts (Tables 1S and 2S),338
xenocrysts of quartz and alkali feldspar are present. Alkali feldspars mostly occur as339
shapeless, heavily corroded relics. Quartz is commonly rimmed by pyroxene, which is340
compositionally distinct from magmatic augite (Table 2S, sample 197-5, phenocryst341
and rim). The matrix contains plagioclase (An28) and augite, with irregular grains of342
quartz and alkali feldspar. Their amount increases systematically towards the343
trachydacite subzone.344
Trachyandesite and trachydacite making up marginal zones in composite dikes345
with abrupt contacts are often heterogenous. This is exhibited by the irregular346
variations of mafic and felsic mineral proportions at a distance of <1 m and by the347

ACC
EPTE
D M
ANU
SCR
IPT
ACCEPTED MANUSCRIPT
16
occurrence of xenocrysts. Less common is homogenous trachyandesite that is similar348
in appearance and texture to trachydolerite.349
5. Geochemistry350
The geochemical data set contains 70 analyses. Of these, 26 samples were351
analyzed for rare earth elements (REE). Data for representative samples are given in352
tables 1–3, and sampling localities are shown in Fig. 1. A full set of chemical data353
with sample localities is given in the online version of the Supplementary data (Table354
3S, Fig. 2S).355
Table 1, Table 2, Table 3356Quartz porphyry. The chemical composition of quartz porphyry varies widely both357
in simple (non-composite) and composite dykes. In particular, silica content ranges358
from 68.6 to 78.4 wt.% (Fig. 3, Table 1). However, in the majority of samples from359
simple dykes the range is narrow extending from 76 to 77.5 wt.% SiO2. By contrast,360
quartz porphyry making up the interiors of composite dykes is often less silica rich,361
with SiO2 ≤ 74 wt.%. Decreased SiO2 content in felsic rocks is characteristic of362
varieties with clear textural and mineralogical evidence of contamination by mafic363
material (mafic enclaves and schlieren, plagioclase xenocrysts, alkali feldspar364
phenocrysts with brownish outer zones enriched in albite molecule). Contamination365
explains not only the SiO2-depletion, but also the enrichments in MgO, FeO, CaO and366
related trace elements (Fig. 3) and the less pronounced negative Eu anomaly (Figs. 4A367
and 4B). In simple quartz porphyry dykes visible evidence of contamination is rare.368
However, the compositional similarity between homogenous silica-depleted quartz369
porphyry from simple dykes and undoubtedly contaminated rocks from composite370
dykes suggests that these dykes also crystallized from hybridized rhyolite magma. In371

ACC
EPTE
D M
ANU
SCR
IPT
ACCEPTED MANUSCRIPT
17
Fig. 3 the border between “pure” and contaminated quartz porphyries is shown by372
convention at 74–75 wt.% SiO2.373
Figure 4, Figure 5374Uncontaminated (‘pure’) quartz porphyry corresponds chemically to alkaline375
granite (Figs. 5A and 5B) with agpaitic index of [Na+K]/Al >0.9, and K2O (4.2–5.4376
wt.%) dominating over Na2O (Table 1). In the standard classification diagram (Marian377
and Piccoli, 1989) rock compositions occupy a small field straddling the border378
between metaluminous and peraluminous granites (not shown). Quartz porphyry379
exhibits geochemical traits of A-type granite (Fig. 5C) formed in a within-plate380
environment (Fig. 5D). Major and trace element contents vary within narrow limits:381
the total content of MgO, CaO and TiO2 is less than 1 wt.% and FeOt = 1.5–2.6 wt.%382
(Fig. 3). Average Zr and Y contents are fairly high, 570 and 69 ppm, respectively,383
whereas Sr content is low, 13–72 ppm (Tables 1 and 2, Figs. 3 and 5C). ΣREE384
averages 180 ppm, chondrite-normalized REE patterns are flat (Lan/Ybn is about 3)385
and negative Eu anomaly is well pronounced, with Eu/Eu* value of 0.05–0.07 (Tables386
1 and 2; Fig. 4A).387
Figure 6388Trachydolerite contains 47–53 wt.% SiO2. It is low-Al (Al2O3 = 14.7–15.3 wt.%)389
and low-Mg (Mg# = 40–55) with decreased CaO (3.2–6.3 wt.%). It is characterized390
by high contents of Ba = 660 to 940 ppm, Zr = 210 to 318 ppm, and Y = 26 to 47 ppm391
(Table 2). Trachydolerites are classified according to their TiO2 content to moderate-392
Ti and high-Ti varieties, with 1.7–1.8 and 2.8–2.9 wt.% TiO2, respectively. The two393
groups are similar in many geochemical features, but the high-Ti rock is richer in394
FeOt, HFSE (P, Zr,Y) and REE (Table 2). The REE patterns of both subgroups are395

ACC
EPTE
D M
ANU
SCR
IPT
ACCEPTED MANUSCRIPT
18
gently dipping and almost parallel (Fig. 6C) with Lan/Ybn ≈ 8 and Eu/Eu* ≈ 0.85396
(Table 2).397
Figure 7398The high proportion of secondary minerals (chlorite, actinolite, sericite, carbonate,399
hematite) even in the least altered samples suggests that the observed contents of400
alkalis and other mobile elements might not correspond to the original magmatic401
values. Therefore classification diagrams based on immobile trace elements are used.402
In the Nb/Y vs Zr/TiO2 diagram (Fig. 6A) compositions of both moderate-Ti and403
high-Ti trachydolerites plot in the field of subalkaline basalt. In the Zr–Ti–Y404
geotectonic classification diagram (Fig. 6B) all data points plot in the field of within-405
plate basalts.406
Rocks of intermediate composition forming mafic margins with abrupt contacts in407
composite dykes and rare simple mafic dykes plot in the field of andesite and dacite in408
the Nb/Y vs Zr/TiO2 classification diagram (Fig. 6A). The chemical affinities of the409
intermediate rocks are described below, in the discussion that concerns the interaction410
between coeval silicic and mafic magmas.411
6. Stable and radiogenic isotope ratios412
6.1. Oxygen isotopes413
Oxygen isotope ratios were measured in rock-forming minerals from felsic and414
mafic rocks (quartz, alkali feldspar, plagioclase, augite) and in zircon from the quartz415
porphyry (Table 4; Fig. 7). The whole-rock δ18O values that were measured in416
samples analyzed for radiogenic isotopes are listed in Table 5.417
Figure 8, Table 4418
In a trachydolerite from a composite dyke the δ18O of clinopyroxene is 5.78‰419
(Fig. 7), which is within the δ18O range of clinopyroxene in the mantle (Mattey et al.,420

ACC
EPTE
D M
ANU
SCR
IPT
ACCEPTED MANUSCRIPT
19
1994a) and is similar to the δ18O(Cpx) of modern basalts from the Taupo volcanic421
zone (New Zealand) erupted through the continental crust (Macpherson et al., 1998).422
This suggests that the oxygen isotope ratio of clinopyroxene from the trachydolerite423
was not modified after the initial isotope equilibrium with the mantle source rock.424
Notwithstanding, plagioclase of the trachydolerite has a non-magmatic high δ18O425
value of about 11‰ (Fig. 7). Similar values are also characteristic of plagioclase in426
mafic rocks from earlier dyke suites (Fig. 7). Experimentally calibrated plagioclase–427
clinopyroxene isotope fractionations at temperatures of crystallization of basaltic428
melts (1100–1200 ˚C) are ≤ 0.7‰ (Chiba et al., 1989). Oxygen isotope ratios of429
plagioclase from recently erupted oceanic arc lavas range from 5.6 to 5.9‰ (Eiler et430
al., 2000). Likewise δ18O(Pl) of historic subaerial alkaline basalt from the Lanai431
volcano, Hawaii is 6.08‰ (Eiler et al., 1996). Thus, the δ18O values of plagioclase in432
the Elat mafic dykes are 4 to 5‰ higher than their original magmatic equilibrium433
values.434
Oxygen isotope ratios of zircon in quartz porphyry from composite dykes and from435
a subvolcanic stock range from 6.45 to 7.23‰. These values are significantly higher436
than δ18O of mantle zircon: 5.3 ± 0.6‰ (2σ; Valley, 2003). Since zircon is the best437
preserver of initial magmatic values (Valley et al., 1994; Page et al., 2006) the438
relatively high δ18O(Zrn) of quartz porphyry suggests contribution of upper crustal439
sources to the rhyolite magma. This stands in contrast to the mantle δ18O of440
clinopyroxene from the trachydolerite and suggests variable sources for the coexisting441
magmas.442
In 11 samples collected from different quartz porphyry dykes, the δ18O values of443
quartz range from 8.30 to 9.70‰ (Table 4; Fig. 7). The measured Δ18O(Qtz-Zrn), 2.15444
to 2.61‰, does not differ markedly from the predicted magmatic quartz-zircon445

ACC
EPTE
D M
ANU
SCR
IPT
ACCEPTED MANUSCRIPT
20
isotope fractionation, 2.3‰ at T = 800 ˚C (Valley et al., 2003). This attests that in446
most dykes quartz was subjected to only minor modification of the magmatic δ18O447
during post-crystallization cooling.448
In contrast to the rather limited variation in oxygen isotope ratios of quartz449
(~1.4‰, n = 10), the δ18O values of alkali feldspar range from 10.67 to 15.45‰. The450
Δ18O (Qtz–Afs) values are always negative (reversed) and range mostly from –4 to –451
6‰ (Table 5; Fig. 13), which is far from the experimentally determined magmatic452
equilibrium fractionation of +1‰ at 700 ˚C (Clayton et al., 1989). Thus, the δ18O453
values for alkali feldspar in quartz porphyry were extremely elevated by a post-454
magmatic process.455
Whole-rock samples from felsic and mafic rocks (Table 5) are characterized by456
high δ18O values, commonly >10‰, mostly affected by the elevated δ18O values of457
feldspars, which are the most modally abundant phase in both groups and most readily458
exchange oxygen during sub-solidus alteration. The whole-rock oxygen isotope data459
are discussed in the next section.460
6.2. Radiogenic isotope ratios461
Rb-Sr and Sm-Nd data for 12 whole-rock samples including silicic and mafic462
dyke rocks are given in Table 5. For comparison, isotope data for the Katharina ring463
complex, which is made up of Late Pan-African A-type granite and related ring dyke464
rocks (Eyal and Herzkiyahu, 1980; Katzir et al., 2006), are also presented in Table 5.465
Table 5466The calculated initial 87Sr/86Sr ratios (= I(Sr) at 590 Ma) range from ca. 0.704467
(trachydolerite A196-1) to ca. 0.737 (quartz porphyry, A-30). The I(Sr) values in468
felsic rocks are not only high, but also extremely variable, ranging from 0.71253 to469

ACC
EPTE
D M
ANU
SCR
IPT
ACCEPTED MANUSCRIPT
21
0.73648 (Table 5), which precludes calculation of an isochron and suggests470
postmagmatic disturbance of the Rb-Sr system.471
Figure 9472The Sm-Nd isotopic data seem to provide much more coherent information about473
the petrogenesis of the dyke rocks. The initial 143Nd/144Nd ratios, expressed as εNd(T)474
values do not correlate with the initial Sr values (Fig. 8). They are fairly uniform and475
range from +0.9 to +3.3. Given the analytical error of ±0.5 ε-unit, there is no476
systematic and significant difference between εNd(T) values of felsic and mafic dyke477
rocks. However, the range of εNd(T) values is clearly lower than that of the Katharina478
Complex (+3.6 to + 5.5). The difference is also reflected by the oxygen isotope data479
(see Table 5, last column) to be presented below. The Sm-Nd model ages, calculated480
for felsic rocks with a two-stage model, range from ca. 1000 to 1100 Ma. This range481
is rather similar to that of the Katharina Complex. Comparatively young model ages482
are characteristic of most Precambrian rocks throughout the Arabian-Nubian shield483
supporting the idea of juvenile Neoproterozoic continental crust in the shield (Stein484
and Goldstein, 1996).485
7. Discussion486
7.1. Effect of alteration on the original chemical composition of the dyke rocks487
The abundance of secondary minerals and the significant elevation of the oxygen488
isotope ratios of feldspar even in the seemingly least altered felsic and mafic rocks489
indicate that the dyke rocks were subjected to rather extensive alteration. Also the490
calculated whole-rock (87Sr/86Sr)0 values for 590 Ma in quartz porphyry and rhyolite491
porphyry are unusually high and vary over a wide range. The Rb-Sr isotope data do492
not allow calculating an isochron. This raises the question of how well the original493
chemical composition of the dyke rocks has been preserved under conditions of494

ACC
EPTE
D M
ANU
SCR
IPT
ACCEPTED MANUSCRIPT
22
postmagmatic alteration. We approached this problem by comparing quartz porphyry495
and trachydolerite from southern Israel to similar rock types from adjacent regions,496
the Northeastern Desert, Egypt and southwestern Jordan. According to Stern et al.497
(1988) and Jarrar et al. (2004), these rocks have been subjected to rather mild498
alteration that did not prevent dating them by the Rb-Sr method. Unfortunately, there499
is not a single key area in which both felsic and mafic rocks can be used for500
comparison as reference rocks. In particular, in southwestern Jordan the rhyolite from501
composite dykes is chemically uniform and contains 75–77 wt.% SiO2, but mafic502
margins are made up of hybrid latite (Jarrar et al., 2004). In the Northeastern Desert503
dolerite is abundant in the bimodal dyke swarm, whereas rhyolite is characterized by504
wide range of SiO2, from 69 wt.% to 77 wt.%, and the origin of low-SiO2 rhyolite is505
debatable (Stern et al., 1988). For this reason we have chosen the dolerite from the506
Northeastern Desert and rhyolite from southwestern Jordan as reference rocks for507
normalization. A comparison of normalized average volatile-free compositions of508
felsic rocks with ≥ 75 wt.% SiO2 and mafic rocks with 49–56 wt.% SiO2 (Table 2;509
supplementary data, Table 4A) is presented by spidergrams (Fig. 9).510
Figure 9511The patterns in Fig. 9A show that within one standard deviation the felsic rocks512
from all three regions are fairly similar in Th, Y, La, Sm, Gd and in the mobile LIL513
element contents (Rb, K, and Na). Rhyolites from southern Israel and the514
Northeastern Desert, as compared to felsic rocks from southwestern Jordan, are richer515
in Nb, Zr, Ce, Yb and poorer in Sr. This points to their more alkaline character and516
suggests that the observed chemical distinctions are caused by original compositional517
features of the silicic magmas in the different regions rather than by migration of518

ACC
EPTE
D M
ANU
SCR
IPT
ACCEPTED MANUSCRIPT
23
elements in the process of alteration. It is thus concluded that the initial igneous519
composition of the felsic dyke rocks is sufficiently well preserved.520
Chemical data for mafic rocks are compared in Fig. 9B. The plot shows that the521
chemical compositions of trachydolerite from southern Israel and of mafic rocks from522
the bimodal dyke suite in Egypt are essentially similar. The main distinction is the523
higher K and Rb contents of the S. Israel rocks. It is conceivable that the K and Rb524
enrichment was partly caused by metasomatic alteration (Agron and Bentor, 1981;525
Wachendorf et al., 1985). The original concentration of these elements cannot be526
quantitatively assessed. We assume that it is comparable to that of the mafic dykes527
from the Northeastern Desert, namely about 2 wt.% K2O and ~ 50 ppm Rb.528
7.2. Interaction of mafic and silicic magma529
Field, petrographic and chemical data indicate that interaction between mafic and530
silicic magmas occurred during the formation of the bimodal dyke suite. Interaction531
occurred both in situ, in the process of composite dyke formation, and at greater depth532
from which hybrid magmas were injected to the subsurface level.533
The most graphic example of in situ interaction between rhyolite and basalt534
magmas is the Netafim dyke #2 (Fig. 10). Symmetric structure and gradational535
contacts between felsic interior and mafic margins show that the injection of silicic536
magma occurred when part of the basic melt had not yet solidified. The phenocryst537
assemblages in the trachydacite and trachyandesite from the transitional zone were538
derived from both end-member magmas. This points to mutual penetration of two539
adjacent partially crystallized magmas that already contained phenocrysts.540
Variation of rock chemistry across dyke #2 is shown in Table 3 and in a set of541
diagrams (Fig. 10). Both major and selected trace elements (except Ba) demonstrate542
symmetrical and regular change from quartz porphyry through the hybrid trachydacite543

ACC
EPTE
D M
ANU
SCR
IPT
ACCEPTED MANUSCRIPT
24
and trachyandesite to trachydolerite. The only noticeable discrepancy in the544
distribution of Na2O, K2O, and Rb is seen in one sample from quartz porphyry545
(sample 8) that contains small mafic schlieren. Progressing from quartz porphyry to546
trachydolerite, REE contents decrease and Eu/Eu* increases systematically as547
expected in mixing of silicic and mafic end members (Fig. 11).548
Figure 10, Figure 11549In a series of silica variation diagrams (Fig. 12) the data points are mostly550
arranged along straight regression lines connecting end-members, with R-values close551
to unity. The scattering in the Ba and Rb data possibly stems from fast chemical552
diffusion superimposed on bulk mixing. Thus, chemical data are in a good553
consistency with structural and petrographic evidence indicating that the main process554
responsible for the formation of the hybrid rocks in the composite dyke #2 was555
magma mixing.556
Figure 12557 Mass balance calculations performed for major and trace elements show that the558
trachyandesite could form by mixing of the basalt and rhyolite components in559
proportions of 57% and 43% respectively, whereas for trachydacite the proportions560
are 20.5% and 79.5%, respectively (Table 6, calculated using program Igpet for561
Windows, 1994).562
Table 6563Composite dykes with gradational contacts like composite dyke #2 are not564
common in the Elat area. Actually, dykes with abrupt contacts are dominant and in565
many of them the mafic margins are made up of trachyandesite and trachydacite. In566
places these rocks make up simple dykes. The intermediate rocks are often567
heterogeneous and contain xenocrysts of quartz, K-feldspar and plagioclase with568
sieve-like texture. These features show that magma mixing was important in the569

ACC
EPTE
D M
ANU
SCR
IPT
ACCEPTED MANUSCRIPT
25
genesis of the intermediate rocks. Abrupt contacts in composite dykes attest that570
hybrid magmas were produced mainly at greater depth prior to emplacement.571
Chemical compositions of intermediate rocks are plotted in binary diagrams (Fig. 12)572
and show rather restricted similarity with the in situ produced hybrid rocks from the573
Netafim dyke. Only less mobile major elements tend to be arranged close to the574
mixing lines. Elements with high diffusivity, K2O and Rb, demonstrate large scatter,575
which points to the great role of diffusive exchange between co-existing magmas576
(Zorpi et al., 1991; Poli and Tommazini, 1991; Litvinovsky et al., 1995b). The577
distinctions in other trace elements are more significant. Intermediate rocks are clearly578
divided into two groups with different Sr, Ba, Zr, Nb, and Y concentrations, and579
neither of them is similar to the in situ formed hybrid rocks (Fig. 12, Tables 1 and 2;580
Table 3S, supplementary data). It is likely that magma mixing processes had not been581
frozen at the initial stage as it occurred in the Netafim dyke. At greater depth mixing582
could have progressed to much higher extent and may have been followed by583
fractional crystallization and assimilation. Some variations in the end-member584
compositions are also possible.585
7.3. Oxygen isotope evidence of late alteration of dyke rocks586
Initial magmatic 18O/16O ratios have been retained only in two minerals from the587
dyke rocks: zircon in felsic rocks and clinopyroxene in trachydolerite. The relatively588
small variation in δ18O(Qtz) and the magmatic-like Δ18O(Qtz-Zrn) in the dykes589
indicate that the oxygen isotope ratio of quartz was only slightly modified after590
crystallization (Fig. 7). However, the magmatic δ18O values of feldspars were591
significantly altered. Isotope ratios of quartz and alkali-feldspar from quartz porphyry592
dykes are presented in a δ-δ diagram (Fig. 13). For comparison, isotope data on593
alkaline granites from southern Israel and Sinai Peninsula (the Katharina ring594

ACC
EPTE
D M
ANU
SCR
IPT
ACCEPTED MANUSCRIPT
26
complex) are also shown (the data are compiled in Table 7). The δ18O values for595
quartz in each rock unit is almost uniform, while δ18O(Afs) is highly variable thus596
forming well-defined, narrow and vertically elongated arrays in the plot. A notable597
difference between granites and dykes is clearly exhibited: Δ18O (Qtz–Afs) in quartz598
porphyries are always negative and range mostly from –2 to –6‰, whereas in the599
granites these values vary from –0.7 to –2.0‰. Measured quartz-alkali feldspar600
isotope fractionations in fresh granites worldwide are typically about +1 to +1.5 ‰601
(Criss and Taylor, 1983). These are slightly larger than the experimentally determined602
equilibrium Δ18O(Qtz–Ab) at 800 ˚C (0.8‰; Clayton et al., 1989) and probably reflect603
inter-mineral subsolidus oxygen exchange during cooling. It follows that the604
magmatic 18O/16O ratio of feldspar was elevated by exchange with external reservoir605
both in plutonic and dyke rocks, but in the latter the elevation was extreme (up to606
8‰).607
Figure 13608Quartz is much more resistant than feldspar to hydrothermal 18O/16O exchange.609
The preservation of magmatic δ18O values in quartz on the one hand and the marked610
increase in δ18O(Afs) on the other hand indicate that dykes experienced intense water-611
rock interaction. However, high-temperature (250–500 ˚C) hydrothermal alteration by612
circulating meteoric water heated by a cooling pluton, which is indicated in many613
shallow intrusions (e.g., Criss and Taylor, 1983), can be ruled out. Oxygen exchange614
with hot meteoric water would instead appreciably decrease the isotopic ratio of615
feldspar relative to quartz to form highly positive quartz–alkali feldspar fractionations616
(Criss and Taylor, 1983, 1986). A simple closed-system, water-rock exchange model617
indicates that the observed high δ18O values of feldspar in the felsic dykes (+11 to618
+16‰) require very low temperatures of alteration (≤ 100 ˚C), if it occurred by619

ACC
EPTE
D M
ANU
SCR
IPT
ACCEPTED MANUSCRIPT
27
exchange with typical meteoric water of δ18O(H2O) = –5 to –15‰ (Wenner and620
Taylor, 1976).621
Low-temperature alteration of quartz porphyry is also indicated by extensive622
reddening and turbidization of alkali feldspar. Likewise, plagioclase in the mafic623
dykes is commonly sericitized, turbid and characterized by significant loss of Ca,624
culminating in almost complete albitization of labradorite-andesine (Litvinovsky et625
al., in press). Therefore the 4 to 5‰ elevation of δ18O (Pl) relative to its inferred626
magmatic ratios (Fig. 7) could also have occurred by low-temperature interaction with627
meteoric water. Alternatively, higher temperature alteration should involve unusually628
18O/16O-rich waters. High temperature (~250 ˚C) interaction with high-δ18O brines629
(+3‰) was suggested to account for the moderately negative Δ18O (Qtz–Pl) (–1 to –630
1.4‰) measured in Timna mafic and felsic plutonic rocks (Beyth et al., 1997). The631
hydrothermal activity presumably responsible for the 18O/16O enrichments in the632
Timna igneous complex was attributed to circulation of brines through fractures633
related to the Dead Sea transform (Beyth et al., 1997; Matthews et al., 1999). The634
alleged timing of the hydrothermal event was largely based on the chemical remanent635
magnetization of Miocene age measured in the Timna igneous rocks (Marco et al.,636
1993). Here we show that postmagmatic 18O/16O elevations in feldspars, and637
consequently in whole rocks, are not restricted to the Timna area, but characterize638
dykes and plutons throughout the order of magnitude larger Elat area. Moreover, Late639
Neoproterozoic alkaline granite, the Katharina pluton, that outcrops > 50 km away640
from the Dead Sea transform in central southern Sinai also shows mild 18O/16O-641
enrichments in its uppermost part that is comparable to those measured in Timna. The642
origin(s) and timing(s) of the elevation of isotope ratios that is characteristic of a large643
area in the northernmost ANS are yet to be determined. Our results show, however,644

ACC
EPTE
D M
ANU
SCR
IPT
ACCEPTED MANUSCRIPT
28
that late oxygen exchange with external fluids occurred not only in the bimodal dyke645
suite, but also in dykes from the two preceding suites (Fig. 7; Table 4). This attests646
that the alteration process was not linked with injection of a specific batch of magma.647
Presumably the extensive water-rock exchange happened mainly in dykes since dyke648
injections are commonly controlled or followed by fault zones that accommodate649
circulation of water. Less intense 18O/16O variations in the host granites (Fig. 13) may650
be explained by the fact that these rocks were sampled at sites with no evidence of651
fracturing and rock alteration.652
7.4. Origin of the unusual I(Sr) values in the quartz porphyry dykes653
The I(Sr) (590 Ma) values for individual quartz and rhyolite porphyry dykes from654
the bimodal suite vary widely, from 0.71253 to 0.73648 (Table 5), and the Rb-Sr655
isotope data do not allow calculation of a realistic isochron. In a classic diagram of656
I(Sr) vs εNd(T) (fig. 8), the data points of the dyke rocks fall in the first quadrangle,657
which is totally unexpected from felsic igneous rocks. This indicates a pronounced658
disturbance of the pristine Rb-Sr isotope system that could have occurred either at the659
magmatic or post-crystallization stage.660
At the magmatic stage, such a disturbance could have been caused by active661
interaction between coeval silicic and mafic magmas. Some experimental studies have662
observed that isotopic gradients homogenize roughly ten times faster than their663
respective chemical gradients, so a basaltic magma may thereby impart its isotopic664
characteristics to a silicic magma long before the chemical composition of the latter is665
noticeably changed (Baker, 1989, 1990; Lesher, 1990, 1994; Snyder and Tait, 1998).666
Also it was shown that the 87Sr/86Sr of silicic magmas is very sensitive to input from667
basaltic injections, but the Nd-isotope ratios are preserved (Snyders and Tait, 1998).668

ACC
EPTE
D M
ANU
SCR
IPT
ACCEPTED MANUSCRIPT
29
Applying the isotope exchange model to the bimodal dykes of Elat, we assume669
that the mafic end-member had I(Sr) of about 0.7050 and εNd(T) = 2, whereas the670
felsic end-member, i.e. the least hybridized silicic magma, had I(Sr) ~0.7400 and671
εNd(T) ~2 (Table 5). Such isotope characteristics of the supposed silicic end-member672
are unusual. On the one hand, very high I(Sr) value points to typical ancient673
continental crust source; on the other hand, the εNd(T) values are characteristic of674
mildly depleted mantle or of juvenile crust. However, the main argument that testifies675
against isotope exchange during magma mixing is the absence of felsic rocks with676
high I(Sr) values in the territory of the ANS. All granites and gneisses that may be677
regarded as possible silicic end-member sources have I(Sr) values of <0.710–0.715,678
which are characteristic of crust in juvenile provinces like the ANS (Stein and679
Goldstein, 1996; Stein, 2003).680
In order to assess the role of post-crystallization processes in disturbing the Rb-Sr681
system, one has to acknowledge the crucial effect of alkali feldspar, the major carrier682
of both Rb and Sr in the felsic dykes from the bimodal suite. The water-rock683
interaction that resulted in the elevation of δ18O(Afs) up to 13–15‰ could also cause684
the significant disturbance of the Rb-Sr isotope system. Indeed, a fairly clear positive685
correlation between (87Sr/86Sr)0 and δ18O(WR) in rhyolitic rocks is demonstrated in686
Fig. 14A. By contrast, in the Katharina ring complex disturbance of the initial oxygen687
isotope is minimal (Fig. 13), and the (87Sr/86Sr)0 values do not correlate with688
δ18O(WR) values (Fig. 14A), though anomalously low I(Sr) < 0.700 in one sample689
(Table 5) indicates that the Rb-Sr isotope system did not remain fully closed.690
However, a Rb-Sr isochron for the Katharina complex yields an age of 593 ± 16 Ma691
that is consistent with a U-Pb single zircon age of 583 ± 5 Ma (Katzir et al., 2006),692
whereas for the quartz porphyry dykes a Rb-Sr age could not be calculated.693

ACC
EPTE
D M
ANU
SCR
IPT
ACCEPTED MANUSCRIPT
30
Figure 14694In the trachydolerite increase of I(Sr) values is exhibited less clearly, though the695
highest measured value is 0.71241 (Table 5). In mafic rocks Rb is concentrated in696
subordinate alkali feldspar while the main carrier of Sr is plagioclase constituting697
about 60 vol.%. Since Sr dominates over Rb, alteration of alkali feldspar that may698
result in resetting of its 87Rb/86Sr and 87Sr/86Sr ratios would not make a great impact699
on the whole-rock 87Sr/86Sr value.700
Thus the available radiogenic isotope data showed that the Rb-Sr isotope701
characteristics of the dyke rocks are dominated by late post-crystallization alteration,702
hence they cannot be used as petrogenetic indicators.703
Low-temperature alteration that caused disturbance of the isotope systems is still704
poorly studied in southern Israel. Its effect on the rock chemical composition was not705
yet investigated in detail. However, it was shown above (section 7.1) that the706
composition of felsic dyke rocks was not markedly changed by alteration processes,707
though in trachydolerite minor increase of K2O and Rb contents should be considered.708
7.5. Origin of rhyolite magmas in the bimodal dyke suite709
Radiogenic and stable isotope ratios are commonly considered as the most reliable710
tracers of provenance of magmas. However, in the foregoing sections it was711
demonstrated that in the Elat area late post-crystallization processes have extensively712
altered the magmatic Sr isotope compositions. Unlike Sr isotope ratios, εNd(T) values713
of the bimodal suite vary within fairly narrow limits, from about +1.4 to +3.3 both in714
felsic and mafic dyke rocks and show no evidence of correlation with the whole-rock715
(87Sr/86Sr)0 and δ18O values (Figs. 8 and 14B). Thus, the alteration processes have not716
significantly affected the Sm-Nd isotope system.717

ACC
EPTE
D M
ANU
SCR
IPT
ACCEPTED MANUSCRIPT
31
The positive εNd(T) values of the mafic dyke rocks, +2.0 to +3.3 (Table 5)718
indicate derivation from a mildly ‘enriched’ mantle source, similar to those associated719
with present day ocean island basalts (DePaolo, 1988; Stein and Goldstein, 1996).720
This source was more enriched relative to the “plume mantle” that formed at the early721
stages of the evolution of the ANS and was transformed into juvenile crust and722
lithospheric mantle during the time interval of ~870–650 Ma (Stein, 2003). According723
to Stein (2003), the εNd value of the “plume mantle”, +5 ± 1, did not change much724
during a long period, from 800 Ma to 200 Ma, owing to its low Sm/Nd ratio.725
In the felsic dyke rocks the εNd(T) values vary from +0.9 to +3.1. It is likely that726
in places the Nd isotope system was slightly affected by alteration. For example,727
εNd(T) values of three samples collected from a single quartz-porphyry dyke (Fig. 1,728
dyke #8) are +2.3, +2.4, and +0.9 (Table 5, samples A18, A66-3, and A30). This729
suggests that the lowest value may be altered, thus limiting the igneous εNd(T) values730
of felsic rocks to the range of +1.4 to +3.1.731
Apparently, the complete overlap of Nd isotope ratios in the coexisting mafic and732
silicic magmas can be interpreted in terms of consanguinity of mafic and silicic melts.733
However, in the ANS this is not the only possible interpretation since most of the734
crust is juvenile and relatively young (<1 Ga) and thus by the end of the735
Neoproterozoic it had not yet developed the radiogenic isotope signatures736
characteristic of ancient continental crust (Stein and Hoffmann, 1992; Stem and737
Kröner, 1993; Furnes et al., 1996; Stein and Goldstein, 1996; Stern and Abdesalam,738
1998; Stern, 2002; Mushkin et al., 2003). In particular, it can be seen in the εNd(T) vs739
age diagram (Fig. 15) that two sources of alkaline rhyolite dykes are equally credible740
in southern Israel. The first one is coeval mafic magma evolved by fractional741
crystallization to form rhyolite. The second viable source is older metamorphic742

ACC
EPTE
D M
ANU
SCR
IPT
ACCEPTED MANUSCRIPT
32
basement (granitic gneiss, crystalline schist, as well as igneous mafic rocks), which743
suggests formation of the rhyolite magma by partial melting of crustal material.744
Figure 15745 Regardless of the juvenile character of the crust, oxygen isotopes are a sensitive746
tracer of upper crustal contribution to magmas (King et al., 1998; Peck et al., 2000;747
Cavosie et al., 2005; Valley et al., 2005). Oxygen isotope ratios of refractory minerals748
reveal significant difference between the mafic and felsic dykes. Whereas749
clinopyroxene from the trachydolerite is characterized by a typical mantle δ18O value750
of 5.8‰, quartz porphyry from the same composite dyke (dyke #2) contains zircon751
with δ18O = 6.45‰, which appreciably differs from mantle zircon values, 5.3 ± 0.6‰752
(2σ; Valley, 2003). Other quartz porphyries from the bimodal suite have either similar753
(6.5‰) or higher (7.2‰) non-mantle δ18O(Zrn) values (Fig. 7; Table 4). It follows754
that the coexisting mafic and silicic magmas of the bimodal suite differ by origin:755
trachydolerite evolved from mantle-derived melts, while quartz porphyry had a756
significant crustal component in its source.757
A-type silicic magma occurs within the bimodal dyke suite in southern Israel,758
southwestern Jordan and Sinai, Egypt. Previous models for the origin of A-type silicic759
magma in the northern ANS included fractional crystallization of mantle-derived760
magma (Stern and Voegeli, 1995; Kessel et al., 1998; Jarrar et al., 2003) and melting761
of mafic lower crust (Jarrar et al., 1992, 2004). The new oxygen isotope data show762
that pure mantle origin of silicic magma is not possible, and a contribution of upper763
crustal, high-δ18O sources to the rhyolite dyke magma is required. Therefore, if764
melting of lower crust is considered, such crust should have included a significant765
component of protoliths that had been altered near the surface at low temperatures. A766
plethora of surface-derived rocks from earlier evolutionary stages of the ANS occur in767

ACC
EPTE
D M
ANU
SCR
IPT
ACCEPTED MANUSCRIPT
33
southern Israel and should be considered as potential sources for the rhyolite magma.768
For example, melting of the peraluminous Elat granite thought to be derived from769
meta-sedimentary sources can account for the observed isotope ratios of the quartz770
porphyry [δ18O(Zrn) ~ 7‰; Fig. 16; Eyal et al., 2004]. Melting of the late Proterozoic771
metamorphic upper crust represented by the Elat granitic gneiss [δ18O(Zrn) ~ 7‰;772
Fig. 16] is also a possible scenario, which is supported by the Nd isotope data (Fig.773
15). Thus, the role of mantle-derived magma in generating the quartz porphyry dykes774
was likely restricted to advection of heat with only subdued contribution of mafic775
material to the magma.776
Figure 16777The recently acquired isotope data on the dykes of the bimodal suite and on some778
A-type granite plutons in the northern ANS give a new perspective on the long779
standing problem of the origin of the A-type granites (Loiselle and Wones, 1979;780
Collins et al., 1982; Whalen et al., 1987; Eby, 1990; Creaser et al., 1991; Turner et al.,781
1992; Kerr and Fryer, 1993; Wickham et al., 1995; Patiño Douce, 1997; Litvinovsky782
et al., 1999, 2002; Wu et al., 2002). In addition to the quartz porphyry dykes,783
appreciable crustal contribution is also indicated by the δ18O (Zrn) values of the784
alkaline Yehoshafat granite, 6.52 to 6.76‰ (Fig. 16; Table 7). The granite formed in785
the beginning of the post–orogenic stage (Table 7) and is intruded by the bimodal786
dyke suite. In contrast to the relatively high oxygen isotope ratios of the rhyolitic787
dykes and Yehoshafat granite, other A-type granites in the northern ANS bear a788
dominant mantle δ18O signature. In particular, the Timna alkaline granite pluton789
exposed ~20 km to the north of the study area and also intruded by the bimodal dyke790
suite has average δ18O(Zrn) of 5.52‰ (Table 7). Similar δ18O(Zrn) values are791
obtained for syenogranite (5.81‰) and ring dyke perthite quartz syenite (5.48–792

ACC
EPTE
D M
ANU
SCR
IPT
ACCEPTED MANUSCRIPT
34
5.66‰) from the alkaline Katharina ring complex (S. Sinai, Egypt) (Table 7). These793
values indicate that the generation of the alkaline granite magma involved either794
differentiation of mantle-derived alkaline mafic magma with minor assimilation of795
crustal material (Beyth et al., 1994) or melting of lower crust formed by underplating796
of K-rich basalt magma.797
Table 7798The abundant bimodal dyke swarms, A-type granite plutons and bimodal volcanic799
suites formed in an extentional tectonic environment (e.g., Stern, 1994; Garfunkel,800
2000; Genna et al., 2002). Extension-induced ascent of mantle-derived mafic magma801
into the crust could either melt the existing continental crust and mix with the partial802
melts or merely result in fractional crystallization of mafic magma leading to granite803
formation (Eby, 1992; Black and Liégeois, 1993). The presence of two isotopically804
distinct groups of post-orogenic alkaline granite in the northern ANS, suggests that A-805
type magmatism may originate by alternative processes almost coevally.806
8. Conclusions807
1. The Late Pan-African bimodal dyke suite in southern Israel was formed by808
injection of alkaline rhyolitic and trachybasaltic magmas. Formation of composite809
dykes points to coexistence of silicic and mafic magmas.810
2. Evidence of magma mixing is established. Mixing occurred both at shallow depth,811
in the process of formation of composite dykes, and at greater depth, still prior to812
dyke emplacement.813
3. Dyke rocks have been subjected to extensive low-temperature alteration that814
caused significant disturbance of the magmatic 18O/16O ratios in alkali feldspar815
and plagioclase. Magmatic 18O/16O ratios in zircon, clinopyroxene and partly816
in quartz have been retained.817

ACC
EPTE
D M
ANU
SCR
IPT
ACCEPTED MANUSCRIPT
35
4. The Rb-Sr isotope ratios of the quartz porphyry are also dominated by low-818
temperature hydrous alteration process; hence they do not characterize the819
magmatic process.820
5. Initial magmatic Nd isotope ratios were preserved in most rocks, and the εNd(T)821
values in mafic and felsic rocks overlap and range from ~1.2 to 2.9. However, two822
sources of rhyolite melt are equally credible: K-rich basalt magma that produced823
coeval mafic dykes, and metamorphic rocks from the juvenile crust. Oxygen824
isotope ratios of zircon in quartz porphyry reveal significant crustal contribution to825
the rhyolites, suggesting that mafic and A-type silicic magmas are coeval, but not826
co-genetic.827
6. Two groups of Late Neoproterozoic A-type granites are distinguished in the region:828
(1) those produced mostly from a mantle-derived source, with δ18O(Zrn) ranging829
from 5.5 to 5.7‰ (Timna and Katharina granitoids), and (2) those with significant830
contribution of the modified juvenile crustal component, with δ18O(Zrn) varying831
from 6.5 to 7.2‰ (Elat quartz porphyry dykes and Yehoshafat granite). This832
attests that A-type silicic magmas may originate by alternative processes almost833
coevally.834
Acknowledgements835
This study was supported by the Ministry of National Infrastructure and Energy, Israel836
(grant #23–17–04), the Israel Science Foundation (grant 142/02) and by the National837
Science Council (NSC), Taiwan (grants NSC93-2116-M-001-025, NSC94-2116-M-838
001-021, NSC94-2752-M-002-010-PAE). Authors are greatly indebted to M. Beyth839
and anonymous reviewer for valuable recommendations and corrections that provided840
a significant improvement to the paper.841

ACC
EPTE
D M
ANU
SCR
IPT
ACCEPTED MANUSCRIPT
36
Supplementary data842
Figure 1S843
Table 1S844
Table 2S845
Figure 2S846
Table 3S847
Table 4S848
References849
Agron, N., Bentor, Y.K., 1981. The volcanic massif of Biq’at Hayareah (Sinai-850
Negev), a case of potassium metasomatism. J. Geol. 89, 479–496.851
Baer, G., Beyth, M., Reches, Z., 1994. Dyke emplaced into fractured basement,852
Timna Igneous Complex, Israel. J. Geophys. Res. 99, 24039–24050.853
Baker, D.R., 1989. Tracer versus trace element diffusion: diffusional decoupling of Sr854
concentration fron Sr isotope composition. Geochim. Cosmochim. Acta 53, 3015–855
3023.856
Baker, D.R., 1990. Chemical interdiffusion of dacite and rhyolite: anhydrous857
measurements at 1 atm and 10 kbar, application of transition state theory, and858
diffusion in zoned magma chambers. Contrib. Mineral. Petrol. 104, 407–423.859
Bentor, Y.K., 1985. The crust evolution of the Arabo-Nubian Massif with special860
reference to the Sinai Peninsula. Precambrian Res. 28, 1–74.861
Bentor, Y.K., Eyal, M., 1987. The geology of southern Sinai, its implication for the862
evolution of the Arabo-Nubian Massif. Isr. Acad. Sci. Humanities, Jerusalem.863
Beyth, M., Stern, R.J., Altherr, R., Kröner, A., 1994. The late Precambrian Timna864
igneous complex, Southern Israel: Evidence for comagmatic-type sanukitoid865
monzodiorite and alkali granite magma. Lithos 31, 103–124.866

ACC
EPTE
D M
ANU
SCR
IPT
ACCEPTED MANUSCRIPT
37
Beyth, M., Longstaffe, F.J., Ayalon, A., Matthews , A., 1997. Epigenetic alteration of867
the Precambrian igneous complex at Mount Timna, southern Israel: Oxygen-868
isotope studies. Isr. J. Earth Sci. 46: 1–11.869
Beyth, M., Heimann, A., 1999. The youngest igneous event in the crystalline870
basement of the Arabian-Nubian Shield, Timna Igneous Complex. Isr. J. Earth871
Sci. 48, 113–120.872
Bielski, M., 1982. Stages in the evolution of the Arabo-Nubian massif in Sinai. Ph.D.873
thesis, Hebrew Univ., Jerusalem (in Hebrew; English Abstract, Tables, Figures).874
Black, R., Liégeois, J.P., 1993. Cratons, mobile belts, alkaline rocks and continental875
lithospheric mantle: the Pan-African testimony. J. Geol. Soc. (Lond.) 150, 89–98.876
Carrigan, C.R., Eichelberg, J.C., 1990. Zoning of magmas by viscosity in volcanic877
conduits. Nature 343, 248–251.878
Cavosie, A.J., Valley, J.W., Wilde, S.A., E.I.M.F, 2005. Magmatic 18O in 4400-3900879
Ma detrital zircons: a record of the alteration and recycling of crust in the early880
Archean. Earth Planet. Sci. Lett. 235, 663–681.881
Chiba, H., Chacko, T., Clayton, R.N., Goldsmith, J.R., 1989. Oxygen isotope882
fractionations involving diopside, forsterite, magnetite and calcite: application to883
geothermometry. Geochim. Cosmochim. Acta 53, 2895–2995.884
Clayton, R.N., Goldsmith, J.R., Mayeda, T.K., 1989. Oxygen isotope fractionation in885
quartz, albite, anorthite and calcite. Geochim. Cosmochim. Acta 53, 725–733.886
Collins, W.J., Beams, S.D., White, A.J.R., Chappell, B.W., 1982. Nature and origin of887
A-type granites with particular reference to Southeastern Australia. Contrib.888
Mineral. Petrol. 80, 189–200.889
Creaser, R.A., Price, R.C., Wormald, R.J., 1991. A-type granites revisited:890
Assessment of a residual-source model. Geology 19, 63–166.891

ACC
EPTE
D M
ANU
SCR
IPT
ACCEPTED MANUSCRIPT
38
Criss, R.E., Taylor, H.P., 1983. An 18O/16O and D/H study of Tertiary hydrothermal892
systems in the southern half of the Idaho batholith. Geol. Soc. Am. Bull. 94, 640–893
663.894
Criss, R.E., Taylor, H.P., 1986. Meteoric-hydrothermal systems. In: Valley, J.W.,895
Taylor, H.P., O’Neil, J.R. (Eds.), Stable Isotopes in High Temperature Geological896
Processes. Reviews in Mineralogy, vol. 16. Mineral. Soc. America, Washington,897
DC, pp. 373–424.898
DePaolo, D.J., 1988. Neodynium Isotope Geochemistry: An Introduction. Springer-899
Verlag, New York.900
Eby, G.N., 1990. The A-type granitoids: a review of their occurrence and chemical901
characteristics and speculations on their petrogenesis. Lithos 26, 115–134.902
Eby, G.N., 1992. Chemical subdivision of the a-type granitoids: petrogenetic and903
tectonic implications. Geology 20, 641–644.904
Eiler, J.M., Farley, K.A., Valley, J.W., Hofmann, A.W., Stolper, E.M., 1996. Oxygen905
isotope constraints on the sources of Hawaiian volcanism. Earth Planet. Sci. Lett.906
144, 453–468.907
Eiler, J. M., Crawford, A., Elliott, T., Farley, K.A., Valley, J.W., Stolper, E.M., 2000.908
Oxygen isotope geochemistry of oceanic-arc lavas. J. Petrol. 41, 229–256.909
Eyal, M., Hezkiyahu, T., 1980. Katharina Pluton - the outlines of a petrological910
framework. Isr. J. Earth Sci. 29, 41–52.911
Eyal, Y., Eyal, M., Kröner, A., 1991. Geochronology of the Elat Terrain metamorphic912
basement, and its implication for crustal evolution of the NE part of the Arabian-913
Nubian Shield. Isr. J. Earth Sci. 40, 5–16.914

ACC
EPTE
D M
ANU
SCR
IPT
ACCEPTED MANUSCRIPT
39
Eyal, M., Litvinovsky, B.A., Katzir, Y., Zanvilevich, A.N., 2004. The Pan-African915
high-K calc-alkaline peraluminous Elat granite of southern Israel: geology,916
geochemistry and petrogenesis. J. Afric. Earth Sci. 40, 115–136.917
Furman, T., Spera, F.J., 1985. Co-mingling of acid and basic magma with the918
implications for the origin of mafic I-type xenoliths: field and petrochemical919
relations of an unusual dike complex at Eagle Lake, Sequoia National Park,920
California, USA. J. Volcanol. Geothermal Res. 24, 151–178.921
Furnes, H., El-Sayed, M.M., Khalil, S.O., Hassanen, M.A., 1996. Pan-African922
magmatism in the Wadi El-Imra district, Central Eastern Desert, Egypt:923
geochemistry and tectonic environment. J. Geol. Soc. (Lond.) 153, 705–718.924
Gal, A., 2006. Oxygen Isotope Perspective on Post-Orogenic Alkaline Magmatism in925
the Arabian-Nubian Shield of Southern Israel. MS thesis, Ben-Gurion University926
of the Negev, Be’er Sheva, Israel, (in Hebrew; English Abstract).927
Garfunkel, Z., 2000. History and paleogeography during the Pan-African orogen to928
stable platform transition: Reappraisal of the evidence from Elat area and the929
northern Arabian-Nubian Shield. Isr. J. Earth Sci. 48, 135–157.930
Garfunkel, Z., Eyal, Y., Eyal, M., Weissbrod, T., Bakler, N., Shimron, A. E., Peltz, S.,931
Gutkin, V., Bartov, Y., Drukman, Y., Rozenfeld, M., Sneh, A., 2000. Geological932
map of the Northern Gulf of Elat area, scale 1:100,000 (sheet 26 Elat). Geol. Surv.933
Isr., Jerusalem.934
Genna, A., Nehlig, P., Le Goff, E., Guerrot, C., Shanti, M., 2002. Proterozoic935
tectonism of the Arabian Shield. Precambrian Res. 117, 21–40.936
Gibson, I.L., Walker, G.P.L., 1963. Some composite rhyolite/basalt lavas and related937
composite dikes in eastern Iceland. Proc. Geol. Assoc., 74: 301.938

ACC
EPTE
D M
ANU
SCR
IPT
ACCEPTED MANUSCRIPT
40
Gutkin, V., Eyal, Y., 1998. Geology and evolution of Precambrian rocks, Mt.939
Shelomo, Elat area. Isr. J. Earth Sci. 47, 1–18.940
Iacumin, M., Mazaroli, A., El-Metwally, A.A., Piccirillo, E.M., 1998. Neoproterozoic941
dyke swarms from southern Sinai (Egypt): geochemistry and petrogenetic aspects.942
J. Afric. Earth Sci. 26, 49–64.943
Jarrar, G., 2001. The youngest Neoproterozoic mafic dike suite in the Arabian Sield:944
mildly alkaline dolerites from South Jordan – their geochemistry and petrogenesis.945
Geol. Mag. 138, 309–323.946
Jarrar, G., Wachendorf, H., Saffarini, G., 1992. A Late Proterozoic bimodal947
volcanic/subvolcanic suite from Wadi Araba, southwest Jordan. Precambrian Res.948
56, 51–72.949
Jarrar, G., Stern, R.J., Saffarini, G., Al-Zubi, H., 2003. Late and post-orogenic950
Neoproterozoic intrusions of Jordan: implications for crustal growth in the951
northernmost segment of the East African Orogen. Precambrian Res. 123, 295–952
319.953
Jarrar, G., Saffarini, G., Baumann, A., Wachendorf, H., 2004. Origin, age and954
petrogenesis of Neoproterozoic composite dikes from the Arabian-Nubian Sield,955
SW Jordan. Geol. J. 39, 157–178.956
Kanaris-Sotiriou, R., Gill, F.G.F., 1985. Hybridization and the petrogenesis of957
composite intrusions: The dyke at An Cumhann, Isle of Arran, Scotland. Geol.958
Mag. 122, 361–372.959

ACC
EPTE
D M
ANU
SCR
IPT
ACCEPTED MANUSCRIPT
41
Katzir, Y, Eyal, M., Litvinovsky, B. A., Jahn, B-M, Zanvilevich, A. N., Valley, J. W.,960
Beeri, Y., Pelly, I., Shimshilashvili, E., 2006. Petrogenesis of A-type granites and961
origin of vertical zoning in the Katharina pluton, area of Gebel Mussa (Mt.962
Moses), Sinai, Egypt. Lithos, in press.963
Katzir, Y., Litvinovsky, B.A., Eyal, M., Zanvilevich, A.N., Vapnik, Ye., 2006. Four964
successive episodes of Late Pan-African dykes in the central Elat area, southern965
Israel. Isr. J. Earth Sci., in press.966
Kerr, A., Fryer, B.J., 1993. Nd isotope evidence for crust-mantle interaction in the967
generation of A-type granitoid suites in Labrador, Canada. Chem. Geol. 104, 39–968
60.969
Kessel, R., Stein, M., Navon, O., 1998. Petrogenesis of late Neoproterozoic dikes in970
the northern Arabian-Nubian Shield. Implication for the origin of A-type granites.971
Precambrian Res. 92, 195–213.972
King, E.M., Valley, J.W., Davis, D.W., Edwards, G.R., 1998. Oxygen isotope ratios973
of Archean plutonic zircons from granite-greenstone belts of the Superior974
Province: indicator of magmatic source. Precambrian Res. 92, 365–387.975
Koyaguchi, T., Takada, A., 1994. An experimental study of the formation of976
composite intrusions from zoned magma chambers. J. Volcanol. Geothermal Res.977
59, 261–267.978
Lasher, C.E., 1990. Decoupling of chemical and isotopic exchange during magma979
mixing. Nature 344, 235–237.980
Lasher, C.E., 1994. Kinetics of Sr and Nd exchange in silicate liquids: theory,981
experiments, and applications to uphill diffusion, isotopic equilibration and982
irreversible mixing of magmas. J. Geophys. Res. 99, 9585–9604.983

ACC
EPTE
D M
ANU
SCR
IPT
ACCEPTED MANUSCRIPT
42
Liégeois, J.-P., Black, R., 1987. Alkaline magmatism subsequent to collision in the984
Pan-African belt of the Adrar des Iforas. In: Fitton, J.G., Upton, B.G.J. (Eds.),985
Alkaline Igneous Rocks. Geol. Soc. Spec. Publ., vol. 30, pp. 381–401.986
Litvinovsky, B.A., Zanvilevich, A.N., Kalmanovich, M.A., 1995a. Recurrent mixing987
and mingling of coexisting syenite and basalt magmas in the Ust'-Khilok massif,988
Transbaikalia, and its petrologic significance. Petrology 3, 115–137.989
Litvinovsky, B.A., Zanvilevich, A.N., Lyapunov, S.M., Bindeman, I.N., Davis, A.M.,990
Kalmanovich, M.A., 1995b. Model of composite basite-granitoid dike generation991
(Shaluta Pluton, Transbaikalia). Russian Geology and Geophysics 36, 1–19.992
Litvinovsky, B.A., Zanvilevich, A.N., Wickham, S.M., Steele, I.M., 1999. Origin of993
syenitic magmas from anorogenic granitoid series: syenite-granite series from994
Transbaikalia. Petrology (Moscow) 7, 483–508.995
Litvinovsky, B.A., Jahn, B.-M., Zanvilevich, A.N., Saunders, A., Poulain, S., 2002.996
Petrogenesis of syenite-granite suites from the Bryansky Complex (Transbaikalia,997
Russia): implications for the origin of A-type granitoid magmas. Chem. Geol. 189,998
105–133.999
Litvinovsky, B.A., Eyal, M., Zanvilevich, A.N., Katzir, Y., Jahn B.-M., Beeri, Y.,1000
Valley, J.W., Vapnik, Ye., 2006. Late Neoproterozoic dykes in the northernmost1001
Arabian-Nubian shield (southern Israel): sequence of dyke episodes, geochemical1002
and isotope evidence of magma sources. Int. J. of Earth Sci., in press.1003
Loiselle, M.C., Wones, D.R., 1979. Characteristics and origin of anorogenic granites.1004
Geol. Soc. Am. Abstr. Progr. 11, 468.1005
Ludwig, K.R., 2003. ISOPLOT/Ex 3.00. A geochronological toolkit for Microsoft1006
Excel. Berkeley Geochronology Center Spec. Publ. v. 4, 70 pp.1007

ACC
EPTE
D M
ANU
SCR
IPT
ACCEPTED MANUSCRIPT
43
Macpherson, C.G., Gamble, J.A., Mattey, D.P., 1998. Oxygen isotope geochemistry1008
of lavas from an oceanic to continental arc transition, Kermadec-Hikurangi1009
margin, SW Pacific. Earth Planet. Sci. Lett. 160, 609–621.1010
Marco, S., Ron, H., Matthews, A., Beyth, M., Navon, O., 1993. Chemical remanent1011
magnetism related to the Dead Sea Rift: Evidence from Precambrian igneous rock1012
of mount Timna, southern Israel. J. Geophys. Res. 98, 16001–16012.1013
Marian, P.D., Piccoli, P.P.M., 1989. Tectonic discrimination of granitoids. Geol. Soc.1014
Am. Bull. 101, 635–643.1015
Marshall, L.A., Sparks, R.S.J., 1984. Origin of some mixed-magma and net-veined1016
ring intrusions. J. Geol. Soc. (Lond.) 141, 171–182.1017
Mattey, D., Lowry, D., Macpherson, C., 1994a. Oxygen isotope composition of1018
mantle peridotite. Earth Planet. Sci. Lett. 128, 231–241.1019
Mattey, D., Lowry, D., Macpherson, C., Chazot, G., 1994b. Oxygen isotope1020
composition of mantle minerals by laser fluorination analysis: homogeneity in1021
peridotites, heterogeneity in eclogites. Mineral. Mag. 58A, 573–574.1022
Matthews, A., Ayalon, A., Ziv, A., Shaked, J., 1999. Hydrogen and oxygen isotope1023
studies of alteration in the Timna igneous complex. Isr. J. Earth Sci. 48, 121–131.1024
Moghazi, A.M., 2002. Petrology and geochemistry of Pan-African granitoids, Kab1025
Amiri area, Egypt – imolications for tectonomagmatic stages of the Nubian Shield1026
evolution. Mineral. Petrol. 75, 41–67.1027
Mushkin, A., Navon, O., Halicz, L., Heimann, A., Wöerner, G., Stein, M., 1999.1028
Geology and geochronology of the Amram Massif rocks, southern Negev Desert,1029
Israel. Isr. J. Earth Sci. 48, 179–193.1030
ACC
EPTE
D M
ANU
SCR
IPT
ACCEPTED MANUSCRIPT
44
Mushkin, A., Navon, O., Halicz, L., Heimann, A., Hartmann, G., Stein, M., 2003. The1031
petrogenesis of A-type magmas from the Amram Massif, southern Israel. J. Petrol.1032
44, 815–832.1033
Page, F.Z., Deangelis, M., Fu, B., Kita, N., Lancaster, P., Valley J.W., 2006. Slow1034
oxygen diffusion in zircon.16th V.M. Goldschmidt Conference, Melbourne,1035
Australia. Absracts.1036
Patiño Douce, A.E., 1997. Generation of metaluminous A-type granites by low-1037
pressure melting of calc-alkaline granitoids. Geology 25, 743–746.1038
Pearce, J.A., Cann, J.R., 1973. Tectonic setting of basic volcanic rocks determined1039
using trace element analyses. Earth Planet. Sci. Lett. 19, 290–300.1040
Pearce, J.A., Harris, N.B., Tindle, A.G., 1984. Trace element discrimination diagrams1041
for the tectonic interpretation of granitic rocks, J. Petrol. 25, 956–9831042
Peck, W.H., King, E.M., Valley, J.W., 2000. Oxygen isotope perspective on1043
Precambrian crustal growth and maturation. Geology 28, 363-366.1044
Poli, G.E., Tommazini, S., 1991. Model of the origin and significance of1045
microgranular enclaves in calc-alkaline granitoids. J. Petrol. 32, 657–666.1046
Snyder, D., Crambles, C, Tait, S., Wiebe, R.A., 1997. Magma mingling in dikes and1047
sills. J. Geol. 105, 75–86.1048
Snyder, D., Tait, S., 1998. The imprint of basalt on the geochemistry of silicic1049
magmas. Earth Planet. Sci. Lett. 160, 433–445.1050
Spicuzza, M.J., Valley, J.W., Kohn, M J., Girard, J.P., Fouillac, A.M., 1998a. The1051
rapid heating, defocused beam technique: a CO2-laser-based method for highly1052
precise and accurate determination of δ18O values of quartz. Chem. Geol. 144,1053
195–203.1054

ACC
EPTE
D M
ANU
SCR
IPT
ACCEPTED MANUSCRIPT
45
Spicuzza, M.J., Valley, J.W., McConnell, V.S., 1998b. Oxygen isotope analysis of1055
whole rock via laser fluorination: An air-lock approach. Geol. Soc. Am. Abstr.1056
Progr. 30, p. 80.1057
Stein, M., 2003. Tracing the plume material in the Arabian-Nubian Shield.1058
Precambrian Res. 123, 223–234.1059
Stein, M., Hoffman, A.W., 1992. Fossil plumes beneath the Arabian lithosphere?1060
Earth Planet. Sci. Lett. 114, 193–209.1061
Stein, M., Goldstein, S.L., 1996. From plume head to continental lithosphere in the1062
Arabian-Nubian shield. Nature 382, 773–778.1063
Stein, M., Navon, O., Kessel, R., 1997. Chromatographic metasomatism of the1064
Arabian-Nubian lithosphere. Earth Planet. Sci. Lett. 152, 75–91.1065
Stern, R.J., 1994. Arc assembly and continental collision in the Neoproterozoic East1066
African orogen. Implications for the consolidation of Gondwanaland. Annu. Rev.1067
Earth Planet. Sci. 22, 319–351.1068
Stern, R.J., 2002. Crustal evolution in the East African Orogen: a neodymium isotopic1069
perspective. J. Afr. Earth Sci. 34, 109–117.1070
Stern, R.J., Gottfried, D., Hedge, C.E., 1984. Late Precambrian rifting and crustal1071
evolution in the North Eastern Desert of Egypt. Geology 12, 168–172.1072
Stern, R.J., Hedge, C.E., 1985. Geochronologic and isotopic constraints on Late1073
Precambrian crustal evolution in the Eastern Desert of Egypt. Am. J. Sci. 285, 97–1074
127.1075
Stern, R.J., Gottfried, D., 1986. Petrogenesis of the Late Precambrian (575-600 Ma)1076
bimodal suite in the Northeast Africa. Contrib. Mineral. Petrol. 92, 492–501.1077

ACC
EPTE
D M
ANU
SCR
IPT
ACCEPTED MANUSCRIPT
46
Stern, R.J., Voegeli, D.F., 1987. Geochemistry, geochronology, and petrogenesis of a1078
Late Precambrian (= 590 Ma) composite dike from the North Eastern Desert of1079
Egypt. Geologische Rundschau 76, 325–341.1080
Stern, R.J., Sellers, G., Gottfried, D., 1988. Bimodal dike swarms in the North of the1081
Eastern Desert of Egypt: Significance for the origin of the Precambrian “A-type”1082
Granites in Northern Afro-Arabia. In: Greiling, R., Gaby, R. (Eds.), The Pan-1083
African Belt of NE Africa and Adjacent Areas: Tectonic Evolution and Economic1084
Aspects. Frieder. Vieweg. & Sohn, Braunschweig, Germany, pp.147–179.1085
Stern, R.J., Kröner, A., 1993. Late Precambrian crustal evolution in NE Sudan,1086
isotopic and geochronologic constraints. J. Geol. 101, 555–574.1087
Stern, R.J., Voegeli, D., 1995. Late Neoproterozoic (570 Ma) composite dykes from1088
the Northern Arabian-Nubian Shield: Petrogenetic perspectives on1089
contemporaneous mafic and felsic igneous activity. Third international Dyke1090
Conference, Jerusalem, September 4–8, 1995, p. 69. Abstracts.1091
Stern, R. J., Abdelsalam, M. G., 1998. Formation of continental crust in the Arabian-1092
Nubian Shield: evidence from granitic rocks of the Nakasib suture, NE Sudan.1093
Geologische Rundschau 87, 150–160.1094
Stoeser, D.B., Camp, V.E., 1985. Pan-African microplate accretion of Arabian shield.1095
Geol. Soc. Am. Bull. 96, 817–826.1096
Sun, S., McDonough, W.F., 1989. Chemical and isotopic systematics of oceanic1097
basalts: implications for mantle compositions and processes. In: Saunders, A.D.,1098
Norry, M.J. (Eds.), Magmatism in the Ocean Basins. Geol. Soc. Spec. Publ., v.1099
42, pp. 313–345.1100
Sylvester, P. J., 1989. Post-collisional alkaline granites. J. Geology 97, 261–281.1101
ACC
EPTE
D M
ANU
SCR
IPT
ACCEPTED MANUSCRIPT
47
Titov, A.V., Litvinovsky, B.A., Zanvilevich, A.N., Shadaev, M.G., 2000.1102
Hybridization in composite basic-rock–leucogranite dikes of the Ust’-Khilol1103
massif, Transbaikalia. Russian Geology and Geophysics 41, 1662–1675.1104
Turner, S.P., Foden, J.D., Morrison, R.S., 1992. Derivation of some A-type magmas1105
by fractionation of basaltic magma: an example from the Padthway Ridge, South1106
Australia. Lithos 28, 151–179.1107
Valley, J.W., 2003. Oxygen isotopes in zircon. In: Hanchar, J.M., Hoskin, W.O.1108
(Eds.), Zircon. Reviews in Mineralogy and Geochemistry, vol. 53. Mineral. Soc.1109
America, Washington, DC, pp. 343–385.1110
Valley, J.W., Chiarenzelli, J.R., McLelland, J.M., 1994. Oxygen isoitope1111
geochemistry of zircon. Earth Planet. Sci. Lett. 126, 187–206.1112
Valley, J.W., Kitchen, N., Kohn, M.J., Niendorf, C.R., Spicuzza, M.J., 1995. UWG-2,1113
a garnet standard for oxygen isotope ratios: Strategies for high precision and1114
accuracy with laser heating. Geochim. Cosmochim. Acta 59, 5523–5531.1115
Valley, J.W., Bindeman, I.N., Peck, W.H., 2003. Empirical calibration of oxygen1116
isotope fractionation in zircon. Geochim. Cosmochim. Acta 67, 3257–3266.1117
Valley, J.W., Lackey, J.S, Cavosie, A.J., Clechenko, C.C., Spicuzza, M.J., Basei,1118
M.A.S., Bindeman, I.N., Ferreira, V.P., Sial, A.N., King, E.M., Peck, W.H.,1119
Sinha, A.K. Wei, C.S., 2005. 4.4 billion years of crustal maturation: Oxygen1120
isotopes in magmatic zircon. Contr. Mineral. Petrol. 150, 561–580.1121
Vogel, T.A., Wilband, J.T., 1978. Coexisting acidic and basic melts: geochemistry of1122
a composite dike. J. Geol. 86, 353–371.1123
Wachendorf, H., Zachmann, D., Jarrar, G.H., 1985. The role of pressure in control of1124
potassium, sodium, and copper concentration in hypabyssal intrusives as1125

ACC
EPTE
D M
ANU
SCR
IPT
ACCEPTED MANUSCRIPT
48
demonstrated in Late Precambrian dikes in southern Jordan. Precambrian Res. 30,1126
221–248.1127
Wenner, D.B., Taylor, Jr., 1976. Oxygen and hydrogen isotope studies of Precambrian1128
granite-rhyolite terrane, St. Francois Mountains, southeastern Missouri. Geol. Soc.1129
Am. Bull. 87, 1587–1598.1130
Whalen, J.B., Currie, K.L., Chappe, B.W., 1987. A-type granites: geochemical1131
characteristics, discrimination and petrogenesis. Contrib. Mineral. Petrol. 95, 407–1132
419.1133
Wickham, S.M., Litvinovsky, B.A., Zanvilevich, A.N., Bindeman, I.N., 1995.1134
Geochemical evolution of Phanerozoic magmatism in Transbaikalia, East Asia: a1135
key constraint of the origin of K-rich silicic magmas and the process of1136
cratonization. J. Geophys. Res. 100/B8, 15641–15654.1137
Wiebe, R.A., Ulrich, R., 1997. Origin of composite dikes in the Gouldsboro granite,1138
coastal Maine. Lithos 40, 157–178.1139
Winchester, J.A., Floyd, P.A., 1977. Geochemical discrimination of different magma1140
series and their differentiation products using immobile elements. Chem. Geol. 70,1141
319–339.1142
Wu, F.-Y., Sun, D.-Y., Li, H.-M., Jahn, B.-M., Wilde, S.A., 2002. A-type granites in1143
Northeastern China: age and geochemical constraints on their petrogenesis. Chem.1144
Geol. 187, 143–173.1145
Zorpi, M.J., Couloh, C., Orsini, J.B., 1991. Hybridization between felsic and mafic1146
magmas in calc-alkaline granitoids – a case study in northern Sardinia, Italy.1147
Chem. Geol. 92 (1/3), 45–86.1148
Figure captions1149

ACC
EPTE
D M
ANU
SCR
IPT
ACCEPTED MANUSCRIPT
49
Fig. 1. Distribution of quartz porphyry, rhyolite porphyry and composite dykes from1150
the bimodal suite in the Elat area (based on an aerial photographs interpretation1151
performed by V.Voznesensky, with authors’ refinements). Area with abundant dykes,1152
after Gutkin and Eyal (1998). Cretaceous to recent sedimentary sequences (undivided)1153
are shown in white. Inset: 1 and 2 are Late Neoproterozoic bimodal volcanic and dyke1154
suites in southwestern Jordan (Jarrar et al., 2004) and Northeastern Desert, Egypt1155
(Stern et al., 1988).1156
Fig. 2. Composite dykes of the second type in the Elat area. A, sub vertical 20-m wide1157
composite dyke with abrupt contact between felsic interior and mafic margins. The1158
dyke is exposed in Wadi Shehoret, 5 km to the north from the area shown in Fig. 11159
(for locality, see Supplementary data). The left contact, highlighted by black line is1160
subjected to tectonic fracturing. B, sketch of the structure of a composite dyke with1161
gradational contacts between felsic interior and mafic margins (Fig. 1, dyke #2). The1162
width of hybrid zones (30–50 cm) is off scale. The inset shows a photograph of1163
typical microgranular mafic enclaves (MME) in quartz porphyry.Fig. 3. Silica1164
variation diagrams of selected major and trace elements in quartz porphyry dykes1165
from the bimodal suite. Stippled bands designate the supposed border zone between1166
“pure” and contaminated rocks.1167
Fig. 4. Chondrite-normalized REE patterns for quartz porphyries from simple (non-1168
composite) dykes (asterisks) and from composite dykes (CD), stippled area. A, “pure”1169
quartz porphyry; B, contaminated quartz porphyry. Here and in Figs. 6 and 111170
chondrite values are from Sun and McDonough (1989).1171
Fig. 5. Quartz porphyry compositions plotted in classification diagrams. A,1172
100*[(MgO+FeOt+TiO2)/SiO2] vs (Al2O3+CaO)/(FeOt+Na2O+K2O) diagram, after1173
Sylvester (1989); H.F. C-A = highly fractionated calc-alkaline. B, SiO2 vs Agpaitic1174

ACC
EPTE
D M
ANU
SCR
IPT
ACCEPTED MANUSCRIPT
50
Index [(Na+K]/Al], after Liégeois and Black (1987). C, Ga/Al vs Zr diagram; gray1175
rectangles denote the fields of S-, I-, and M-type granitoids (after Whalen et al.,1176
1987). D, Y+Nb vs Rb tectonic classification diagram, after Pearce et al. (1984).1177
Fig. 6. Mafic rock compositions plotted in classification diagrams. A, Nb/Y vs1178
[(Zr/TiO2)*0.0001] diagram, after Winchester and Floyd (1977). B, Zr–Ti/100–Y*31179
diagram, after Pearce and Cann (1973). C, chondrite-normalized REE patterns for1180
moderate-Ti and high-Ti trachydolerite.1181
Fig. 7. Oxygen isotope ratios of mineral separates from the Late Neoproterozoic dyke1182
suites of southern Israel. The SiO2 (wt.%) content is denoted in parentheses. The1183
shaded band marks the range of δ18O values of clinopyroxene in mantle xenoliths1184
(Mattey et al., 1994a, b). The dashed rectangle illustrates the δ18O range of1185
plagioclase in oceanic arc lavas (Eiler et al., 2000). Also shown are the average δ18O1186
values of clinopyroxene phenocrysts from basalts and andesites of the Taupo arc, New1187
Zealand and of plagioclase from the Lanai volcano, Hawaii (Eiler et al., 1996;1188
Macpherson et al., 1998). The Zrn–Afs–Qtz bar shows equilibrium fractionations1189
between the minerals at magmatic temperatures (after Chiba et al., 1989; Valley et al.,1190
2003).1191
Fig. 8. εNd(590 Ma) vs (87Sr/86Sr)0 in dykes from the bimodal suite . Note the narrow1192
range of εNd(T) values in mafic and felsic rocks irrespective of (87Sr/86Sr)0 values.1193
Fig. 9. Spidergrams of felsic (A) and mafic (B) rocks from the bimodal dyke suite in1194
southern Israel normalized to well-preserved Late Neoproterozoic dyke rocks from1195
similar suites in Egypt and Jordan (see text for more details). A, normalized to1196
rhyolite from southwestern Jordan (Jarrar et al., 2004); B, normalized to dolerite from1197
the Northeastern Desert, Egypt (Stern et al., 1988). Stippled areas are ± 1σ range of1198

ACC
EPTE
D M
ANU
SCR
IPT
ACCEPTED MANUSCRIPT
51
rock compositions used for normalization. A full set of data is given in Table 3S of1199
the supplementary data.1200
Fig. 10. Compositional profiles across the Netafim composite dyke #2 (plots of1201
selected major and trace elements versus distance). Zones within the dyke: TD =1202
trachydolerite; mixing zone: TA = hybrid trachyandesite, Tdc = hybrid trachydacite;1203
QP = quartz porphyry. Sample numbers are the same as in Table 3. Major elements,1204
wt.%; trace elements, ppm.1205
Fig. 11. Chondrite-normalized REE patterns for rocks from the Netafim composite1206
dyke #2. The pattern numbers correspond to the sample numbers in Table 3; in1207
parentheses: silica content (wt. %).1208
Fig. 12. Silica variation diagrams for rocks making up the Netafim composite dyke #21209
with regression lines and the correlation coefficient values (R). Stippled fields denote1210
compositions of intermediate rocks from composite dykes with abrupt contacts, and1211
simple andesite dykes; I and II, groups of dyke rocks (see text).1212
Fig. 13. δ–δ diagrams for quartz and alkali feldspar in quartz porphyry from the1213
bimodal suite (asterisks). Isotherm for equilibrium fractionation between Qtz and Ab1214
at 800 oC is after Clayton et al. (1989). For comparison, data for three Late1215
Neoproterozoic granite complexes are presented (see text).1216
Fig. 14. Oxygen, Sr and Nd isotope ratios in mafic and felsic rocks from the bimodal1217
dyke suite: (A) positive correlation between whole rock δ18O and 87Sr/86Sr(590 Ma);1218
(B) no correlation between whole rock δ18O and εNd (590 Ma).1219
Fig. 15. εNd(T) vs age for Neoproterozoic igneous rocks and selected metamorphic1220
rocks of southern Israel. Sources of data: Elat area, this paper (Table 5), unpublished1221
authors’ data for Elat granitic gneiss, and Stein & Goldstein (1996); Amram area,1222
Mushkin et al. (2003); Timna area, Beyth et al. (1994).1223

ACC
EPTE
D M
ANU
SCR
IPT
ACCEPTED MANUSCRIPT
52
Fig. 16. Oxygen isotope ratios of zircon from igneous felsic rocks and granitic gneiss1224
in southern Israel and the Sinai Peninsula (the Katharina ring complex). Two groups1225
of A-type granites with different isotope signatures are distinguished. Mantle values1226
of δ18O (Zrn) = 5.3 ± 0.6 (2 σ; Valley, 2003).1227
1228
1229
1230
1231
1232
1233
1234
1235
1236
1237
1238
1239
1240
1241
1242
1243
1244
1245
1246
1247
1248
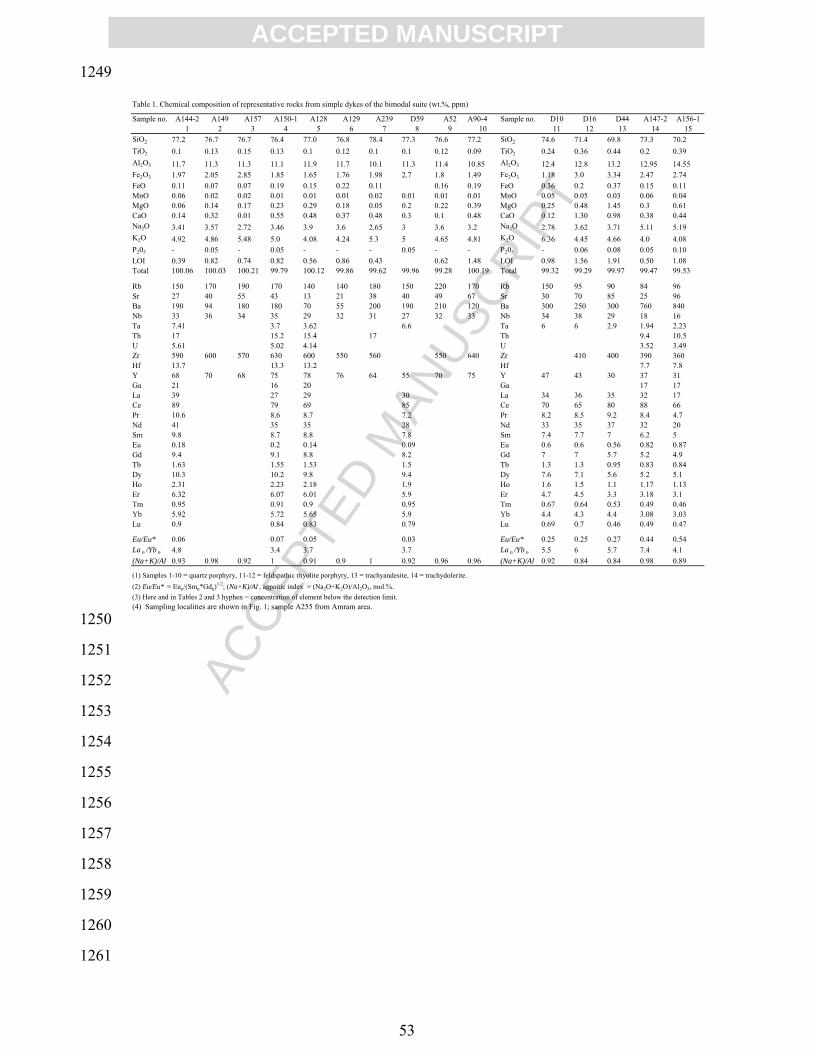
ACC
EPTE
D M
ANU
SCR
IPT
ACCEPTED MANUSCRIPT
53
1249
1250
1251
1252
1253
1254
1255
1256
1257
1258
1259
1260
1261
Table 1. Chemical composition of representative rocks from simple dykes of the bimodal suite (wt.%, ppm)
Sample no. A144-2 A149 A157 A150-1 A128 A129 A239 D59 A52 A90-4 Sample no. D10 D16 D44 A147-2 A156-11 2 3 4 5 6 7 8 9 10 11 12 13 14 15
SiO2 77.2 76.7 76.7 76.4 77.0 76.8 78.4 77.3 76.6 77.2 SiO2 74.6 71.4 69.8 73.3 70.2TiO2 0.1 0.13 0.15 0.13 0.1 0.12 0.1 0.1 0.12 0.09 TiO2 0.24 0.36 0.44 0.2 0.39Al2O3 11.7 11.3 11.3 11.1 11.9 11.7 10.1 11.3 11.4 10.85 Al2O3 12.4 12.8 13.2 12.95 14.55Fe2O3 1.97 2.05 2.85 1.85 1.65 1.76 1.98 2.7 1.8 1.49 Fe2O3 1.18 3.0 3.34 2.47 2.74FeO 0.11 0.07 0.07 0.19 0.15 0.22 0.11 0.16 0.19 FeO 0.36 0.2 0.37 0.15 0.11MnO 0.06 0.02 0.02 0.01 0.01 0.01 0.02 0.01 0.01 0.01 MnO 0.05 0.05 0.03 0.06 0.04MgO 0.06 0.14 0.17 0.23 0.29 0.18 0.05 0.2 0.22 0.39 MgO 0.25 0.48 1.45 0.3 0.61CaO 0.14 0.32 0.01 0.55 0.48 0.37 0.48 0.3 0.1 0.48 CaO 0.12 1.30 0.98 0.38 0.44Na2O 3.41 3.57 2.72 3.46 3.9 3.6 2.65 3 3.6 3.2 Na2O 2.78 3.62 3.71 5.11 5.19K2O 4.92 4.86 5.48 5.0 4.08 4.24 5.3 5 4.65 4.81 K2O 6.36 4.45 4.66 4.0 4.08P205 - 0.05 - 0.05 - - - 0.05 - - P205 - 0.06 0.08 0.05 0.10LOI 0.39 0.82 0.74 0.82 0.56 0.86 0.43 0.62 1.48 LOI 0.98 1.56 1.91 0.50 1.08Total 100.06 100.03 100.21 99.79 100.12 99.86 99.62 99.96 99.28 100.19 Total 99.32 99.29 99.97 99.47 99.53
Rb 150 170 190 170 140 140 180 150 220 170 Rb 150 95 90 84 96Sr 27 40 55 43 13 21 38 40 49 67 Sr 30 70 85 25 96Ba 190 94 180 180 70 55 200 190 210 120 Ba 300 250 300 760 840Nb 33 36 34 35 29 32 31 27 32 33 Nb 34 38 29 18 16Ta 7.41 3.7 3.62 6.6 Ta 6 6 2.9 1.94 2.23Th 17 15.2 15.4 17 Th 9.4 10.5U 5.61 5.02 4.14 U 3.52 3.49Zr 590 600 570 630 600 550 560 550 640 Zr 410 400 390 360Hf 13.7 13.3 13.2 Hf 7.7 7.8Y 68 70 68 75 78 76 64 55 70 75 Y 47 43 30 37 31Ga 21 16 20 Ga 17 17La 39 27 29 30 La 34 36 35 32 17Ce 89 79 69 85 Ce 70 65 80 88 66Pr 10.6 8.6 8.7 7.2 Pr 8.2 8.5 9.2 8.4 4.7Nd 41 35 35 28 Nd 33 35 37 32 20Sm 9.8 8.7 8.8 7.8 Sm 7.4 7.7 7 6.2 5Eu 0.18 0.2 0.14 0.09 Eu 0.6 0.6 0.56 0.82 0.87Gd 9.4 9.1 8.8 8.2 Gd 7 7 5.7 5.2 4.9Tb 1.63 1.55 1.53 1.5 Tb 1.3 1.3 0.95 0.83 0.84Dy 10.3 10.2 9.8 9.4 Dy 7.6 7.1 5.6 5.2 5.1Ho 2.31 2.23 2.18 1.9 Ho 1.6 1.5 1.1 1.17 1.13Er 6.32 6.07 6.01 5.9 Er 4.7 4.5 3.3 3.18 3.1Tm 0.95 0.91 0.9 0.95 Tm 0.67 0.64 0.53 0.49 0.46Yb 5.92 5.72 5.65 5.9 Yb 4.4 4.3 4.4 3.08 3.03Lu 0.9 0.84 0.83 0.79 Lu 0.69 0.7 0.46 0.49 0.47
Eu/Eu* 0.06 0.07 0.05 0.03 Eu/Eu* 0.25 0.25 0.27 0.44 0.54La n /Yb n 4.8 3.4 3.7 3.7 La n /Yb n 5.5 6 5.7 7.4 4.1(Na+K)/Al 0.93 0.98 0.92 1 0.91 0.9 1 0.92 0.96 0.96 (Na+K)/Al 0.92 0.84 0.84 0.98 0.89
(1) Samples 1-10 = quartz porphyry, 11-12 = feldspathic rhyolite porphyry, 13 = trachyandesite, 14 = trachydolerite.(2) Eu/Eu* = Eun/(Smn*Gdn)
1/2; (Na+K)/Al , agpaitic index = (Na2O+K2O)/Al2O3, mol.%. (3) Here and in Tables 2 and 3 hyphen = concentration of element below the detection limit.(4) Sampling localities are shown in Fig. 1; sample A255 from Amram area.

ACC
EPTE
D M
ANU
SCR
IPT
ACCEPTED MANUSCRIPT
54
1262
1263
1264
1265
1266
1267
1268
1269
1270
1271
1272
1273
Table 2. Chemical composition of representative rocks from composite dykes (CD) of bimodal suite (wt.%, ppm)
Sample no. A260-6 A197-1 A202 A198 D218a D231 A127 A127-1 A30 A66-3 A18 A285 Sample no. A260-1 A260-3 A260-4 A196-1 N-1 A197-8 A197-7 A202-2# of CD CD-1 CD-2 CD-4 CD-5 CD- # of CD _____ _____ _____ _____
Quartz porphyry from interiors Mafic rocks from marginal zonesSiO2 68.61 71.7 76.2 73.8 73.4 72.3 74.1 73.2 76 76.2 74.7 74.6 SiO2 56.6 62.2 66.7 50.8 52.8 61.3 65.5 61.7TiO2 0.46 0.33 0.2 0.29 0.28 0.28 0.25 0.35 0.16 0.13 0.14 0.2 TiO2 1.14 0.82 0.61 1.83 1.72 1.04 0.67 1.15Al2O3 13.55 13 12.05 12.4 12.35 12.6 11.6 11.8 11.6 11.6 11.2 11.8 Al2O3 16.9 15.4 14 15.3 14.7 13.9 13.3 14.65Fe2O3 2.67 0.76 1.78 2.65 2.22 4.22 2.99 2.66 2.79 2.74 2.6 2.12 Fe2O3 4.62 3.63 2.36 3.44 4.82 2.02 1.65 3.08FeO 0.92 1.81 0.16 0.26 0.46 0.23 0.34 0.72 0.32 0.18 0.16 0.13 FeO 2.69 1.96 1.78 4.35 4.1 3.14 2.12 2.25MnO 0.05 0.04 0.01 0.02 0.04 0.04 0.03 0.03 - 0.01 - 0.02 MnO 0.07 0.06 0.06 0.17 0.18 0.11 0.08 0.07MgO 1.57 0.56 0.13 0.2 0.42 0.58 0.92 0.79 0.05 0.13 - 0.34 MgO 2.65 2.22 1.49 4.47 4.6 2.5 1.1 2.7CaO 1.11 0.85 0.26 0.44 0.78 0.4 0.49 0.53 0.48 0.19 1.13 0.24 CaO 2.35 1.68 1.39 6.28 6.0 3.82 3.04 1.93Na2O 5.46 2.75 3.85 3.86 3.25 3.36 3.55 3.34 4.6 3.0 3.72 2.88 Na2O 5.51 5 4.65 3.79 3.27 3.5 2.51 3.47K2O 4.04 6.34 4.92 5.11 5.89 5.35 4.0 4.77 3.0 5.4 3.88 5.84 K2O 4.61 4.74 5.18 3.2 2.76 4.44 5.97 5.26P2O5 0.15 0.06 - - - - - 0.05 - - - - P2O5 0.33 0.23 0.2 0.38 0.4 0.2 0.12 0.39LOI 1.33 1.9 0.58 0.44 1.19 1.26 1.64 1.26 0.83 0.82 2.12 1.33 LOI 2.65 2.21 1.64 5.44 4.65 4.23 3.41 2.84Total 99.92 100.1 100.14 99.8 100.28 100.62 99.91 99.5 99.83 100.4 99.75 99.5 Total 100.1 100.2 100.1 99.45 100 100.2 99.47 99.49
Rb 100 145 140 115 130 120 91 120 95 194 135 150 Rb 107 100 120 86 65 92 140 150Sr 300 110 72 81 52 52 41 56 30 60 50 56 Sr 360 390 320 460 430 310 190 200Ba 670 460 280 240 450 320 60 70 50 150 50 240 Ba 800 900 1130 940 750 490 690 740Nb 10 25 20 30 28 29 45 51 32 34 35 30 Nb 7 9 11 13 18 19 21 14Ta 4.71 3.54 4.15 4.13 2.75 3.01 Ta 1.17 0.57Th 11.5 13 11 12.7 11.6 17.5 17.7 17.3 16 Th 4.2 3.7U 3.69 3.92 3.76 4.46 5.75 4.74 U 1.15 0.81Zr 190 430 270 470 390 440 620 660 590 590 590 410 Zr 225 180 190 210 220 320 370 360Hf 11.3 14.3 14.1 14.1 14.4 14 Hf 5.2 4.7Y 37 42 63 37 53 74 75 64 75 68 44 Y 24 21 19 28 26 35 35 54Ga 19 17 21 20 28 23 23 19 21 20 Ga 23 20La 56 42 59 48 61 60 28 43 60 58 La 24 28 37 43Ce 117 94 110 95 132 131 65 102 120 106 Ce 52 58 84 94Pr 15 11.3 15.1 15.9 7.2 12.2 14 Pr 7.1 6.8 11.1 12.4Nd 58 47 58 43 59 63 32 50 55 43 Nd 30 28 44 48Sm 10.4 10.3 11.9 12.4 9 11.6 11.5 Sm 6.1 5.6 8.7 9.2Eu 0.64 0.73 0.66 0.72 0.2 0.28 0.3 Eu 1.5 1.58 1.18 0.92Gd 10.7 9.5 11.4 11 8.5 11 11 Gd 6.4 5.2 9.0 9.6Tb 1.34 1.58 2 1.76 1.7 1.93 1.9 Tb 0.8 0.81 1.17 1.2Dy 7 8.8 11.2 10.7 10.3 11.2 11 Dy 4.2 4.7 6.2 6.6Ho 1.35 1.77 2.24 2.3 2.2 2.33 2.3 Ho 0.8 0.94 1.18 1.26Er 4.18 4.99 6.38 6.19 6.9 6.73 6.9 Er 2.35 2.6 3.48 3.77Tm 0.65 0.74 0.94 0.93 1 1.02 0.98 Tm 0.33 0.37 0.52 0.58Yb 4.15 4.93 6.11 5.81 6.7 6.57 6.5 Yb 1.96 2.45 3.26 3.65Lu 0.64 0.76 0.92 0.87 1 0.98 0.98 Lu 0.29 0.37 0.51 0.56Eu/Eu* 0.19 0.23 0.17 0.19 0.07 0.08 0.08 Eu/Eu* 0.74 0.89 0.41 0.3La n /Yb n 9.7 6.1 7.2 7.4 3 4.7 6.6 La n /Yb n 8.8 8.3 8.1 8.4(Na+K)/Al 0.98 0.88 0.97 0.96 0.95 0.9 0.88 0.9 0.93 0.93 0.92 0.94 (Na+K)/Al
Eu/Eu* = Eun/(Smn*Gdn)1/2; (Na+K)/Al , agpaitic index = (Na2O+K2O)/Al2O3, mol.%.
_____________________ CD_____in Fig. 1__
CD-6__________ ___________CD-7 CD-2________________Amram in Fig. 1__
CD-8 CD-1_______________

ACC
EPTE
D M
ANU
SCR
IPT
ACCEPTED MANUSCRIPT
55
1274
1275
1276
1277
1278
1279
1280
1281
1282
1283
1284
1285
1286
1287
1288
1289
1290
1291
Table 3. Composition of rocks collected in the cross section through the Netafim composite dyke # 2 (wt.%, ppm)
Sample no. A196-1 N-1 A196-2 A197-8 A197-7 N-6 N-2 A197 A197-1 A197-4 A197-5 N-7/1 A196-3 A197-6Rock TD TD TA TA Tdc Tdc QP QP QP TDc TA TA TA TD
1 2 3 4 5 6 7 8 9 10 11 12 13 14
SiO2 50.8 52.8 55.2 61.3 65.5 67.2 71.7 72.1 71.7 66.4 61.5 58.2 59.7 49.6TiO2 1.83 1.72 1.54 1.04 0.67 0.7 0.3 0.32 0.33 0.63 1.09 1.26 1.23 2.15Al2O3 15.3 14.7 14.6 13.9 13.3 13.0 12.7 13.3 13 13.2 14.1 13.95 14.5 15.6Fe2O3 3.44 4.82 3.27 2.02 1.65 2.82 1.46 1.64 0.76 1.67 1.33 3.87 1.84 3.89FeO 4.35 4.1 4.01 3.14 2.12 1.41 1.23 1.02 1.81 2.12 3.74 2.94 4.1 5.93MnO 0.17 0.18 0.25 0.11 0.08 0.03 0.02 0.04 0.04 0.08 0.11 0.1 0.11 0.22MgO 4.47 4.6 4.8 2.5 1.1 1.69 0.53 0.76 0.56 1.55 3.15 3.62 3.85 6.4CaO 6.28 6.0 5.35 3.82 3.04 1.65 1.19 0.55 0.85 2.73 3.24 3.52 3.88 7.08Na2O 3.79 3.27 3.76 3.5 2.51 3.21 2.38 3.71 2.75 2.96 3.51 3.62 3.46 3.74K2O 3.78 2.76 3.09 4.44 5.97 5.66 6.6 5.19 6.34 5.65 4.61 4.3 3.5 1.73P205 0.38 0.4 0.33 0.2 0.12 0.15 0.06 - 0.06 0.11 0.22 0.26 0.24 0.43LOI 5.44 4.65 4.04 4.23 3.41 2.24 1.59 1.39 1.9 3.17 3.41 3.94 3.61 3.52Total 100.03 100 100.24 100.2 99.47 99.76 99.76 99.99 100.1 100.27 100.01 99.58 100.02 100.29
Rb 86 65 72 92 140 140 160 105 145 135 100 98 69 37Sr 460 430 410 310 190 170 150 105 110 230 290 340 330 560Ba 940 750 670 490 690 370 530 240 460 500 540 590 420 560Nb 13 18 15 19 21 32 37 26 25 22 21 20 19 12Zr 210 220 240 320 370 380 440 430 430 380 310 270 280 200Y 28 26 27 35 35 34 43 43 37 34 33 25 37 23
Abbreviations: TD = trachydolerite; TA = trachyandesite; Tdc = trachydacite; QP = quartz porphyry.

ACC
EPTE
D M
ANU
SCR
IPT
ACCEPTED MANUSCRIPT
56
1292
1293
Table 4. δ18O values (‰, SMOW) in minerals from dyke rocks
Sample no. Rock Qtz Afs [Pl] Zrn[Cpx]
Bimodal dyke suite 3A197-6 trachydolerite [11.16] [5.78]
A52 quartz porphyry, stock 9.10 11.86 6.49A197 quartz porphyry, dyke 8.57 13.27
A197-1 " 8.60 13.12 6.45A-129 " 8.9A-157 " 8.71 14.73A198 " 9.69 12.95 7.23A202 " 9.65 13.41A128 " 8.75 10.67A149 " 8.9 14.1A285 " 8.3 15.45
D218a " 8.68 13.43Dyke suite 2
A148 andesite porphyry [11.13]A160-1 dacite porphyry [13.58]
Dyke suite 1A173a microdiorite [11.12]
A28 lamprophyre [10.06]A25 " [10.84]
1294
1295
1296
1297
1298
1299
1300
1301
1302
1303

ACC
EPTE
D M
ANU
SCR
IPT
ACCEPTED MANUSCRIPT
57
1304
1305
1306
1307
1308
1309
1310
1311
1312
1313
1314
1315
1316
1317
1318
1319
Table 5. Nd-Sr and δ18O (WR) isotope compositions of rocks from the dyke suite 3 (southern Israel) and the Katharina ring complex (Sinai, Egypt)
Sample no Rock Rb Sr 87Rb/ 87Sr/ ±2σ I (Sr) Sm Nd 147Sm/ 143Nd/ ±2σ εNd(0) εNd(T) f TDM-1 TDM-2 δ18O
(ppm) (ppm) 86Sr 86Sr (ppm) (ppm) 144Nd 144Nd (Sm/Nd) (Ma) (Ma) WR
Dyke suite 3 (590 Ma)
A18 quartz porphyry 144.6 78.3 5.38 0.780104 15 0.73483 11.51 55.33 0.1258 0.512484 9 -3.0 2.3 -0.36 1154 1077 11.71
A66-3 " 211.5 103.8 5.94 0.781755 11 0.73180 11.59 49.75 0.1408 0.512544 8 -1.8 2.4 -0.28 1267 1001 12.76
A30 " 102.7 50.9 5.88 0.785968 14 0.73648 9.41 32.18 0.1768 0.512606 10 -0.6 0.9 -0.10 11.49
A127 " 97.8 73.7 3.86 0.759867 16 0.72740 11.87 58.84 0.1220 0.512510 12 -2.5 3.1 -0.38 1063 1030 12.16
A198 " 119.9 126.0 2.76 0.742676 11 0.71943 10.33 46.7 0.1337 0.512465 18 -3.4 1.4 -0.32 1304 1118 11.52
A147-2 rhyolite porphyry 86.3 54.9 4.58 0.773803 17 0.73529 8.14 40.59 0.1212 0.512476 15 -3.2 2.5 -0.38 1111 1083 11.15
A156-1 " 106.6 157.7 1.96 0.728985 13 0.71253 5.84 22.54 0.1566 0.512553 10 -1.7 1.4 -0.20 1591 1008 9.79
A196-1 trachydolerite 70.0 457.1 0.44 0.708304 10 0.70458 6.64 31.82 0.1262 0.512502 10 -2.7 2.7 -0.36 1128 10.54
N-1 " 40.7 698.7 0.17 0.707539 14 0.70612 5.63 27.68 0.1230 0.512486 14 -3.0 2.6 -0.37 1115 9.24
D21aa " 101.8 166.7 1.77 0.727299 12 0.71241 11.03 50.04 0.1333 0.512494 11 -2.8 2.0 -0.32 1242 10.5
A196-4a trachyandesite 6.73 32.73 0.1243 0.512478 12 -3.1 2.3 -0.37 1145 10.92
A127-2 " 9.87 47.3 0.1262 0.512535 12 -2.0 3.3 -0.36 1070 13.1
Katharina ring complex (590 Ma)
D163 syenogranite, pluton 220.5 91.29 7.01 0.758037 8 0.69904 6.34 32.57 0.1177 0.512519 3 -2.3 3.6 -0.40 1002 1010 9.18
D165 " 238.3 86.75 7.98 0.767362 8 0.70020 7.26 36.33 0.1208 0.512546 3 -1.8 3.9 -0.39 991 971 8.15
IL-66 quartz monz. porphyry 53.8 396.9 0.37 0.706085 7 0.70300 10.97 62.42 0.1062 0.512571 3 -1.3 5.5 -0.46 822 911 7.12
IL-161 quartz syenite porphyry 99.6 305.3 0.94 0.710773 7 0.70284 12.08 72.82 0.1003 0.512503 3 -2.6 4.6 -0.49 870 1012 7.13
AG-32 peralk. granite porphyry 204.9 8.96 69.9 1.291379 10 0.70372 12.17 63.49 0.1159 0.512558 3 -1.6 4.5 -0.41 923 945 9.19
(1) To obtain meaningful model ages, TDM were calculated for samples with f(Sm/Nd) that range from -0.2 to -0.6 (Wu et al., 2002). (2) For mafic rocks only one-stage model age (TDM-1) was calculated.
(3) Samples IL-66, IL-161 and AG-32 are from ring dykes.

ACC
EPTE
D M
ANU
SCR
IPT
ACCEPTED MANUSCRIPT
58
1320
1321
Table 6. Results of modelling of magma mixing for the Netafim composite dyke #2
Trachydolerite Qtz porphyrySample n=3 n=3 Observed Calculated Observed Calculatedwt.%SiO2 54.28 73.15 61.79 62.07 68.69 68.99TiO2 2.02 0.33 1.28 1.28 0.69 0.67Al2O3 16.15 13.24 14.83 14.81 13.63 13.78
FeOt 8.97 2.56 6.07 6.16 3.85 3.86MgO 5.48 0.63 3.74 3.36 1.50 1.62CaO 6.85 0.88 4.14 4.25 2.55 2.09Na2O 3.83 3 3.73 3.45 2.99 3.16K2O [2.00] 6.15 4.17 3.77 5.96 5.28P2O5 0.42 0.05 0.26 0.26 0.13 0.13
Sum residuals squared 0.40 0.74Mixing components (wt.%)Basic magma 56.8 20.5Felsic magma 43.2 79.5
ppmRb [50] 137 86 87 138 118Ba 750 410 543 600 520 478Sr 483 122 336 326 197 195Zr 210 433 285 305 377 386Nb 14 29 19 21 25 26Y 26 41 32 32 34 38La 26 56 37 39 43 50Ce 55 117 84 81 94 104Nd 29 58 44 41 48 52Sm 5.9 10.4 8.7 7.8 9.2 9.4Eu 1.54 0.64 1.18 1.1 0.92 0.8Gd 5.8 10.7 9 8 9.6 9.7Dy 4.5 7 6.2 5.5 6.6 6.4Er 2.48 4.18 3.48 3.2 3.77 3.89Yb 2.21 4.15 3.26 3 3.65 3.7
(1) Modelling was done using the program IGPET (Terra Softa Inc., 1994).(2) In rock compositions major elements are recalculated to total = 100% volatile free. (3) In trachydolerite, accepted contents of K2O = 2 wt.% and Rb = 50 ppm are in brackets (see section 7.1).(4) Total Fe as FeOt.
Mixing magmas Hybrid magmasTrachyandesite (n=5) Trachydacite (n=3)
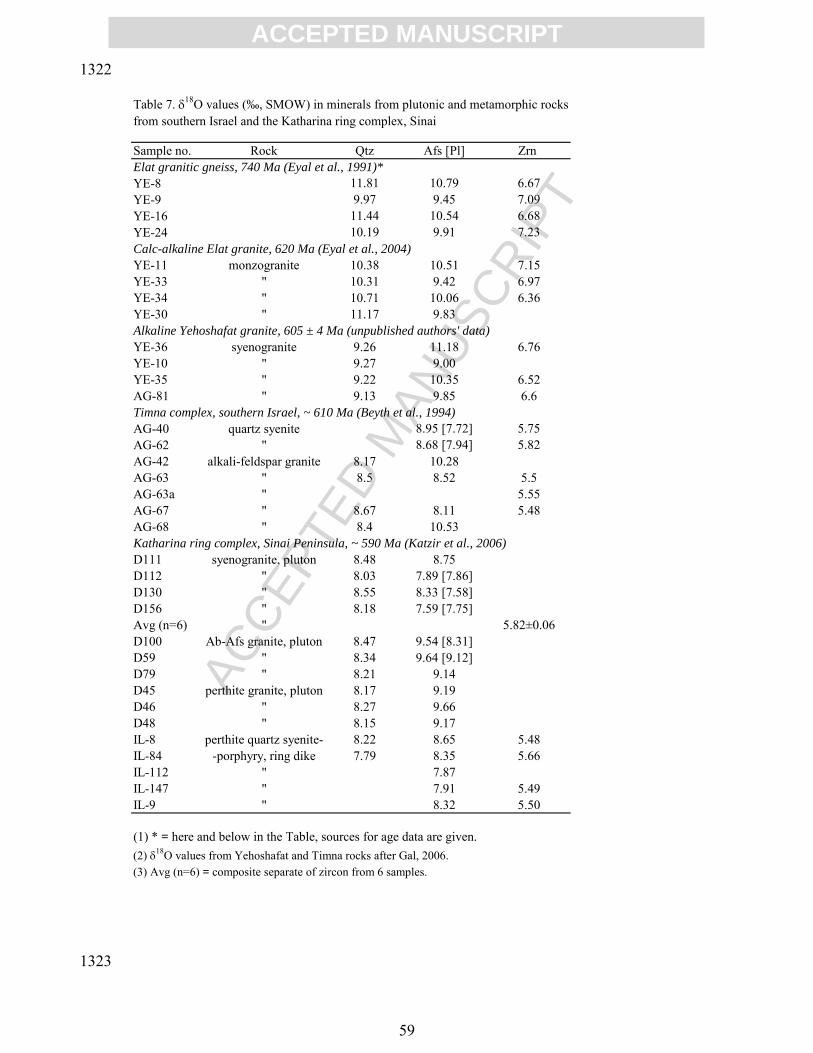
ACC
EPTE
D M
ANU
SCR
IPT
ACCEPTED MANUSCRIPT
59
1322
1323
Table 7. δ18O values (‰, SMOW) in minerals from plutonic and metamorphic rocksfrom southern Israel and the Katharina ring complex, Sinai
Sample no. Rock Qtz Afs [Pl] Zrn Elat granitic gneiss, 740 Ma (Eyal et al., 1991)* YE-8 11.81 10.79 6.67YE-9 9.97 9.45 7.09YE-16 11.44 10.54 6.68YE-24 10.19 9.91 7.23Calc-alkaline Elat granite, 620 Ma (Eyal et al., 2004) YE-11 monzogranite 10.38 10.51 7.15YE-33 " 10.31 9.42 6.97YE-34 " 10.71 10.06 6.36YE-30 " 11.17 9.83Alkaline Yehoshafat granite, 605 ± 4 Ma (unpublished authors' data)YE-36 syenogranite 9.26 11.18 6.76YE-10 " 9.27 9.00YE-35 " 9.22 10.35 6.52AG-81 " 9.13 9.85 6.6Timna complex, southern Israel, ~ 610 Ma (Beyth et al., 1994)AG-40 quartz syenite 8.95 [7.72] 5.75AG-62 " 8.68 [7.94] 5.82AG-42 alkali-feldspar granite 8.17 10.28AG-63 " 8.5 8.52 5.5AG-63a " 5.55AG-67 " 8.67 8.11 5.48AG-68 " 8.4 10.53Katharina ring complex, Sinai Peninsula, ~ 590 Ma (Katzir et al., 2006) D111 syenogranite, pluton 8.48 8.75D112 " 8.03 7.89 [7.86]D130 " 8.55 8.33 [7.58]D156 " 8.18 7.59 [7.75]Avg (n=6) " 5.82±0.06D100 Ab-Afs granite, pluton 8.47 9.54 [8.31]D59 " 8.34 9.64 [9.12]D79 " 8.21 9.14D45 perthite granite, pluton 8.17 9.19D46 " 8.27 9.66D48 " 8.15 9.17IL-8 perthite quartz syenite- 8.22 8.65 5.48IL-84 -porphyry, ring dike 7.79 8.35 5.66IL-112 " 7.87IL-147 " 7.91 5.49IL-9 " 8.32 5.50
(1) * = here and below in the Table, sources for age data are given. (2) δ18O values from Yehoshafat and Timna rocks after Gal, 2006. (3) Avg (n=6) = composite separate of zircon from 6 samples.

ACC
EPTE
D M
ANU
SCR
IPT
ACCEPTED MANUSCRIPT
60
1324
1325
1326

ACC
EPTE
D M
ANU
SCR
IPT
ACCEPTED MANUSCRIPT
61
1327
1328
1329
1330
1331
1332

ACC
EPTE
D M
ANU
SCR
IPT
ACCEPTED MANUSCRIPT
62
1333
1334
1335
1336
1337
1338
1339
1340
1341

ACC
EPTE
D M
ANU
SCR
IPT
ACCEPTED MANUSCRIPT
63
1342
1343
1344
1345
1346

ACC
EPTE
D M
ANU
SCR
IPT
ACCEPTED MANUSCRIPT
64
1347
1348
1349
1350
1351
1352
1353
1354
1355
1356
1357
1358
1359
1360
1361
1362
1363

ACC
EPTE
D M
ANU
SCR
IPT
ACCEPTED MANUSCRIPT
65
1364

ACC
EPTE
D M
ANU
SCR
IPT
ACCEPTED MANUSCRIPT
66
1365
1366
1367
1368
1369
1370
1371
1372
1373
1374
1375
1376
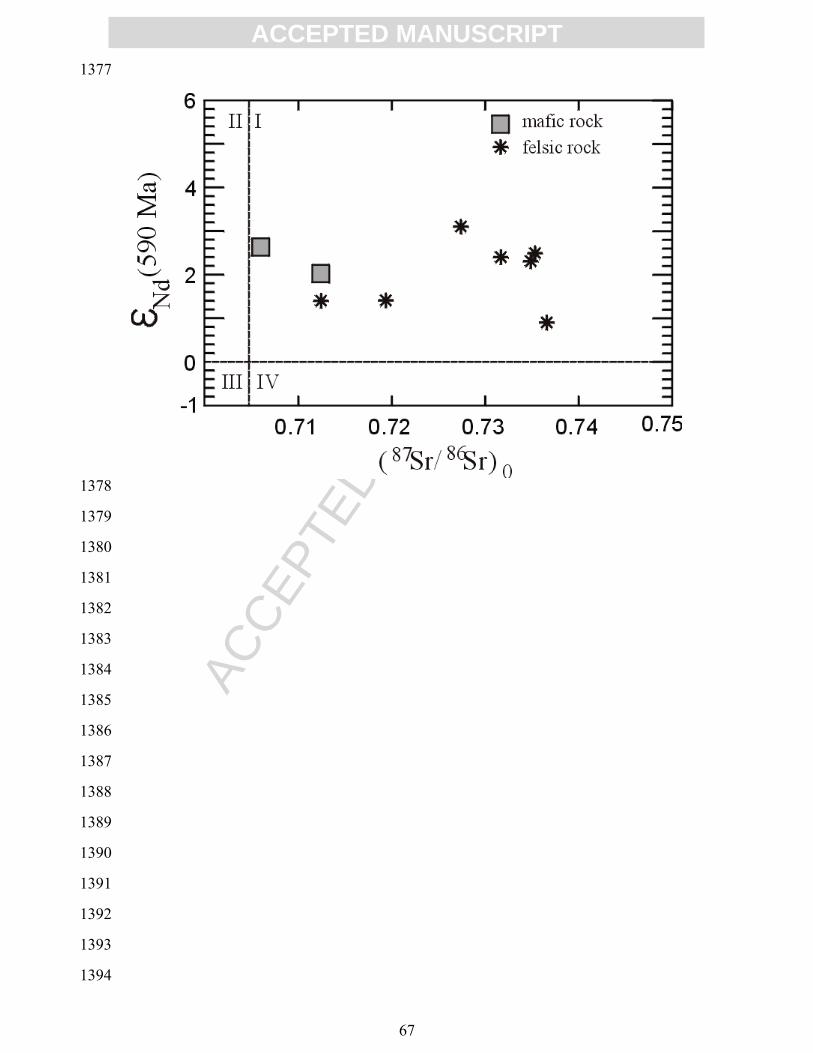
ACC
EPTE
D M
ANU
SCR
IPT
ACCEPTED MANUSCRIPT
67
1377
1378
1379
1380
1381
1382
1383
1384
1385
1386
1387
1388
1389
1390
1391
1392
1393
1394

ACC
EPTE
D M
ANU
SCR
IPT
ACCEPTED MANUSCRIPT
68
1395
1396
1397
1398
1399
1400
1401
1402
1403

ACC
EPTE
D M
ANU
SCR
IPT
ACCEPTED MANUSCRIPT
69
1404
1405
1406
1407
1408
1409
1410
1411
1412
1413
1414
1415
1416
1417
1418
1419

ACC
EPTE
D M
ANU
SCR
IPT
ACCEPTED MANUSCRIPT
70
1420
1421
1422
1423
1424
1425
1426
1427
1428
1429
1430
1431
1432
1433
1434
1435
1436
1437

ACC
EPTE
D M
ANU
SCR
IPT
ACCEPTED MANUSCRIPT
71
1438

ACC
EPTE
D M
ANU
SCR
IPT
ACCEPTED MANUSCRIPT
72
1439
1440
1441
1442
1443
1444
1445
1446
1447
1448
1449
1450
1451
1452
1453
1454
1455
1456
1457
1458
1459
1460
1461
1462

ACC
EPTE
D M
ANU
SCR
IPT
ACCEPTED MANUSCRIPT
73
1463
1464
1465
1466
1467
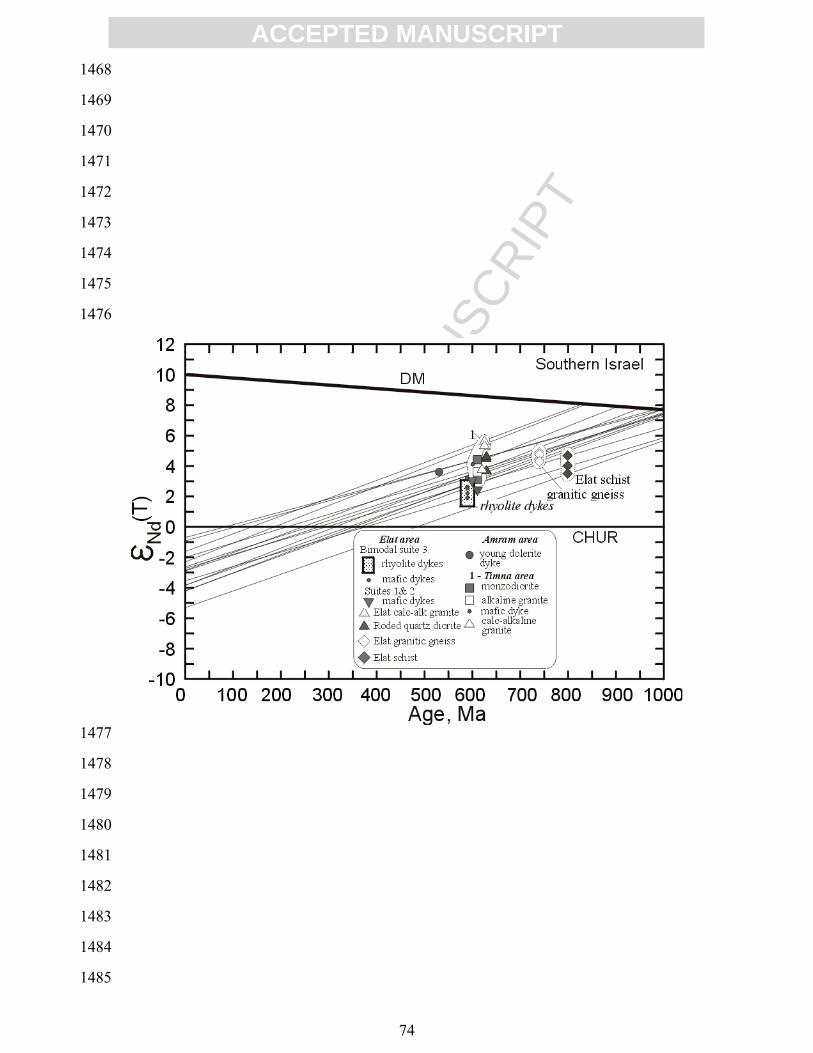
ACC
EPTE
D M
ANU
SCR
IPT
ACCEPTED MANUSCRIPT
74
1468
1469
1470
1471
1472
1473
1474
1475
1476
1477
1478
1479
1480
1481
1482
1483
1484
1485

ACC
EPTE
D M
ANU
SCR
IPT
ACCEPTED MANUSCRIPT
75
1486
1487
1488
1489
1490
1491
1492
1493
1494
1495
1496
1497