literature review of other rock piles: … · literature review of other rock piles:...
TRANSCRIPT

1
Questa Rock Pile Weathering Stability Project
LITERATURE REVIEW OF OTHER ROCK PILES: CHARACTERIZATION, WEATHERING, AND STABILITY
Virginia T. McLemore, Ahmadali Fakhimi, Dirk van Zyl, Gertrude F. Ayakwah, Kojo Anim, Kwaku Boakye, Frederick Ennin, Prosper Felli, Del Fredlund, Luiza A.F. Gutierrez, Samuel
Nunoo, Samuel Tachie-Menson, and Vanessa C. Viterbo
June 6, 2009
New Mexico Bureau of Geology and Mineral Resources
Open-file Report OF-517
Molycorp Task B4.2.5

2
EXECUTIVE SUMMARY
The purpose of this report is to present an extensive literature review of • construction of rock piles • factors influencing shear strength of soil • characterization of rock piles throughout the world • the effects of weathering on rock piles throughout the world • stability of rock piles throughout the world.
The shape of mine rock piles is mainly based on the nature and topography of where they are emplaced. The dumping method of rock-pile material can be used to classify rock piles. The Questa rock piles were constructed predominantly by end-dumping as side-hill or valley-fill configurations. The rock piles are stratified. The Questa rock piles are some of the largest rock piles in slope length in the world.
The geotechnical properties of Questa rock pile material have many similarities with those of rock pile materials worldwide. The majority of rock pile failures have occurred at the coal mines, where the materials are in general weaker than at porphyry-type mines such as Questa rock-pile material. The weathering of Questa rock-pile material during last 25-40 years has caused reduction of rock strength and durability of some samples of the surface layer of GHN rock pile and an increase in cohesion in the locations where in-situ shear tests were conducted. These changes are consistent with those reported in the literature. Many rock pile failures are in coal and other sedimentary rocks because coal deposits consist of weaker rocks and can allow greater pore water pressure into the rock piles that can result in slope instability. Geological significance This report summarizes different geological parameters of rock piles from throughout the world. Weathering significance This report summarizes studies of weathering characteristics of rock piles from throughout the world. Geotechnical significance This report summarizes different geotechnical parameters of rock piles from throughout the world. Interface significance This report provides parameters of rock piles similar to Questa rock piles that are both stable and have reported slope failures.
3
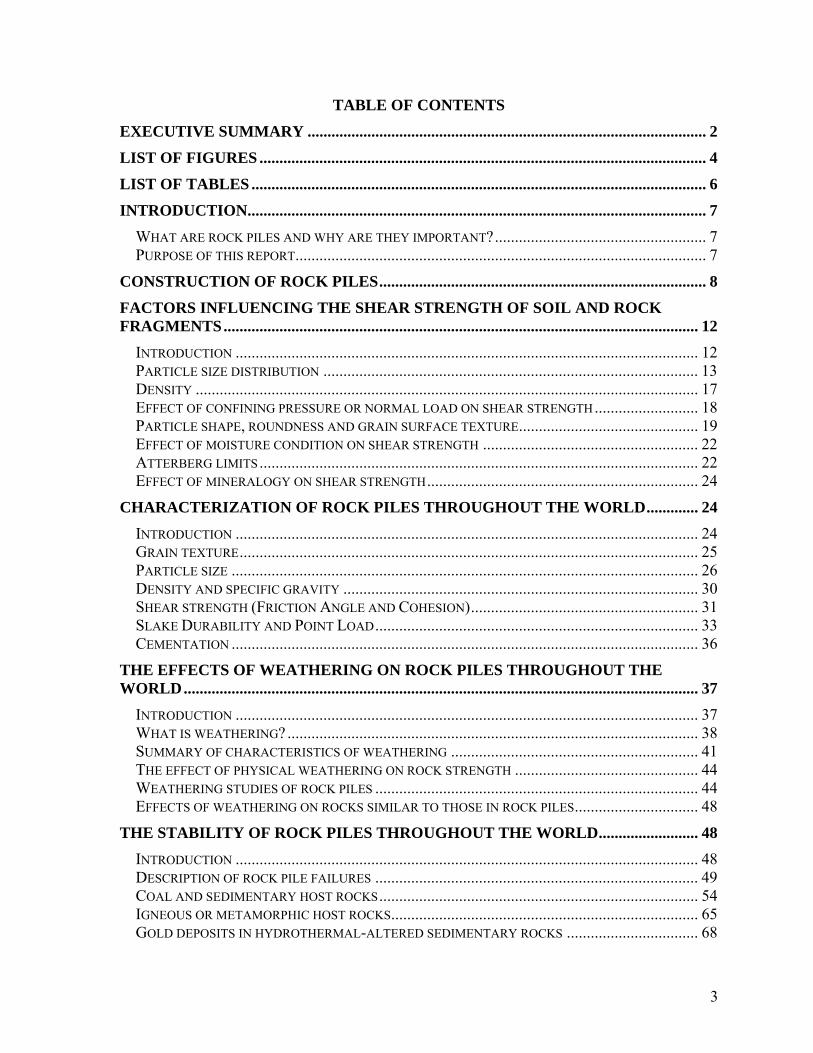
TABLE OF CONTENTS
EXECUTIVE SUMMARY .................................................................................................... 2
LIST OF FIGURES ................................................................................................................ 4
LIST OF TABLES .................................................................................................................. 6
INTRODUCTION................................................................................................................... 7 WHAT ARE ROCK PILES AND WHY ARE THEY IMPORTANT? ..................................................... 7 PURPOSE OF THIS REPORT ....................................................................................................... 7
CONSTRUCTION OF ROCK PILES .................................................................................. 8
FACTORS INFLUENCING THE SHEAR STRENGTH OF SOIL AND ROCK FRAGMENTS ....................................................................................................................... 12
INTRODUCTION .................................................................................................................... 12 PARTICLE SIZE DISTRIBUTION .............................................................................................. 13 DENSITY .............................................................................................................................. 17 EFFECT OF CONFINING PRESSURE OR NORMAL LOAD ON SHEAR STRENGTH .......................... 18 PARTICLE SHAPE, ROUNDNESS AND GRAIN SURFACE TEXTURE ............................................. 19 EFFECT OF MOISTURE CONDITION ON SHEAR STRENGTH ...................................................... 22 ATTERBERG LIMITS .............................................................................................................. 22 EFFECT OF MINERALOGY ON SHEAR STRENGTH .................................................................... 24
CHARACTERIZATION OF ROCK PILES THROUGHOUT THE WORLD ............. 24 INTRODUCTION .................................................................................................................... 24 GRAIN TEXTURE ................................................................................................................... 25 PARTICLE SIZE ..................................................................................................................... 26 DENSITY AND SPECIFIC GRAVITY ......................................................................................... 30 SHEAR STRENGTH (FRICTION ANGLE AND COHESION) ......................................................... 31 SLAKE DURABILITY AND POINT LOAD ................................................................................. 33 CEMENTATION ..................................................................................................................... 36
THE EFFECTS OF WEATHERING ON ROCK PILES THROUGHOUT THE WORLD ................................................................................................................................. 37
INTRODUCTION .................................................................................................................... 37 WHAT IS WEATHERING? ....................................................................................................... 38 SUMMARY OF CHARACTERISTICS OF WEATHERING .............................................................. 41 THE EFFECT OF PHYSICAL WEATHERING ON ROCK STRENGTH .............................................. 44 WEATHERING STUDIES OF ROCK PILES ................................................................................. 44 EFFECTS OF WEATHERING ON ROCKS SIMILAR TO THOSE IN ROCK PILES ............................... 48
THE STABILITY OF ROCK PILES THROUGHOUT THE WORLD ......................... 48 INTRODUCTION .................................................................................................................... 48 DESCRIPTION OF ROCK PILE FAILURES ................................................................................. 49 COAL AND SEDIMENTARY HOST ROCKS ................................................................................ 54 IGNEOUS OR METAMORPHIC HOST ROCKS ............................................................................. 65 GOLD DEPOSITS IN HYDROTHERMAL-ALTERED SEDIMENTARY ROCKS ................................. 68
4
SUMMARY OBSERVATIONS .......................................................................................... 73 CONSTRUCTION OF ROCK PILES ............................................................................................ 73 CHARACTERIZATION OF ROCK PILES THROUGHOUT THE WORLD .......................................... 73 THE EFFECTS OF WEATHERING ON ROCK PILES THROUGHOUT THE WORLD ........................... 77 STABILITY OF ROCK PILES THROUGHOUT THE WORLD .......................................................... 78
REFERENCES AND ANNOTATED BIBLIOGRAPHY ................................................. 78
APPENDIX 1. STATISTICAL ANALYSES .................................................................... 100
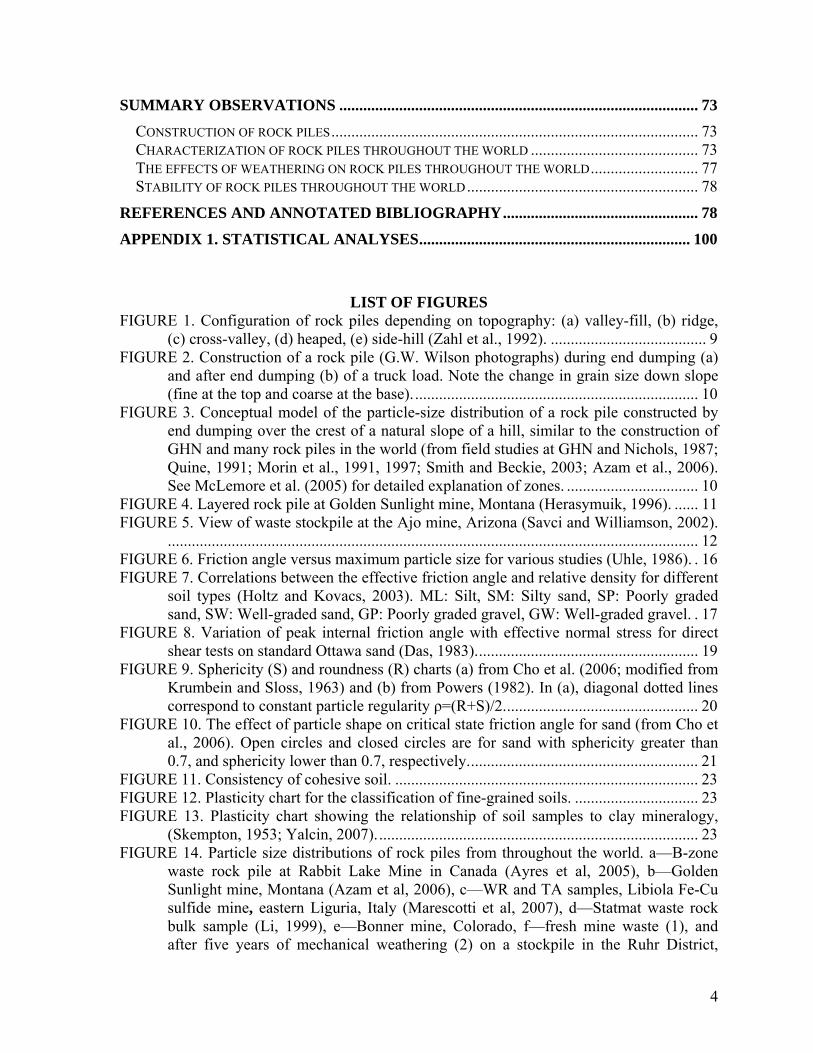
LIST OF FIGURES FIGURE 1. Configuration of rock piles depending on topography: (a) valley-fill, (b) ridge,
(c) cross-valley, (d) heaped, (e) side-hill (Zahl et al., 1992). ....................................... 9 FIGURE 2. Construction of a rock pile (G.W. Wilson photographs) during end dumping (a)
and after end dumping (b) of a truck load. Note the change in grain size down slope (fine at the top and coarse at the base). ....................................................................... 10
FIGURE 3. Conceptual model of the particle-size distribution of a rock pile constructed by end dumping over the crest of a natural slope of a hill, similar to the construction of GHN and many rock piles in the world (from field studies at GHN and Nichols, 1987; Quine, 1991; Morin et al., 1991, 1997; Smith and Beckie, 2003; Azam et al., 2006). See McLemore et al. (2005) for detailed explanation of zones. ................................. 10
FIGURE 4. Layered rock pile at Golden Sunlight mine, Montana (Herasymuik, 1996). ...... 11 FIGURE 5. View of waste stockpile at the Ajo mine, Arizona (Savci and Williamson, 2002).
..................................................................................................................................... 12 FIGURE 6. Friction angle versus maximum particle size for various studies (Uhle, 1986). . 16 FIGURE 7. Correlations between the effective friction angle and relative density for different
soil types (Holtz and Kovacs, 2003). ML: Silt, SM: Silty sand, SP: Poorly graded sand, SW: Well-graded sand, GP: Poorly graded gravel, GW: Well-graded gravel. . 17
FIGURE 8. Variation of peak internal friction angle with effective normal stress for direct shear tests on standard Ottawa sand (Das, 1983). ....................................................... 19
FIGURE 9. Sphericity (S) and roundness (R) charts (a) from Cho et al. (2006; modified from Krumbein and Sloss, 1963) and (b) from Powers (1982). In (a), diagonal dotted lines correspond to constant particle regularity ρ=(R+S)/2. ................................................ 20
FIGURE 10. The effect of particle shape on critical state friction angle for sand (from Cho et al., 2006). Open circles and closed circles are for sand with sphericity greater than 0.7, and sphericity lower than 0.7, respectively. ......................................................... 21
FIGURE 11. Consistency of cohesive soil. ............................................................................ 23 FIGURE 12. Plasticity chart for the classification of fine-grained soils. ............................... 23 FIGURE 13. Plasticity chart showing the relationship of soil samples to clay mineralogy,
(Skempton, 1953; Yalcin, 2007). ................................................................................ 23 FIGURE 14. Particle size distributions of rock piles from throughout the world. a—B-zone
waste rock pile at Rabbit Lake Mine in Canada (Ayres et al, 2005), b—Golden Sunlight mine, Montana (Azam et al, 2006), c—WR and TA samples, Libiola Fe-Cu sulfide mine, eastern Liguria, Italy (Marescotti et al, 2007), d—Statmat waste rock bulk sample (Li, 1999), e—Bonner mine, Colorado, f—fresh mine waste (1), and after five years of mechanical weathering (2) on a stockpile in the Ruhr District,

5
Germany (Neumann-Mahlkau, 1993), g—range of four rock piles from Carlin deposits, Nevada (Quine, 1993), h—soil cover, oxidized rock and waste rock before oxidation (Yazdani, 1995). ......................................................................................... 30
FIGURE 15. Acid drainage (AD) tetrahedron, showing the relationship between the four components that produce AD and promote the weathering or oxidation of minerals (McLemore and the Steering Committee of ADTI, 2008). ........................................ 40
FIGURE 16. Factors affecting weathering (Lan et al., 2003). ................................................ 42 FIGURE 17. Correlation of weathering grade with dry density and porosity. High/mean/low
values are plotted for each grade (from Thuro and Scholz, 2003). Density decreased and porosity increased as weathering grade increased. .............................................. 46
FIGURE 18. Possible failure modes in mine rock piles (Caldwell and Moss, 1981). ............ 50 FIGURE 19. Effect of highwall height and percentage of soil and slakable rock in the
highwall on the rock pile stability (Douglass and Bailey, 1982). ............................... 59 FIGURE 20. Friction angle of spoil versus the amount of soil and slakable material in
corresponding highwall zone (Douglas and Bailey, 1982). ........................................ 59 FIGURE 21. Friction angle (total stress) versus water content of spoil (Douglass and Bailey,
1982). .......................................................................................................................... 60 FIGURE 22. Cohesion versus percent compaction for spoil (Douglass and Bailey, 1982). .. 60 FIGURE 23. Plasticity index vs. fricition angle for 60 samples from 12 coal mine rock piles
in east-central Ohio (Shakoor and Ruof, 1989). ......................................................... 64 FIGURE 24. Particle size distributions of rock piles world-wide (a) and GHN rock pile (b),
Questa (see Table 3 for references, GHN values from project reports). ..................... 73 FIGURE 25. Histograms of density of rock piles world-wide and GHN rock pile, Questa
mine (see Table 4 for references, GHN and Questa rock piles values from McLemore et al. (2008c). Note histogram of density for rock piles world-wide includes maximum and minimum or average values for specific locations, including coal and other sedimentary mines, listed in Table 4. ................................................................ 74
FIGURE 26. Histograms of specific gravity of rock piles world-wide and GHN rock pile, Questa mine (see Table 4 for references, GHN values from project reports). Note histogram of specific gravity for rock piles world-wide includes maximum and minimum or average values for specific locations, including coal mines and other sedimentary rocks, listed in Table 4. .......................................................................... 75
FIGURE 27. Atterberg Limits for various rock piles throughout the world, including Goathill North, Questa mine (see Table 4 for references, GHN values from project reports). 75
FIGURE 28. Plasticity index vs. fricition angle for coal spoil samples from Shakoor and Ruof (1989) compared to Goathill North (GHN) and other Questa samples (GHN and other Questa values from project reports). .................................................................. 76
FIGURE 29. Histograms of porosities of rock piles world-wide and GHN rock pile, Questa (see Table 4 for references, GHN values from project reports). Note histogram of porosities for rock piles world-wide includes maximum and minimum or average values for specific locations, including coal and other sedimentary mines, listed in Table 4. ....................................................................................................................... 76
FIGURE 30. Histograms of friction angles of rock piles world-wide and GHN rock pile, Questa (see Table 5 for references, GHN values from McLemore et al., 2008c). Note histogram of friction angles for rock piles world-wide includes maximum and

6
minimum or average values for specific locations, including coal and other sedimentary mines, listed in Table 5. .......................................................................... 77
LIST OF TABLES
TABLE 1. Terms and definitions for mine waste (van Zyl et al., 2002; Neuendorf et al., 2005). ............................................................................................................................ 7
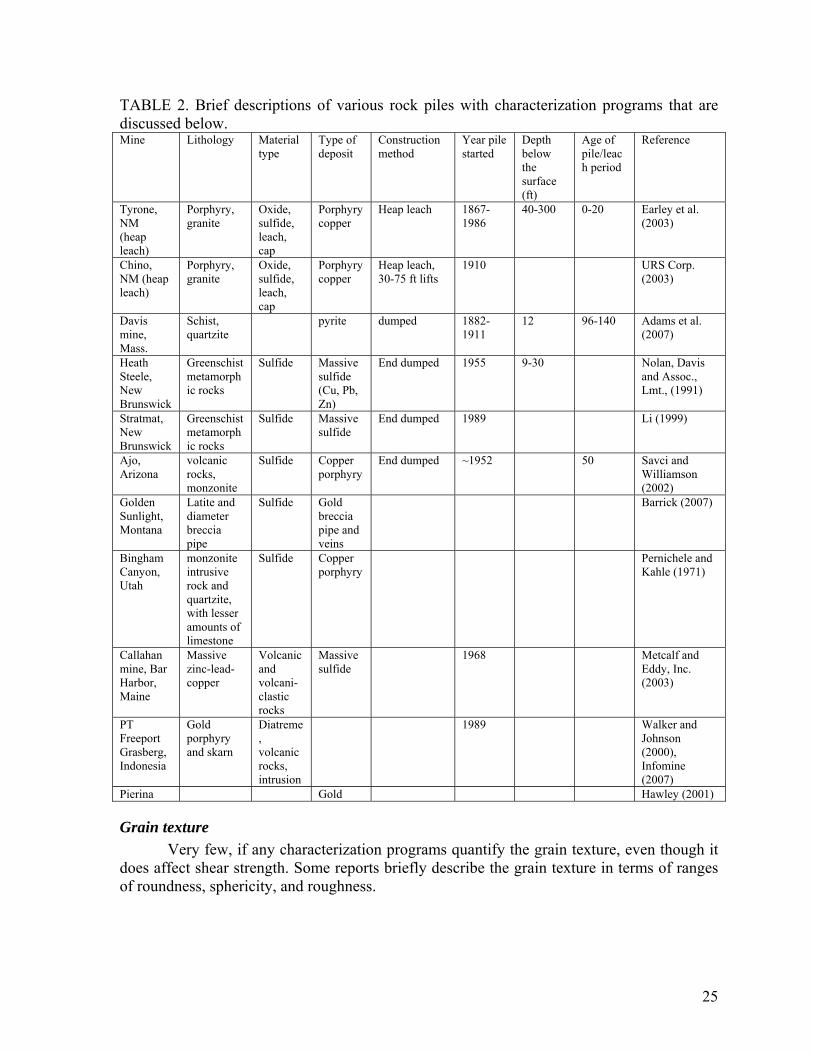
TABLE 2. Brief descriptions of various rock piles with characterization programs that are discussed below. ......................................................................................................... 25
TABLE 3. Distribution of particle size of rock piles around the world. ................................ 26 TABLE 4. Summary of various parameters of rock piles throughout the world. ................... 30 TABLE 5. Summary of mine rock values of friction angle and cohesion. ............................. 32 TABLE 6. This table shows factors that affect durability and strength of rocks tests
(Koncagül and Santi, 1999; Cheema et al., 2004). ..................................................... 33 TABLE 7. Summary of slake durability indices (ID2) from locations around the world ...... 34 TABLE 8. Summary of typical point load indices of different locations around the world.
*chloritized quartz–phylic fragmental rhyolite. .......................................................... 35 TABLE 9. Weathering field survey used to characterize the weathering sequence in the
gneiss. Weathering grades I, II, and VI were unavailable to survey (after Calcaterra et al., 1998). .................................................................................................................... 46
TABLE 10. Main engineering-geological features of weathered horizons near Acri (after Calcaterra et al., 1998). The numbers in brackets refer to the number of samples tested, and n.d. = not determined. ............................................................................... 46
TABLE 11. Shear strength parameters of sedimentary residual soil with weathering grades varying from III to V. The lower end is for less weathered material and the higher end is for more weathered material (Huat et al., 2005). .................................................... 47
TABLE 12. Brief description of mine-rock piles that had reported slope failures. ................ 51 TABLE 13. Some engineering properties of generic spoil types (Douglass and Bailey, 1982).
..................................................................................................................................... 61 TABLE 14. Summary of the engineering properties for each individual bulk spoil samples
(Shakoor and Ruof, 1989, dimensions of some parameters were changed from English to metric system)............................................................................................ 62
TABLE 15. Geotechnical properties of a tailings deposit in Montru valley, Romania studied by Stanciucu (2005). ................................................................................................... 65
TABLE 16. Results of triaxial tests at failure on rock-pile material (Linero et al. 2007). e1=Initial void ratio after isotropic consolidation; σ3=Confining pressure; σ1/ σ3 = Principal stresses ratio; Friction angle is at origin (considering null cohesion); Axial strain is at failure; Volumetric strain is at failure. Conventional signs for strain: (-) compression, (+) expansion; Bg = Marsal particle breakage parameter (represents, approximately, the percentage in weight of the particles that have suffered fragmentation). ............................................................................................................ 68
TABLE 17. Description of samples from gold mines in Nevada studied by Quine (1993). .. 69 TABLE 18. Point load test results from gold mines in Nevada (Quine, 1993). ..................... 70 TABLE 19. Slake durability test results from gold mines in Nevada (Quine, 1993). ............ 70 TABLE 20. Materials classification testing for Gold Quarry NWRF (Barkley et al., 2006). 72

7
INTRODUCTION What are rock piles and why are they important? Rock piles, the preferred term by some in the metal mining industry today, refer to the man-made structures consisting of piles of non-ore overburden material that had to be removed in order to extract ore. This material, referred to in older literature as mine waste, mine soils, overburden, stockpiles, subore, or proto-ore, does not include the tailings material, which consists of material remaining after milling. Table 1 is a list of definitions of some of the different types of mine waste. TABLE 1. Terms and definitions for mine waste (van Zyl et al., 2002; Neuendorf et al., 2005).
Term Definition Overburden
The barren rock above the mineral resource that must be removed in order to mine the mineral resource.
Mine rock piles (Waste rock)
Barren or uneconomic mineralized rock that has been mined, but is not of sufficient value to warrant treatment and is therefore removed ahead of processing. It can include overburden.
Low grade ore stockpiles
Rock that has been mined and stockpiled with sufficient value to warrant processing, either when blended with higher-grade rock or after higher-grade ore is exhausted, but many times left as ‘waste’.
Tailings
The washed solid product from the processing treatment and mineral concentration technique (generally from mills) that are considered too low grade to be treated further. Tailings are the finely ground host rock materials from which the desired mineral values have been largely extracted.
Heap leach spent ore
Broken rock remaining after recovery of metals through heap leaching.
During open-pit mining, the overburden material was removed to gain access to the ore and placed in massive rock piles. The unit operations associated with the production and removal of overburden and rock materials include: drilling, blasting, loading and hauling (Hartman and Mutmansky, 2002). Blast hole spacing, amount of explosives and the characteristics of the in-situ rock materials determine the size of rock fragments resulting from blasting. Traditionally, this material was discarded in the most efficient and least costly manner possible by dumping in rock piles as close to the open pit as possible to limit haulage costs. Typically, these rock piles were not characterized or studied extensively because they had little significance to the operating mine. However, many rock piles subsequently developed environmental problems including acid rock drainage (ARD), leaching of heavy metals, erosion, slope stability concerns, and undesirable aesthetic attributes. There is an increasing need for basic information and understanding of the construction, characterization, and processes occurring within these man-made features.
Purpose of this report The purpose of this report is to present an extensive literature review of
• construction of rock piles • factors influencing shear strength of soil and rock fragments • characterization of rock piles throughout the world • the effects of weathering on rock piles throughout the world • stability of rock piles throughout the world.

8
This review presents a summary of observations for coal and metal mining. While the latter information is more directly applicable to the Questa project, the information obtained for coal mining helps to understand the broad range in the characteristics of rock piles on an international basis. Furthermore, this review focused on published information and does not include a complete review of engineering reports, permitting documents and other similar documents that were submitted for a specific project. More detailed descriptions of the Questa rock piles are in other reports.
CONSTRUCTION OF ROCK PILES
The shape of mine rock piles is mainly based on the nature and topography of where they are emplaced. Mine rock piles can take the shape of one of, or a combination of many different configurations, such as valley-fill, cross-valley, side-hill, ridge, and heaped, depending on the topography of the area (Fig. 1; Zahl et al., 1992). The dumping method of rock-pile material can be used to classify rock piles into five basic methods of rock-pile construction (Nichols, 1987; Morin et al., 1991; Quine, 1993; Herasymuik, 1996; Shum, 1999; Tran, 2003):
• end dumping (dumping rock over dump face resulting in some particle size segregation down slope towards the toe of the rock pile, with particle size generally increasing)
• push dumping (dumping from trucks then leveling by pushing by tractor and shovel resulting in particle size segregation; finer at the top, coarser at the toe of the rock pile)
• free dumping or plug dumping (dumping in small piles on the surface of the rock pile, grading the material, and compacting in layers or lifts resulting in dense layers with no real particle size segregation)
• drag-line spoiling (deposited on the surface without construction of lifts and minimal compaction resulting in dense layers with no real particle size segregation because of the relatively low overall height of the spoil piles; typically used in coal mining)
• mixing of waste rock with tailings. The Questa rock piles were constructed predominantly by end-dumping as side-hill or
valley-fill configurations at locations providing the shortest haul distance and least elevation change from the area being mined at the time. End dumping generally results in the segregation of materials with the finer-grained material at the top and coarser-grained material at the base (Fig. 2), because the finer-grained material moves down slope slower than the coarser-grained material. As the rock-pile face advances, the heterogeneity within the pile gradually increases. End dumping results in five physical zones of segregation (Fig. 3; Nichols, 1987; Quine, 1991; Morin et al., 1991, 1997; Smith and Beckie, 2003; McLemore et al., 2005; Azam et al., 2006):
• upper traffic surface (compacted by heavy equipment and trucks) • top of the rock pile where fines are more concentrated than coarser material and is
matrix supported • intermediate zone where material is more well graded, evenly distributed, and cobble
supported • basal coarse zone of cobbles and boulders along the contact between the rock pile and
the original bedrock or colluvium

9
• toe of the rock pile where mostly coarse material is concentrated and is cobble supported.
FIGURE 1. Configuration of rock piles depending on topography: (a) valley-fill, (b) ridge, (c) cross-valley, (d) heaped, (e) side-hill (Zahl et al., 1992).
(a)
a b c
e d
Rock Pile
Rock Pile

10
(b) FIGURE 2. Construction of a rock pile (G.W. Wilson photographs) during end dumping (a) and after end dumping (b) of a truck load. Note the change in grain size down slope (fine at the top and coarse at the base).
FIGURE 3. Conceptual model of the particle-size distribution of a rock pile constructed by end dumping over the crest of a natural slope of a hill, similar to the construction of GHN and many rock piles in the world (from field studies at GHN and Nichols, 1987; Quine, 1991; Morin et al., 1991, 1997; Smith and Beckie, 2003; Azam et al., 2006). See McLemore et al. (2005) for detailed explanation of zones.

11
Rock-pile material is generally emplaced in rock piles dry and rock piles tend to progressively increase in water content with time through infiltration and fluid flow (Williams and Rohde, 2008). The particle size of the material varies from large boulders to clay size. Slope height does not change the type of gradation, but shorter heights can reduce the amount of segregation. Rock-pile materials can be classified as rock-like or soil-like (Dawson and Morgenstern, 1995; Smith and Beckie, 2003; Fines et al., 2003). Rock-pile material with greater than 20% passing the 2 mm grain size sieve (i.e. sand size) is considered soil-like (Dawson and Morgenstern, 1995). The upper portion of the Questa rock piles tends to be more soil-like (matrix-supported), whereas the lower portions tend to be rock-like (cobble-supported). The underlying base of the Questa rock piles is coarse rock and typically cobble supported (McLemore et al., 2008c). The resulting layers are locally at or near the angle of repose and subparallel to the original slope angle that was very steep.
Stratified, heterogeneous rock piles like those at Questa are common elsewhere in the world (Call, 1985; Swanson et al., 2000; Jeong and Lee, 2003; Fines et al., 2003; Tran, 2003). The rock pile at the Libiola mine near Sestri Levante, Genova is reddish-yellow, generally coarse-grained, and stratified (Dinelli et al., 2001). The rock piles at Golden Sunlight are heterogeneous and stratified (Fig. 4; Herasymuik, 1996; Azam et al., 2006). The rock piles at the Ajo mine, Arizona are stratified (Fig. 5; Savci and Williamson, 2002). The Goldstrike rock piles in Nevada are very complex and stratified (Martin et al., 2005). However, the Questa rock piles differ from other mines sites in that the Questa rock piles are high, but not very thick. Most mine rock piles have an average thickness that is close to the height of the pile which creates a large chimney effect of warm air. At Questa, typically the rock pile material is less than several hundred feet thick, but the rock pile height is hundreds to two thousand feet along slope.
FIGURE 4. Layered rock pile at Golden Sunlight mine, Montana (Herasymuik, 1996).

12
FIGURE 5. View of waste stockpile at the Ajo mine, Arizona (Savci and Williamson, 2002).
The particle size segregation resulting from construction by end dumping results in
layers of high permeability. The constructed benches and the inclined and interbedded, stratified layers of coarse and fine material provide conduits for preferential water and air flow. The fine layers allow for unsaturated water flow and the coarse layers allow venting of warm air throughout the rock pile. Relatively dry cool air enters the pile at the base and at benches, and warms as the air travels through the coarse layers with high pyrite content. The mine rock has an elevated temperature due to the exothermic reaction of pyrite oxidation. The warmed air then moves upwards within coarse layers and vents at the surface. A pressure gradient is produced from the increase in air temperature that results in a decrease in density and increase in volume. The pressure gradient within the rock pile creates a draft effect and draws in more air at the base. The movement of warm air brings in oxygen and water vapor, which increases the rate of oxidation, thus creating a convective cell within the rock pile. This process is referred to as the chimney effect (Shaw et al., 2002). Such chimneys are associated with acid generating rock piles when vents of steam are observed on cool winter days.
FACTORS INFLUENCING THE SHEAR STRENGTH OF SOIL AND ROCK
FRAGMENTS Introduction
One of the primary geotechnical parameters required for predicting slope stability is shear strength. The shear strength of soil and materials containing rock fragments is the capability to resist failure under an applied shear force. Using the Mohr-Coulomb failure criterion (Fredlund et al., 1996), the shear strength of granular soil is frequently characterized by the angle of internal friction (φ) and cohesion (C), as follows
τ = c′ + (σn – uw) tan φ′ [1]
where: τ = shear strength
c′ = cohesion intercept (due to adhesion, cementation, stress history, interlocking of particles, etc.)
φ′ = effective angle of internal friction σn = total normal stress on the plane of failure (σn – uw) = effective normal stress on the plane of failure uw = pore-water pressure.

13
While the cohesion is a mathematical expression of the shear strength at zero normal stress, it also can have some physical meaning. For example, cohesion can be thought of as the adhesion force that exists between the particles of the soil samples or that resulting from cementation. Apparent cohesion can be due to the presence of negative pore pressure or capillary action as well as interlocking of particles when the material is dense. Friction angle is the measure of the resistance of the particles to shear force when normal stress on the shear plane is not zero. When the degree of saturation of a soil is greater than approximately 85%, saturated soil mechanics principles can be applied. However, when the degree of saturation is less than 85%, like at Questa, it becomes necessary to apply unsaturated soil mechanics principles (Fredlund and Rahardjo, 1993). The friction angles of well-graded gravel and sandy soils are high compared to fine-grained soils. The angle of internal friction angle is a function of the following parameters (Hawley, 2001; Holtz and Kovacs, 2003):
• Particle shape and roughness of grain surface (friction angle typically increases with increasing angularity and surface roughness)
• Grain quality (weak rock materials such as shale have lower friction angles compared to strong rock materials such as granite)
• Grain size (friction angle increases or decreases with increase in grain size) • Grain size distribution (friction angle typically decreases with decreasing coefficient
of uniformity, Cu) • Specific gravity (related to mineralogy) • State of compaction or packing (friction angle typically increases with increasing
density or decreasing void ratio) • Applied stress level (friction angle decreases with increasing confining stress,
resulting in a curved strength envelope passing through the origin instead of the classical straight line)
• Definition of failure conditions (drained or undrained) • Degree of saturation.
These factors compete with each other, complicating their effect on friction angle. The following sub-sections describe the influence of specific material characteristics on the shear strength of soil and rock fragments. Particle size distribution General Discussion
An increase in the proportion of coarse material in an otherwise fine-grained granular soil typically results in an increase in friction angle (Holtz and Gibbs, 1956; Holtz, 1960). Typical friction-angle values for medium-dense sand can range from 32º to 38º, while typical friction-angle values for medium-dense sandy gravel can range from 34º to 48º (Das, 1983). Triaxial strength testing of large size (up to 200 mm) of rockfill particles, similar to those found in mine rock piles, have internal friction angles in the range of 40º to 50º, the lower end of the range corresponding to fine-grained material, and the upper end of the range corresponding to coarse-grained material (Leps, 1970).
The true particle size distribution of rock piles can be difficult to obtain (Valenzuela et al., 2008), because:
• Material is heterogeneous • Gravity segregation distributes coarser size material at base and finer material at top • Large cobbles and boulders are typically excluded from particle size analysis.

14
Distribution of the particle size can be determined by laboratory methods (U.S. Army Corps of Engineers, 1970; ASTM, 2002), in situ (Valenzuela et al., 2008), or by image analysis of photographs.
Effect of scalping on the shear strength of soils Scalping of larger soil particles from a rock pile sample to perform shear strength
tests in the laboratory has been a center of discussion, because the materials tested in the laboratory are smaller in size compared to in-situ particle size and is not always a true representation of the in-situ particle size distribution. There is a possibility that laboratory test results are not representative of the shear strength in-situ because of size effect. There can be an overestimation or underestimation of the shear strength even if the test is performed under in-situ conditions.
Duncan and Chang (1970) indicated that the stress-strain behavior of any type of soil depends on a number of different factors including density, water content, particle structure, drainage conditions under which the test is performed, strain conditions (i.e. plane strain, plain stress), duration of loading, stress history, confining pressure, and shear stress. In many cases it is possible to take account of these factors by selecting soil samples and testing under conditions that simulate the corresponding field conditions. The most difficult condition to simulate is testing on particle size distribution similar to in-situ particle size distribution. Most laboratory devices are not capable of handling large sizes and therefore requires that the material is scalped to obtain smaller particle-sizes for a particular test.
Bishop (1948) performed direct shear tests on two particle-size distributions of uniform soil, one having a maximum particle size of 0.058 cm (0.023 in) and another 3.175 cm (1.25 in). Bishop (1948) used a square shear box of 30 cm (12 in) on each side and 15 cm (6 in) high. The maximum particle size of the sample was 1/10 of the width of the shear box. The ratio between the two particle sizes was approximately 1/60. Bishop (1948) reported that there is no effect on the shear strength, even though two different materials with different particle sizes were used.
Lewis (1956) performed a series of tests on particles of crushed granite of several different size distributions. Two different shear boxes were employed, 30 cm and 6 cm square. The particle sizes were different based on the shear box employed. Lewis (1956) concluded that the friction angle increased with increasing size of particle sizes, which was attributed to an increase in interlocking particles, interference of particle shear, and increase in dilatational tendencies for the larger particles.
Vallerga et al. (1957) performed triaxial tests and found that the ratio of the normal diameter of the maximum grain size (Dmax) for uniformly-graded soil should be 1/20 and less than 1/6 for a well-graded soil to avoid size effect. Vallerga et al. (1957) reported that there is no evidence of any particle size effect on the value of the angle of internal friction. They also indicated that the material with angular particles has a higher angle of internal friction than subrounded material, the difference being as great as 7.5° at a void ratio of 0.80. While the results of these tests were significant, Vallerga et al. (1957) noted that the range of particle sizes was too small to extrapolate to the 60 cm (24 in) particle size typically used in a rockfill dam. Likewise the confining pressure used was too low compared to the actual confining pressure in an embankment. Hribar et al. (1986) recommended using 1/5 the sample size as the maximum particle size to eliminate this effect of overestimation of shear strength.

15
Leslie (1961) tested subrounded alluvial materials of varying maximum size, but with geometrically similar gradations. The tests were performed using three different sample sizes and a maximum confining pressure of 414 kPa (60 psi). Leslie (1961) indicated that at a given void ratio, the smallest-sized material has the highest angle of internal friction, and the angle of internal friction decreases as the maximum particle size increases.
Kirkpatrick (1965) performed triaxial tests on uniformly-graded samples of sand having particle diameters ranging from 2 mm to 0.3 mm with a confining pressure of 345 kPa (50 psi). Kirkpatrick (1965) concluded that the effect of grading was not noted since the particle properties were uniform, but indicated that the internal friction angle decreases as the maximum particle size increases. Subsequent tests performed on different size glass beads tend to confirm the same findings.
Marsal (1965) performed triaxial tests using 4, 10, 20, and 113 cm diameter samples of silicified conglomerate consisting of granitic gneiss. The ratio of the maximum particle size and the sample diameter was 1/5 and the confining pressures ranged from 2 to 25 kg/cm2. Marsal (1965) concluded that the strength of samples with particles having a maximum diameter of 20 cm was significantly less than that of samples composed of particles having a maximum diameter of 4 cm.
Koerner (1970) conducted triaxial compression tests using lubricated end plates and samples measuring approximately 10 cm (4 inich) high and 10 cm (4 inch) in diameter. The study consisted of eight different saturated quartz soils. The effective size D10 of the soils ranged from 2.60 mm (fine gavel) to 0.0010 mm (18% clay size). The effective size was the only varying parameter as the Cu (coefficient of uniformity) had little influence on the frictional strength of soil at a given relative density. Koerner (1970) concluded that, varying the effective size, D10, of the saturated quartz soils show increase in internal friction angle with decreasing particle size. This increase is significant with particle sizes less than 0.06 mm (medium sand and finer).
Varadarajan et al. (2003) examined rockfill materials obtained from Ranjit Sagar Hydropower Project (Gurdaspur district, Punjab state, North India) and Purulia Pumped Storage Hydroelectric Project (Purulia district, West Bengal State, eastern part of India). The Ranjit Sagar Project consists of alluvial material of rounded to subrounded particles up to 320 mm in size. The Purulia Project rockfill materials used was obtained by blasting metamorphic rock, which consisted of angular to subangular particles up to 1200 mm in size. The tests were performed with dry density corresponding to 87% of relative density. For the triaxial tests, two sample sizes, 381 mm diameter by 813 mm long and 500 mm diameter by 600 mm long were used. The materials were thoroughly wet mixed, with water contents ranging from 3 to 4 %. Varadarajan et al. (2003) concluded that the angle of shearing resistance for the two rockfill materials behaved differently due to the varying particle size. The angle of shearing resistance increased with the size of the particles for the Ranjit Sagar material, but the opposite trend was observed for the Purulia material. This behavior was attributed to the breakage of the particles due to contact stresses (Lambe and Whitman, 1969). In the case of the Ranjit Sagar rockfill material, the rate of increase in the breakage factor with increase in particle size was low (an increase of 3.25 % in the breakage factor at a confining pressure of 1.4 MPa). Therefore the net effect of breakage on friction angle is less compared to interlocking of the particles (Lambe and Whitman, 1969). In the case of the Purulia rockfill material, the rate of increase in the breakage factor with particle size was high (an increase of 1.7% in the breakage factor at the confining pressure of 1.2 MPa). This

16
is due to the high stress build up at the contact surface of the angular particles with increasing particle size causing high particle breakage. This accounts for the decrease in internal friction angle or shearing resistance with particle size.
There is no common agreement on the effect of scalping on shear strength after evaluating the literature on this topic. Different views are presented with some indicating that internal friction angle decreases with increase in particles size, while others have opposite views. Uhle (1986) showed that different factors must be accounted for when examining the relationship of particle size on friction angle (Fig. 6).
FIGURE 6. Friction angle versus maximum particle size for various studies (Uhle, 1986).
Effect of larger particles and allowable particle size in the shear box test The effect of particle size on shear strength has been studied for decades (Uhle,
1986). For example, Holtz and Gibbs (1956) and Leslie (1961) indicated that when a tested

17
sample is larger than the soil particles (i.e. rock size), the effect of the sample size on the measured shear strength is negligible. However, they indicated that the ratio of the sample diameter to the maximum particle size has influence on the measured shear strength. The presence of large particles in the sample increases the measured strength due to interference between the larger particles.
Marachi et al. (1969), after considering data presented by Holtz and Gibbs (1956), concluded that if the material gradation is such that the proportion of particles in the maximum sieve size range is 30% or less and the ratio of the sample diameter to the largest particle size is 6, no effect of the sample size on test results should exist.
Vallerga et al. (1957), after performing triaxial tests, indicated that the ratio of the normal diameter of the maximum grain size (Dmax) for uniformly-graded soil should be 1/20 and less than 1/6 for a well-graded soil. Hribar et al. (1986) recommended using 1/5 the sample size as the maximum particle size to eliminate the effect of overestimation of shear strength.
Density
Density is the weight per unit volume of soil. In natural soils, the magnitude of the total density or wet density depends on how much water is in the voids as well as the density of the mineral grains themselves at a given time. The range of wet density for all soils could be from slightly more than 1.00 g/cm3 to as high as 2.40 g/cm3, depending on the relative density (Holtz and Kovacs, 2003). Figure 7 shows the relationship between the effective friction angle from triaxial compression tests, and relative density and soil classification. When two sands have the same relative density, the soil that is better graded (for example, an SW soil as opposed to an SP soil) has a larger friction angle (Holtz and Kovacs, 2003).
FIGURE 7. Correlations between the effective friction angle and relative density for different soil types (Holtz and Kovacs, 2003). ML: Silt, SM: Silty sand, SP: Poorly graded sand, SW: Well-graded sand, GP: Poorly graded gravel, GW: Well-graded gravel.
Specific gravity of soil solids, Gs, is the mass density of the mineral solids in soil normalized relative to the mass density of water. Specific gravity also can be viewed as the
18
mass of a given volume of soil solid normalized relative to the mass of an equivalent volume of water. Published values indicate that the specific gravity of sand is assumed to be 2.65, because this is the specific gravity of quartz. Since the mineralogy of clay is more variable, Gs for clay is variable, and is typically assumed to be between 2.70 and 2.80, depending on the mineralogy (Holtz and Kovacs, 2003).
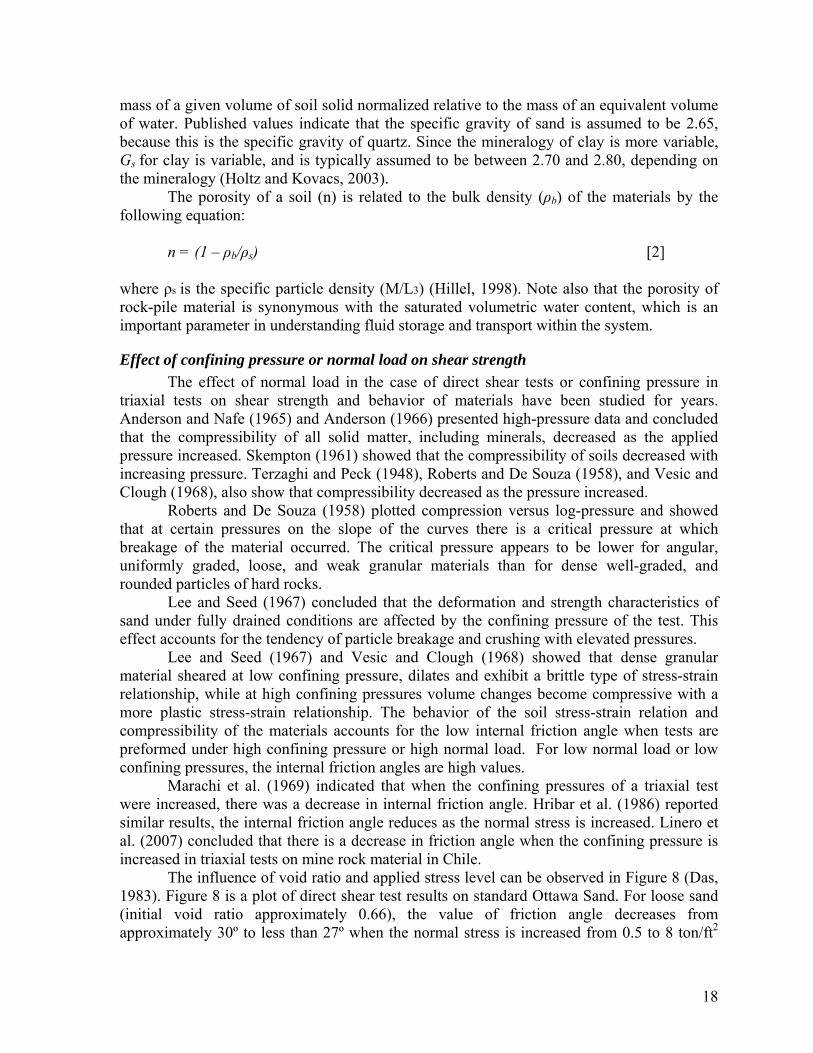
The porosity of a soil (n) is related to the bulk density (ρb) of the materials by the following equation: n = (1 – ρb/ρs) [2] where ρs is the specific particle density (M/L3) (Hillel, 1998). Note also that the porosity of rock-pile material is synonymous with the saturated volumetric water content, which is an important parameter in understanding fluid storage and transport within the system.
Effect of confining pressure or normal load on shear strength The effect of normal load in the case of direct shear tests or confining pressure in
triaxial tests on shear strength and behavior of materials have been studied for years. Anderson and Nafe (1965) and Anderson (1966) presented high-pressure data and concluded that the compressibility of all solid matter, including minerals, decreased as the applied pressure increased. Skempton (1961) showed that the compressibility of soils decreased with increasing pressure. Terzaghi and Peck (1948), Roberts and De Souza (1958), and Vesic and Clough (1968), also show that compressibility decreased as the pressure increased.
Roberts and De Souza (1958) plotted compression versus log-pressure and showed that at certain pressures on the slope of the curves there is a critical pressure at which breakage of the material occurred. The critical pressure appears to be lower for angular, uniformly graded, loose, and weak granular materials than for dense well-graded, and rounded particles of hard rocks.
Lee and Seed (1967) concluded that the deformation and strength characteristics of sand under fully drained conditions are affected by the confining pressure of the test. This effect accounts for the tendency of particle breakage and crushing with elevated pressures.
Lee and Seed (1967) and Vesic and Clough (1968) showed that dense granular material sheared at low confining pressure, dilates and exhibit a brittle type of stress-strain relationship, while at high confining pressures volume changes become compressive with a more plastic stress-strain relationship. The behavior of the soil stress-strain relation and compressibility of the materials accounts for the low internal friction angle when tests are preformed under high confining pressure or high normal load. For low normal load or low confining pressures, the internal friction angles are high values.
Marachi et al. (1969) indicated that when the confining pressures of a triaxial test were increased, there was a decrease in internal friction angle. Hribar et al. (1986) reported similar results, the internal friction angle reduces as the normal stress is increased. Linero et al. (2007) concluded that there is a decrease in friction angle when the confining pressure is increased in triaxial tests on mine rock material in Chile.
The influence of void ratio and applied stress level can be observed in Figure 8 (Das, 1983). Figure 8 is a plot of direct shear test results on standard Ottawa Sand. For loose sand (initial void ratio approximately 0.66), the value of friction angle decreases from approximately 30º to less than 27º when the normal stress is increased from 0.5 to 8 ton/ft2

19
(50 to 808 kPa). Similar results were obtained for dense sand (e = 0.58), i.e. friction angle decreases from 34.5º to about 29º due to an increase in normal stress 0.5 to 8 ton/ft2 (50 to 808 kPa).
FIGURE 8. Variation of peak internal friction angle with effective normal stress for direct shear tests on standard Ottawa sand (Das, 1983). Particle shape, roundness and grain surface texture
Friction angle and, therefore, slope stability are in part dependent upon grain texture, specifically shape and roughness of grain surfaces. Robinson and Friedman (2002) showed that increased angularity of grains increased the friction angle. Uhle (1986, table 2.4) also showed that increased angularity of grains increased friction angles.
Grain texture is dependent upon material composition, grain formation, separation from the matrix, transportation, and depositional environments. Chemical and physical weathering can affect grain texture; more weathered sands tend to be rounder regardless of particle size (Cho et al., 2006). Grain texture is characterized by three dimensionless parameters (Krumbein, 1941; Barrett, 1980; Powers, 1982; Dodds, 2003; Oakey et al., 2005):
• form (cubical, spherical, elliptical, elongated, flat, tubular, platy, lath like, needle) o sphericity (ratio of the surface area of the particle to the surface area of a
sphere of equal volume; Wadell, 1932; Santamarina et al., 2001) o aspect ratio or elongation (the ratio of the long, L, to the intermediate, B, axes) o flatness (the ratio of the intermediate, B, and short, T, axes) o eccentricity (the ratio δp/Rp of an elliptical particle who’s two dimensional
outline has been expressed in polar coordinates as Rp = δp·cos(2θ)) • roundness or angularity • smoothness, roughness, striated, frosted, dull (dependent upon scale because all
grains are rough at some scale).

20
Sphericity is the best measure of the form for most rock fragments and grains in the Questa samples, although some minerals, such as pyrite, exhibit a cubic form and gypsum exhibits needles or blades. Sphericity and roundness can be estimated visually using comparison charts (Fig. 9). These charts make it easier to examine the influence of particle shape on geotechnical properties (Powers, 1982; Cho et al., 2006). More sophisticated modeling techniques using Fourier, fractal, or image analyses have been developed (Clark, 1987; Hyslip and Vallejo, 1997; Smith, 1999; Bowman et al., 2001; Sukumaran and Ashmawy, 2001; Alshibli and Alsaleh, 2004; Cox and Budhu, 2007).
(a)
(b) FIGURE 9. Sphericity (S) and roundness (R) charts (a) from Cho et al. (2006; modified from Krumbein and Sloss, 1963) and (b) from Powers (1982). In (a), diagonal dotted lines correspond to constant particle regularity ρ=(R+S)/2.
The relationship between particle shape and critical state friction angle is presented in
Figure 10 (Cho et al., 2006). Open circles are for sand with sphericity >0.7, and closed circles are for sand with sphericity <0.7. The plot shows a negative correlation between internal friction angle and roundness. As roundness varied from 0.1 (very angular) to 1 (well rounded), the internal friction angle decreased from approximately 40º to 28º. Particles with a higher sphericity generally had lower friction angles. Surface roughness is very difficult to

21
measure (McCarroll and Nesje, 1996); but surface roughness will have an effect on internal friction angle. Typically, the greater surface roughness results in greater internal friction angle (Holtz and Kovacs, 2003).
FIGURE 10. The effect of particle shape on critical state friction angle for sand (from Cho et al., 2006). Open circles and closed circles are for sand with sphericity greater than 0.7, and sphericity lower than 0.7, respectively.
Vallerga et al. (1957) performed triaxial tests on samples composed of glass beads. To achieve the surface roughness of the beads, the beads were etched in hydrofluoric acid for different periods of time. To measure the degree of surface roughness, a kerosene adsorption ratio was used. They presented results indicating clearly that as the surface roughness increased the values of the angle of internal friction increased. Horn and Deere (1962) confirmed the same observation that etched surfaces of quartz have higher coefficient of static friction than do for polished surfaces. Uhle (1986) also concluded that increase in roughness increased friction angle.
Marachi et al. (1969) considered the results and conclusions presented by Vallerga et al. (1957) and Horn and Deere (1962) and concluded that the observations could be due to the low pressure under which the tests were conducted. This is reasonable because at low particle contact pressures, micro-surface structures such as surface roughness affect frictional characteristics of minerals. Under high normal load or confining pressures, where the contact pressure is so high to cause breakage of the particles, the effect of surface roughness could be negligible.
Barton (2008) presents arguments that strength of rock-pile material is similar to the strength of rockfill and rock joints, because these materials have similar strength envelopes due to the effects of point of contacts. Barton (2008) suggests that the actual point of contact is important and as peak shear strength is obtained, the actual point contact stress levels are high due to the small contact areas. He also recognizes the effect of roughness and particle size on shear strength. As roughness increases so does friction angle. Interfaces, which could be the weakest point in the system, also can be evaluated similar to rockfill, rock pile, and rock joints. Laboratory and field tilt tests can be used to determine the shear strength of the interfaces (Barton, 2008).

22
Effect of moisture condition on shear strength The effect of moisture on shear strength of soils is very important in considering
slope stability. Sowers et al. (1965), Howson (1939), and Kjaernsli and Sande (1963) indicated that dry rockfill material upon wetting undergoes a considerable amount of compression comparable to wet samples. Furthermore, Kjaernsli and Sande (1963) showed that the shear strength of dry samples is higher than that of saturated and submerged samples.
Lee et al. (1967) performed triaxial compression tests and reported that the strength of dry Ottawa sand was unaltered by wetting, but the strength of dry Antioch sand, which contained some weathered and cracked particles, was almost 1.5 times higher than that of wet samples.
Atterberg limits Atterberg limits are determined from two tests which are used to give empirical
information on the reaction of fine soil (less than 74 μm-size fraction) to water. There are at least two uses of the Atterberg Limits of interest: classification and behavior in terms of liquid, plastic, and brittle solid. These are water content tests that bracket the upper and lower limits of water contents at which a cohesive soil remain as a solid, plastic mass and can support a load. Above the upper water content, defined as the Liquid Limit (LL), the soil will flow as a semi-viscous liquid. Below the lower water content, defined as Plastic Limit (PL), the soil behaves as a brittle mass. With the range of the two water contents, defined as the Plastic Index (PI), the soil behaves as a plastic mass (Fig. 11) capable of supporting a load. The soil is classified using the Plasticity Chart shown in Figure 12. By plotted the values of LL and PI on this chart, the soil types are established as well as the degree of plasticity (low, L, or high, H). The PI is dependent on mineralogy of the clay material present (Fig. 13).
Classification is accomplished with the LL, PL, and PI:
PI = LL – PL [3] A plasticity chart has PI on the y-axis and LL on the x-axis. From the PI and the LL, a Unified Soil Classification Symbol can be determined. The index for scaling the natural water content of a soil sample is the liquidity index (LI):
LI = (water content (wn) – PL)/PI [4] If the LI is less than 0, a brittle fracture would occur when sheared. If LI is between 0 and 1, the soil would behave like a plastic. If the LI is greater than 1, the soil would be a very viscous liquid.

23
FIGURE 11. Consistency of cohesive soil.
FIGURE 12. Plasticity chart for the classification of fine-grained soils.
FIGURE 13. Plasticity chart showing the relationship of soil samples to clay mineralogy, (Skempton, 1953; Yalcin, 2007).
The degree of plasticity relates to strength. In fine-grained soils, the term plasticity describes the ability of a soil to undergo unrecoverable deformation at constant volume without cracking or crumbling. Highly plastic clays are those that tend to swell with water content and has a LL higher than 50. Low plasticity fines are those that do not swell with a

24
LL<50. The 50 mark along the x-axis, shown in Figure 11, separates the high and low plasticity soils.
Effect of mineralogy on shear strength There has been work to determine the mineralogical effects on the engineering
properties of granular materials by controlling the physical properties of each of the rock particles. Horn and Deere (1962) performed sliding friction tests under different humidity conditions and showed that increases of surface moisture causes the coefficient of friction to increase for massive-structured minerals such as quartz as compared to a decrease for minerals having layer-lattice structures such as mica. Horn and Deere (1962) found that the sliding friction on different minerals under similar testing conditions show different coefficients of friction, but minerals of the same type, but different origins, had the same frictional characteristics.
Sowers et al. (1965) conducted uniaxial compression tests in the laboratory on rockfill materials, and concluded that even though the samples tested have equal uniformity coefficients and under similar testing conditions, the compression of sandstone under 479 kPa (10,000 psf) normal load was almost twice that of greywacke. Sowers et al. (1965) also observed that the compression of granite was almost 1/2 times greater than that of greywacke. This shows the influence of mineralogy on shear strength. Different minerals respond differently to deformation and have different resistance to failure.
CHARACTERIZATION OF ROCK PILES THROUGHOUT THE WORLD Introduction
The most important factors controlling rock pile stability are geometry of the rock pile, weight of waste rock, shear strength, pore pressure and foundation conditions (Gomez et al., 2000, 2003). However, the mineralogy and chemistry of the rock-pile material and of the discharging water is important in determining the acid drainage potential. The acid drainage potential could ultimately affect the slope stability by changing the composition (i.e. weight and shear strength) of the rock pile or even the foundation.
A typical rock-pile characterization program involves field and laboratory measurements to determine the physical, hydrological, geological, geochemical, and geotechnical properties of the rock pile as a whole and of the materials within it. Rock-pile characterization programs have been carried out in a number of mines worldwide for reasons such as preparing Environmental Impact Statements (EIS), predicting acid drainage potential, designing stable rock-pile configurations, identifying suitable remediation methods, and mine closure plans. Also, some characterization programs have been performed during deconstruction of rock piles because of the opportunity to examine the interior of the rock piles without expensive drilling programs. Table 2 includes brief descriptions of some rock-pile characterization programs.
25
TABLE 2. Brief descriptions of various rock piles with characterization programs that are discussed below. Mine Lithology Material
type Type of deposit
Construction method
Year pile started
Depth below the surface (ft)
Age of pile/leach period
Reference
Tyrone, NM (heap leach)
Porphyry, granite
Oxide, sulfide, leach, cap
Porphyry copper
Heap leach 1867-1986
40-300 0-20 Earley et al. (2003)
Chino, NM (heap leach)
Porphyry, granite
Oxide, sulfide, leach, cap
Porphyry copper
Heap leach, 30-75 ft lifts
1910 URS Corp. (2003)
Davis mine, Mass.
Schist, quartzite
pyrite dumped 1882-1911
12 96-140 Adams et al. (2007)
Heath Steele, New Brunswick
Greenschist metamorphic rocks
Sulfide Massive sulfide (Cu, Pb, Zn)
End dumped 1955 9-30 Nolan, Davis and Assoc., Lmt., (1991)
Stratmat, New Brunswick
Greenschist metamorphic rocks
Sulfide Massive sulfide
End dumped 1989 Li (1999)
Ajo, Arizona
volcanic rocks, monzonite
Sulfide Copper porphyry
End dumped ~1952 50 Savci and Williamson (2002)
Golden Sunlight, Montana
Latite and diameter breccia pipe
Sulfide Gold breccia pipe and veins
Barrick (2007)
Bingham Canyon, Utah
monzonite intrusive rock and quartzite, with lesser amounts of limestone
Sulfide Copper porphyry
Pernichele and Kahle (1971)
Callahan mine, Bar Harbor, Maine
Massive zinc-lead-copper
Volcanic and volcani-clastic rocks
Massive sulfide
1968 Metcalf and Eddy, Inc. (2003)
PT Freeport Grasberg, Indonesia
Gold porphyry and skarn
Diatreme, volcanic rocks, intrusion
1989 Walker and Johnson (2000), Infomine (2007)
Pierina Gold Hawley (2001)
Grain texture Very few, if any characterization programs quantify the grain texture, even though it
does affect shear strength. Some reports briefly describe the grain texture in terms of ranges of roundness, sphericity, and roughness.
26
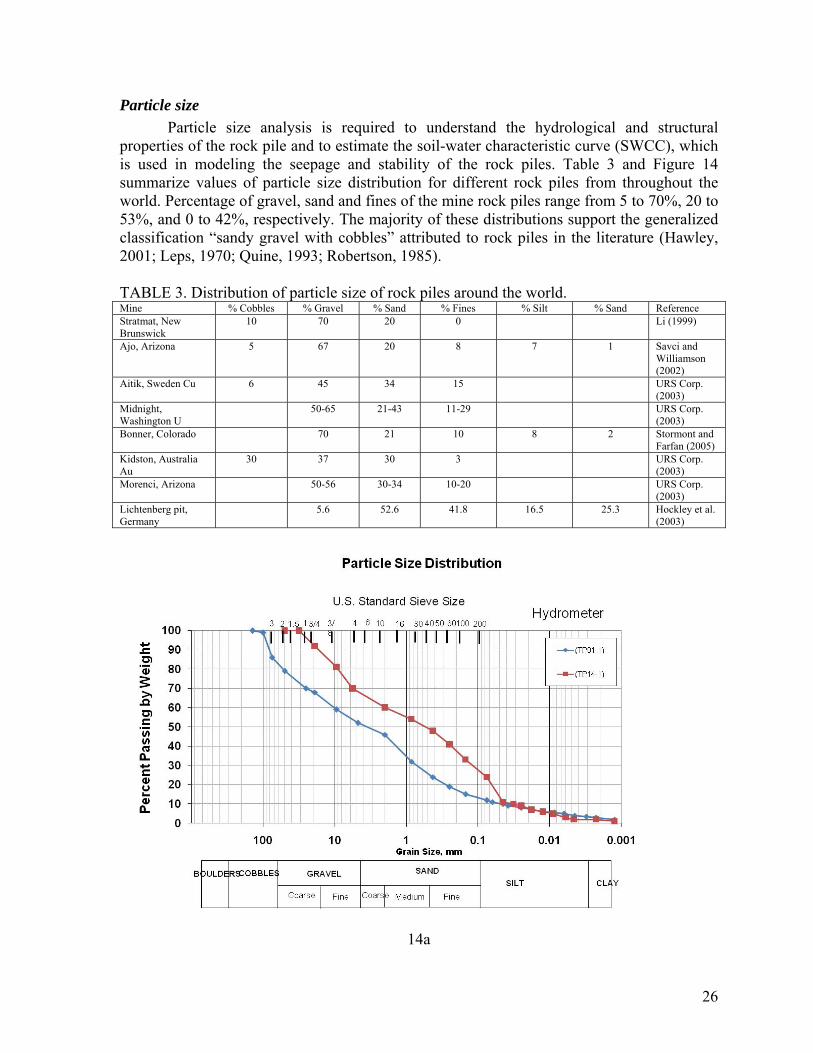
Particle size Particle size analysis is required to understand the hydrological and structural
properties of the rock pile and to estimate the soil-water characteristic curve (SWCC), which is used in modeling the seepage and stability of the rock piles. Table 3 and Figure 14 summarize values of particle size distribution for different rock piles from throughout the world. Percentage of gravel, sand and fines of the mine rock piles range from 5 to 70%, 20 to 53%, and 0 to 42%, respectively. The majority of these distributions support the generalized classification “sandy gravel with cobbles” attributed to rock piles in the literature (Hawley, 2001; Leps, 1970; Quine, 1993; Robertson, 1985). TABLE 3. Distribution of particle size of rock piles around the world. Mine % Cobbles % Gravel % Sand % Fines % Silt % Sand Reference Stratmat, New Brunswick
10 70 20 0 Li (1999)
Ajo, Arizona 5 67 20 8 7 1 Savci and Williamson (2002)
Aitik, Sweden Cu 6 45 34 15 URS Corp. (2003)
Midnight, Washington U
50-65 21-43 11-29 URS Corp. (2003)
Bonner, Colorado 70 21 10 8 2 Stormont and Farfan (2005)
Kidston, Australia Au
30 37 30 3 URS Corp. (2003)
Morenci, Arizona 50-56 30-34 10-20 URS Corp. (2003)
Lichtenberg pit, Germany
5.6 52.6 41.8 16.5 25.3 Hockley et al. (2003)
14a

27
14b
14c

28
14d
14e

29
14f
14g

30
14h
FIGURE 14. Particle size distributions of rock piles from throughout the world. a—B-zone waste rock pile at Rabbit Lake Mine in Canada (Ayres et al, 2005), b—Golden Sunlight mine, Montana (Azam et al, 2006), c—WR and TA samples, Libiola Fe-Cu sulfide mine, eastern Liguria, Italy (Marescotti et al, 2007), d—Statmat waste rock bulk sample (Li, 1999), e—Bonner mine, Colorado, f—fresh mine waste (1), and after five years of mechanical weathering (2) on a stockpile in the Ruhr District, Germany (Neumann-Mahlkau, 1993), g—range of four rock piles from Carlin deposits, Nevada (Quine, 1993), h—soil cover, oxidized rock and waste rock before oxidation (Yazdani, 1995). Density and specific gravity
Many characterization programs determine dry density and specific gravity along with other geotechnical parameters (Table 4). Williams (2000) indicated that the density of mine rock piles ranges from 1.6 to 2.2 t/m3, depending upon whether the material has undergone compaction or not. The rock piles and analogs in question have been subjected to gravitational compaction and the generation of some fines filling the voids accounts for the high measured densities. TABLE 4. Summary of various parameters of rock piles throughout the world. Mine Mine rock
material USCS soil group
Paste pH
Dry Density g/cc
Specific gravity
LL PL PI Porosity %
Moisture Content %
References
Tyrone, NM (heap leach)
Porphyry, granite
GC, GW-GC, SC
2.07-4.27
2.64-2.78
28-40
15-18 8-23 Earley et al. (2003)
Chino, NM (heap leach)
Porphyry, granite
GW-GC, GC
1.78, 1.93
2.63-2.75
26, 36
8, 13
4.2-15.1 URS Corp. (2003)
Davis mine, Mass.
Schist, quartzite
2.65 35-55 Adams et al. (2007)
Heath Greenschist 2.35 Nolan,

31
Mine Mine rock material
USCS soil group
Paste pH
Dry Density g/cc
Specific gravity
LL PL PI Porosity %
Moisture Content %
References
Steele, New Bruswick
metamorphic rocks
Davis and Assoc., Lmt. (1991)
Stratmat, New Bruswick
Greenschist metamorphic rocks
4.1-9.4
2.64-3.25
26.4 Li (1999)
Ajo, Arizona
Volcanic rocks, monzonite
1.61-2.06
0.5-7 Savci and Williamson (2002)
Bonner, CO GP-GM 1.65 (in situ)
6-10 Stormont and Farfan (2005)
Golden Sunlight, Montana
Latite and diameter breccia pipe
SW, GP, GW
2.3-6.1
1.5-2.1 2.63-2.78
22.1-33.5
4-39 Herasymuik (1996), Azam et al. (2006)
Central Pit, Turkey
Sedimentary rocks
GC 35 24 11 Kasmer and Ulusay (2006)
Lignite Creek, Alaska
Sedimentary rocks
SM 1.5 19-20
15-18 2-4 Kroeger et al. (1991)
Aberfan, England
Sedimentary rocks
1.60-1.94
2.1 Lucia (1981)
Equity 3.54-7.05
Saretzky (1998)
Kidston, Australia
2.65 40 Bews et al. (1997)
Midnight, WA (uranium)
Metamorphic rocks
1.52-2.00
2.75-2.84
19-52
1-29 URS Corp. (2003)
Lichtenberg pit, Germany
2.1 2.75 24 Hockley et al. (2003)
Ohio coal dumps
Sedimentary rocks
GW, SW, GP, CL
1.69-2.13
24.1-43.5
15.0-26.2
4.5-19.6
4.4-18.2 Shakoor and Ruof (1989)
Yorkshire coal mine
Coarse discard
1.5-1.9 2.04-2.63
23-44
16-25 8-13.6 Bell (1996)
Brancepath coal mine
Coarse discard
1.06-1.68
1.81-2.54
23-42
None-35
5.3-11.9 Bell (1996)
Wharncliffe coal mine
Coarse discard
1.39-1.91
2.16-2.61
25-46
14-21 6-13 Bell (1996)
Bogdanka coal mine, Lubelskie, Poland
5 yrs old 7 yrs old 8 yrs old
1.95 1.69 1.75
11-14 15-19 21
Filipowicz and Borys (2005)
Shear strength (Friction Angle and Cohesion) Table 5 summarizes values of internal friction angle and cohesion from different rock
piles. Typical values of cohesion vary between 0 to 239 kPa (0 and 5000 psf) and friction angle varies between 21º and 55º, with most values reported between 38º to 45º. Studies have shown that in fine-grained materials, such as shale, cohesion is related to clay mineralogy, absorption and adsorption of ions, and slake durability, whereas friction angle is controlled by clay mineralogy, absorption, adsorption, and Atterberg limits, but no single geologic characteristic or engineering property correlates strongly with cohesion or friction angle (Dick et al., 1994; Hajdarwish, 2006).

32
TABLE 5. Summary of mine rock values of friction angle and cohesion. Mine Mine rock material Internal
friction angle (°) φ
Apparent cohesion (kPa) C
Range in normal stress (kPa)
Comments References
Tyrone, NM (heap leach)
Porphyry, granite 34.1-36.9 2.8-15.2 Earley et al. (2003)
Chino, NM (heap leach)
Porphyry, granite 34 0 234-819 Hoek-Brown method
URS Corp. (2003)
Lubelskie, Poland
Coal Fresh 32-55 5 yrs old 34-35 7 yrs old 27-37
20-32 21-35 25-40
Friction angle decreases, cohesion increases with age
Filipwicz and Borys (2004)
Upper Silesian, Poland
Coal Fresh 36-41 8 yrs old 21-29
18-23 27-37
Friction angle decreases, cohesion increases with age
Filipwicz and Borys (2004)
Bouganville Copper Ltd., Papua, New Guinea
Fractured rock (Panguna andesite)
29-45 0 Triaxial test 6-in diameter Dmax=3/4 in, samples comprise of moderately to slightly weathered rock with 20% fines
URS Corp. (2003)
Endako, B.C., Canada
Molybdenum in quartz monzonite
36 490 766 Material properties 30% >300 mm, 2% < no. 200 sieve
B.C. Mine Waste Rock Research Comm. (1991), URS Corp. (2003)
Bald Mountain, Nevada
Gold in Dundrberg Shale
39 172 Direct shear test, shear box 15 in x 15 in, Dmax=3 in
Quine (1993)
Barrick Nevada Gold in argillized granodiorite
38-40.3 83-139 Direct shear test, shear box 15 in x 15 in, Dmax=3 in
Quine (1993)
Big Springs, Nevada
Gold in argillaceous siltstone
47-50 206-239 Direct shear test, shear box 15 in x 15 in, Dmax=3 in
Quine (1993)
Candelaria, Nevada
Gold in siltstone and shale
43-47 90-239 Direct shear test, shear box 15 in x 15 in, Dmax=3 in
Quine (1993)
Newmont, Nevada
Gold in siltstone/sandstone
35-51 69-205 Direct shear test, shear box 15 in x 15 in, Dmax=3 in
Quine (1993)
Round Mountain, Nevada
Gold in rhyolite tuff 40-41.5 77-96 Direct shear test, shear box 15 in x 15 in, Dmax=3 in
Quine (1993)
PT Freeport Grasberg, Indonesia
Gold porphyry and skarn
37-42.2 39.6-40.4
34-64 0-11
Direct shear Triaxial compression, consolidated, undrained
Walker and Johnson (2000), Infomine (2007)
Bonner, Colorado
37 5 Direct shear test, in situ shear box 30 in x 30 in x 16 in
Stormont and Farfan (2005)
Equity Silver 37.5 345-800 URS Corp. (2003)
Midnight, Washington
Uranium in quartz monzonite, marble, and calc-silicate rock
32.6-43.7 37
0-29 31
Triaxial test, 4 in diameter, Dmax=3/4/in Triaxial test, 6 in diameter, Dmax=1.5 in
URS Corp. (2003)
Brancepath coal mine
Coarse discard 31.5-35 19.44-21.41 Bell (1996)

33
Mine Mine rock material Internal friction angle (°) φ
Apparent cohesion (kPa) C
Range in normal stress (kPa)
Comments References
Wharncliffe coal mine
Coarse discard 27.5-39.5 3.65-39.03 Bell (1996)
Bogdanka coal mine, Lubelskie, Poland
Coarse discard 29-37 16-40 Bell (1996)
Slake Durability and Point Load Durability of rocks can be described as the resistance to breakdown under weathering
conditions. This property can be determined by the slake durability test, which measures the resistance of rocks to breakdown due to wetting and drying cycles. Slake durability is reported as a durability index (ID2) (ASTM, 2001; International Society for Rock Mechanics, 1979; Franklin and Chandra, 1972). Rock strength depends on many other factors as well (Table 6). Some of these factors can be the original strength of the unaltered rock; the amount of intact rock; the number of joints, their spacing, orientation, width, continuity, and presence of filling material; the amount and flow of ground water through joints and pore spaces; and the degree of weathering of rock fragments (Hoek, 2000).
Another simple test that can be performed to estimate strength of rocks is the point load test. The testing machine used consists of a loading frame, which measures the force required to break the sample, and a system for measuring the distance between the two contact points. The point load index (Is), obtained with the point load test, is suggested as a standard to classify rock strength. Strength and durability indices values for different areas in the world are summarized in Table 7 and 8. TABLE 6. This table shows factors that affect durability and strength of rocks tests (Koncagül and Santi, 1999; Cheema et al., 2004).
Factors Strength Test Slake Durability Test Microstructure Angularity Increase Decrease Grain size
- Coarse - Fine
Decrease Increase
Increase Decrease
Degree of alignment Decrease Decrease Packing Density (dense) Increase Increase Sutured/Straight grain to grain contact Increase Increase Porosity
- High - Low
Decrease Increase
Depends on permeability Depends on permeability
Degree of Bonding - Well - Weakly
Increase Decrease
Increase Decrease
Mineralogy Grains Depend on type of minerals Depend on type of minerals Cementing and bonding material
- Quartz - Clay Minerals
Increase Decrease
Increase Decrease
Various Permeability
- High - Low
Decrease Increase
Increase Decrease
Diagenesis and Metamorphosis Increase Increase Water content

34
Factors Strength Test Slake Durability Test - High - Low
Decrease Increase
Increase Decrease
Soft soluble minerals Decrease Decrease Microfractures Decrease Decrease Inclusions Decrease No effect TABLE 7. Summary of slake durability indices (ID2) from locations around the world.
Area Locality Origin Rock Type ID2 (%)
Source
Trout Lake mine
Flin Flon, Manitoba, Canada
Footwall, hangingwall
Chlorite schist (chloritized quartz-phylic fragmental rhyolite)
99.4 Eberhardt et al. (1996)
Eskihisar Lignite mine
Yatagan Basin, Turkey Benches, Slopes, Outcrops
Compact Marl 96.8 Gökçeoglu et al. (2000)
Lignite open pit
Soma lignite basin, Guvenc, Turkey
Benches, Slopes, Outcrops
Mudstone 98.4 Gökçeoglu et al. (2000)
Tinaz Coal mine
Mugla Basin, Turkey Benches, Slopes, Outcrops
Compact Marl 93.2 Gökçeoglu et al. (2000)
Eskihisar Lignite mine
Yatagan Basin, Turkey Spoil Piles Compact + laminated marls
88.7 Gökçeoglu et al. (2000)
Hindustan Copper Limited Mines
Malanjkhand, India Country rock Granite – moderately weathered
98.8 Gupta and Rao (2001)
Hindustan Copper Limited Mines
Malanjkhand, India Country rock Granite – highly weathered
90.1 Gupta and Rao (2001)
Marble mining area
Kherwara, India Waste Dump Green marble – bad quality
97.0 Maharana (2005)
Marble mining area
Kherwara, India Waste Dump Green marble (serpentine)
89.9 Maharana (2005)
India Rourkela Steel Plant
Fly ash composite 83.0 Manoj (2006)
Selangor Malaysia Kenny Hill Cut slope
Shale – slightly weathered
92.0 Mohamed et al. (2006)
Selangor Malaysia Kenny Hill Cut slope
Sandstone – moderately weathered
92.0 Mohamed et al. (2006)
Selangor Malaysia Kenny Hill Cut slope
Sandstone – highly weathered
46.0 Mohamed et al. (2006)
Bald Mountain
Nevada, US Waste Rock Siltstone 98.9 Quine (1993)
Barrick GoldStrike
Nevada, US Waste Rock Welded Tuff 88.3 Quine (1993)
Big Springs Nevada, US Waste Rock Siltstone 98.1 Quine (1993)
Candelaria Nevada, US Waste Rock Siltstone 98.6 Quine (1993)
Round Mountain
Nevada, US Waste Rock Welded Tuff 93.1 Quine (1993)
35
Area Locality Origin Rock Type ID2 (%)
Source
Sivas, Turkey Dolines Porphyritic gypsum 97.0 Ylmaz and Karacan (2005)
Sivas, Turkey Dolines Alabaster 91.0 Ylmaz and Karacan (2005)
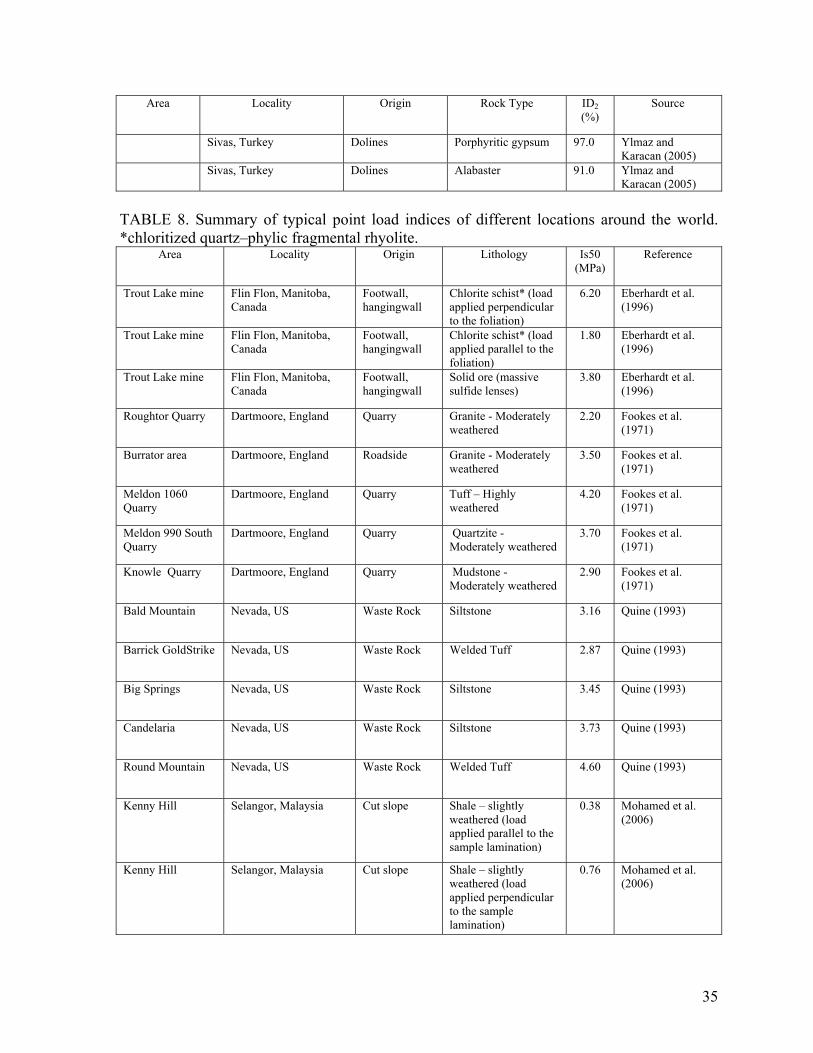
TABLE 8. Summary of typical point load indices of different locations around the world. *chloritized quartz–phylic fragmental rhyolite.
Area Locality Origin Lithology Is50 (MPa)
Reference
Trout Lake mine Flin Flon, Manitoba, Canada
Footwall, hangingwall
Chlorite schist* (load applied perpendicular to the foliation)
6.20 Eberhardt et al. (1996)
Trout Lake mine Flin Flon, Manitoba, Canada
Footwall, hangingwall
Chlorite schist* (load applied parallel to the foliation)
1.80 Eberhardt et al. (1996)
Trout Lake mine Flin Flon, Manitoba, Canada
Footwall, hangingwall
Solid ore (massive sulfide lenses)
3.80 Eberhardt et al. (1996)
Roughtor Quarry Dartmoore, England Quarry Granite - Moderately weathered
2.20 Fookes et al. (1971)
Burrator area Dartmoore, England Roadside Granite - Moderately weathered
3.50 Fookes et al. (1971)
Meldon 1060 Quarry
Dartmoore, England Quarry Tuff – Highly weathered
4.20 Fookes et al. (1971)
Meldon 990 South Quarry
Dartmoore, England Quarry Quartzite - Moderately weathered
3.70 Fookes et al. (1971)
Knowle Quarry Dartmoore, England Quarry Mudstone - Moderately weathered
2.90 Fookes et al. (1971)
Bald Mountain Nevada, US Waste Rock Siltstone 3.16 Quine (1993)
Barrick GoldStrike Nevada, US Waste Rock Welded Tuff 2.87 Quine (1993)
Big Springs Nevada, US Waste Rock Siltstone 3.45 Quine (1993)
Candelaria Nevada, US Waste Rock Siltstone 3.73 Quine (1993)
Round Mountain Nevada, US Waste Rock Welded Tuff 4.60 Quine (1993)
Kenny Hill Selangor, Malaysia Cut slope Shale – slightly weathered (load applied parallel to the sample lamination)
0.38 Mohamed et al. (2006)
Kenny Hill Selangor, Malaysia Cut slope Shale – slightly weathered (load applied perpendicular to the sample lamination)
0.76 Mohamed et al. (2006)
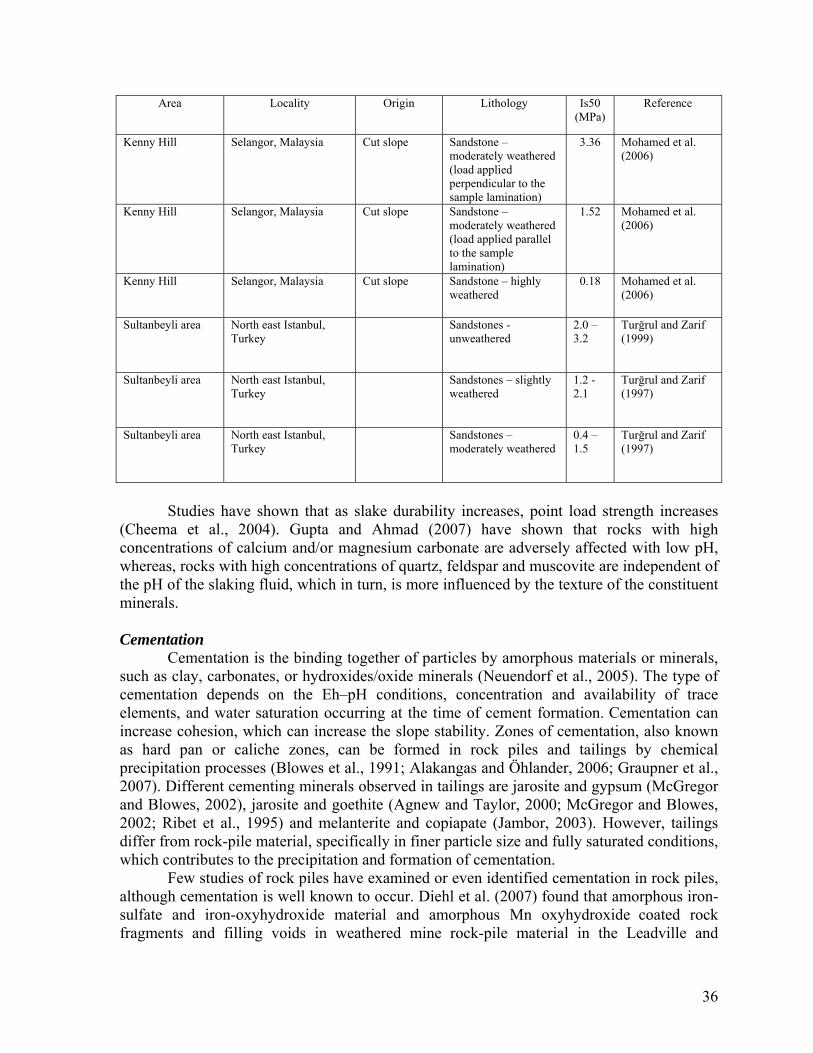
36
Area Locality Origin Lithology Is50 (MPa)
Reference
Kenny Hill Selangor, Malaysia Cut slope Sandstone – moderately weathered (load applied perpendicular to the sample lamination)
3.36 Mohamed et al. (2006)
Kenny Hill Selangor, Malaysia Cut slope Sandstone – moderately weathered (load applied parallel to the sample lamination)
1.52 Mohamed et al. (2006)
Kenny Hill Selangor, Malaysia Cut slope Sandstone – highly weathered
0.18 Mohamed et al. (2006)
Sultanbeyli area North east Istanbul, Turkey
Sandstones - unweathered
2.0 – 3.2
Turğrul and Zarif (1999)
Sultanbeyli area North east Istanbul, Turkey
Sandstones – slightly weathered
1.2 - 2.1
Turğrul and Zarif (1997)
Sultanbeyli area North east Istanbul, Turkey
Sandstones – moderately weathered
0.4 – 1.5
Turğrul and Zarif (1997)
Studies have shown that as slake durability increases, point load strength increases
(Cheema et al., 2004). Gupta and Ahmad (2007) have shown that rocks with high concentrations of calcium and/or magnesium carbonate are adversely affected with low pH, whereas, rocks with high concentrations of quartz, feldspar and muscovite are independent of the pH of the slaking fluid, which in turn, is more influenced by the texture of the constituent minerals. Cementation
Cementation is the binding together of particles by amorphous materials or minerals, such as clay, carbonates, or hydroxides/oxide minerals (Neuendorf et al., 2005). The type of cementation depends on the Eh–pH conditions, concentration and availability of trace elements, and water saturation occurring at the time of cement formation. Cementation can increase cohesion, which can increase the slope stability. Zones of cementation, also known as hard pan or caliche zones, can be formed in rock piles and tailings by chemical precipitation processes (Blowes et al., 1991; Alakangas and Öhlander, 2006; Graupner et al., 2007). Different cementing minerals observed in tailings are jarosite and gypsum (McGregor and Blowes, 2002), jarosite and goethite (Agnew and Taylor, 2000; McGregor and Blowes, 2002; Ribet et al., 1995) and melanterite and copiapate (Jambor, 2003). However, tailings differ from rock-pile material, specifically in finer particle size and fully saturated conditions, which contributes to the precipitation and formation of cementation.
Few studies of rock piles have examined or even identified cementation in rock piles, although cementation is well known to occur. Diehl et al. (2007) found that amorphous iron-sulfate and iron-oxyhydroxide material and amorphous Mn oxyhydroxide coated rock fragments and filling voids in weathered mine rock-pile material in the Leadville and

37
Montezuma districts, Colorado. Similar textures were found in rock piles in Slättberg, Sweden by Lin and Herdert (1997) and in Gyeongsangbuk-Do area, Korea by Jeong and Lee (2003). Jeong and Lee (2003) described cementation consisting of fine aggregates of plumbojarosite, Fe oxyhydroxides and sulfates, and manganates in rock piles in the Gyeongsangbuk-Do area, Korea. According to Pernichele and Kahle (1971) field studies of leached rock piles indicate that the cementing action of iron precipitates formed within the piles as a result of natural or production leaching tends to improve the strength of the piles over time.
Marescotti et al. (2007) described cementation of grain fragments in a rock pile at a sulfide mine at Libiola, Italy. Fe-oxides and oxyhydroxides replaced primary sulfide minerals, replaced gangue minerals, coated grains, and cemented aggregates. The predominant minerals were goethite, lepidocrite, and hematite. Aggregates of flake-shaped Fe smectites were found intergrown with the alteration rims of the altered sulfide minerals and with the secondary Fe minerals.
Acero et al. (2006) and Bingham et al. (1994) present evidence that schwertmannite can be a predominant control of the chemistry of the acid water in rock piles. Schwertmannite is a Fe(III)-oxyhydroysulfate that forms commonly in waters with pH values between 3.0 and 4.5 and sulfate concentrations between 1000 and 3000 mg/l (Bigham et al., 1994). Within weeks to months, oxidation can transform schwertmannite into stable goethite (Bingham et al., 1994; Acreo et al., 2006), which can increase the cementation of the rock pile.
McGregor and Blowes (2002) found that cemented layers in tailings from northern Ontario resulted in an increase in density, decrease in porosity, and increase in sulfur relative to uncemented tailings. With time, gypsum-jarosite cement transformed to goethite-rich cement.
Chigira and Oyama (1999) studied the effect of chemical weathering on pyrite-bearing sedimentary rocks. The geotechnical evaluations by these authors showed that sandstone was strengthened, because of cementation by iron oxide or hydroxide resulting from oxidation of pyrite; while mudstone was weakened, because it had greater clay fractions and larger surface areas than sandstone.
Lohnes and Demirel (1973) reported the cohesion increase in lateritic soil as the result of weathering. According to these authors, the weathering process included a transformation of feldspars to kaolinite and kaolinite to gibbsite accompanied by formation of iron oxides from iron-rich primary mineral. The cementation was the result of loss of kaolinite, enrichment of oxides, dehydration and crystallization of iron-oxide minerals into continuous aggregates or networks.
THE EFFECTS OF WEATHERING ON ROCK PILES THROUGHOUT THE
WORLD Introduction
Many engineers and scientists have recognized that rock piles exhibit both physical and chemical weathering (Alpers et al., 1994; Cravotta, 1994; Nesbitt and Jambor, 1998; Jambor and Blowes, 1998; Jambor, 2003). It has been suggested that weathering of the rock piles could affect their long-term slope stability (Robertson, 1982, 1985). In this section, weathering will be defined and the effects of weathering on rock piles, specifically slope stability, will be discussed.

38
What is weathering?
Weathering is the set of physical and chemical changes, up to and including disintegration of rock by physical, chemical, and/or biological processes occurring at or near the earth’s surface (e.g., in the vadose zone within approximately 100 m of ground surface at temperatures less than or equal to approximately 70°C) that result in reductions of grain size, changes in cohesion or cementation, and change in mineralogical composition (modified from Neuendorf, et al., 2005). For the purpose of the Questa study, weathering refers to the changes in the rock pile materials after mining. Weathering is the consequence of exposing rocks to the conditions at the Earth’s surface in an environment of fairly low temperatures, low pressures, organic activity, and chemically active substances such as water and the gases of the atmosphere. According to the Glossary of Geology (Neuendorf et al., 2005), weathering is “the destructive process or group of processes by which earthy and rocky materials on exposure to atmospheric agents at or near the earth’s surface are changed in color, texture, composition firmness, of form with little or no transport of the loosen or altered material; specifically the physical disintegration and chemical decomposition of rock that produce an in-situ mantle of waste…” Many scientists study these processes in terms of geologic scale. However, weathering in rock piles, including the Questa study, is a study of weathering in engineering time, i.e. tens or hundreds of years, where short-term weathering processes are more important than long-term processes (Fookes et al., 1988; Geological Society Engineering Group Working Party, 1995).
There are two general types of weathering that must be examined during this project, physical weathering and chemical weathering. Physical weathering involves the physical breakup of a rock by mechanical processes. This decrease in grain size can result in an increase in surface area, which can lead to greater chemical reactivity and exposure of fresh mineral surfaces. Common physical weathering processes that are relevant to rock piles include (Fookes et al., 1971; 1988; Birkeland, 1999; Lan et al., 2003):
• Freeze/thaw and related frost-action effects • Thermal expansion and contraction of rock • Deformation (crushing) of rock fragments due to the weight of overlying rock • Abrasion, pressure release on rock by erosion of overlying materials • Growth of plants and living organisms in rock.
A special case that is relevant to Questa rock piles is the physical breakup of the rock by the volume increase resulting from transformation of anhydrite to gypsum or other crystal growth along fractures. Crystallization of mineral phases also can break up the rock, for example the crystallization of salt increases the volume by as much as 5%.
Chemical weathering encompasses changes to the texture, structure, and composition of the rock fragments due to geochemical and biogeochemical reactions. Important chemical weathering processes include (Canterford et al., 1985; Fookes et al., 1988; Birkeland, 1999; Lan et al., 2003):
• Oxidation-reduction (redox) reactions, such as the acid-generating oxidation of pyrite, which can be catalyzed by important microbiological interactions
• Short term acid-base reactions, such as dissolution of carbonates and precipitation of soluble, efflorescent salts that can cement fragments during dry periods but is not expected to provide reliable, long-term cohesion

39
• Solubility-controlled precipitation of long-lived cements such as goethite in ferricrete zones and low to moderate-solubility sulfates and related minerals (e.g., gypsum and jarosite)
• Longer term acid-base reactions, such as acid hydrolysis of alumino-silicates to form new clay minerals
• Normal soil diagenesis reactions driven largely by atmospheric oxygen and dissolved carbon dioxide where minerals in rock fragments are exposed to air.
Chemical weathering can be further classified as congruent and incongruent. Congruent weathering is the complete dissolution of the mineral without precipitation of a new phase. Incongruent weathering is the dissolution or partial dissolution of a mineral while precipitating a new phase or with a residue remaining after partial dissolution.
Short-term weathering suggests that rock-pile material is similar in composition to the parent material. Long-term weathering can diminish the effect of parent material on the composition of the resulting rock-pile material, turning it to a mine soil. The longer a material has been forming, the less it resembles the parent material. Mine soils are soils that form from organic matter, mineral soil materials, sediments, and rocks redistributed by humans during or after mining process (Galbraith, 2004).
Under typical, near-surface conditions (e.g., pH 5, 25°C), the rates of dissolution of aluminosilicate minerals are too slow to be a significant weathering process that could affect slope stability over periods of decades or even centuries (Lasaga and Bermer, 1998, table 1.5, p. 109). In considering the sorts of reaction rates cited by Lasaga and Bermer (1998) and most other geochemists studying weathering, it is important to note that they have been developed experimentally for conditions that are directed at near-surface conditions for rocks that do not include significant concentrations of sulfide minerals. The principal weathering acid in the typical environment is carbonic acid (H2CO3), formed by dissolution of atmospheric CO2 into low ionic strength meteoric waters:
H2O(l) + CO2 (v) < = > H2CO3 (aq) [5]
Under average atmospheric conditions (PCO2 = 10-3.5 atm), rainwater or snow will have a pH of approximately 5.7 (Holland, 1978; Hem, 1985). Lower pH, often around 5 and sometimes less than 4.5 is seen in precipitation affected by anthropogenic inputs of sulfur and nitrogen in the atmosphere, and pH also can be lower in soils affected by transpiration of photosyntheizing plants that drive the PCO2 up. But very low-pH values of the sorts seen in sulfide-mine systems (locally pH < 3.5) is not generated naturally by CO2-dominated systems. In addition, carbonic is a weak acid (CRC, 1985: pK = 6.37 ), and the titratable acidities of soil waters are generally in the range of a few to a few tens of a milligrams (mg) of calcium carbonate (CaCO3) eq/L (Sposito, 1989).
There are some other, related factors that separate the geochemical environment of the Questa rock piles from those generally considered in weathering studies. The rock piles contain as much as 5% of pyrite (FeS2), which most rocks and soils do not have. The porosity and structure of the rock piles allows flow of air into the system by both diffusion and advection/convection (Ritchie, 1994, 2003), providing the primary oxidant for pyrite oxidation:
FeS2 + 7/2 O2 + H2O Fe2+ + 2 SO42- + 2 H+ [6]
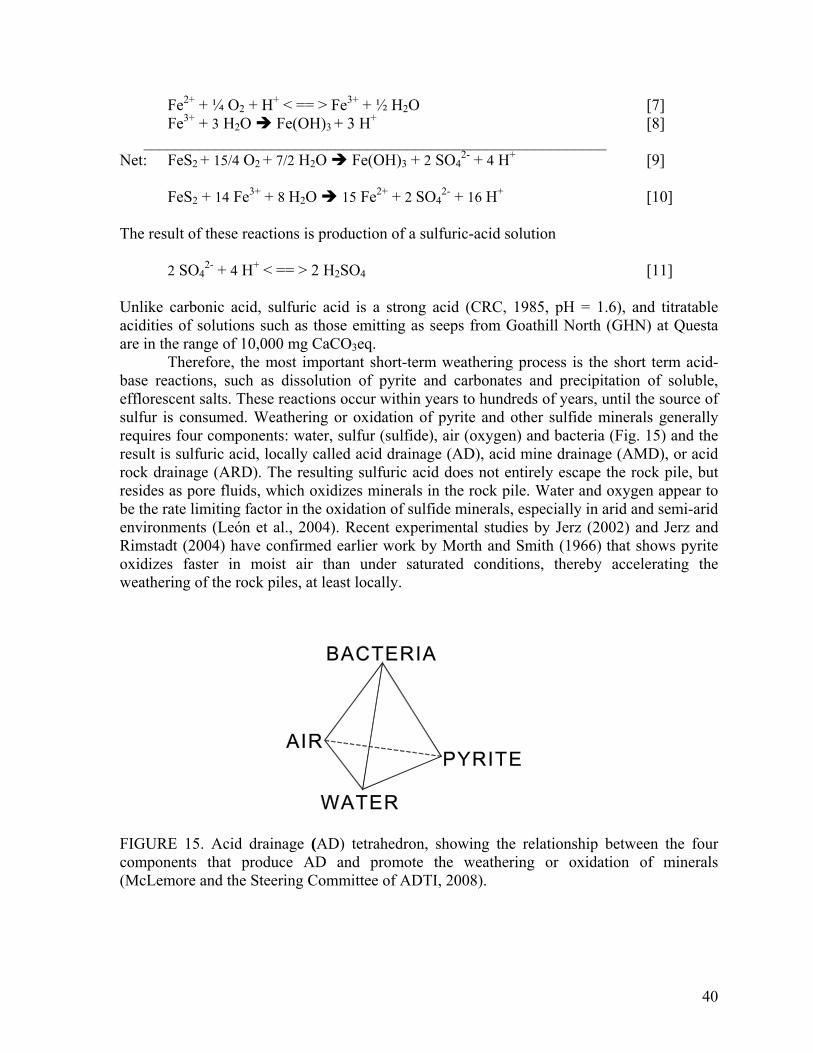
40
Fe2+ + ¼ O2 + H+ < == > Fe3+ + ½ H2O [7] Fe3+ + 3 H2O Fe(OH)3 + 3 H+ [8]
__________________________________________________________ Net: FeS2 + 15/4 O2 + 7/2 H2O Fe(OH)3 + 2 SO4
2- + 4 H+ [9]
FeS2 + 14 Fe3+ + 8 H2O 15 Fe2+ + 2 SO42- + 16 H+ [10]
The result of these reactions is production of a sulfuric-acid solution
2 SO42- + 4 H+ < == > 2 H2SO4 [11]
Unlike carbonic acid, sulfuric acid is a strong acid (CRC, 1985, pH = 1.6), and titratable acidities of solutions such as those emitting as seeps from Goathill North (GHN) at Questa are in the range of 10,000 mg CaCO3eq. Therefore, the most important short-term weathering process is the short term acid-base reactions, such as dissolution of pyrite and carbonates and precipitation of soluble, efflorescent salts. These reactions occur within years to hundreds of years, until the source of sulfur is consumed. Weathering or oxidation of pyrite and other sulfide minerals generally requires four components: water, sulfur (sulfide), air (oxygen) and bacteria (Fig. 15) and the result is sulfuric acid, locally called acid drainage (AD), acid mine drainage (AMD), or acid rock drainage (ARD). The resulting sulfuric acid does not entirely escape the rock pile, but resides as pore fluids, which oxidizes minerals in the rock pile. Water and oxygen appear to be the rate limiting factor in the oxidation of sulfide minerals, especially in arid and semi-arid environments (León et al., 2004). Recent experimental studies by Jerz (2002) and Jerz and Rimstadt (2004) have confirmed earlier work by Morth and Smith (1966) that shows pyrite oxidizes faster in moist air than under saturated conditions, thereby accelerating the weathering of the rock piles, at least locally.
FIGURE 15. Acid drainage (AD) tetrahedron, showing the relationship between the four components that produce AD and promote the weathering or oxidation of minerals (McLemore and the Steering Committee of ADTI, 2008).

41
The Geological Society Engineering Group Working Party (1995) sent a questionnaire to various engineers to review the way in which in-situ weathered rocks are described and classified. A few points of consensus include:
• Different lithologies weather in different degrees regardless of climate • Complex weathering fronts or profiles are common • Weathered rocks are difficult to classify • The more widely used classifications are descriptive and based on simple
observations and/or strength • None of the participants advocated the use of petrographical or geochemical indices.
Summary of characteristics of weathering
Weathering is the result of complex climatic, geological, biological, and physical processes as well as geography and climate (Fig. 16; Fookes et al., 1971, 1988, Lan, et al, 2003) and is likely to be heterogeneous, especially since the rock-pile material is heterogeneous. Weathering changes the original texture, structure, mineralogy, and chemistry of the material and tends to change a material from rock-like to soil-like material. Similar rocks in the same area can weather differently depending upon these processes. Different lithologies (i.e. rock compositions) can have different weathering rates under similar physical, chemical, and biological processes and therefore have different geological and engineering properties (Lan et al., 2003). The weathering environment and duration of weathering can be variable. Furthermore, weathering is not entirely a subtractive process, but additional elements can be added from precipitation of solutions, such as pore fluids. Other factors, summarized below, significantly affect the changes observed during weathering and can in fact, have more effect on the engineering properties than mineralogy and chemistry. Indications of weathering in the Questa rock piles include:
• Change in color, typically to yellow, orange, white, light gray for oxidized (weathered) samples compared to the darker brown and gray of unoxidized (unweathered) samples (however, color could be exaggerated)
• Change in bulk texture • A decrease in particle size in some samples due to physical weathering (i.e.
increase in fine-size particles due to weathering) • Increase in cracks/fractures • Increase in porosity (then a potential decrease if cementation occurs) • Increase in soil:rock ratio • Decrease in compactness (soils become loose with weathering, then a
potential increase if cementation occurs). • Changes in mineralogy
• Precipitation of Fe hydroxides and oxides in weathered samples • Precipitation of jarosite and gypsum (some of which can result from both pre-
mining alteration, as well as from post-mining weathering) • Dissolution of minerals (calcite, pyrite, epidote, clays, fluorite, other silicate
minerals) • Changes in mineral texture
• Primary igneous textures rarely preserved or obscured in highly weathered samples
• Oxidized (tarnished or coated) pyrite

42
• Reaction rims • Skeleton textures • Fractures in mineral grains
• Changes in grain textures • Increase roundness • Increase roughness • Breakage or destruction of grain contacts
• Changes in cementation or cohesion • Piping or stoping within rock pile • Gases venting from drill holes or surface fractures • Evolving water chemistry, as seen in water samples collected at the toe of rock piles
and base of alteration scars that are characterized by acidic, high sulfate, high TDS, high metal concentrations (Al, Mg, Fe, Mn, F, Cu, Zn, SO4) and low concentrations of K, Na, Mo.
Not all weathered samples exhibit all of these features.
FIGURE 16. Factors affecting weathering (Lan et al., 2003).
Weathering is generally not a subtractive process in the weathered soil profile (Duzgoren-Aydin et al., 2002), but weathering could be a subtractive process in the Questa

43
rock piles, as shown by the chemical composition of waters flowing form the base of GHN rock pile (McLemore et al., 2008a, c). Furthermore, the behavior of major elements and variations in paste pH and LOI (loss on ignition) within a soil profile and within the Questa rock piles can not be explained solely on the basis of weathering. In the Questa rock piles, variations in pre-mining lithology and hydrothermal alteration are important and must be quantified (McLemore et al., 2005, 2006a, b). The type and abundance of clay minerals within the Questa rock piles, unlike those within a natural weathered soil profile, are likely a result of pre-mining hydrothermal alteration and not necessarily a result of post-mining weathering (McLemore et al., 2006b; Donahue et al., 2007). In the Questa rock piles, unlike most natural soil profiles, dissolution of pyrite, calcite, and to a lesser extent chlorite and illite results in 1) dissolution in water seeping from the rock piles and/or 2) the precipitation of jarosite, gypsum, and other sulfate and iron oxide/hydroxide minerals.
Color is one of the easiest and most obvious characteristics of different intensities of weathering because it reflects differences in mineralogy and texture (Fontes and Carvaalho, 2005). The original color of the igneous rocks reflects the original mineralogy, which is typically related to the presence or absence of mafic and feldspathic minerals. The color of soils weathered from igneous rocks is somewhat dependent upon oxidation of these mafic and feldspathic minerals, especially iron and manganese oxides. Reds, browns and yellows typically reflect the different oxidation states and abundances of iron minerals and manganese oxides.
Numerous studies in the literature have used color as an indication of the intensity of weathering. Shum and Lavkulich (1999) used color to estimate iron content and as a weathering indicator. Yokota and Iwamatsu (1999) showed that colors towards red increased with increase in weathering. Yokoyama and Nakashima (2005) showed that color of weathered materials increased towards yellowish-brown with increased weathering as ferrihydrite weathers to goethite. Fontes and Carvalho (2005) describes various color indices and the relationship to weathering. Martín-Garcia et al. (1999) used a visual degree of weathering (DW; 0-3) based upon reddening, cracks, mineral alterations, compactness and roundness of the clasts. There was a lightening of color, red pigmentation, increase in cracks, decreased compactness and increased roundness with increase in weathering. Martín-Garcia et al. (1999) further showed that weathering profiles in pyrite-bearing rock consist of a less weathered reduced zone, dissolved zone, and more weathered oxidized zone in areas where the H2O and O2 fluxes are in the same direction. If the H2O and O2 fluxes are in opposite direction then the oxidized and dissolved zones overlap. Tonui et al. (2002) used color to differentiate between three different types of weathering of saprolite in regolith at the Northparkes deposit in New South Wales, Australia. Scheinost and Schwertmann (1999) used a colorimeter to determine that color is useful in identifying goethite, hematite, lepidocrocite, jarosite, maghemite, and feroxyhite but not as useful in identifying ferrihydrite, akaganeite, and schwertmnnite.
However, the mineralogical effect of the fast-reacting (less than 40 yrs) weathering pyrite system is to produce precipitates of secondary reaction minerals on the surface of existing rock fragments and within the soil matrix, which result in the yellow to orange color, reflecting the role of ferric iron in the mineral structures. The secondary precipitates form coatings on exterior surfaces, rims, and fill macro- and micro-fractures. Thus, the macro-scale impression of weathering, caused by the discoloration from the observed secondary

44
precipitates is exaggerated. Furthermore, the color of the rock pile material can in effect be from pre-mining hydrothermal alteration.
Differences in texture also are important in characterizing and understanding weathering processes. Munroe et al. (1999, 2000) described the changes in textures and geochemistry of minerals oxidized in rock piles in the Hillsboro district, New Mexico. Rinds, thought to form during weathering, formed cerussite and anglesite around galena, ilmenite and clay around hematite, and Fe/Cu hydroxide around chalcopyrite. Some minerals, such as pyrite, exhibited distinctive dissolution textures.
Diehl et al. (2007) recognized the importance of understanding differences in weathering characteristics based on scale, from the outcrop to the microscale. Physical weathering involves the breaking of rock fragments into smaller fragments along grain boundaries and transgranular fractures that are lined with iron oxides and other secondary minerals as well as freeze-thaw processes. Clay coatings and clay drapes on mineral grains and fragments indicate weathering and vertical transport of minerals within the rock pile. Dissolution of minerals, such as calcite, pyrite, chalcopyrite, sphalerite, galena, and ilmenite, and precipitation of new minerals, such as jarosite and iron oxides, are indicative of weathering.
The effect of physical weathering on rock strength Physical weathering breaks down rock material by exerting various stresses and
forces on rock fragments and outcrops. Freeze-thaw, wetting-drying, and heating-cooling can lead to eventual rupture of rock material by slowly opening any void spaces within the rock, especially along discontinuous surfaces, such as fractures (Fookes et al., 1988). Ollier (1984) estimates that freeze-thaw can exert a force up to 200 MPa. Crystallization and hydration of of salts also can break rock material down. Hale and Shakoor (2003) demonstrated in laboratory experiments that neither heating-cooling nor wetting-drying reduced the unconfined compressive strength values of sandstone, but that freezing-drying did significantly lower the unconfined compressive strength values of sandstone. These results suggest that freeze-thaw could be a quicker physical weathering effect than heating-cooling or wetting-drying. Weathering studies of rock piles
There are some studies on the effect of weathering on geotechnical parameters of material found in mine rock piles. Furthermore, natural hillslopes and rockfill dams have similarities with rock-pile material in general (Leps, 1970; Quine, 1993; Robertson, 1985; URS Corporation, 2003). Therefore, in this literature review of the effect of weathering on geotechnical properties of mine rock, studies on natural hillslope and rockfill material will be included as well.
Tran (2003) determined from a study of two contrasting rock piles that: • Internal structure of the rock pile influences the geochemistry, and therefore the
weathering, of the rock pile • Preferential leaching pathways can be developed, especially within coarse silt to fine
sand layers • End-dumping is the least desirable construction method because end dumping
produces alternating layers of fine and coarse layers that allow flow of oxygen and water into the rock pile.

45
Yokota and Iwamatsu (1999) measured the penetrative hardness of weakly welded dacitic to rhyolitic tuff rocks that correlates with their strength as an indicator of rock weathering. Through this technique, they showed that the rock surface had less strength and suffered from more weathering with the consequence of slope instability during heavy rainfall. Furthermore, Yokota and Iwamatsu (1999) claimed that the slope instability continued to occur in the region once the thickness of the weathered zone reaches a specific threshold.
Pasamehmetoglu et al. (1981) observed a decrease in strength of weathered andesites, when they studied rock piles in Ankara, Turkey. They noted that there is a large decrease in strength with weathering of the otherwise intact rocks. These changes in strength are due to the variation in mineral composition and porosity that occurs in andesites during weathering and that these changes affect the slope stability. Abramsom et al. (2001) noted the effect of weathering on rock piles by noticing the significant alteration of clay (argillic) to slaking and physical weathering due to the freeze-thaw and wet-dry cycles.
The Kennecott Greens Creek mine near Juneau, southern Alaska is a volcanogenic massive sulfide deposit, hosted by Triassic calcareous argillite and phyllite (metamorphosed volcanic rocks). The underground mine produced silver, gold, zinc, and lead starting in 1989 until 1993. The mine reopened in 1996. Weathering of the rock-pile material resulted in decrease in concentrations of dolomite, chlorite, and pyrite and precipitation of jarosite, copiapite, gypsum, hexahydrite, and epsomite, compared to fresh rocks (Condon, 1999). Condon (1999) noted “the lack of substantial amounts of clay minerals such as kaolinite and smectite even in acidic samples” was evidence that acidic conditions were established recently.
The Aitik copper mine, Sweden operated since 1964 by Boliden and is in quartz-biotite and muscovite schist, where thin veins and disseminations of chalcopyrite, pyrite, and pyrrhotite were mined (Takala et al., 1999). Primary minerals include plagioclase (10-30%), K-feldspar (10-30%), biotite (10-20%), muscovite (1-30%), quartz (20-30%), and calcite (0.5%). Material from the Aitik rock piles were placed in six unsaturated columns for 3.5 yrs. Results from the experimental studies and numerical modeling indicated that sulfate oxidation was accompanied by dissolution of calcite yielding a neutral pH and a simultaneous sulfide oxidation and weathering of silicate minerals in a pH of 3-4 after depletion of calcite (Stromberg and Banwart, 1994, 1999). Weathering of pyrite, chalcopyrite, sphalerite, plagioclase, biotite, and garnet, and calcite dissolution resulted in precipitation of gypsum, jarosite, ferrihydrate, and ferric oxyhydroxide and mobilization of various elements (Stromberg and Banwart, 1994, 1999). Many of the precipitated minerals coated the silicate minerals. Calcaterra et al. (1998) studied the weathering processes in crystalline rocks of the Sila Massif, Calabria, Southern Italy. Weathering grades were identified using a weathering field survey classification scheme proposed by the Hong-Kong Geotechnical Control Office. Descriptions of completely- to moderately-weathered gneissic rocks are presented in Table 9. Laboratory results of geotechnical properties in Table 10 showed that strength, density, and specific gravity decreased and porosity increased as weathering grade increased. Thuro and Scholz (2003) presented density and porosity results that are in agreement with the findings from Calcaterra et al. (1998) shown in Figure 17.

46
TABLE 9. Weathering field survey used to characterize the weathering sequence in the gneiss. Weathering grades I, II, and VI were unavailable to survey (after Calcaterra et al., 1998). Weathering
grade Parent rock
Field survey
V Gneiss (core
stones)
brownish to reddish-orange coarse-grained soils, retaining original mass structure and material fabric (less than 30% rocks, as core stones), slakes in water, easily crumbled by hand and finger pressure into grains, indented by geologic hammer, relict discontinuities are recognizable
IV Gneiss completely discolored (brownish-red) weak rocks does not slake in water, can be broken by hand into smaller fragments, discontinuities are clearly visible, original fabric is present
III Gneiss greenish-gray rocks stained and discolored along discontinuities and original fabrics are wholly preserved.
TABLE 10. Main engineering-geological features of weathered horizons near Acri (after Calcaterra et al., 1998). The numbers in brackets refer to the number of samples tested, and n.d. = not determined. Weathering
grade Parent Rock
Specific gravity
Bulk Density (kN/m3)
Dry Density (kN/m3)
Saturated Density (kN/m3)
Porosity (%)
Point Load Strength (MPa)
V Granitoids (soil)
26.3-27.6 (7)
19.3-20.0 (7)
18.3-19.4 (7)
21.4-22.2 (7)
28.7-32.2 (7)
n.d.
V Gneiss (corestones)
26.0-26.5 (5)
22.1-25.2 (5)
21.2-24.4 (5)
23.0-25.5 (5)
8.2-15.5 (5)
0.7-1.1 (4)
IV Gneiss 26.1-26.7 (6)
23.1-25.4 (6)
22.7-25.2 (6)
24.0-35.7 (6)
5.0-13.1 (6)
0.4-2.9 (6)
III Gneiss 26.3-29.9 (5)
25.3-28.6 (5)
25.2-28.6 (5)
25.6-29.0 (5)
2.2-4.7 (5)
0.5-4.1 (4)
FIGURE 17. Correlation of weathering grade with dry density and porosity. High/mean/low values are plotted for each grade (from Thuro and Scholz, 2003). Density decreased and porosity increased as weathering grade increased.
Peel (1990) exposed three soil materials to sulfuric acid (pH 1) and found that after 100 days of exposure, very little of the soil dissolved. Upon exposure to sulfuric acid, the

47
bentonite/sand mixture did not have a plastic limit, the hydraulic conductivity increased by an order of magnitude, and consolidation tests could not be performed. The White Store and Hoytville soil materials were resistant to acid dissolution, but exposure to sulfuric acid resulted in decreased plasticity index and increase in coefficients of consolidation. Peel (1990) concluded that the changes in hydraulic conductivity, consolidation, and Atterberg limits of the three soil materials exposed to sulfuric acid are a result of increased flocculation of the clays not to particle dissolution. Huat et al. (2005) studied the strength parameters in a profile of sedimentary residual soils of various weathering grades. The weathering grades varied from III to V (Table 9), where the lower end is for less weathered material and the higher end is for more weathered material. The site comprised residual soil of weathered sandstone, overlying schist and quartzite. The soils were generally yellowish brown and consisted mainly of fine sands, silt and clay. Results of triaxial tests are shown in Table 11. The results show an increase in cohesion and a decrease in angle of friction as the soil/rock becomes more weathered. An increase in fines content with weathering grade was observed, which according to the authors was the reason for a decrease in friction angle. TABLE 11. Shear strength parameters of sedimentary residual soil with weathering grades varying from III to V. The lower end is for less weathered material and the higher end is for more weathered material (Huat et al., 2005).
Weathering grade Cohesion Angle of friction (kPa) (degrees)
V 10 26 IV 8 28
IV-III 4 31 III 0 33
Lumb (1962, 1965) conducted extensive work on residual soils in Hong Kong. They successfully used particle size parameters to indicate the degree of weathering based on field observations that most soil profiles exhibit trends of decreasing particle size and increasing clay content towards the surface.
Jaboyedoff et al. (2004) found that weathering of fault gouge to smectite changes the mechanical properties of fault gouge, which leads to slope instability. The grain size distribution of the fault gouge is 3% clay and silts, 54% sand and 43% gravel. The dissolution of pyrite in the fault gouge allows the dissolution of albite and chlorite, thereby precipitating smectite. This weathering results in a decrease in friction angle and small variations in cohesion. Cohesion could increase as a result of precipitation of minerals such as calcite that act as cement, but cohesion also could decrease as other minerals dissolve.
Earley et al. (2003) examined the effect of weathering on slope stability at the Tyrone heap leach piles and found that the heap leach piles, consisting of granular material, are stable. The older rock piles appear to have weathered more compared to the interior of the rock piles and the younger piles. Most of the clay in the rock piles is from pre-mining hydrothermal alteration, not weathering. Feldspar alteration and clay formation in the weathering environment are slow and geochemical modeling shows that significant amounts of new clay is not expected to form in the future. Friction angles ranged from 34.1° (shear stress 2.2 psi) to 36.9° (shear stress 0.6 psi).

48
Even though most literature presents similar results, and indicate a reduction of strength with increasing weathering, it cannot be generalized that weathering will always decrease mine rock/soil strength. Most of these studies are based upon soil profiles that ranged from unweathered rock to weathered soil that formed over a long period of time. Cementation was not a factor in these studies. Chemical weathering can produce cements, such as hematite, that will join grains together and that are not easily dissolved in water. According to Pernichele and Kahle (1971) field studies of leached rock piles indicate that the cementing action of iron precipitates formed within the piles as a result of natural or production leaching tends to improve the strength of the piles over time. Generally, the cementation is so complete that vertical cuts are capable of standing for years without signs of failure.
Effects of weathering on rocks similar to those in rock piles Tuğrul and Zarif (1999) determined that textural characteristics have greater changes
in the engineering properties than changes in the mineralogy. Their study suggests that the types of contacts, grain (mineral) shape and size significantly influence the engineering properties of the granitic rocks. Strength increased as particle size decreased. Quartz and feldspar appear to be significant minerals that affect mechanical properties and these minerals can opposite effects on strength parameters.
Ng et al. (2001) recognized that the weathering grade classification developed by the GCO (1988) relies on visual inspection, experience and simple tests and could lead to inconsistent or even inaccurate classification of the weathering grade. Classification of the weathering grade is hampered even more because two or three weathering grades can occur in a single hand sample. They also recognized that weathering (decomposition) of feldspar began with leaching of alkali elements (Na, Ca) and with increase in weathering intensity clays can begin to form. Potassium and magnesium also leach from illite and chlorite, which with increase in weathering intensity can form kaolinite.
THE STABILITY OF ROCK PILES THROUGHOUT THE WORLD
Introduction A rock pile failure is the uncontrolled or unscheduled release of the pile material
beyond the confines of the pile (Robertson and Skermer, 1988). In summary, most rock pile failures are caused by disruptive actions that can be described in two ways:
• Sudden, intense or extreme events such as floods that cause liquefaction (Hutchinson, 1988), earthquakes, volcanic action, and glaciation, which apply forces exceeding the values for which the impoundments were originally designed
• Slow, but perpetual actions of wind and water erosion, frost action, other forms of weathering and decomposition, chemical reaction and biological actions such as intrusion by roots, animals, and man. Although slope failures and breaches in tailings piles are more common, sudden,
slope failures of rock piles are not as common, but when they occur, the resulting publicity feeds public perceptions that these mine features could be hazardous. Four types of sudden, intense failures of mine-rock piles include (Pernichele and Kahle, 1971; Whiting, 1981):
• Debris flow (also known as flow slide) • Foundation failure • Edge slump

49
• Blowout (internally generated by elevated hydraulic pressures that accumulate in some layers resulting in decreasing internal effective stress and stability).
Many investigators have studied the mechanisms resulting in failed rock piles (Table 12), but most of these studies have been on coal rock piles (spoils), which differ from those resulting from porphyry deposits. Coal rock piles generally consist of sedimentary rocks, which are weaker and weather differently than porphyry deposits and can allow more water into the rock piles that can result in slope instability.
The various failure modes that occur in mine waste embankments have been summarized by Caldwell and Moss (1981) and others who review the methods of analysis. These failure modes are illustrated in Figure 18. Surface or edge slides can occur as material moves down the slope. This mode of failure is most likely to occur in crest tipped embankments. If sufficient water enters the slope and flows parallel to the face, a shallow flow slide can occur. Rock piles placed on flat ground of competent soil are least likely to fail. However, if the flat ground is covered by a thin layer of weak material, base failure can occur. If the ground is inclined, base failure is more likely to occur. This mode of failure has been experienced in both end-dumped and layer-placed embankments. Block translation can occur where a dump is formed on inclined ground and the soil cover is relatively thin and weak.
Unusually high water tables in the embankment, earthquakes or the decay of organic material beneath the dump can start a slope failure. Circular arc failure through the dump material is most common where the dump material contains a significant percentage of find-grained soil. Similarly, a circular arc failure surface can develop through a deep foundation soil deposit of fine-grained soils (Caldwell and Moss, 1981).
Description of rock pile failures Many of the reported rock-pile failures are found in coal deposits, although other
types of deposits are subjected to failure as well (Table 12). Table 12 is divided into three types of deposits, coal-, igneous- or metamorphic-hosted, and gold deposits in hydrothermal-altered sedimentary rocks, to emphasize the different material of these deposits. Coal deposits are sedimentary deposits and the overburden typically contains relatively weak shales, siltstones, sandstones, and low-quality coal that have different properties than the igneous- and metamorphic-hosted massive sulfide and porphyry copper and molybdenum deposits, similar to the Questa deposit. Various terms are used to describe the overburden material remaining in the rock piles: dumps, waste piles, coarse colliery, spoil, gob, heaps, etc. Slope failures of some of these features have been dramatic, caused loss of life and property in some instances, and were widely publicized (Table 12).
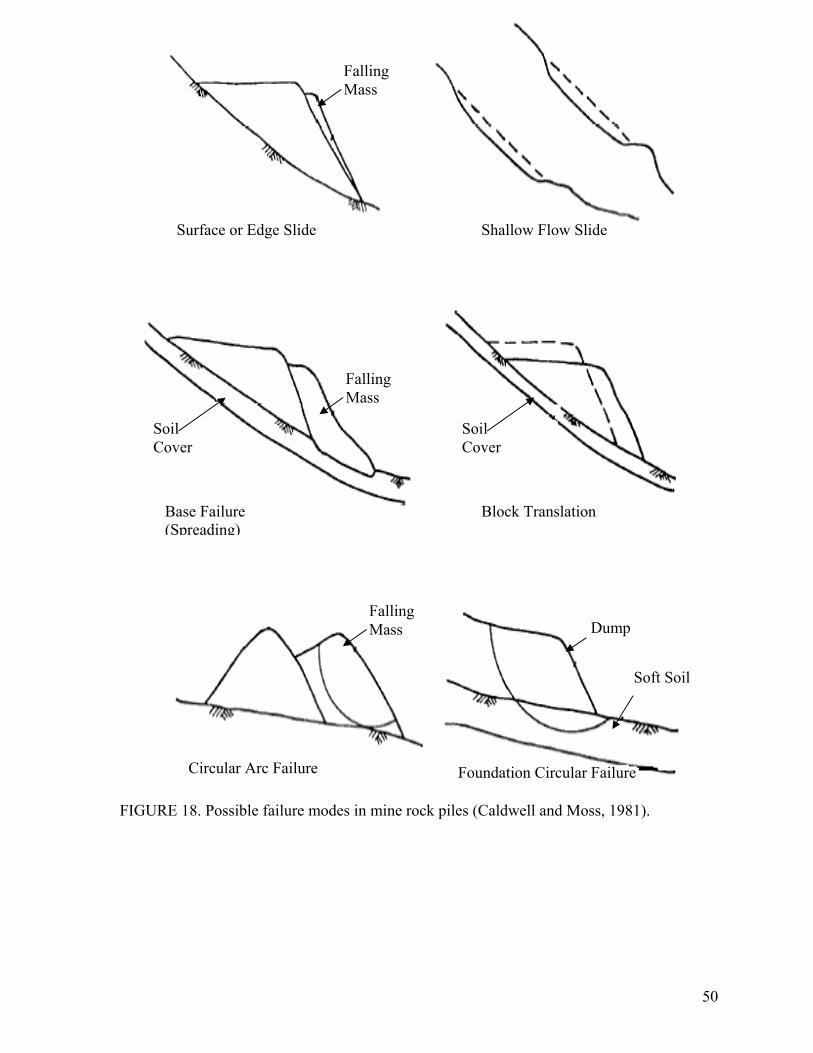
50
FIGURE 18. Possible failure modes in mine rock piles (Caldwell and Moss, 1981).
Falling Mass
Falling Mass
Soil Cover
Soil Cover
Falling Mass Dump
Soft Soil
Surface or Edge Slide Shallow Flow Slide
Base Failure (Spreading)
Block Translation
Circular Arc Failure Foundation Circular Failure
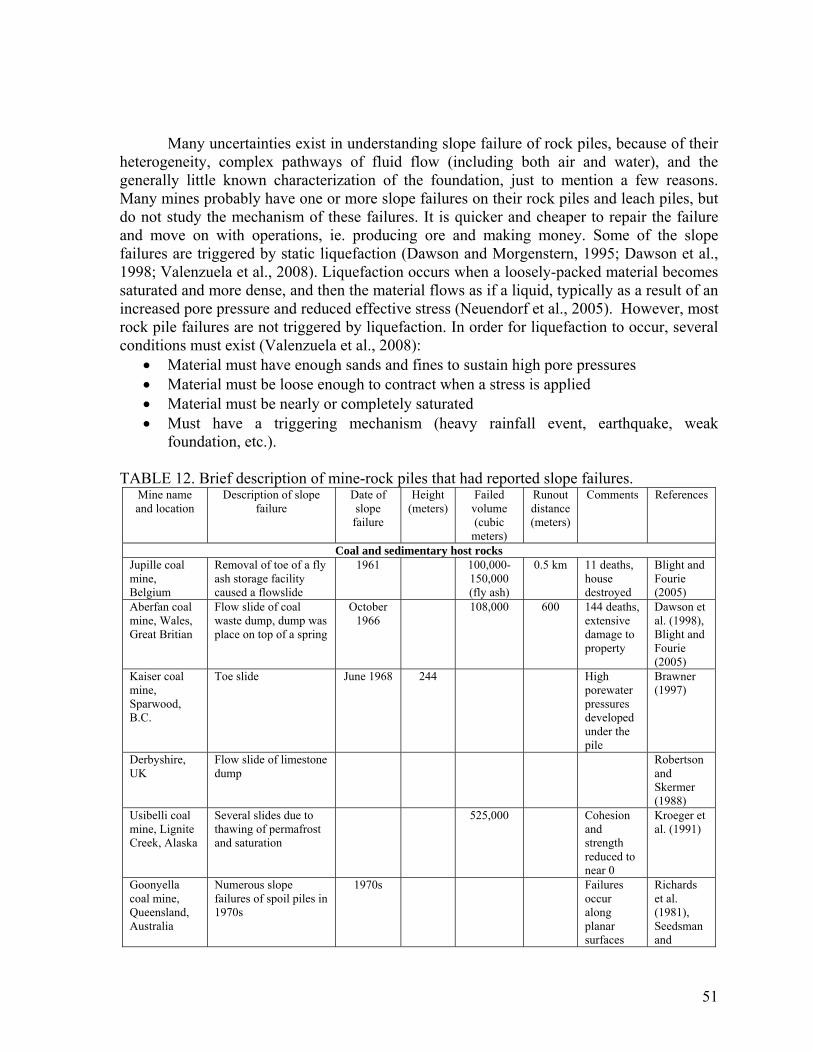
51
Many uncertainties exist in understanding slope failure of rock piles, because of their
heterogeneity, complex pathways of fluid flow (including both air and water), and the generally little known characterization of the foundation, just to mention a few reasons. Many mines probably have one or more slope failures on their rock piles and leach piles, but do not study the mechanism of these failures. It is quicker and cheaper to repair the failure and move on with operations, ie. producing ore and making money. Some of the slope failures are triggered by static liquefaction (Dawson and Morgenstern, 1995; Dawson et al., 1998; Valenzuela et al., 2008). Liquefaction occurs when a loosely-packed material becomes saturated and more dense, and then the material flows as if a liquid, typically as a result of an increased pore pressure and reduced effective stress (Neuendorf et al., 2005). However, most rock pile failures are not triggered by liquefaction. In order for liquefaction to occur, several conditions must exist (Valenzuela et al., 2008):
• Material must have enough sands and fines to sustain high pore pressures • Material must be loose enough to contract when a stress is applied • Material must be nearly or completely saturated • Must have a triggering mechanism (heavy rainfall event, earthquake, weak
foundation, etc.). TABLE 12. Brief description of mine-rock piles that had reported slope failures.
Mine name and location
Description of slope failure
Date of slope failure
Height (meters)
Failed volume (cubic
meters)
Runout distance (meters)
Comments References
Coal and sedimentary host rocks Jupille coal mine, Belgium
Removal of toe of a fly ash storage facility caused a flowslide
1961 100,000-150,000 (fly ash)
0.5 km 11 deaths, house destroyed
Blight and Fourie (2005)
Aberfan coal mine, Wales, Great Britian
Flow slide of coal waste dump, dump was place on top of a spring
October 1966
108,000 600 144 deaths, extensive damage to property
Dawson et al. (1998), Blight and Fourie (2005)
Kaiser coal mine, Sparwood, B.C.
Toe slide June 1968 244 High porewater pressures developed under the pile
Brawner (1997)
Derbyshire, UK
Flow slide of limestone dump
Robertson and Skermer (1988)
Usibelli coal mine, Lignite Creek, Alaska
Several slides due to thawing of permafrost and saturation
525,000 Cohesion and strength reduced to near 0
Kroeger et al. (1991)
Goonyella coal mine, Queensland, Australia
Numerous slope failures of spoil piles in 1970s
1970s Failures occur along planar surfaces
Richards et al. (1981), Seedsman and

52
Mine name and location
Description of slope failure
Date of slope failure
Height (meters)
Failed volume (cubic
meters)
Runout distance (meters)
Comments References
that concentrate moisture
Emerson (1985)
Buffalo Creek coal mine, USA
Overtopping of coal dump
1972 118 fatalities, 4000 homeless and $50 million damage
Blight and Fourie (2005)
Quintette coal mine, Tumbler Ridge, British Columbia, Canada
Flow slide caused by pore pressure resulting from collapse settlement
September 9, 1985
240 2,500,000 2,200 Weight of spoil pile overloaded flood plain sediments
Brawner (1997), Dawson et al. (1998), Blight and Fourie (2005)
Fording River coal mine, British Columbia, Canada
October 26, 1989
400 3,000,000 800 Dawson et al. (1998)
Greenhills Cougar No. 7 coal mine, British Columbia, Canada
May 11, 1992
100 200,000 700 Dawson et al. (1998)
Central pit, Central Anatolia, Turkey
Circular failure due to oversaturation after heavy rainfall
May 2001 850 20,000,000 Kasmer and Ulusay (2006)
Valea Manastirii, Gorj, Romania
landslide March 2000
60 30-50 Stanciucu (2005)
Sulphur mine, Tarnobzeg, Poland
Toe failure caused by plastic clay in the subgrade and manner of dumping (raised in successive layers)
Mularz. and Rybicki (1977)
Eskihisar, Yatağan, Turkey
Sallow circular failures produced in part by increased water infiltration
Ulusay et al. (1995)
Niederlausitz, Eastern Germany
15 flowslides of lignite waste rock piles
1955-1998
Up to several millions
Water level rises in rounded, fine- to medium grained sands
Witcher (2007)
Blackpool China Clays, Cornwall, UK
Rapid flow slide October 1967
130 Lucia (1981), Robertson and Skermer

53
Mine name and location
Description of slope failure
Date of slope failure
Height (meters)
Failed volume (cubic
meters)
Runout distance (meters)
Comments References
(1988) Igneous or metamorphic host rocks
Hayden Hill gold mine, Lassen, Calif
rock pile slide 1993 68.5 Kinross (2007)
Clinton Creek asbestos, Yukon, Canada
slope failure of rock pile due to weak foundation, thawing of foundation resulting in excess pore pressures
1974 Robinson et al. (2005)
Equity silver mine, British Columbia, Canada
minor slope failure at Main dump as a result of construction on top of glacial till, company changed construction method
URS Corp. (2003)
Bonner, Silverton, Colorado, USA
while remediating adits, a portion of the rock pile failed when trucks traveled over it
2001? 19 runout was less than 100 m
Stormont and Farfan (2005)
Callahan lead-zinc mine, Bar Harbor, Maine, USA
slope failure because of oversteepening slope
Between 1972 and
2003
Metcalf and Eddy (2003)
Big Springs gold mine, Nevada, USA
evidence of failure of rock pile, reactivation of older failures or excessively loading an older weak material
unknown Quine (1993)
Bingham Canyon copper mine, Utah, USA
slide of 20 acres rock pile along a weak, continuous saturated clay soil foundation
May 1981,
August 1982
Zavodni et al. (1984), Perniche and Kahle (1970)
Vlakfontein gold, Witwatersrand field South Africa
Basal slip beneath quartzite dump
1965 (Blight 1969)
Grasberg, Indonesia
Slope failure May 2000
4 fatalities Infomine (2007)
Copper mine, Chile
Failure of a rock pile ~2004 315 Reached the open pit and climbed the opposite wall 75 m
Valenzuela (2004), Valenzuela et al. (2008)
Nye Nye iron mine, Liberia
Iron ore dump failure 1982 200 fatalities
(NCE, 1982)
Gold or silver deposits in hydrothermal-altered sedimentary rocks Gold Quarry gold mine, Nevada, USA
Failure in deposited Carlin Formation materials
February 2005
Slide covered road
Barkley et al. (2006)
Montalbion mine, Queensland
Slope failures Rock piles formed during
Harris et al. (2003)

54
Mine name and location
Description of slope failure
Date of slope failure
Height (meters)
Failed volume (cubic
meters)
Runout distance (meters)
Comments References
mining 1885-1922
Coal and sedimentary host rocks Bishop (1973) reviewed the stability of a few tip and spoil heaps. In particular, he
investigated the disaster at Aberfan, Great Britian, a slide involving 102,060 m3 (140,000 yd3) of colliery rubbish that resulted in the loss of 144 lives, mostly children. The height of the tip from the toe to the crest was approximately 66 m (220 ft) when the slide occurred. In his study Bishop (1973) introduced the brittleness index (Is) that can be applied to both drained and undrained conditions:
f
rfs drainedI
τττ −
=)( [12]
fu
rufus
cccundrainedI
)()()()( −
= [13]
where τ is the shearing resistance on the sliding surface for a given value of effective normal stress and cu denotes the apparent cohesion. The suffixes f and r refer to peak and residual states. Drained triaxial tests on tip material that on average contained only 10% of fine passing the no. 200 sieve gave a peak friction angle of 39.5º. But this material degraded to a cohesive material with plasticity index of 16 and ultimate (or residual or post peak) friction angle of 18º on the lower section of the slip surface. In this latter region, a displacement of at least 21 m (70 ft) was estimated on the slip surface. Therefore, the brittleness index for the tip material was about 61%. Bishop (1973) believes that the tip material had a low in-situ dry density that made it capable of undergoing a very large decrease in volume when subjected to a large shear displacement. The reduction of volume was responsible for the increase in pore pressure, which together with the high brittleness resulted in great movement of the sliding material.
Dawson et al. (1998) investigated the stability problem of coal mine rock piles in British Columbia, Canada. The heights of the rock piles range between 100 to 400 m and they were end-dumped at their angle of repose of approximately 38º on foundation slopes steeper than 15º. The foundation materials overlying the bedrock typically consist of granular colluvium derived from weathering and slope wash or alpine dense stony glacial tills. Three rock piles, Marmot 1660, South Spoil, and Cougar 7, failed during 1985 to 1992. The failed material ranged from 0.2 to 2.5 million cubic meters and the runout distance was between 700 to 2200 m. A significant rainfall of 30 to 35 cm within 2 weeks prior to failure was recorded for both the Marmot 1660 and South Spoil rock piles. Similar rainfall intensities did not precede the failure of Cougar 7, but this rock pile was constructed under wet conditions the previous spring. Dumping on Marmot 1660 was operational until a few hours before the failure when activities were shut down due to the presence of large cracks. Major cracking and bulging did not occur until just before failure. The South Spoil was operational until October 24, 1989, at which time the dump was closed because of high rate of movement. Movement rate of approximately 10 cm/hr was detected by wireline extensometers that on October 25 increased to 100 to 130 cm/hr before the catastrophic failure on the following

55
day. Cougar rock pile was inactive and remained stable for 13 months prior to failure. Just prior to failure, cracks were noticed on the dump face following the snow fall the previous night. Dawson et al. (1998) indicates that these dumps were moving on a fine-grained and wet layer. Triaxial tests on the foundation soil of these rock piles showed brittle behavior of this material with a mobilized friction angle corresponding to the peak deviatoric stress that was lower than the steady state friction angle. Dawson et al. (1998) concluded that due to the increase in pore pressure and collapse behavior of these rock piles at void ratios greater than about 0.3, rapid failure or flow slide occurred.
Rock-pile instability at the Eskihisar strip coal mine of southwestern Turkey was studied by Ulusay et al. (1995). More than 80% of rock-pile material is made of weak, laminated and clayey rock types of the Sekkoy Formation, predominantly marly material. The rock piles were constructed at their angle of repose of 35º and were 40 to 100 m high. SPT, direct shear tests, consolidated drained triaxial tests and slake durability tests were perform on the rock pile material. The rock-pile material was classified as GM-MH in the Unified Soil Classification system, and contained 15 to 69%, with a mean of 44% fines. The majority of liquid limit values exceeded 50% with an averaged plasticity index of 18.5. The predominant clay minerals in the rock-pile material were illite and kaolinite with small amounts of montmorillonite. The natural water content varied between 28 and 49% with a mean of 37%. The SPT values ranged between 10 and 40, indicating a friction angle of 31 to 38º for the material. The moist density of the rock-pile material was between 13 to 15 kN/m3 and the peak and ultimate friction angles of 34.3º and 33º were obtained from the laboratory tests. The corresponding peak and residual cohesions were 12 and 8.9 kPa respectively. The values for the peak and ultimate friction angles indicate that that the frictional resistance of the rock pile did not reduce markedly even after a shear strain of 15%. The majority of rock pieces tested for slake durability showed durability index of 90% or higher, indicating high to very high durability according to the Franklin and Chandra (1972) durability classification. Nevertheless, if the samples were subjected to five cycles of drying and wetting instead of two cycles, their durability index was reduced. This was an indication that these materials are susceptible to relatively fast weathering, which also is consistent with the high percentage of fine-grained materials. Site observations indicated that the failures did not penetrate the foundation material and occurred along circular surfaces through the rock pile material. The slide movements were rapid and Ulusay et al. (1995) concluded that surface water infiltration contributed to failures.
A landslide in the rock piles in the coal mine area in north-central West Virginia was investigated by Okagbue (1986). The rock pile contained 41 to 90% fine material with a mean of 65%. The Atterberg limits of samples from the rock pile showed the liquid and plastic limits of 38 to 54, and 29 to 39, respectively. The plasticity index ranged from 7 to 26. The rock fragments in the rock pile had an averaged slake durability index of 79% or a medium durability under Franklin’s durability classification (Franklin and Chandra, 1972). Extensive weathering was indicated by this relatively low slake durability along with the presence of a high percentage of fine-grained materials in the rock pile. More than 50% of the rock-pile material in this region was made of red shale that is commonly soft, occasionally with a characteristic soapy texture, and weathers very rapidly to small platy fragments. A peak friction angle ranging from 26 to 33º and an ultimate friction angle ranging from 18 to 22º were obtained from consolidated undrained triaxial compression tests and consolidated drained direct shear tests on undisturbed samples. The measured peak and

56
residual cohesions were 9.6 to 18.2 kPa and 9.6 to 16 kPa, respectively. In the back analysis of the failed slope, an ultimate friction angle of 20º and 0 kPa cohesion was used; these values were justified based on the observed creep in the rock pile material. Okagbue (1986) concluded that the composition of the material, the nature of the foundation soil, and the seasonal high water table contributed to the instability of the rock pile.
Richards et al (1981) examined the rock piles failures at the Goonyella coal mine, located on the western flank of the Bowen Basin in central Queensland, Australia, which is operated by BHP-Billiton. The rock piles were constructed at a natural angle of repose of 35º. The height of the rock piles were 70 to 80 m. In order to access the coal layer, the 50 m thick overburden was gradually removed and dumped in the mine area. The overburden material consisted of interbedded to interlaminated sandstones, siltstones, and claystones. In many locations, black clay planes with liquid limit of 80 and plastic limit of 20 was observed that are in thin layers less than 4 cm in thickness. The rock-pile material included significant quantities of medium-order dispersive and swelling clays, including montmorillonite. Hydrogeological study of the mine area showed isolated regions in the rock pile with standing water level up to 15 m above the rock-pile floor. However, in most cases, free moisture was not observed in the boreholes and the unsaturated rock pile had moisture contents between 0 to 15%. Direct shear tests on unsaturated rock-pile material with an averaged moisture content of 11% indicated a peak friction angle of φ = 36 to 49º and a cohesion of c = 100 to 500 kPa. The residual shear strength parameters were φ = 15º and c = 125 kPa. Upon saturation (moisture content of 18%), the peak friction was reduced to φ = 15 to 30º and the corresponding cohesion was 15 kPa. The saturated ultimate friction angle and cohesion were 3 to 5º and 50 kPa, respectively. The higher residual cohesion compared to the peak value was justified by arguing that saturated clay material becomes less structured due to large movement along the shear plane corresponding to the residual stage of the shear testing. Comparison of the peak and ultimate friction angles indicated that the rock-pile material has a major strain softening characteristic. Richards et al. (1981) concluded that the failures of the rock piles occurred along two or three planar surfaces and that the low shear strength in the basal that was controlled by the sensitivity of the material to moisture, and the tensile cracking due to stress relief and blasting were the main causes for instabilities.
The stability of rock piles, 30-200 m in height, which were constructed on 10 to 26º natural slopes, were examined by Nichols (1982). The Fording River mine, located in the Rocky Mountains of Southeastern British Columbia, has average temperatures ranging from -40ºC in January to +35ºC in July. The annual precipitation consists of rainfall between 220 to 330 mm plus snowfall ranging from 240 to 680 cm. The rock piles have different face angles, which changed with deformation of the rock piles. For example, a rock pile at a height of 24 m was found to slump from an initial face angle of 40º down to 26º over a period of several months. The foundation material above the bedrock was 0-10 m of hard glacial till overlain by 0-7 m of weak compressible organic soil and peat. The glacial till had a density of 2.18 kg/m3. Samples of the till showed an average grain size content of 40% boulders and pebbles, 54% coarse to fine sand and 6% silt and clay. The rock pile material was a combination of 55% siltstone, 28% sandstone, 15% carbonaceous mudstone and shale and 2% non-recoverable coal. The dry density and friction angle of rock-pile material were 1.76 kg/m3 and 37º, respectively. Nichols (1982) noted that after compaction testing, there was a shift in the size distribution between 15 and 20% to the finer side, possibly indicating that the rock fragments did not have high strength. Tension and shear cracks were observed

57
on the surface of all rock piles at the mine. The tension cracks parallel to the face were 30 to 60 m long and up to 100 m back from the face. Nichols (1982) believed that these cracks were not related to the rock pile stability, but were the result of differential compaction due to increased dump height toward the crest. The measurement of rock-pile deformation indicated that the foundation slope had an influence on the movement rate. For example, on No. 2 dump, crest movement decreased from 0.6–0.8 m/day to less than 0.2 m/day, as the toe advanced over a 27º slope to a 14º slope. Nichols (1982) observed that when the crest movement of a rock pile exceeded 0.5 m/day, dumping in the area was temporarily stopped even though the rate of movement in excess of 1.5 m/day occurred on No. 2 dump without any subsequent mass failure. In general, weak organic foundation soils in excess of 0.3 m thick were removed before dumping the material. Movement of the rock pile at the foundation was observed locally where weak organic soils greater than 0.3 thick were not removed. A failure commenced due to continued dumping, despite abnormally high crest movement. In addition, a failure resulted from change in slope profile from 14.5º to 30º. In summary, the weak foundation of some of rock piles in this mine was believed as the main cause for the observed failures.
Filipowicz and Borys (2004) examined the effect of weathering on the geotechnical properties of rock piles at the Bogdanka coal mine in Poland. The rock piles in this mine contain 60% claystone, 20% siltstone with some 20% of sandstone and carbon rocks. In this study, geotechnical properties, including friction angle, cohesion, and coefficient of permeability of fresh wastes and wastes from a rockpile weathered for seven years were compared. The following results were reported:
• The gradation curves of fresh material and seven-year-old rock-pile material were different. The seven-year-old weathering resulted in the reduction of the original D50 of 10 mm to a new D50 of 3 mm.
• The maximum dry density and the optimum moisture content as determined by proctor tests for fresh and seven-year-old rock-pile materials were 1840 kg/m3 and 13%, and 1660 kg/m3 and 19% respectively. Therefore, the maximum dry density was reduced, whereas the water content increased due to weathering.
• The coefficient of permeability of the rock pile reduced from the original value of 4.02×10⁻⁴–8.67×10⁻⁴ m/s to 1.09×10⁻⁶–9.56×10⁻⁷ m/s after seven years of weathering.
• The cohesion of seven-year-old rock pile increased from 22-32 kPa to 26-40 kPa. Cohesion values were obtained by conducting direct shear tests on the rock-pile material, even though it was not clear whether the tested samples were saturated or unsaturated.
• The friction angle of the rock pile decreased from 43º-55º to 36º-39º after seven years of weathering. The fresh rock-pile materials also were subjected to constant soaking. The grain-size
distributions of the materials subjected to the constant soaking were determined after 7, 14, 21, 28, 35, 70, 112, 161, 224, 294, 371, 441, 511 and 581 days. Grain-size distribution, friction angle, and cohesion of the material did not change due to the constant soaking. The fresh rock-pile materials also were subjected to several cycles of wetting and drying. One cycle consisted of a three-week drying at a temperature of 20º C and wetting with water for the next 3 days. Sieve analysis of the materials showed that the percentage of gravel decreased, whereas the percentage of fine-grained material increased due to the wetting and drying cycles. For example, the percentage of gravel fraction decreased from 75% to 15%

58
while the percentage of fine-grained fraction increased from 10% to 38%. After 10 cycles of wetting and drying, the original cohesion of 22-32 kPa increased to 23-44 kPa, while the friction angle decreased from 43º-55º to 37º to 43º. Filipowicz and Borys (2004) concluded that the wetting and drying cycles have a more drastic affect on the geotechnical properties of rock piles compared to where the material is constantly soaked. It should be noted that the rock-pile materials in this study were not as acidic for civil engineering applications as Filipowicz and Borys (2004) expected them to be. Rock-pile instability in the Poker Flats mining area in central Alaska was reported by Huang et al. (1992). Total annual precipitation in this area ranges from 38 to 46 cm, with most precipitation occurring during late summer storm events. Spring thaw also contributes runoff to slopes. The rock-pile material consisted of frozen clayey silt and sandstone. The rock-pile material classified as SM in the Unified Soil Classification System, had a liquid limit of 18-21, a plastic limit of 15-18 and a plastic index of 2-5. The friction angle and cohesion of this material was 32º and 0, respectively. Part of the rock-pile material was beneath the water table in this mine. Huang et al. (1992) concluded that strength properties of material and variations of shear strength due to strain- or moisture-softening resulted in the instability.
Douglass and Bailey (1982) evaluated the rock-pile instability in several coal mines. In mine A, a surface coal mine in southern Illinois, the overburden consisted of 21 m of clayey glacial till over approximately 12 m of interbedded shales, claystones, and limestone. All coal production in this mine came from a single seam, the Illinois No. 6, which overlies a slakable underclay. Near the base of the spoil, a blocky rock to form a buckwall, 18 to 24 m in height was constructed by the shovel operator. The rock pile in mine A had a slope averaging 39º with an oversteepened toe of approximately 63º inclination. A large failure in this rock pile occurred with an apparent circular slip surface. It was not clear if this surface was confined to the rock pile or passed through the underclay. Back analysis indicated that a base failure would likely have occurred if the strength of the underclay was below its peak value. The reduction in underclay shear strength could have resulted from disturbance or an increase in water content. Douglass and Bailey (1982) determined, based on the laboratory tests, that the underclay friction angle declined from 27.5º at natural water content to approximately 23º when flooded, and further decreased to 16º when disturbed or remolded. The height of the rock pile at mine A was approximaltely 50 m.
Mine B located in northern Missouri also was examined by Douglass and Bailey (1982). The overburden consists of 8 m glacial till and about 17 m of shale interbedded with limestone and claystone. The height of the rock pile at mine B was approximately 60 m and had inplace buckwall of undisturbed rock. The rock pile failed due to shearing slip along the underclay beneath the buckwall. The failure was an example of a sliding wedge and caused a temporary closure of the pit. Douglass and Bailey (1982) believed that the failure in mine B was due to strength reduction through an increase in absorbed moisture and slaking.
Douglass and Bailey (1982) also examined the stability problem in 24 open pits in the central United States. Based on this study, they concluded that both highwall height and the percentage of soil and slakable rock in the highwall correlate well with spoil instability, as shown in Figure 19. According to Douglass and Bailey (1982), a slakable rock has a slake durability index of less than 85%. Figure 19 indicates that once the depth of excavation exceeds about 18 m, pits with more than 40% soil and slakable rock frequently experiences stability problems. The slope failures are less frequent or less severe as the amount of soil

59
and slakable rock reduces to 20% to 40%. Spoils with less than 20% soil and slakable rock seem to be stable even in comparatively deep mines. In Figure 20, the friction angle of overburden material versus the percentage of soil and slakable rock is shown and demonstrates how the friction angle reduces as the percentage of soil is increased.
0
5
10
15
20
25
30
35
0 20 40 60 80 100Percent Soil & Slakable Rock in Highwall
Hei
ght o
f Hig
hwal
l (m
)
Stable Spoils
Spoil Pile Slope Failures Observed & Reported
Infrequent or Less Severe
Failures
Minor or No Failures
Underclay Removed
Frequent or Severe Failures
FIGURE 19. Effect of highwall height and percentage of soil and slakable rock in the highwall on the rock pile stability (Douglass and Bailey, 1982).
FIGURE 20. Friction angle of spoil versus the amount of soil and slakable material in corresponding highwall zone (Douglas and Bailey, 1982).
Douglass and Bailey (1982) showed that the friction angle and cohesion of rock pile material are functions of water content and in-situ density, respectively (Figs. 21, 22).

60
0
10
20
30
40
0 5 10 15 20 25 30 35
Water Content (%)
Ang
le o
f Int
erna
l Fri
ctio
n (º
)
Least Squares Regression Line(Regression Coefficient, r = -0.84)
FIGURE 21. Friction angle (total stress) versus water content of spoil (Douglass and Bailey, 1982).
Least Squares Regression Line(Regression Coefficient, r = 0.82)
0
50
100
150
75 80 85 90 95 100 105Insitu Density Expressed as Percent of Standard Proctor Compaction
Coh
esio
n, k
Pa
FIGURE 22. Cohesion versus percent compaction for spoil (Douglass and Bailey, 1982).
Some geotechnical properties of the rock pile materials were reported by Douglass and Bailey (1982) (Table 13).

61
TABLE 13. Some engineering properties of generic spoil types (Douglass and Bailey, 1982). SPOIL TYPE Natural
Water Content
( %)
Dry Density (g/cc)
Angle of Internal Friction (total)
(degrees) φ
Cohesion (total) (kPa)
C
Plasticity Index
SOIL (Consists of 75% or more
soil and slakable rock
13 to 37 (21)
1.38 to 1.75 (1.54)
0 to 10 (5)
9.6 to 95.8 (57.5)
12 to 30 (19)
No. of Tests 29 29 9 9 9 MIXED
Soil & Rock 9 to 19 (13)
1.31 to 2.07 (1.68)
4 to 30 (20)
19.1 to 134 (62.2)
14 to 32 (19)
No. of Tests 44 43 14 14 16 ROCK
(Consists of 10% or less
slakable rock
5 to 15 (9)
1.44 to 1.91 (1.65)
27 to 32 (29)
28.7 to 47.9 (38.3)
14 to 20 (18)
No. of Tests 21 20 3 3 6 Note that all friction angles reported by Douglass and Bailey (1982) were determined from unconsolidated undrained triaxial tests. The tests included both undisturbed and reconstituted samples at their natural water contents.
The failure of 11 rock piles located in southwestern Virginia was investigated by Donovan and Karfakis (2003). The rock piles consisted of sandstone, shale, and coal. The soil classification of the materials was GM-GC, SM-SC and CL. The average values of density, cohesion, and angle of internal friction were 19.63 kN/m3, 8.41 kPa, and 28º, respectively. The slopes of the rock piles had a horizontal to vertical ratio of 1.5-1.6 that is equivalent to a slope angle of 32-33º. All the slides had a planar failure surface. Vertical scarping near the upper part of the rock piles and bulging at the toe were the most common features of the sliding surfaces. All 11 failures occurred during the years where rainfall was above average. Donovan and Karfakis (2003) believed that the following factors contributed to the rock-pile failures:
• The gravel-size fragments of shale and sandstone were subjected to cycles of wetting and drying that led to the formation of sand-silt-clay mixture that had a friction angle lower than that of the original rock-pile material.
• The drainage abilities of the embankments were hindered gradually as the percentage of fine-grained material increased due to weathering. The increase in fine-grained material reduced the permeability coefficient leading to the build up of excessive pore pressure.
• The material overlying the bedrock foundation was saturated. The water flow through the rock pile and parallel to the spoil-bed rock interface provided extra driving force of the material. In addition, the water flow lubricated the spoil-bed rock interface that was most likely the failure surface.

62
According to Donovan and Karfakis (2003), the failures were progressive in nature. The slides were initiated by formation of tension cracks that served as a collection point for surface run-off, causing diversion of water toward the rock pile-bed rock interface.
The geotechnical properties and stability problems of 12 coal mine rock piles in east-central Ohio were investigated by Shakoor and Ruof (1989). Eight of these rock piles were “new” (age one month or younger) and the rest were “old” (age seven years or older). The rock-pile materials consisted primarily of predominantly shale, with lesser amounts of sandstone and siltstone. No explicit information regarding the height of the rock piles were provided. Based on the slope stability sensitivity analysis that was conducted, it is realized that the slope angle of the rock piles ranged from 20º to 34º. The thickness of the overburden above the lowest-mine coal seam varied greatly between different mines and ranged from 9 to 37 m. The general mining method practiced in the area was contour strip mining. The dump was generally handled only once with no or minimal compaction. For geotechnical study, only near-surface samples were collected randomly at intervals no less than 76 m. Field dry density values ranged from 1400 to 1910 kg/m3 with an average of 1660 kg/m3. The natural water content was from 4.4% to 24.8% with a mean of 11%. The liquid limit, plastic limit, and plasticity indices were 23.2% to 43.5%, 15% to 26.6%, and 4.5% to 19.6%, respectively. The slake durability index of samples ranged from a low of 1.9% to a high of 95.5% with a mean of 75.9%. Shakoor and Ruof (1989) believe that the spoils will degrade with time due to their low to medium slaking resistance. The percentage of fine-grained material in the embankments was small; the majority of the samples had a percentage of fines less than 5%. The maximum percentage of fines was 55%. Table 14 shows some of the geotechnical properties of the rock piles measured by Shakoor and Ruof (1989). TABLE 14. Summary of the engineering properties for each individual bulk spoil samples (Shakoor and Ruof, 1989, dimensions of some parameters were changed from English to metric system).
Sample No.
Age USCS Natural Water
Content (%)
Liquid Limit
Plastic Limit
Plasticity Index
Liquidity Index
Slake Durability Index (%)
Permeability (10-5) (cm/sec)
Direct Shear
Friction (o) φ
Cohesion (kPa) C
A1 new GW 7.6 38 22.1 15.9 -0.91 79.8 28 0 A2 new SW 6.2 34.5 20.3 14.2 -0.99 83.6 5.280 28 5.3 A3 new SW 7.5 29.3 19.2 10 -1.17 88.6 32 4.7 A4 new SW 9.1 24.1 15.9 8.2 -0.83 70.1 32 1.3 A5 new GW 5.5 33.4 21.6 11.8 -1.36 82.1 3.080 29 5.0 B1 new GP 9.3 33.8 21.4 12.4 -0.98 12.1 28 5.5 B2 new GW 11.6 37.4 24 13.4 -0.93 26.7 29 3.0 B3 new GW 14.4 29.6 19.4 10.2 -0.49 1.9 13.300 30 1.6 B4 new GW 10.7 29.2 19.8 9.4 -0.97 5.2 33 1.8 B5 new GP 8.1 23.2 15.7 7.5 -1.01 81.2 0.331 32 3.5 C1 old GW 9.6 34.5 21.4 8.1 -1.46 90.3 2.000 34 0.6 C2 old GW 9.2 35.8 26.6 9.2 -1.89 89.7 33 1.6 C3 old GW 9.6 30.3 21 9.3 -1.23 84.2 30 7.2 C4 old GW 10.1 37.4 25 12.4 -1.2 93.2 3.900 27 5.1 C5 old GW 11.5 36.8 23 13.8 -0.83 92.9 30 0 D1 new GW 5 29.5 18.2 11.3 -1.17 70.3 32 11.5 D2 new GW 5.2 28.1 17.4 10.7 -1.14 79.1 97.900 32 2.9 D3 new GW 14.6 36 22.7 13.3 -0.61 69.6 4.750 33 3.7 D4 new GW 16 30 20.9 9.1 -0.54 81.3 33 1.7 D5 new GW 8.1 29.3 17.3 12 -0.77 84.6 31 4.9 E1 new GP 7.8 31.3 21.4 9.9 -1.37 83.1 0.575 35 0 E2 new GW 5.4 29.5 19.2 10.3 -1.34 80.4 5.570 29 5.4 E3 new GW-GC 4.7 29 18.8 10.2 -1.38 85.4 32 1.7 E4 new GP 8.5 33 18.8 14.2 -0.73 76.8 29 3.8 E5 new GW 4.8 30 18.5 11.5 -1.19 83.3 32 0.5 F1 old SW 13.2 41.6 25.2 16.4 -0.73 52.2 26 9.5

63
Sample No.
Age USCS Natural Water
Content (%)
Liquid Limit
Plastic Limit
Plasticity Index
Liquidity Index
Slake Durability Index (%)
Permeability (10-5) (cm/sec)
Direct Shear
F2 old SC 17.2 36.3 21.9 14.4 -0.33 77.3 5.29 31 5 F3 old CL 18 39.4 21.2 18.2 -0.18 60.1 9.13 30 1.8 F4 old SC 24.8 43.5 23.9 19.6 -0.05 48.3 30 2 F5 old SW 19.3 38.8 22.6 16.2 -0.2 73.5 33 3.4 G1 new GW 13.5 29.6 17.8 11.8 -0.36 94.3 0.697 27 5.3 G2 new SP 6.5 29.5 17 12.5 -0.34 86.9 30 5.6 G3 new GW 7.9 30.1 17.1 13 -0.71 91.1 26 9.7 G4 new GW 8.1 32.5 18.6 13.9 -0.76 92.3 3.310 34 1.7 G5 new GP 10.8 28.4 16.6 11.8 -0.49 88.7 31 0.7 H1 new GW 4.4 26.2 15 11.2 -0.95 60.1 29 6.8 H2 new GW 5.7 26.1 16.1 10 -1.04 72.3 1.840 30 7.6 H3 new GW 6.4 26.2 21.7 4.5 -3.4 75.4 2.950 35 3.5 H4 new GW 4.5 27.9 18.1 9.8 -1.39 66.3 31 0.5 H5 new GW 7.6 24.8 15.8 9 -0.91 69.1 34 2.3 I1 old GW 8.7 33.5 24.6 8.9 -1.79 87.2 9.590 33 4.6 I2 old GW 10.3 35.9 25.2 10.7 -1.39 86.9 28 3.8 I3 old GW 11.6 31.2 22.9 8.3 -1.36 89.1 95.400 32 4.1 I4 old GW 11.7 36.6 26.2 10.4 -1.39 92.2 28 1.1 I5 old GW 11.3 38 25.2 12.8 -1.09 95.5 26 4.1 J1 new GW 8 32.5 19 13.5 -0.81 85.1 31 3.3 J2 new SW 5.6 27.4 18 9.4 -1.32 86.7 21.340 33 0 J3 new GW 9.8 29.7 22 7.7 -1.58 84.5 34 0 J4 new GW 12 28.5 19 9.5 -0.74 93.8 0.997 32 2.3 J5 new GW 6.7 29.2 18.1 11.1 -1.03 85 31 1.6 K1 new GW 23.2 30.5 21.9 8.6 0.15 87.9 7.520 32 2.1 K2 new GP 18.2 35.5 21.7 13.8 -0.25 68.7 25 5.3 K3 new SW 15.7 38.8 24.4 14.4 -0.6 83.3 28 1.5 K4 new GW 16.2 37.9 23.1 14.8 -0.47 79.8 27 0 K5 new GW 17.8 31.5 18.2 13.3 -0.03 77.8 7.260 28 4.4 L1 old SC 16.6 33.8 19.2 14.6 -0.18 NA 32 1.6 L2 old SC 14.9 33.8 21.2 12.6 -0.5 NA 31 0.1 L3 old CL 20.8 34.3 20.9 13.4 -0.01 NA 8.150 28 1.4 L4 old SC 12.8 37 19.9 17.1 -0.42 NA 4.320 30 1.9 L5 old SC 19.4 35.5 20.2 15.3 -0.05 NA 29 3.3
Mean 11.0 32.4 20.5 11.8 75.8 5.5 30.5 3.2 Standar
d Deviati
on
5.0 4.4 2.9 2.9 20.8 - 2.4 2.6
Table 14 indicates that many of the rock pile samples were classified as GW
according to the Unified Soil Classification System. The permeability of the material ranged from 3.31×10⁻⁶ to 9.79×10⁻⁴ cm/s, indicating the poor drainage characteristic of these rock piles. As Table 14 shows, the angle of friction and cohesion determined by direct shear testing under consolidated-drained condition ranged from 25.2 to 35.4º and 0 to 11.5 kPa, respectively. Note that the particles greater than no. 4 sieve were removed before conducting the shear tests. Figure 23 shows the relationship between the friction angle and the plasticity index reported by Shakoor and Ruof (1989). Even though the data points are scattered, as expected, the friction angle in general decreases as the plasticity index increases (Fig. 23). Statistical analysis by Shakoor and Ruof (1989) showed that the age did not appear to significantly control the engineering properties of the spoils. They believe that the age factor was masked by other factors, such as mining practice, percentage of various lithologies within the parent rock, and local hydrological conditions. However, Shakoor and Ruof (1989) mention that the plasticity index of old spoils tended to be slightly higher than that of the new spoils. Shallow circular slumps and flow slides were common failure mechanisms in these rock piles. Shallow slumps did not extend into the embankments more than 6 m. Water and underclay appear to affect the stability of the studied rock piles in these mines. Even though all the embankments studied had effective drainage system consisting of diversion ditches and catchment ponds, overloading of the ditches generally promoted erosion and

64
water infiltration into the settlement cracks between the spoil and the high wall. The ground water and rain water infiltration adversely affected the embankments stability. Some of the rock piles in the mine area had either continuous or laterally discontinuous underclay. This underclay had undrained shear strength of 49.4 kPa, as obtained by torvane tests. The slake durability index of underclay was as low as 14.4%. This very low durability suggested that the underclay could degrade rapidly under the wetting and drying effect of water percolation in the embankment that could result in the sliding of the rock piles.
FIGURE 23. Plasticity index vs. fricition angle for 60 samples from 12 coal mine rock piles in east-central Ohio (Shakoor and Ruof, 1989).
Stanciucu (2005) examined the stability of one of the largest coal mine tailings deposit in Romania, located in the Montru valley. This site is included in this review since the tailings consisited of gravel in the silty-clay matrix; this mixture is similar to that of rock piles. The tailings area is 60 m in height and covers an area of 6 km2. The volume of the tailings pile is more than 400 million cubic meters with side slopes of 18º to 20º. The construction of the tailings pile started 40 years ago. In March 2000, within a few hours, a large landslip occurred in this material with lateral movement in the order of 30 to 50 m and resulted in blocking the Montru River. The tailings pile was constructed on a Holocene deposit that was seated on bedrock. The bedrock consists of Pliocene clay-consolidated marl, interbeded coal layers and sand and gravel. The Holocene deposit included a variety of sediment, including silty clay, sandy silt, and sand and gravel. Borehole logs indicated that both the Holocene alluvium and the bedrock contained saturated cohesive soils of high plasticity and compressibility. The tailings material consisted mostly of silty clay of high plasticity and low compressibility with varying amounts of noncohesive gravel, sand and coal. The averaged geotechnical properties of the tailings pile, alluvial deposit, and bedrock are shown in Table 15. The geometry of the sliding surface was obtained by comparing the borehole data with vertical electrical sounding profiles. The electrical conductivity had a pronounced change in the vicinity of the sliding surface. Based on this study, Stanciucu (2005) concluded that the sliding surface passed through the weak foundation.
0
5
10
15
20
25
30
35
40
0 5 10 15 20
Plasticity Index (%)
Fric
tiona
l Ang
le (o )
New SpoilOld Spoil

65
TABLE 15. Geotechnical properties of a tailings deposit in Montru valley, Romania studied by Stanciucu (2005).
Material Water content (%)
Plasticity index (%)
Porosity (%) Degree of saturation (%)
Friction angle (degree) φ
Cohesion (kPa) C
Tailings pile 21.3 28.2 43.1 80 16.5 16.8 Holocene alluvial deposit
22 14.4 47.7 60 13.5 8.3
Bedrock 27.5 24.2 44.7 90 18.5 9.1
Igneous or metamorphic host rocks Pernichele and Kahle (1971) investigated the stability of rock piles at Kennecott’s
Bingham Canyon copper mine near Salt Lake City, Utah. Since the open-pit operations started in 1906, approximately 2 billion tons of waste rock has accumulated in the rock piles at the Bingham Canyon mine. Some of the rock piles are up to 300 m thick and as their thicknesses continue to increase, they extend behind the confines of the canyons. Systematic leaching of the copper-bearing rock piles began in 1942 and gradually the amount of water distribution increased with time. The increase in the height of rock piles and rate of growth of water distribution prompted detailed study of stability of these rock piles. Pernichele and Kahle (1971) report that failure involving the movement of entire rock piles or major portions of rock piles is unlikely as long as saturation within the base of the rock pile does not exceed 1/3 the pile height. For this reason, water level monitoring holes were drilled in the major piles. Even though no significant saturation and massive rock-pile failures have occurred before 1971, some relatively small troublesome slides have occurred.
The waste rock from the Bingham pit can be divided into two major types: quartzite and intrusive. Quartzite undergoes little chemical breakdown within the rock pile during leaching, resulting the rock piles composed of quartzite to retain high permeability. On the other hand, the high temperature of up to 82ºC (180ºF) and the acidic environment that exists within the rock piles caused rapid breakdown of the intrusive rock into clay and clay-like material. As the result of chemical decomposition of the intrusive rock, iron precipitates are generated. The iron precipitates improve the strength of the rock piles with time as the induced cementation is so complete that vertical cuts are capable of standing for years without signs of failure. The formation of clay and precipitation of iron salts has another effect on the rock pile; it reduces the permeability with time that can result in increased pore pressure in the rock piles.
Note that the angle of internal friction of fresh rock pile in this mine is approximately 32º. Based on studies by Pernichele and Kahle (1971), four types of failure have been observed in these rock piles: debris flow, foundation failure, edge slump, and blowout. Debris flow occurred in old rock piles with low coefficient of permeability. The low coefficient of permeability is due to break down of intrusive rock and deposition of iron salts. Pipeline breaks and concentrated natural runoff caused a large mass of lose dump material to accumulate as the flow moved down the rock pile slope. Foundation failure and edge slumps occurred in areas where dumping was in progress and were due to rapid loading of clayey foundation soil and temporary hang-up of dump material near the crest of the rock pile. These failures were preceded by extensive development of tension cracks along the crest of the rock pile and were slow in movement. These types of failures do not pose a serious threat to the personnel and equipments. Blowouts were extremely rapid in movement and occurred

66
in a perched water zone that intersected the rock-pile slope that had low permeability. This failure caused several hundred feet of material to be thrown in the air at the beginning of the failure. To control the blowout where perched water zones exist, the rate of water application to the rock pile needs to be carefully studied. Installation of drain holes to control saturation near the rock-pile face is also an effective tool in reducing the chance of blowout failure. The mineralization from the Hayden Hill mine in northcentral California is from a hydrothermally-altered, gold-hosted breccia and narrow vein deposit in Miocene volcanoclastic sequence of dacitic tuffs and breccias. Two open pit gold operations (the Lookout Zone and the Providence Zone) were mined from 1993 to 1999. As of May 1999, reclamation work continued at the mine. In 1993, the 210-acre facility experienced a series of small structural failures, culminating in a major failure in 1994. Subsequently, it was determined that a foundation weakness before mining caused the failure (Kinross, 2007).
Cassiar Mining Corporation mined the Clinton Creek asbestos mine in British Columbia in 1968-78 by open-pit methods. The sepentinite ore body is hosted by weathered and fractured argillite. More than 60 million tons of waste rock was deposited into 2 rock piles. In 1974, a slope failure occurred in one of the rock piles, blocking natural drainage and creating a lake. Investigations indicated that a weak foundation contributed to continued horizontal displacements following the initial slope failure. The loss of strength was related to several complex geological factors, including ice content, soil type, and the rate of thawing resulting in excess pore-water pressures (Robinson et al., 2005).
Lenses of zinc, copper, lead, and iron sulfides were first discovered in volcanic agglomerate and rhyolite and andesite volcanic rocks at the Callahan mine, Brooksville, Maine in 1880 and minor production occurred. In 1964, Callahan Mining Corporation began development of an open-pit mine, which began operations in February 1968. During 1968, a mud slide flowed into the pit and covered some mining equipment. Production ceased in 1972 and the area was added to the National Priorities List by the EPA in September 2002. During mining of the open pit, approximately 5 million tons of waste rock was removed and placed in three rock piles, which were referred to in older reports as tailings piles, ore storage pads, waste rock dumps, Mount Callahan, and overburden piles. These piles are not tailings but overburden waste rock. The smallest rock pile, WRP 3, had 1 to 2 slope failures due to oversteepening slopes (Metcalf and Eddy, Inc., 2003).
The Bonner mine site is one of many abandoned mine sites in Colorado. The stability of a rock pile in this region that is located on the south side of Mineral Creek in San Juan County was studied by Stormont and Farfan (2005). The rock pile was contributing to the metal load in Mineral Creek. For this reason, the U.S. Forest Service attempted to route the drainage away from the rock pile. Part of the rock pile failed and moved toward Mineral Creek even though it did not dam the stream. Field investigation indicated that the rock pile had a variable slope inclination; the slope angle was in the range of 2 to 52º. The histogram of slope inclination showed that the rock-pile slopes in the majority of locations were between 19º to 35º. Sieve analysis, Atterberg limit tests, permeability tests, and laboratory and in-situ direct shear tests were conducted on the rock-pile material. Gravimetric water content of the field material was in the range of 6 to 10%. The material had a low plasticity index and was classified as GP-GM that corresponds to poorly graded gravel with silt. The percentage of the fine, passing sieve no. 200, was approximately 11%. The constant head approach was implemented to measure the permeability of the rock-pile samples that were compacted to the field dry density. The mean permeability coefficient was 1.0×10⁻³ cm/s.

67
Stormont and Farfan (2005) believed that this permeability coefficient was sufficiently great to allow rapid drainage of the water through the rock pile. Consequently, there was little likelihood that positive pore pressures were developed in the pile. Laboratory shear tests were conducted using a shear box 32 cm2 × 2.5 cm (5 in2 × 1 in) in size. The tests were performed on samples with maximum particle size of 4.75 mm; due to scalping, only 30% of the rock pile material was used for laboratory shear testing. The shear test samples were either saturated with a water content of about 24% or had the field moisture content of 8%.
Large dimension laboratory and in-situ tests were performed as well using a shear box 30.5 cm × 30.5 cm × 15.2 cm (12 in × 12 in × 6 in) in dimension. Stormont and Farfan (2005) reported that the small scale laboratory tests produced the greatest shear resistance, suggesting that the shear strength of the smaller fraction of the rock-pile material was greater than that of the composite material. The mean friction angle and cohesion of all the laboratory and in-situ tests were reported as 37º and 4.8 kPa, respectively. The limit equilibrium stability analysis of the rock pile, using these shear strength parameters, demonstrated that some parts of the rock pile were instable.
Linero et al. (2007) studied the geotechnical properties of rock-pile materials in the Andina copper mine, Codelco, Chile. Since the production rate is planned to increase in next 10 years, it is estimated that some of the rock piles in this mine will contain more than 1000 million tons of material and will reach heights of up to 900 m. The waste material in these rock piles comes mostly from strong to very strong porphyry rock and granodiorite that has an average unconfined compressive strength of 125 MPa. The grains in the rock-pile material are angular and strong. The material is well graded with typical D100 of 406 mm, D50 of 76 mm and D10 of 10 mm. The percentage of fine-grained material is approximately 2%. A large triaxial apparatus 2 m in height and 1 m in diameter was used to study the shear strength of the rock-pile material. Even though the natural water content of the material ranged from 5.7 to 7.3%, all samples were saturated and then tested using consolidated-drained triaxial tests. The specific gravity of the rock fragments was 2.7 to 2.8. The rock-pile materials were scaled using “parallel” and “truncated” scaling. The maximum particle size was approximately 20 mm to ensure that this size did not exceed 1/5 of the cell diameter. The samples were compacted to the in-situ dry density of 18 to 19 kN/m3, which was obtained using the water replacement method. The stress-strain curves from the triaxial tests suggested a work hardening plastic behavior with no softening, even though the tests were continued up to an axial strain of 18%. Table 16 shows the results of triaxial tests, which shows that the friction angle reduced from 51º to 32º as the confining pressure increased from 0.1 to 2 MPa. The last column in this table shows approximately the percentage by weight of the material that suffered from particle breakage. The rock-pile modulus was measured as well. The modulus was reduced as the confining pressure increased; at a confining pressure of 500 kPa, the modulus was about 20 MPa. The non-linear Mohr-Coulomb envelope that was used for interpretation of the triaxial test results is as follows:
b
nAστ = [14] Where τ is the shear strength and σn is the normal stress in MPa. A and b are material constants that were 0.84 and 0.78 for “parallel” scaling and 0.86 and 0.9 for “truncated” scaling, respectively. Linero et al. (2007) concluded that the decrease of friction angle with the normal effective pressure must be considered in the stability analysis of the rock piles.
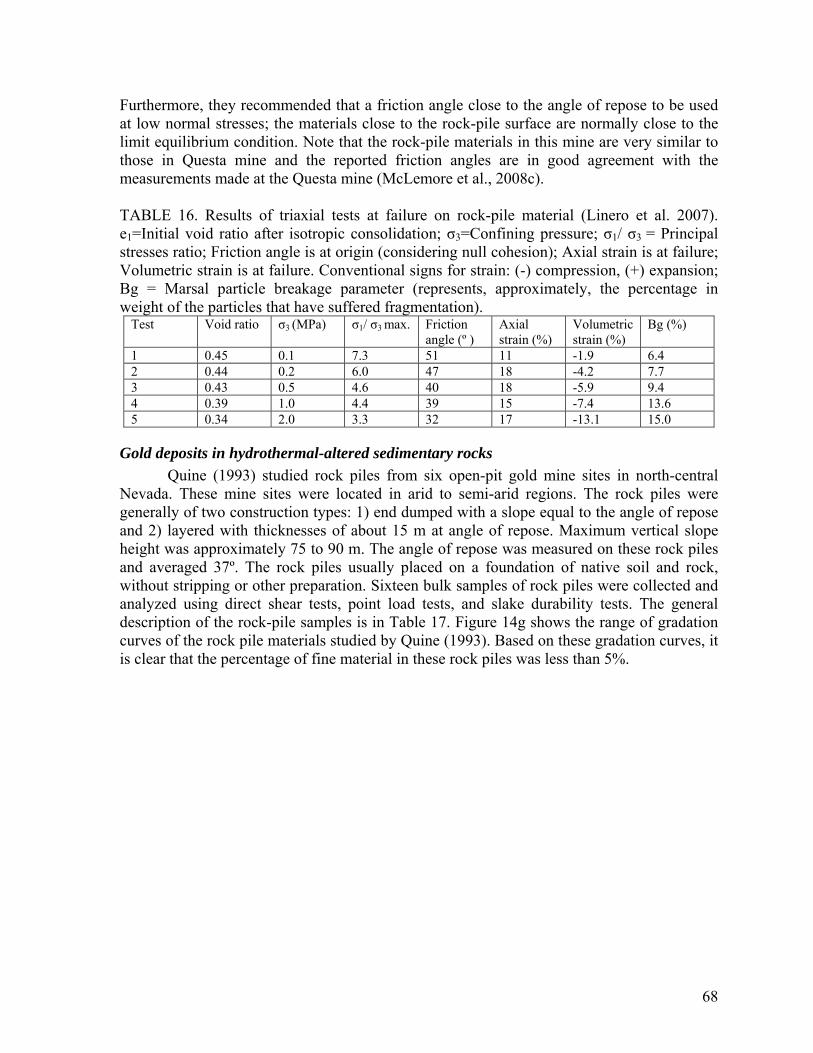
68
Furthermore, they recommended that a friction angle close to the angle of repose to be used at low normal stresses; the materials close to the rock-pile surface are normally close to the limit equilibrium condition. Note that the rock-pile materials in this mine are very similar to those in Questa mine and the reported friction angles are in good agreement with the measurements made at the Questa mine (McLemore et al., 2008c).
TABLE 16. Results of triaxial tests at failure on rock-pile material (Linero et al. 2007). e1=Initial void ratio after isotropic consolidation; σ3=Confining pressure; σ1/ σ3 = Principal stresses ratio; Friction angle is at origin (considering null cohesion); Axial strain is at failure; Volumetric strain is at failure. Conventional signs for strain: (-) compression, (+) expansion; Bg = Marsal particle breakage parameter (represents, approximately, the percentage in weight of the particles that have suffered fragmentation).
Test Void ratio σ3 (MPa) σ1/ σ3 max. Friction angle (º )
Axial strain (%)
Volumetric strain (%)
Bg (%)
1 0.45 0.1 7.3 51 11 -1.9 6.4 2 0.44 0.2 6.0 47 18 -4.2 7.7 3 0.43 0.5 4.6 40 18 -5.9 9.4 4 0.39 1.0 4.4 39 15 -7.4 13.6 5 0.34 2.0 3.3 32 17 -13.1 15.0
Gold deposits in hydrothermal-altered sedimentary rocks Quine (1993) studied rock piles from six open-pit gold mine sites in north-central
Nevada. These mine sites were located in arid to semi-arid regions. The rock piles were generally of two construction types: 1) end dumped with a slope equal to the angle of repose and 2) layered with thicknesses of about 15 m at angle of repose. Maximum vertical slope height was approximately 75 to 90 m. The angle of repose was measured on these rock piles and averaged 37º. The rock piles usually placed on a foundation of native soil and rock, without stripping or other preparation. Sixteen bulk samples of rock piles were collected and analyzed using direct shear tests, point load tests, and slake durability tests. The general description of the rock-pile samples is in Table 17. Figure 14g shows the range of gradation curves of the rock pile materials studied by Quine (1993). Based on these gradation curves, it is clear that the percentage of fine material in these rock piles was less than 5%.
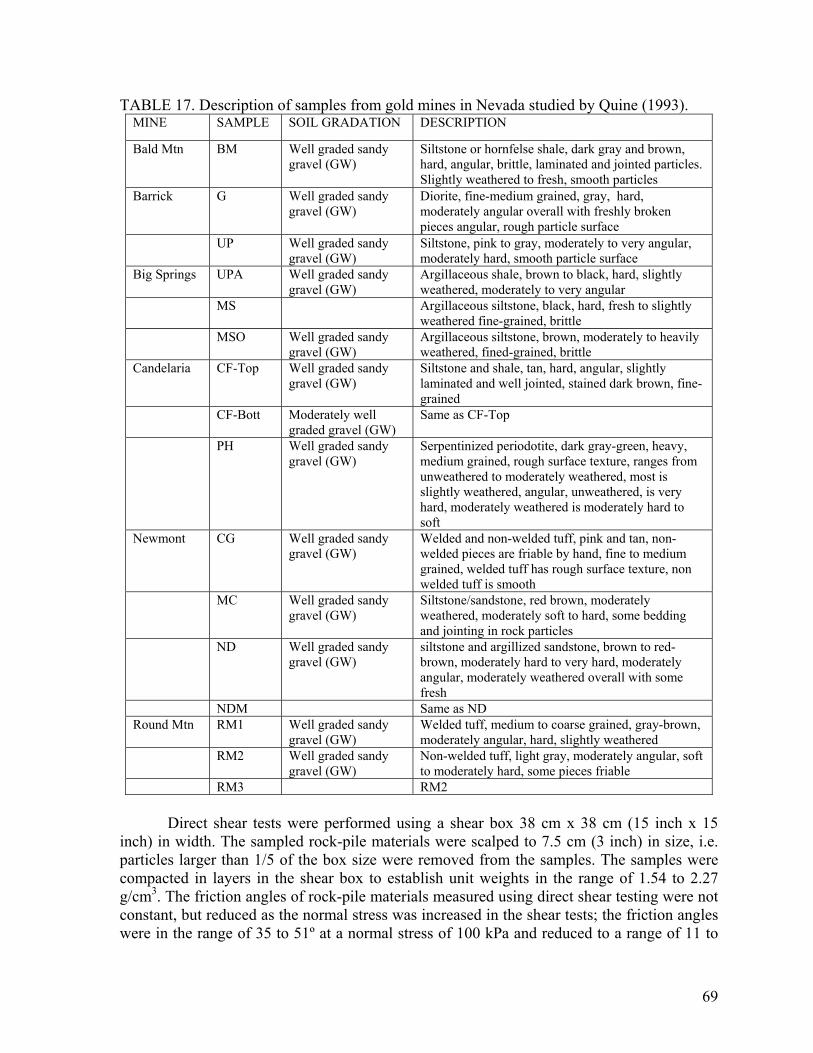
69
TABLE 17. Description of samples from gold mines in Nevada studied by Quine (1993). MINE SAMPLE SOIL GRADATION DESCRIPTION
Bald Mtn BM Well graded sandy gravel (GW)
Siltstone or hornfelse shale, dark gray and brown, hard, angular, brittle, laminated and jointed particles. Slightly weathered to fresh, smooth particles
Barrick G Well graded sandy gravel (GW)
Diorite, fine-medium grained, gray, hard, moderately angular overall with freshly broken pieces angular, rough particle surface
UP Well graded sandy gravel (GW)
Siltstone, pink to gray, moderately to very angular, moderately hard, smooth particle surface
Big Springs UPA Well graded sandy gravel (GW)
Argillaceous shale, brown to black, hard, slightly weathered, moderately to very angular
MS Argillaceous siltstone, black, hard, fresh to slightly weathered fine-grained, brittle
MSO Well graded sandy gravel (GW)
Argillaceous siltstone, brown, moderately to heavily weathered, fined-grained, brittle
Candelaria CF-Top Well graded sandy gravel (GW)
Siltstone and shale, tan, hard, angular, slightly laminated and well jointed, stained dark brown, fine-grained
CF-Bott Moderately well graded gravel (GW)
Same as CF-Top
PH Well graded sandy gravel (GW)
Serpentinized periodotite, dark gray-green, heavy, medium grained, rough surface texture, ranges from unweathered to moderately weathered, most is slightly weathered, angular, unweathered, is very hard, moderately weathered is moderately hard to soft
Newmont CG Well graded sandy gravel (GW)
Welded and non-welded tuff, pink and tan, non-welded pieces are friable by hand, fine to medium grained, welded tuff has rough surface texture, non welded tuff is smooth
MC Well graded sandy gravel (GW)
Siltstone/sandstone, red brown, moderately weathered, moderately soft to hard, some bedding and jointing in rock particles
ND Well graded sandy gravel (GW)
siltstone and argillized sandstone, brown to red-brown, moderately hard to very hard, moderately angular, moderately weathered overall with some fresh
NDM Same as ND Round Mtn RM1 Well graded sandy
gravel (GW) Welded tuff, medium to coarse grained, gray-brown, moderately angular, hard, slightly weathered
RM2 Well graded sandy gravel (GW)
Non-welded tuff, light gray, moderately angular, soft to moderately hard, some pieces friable
RM3 RM2
Direct shear tests were performed using a shear box 38 cm x 38 cm (15 inch x 15 inch) in width. The sampled rock-pile materials were scalped to 7.5 cm (3 inch) in size, i.e. particles larger than 1/5 of the box size were removed from the samples. The samples were compacted in layers in the shear box to establish unit weights in the range of 1.54 to 2.27 g/cm3. The friction angles of rock-pile materials measured using direct shear testing were not constant, but reduced as the normal stress was increased in the shear tests; the friction angles were in the range of 35 to 51º at a normal stress of 100 kPa and reduced to a range of 11 to
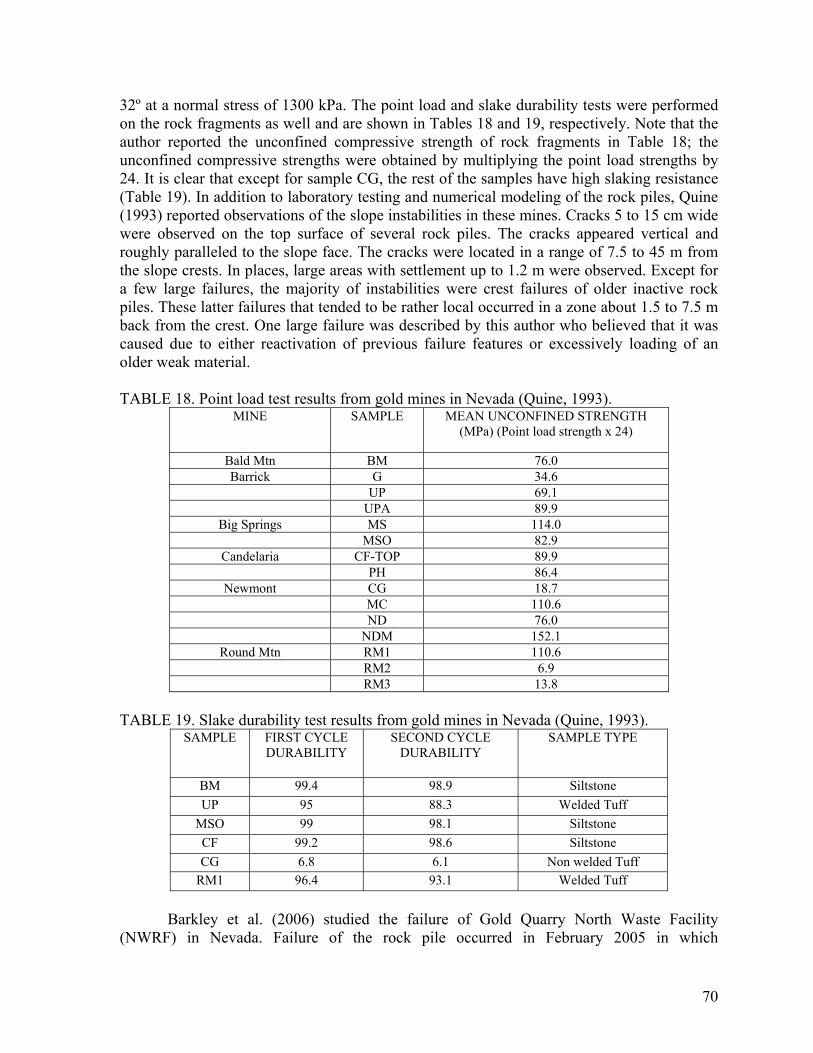
70
32º at a normal stress of 1300 kPa. The point load and slake durability tests were performed on the rock fragments as well and are shown in Tables 18 and 19, respectively. Note that the author reported the unconfined compressive strength of rock fragments in Table 18; the unconfined compressive strengths were obtained by multiplying the point load strengths by 24. It is clear that except for sample CG, the rest of the samples have high slaking resistance (Table 19). In addition to laboratory testing and numerical modeling of the rock piles, Quine (1993) reported observations of the slope instabilities in these mines. Cracks 5 to 15 cm wide were observed on the top surface of several rock piles. The cracks appeared vertical and roughly paralleled to the slope face. The cracks were located in a range of 7.5 to 45 m from the slope crests. In places, large areas with settlement up to 1.2 m were observed. Except for a few large failures, the majority of instabilities were crest failures of older inactive rock piles. These latter failures that tended to be rather local occurred in a zone about 1.5 to 7.5 m back from the crest. One large failure was described by this author who believed that it was caused due to either reactivation of previous failure features or excessively loading of an older weak material.
TABLE 18. Point load test results from gold mines in Nevada (Quine, 1993).
MINE SAMPLE MEAN UNCONFINED STRENGTH (MPa) (Point load strength x 24)
Bald Mtn BM 76.0 Barrick G 34.6
UP 69.1 UPA 89.9
Big Springs MS 114.0 MSO 82.9
Candelaria CF-TOP 89.9 PH 86.4
Newmont CG 18.7 MC 110.6 ND 76.0 NDM 152.1
Round Mtn RM1 110.6 RM2 6.9 RM3 13.8
TABLE 19. Slake durability test results from gold mines in Nevada (Quine, 1993).
SAMPLE FIRST CYCLE DURABILITY
SECOND CYCLE DURABILITY
SAMPLE TYPE
BM 99.4 98.9 Siltstone UP 95 88.3 Welded Tuff
MSO 99 98.1 Siltstone CF 99.2 98.6 Siltstone CG 6.8 6.1 Non welded Tuff
RM1 96.4 93.1 Welded Tuff
Barkley et al. (2006) studied the failure of Gold Quarry North Waste Facility (NWRF) in Nevada. Failure of the rock pile occurred in February 2005 in which

71
approximately 10 million tons of material was displaced. The toe of the collapse moved approximately 180 m as the result of sliding. The rock pile was approximately 126 m high with an overall slope of 2.9 H to 1 V (19º) before failure. The rock exposed at the Gold Quarry deposit included Paleozoic sedimentary rocks (siltstone, mudstone, chert, argillite, and limestone), Tertiary rocks (basal gravel, tuffaceous sedimentary rock overlain by interbedded sandstone, siltstone, and tuff), and Quarternary sedimentary rocks. The Quarternary materials that formed the foundation of the rock pile, consisted of brown organic sandy silts and fine grained silty sand with some interbedded gravel that had low plasticity. Atterberg limit tests on the foundation material indicated plasticity indices of less than 15. Three acquifers were recognized in the proximity of the Gold Quarry pit. Water was extracted at a rate of 15,000 gpm to achieve slope depressurization and dry working conditions at the bottom of the pit. The rock pile consisted of four lifts. The first three lifts contained significant quantities of tuffaceous sediments. In particular, lifts 1 and 2 contained montmorillonite-rich clays with high plasticity. Barkley et al. (2006) reported that high plasticity soils are weaker than low plasticity soils because high-plastic solid exhibit brittle strength behavior as they lose their strength as their deformation continues from peak toward the residual strength.
Barkley et al. (2006) also discussed the findings of Mesri and Shahien (2003) and Skempton (1964) about the brittle behavior of soils. Mesri and Shahien (2003) reported that soils with plasticity indices less than 20% are not prone to brittle failure as the difference between peak and residual strengths of these soils is low. Skempton’s back analysis of failed slopes in 1950s in Europe (Skempton, 1964) that were excavated in over-consolidated clays indicated the importance of residual strength. Skempton (1964) explained that the presence of imperfections and cracks in over-consolidated clays can act as stress concentrators that cause the fracturing and slip continue to develop at an average stress significantly less than the peak strength measured in laboratory. Such imperceptible cracking, referred to as shear creep, is progressive; the overstressed areas come to residual strength, shedding stress to areas that have not reached residual strength. It can take decades for this process to complete, resulting in large displacements and, ultimately, slope failure. Skempton (1964) discovered that a significant portion of the failure surface in the back-analyzed failed slopes reached residual strength. He defined the residual factor (R) that indicates the percentage of the failure surface that attains residual strength values at limiting equilibrium. R was defined as the ratio of the difference between peak remolded strength and average failure strength to the difference between the peak remolded strength and the residual strength. Skempton (1964) reported R values in the range of 0.56 to 0.80.
Barkley et al. (2006) reported the results of direct shear tests on the rock-pile material using shear boxes 6.4 cm to 7.5 cm (2.5 to 3 inches) in diameter. The material that passed the 9.5 mm (3/8 inch) sieve was used for shear testing. The shear tests were performed at normal stresses of 50, 100, 400, and 1200 kPa (7, 14, 58, and 174 psi) with a shear displacement rate of 0.0127 mm/min (0.0005 inches per minute). Samples were compacted with the field moisture content, consolidated, and then sheared while submerged. To achieve residual condition, the shear tests were reversed and repeated for two to four cycles. Shear test results showed that the material from lift 1 under a normal stress of 1200 kPa (174 psi) lost its shear resistance significantly at the 3rd reversal of the shear deformation indicating the brittle behavior of this material. Table 20 shows the results of the laboratory tests on the rock-pile material at Gold Quarry site. From Table 20, it is clear that lifts 1 and 2 were highly plastic

72
and contained a large portion of fine materials. The average friction angle and cohesion of the lift 1 material were 10.9º and 25 kPa (3.8 psi), respectively. The plasticity index of the lower lifts ranged from 20 to 60% with an average of 35%. Note that the rock pile on the top lift was made of hard rock that is typical for base metal or precious metal mines but the lifts 1 and 2 were too weak with high plasticity index and brittle behavior. Barkley et al. (2006) showed through back analyses that these weak layers were responsible for the failure of the rock pile. TABLE 20. Materials classification testing for Gold Quarry NWRF (Barkley et al., 2006).
From To Gravel Sand Silt/Clay846_H141 41 42 74.32 19.48 6.2 NA NA NA GP-GM
846_H1105 104 105 30.83 34.3 34.87 36 22 14 SC 12.2846_H258 58 61 74.14 16.59 9.27 NA NA NA GP-GC 12 18.62 33.13846_H299 99 101 53.57 32.59 13.84 21 16 5 GC-GM 9
846_H1342 42.5 45 62.38 23.27 14.35 NA NA NA GC-GM846_H1186 186 187 40.45 31.75 27.8 58 39 19 GM 25.3846_H1195 195 196 17.74 19.42 62.84 83 45 38 MH 37.1846_H1215 215 216 10.63 24.75 64.62 36 25 11 ML 21.2 36.68 19.95 Montmorillonite Quartz846_H2171 171 173.5 5.14 24.94 69.92 73 46 27 MH 34.9846_H2181 181 183.5 6.89 18.42 74.69 87 60 27 MH846_H2196 196 198.5 9.96 25.85 64.19 87 61 26 MH 43.4846_H2229 229 231 3.58 23.36 73.06 87 54 33 MH 48.8846_HI366 66 68.5 16.82 30.82 52.36 64 30 34 CH846_HI374 74 76 10.17 26.5 63.33 83 48 35 MH846_H1246 246 247 10.17 16.37 73.46 73 36 37 MH 33.5846_H1259 259 260 12.94 28.21 58.85 82 41 41 MH 32.6 40.82 13.42 Montmorillonite Quartz846_H1282 282 283 6.33 17.74 75.93 82 41 41 MH 43.9 38.96 13.04 Quartz Montmorillonite846_H2255 255 257 27.16 31.78 41.06 62 34 28 SM846_H2263 263 265 0.47 18.8 80.73 101 50 51 MH846_H2293 293 295 21.08 23.38 55.54 93 54 39 MH-CH 33846_HI3145 145 147.5 28.67 30.47 40.86 72 35 37 SM-SC 25846_HI3157 157.5 160 22.55 35.14 42.31 92 45 47 SM-SC 32 Montmorillonite Quartz846_HI3169 169 171 22.76 41.17 36.07 61 34 27 SM-SC846_HI3200 200 202 13.36 27.57 59.07 83 56 27 MH846_EHFC-1 4.74 24.61 70.65 91 60 31 MH 54 32.54 8.74 Montmorillonite846_EHFC-2 6.52 18.56 74.92 87 60 27 MH 51.6 45.02 10.79846_H1320 320 321 21.57 42.25 36.18 54 32 22 GM-GC 18.5 38.06 14.64 Montmorillonite Quartz846_H1385 385 386 32.27 23.56 44.17 84 47 37 GM-GC 26.4 27.17 8.96 Montmorillonite Quartz846_H1396 396 397 31.79 33.24 34.97 67 48 19 SM 63846_H1402 402 403 1.02 16.9 82.08 106 44 62 MH-CH 49.1 12.48 7.02 Montmorillonite Quartz846_H2328 328 330 1.12 10.79 88.09 103 49 54 MH-CH Montmorillonite846_H2345 345 347.5 1.03 21.83 77.14 84 51 33 MH 53.5 Montmorillonite Quartz846_H2355 355 357 8.03 10.72 81.25 95 54 41 MH-CH 61.5 6.83 8.72 Montmorillonite Quartz846_H2376 376 378 34.09 31.77 34.14 50 26 24 GC 20.7 15.44 17.25846_HI3215 215 217.5 19.69 26.92 53.39 93 57 36 MH846_HI3260 260 262.5 27.07 25.27 47.65 82 51 31 GM 35.2 Montmorillonite Quartz846_HI3275 275 277.5 19.18 32.36 48.46 81 37 44 SM 23 Montmorillonite Quartz846_HI4102 102 104.5 6.78 14.19 79.03 92 60 32 MH 40.4 Montmorillonite846_HI4111 111.5 113.5 5.13 28.72 66.15 86 40 46 MH-CH Montmorillonite Quartz846_HI4118 118 119 1.42 20 78.58 94 68 26 MH 58.3846_HI595 95 97.5 19.97 30.95 49.08 61 31 30 SC 25.2
846_HI5105 105 107 15.1 25.96 58.94 85 36 49 CH 30 Montmorillonite Quartz846_HI5116 116 118 5.93 24.45 69.62 90 65 25 MH 48 Montmorillonite846_HI5127 127 129 6.34 24.03 69.63 91 63 28 MH 57.9 29.16 10.86 Montmorillonite Quartz846_EHFC-3 0.15 9.63 90.22 48 35 13 OL846_EHFC-3 3.4 40.3 56.3 NA NA 0 ML846_H1411 411 412 3.43 47.99 48.58 31 22 9 SM 19846_H2395 395 397.5 0.18 58.58 41.24 NA NA 0 SM846_H2404 404 406 0 24.63 75.37 42 31 11 OL 18.8 11.03 28.81846_HI4119 119 120 0.23 4.61 95.16 44 29 15 OL846_HI5130 130 132.5 0.1 13.91 85.99 54 31 23 OH 27.5 13.03 24.27
system.
Sample No.
Major Mineral Assemblag
Moderate Mineral
Assemblage
Atterberg Limits Direct Shear Strength X-Ray Diffraction MineralogySample Information Sieves
PAG
Insitu Moisture Content
(%)
Cohesion (kPa)
Friction Angle (o)Depth Grain S iz e % by Weight
Liquid Limit LL
Plastic Limit PL
Plasticity Index PI
USCS
1' below contact2' below contact
FOUNDATION
LIFT 3
LIFT 2
C ontact 1' above contact
LIFT 1

73
SUMMARY OBSERVATIONS Construction of rock piles
The shape of mine rock piles is mainly based on the nature and topography of where they are emplaced. The dumping method of rock-pile material can be used to classify rock piles. The Questa rock piles were constructed predominantly by end-dumping as side-hill or valley-fill configurations. Many rock piles world-wide are stratified. The Questa rock piles are some of the largest rock piles in slope length in the world. Characterization of rock piles throughout the world Particle size—Questa rock piles have similar particle size distributions as rock piles from throughout the world (Table 3, Fig. 24).
Particle Size Distribution
0102030405060708090
100
0.0010.0100.1001.00010.000100.0001000.000Grain Size, mm
Perc
ent P
assi
ng b
y W
eigh
t
. FIGURE 24. Particle size distributions of rock piles world-wide (a) and GHN rock pile (b), Questa (see Table 3 for references, GHN values from project reports).

74
Density—The median values among the rock piles from throughout the world and the Questa rock piles are not statistically significant different (P = 0.789). Therefore the Questa rock piles have similar dry densities as other rock piles from throughout the world (Table 4, Fig. 25, Appendix 1).
Dry Density (g/cc)0.0 0.5 1.0 1.5 2.0 2.5 3.0 3.5 4.0
Num
ber
of S
ampl
es
0
2
4
6
8
10
12
14Rock Piles World Wide
Dry Density (g/cc)0.0 0.5 1.0 1.5 2.0 2.5 3.0 3.5 4.0
Num
ber
of S
ampl
es
0
20
40
60
80
100GHN
Dry Density (g/cc)0.0 0.5 1.0 1.5 2.0 2.5 3.0
Num
ber
of S
ampl
es
0
20
40
60
80
100Questa Rock Piles
FIGURE 25. Histograms of density of rock piles world-wide and GHN rock pile, Questa mine (see Table 4 for references, GHN and Questa rock piles values from McLemore et al. (2008c). Note histogram of density for rock piles world-wide includes maximum and minimum or average values for specific locations, including coal and other sedimentary mines, listed in Table 4. Specific gravity—Questa rock piles have similar specific gravities as other rock piles from throughout the world (Table 4, Fig. 26).

75
Specific Gravity0.0 0.5 1.0 1.5 2.0 2.5 3.0
Num
ber
of S
ampl
es
0
1
2
3
4
5
6Rock Piles World Wide
Specific Gravity0.0 0.5 1.0 1.5 2.0 2.5 3.0
Num
ber
of S
ampl
es
0
5
10
15
20
25GHN
FIGURE 26. Histograms of specific gravity of rock piles world-wide and GHN rock pile, Questa mine (see Table 4 for references, GHN values from project reports). Note histogram of specific gravity for rock piles world-wide includes maximum and minimum or average values for specific locations, including coal mines and other sedimentary rocks, listed in Table 4. Atterberg Limits—The samples in Table 4 and from the Questa project (from project reports and URS Corp. 2003) were plotted on Casagrande’s Plasticity chart where they generally plot as CL or ML samples with some CL-ML samples (Fig. 27). This indicates:
• rock pile samples (from both coal and metal mines) have similar Atterberg limits • the samples are inorganic clays with little swelling potential (CL) to inorganic silts
(ML) Some samples from Questa and elsewhere in the world are nonplastic and do not appear in Figure 27. Figure 28 shows a negative relationship between friction angle and plasticity index for Questa samples and coal spoil pile samples (Shakoor and Ruof, 1989).
Casagrande's Plasticity Chart
0
10
20
30
40
50
60
0 10 20 30 40 50 60 70 80 90 100
Liquid Limit
Plas
ticity
Inde
x
U-Line A-Line TyroneChino Ohio Coal Mines Central Pit, TurkeyGHN Midnight, WA GHN DHOther Questa piles
CL
Or
CH
OH MH
FIGURE 27. Atterberg Limits for various rock piles throughout the world, including Goathill North, Questa mine (see Table 4 for references, GHN values from project reports).

76
0
10
20
30
40
50
60
0 5 10 15 20 25
Plasticity Index (PI) %
Fric
tion
Ang
le (d
egre
es)
Old Coal Spoil New Coal Spoil GHN Other Questa FIGURE 28. Plasticity index vs. fricition angle for coal spoil samples from Shakoor and Ruof (1989) compared to Goathill North (GHN) and other Questa samples (GHN and other Questa values from project reports). Porosity—Questa rock piles have similar porosities as other rock piles from throughout the world (Table 4, Fig. 29).
Porosity %0 10 20 30 40 50 60
Num
ber
of S
ampl
es
0.0
0.5
1.0
1.5
2.0Rock Piles World Wide
Porosity %0 10 20 30 40 50 60
Num
ber
of S
ampl
es
0
1
2
3
4
5GHN
FIGURE 29. Histograms of porosities of rock piles world-wide and GHN rock pile, Questa (see Table 4 for references, GHN values from project reports). Note histogram of porosities for rock piles world-wide includes maximum and minimum or average values for specific locations, including coal and other sedimentary mines, listed in Table 4. Shear strength—Questa rock piles have relatively similar ranges of friction angles as other rock piles from throughout the world (Fig. 30). Nevertheless, the average friction angle of Questa rock piles is statistically higher than that of the world-wide rock piles (Appendix 1). The friction angle of materials in coal mines that are included in world-wide rock piles is lower than that of rock piles made of igneous rock

77
Friction Angle (degrees)20 25 30 35 40 45 50 55 60
Num
ber
of S
ampl
es
0
2
4
6
8
10
12
14Rock Piles World Wide
Friction Angle (degrees)20 25 30 35 40 45 50 55 60
Num
ber
of S
ampl
es
0
5
10
15
20
25
30
35
40GHN
Friction Angle (degrees)20 25 30 35 40 45 50 55 60
Num
ber
of S
ampl
es
0
10
20
30
40
50
60Questa Rock Piles
FIGURE 30. Histograms of friction angles of rock piles world-wide and GHN rock pile, Questa (see Table 5 for references, GHN values from McLemore et al., 2008c). Note histogram of friction angles for rock piles world-wide includes maximum and minimum or average values for specific locations, including coal and other sedimentary mines, listed in Table 5.
The effects of weathering on rock piles throughout the world Weathering is complex and nonlinear and dependent upon many factors. The Questa
rock piles have a relatively simple sulfide mineralogy consisting of predominantly pyrite and molybdenite with trace amounts of other sulfide minerals (Meyer, 1991), whereas many rock piles in the world have a more complex sulfide mineralogy. Thus, the weathering of pyrite and calcite to gypsum and jarosite is the major weathering system at Questa in the short term (i.e. <100 yrs). Weathering is generally not a subtractive process in the weathered soil profile (Duzgoren-Aydin et al., 2002), but weathering could be a subtractive process in the Questa rock piles, as shown by the chemical composition of waters flowing form the base of GHN rock pile (McLemore et al., 2008a). In-situ shear testes (Boakye, 2008) suggest that the cohesion of the rock pile material at Questa mine has increased to an average value of approximately 10 kPa compared to the initial value of zero at the time of placement. Furthermore, it appears that weathering has caused reduction of friction angle, strength, and slake durability of surface layer I of GHN rock pile (McLemore et al., 2008c). Filipowicz and Borys (2004) studied the effect of seven years weathering in Bogdanka coal mine rock piles in Poland and concluded reduction of friction angle and increase in cohesion due to weathering. Pernichele and Kahle (1971) investigated the slope stability of rock piles at Kennecott’s Bingham Canyon copper mine. The rock pile material from the Bingham pit can be divided into two major lithologic types: quartzite and porphyry. Quartzite undergoes little chemical breakdown within the rock pile

78
during leaching resulting in quartzite dumps to retain high permeability. On the other hand, high temperatures, up to 82º C (180º F), and the acidic environment that exists within the rock piles caused rapid breakdown of the porphyry rock into clay-sized material. As the result of chemical decomposition of the porphyry, iron precipitates are generated. According to these authors, the iron precipitates improve the strength of the rock piles with time as the induced cementation is so complete that vertical cuts are capable of standing for years without signs of failure.
Stability of rock piles throughout the world Many rock-pile failures are in coal and other sedimentary rocks, although other types
of deposits are subjected to failure. Coal deposits are subjected to more slope failures than deposits in igneous and metamorphic rocks, because coal deposits consist of weaker rocks and can allow more water into the rock piles that can result in slope instability.
REFERENCES AND ANNOTATED BIBLIOGRAPHY
Abramsom L.W., Lee, T.S., Sharma, S. and Boyce, G.M., 2001, Slope Stability and Stabilization Methods: 2nd edition, John Wiley and Son, Inc.
Adams, R., Ahfeld, D., and Sengupta, A., 2007, Investigating the potential for ongoing pollution from an abandoned pyrite mine: Mine Water and the Environment, v. 26, p. 2-13.
Acero, P., Ayora, C., Torrentó, C. And Nieto, J.M., 2006, The behavior of trace elements during Schwertmannite precipitation and subsequent transformation into goethite and jarosite: Geochimica et Cosmochima Acta, v. 70, p. 4130-4139.
Agnew, M. and Taylor, G.F., 2000, Development, cycling and effectiveness of hardpans and
cemented layers in tailings storage facilities in Australia; in Grundon, N.J. and Bell, L.C. (eds) Australian workshop on acid mine drainage: Townsville, p. 157–169.
Alakangas, L. and Öhlander, B., 2006, Formation and composition of cemented layers in low-suphide mine tailings, Laver, northern Sweden: Environmental Geology, v. 50, p. 809-819.
Alpers, C.N., Blowes, D.W., Nordstrom, D.K., Jambor, J.L., 1994, Secondary minerals and acid-mine water chemistry: In Short Course Handbook on Environmental Geochemistry of Sulfide Mine Wastes, Waterloo, Ontario, May 1994, Mineralogical Association of Canada, p. 247-270.
Alshibli, K.A. and Alsaleh, M.I., 2004, Characterizing surface roughness and shape of sands using digital microscopy: Journal of Computing in Civil Engineering, v. 18(1), p. 36-45.
Anderson, O.L., 1966, A Proposed Law of Corresponding States for Oxides Compounds: Journal of Geophysical Research, v. 71, no. 20, p. 4963-4971.
Anderson, O.L., and Nafe, J.E., 1965, The Bulk Modulus-Volume Relationship for Oxide Compounds and Related Geophysical Problems: Journal of Geophysical Research, v. 70, no. 16, p. 3951-3963.
ASTM, 2001, American Society for Testing Materials. Procedures for testing soils (1964); Standard Test Method for Slake Durability of Shales and Similar Weak Rocks: D4644-87 (Reapproved 1992). Annual Book of ASTM Standards, West Conshohocken, PA.

79
ASTM, 2002, Standard Test Method for Particle-Size Analysis of Soils (D422): Annual Book of ASTM Standards. American Society for Testing and Materials (ASTM), West Conshohocken, PA.
Ayres, B., Landine, P., Adrian, L., Christensen, D., and O’Kane, M., 2005, Cover and final landform design for the B-zone waste rock pile at Rabbit Lake mine: BZWRP Cover and Landform Design, UM and H Conference, 10 p.
Azam, S., Wilson, G.W., Herasymuik, G., Nochol, C., and Barbour, L.S., 2006, Hydrogeological behavior of an unsaturated waste rock pile: a case study at the Golden Sunlight mine, Montana, USA: Bulletin Engineering Geology and Environment, 10 p.
Barton, N.R., 2008, Shear strength of rockfill, interfaces and rock joints and their oints of contact in rock dump design; in A. Fourie, ed., Rock Dumps 2008: Australian Centre for Geomechanics, Perth, p. 3-17.
Barrett, P.J., 1980, The shape of rock particles—A critical review: Sedimentology, v. 27, p. 291-303.
Barrick, 2007, http://www.barrick.com/GlobalOperations/NorthAmerica/GoldenSunlight/default.aspx, accessed October 31, 2007.
Barkley, R.C., Pryor, P.R., and Nicholas, D.E., 2006, Gold quarry slide, geotechnical investigation, failure mechanisms report: prepared for Newmont Mining Corporation by Call and Nicholas, Inc.
Basile, A., Mele, G., and Terribile, F., 2003, Soil hydraulic behavior of a selected benchmark soil involved in the landslide of Sarno 1998: Geoderma, v. 117, p. 331-346.
Baumer, A., Searle, P.J., and Tillman, V.H., 1973, Slope stability on the Bougainville copper project, Papua, New Guinea: Quarterly Journal of Engineering Geology, vol. 6 (3-4), p. 303-314.
• Slope stability problems have occurred within the highly weathered, surficial material, especially at the interfaces
B.C. Mine Waste Rock Pile Research Committee, 1991, Mined rock and overburden piles. Investigation and design manual: British Columbia Mine Waste Rock Pile Research Committee Interim Guidelines. May.
Been, K., Conlin, B.H., Crooks, J.H.A., Fitzpatrick, S.W., Jefferies, M.G., Rogers, B.T., and Shinde, S., 1987, Back analysis of the Nerlerk berm liquefaction slides: Discussion: Canadian Geotechnical Journal, v. 24, p. 170–179.
Bell, F.G., 1996, Dereliction: colliery spoil heaps and their rehabilitation: Environmental and Engineering Geoscience, v. 2, p. 85-96.
Benvenuti, M., Mascaro, I., Corsini, F., Lattanzi, P., Parrini, P., and Tanelli, G., 1997, Mine waste dumps and heavy metal pollution in abandoned mining district of Boccheggiano (southern Tuscany, Italy): Environmental Geology, v. 30, p. 238-243.
• 3 types minerals: primary (pre-weathering), secondary (weathered), ternary (formed after collection)
• Weathered minerals in minor and variable amounts • Lack of weathered clay minerals
Bews, B.E., Barbour, S.L., Wilson, G.W., and O’Kane, M.A., 1997, The design of lysimeters for a low flux cover system over acid generating waste rock: unpublished report.

80
Bingham, J.M., Carlson, L., and Murad, E., 1994, Schwertmannite, a new iron oxhydroxysulphate from Pyhasalmi, Finland, and other localities: Mineralogical Magazine, v. 58, p. 641-648.
Birkeland, P.W., 1999, Soils and geomorphology, Oxford University Press publication, 430 p.
Birkham, T.K., Hendry, M.J., Wassenaar, L.I., Mendoza, C.A., and Lee, E.S., 2003, Characterizing geochemical reactions in unsaturated mine waste-rock piles using gaseous O2, CO2, 12CO2, and 13CO2: Environmental Science Technology, v. 37, p. 496-501
• O2 and CO2 concentration alone can not identify depths of dominant geochemical reactions
• Oxidation of organic material below rock piles important Bishop, A.W., 1948, A Large Shear Box for Testing Sand and Gravels, Proceedings of the
2nd International Conference on Soil Mechanics and Foundation Engineering, v. 1, p. 207-211.
Bishop, A.W., 1973, The stability of tips and spoil heaps: Quarterly Journal of Engineering Geology, vol. 6, p. 335-376.
Bladh, K.W., 1982, The formation of goethite, jarosite and alunite during weathering of sulphide-bearing felsic rocks: Economic Geology, v. 77, p. 176-184.
Blight, G.E., 1969, Foundation failures of four rockfill slopes: Journal Soil Mechanics and Foundations Division, American Society of Civil Engineers, v. 95(SM3).
Blight, G.E. and Fourie, A.B., 2005, Catastrophe revisited—disastrous flow failures of mine and municipal solid waste: Geotechnical and Geological Engineering, v. 23, p. 219-248
• Table and description of failures Blowes, D.W. and Jambor, J.L., 1990, The pore-water geochemistry and the mineralogy of
the vadose zone of sulphide tailings, Waite Amulet, Quebec, Canada: Applied Geochemistry, v. 5, p. 327-346.
Blowes, D.W., Reardon, E.J., Jambor, J.L., and Cherry, J.A., 1991, The formation and potential importance of cemented layers in inactive sulfide mine tailings: Geochimica et Cosmochimica Acta, v. 55, p. 965-978.
Bowman, E.T., Soga, K., and Drummnond, W., 2001, Particle shape characterization using Fourier descriptor analysis: Geotechnique, v. 51(6), p. 545–554.
Borden, R., 2001, Geochemical evolution of sulphide-bearing waste rock soils at the Bingham Canyon mine, Utah: Geochemistry: Exploration, Environment, Analysis, v. 1, p. 15-22
• Paste pH ranges 2.08-7.91 • Paste conductivity (measure of soil salinity) ranges 22-8750 μS/cm • Paste pH and conductivity controlled by sulfide distribution, amount of limestone and
age of soils • Paste pH of fresh exposed material is 7, within 6 yrs is 4.7, within 50 yrs is 3.7
Box, J.C., and Prosser, A.P., 1986, A general model for the reaction of several minerals and several reagents in heap and dump leaching: Hydrometallurgy, 16, p. 77-92.
Brackley, I.J.A., Welensky, P., and O'Connell-Jones, G., 1985, Slope Stability at an Opencast Quartz Mine: Journal of The South African Institute of Mining and Metallurgy, v. 85, n. 2, p. 33-40.

81
Brady, K.S., Bigham, J.M., Jaynes, W.F., and Logan, T.J., 1986, Influence of sulfate on Feoxide formation: comparisons with a stream receiving acid mine drainage: Clay and Clay Minerals, v. 34, p. 266-274.
Brawner, C.O., 1997, Rock mechanics engineering in Canadian surface mining: Geotechnical News, Special, p. 110-116.
• Describes several failures of pit walls and waste rock piles Burnley, R.B., 1993, Mine reclamation and waste dump stability: M.S. thesis, University of
Nevada Reno, 110 p. • Similar study and results to Quine (1993)
Calcaterra, D., Parise, M. and Dattola, L., 1998, Weathering Processes in Crystalline Rocks of the Sila Massif, Calabria, Southern Italy, as Predisposing Factor for the Development of Debris Flows. In: A. Evangelista and L. Picarelli (eds.), The Second International Symposium on Hard Soils-Soft Rocks. A. Balkema, Naples, Italy, p. 73-84.
Call, R.D., 1985, Evaluation of material properties; in McCarter, M.K., Design of non-impounding mine waste dumps: American Institute of Mining, Metallurgical, and Petroleum Engineers, Inc. New York, New York, p. 36-46.
Campbell, D.B., 2000, The mechanism controlling angle-of-repose stability in waste rock embankments; in Slope Stability in Surface Mining: Society for Mining, Metallurgy and Exploration, Inc., p. 285-291.
• End-dumping involves material that rolls and slides down slope • Embankment involves gradual accretion of material on face • Rock below surface undergoes compression and shearing stresses • Face is slightly convex
Canterford, J.H., Davey, P.T., and Tsambourakis, G., 1985, Gangue mineral dissolution and jarosite formation in copper solution mining: Hydrometallurgy, v. 13, p. 327-343.
Cardwell, J.A. and Moss, A.S.E., 1981, The Simplified Analysis of Mine Waste Embankments; in Symposium on Design of Non-Impounding Mine Waste Embankments: AIME Fall Meeting, Denver, CO, USA, p. 48-61
• Dumps can be classified according to topography and method of construction • End-dumped slopes formed by method of controlled failure • Factor of safety during construction is close to 1 • Slope angle close to friction angle • Steep slopes
Casey, W.H., Westrich, H.R., and Holdren, G.R., 1991, Dissolution rates of plagioclase at pH 2 and3: American Mineralogist, v. 76, p. 211-217.
Cheema, T., Al-Harthy, A., Al-Aghbari, M., and Al-Aufi, M., 2004, Influence of grain size and mineralogy on the strength of weak rocks: Geo Jordon 2004, p. 239-249.
Chigira M., and Oyama T., 1999, Mechanism and effect of chemical weathering of sedimentary rocks: Engineering Geology, v. 55, p. 3-14.
Cho, G.C., Dodds, J., and Santamarina, J.C., 2006, Particle shape effects on packing density, stiffness, and strength: Natural and crushed sands: Journal of Geotechnical and Geoenvironmental Engineering, v. 132, Issue 5, p. 591-602.
Church, S.E., and Finger, S.E., Integrated investigations of environmental effects of historical mining in the Basin and Boulder mining districts, Boulder River watershed, Jefferon County, Montana: U. S. Professional Paper 1652-D4, p. 139-153

82
• Surface samples of a waste rock pile typically contain less original metals than deeper in the pile because of oxidation
Clark, N.N., 1987, A new scheme for particle shape characterization based on fractal harmonics and fractal dimensions: Powder Technol., v. 51, p. 243–249.
Condon, P.D., 1999, Characterization and prevention of acid rock drainage processes at the Greens Creek mine, Admiralty Island, Alaska: University of Oregon, PhD. Dissertation, 335 p.
Cox, M.R. and Budhu, M., 2007, A practical approach to grain shape quantification: Engineering Geology, doi: 10.1016/j.enggeo.2007.05.005
Cravotta, C.A., 1994, Secondary iron-sulfate minerals as sources of sulfate and acidity: Geochemical evolution of acidic ground water at a reclaimed surface coal mine in Pennsylvania. In Environmental Geochemistry of Sulfide Oxidation; ACS Symposium Series 550; American Chemical Society: Washington, DC, 1993. p. 343-364.
CRC, 1985, CRC Handbook of Chemistry and Physics: 66th Ed., Boca Raton, FL, CRC Press.
Das, B.M., 1983, Advanced Soil Mechanics: New York, McGraw-Hill Book Company, 511 p.
Davies, G.B. and Ritchie, A.I.M., 1986, A model of oxidation in pyretic mine wastes: part 3 import of particle size distribution: Applied Mathematical Modeling, v. 11, p. 417-422.
Dawson, R.F., and Morgenstern, N.R., 1995, Static collapse of mine waste fills: Proceedings of the 4th International Symposium on Mine Planning and Equipment Selection, October, Calgary, Alta, p. 845-851.
Dawson, R.F., Morgenstern, N.R., and Stokes, A.W., 1998, Liquefaction flowslides in Rocky Mountains coal mine waste dumps: Canadian Geotechnical Journal, 35(2), 328-343.
Dick, J., Shakoor, A., and Wells, N., 1994, A geological approach toward developing a mudrock-durability classification system: Canadian Geotechnical Journal, v. 31(1), p. 17-27.
Diehl, S., Koenig, A., Hageman, P., Smith, K., Fey, D., and Lowers, H., 2007, From the micro to the macro scale: A textural and chemical perspective of characterizing waste-rock material: Society of Mining, Exploration, and Metallurgical Engineering, Preprint 07-021, 16 p.
Dinelli, E., Lucchini, F., Fabbri, M., and Cortecci, G., 2001, Metal distribution and environmental problems related to sulfide oxidation in the Libiola copper mine area (Ligurian Apennines, Italy): Journal of Geochemical Exploration, v. 74, p. 141-152.
• Libiola copper mine area, Italy operated from at least 2500 BC until 1965, Plot of MgO-Al2O3-Fe2O3 indicates an increase in Fe2O3 with weathering (basalts, serpentites)
Dodds, J., 2003, Particle shape and stiffness—effects on soil behavior: M.S. thesis, Georgia Institute of Technology, Atlanta, 190 p.
Donahue, K., Dunbar, D., and McLemore, V.T., 2007, Origins of clay minerals in the Molycorp Goathill North rock pile, Questa, NM, SME preprint, 2007 annual meeting, 19 p.

83
Donovan, J.G. and Karfakis, M.G., 2003, Assessment of hillside coal waste embankment failures using qualitative analysis: International Journal of Surface Mining, Reclamation and Environment, Vol. 17, No. 4, 234-245.
Douglass, P.M. and Bailey, M.J., 1982, Evaluation of surface coal mine spoil pile failures, Stability in surface mining: Brawner, C.O. (ed.), v. 3, Printed by Edwards Brothers, Inc., Michigan, USA.
Donovan, J.G. and Karfakis, M.G., 2003, Assessment of Hillside Coal Waste Embankment Failures Using Qualitative Analysis: International Journal of Surface Mining, Reclamation and Environment, v. 17(4), p. 234-245.
Duncan, J.M., and Chang, C.Y., 1970, Nonlinear Analysis of Stress and Strain in Soils, Proceedings of the America Society of Civil Engineers: Journal of the Soil Mechanics and Foundation Division, SM5, p. 1629-1653.
Duzgoren-Aydin, N.S., Aydin, A., and Malpas, A.J., 2002, Re-assessment of chemical weathering indices: case study on pyroclastic rocks of Hong Kong: Engineering Geology, v. 63, p. 99-119.
• Uses a 6 class scheme based upon visual characteristics • Normalized the chemical composition of the weathered rock/soil to the parent
composition • Chemical behavior during weathering depends upon microenvironmental conditions
that control clays and sesquioxides • Ca, Na, K, Si decrease with increasing weathering due to feldspar dissolution • Al, Fe, Ti, Mn, LOI increase with increase in weathering
Earley, D., III, Dyar, M.D., Ilton, E.S. and Granthem, A.A., 1995, The influence of structural fluorine on biotite oxidation in copper-bearing aqueous solutions at low temperatures and pressures: Geochimica et Cosmochimica Acta, v. 59, p. 2423-2433.
Earley, D., III, Kidd, D. A., Shelley, T., Walder, I., and Salvas, E.A., 2003, Slope stability of leached copper stockpile; in Tailings and Mine Waste ’03: Swets and Zeitlinger, p. 121-130
• Older stockpiles and stockpile surfaces have undergone more weathering than the interior and younger stockpiles
• Clay is limited to pre-mining alteration • Modeling shows acid generation will not result in additional significant clay
formation Earley, D., III, Paulson, S.E., and Brink, S.E., 1990, The effects of rock mineralogy,
chemistry, and texture in in-situ leaching of oxide copper ores from the Santa Cruz deposit, Arizona: Society of Mining Engineers, AIME Preprint 90-182, 8 p.
Eberhardt, E., Stead, D., Reeves, M.J., and Connors, C., 1996, Design of tabular excavations in foliated rock: an integrated numerical modeling approach: Geo. and Geol. Eng., v. 15, p. 47-85.
Esposito, K.J., 1999, Mineralogical techniques for characterizing weathering reactions within mine waste materials: Proceedings of Sudbury ‘99: Mining and the Environment II, Sudbury, Ontario, p. 1055-1062.
Fey, D.L. and Desborough, G.A., 2004, Metal leaching in mine-waste materials and two schemes of classification of potential environmental effects of mine-waste piles; in Nimick, D.A., Filipowicz, P. and Borys, M., Integrated investigations of environmental effects of historical mining in the Basin and Boulder mining districts,

84
Boulder River watershed, Jefferson County, Montana: U. S. Geological Survey Professional Paper 1652, p. 137-153.
Filipowicz, P. and Borys, M., 2004, Geotechnical parameters of mining wastes from the Lubelskie coal basin as a material for hydrotechnical embankments: Journal of Water and Land Development, v. 8, p. 163-170.
• Fresh mine wastes contained more gravel fraction than older mine wastes (Bogdanka mine rock pile, Europe)
• Cohesion increased with time in mine wastes and was larger in older mine wastes than fresh mine wastes (cohesion increases with increase in weathering)
• The apparent internal friction angle decreased in the old mine wastes compared to fresh wastes internal friction angle decreases with increase in weathering)
• Mineral composition does not change within 7 years, the age of the oldest rock pile studied
Filipowicz, P. and Borys, M., 2005, Geotechnical properties of mining wastes and their utilization in civil engineering; in Proceedings of International Conference on Problematic Soils: May 25-27, 2005, Eastern Mediterranean University, Famagusta, N. Cyprus, p. 259-267.
• Fresh mine wastes contained more gravel fraction than older mine wastes (several rock piles from Europe)
• Older mine wastes have lower maximum dry density of solid particles and higher optimum moisture contents than fresh mine wastes
• Cohesion increased with time in mine wastes and was larger in older mine wastes than fresh mine wastes (cohesion increases with increase in weathering)
• The apparent internal friction angle decreased in the old mine wastes compared to fresh wastes internal friction angle decreases with increase in weathering)
• Mineral composition does not change within 8 years, the age of the oldest rock pile studied
Fines, P., Wilson, G.W., Williams, D.J., Tran, A.B., and Miller, S., 2003, Field characterization of two full-scale waste rock piles; in proceedings of the 6th ICARD: Cairns, Queensland, p. 903-909.
Fontes, M.P.F. and Carvalho, Jr., I.A., 2005, Color attributes and mineralogical characteristics, evaluated by radiometry, of highly weathered tropical soils: Soil Sci. Soc. Am. J. 69:1162–1172.
Fookes, P.G., Dearman, W.R., and Franklin, J.A., 1971, Some engineering aspects of rock weathering with field examples from Dartmoor and elsewhere: Quarterly Journal of Engineering Geology, v. 4, p. 139-185.
• Good summary of weathering from an engineering perspective • Increased fracturing correlates with increase in weathering during the early stages of
weathering and results in increased chemical weathering later producing a weaker rock
• Includes a description of engineering classifications of weathered soils using visual descriptive means
Fookes, P.G., Gourley, C.S., and Ohikere, C., 1988, Rock weathering in engineering time: Quarterly Journal of Engineering Geology, v. 21, p. 33-57.
Fourie, A.B., Rowe, D., and Blight, G.E., 1999, The effect of infiltration on the stability of the slopes of a dry ash dump: Géotechnique, v. 49(1), p. 1–13.

85
Franklin, J.A., and Chandra, A., 1972, The slake durability test: International Journal Rock Mechanics Mineral Science., v. 9, p. 325–341.
Fredlund, D.G. and H. Rahardjo, 1993, Soil Mechanics for Unsaturated Soils; New York: John Wiley and Sons Inc.
Fredlund, D. G., Xing, A., Fredlund, M.D., and Barbour, S.L., 1996, The Relationship of the Unsaturated Soil Shear Strength to the Soil-Water Characteristic Curve: Canadian Geotechnical Journal, v. 33(3), p. 440-448.
Galbraith, J.M., 2004, Proposed changes to soil taxonomy that may affect mine soil classification; in 2004 National Meeting of the American Society of Mining and Reclamation: American Society of Mining and Reclamation, CD-ROM, 14 p.
Geological Society Engineering Group Working Party, 1995, The description and classification of weathered rocks for engineering purposes; Geological Society Engineering Group Working Party Report: Quaternary Journal of Engineering Geology, v. 28, p. 207-242.
Gökçeoğlu, C., Ulusay, R. and Sönmez, H., 2000, Factors affecting the durability of selected weak and clay-bearing rocks from Turkey, with particular emphasis in the influence of the number of drying and wetting cycles: Engineering Geology, v. 57, p. 215-237.
Gomez, P., Diaz, M., and Lorig, L., 2000, Stability Analysis of Waste Dumps at Chuquicamata Mine, Chile: Felsbau, v. 20, no. 6, p. 61 – 68.
Gomez, P., Diaz, M., and Lorig, L., 2003, Stability Analysis of Waste Dumps at Chuquicamata Mine, Chile: Glückauf-Forschungshefte, v. 64, no. 3, p. 93-99.
• Most important factors controlling dump stability are geometry, weight of waste rock, shear strength, foundation conditions
• Modeling of a generic rock pile • Cracking at the surface of dumps could be a result of settling of the dumps not
necessary failure Gore, D.B., Creagh, D.C., Burgess, J.S., Colhoun, E.A., Spate, A.P., Baird, A.S., 1996,
Composition, distribution and origin of surficial salts in the Westfold Hills, east Antarctica: Antarct. Sci. v. 8, p. 73– 84.
Graupner, T., Kassahun, A., Rammlmair, D., Meima, J.A., Kock, D., Furche, M., Fiege, A., Schippers, A., and Melcher, F., 2007, Formation of sequences of cemented layers and hardpans within sulfide-bearing mine tailings (mine district Freiberg, Germany): Applied Geochemistry, v. 22, 2486-2508 p.
Gupta, V., and Ahmad, I., 2007, The effect of pH of water and mineralogical properties on the slake durability (degradability) of different rocks from the Lesser Himalaya, India: Engineering Geology, doi: 10.1016/j.enggeo.2007.09.004
Gupta, A.S. and Rao, K.S., 2001, Weathering indices and their applicability for crystalline rocks: Bull. Eng. Geol. Env., v. 60, p. 201-221.
Hajdarwish, A.M., 2006, Geologic controls of shear strength behavior of mudrocks: PhD. Dissertation, Kent State University, Ohio, 266 p.
Hale, P.A. and Shakoor, A., 2003, A laboratory investigation of the effects of cyclic heating and cooling, wetting and drying, and freezing and thawing on the compressive strength of selected sandstones: Environmental and Engineering Geoscience, v. IX, no. 2, p. 117-130.
Hancock, G.R. and Turley, E., 2006, Evaluation of proposed waste rock dump designs using the SIBERIA erosion model: Environmental Geology, v. 49, p. 765-779.
86
Harris, D.L., Lottermoser, B.G., and Duchesne, J., 2003, Ephemeral acid mine drainage at the Montalbion silver mine, north Queensland: Australian Journal of Earth Sciences, v. 50, p. 797-809.
Harris, J.R. and Ritchie, A.I.M., 1987, The effect of rehabilitation on the rate of oxidation of pyrite in a mine waste rock dump: Environmental Geochemistry and Health, v. 17, p. 27-36
Hartman, H.L. and Mutmanksy, J.M., 2002, Introductory Mining Engineering: Second Edition, John Wiley and Sons, New York.
Hawley, P.M., 2001, Site Selection, Characterization, and Assessment; In: W.A. Hustrulid, M.K. McCarter and D.J.A. van Zyl (Editors), Slope Stability in Surface Mining: Society for Mining, Metallurgy, and Exploration, Inc (SME). Littleton, p. 267-274.
Hem, J.D., 1985, Study and Interpretation of the Chemical Characteristics of Natural Waters: 3rd Ed. U. S. Geological Survey, Water-Supply Paper 2254.
Herasymuik, G.M., 1996, Hydrogeology of a sulphide waste rock dump: M.S. Thesis, University of Saskatchewan, Saskatoon, Saskatchewan, Canada.
Hillel, D, 1998, Environmental Soil Physics: San Diego, Academic Press. Hockley, D.E., Noel, M., Rykaart, E.M., Jahn., S., and Paul, M., 2003, Testing of soil covers
for waste rock in the Ronneburg WISMUT mine closure; 6th ICARD, Cairns, Australia, The Australasian Institute of Mining and Metallurgy, p. 273-279.
Hoek, E., 2000. Practical Rock Engineering: http://www.rocscience.com/hoek/PracticalRockEngineering.asp, accessed October 23, 2007.
Holland, H.D., 1978, The Chemistry of the Atmosphere and Oceans: New York, John Wiley and Sons.
Holtz, W.G., 1960, The Effect of Gravel Particles on Friction Angle: ASCE Research Conference on Shear Strength, p. 1000-1001.
Holtz, W.G., and Gibbs, H.G., 1956, Triaxial Shear Tests on Previous Gravelly Soils: Journal of Soil Mechanics and Foundation Engineering Division, v. 82, p. 1-22.
Holtz, R.D. and Kovacs, W.D., 2003, An Introduction to Geotechnical Engineering: Civil Engineering and Engineering Mechanics Series, Pearson Education Taiwan Ldt., 733 p.
Horn, H.M., and Deere, D.U., 1962, Frictional Characteristics of Minerals: Geotechnique, v. 12, p. 319-335.
Howson, G.W., 1939, On Design of Rockfill Dams: Transactions, American Society of Civil Engineers, v. 104, p. 42.
Hribar, J., Dougherty, M., Ventura, J., and Yavorsky, P., 1986, Large Scale Direct Shear Test on Surface Mine Spoil: International Symposium on Geotechnical Stability in Surface Mining, Calgery, November, p. 295-303.
Huang, S.L., Speck, R.C., and Xu, M., 1992, Evaluation of coal mine spoil pile instability in the interior Alaska: Bulletin of the Association of Engineering Geologists, v. 29 (1), p. 1-9.
Huat, B.B.K., Ali, F.H., and Affendi, A., 2005, Shear Strength Parameters of Unsaturated Tropical Residual Soils of Various Weathering Grades, Volume 2005, EJGE.
Hughes, D.B. and Clarke, B.G., 2003, Surface coal mining and the reclamation of tips, landfills and quarries—some geotechnical case studies: International Journal of Surface Mining, Reclamation and Environment, v. 17, no. 2, p. 67-97.
87
• Summary of problems with waste materials form coal mines Hungr, O., Dawson, R.F., Kent, A., Campbell, D., and Morgenstern, N.R., 2002, Rapid flow
slides of coal-mine waste in British Columbia, Canada: Geological Society of America Reviews in Engineering Geology, v. XV.
Hutchinson, J.N., 1988, General Report. Morphological and geotechnical parameters of landslides in relation to geology and hydrogeology: 5th International Symposium on Landslides, Switzerland, p. 3-35.
Hyslip, J.P. and Vallejo, L.E., 1997, Fractal analysis of the roughness and size distribution of granular materials: Engineering Geology, v. 48, no. 3-4, p. 231-244.
Infomine, Inc. 2007, http://www.infomine.com/companies-properties/infodbweb/ChargePropertyReport.asp?SearchID=21384, accessed November 19, 2007.
International Society for Rock Mechanics, 1979. Suggested Methods for determination of the slake durability index. Int. J. Rock Mech. Min. Sci. Geomech. V. 16, p. 154-156.
International Society for Rock Mechanics, 1985. Suggested Methods for determining point load strength. Int. J. Rock Mech. Min. Sci. Geomech., p. 53-60.
Iverson, R.M., 2000, Landslide triggering by rain infiltration: Water Resources Research, v. 36 (7), p. 1897-1910.
Jaboyedoff, M., Baillifard, F., Bardou, E., and Girod, F., 2004, The effect of weathering on Alpine rock instability: Quarterly Journal of Engineering Geology and Hydrology, v. 37, p. 95-103.
Jambor, J.L., 2003, Mine-waste mineralogy and mineralogical perspectives of acid-base accounting; in Jambor, J.L., Blowes, D.W., and Ritchie, A.I.M., eds., Environmental Aspects of Mine Wastes: Mineralogical Association of Canada, Short Course Series, v. 31, chap. 6, p. 117-145.
Jambor, J.L., Blowes, D.W., 1998, Theory and applications of mineralogy in environmental studies of sulfide-bearing mine wastes; in Modern Approaches to Ore and Environmental Mineralogy: Cabri, L., Vaughn, D. (eds.), Mineralogical Association of Canada Short Course, vol. 27, p. 367-401.
Jeong, G.Y. and Lee, B.Y., 2003, Secondary mineralogy and microtextures of weathered sulfides and manganoan carbonates in mine waste-rock dumps, with implications for heavy-metal fixation: American Mineralogist, v. 88, p. 1933-1942.
Jerz, J.K., 2002, Geochemical Reactions in Unsaturated Mine Wastes: PhD dissertation, University of Virginia, Blacksburg, 115 p.
Jerz, J.K. and Rimstidt, J.D., 2004, Pyrite oxidation in humid air: Geochimica Cosmochimica Acta, v. 68, p. 701-714.
Johnson, C.D. and Skousen, J.G., 1995, Minesoil properties of 15 abandoned mine land sites in West Virginia: Journal of Environmental Quality, v. 24, p. 635-643
• Acidity and pH decrease with age in the rock piles studied Kasmer, O., and Ulusay, R., 2006, Stability of spoil piles at two coal mines in Turkey:
Geotechnical characterization and design considerations: Environmental and Engineering Geoscience, v. 12, no. 4, p. 337-352.
Kasmer, O., Ulusay, R., and Gokceoglu, C., 2006, Spoil pile instabilities with reference to a strip coal mine in Turkey: mechanisms and assessment of deformations: Environmental Geology, v. 49, p. 570-585.
88
Kent, A., 1992, Coal mine waste dumps in British Columbia, stability issues and recent developments: International Waste Management, p. 10-18.
http://www.infomine.com/publications/docs/Kent1992.pdf, accessed October 23, 2007. • Summary of failures of coal waste rock piles and resulting solutions
Khandelwal, N.K. and Mozumdar, B.K., 1987, Stability of Overburden Dumps: Journal of Mines, Metals and Fuels, v. 25, no. 6, p. 253 – 261.
Kinross, 2007, http://www.kinross.com/cr/reclamation-hay.html (accessed January 19, 2008). Kirkpatrick, W.M., 1965, Effect of Grain Size and Grading on the Shearing Behavior of
Granular Material, Proceedings 6th International Conference on Soil Mechanics and Foundation Engineering, v. I, p. 273-277.
Kjaernsli, B. and Sande, A., 1963, Compressibility of Some Course-Grained Materials: Norwegian Geotechnical Institute, Publication No. 66.
Kocasoy, G. and Curi, K., 1995, The U¨mraniye–Hekimbasi open dump accident: Waste Management and Research, 13, 305–314.
Koerner, R.M., 1970, Effect of Particle Characteristic on Soil Strength: Proceedings of the American Society of Civil Engineers, Journal of the Soil Mechanics and Foundations Division, SM4, p. 1221-1235.
Koncagül, E.C., and Santi, P.M., 1999, Predicting the Unconfined Compressive Strength of the Breathitt Shale Using Slake Durability, Shore Hardness and Rock Structural Properties: Int. J. Rock Mech. Min. Sci., v. 36, p. 139-153.
Kroeger, E.B., Huang, S.L., and Speck, R.C., 1991, Spoil pile failure and analysis in interior Alaska: Society of Mining Engineering, preprint 11 p.
Krumbein, W.C., 1941, Measurement and Geological significance of Shape and Roundness of Sedimentary Particles: Journal of Sedimentary Petrology, v. 11, p. 64-72.
Krumbein, W.C., and Sloss, L.L., 1963, Stratigraphy and sedimentation: 2nd Ed., Freeman and Company, San Francisco.
Lambe, T.W., and Whitman, R.V., 1969, Soil Mechanics: Wiley, New York. Lan, H.X., Hu, R.L., Yue, Z.Q., Lee, C.F., and Wang, S. J., 2003, Engineering and geological
characteristics of granite weathering profiles in South China: Journal of Asian Earth Sciences, v. 21, p. 353-364.
• Completely weathered granites have low moisture, low-medium plasticity, medium void ratio, medium compressibility, high shear strength (friction angle 20-30°, cohesion 20-40 KPa)
• Strength decreases when cementation decreases • Al2O3, Fe2O3, TiO2, H2O decrease with depth (decrease in weathering) while SiO2,
K2O, Na2O, CaO, MgO increase with depth (decrease in weathering) Lasaga, A.C. and Berner, R.A., 1998, Fundamental aspects of quantitative models for
geochemical cycles: Chemical Geology, v. 145, p. 161-175. • Mean lifetime of a 1-mm crystal at 25ºC and pH=5 (equilibrium between mineral and
solution is probably not achieved) Mineral Lifetime (years) quartz 34,000,000
kaolinite 6,000,000 muscovite 2,600,000
epidote 923,000 microcline 921,000
albite 575,000

89
Mineral Lifetime (years) sanidine 291,000 gibbsite 276,000 enstatite 10,100 diopside 6,800 anorthite 112 calcite 0.43
Lee, C.G., Chon, H.T., and Jung, M.C., 2001, Heavy metal contamination in the vicinity of
the Daduk Au-Ag-Pb-Zn mine in Korea: Applied Geochemistry, v. 16, p. 1377–1386 Lee, K.L., and Seed, H.B., 1967, Drained Strength Characteristics of Sands: Journal of Soil
Mechanics and Foundation Division of ASCE, SM6, p. 117-141. Lee, K.L., Seed, H.B., and Dunlop, P., 1967, Effect of Moisture on the Strength of Clean
Sand: Journal of Soil Mechanics and Foundation Division, ASCE, SM6, p. 17-40. Lee, P., Kang, M., Choi, S. and Touray, J., 2005, Sulfide oxidation and the natural
attenuation of arsenic and trace metals in the waste rocks of the abandoned Seobo tungsten mine, Korea: Applied Geochemistry, v. 20, p. 1687-1703.
• Waste rock piles consist of Fe-(oxy)hydroxides (e.g. goethite), jarosite, elemental S, Fe-sulfates, amorphous Fe–As phases, anglesite and covellite
• Column tests and geochemical modeling show formation of jarosite and goethite but not Fe-hydroxide
León, E.A., Rate, A.W., Hinz, C., and Campbell, G.D., 2004, Weathering of sulphide minerals at circum-neutral-pH in semi-arid/arid environments: influence of water content: SuperSoil 2004, 3rd Australian New Zealand Soils Conference, University of Sydney, Australia, 7 p., www.regional.org.au/au/asssi/
Leps, T.M., 1970, Review of Shearing Strength of rockfill: Journal of Soil Mechanics and Foundation Engineering Division, v. 96(SM4), p. 1159-1170.
Leslie, D.D., 1961, Large Scale Triaxial Tests on Gravelly Soils; in Proceedings, 2nd Pam Am Conference on Soil Mechanics and Foundation Engineering: v. I, p. 181-202.
Lewis, J.G., 1956, Shear Strength of Rockfill, Proceedings of the 2nd Australia-New Zealand Conference on Soil Mechanics and Foundation Engineering, p. 181-202.
Li, M., 1999, Hydrochemistry of oxidized waste rock from Stratmat site, N.B.: MEND 1.36.2a, 81 p.
Lin, Z., 1996, Leachable chemistry and precipitates mineralogy of Rudolfsgruvan mine waste rock dump in central Sweden: water Science Technology, v. 33, p. 163-171.
Lin, Z. and Herbert, R.B., Jr, 1997, Heavy metal retention in secondary precipitates from a mine rock dump and underlying soil, Dalarna, Sweden: Environmental Geology, v. 33, p. 1-12.
Linero, S., Palma, C., and Apablaza, R., 2007, Geotechnical characterization of waste material in very high dumps with large scale triaxial testing, Proceedings of International Symposium on Rock Slope Stability in Open Pit Mining and Civil Engineering, 12-14 September 2007, Perth, Australia, p. 59-75.
Linklater, C.M., Sinclair, D.J., and Brown, P.L., 2005, Coupled chemistry and transport modelling of sulphidic waste rock dumps at the Aitik mine site, Sweden: Applied Geochemistry, v. 20, p. 275-293.

90
• Oxidation rates are variable, most of the rock pile is oxidizing slowly, but pockets of more oxidized material, especially near the edges, model predicts that consumption of sulfide material would take few hundred to many thousands of years
• Slow dissolution rates of sulfides and aluminosilicates • Rapid dissolution of amorous oxides • Precipitation of secondary minerals, gypsum, jarosite
Ljungber, J. and Ohlander, B., 2000, The geochemical dynamics of oxidizing mine tailings at Laver, northern Sweden: Journal of Geochemical Exploration, v. 74, p. 57-72.
• Mineralogy studies of the Laver tailings, Sweden shows low sulfides in uppermost, oxidized portion; minerals show surface coating of Fe-oxyhydroxides; edges of biotite slightly oxidized, no other silicates were oxidized
Lohnes R.A. and Demirel T. 1973, Strength and structure of laterites and lateritic soils: Engineering Geology, v. 7, p. 13-33.
Lucia, P.C., 1981, Review of experiences with flow failures of tailing dams and waste impoundments: PhD dissertation, University of California, Berkeley, 234 p.
Lumb, P., 1962. The Properties of Decomposed Granite: Geotechnique, v. 12: p. 226-43. Lumb, P., 1965. The Residual Soils of Hong Kong: Geotechnique, v. 15, p. 180-194. Lundgren, T., 2001, The dynamics of oxygen transport into soil covered mining waste
deposits in Sweden: Journal of Geochemical Exploration, v. 74, p. 163-173 Maharana Pratap University of Agriculture and Technology, 2005. Designing of waste
dumps vis a vis land use planning for marble quarries in southern Rajasthan, India. 20th World Mining Congress.
Manoj, K.M. and Karanam, U.M.R., 2006. Geotechnical characterization of fly ash composites for backfilling mine voids. Geot. and Geol. Eng., v. 24, p. 1749–1765.
Marachi, D.N., Chan, C.K., Seed, B.H., and Duncan, J.M., 1969, Strength and Deformation Characteristics of Rockfill materials: Department of Civil Engineering, University of California, Berkeley, California, Report No. Te-69-5, 139 p.
Marescotti, P., Carbone, C., de Capitani, L., Grieco, G., Lucchetti, G., and Servida, D., 2007, Mineralogical and Geochemical characterisation of open-air tailing and waste-rock dumps from the Libiola Fe-Cu sulphide mine (eastern Liguria, Italy): Environmental Geology, 10.1007/s00254-007-0769-8, 14 p.
Marsal, R.J., 1965, Discussion: Proceedings, 6th International Conference on Soil Mechanics and Foundation Engineering, v. 3, p. 310-316.
Martín-Garcia, J.M., Delgado, G., Parraga, J.F., Gamiz, E., and Delgado, R., 1999, Chemica, mineralogical and (micro)morphological study of coarse fragments in Mediterranean red soils: Geoderma, v. 90, p. 23-47.
Martin, V., Aubertin, M., Zhan, G., Bussière, B., and Chapuis, R.P., 2005, An investigation into the hydrological behaviour of exposed and covered waste rock dumps: SME Preprint 05-109, 10 p.
McCarroll, D. and Nesje, A., 1996, Rock surface roughness as an indicator of degree of rock surface weathering: Earth Processes and Landforms, v. 21, p. 963-877.
McGregor, R.G. and Blowes, D.W., 2002, The physical, chemical and mineralogical properties of three cemented layers within sulfide-bearing mine tailings: Journal of Geochemical Exploration, v. 76, p. 195–207.
McLemore, V.T., Ayakwah, G., Boakye, K., Campbell, A., Donahue, K., Dunbar, N., Gutierrez, L. Heizler, L., Lynn, R., Lueth, V., Osantowski, E., Phillips, E., Shannon,

91
H., Smith, M. Tachie-Menson, S., van Dam, R., Viterbo, V.C., Walsh, P., and Wilson, G.W., 2008c, Characterization of Goathill North Rock Pile: revised unpublished report to Molycorp, Tasks: 1.3.3, 1.3.4, 1.4.2, 1.4.3, 1.11.1.3, 1.11.1.4, 1.11.2.3, B1.1.1, B1.3.2.
McLemore, V.T., Donahue. K.M., Walsh, P., Tachie-Menson, S., Phillips, E.H., Guitierrez, L.A.F., and Shannon, H.R., 2005, Trench Sampling of the Molycorp Goathill North rock piles, Questa Rock Pile Stability Study, New Mexico: National Meeting of the American Society of Mining and Reclamation, Breckenridge, Colo, June, CD-ROM, 26 p. http://geoinfo.nmt.edu/staff/mclemore/Molycorppapers.html
McLemore, V.T., Donahue, K.M., Phillips, E., Dunbar, N., Walsh, P., Gutierrez, L.A.F., Tachie-Menson, S., Shannon, H.R., Wilson, G.W., and Walker, B.M., 2006a, Characterization Of Goathill North Mine Rock Pile, Questa Molybdenum Mine, Questa, New Mexico: National Meeting of the 7th ICARD, SME, and American Society of Mining and Reclamation, St. Louis, Mo., March, CD-ROM, http://geoinfo.nmt.edu/staff/mclemore/Molycorppapers.html
McLemore, V.T., Donahue, K., Phillips, E., Dunbar, N., Smith, M., Tachie-Menson, S., Vitirbo, V., Lueth, V.W., Campbell, A.R. and Walker, B.M., 2006b, Petrographic, mineralogical and chemical characterization of Goathill North Mine Rock Pile, Questa Molybdenum Mine, Questa, New Mexico: 2006 Billings Land Reclamation Symposium, June, 2006, Billings, Mt. Published by Published by American Society of Mining and Reclamation, 3134 Montavesta Rd., Lexington, KY CD-ROM, http://geoinfo.nmt.edu/staff/mclemore/Molycorppapers.html
McLemore, V.T., Fakhimi, A., Boakye, K., Donahue, K., Gutierrez, L., Nunoo, S., Tachie-Menson, S., Viterbo, V.C., 2008b, Geotechnical investigations of the Questa rock piles, Taos County, New Mexico: New Mexico Bureau of Geology and Mineral Resources, Open-file report, in preparation
McLemore, V.T., Lynn, R., and Donahue, K., 2008a, Water Geochemistry, Goathill North Rock Pile: unpublished report to Chevron, Task B1.1.
McLemore, V.T. and the Steering Committee of ADTI, 2008, Management Technologies for Metal Mining Influenced Water, Volume 1: Basics of Metal Mining Influenced Water: Society for Mining, Metallurgy, and Exploration, Inc, Littleton, Co., in press.
Meldrum, J.L., Jamieson, H.E., and Dyke, L.D., 2001, Oxidation of mine tailings from Rankin Inlet, Nunavut, at subzero temperatures: Canadian Geotechnical Journal, v. 38, p. 957-966.
• Some oxidation occurred at -2°C • No oxidation occurred at -10°C
Mesri, G. and Shahien M., 2003, Residual shear strength mobilized in first-time slope failures: Journal of Geotechnical and Geoenvironmental Engineering, ASCE, v. 129, no. 1, p. 12-31.
Metcalf and Eddy, Inc., 2003, Callahan mining superfund site, Brookville, Maine: EPA conceptual model and RI/FS SOW contract 68-W6-0042, 72 p.
Meyer, J.W., 1991, Volcanic, plutonic, tectonic and hydrothermal history of the southern Questa Caldera, New Mexico: University Microfilms, Ph.D. dissertation, 348 p.
Miller, R.A., and Hertel, T.M., 1997, Mine Rock Characterization - Zortman and Landusky Mines, Little Rocky Mountains, Phillips County, North-Central Montana: Fourth International Conference on Acid Rock Drainage, Vancouver, p. 515-532.

92
Mohamed, Z., Rafek, A.G., and Komoo, I., 2006, A geotechnical engineering characterization of interbedded Kenny Hill weak rock in Malaysian wet tropical environment: EJGE.
Morin, K.A., Gerencher, E., Jones, C.E., and Konasewich, D.E., 1991, Critical review of acid drainage from waste rock: MEND report 1.11.1, 193 p.
Morin, K.A., Hutt, N.M., and Hutt, S.G., 1997, History of Eskay Creek mine’s waste-rock dump from placement to disassembly: MEND Project 1.44.1, 419 p.
• Most of the dump consisted of fine-grained material that limited infiltration, although infiltration still occurred
• Mass balance calculations showed that all sulfide in the rock pile would have been consumed within 11-26 yrs
• Acid drainage occurred within 2 yrs of the construction of the rock pile • The rock pile was stratified • Ca, Co, Si decrease with decreasing grain size, Ba, LOI, As, Cu, Pb, Sb, Al, K
increase with decreasing grain size • Point infiltration tests indicated that the rate of water movement through the rock pile
was minimal and the rock pile retained a large amount of acidity due to the minimized infiltration
• Infiltration did occur in areas of heterogeneities like a pebble within a silt layer Morth, A.H. and Smith, E.E., 1966, Kinetics of the sulfide-to-sulfate reaction: Am. Chem.
Soc. Div. Fuel Chem. Preprints 10, 83. Mularz, S. And Rybicki, S., 1977, Subgrade and dump deformations caused by dumping of
mine waste: Engineering Geology, v. 11, p. 189-200. Munroe, E.A. and McLemore, V.T., 1999, Waste rock pile characterization, heterogeneity
and geochemical anomalies in the Hillsboro mining district, Sierra County, New Mexico: Journal of Geochemical Exploration, v. 66, p. 389-405.
Munroe, E.A., McLemore, V.T., and Dunbar, N.W., 2000, Mine waste rock pile geochemistry and mineralogy in southwestern New Mexico, USA; in ICARD 2000: Proceedings from the 5th International Conference on Acid Rock Drainage, Society for Mining, Metallurgy, and Exploration, Inc, Littleton, Co., v. 2, p. 1327-1336.
• Describes textures and geochemistry of weathered minerals from rock piles at Hillsboro district
Nagy, K.L., Blum, A.E., and Lasaga, A.C., 1991, Dissolution and precipitation kinetics of kaolinite at 80°C and pH 3: The dependence on solution saturation state: American Journal of Science, v. 291, p. 649-686.
Nagy, K.L., and Lasaga, A.C., 1992, Dissolution and precipitation kinetics of gibbsite at 80°C and pH 3: The dependence on solution saturation state: Geochimica et Cosmochimica Acta, v. 56(8), p. 3093-3111.
Nagy, K.L., Steefel, C.I., Blum, A.E., and Lasaga, A.C., 1990, Dissolution and Precipitation of kaolinite: Initial results a 80° C with application to porosity evolution in a sandstone; In I. D. Meshi and P. J. Ortoleva (eds.): Prediction of Reservoir quality through chemical modeling p. 85-102. Tulsa: A.A.P.G.
• nature of clay formed during the weathering process depends upon three factors: • The mineralogical and textural composition of the parent rock. • The composition of the aqueous solution. • The nature of the fluid flow (i.e., rate of water flow and pore network)

93
NCE, 1982, Liberian Slip Kills 200: New Civil Engineer, no. October 14. Nesbitt, H.W. and Jambor, J.L., 1998, Role of mafic minerals in neutralizing ARD,
demonstrated using a chemical weathering methodology; in Cabri, L.J. and Vaughan, D.J. (eds.), Modern Approaches to Ore and Environmental Mineralogy: Mineralogical Association of Canada Short Course Series, v. 27, p. 403-421.
Neuendorf, K.K.E., Mehl, Jr., J.P., and Jackson, J.A., 2005, Glossary of Geology: American Geological Institute, 5th edition, Alexandria, Virginia, 779 p.
Neumann-Mahlkau, P., 1993, Acidification by pyrite weathering on mine waste stockpiles, Ruhr district, Germany: Engineering Geology, v. 34, p. 125-134.
Ng, C.W.W., Guan, P., and Shang, Y.J., 2001, Weathering mechanism and indices of the igneous rocks of Hong Kong: Quarterly Journal of Engineering Geology and Hydrogeology, v. 34, p. 133-151.
Nichols R.S., 1982, Waste dump stability at Fording Coal Limited in B.C.; in Stability in surface mining, Brawner C.O. (ed.), Printed by Edwards Brothers Inc, Michigan, USA.
Nichols, R.S. 1987, Rock segregation in waste dumps; In: Flow-through rock drains: Proceedings of the International symposium convened at the Inn of the South, Cranbrook, B.C., September 8-11, 1986.
Nolan, Davis, and Associates, Limited, 1991, Heath Steele waste rock study: MEND project 2.31.1(a), 187 p.
Oakey, R.J., Green, M., Carling, P.A., Lee, M.W.E., Sear, D.A., and Warburton, J., 2005, Grain shape analyses—a new method for determining representative particle shapes for populations of natural grains: Journal of Sedimentary Research, v. 75, p. 1065-1073.
Okagbue, C.O., 1984, The geotechnical characteristics and stability of a spoil heap at Southwestern Pennsylvania coal mine, USA: Engineering Geology, v. 20, p. 325–341.
Okagbue, C.O., 1986, An investigation of landslide problems in spoil piles in a strip coal mining area, West Virginia (USA): Engineering Geology, v. 22, p. 317-333.
Okagbue, C.O., 1987, Stability of Waste Spoils in an Area Strip Mine–Geological and Geotechnical Considerations: Earth Surface Processes and Landforms, v. 12, p. 289-300.
Ollier, C.D., 1969, Weathering geomorphology texts: 1st ed., Oliver and Boyd, Edinburgh. Ollier, C.D., 1984, Weathering geomorphology texts: 2nd ed., Longman Group, Essex, United
Kingdom, 270 p. Olyphant, G.A., Bayless, G.R., Harper, D., 1991, Seasonal and weather-related controls on
solute concentrations and acid drainage from a pyritic coal-refuse deposit in southwestern Indiana, USA: J. Contam. Hydrol., v. 7, p. 219–236.
Pantelis, G., Ritchie, A.I.M. and Stepanyants, Y.A., 2002, A conceptual model for the description of oxidation and transport processes in sulphidic waste dumps: Applied Mathematical Modeling, v. 26, p. 751-770.
Pasamehmetoglu, A.G., Karpuz, C. and Irfan, T.Y., 1981, The weathering characteristics of Ankara andesites from the rock mechanics point of view; in Weak rock; soft, fractured and weathered rock: Proceedings of the international symposium on weak rock; v. I, A.A. Balkema, Rotterdam, Netherlands, p. 185-190 .
94
Pastor, M., Quecedo, M., Fernádez Merodo, J. A., Herrores, M. I., González, E., Mira, P., 2002, Modelling tailings dams and mine waste dumps failures: Geotechnique, v. 52, no. 8, p. 579-591.
• Presents a depth-integrated model to simulate flowslides, mudflows, and debris flows caused by failure of tailings and mine waste rock piles
Pedersen, T.F., 1985, Early diagenesis of copper and molybdenum in mine tailings and natural sediments in Rupert and Holberg Inlets, British Columbia: Canadian Journal of Earth Sciences, v. 22, p. 1474-1484.
Peel, T.A., 1990, Particle size dissolution by sulfuric acid and its effect on the engineering properties of soils: PhD. Dissertation, Duke University, 266 p.
Pernichele, A.D. and Kahle, M.B., 1971, Stability of waste dumps at Kennecott’s Bingham Canyon mine: Society of Mining Engineers, AIME, Transactions, v. 250, p. 363-367.
• Blowout of the Verona dump in 1969 caused by perched leach solutions near the face of the rock pile
• Perched zone on top of accumulation of jarosite Phillips, J.D., Lampe, M., King, R.T, Cedillo, M., Beachley, R., Grantham, C., 1997,
Ferricrete formation in the North Carolina Coastal Plain: Zeitsch. F. Geomorphology, v. 41, p. 67– 79.
Powers, M.C., 1982, Comparison chart for estimating roundness and sphericity: AGI (American Geological Institute), Alexandria, Va., data sheet 18.1
Price, W.A. and Kwong, Y.T.J., 1997, Waste rock weathering; sampling and analysis: observations from the British Columbia Ministry of Employment and Investment Database; in Proceedings from the 4th International Conference on Acid Rock Drainage: v. 1, May 31-June 6, 1997, Vancouver, B.C., Canada.
Puura, E. Neretnieks, I., and Kirsimae, K., 1999, Atmospheric oxidations of the pyritic waste rock in Maardu, Estonia 1. Field study and modeling: Environmental Geology, v. 39, p. 1-19.
Quine, R.L., 1993, Stability and deformation of mine waste dumps in north-central Nevada: M. S. thesis, University of Nevada, Reno.
Rassam, D.W. and Williams, D.J., 1999, 3-dimensional effects on slope stability of high waste rock dumps: International Journal of Surface Mining, Reclamation and Environment, v. 13
Ribet, I., Ptacek, C.J., Blowes, D.W., and Jambor, J.L., 1995, The potential for metal release by reductive dissolution of weathered mine tailings: Journal of Contaminant Hydrology, v. 17, p. 239–273.
Richards, B.G., Coulthard, M.A., and Toh, C.T., 1981, Analysis of slope stability at Goonyella mine: Canadian Geotechnical Journal, v. 18, p. 179-194.
Ritchie, A.I.M., 1994, The waste rock environment: D.W. Blowes ad J.L. Jambor, eds., Environmental geochemistry of sulphide mine wastes: Mineralogical Society of Canada, Short Course Handbook, v. 22, p. 133-161.
Ritchie, A.I.M., 2003, Oxidation and gas transport in piles of sulfidic waste; in Environmental aspects of mine wastes: Mineralogical Association of Canada, Short Course Series, v. 21, p. 73-94.
Roberts, J.A., Daniels, W.L., Bell, J.C., and Burger, J.A., 1988, Early stages of mine soil genesis in a southwest Virginia spoil lithosequence: Soil Science Society of America Journal, v. 52, p. 716-723

95
Roberts, J.E., and De Souza, J.M., 1958, The Compressibility of Sands: Proceedings, ASTM, v. 58, p. 1269-1277.
Robertson, A.M., 1982, Deformation and Monitoring of Waste Dump Slopes, p. 16. Robertson, A.M., 1985, Mine Waste Disposal: An Update on Geotechnical and
Geohydrological Aspects. Robertson, A., and Skermer, N.A., 1988, Design Considerations for the Long Term Stability
of Mine Wastes, in First International Environmental Workshop, Darwin. Robinson, D.A. and Friedman, S.P., 2002, Observations of the effects of particle shape and
size distribution on the avalanching of granular materials: Physical A (Statistical Mechanics and its Applications), v. 311, no. 1-2, p. 97-110.
Robinson, G., Skaftfeld, K., Aslund, R., and Copland, H., 2005, Landslide dams and creeks stabilization at the former Clinton Creek asbestos mine: Northern Latitudes, Dawson City, Yukon.
Salhotra, A.M., Adams, E.E., and Harleman, R.F., 1985, Effect of salinity and ionic composition on evaporation: Analysis of Dead Sea evaporation pans: Water Resour. Res., v. 21(9), p. 1336–1344.
Santamarina, J.C., Klein, K.A. and Fam, M.A., 2001, Soils and Waves: Wiley, West Sussex, 488 p.
Saretzky, G.T., 1998, hydrological characterization of a sulfide waste rock dump: M.S. thesis, Univ. of Saskatchewan, Saskatoon, SK.
Savci, G. and Williamson, A.L., 2002, Hydrologic assessment of waste tock stockpiles: A case study from Ajo mine, Arizona: SME proceedings, Phoenix
Schafer, W.M., Nielson, G.A., and Nettleton, W.D., 1980, Minesoil genesis and morphology in a spoil chronosequence in Montana: Soil Science Society of America Journal, v. 44, p. 802-807
Scheinost, A.C. and Schwertmann, U., 1999, Color identification of iron oxides and hydroxysulfates: use and limitations: Soil Science Society of America Journal, v. 63, p. 1463-1471.
Seedsman, S.A. and Emerson, W.W., 1985, The Role of Clay-rich Rocks in Spoil Pile Failures at Goonyella Mine, Queensland, Australia: International Journal of Rock Mechanics and Mining Science, v. 22, p. 113-118.
Sencindiver, J.C., and Ammons, J.T., 2000, Minesoil Genesis and Classification; Ch. 23. in Reclamation of Drastically Disturbed Lands. R.I. Barnhisel, W.L. Daniels, and R.G. Darmody (Eds.): Agronomy Series No. 41. American Soc. Agronomy. Madison, WI.
• Bridging voids can improve aeration and reduce holding capacity of water as well as lead to differential settling, which can affect hydraulic properties
• Physical and chemical weathering also may break down rock fragments very rapidly in near-surface environments
• Mineralogy of Pennsylvania minesoils indicates that clay minerals have not been altered in minesoils less than 30 years old, even though some of the minesoils are extremely acid.
Shakesby, R.A. and Whitlow, J.R., 1991, Failure of a mine waste dump in Zimbabwe: causes and consequences: Environmental Geol Water Science, v. 18, no. 2, p. 143-153.
• Failure of tailings dam result of poor basal drainage, steep perimeter walls, and saturation of the walls and basal sediments.
96
Shakoor, A. and Ruof, M.A., 1989, Stability of selected coal mine waste embankments in east-central Ohio: Bulletin of the Association of Engineering Geologists, v. 26, p. 369-386
• Engineering properties are variable for each material • Stability is at a minimum under undrained conditions and can be improved by proper
drainage • Used analyses of variance and Monte Carlo simulations to determine relationships
between engineering properties • Recommended to investigate the effect of variation of lithology on engineering
Weight of spoil pile overloaded flood plain sediments properties Shaw, S., Wels, C., Robertson, A., and Lorinczi, G., 2002, Physical and Geochemical
Characterization of Mine Rock Piles at the Questa mine, New Mexico: Tailings and Mine Waste '02, proceedings of the Ninth International Conference on Tailings and Mine Waste: Fort Collins, Colorado, USA, 27-30 January 2002, p. 447-458.
Shinohara, K., Oida, M. and Golman B., 2000, Effect of particle shape on angle of internal friction by triaxial compression test: Powder Technology, v. 107, no. 1, p. 131-136.
Shum, M.G.W., 1999, Characterization and dissolution of secondary weathering products from the Gibraltar mine site [M. S. thesis]: University of British Columbia, 310 p.
Shum, M. and Lavkulich, L.M., 1999, Use of sample color to estimate oxidized Fe content in mine waste rock: Environmental Geology, v. 37, no. 4, p. 281-289.
Siddle, H.L., Wright, M.D., and Hutchinson, J.N., 1996, Rapid failures of colliery spoil heaps in the South Wales coalfield: Quarterly Journal of Engineering Geology, v. 29, p. 103-132.
Skempton, A.W., 1953, The Collodial Activity of Clays; Proceedings, Third International Conference on Soil Mechanics and Foundation Engineering: vol. I, p. 57-61.
Skempton, A.W., 1961, Effect of Stresses in Soils, Concrete, and Rocks, in Conference on Pore Pressure and Suction in Soils, London: Butterworths, p. 4
Skempton A.W., 1964, Long-term stability of clay slopes: Fourth Rankine Lecture, Geotechnique, v. 14, p. 77-101.
Smith, M.L., 1999, The analysis of surface texture using photometric stereo acquisition and gradient space domain mapping: Image Vis. Comput., v. 17, p. 1009–1019.
Smith, L. and Beckie, R., 2003, Hydrologic and geochemical transport processes in mine waste rock; in Environmental aspects of mine wastes: Short Course Series, v. 31, p. 51-72.
Sowers, G.F., Williams, R.C., and Wallace, T.C., 1965, Compressibility of Broken Rock and the Settlement of Rockfills; in Proceedings of the 6th International Conference on Soil Mechanics and Foundation Engineering: v. II, p. 561-565.
Speck, R.C., Huang, S.L., and Kroeger, E.B., 1993, Large-scale slope movements and their affect on spoil-pile stability in Interior Alaska: International Journal of Surface Mining and Reclamation. V. 7 (4), p. 161-166.
Sposito, G., 1989, The Chemistry of Soils: New York, Oxford University Press. Sracek, O., Choquette, M., Gelinas, P., Lefebvre, R., and Nicholson, R.V., 2004,
Geochemical Characterization of Acid Mine Drainage from a Waste Rock Pile, Mine Doyon, Quebec, Canada: Journal of Contaminant Hydrology, v. 69, p. 45-71.
Stanciucu, M., 2005, Evaluation of waste embankment slope stability: Valea Manastirii, Gorj, Romania: Bulletin of Engineering Geology, v. 64, p. 341-346.
97
Stepanek, M. and McAlpine, H.F., 1992, Landslide Dams at Clinton Creek; in Geotechnique and Natural Hazards, BiTech Publishers, Vancouver, B.C., pp 291-298
Stormont, J.C., and Farfan, E., 2005, Stability evaluation of a mine waste pile: Environmental and Engineering Geoscience, v. 11(1), p. 43-52.
Stromberg, B., and Banwart, S., 1994, Kinetic modelling of geochemical processes at the Aitik mining waste rock site in northern Sweden: Appl. Geochem., v. 9, p. 583–595.
Stromberg, B. and Banwart, S.A., 1999, Experimental study of acidity-consuming processes in mining waste rock: some influences of mineralogy and particle size: Applied Geochemistry, v. 14, no. 1, p. 1-16.
Sukumaran, B., and Ashmawy, A.K., 2001, Quantitative characterization of the geometry of discrete particles: Geotechnique, v. 51(7), p. 171–179.
Swanson, D.A, Savci, G., Danzier, G., Williamson, A., and Barnes, C., 2000, Unsaturated hydrologic assessment of waste rock stockpiles in semi-arid climates; in ICARD 2000: Proceedings from the 5th International Conference on Acid Rock Drainage, Society for Mining, Metallurgy, and Exploration, Inc, Littleton, Co., v. 2, p. 1273-1282.
Takala, I., Kontturi, M., Rutkvist, J., and Lindvall, M., 1999, The Aitik waste rock decommissioning project: unpublished report, 8 p.
Terzaghi, K., and Peck, R.B., 1948, Soil Mechanics in Engineering Practice: Wiley, New York.
Tran, A.B., 2003, Geochemistry of acid generating waste rock dumps: M.S. thesis, University of Queensland, Canada, 217 p.
Tonui, E., Jones, R.L., Scott, K.M., 2002. Regolith mineralogy and geochemical dispersion at the Northparkes Cu–Au deposits, NSW, Australia. Geochem. Explor. Environ. Anal. 2, p. 345– 361.
Tuğrul, A. and Gürpinar, O., 1997, The effect of chemical weathering on the engineering properties of Eocene basalts from northeastern Turkey: Environmental and Engineering Geosciences, v. 3, p. 225-234
Tuğrul, A, and Zarif, I.H., 1999, Correlation of mineralogical and textural characteristics with engineering properties of selected granitic rocks from Turkey: Engineering Geology, v. 51, p. 303-317.
Thuro, K. and Scholz, M., 2003. Deep Weathering and Alteration in Granites - A Product of Coupled Processes, International Conference on Coupled T-H-M-C Processes in Geosystems: Fundamentals, Modeling, Experiments and Applications, Sweden.
Tuttle, M.L.W., Wanty, R.B., and Berger, B.R., 2004, Environmental behavior of two molybdenum porphyry systems: 2004 SME Annual Meeting Preprints, p. 443-452.
Uhle, R.J., Jr., 1986, A statistical analysis of rockfill data—Shear strength and deformation parameters with respect to particle size: M.S. thesis, Colorado State University, Fort Collins.
Ulusay, R., Arikan, F., Yolri, M. F., and Cağlan, D., 1995, Engineering geological characterization of coal mine waste material and an evaluation in the context of back-analysis of spoil pile instabilities in a strip mine: Engineering Geology, v. 40, p. 77-101.
• Positive correlation of fines and water content • Differences between peak and residual shear are small

98
• Surface runoff may percolate through the spoil material and reduce effective shear strength
Ulusay R., and Yoleri, F., 1993, Shear strength characteristics of discontinuities in weak, stratified, clay-bearing coal measures encountered in Turkish surface coal mining: Bull Int Assoc Eng Geol, v. 48, p. 109–117
U.S. Army Corps of Engineers, 1970, Grain Size Analysis: Engineering Design: Laboratory Soil Testing: Department of the Army Headquarters, Washington, DC, p. V1-V28.
URS Corporation, 2003, Mine rock pile erosion and stability evaluations, Questa mine: Unpublished Report to Molycorp, Inc. 4 volumes.
Uthus, L., Hoff, I., and Horvli, I., 2007, Evaluation of grain shape characterization methods for unbound aggregates: http://www.sintef.no/upload/154.pdf, accessed November 6, 2007.
Valenzuela, L., 2004, Stability issues in natural and man made slopes in mining: International Conference on Landslides, Brazil.
Valenzuela, L., Bard, E., Campaña, J., and Anabalón, M.E., 2008, High waste rock dumps—challenges and developments; in A. Fourie, ed., Rock Dumps 2008: Australian Centre for Geomechanics, Perth, p. 65-78.
Vallerga, B.A., Seed, H.B., Monismith, C.L., and Cooper, R.S., 1957, Effect of Shape Size and Surface Roughness of Aggregate Particles on the Strength of Granular Materials, Special Technical Publication No. 212, ASTM.
van Zyl, D., Sassoon, M., Digby, C., Fleury, A.M., and Kyeyune, S., 2002, Mining for the Future: Appendix A, Large Volume Waste Working Paper: International Institute for Environment and Development, 31.
Varadarajan, A., Sharma, K.G., Venkatachalam, K., and Gupta, A.K., 2003, Testing and Modeling Two Rockfill Materials, Journal of Geotechnical and Geoenvironmental Engineering, Vol. 129, No. 3, ISSN 1090-0241, p. 206-218.
Velbel, M.A., 1993. Constancy of silicate-mineral weathering-rate ratios between natural and experimental weathering: implications for hydrologic control of differences in absolute rates: Chem. Geol., v. 105, p. 89–99.
Vesic, A.S., and Clough, G.W., 1968, Behavior of Granular Materials Under High Stresses: Journal of Soil Mechanics and Foundation Engineering, ASCE, p. 661-688.
Wadell, H., 1932, Volume, shape, and roundness of rock particles: Journal of Geology, v. 40, p. 443–451.
Walker, W.K. and Johnson, M.J., 2000, Observational engineering for open-pit geotechnics: A case study of predictions verses performance for the stability of a high overburden embankment over a soft/deep foundation at PT Freeport Indonesia’s Grasberg open-pit mine: Slope Stability in Surface Mining, SME, Denver.
Whiting, D.L., 1981, Surface and groundwater pollution; Chapter 9 in Design of non-impounding Mine Waste Dumps: p. 90-98.
Williams, D.J., 2000, Assessment of Embankment Parameters, Slope Stability in Surface Mining: Society for Mining, Metallurgy, and Exploration, Inc. (SME), ISBN 0-87335 194-0, TN291 .S56 2001, p. 275 – 284.
Williams, D.J. and Rohde, T.K., 2008, Rainfall infiltration into and seepage from rock dumps—a review; in A. Fourie, ed., Rock Dumps 2008: Australian Centre for Geomechanics, Perth, p. 79-89.

99
Williams, D.J. and Walker, L.K., 1985, Laboratory and field strength of mine waste rock: Civil Engineering Transactions, vol. 27, No. 3, p. 299–304.
Witcher, L., 2007, Stabilisation of old lignite pit dumps in eastern Germany: Bulletin of Geological Engineering, v. 66, p. 45-51.
Yalcin, A., 2007, The effects of clay on landslides: A case study: Appl. Clay Sci., doi:10.1016/j.clay.2007.01.007
Yanful, E.K., St-Arnaud, L., and Prairie, R., 1990, Hydrogeochemical investigation of reactive tailings at the Waite-Amulet tailings site, Noranda, Quebec, Generation and evolution of acidic pore waters at the Waite-Amulet tailings—final report: MEND Project 1.17.1d, 219 p.
• Three zones of alteration in tailings: a strong oxidized, near-surface depleted in sulfides (pH less than 4), an intermediate zone with minor alteration (pH 5.5), and a bottom zone of weak alteration (pH 6-6.5)
• The most important control on pyrite oxidation is the availability of oxygen, which influences production of ferric iron and density f bacterial populations
• Oxygen is controlled by diffusion Yazdani, J., 1995, Soil water characteristic curve for mine waste rock containing coarse
material: University of Saskatchewan, Saskatoon, Saskatchewan, M.S. thesis, 101 p. Ylmaz, I. and Karacan, E., 2005, Slaking durability and its effect on the doline formation in
the gypsum: Envir. Geol., v. 47, p. 1010-1016. Yokota, S. and Iwamatsu, A., 1999, Weathering distribution in a steep slope of soft
pyroclastic rocks as an indicator of slope stability: Engineering Geology, v. 55, p. 57-68
Yokoyama, T. and Nakashima, S., 2005, Color development of iron oxides during rhyolite weathering over 52,000 years: Chemical Geology, v. 219, p. 309-320.
Yudhbir and Abedinzadeh, R., 1991, Quantification of particle shape and angularity using the image analyzer: Geotechnical Testing Journal, v. 14(3), p. 296–308.
Zahl, E.G., Biggs, F., Boldt, C.M.K., Connolly, R.E., Gertsch, L., and Lambeth, R.H., 1992, Waste Disposal and Contaminant Control, in Hartman, H.L., ed., SME Mining Engineering Handbook: Littleton, CO, Society for Mining, Metallurgy and Exploration Inc., p. 1170-1180.
Zavodni, Z.M., Tygesen, J.D., and Pereus, S.C., 1984, Open pit mine rock dump geotechnical evaluation: International Conference on Case History in Geotechnical Engineering, S. Pralash (ed.), v. 4, Rolla, St. Louis, University of Missouri.

100
APPENDIX 1. STATISTICAL ANALYSES
DENSITY Hypothesis 1. The dry density of the Questa rock piles is different from the dry density of rock piles from throughout the world. Data. Data are results obtained from the literature review (Table 4) and NMIMT sampling and testing on Questa rock piles 2004-2007 (McLemore et al. 2008c). Approach. The normality test failed (P < 0.050), therefore the Kruskal-Wallis One Way Analysis of Variance on Ranks was selected, which assesses the samples in terms of mean. The tests were calculated using the SigmaStat@ software. Results. The results are in Table A1-1. TABLE A1-1. Comparisons of dry density (g/cc) in rock piles using the Kruskal-Wallis One Way Analysis of Variance on Ranks. H = 0.474 with 2 degrees of freedom (P = 0.789).
Group N Median 25% 75% world wide 30 1.905 1.610 2.100
GHN 118 1.831 1.736 1.924 all rock piles 153 1.840 1.735 1.940
Conclusion. The differences in the median values among the treatment groups are not great enough to exclude the possibility that the difference is due to random sampling variability; there is not a statistically significant difference (P = 0.789). POROSITY Hypothesis 2. The porosity of the GHN rock pile is different from the porosity of rock piles from throughout the world. Data. Data are results obtained from the literature review (Table 4) and NMIMT sampling and testing on Questa rock piles 2004-2007 (McLemore et al. 2008c). Approach. The Normality Test passed (P = 0.349) and the Equal Variance Test passed (P = 0.052). Therefore a T-test was used. The tests were alculated using the SigmaStat@ software. Results. The results are in Table A1-2. TABLE A1-2. Comparisons of porosity in rock piles world wide and GHN. T = -0.532 with 14 degrees of freedom. (P = 0.603)
Group Name N Mean Std Dev SEM world wide 7 33.714 11.380 4.301
GHN 9 35.901 4.378 1.459

101
Conclusion. The difference in the mean values of the two groups is not great enough to reject the possibility that the difference is due to random sampling variability. There is not a statistically significant difference between the input groups (P = 0.603). Therefore, the porosity of the rock piles world wide and at GHN is similar. FRICTION ANGLE Hypothesis 3. The friction angle of the GHN rock pile is different from the friction angle of rock piles from throughout the world. Data. Data are results obtained from the literature review (Table 4) and NMIMT sampling and testing on Questa rock piles 2004-2007 (McLemore et al. 2008c). Approach. The Normality Test failed (P < 0.050), therefore, a Kruskal-Wallis One Way Analysis of Variance on Ranks was used. The tests were alculated using the SigmaStat@ software. Results. The results are in Table A1-3. TABLE A1-3. Comparison of friction angles of rock piles world wide and the Questa rock piles using the Kruskal-Wallis One Way Analysis of Variance on Ranks. H = 30.693 with 2 degrees of freedom (P = <0.001),
Group N Median 25% 75% world wide FA 42 37.000 34.000 41.000
GHN 57 42.500 41.025 43.950 Questa 99 42.100 40.400 44.025
Conclusion. The differences in the median values among the treatment groups are greater than would be expected by chance; there is a statistically significant difference (P = <0.001). The Questa rock piles have larger friction angles than most rock piles world wide.