listening with realism: sound stage extension for laptop ......sound stage extension for laptop...
TRANSCRIPT
Listening with Realism: Sound Stage Extension for Laptop Speakers
Tsai-Yi Wu
Submitted in partial fulfillment of the requirements for the Master of Music in Music Technology
in the Department of Music and Performing Arts Professions Steinhardt School
New York University
Advisor: Dr. Agnieszka RoginskaReader: Dr. Morwaread Farbood
December 6, 2013
i

This thesis is dedicated to my family.For their endless love, support, and encouragement
ii
Mobile devices with stereo speakers such as laptops are increasingly popular. Even though
laptops are mostly used for entertainment, the performance of laptop internal speakers still leaves room
for improvement because of the physical constraints. One of the major issues of laptop reproduction is
the flat and narrow sound coming from underneath compared to using external speakers. The general
approach is to create virtual surround sound speakers by simulating the influence of the shape of
human head and pinnae on the sound. However, the ideal listening area of the virtual surround speakers
is very narrow in stereo loudspeaker reproduction, and the effect is sensitive to an individual’s body
shape. This Master’s thesis introduces a new sound stage width extension method for internal
loudspeakers. Ambidio is a real-time application that enhances a stereo sound file playing on a laptop in
order to provide a more immersive experience over built-in laptop loudspeakers. The method, based on
Ambiophonics principles, is relatively robust to a listener’s head position, and requires no measured/
synthesized HRTFs1 . The key novelty of the approach is the pre/post-processing algorithm that
dynamically tracks the image spread and modifies it to fit the hardware setting in real-time. Two
detailed evaluations are provided to assess the robustness of the proposed method. Experimental results
show that the average perceived stage width of Ambidio is 176º using internal speakers, while keeping a
relatively flat frequency response and a higher user preference rating.
i
1 Head Related Transfer Functions, see Section 2.1.
ABSTRACT
Abstract
There are a number of people without whom this thesis might not have been possible written.
First and foremost, I would like to thank my advisor, Prof. Dr. Agnieszka Roginska, who has given her
valuable time, advice, and warm support to this thesis from the beginning up to the end of the writing.
Thank you for your confidence in me. I would also like to thank Mr. Ralph Glasgal, the inventor of
Ambiophonics, for his kindly sharing of knowledge and experience. I learned a lot from your insight
and I appreciate the patience you showed to me.
I would also like to acknowledge Prof. Dr. Morwaread Farbood as the second reader of this
thesis for her valuable comments on this thesis. I want to thank Prof. Paul Geluso for his help with the
stereo widening techniques, M/S mixing, and reviewing Ambidio. I also want to take this opportunity to
thank all of the faculty members of the Department of Music and Performing Arts Professions who
have taught and guided me during the years of my study in Music Technology program.
I owe particular thanks to E-Ning Chang, Lu-Chin Chu, and JEASMCL for being with me
during every darkest night. Thank you for everything. I am also grateful to Shao-Ting Sun and Cheng-I
Wang for all the helpful conversations. Being friend with you is one of the best things happened to me
in New York. Special thanks goes to Shao-An Juan, who came and rescued me from Hurricane Sandy. To
all my friends in Taiwan: Scouts of Chateau Villa, GFN, and 7 Music Studio, thank you all for making
me feel like I’m not too far from home.
In addition, a thank you to my boyfriend, Pei-Lun Hsieh. Words fail me. I love you.
Last but not the least, I would like to give my most sincere gratitude to my beloved family.
Thank you for giving me strength to reach for stars. I can’t make it without your support. Words are
really not enough to express my gratitude, and I am going to cry because I miss you all so much. I am
so blessed to have each and every one of you in my life. I love you all!!
ii
ACKNOWLEDGEMENTS
Acknowledgements
..................................................................................................................................1. Introduction 1
1.1 ................................................................................................................Listening on Laptop Speakers 1
1.2 ...................................................................Can People Have Better Sound with Laptop Speakers? 2
1.3 ..............................................................................................................................Chapter Arrangement 3
...................................................................................................................................2. Background 4
.................................................................................................................2.1 How Humans Locate Sound? 4
2.2 ........................................................................................................Stereo Loudspeaker Reproduction 5
2.3 ..................................................................Spatial Enhancement: Sound Goes Beyond Boundaries 6
..................................................................................................2.4 Crosstalk and Crosstalk Cancellation 8
.............................................................................................................................2.5 Mid/Side Processing 10
.................................2.6 A Brief Review of Commercial Passive Spatial Enhancement Products 11
.................................................................................................................2.6.1 Qsound Labs, Inc. 11
................................................................................................2.6.2 Harman International, Inc. 12
................................................................................................................................2.6.3 DTS, Inc. 13
2.6.4 ......................................................................................................Dolby Laboratories, Inc. 14
................................................................................2.6.5 3D3A Lab of Princeton University 16
..............................................................................................2.6.6 Other Commercial Products 17
..............................................................................................................................3. Methodology 18
3.1 ..............................................................................................Whose Ears Should We Listen With? 18
3.2 ......................................................Ambiophonics: The Key to Unlock Worlds of Sonic Reality 19
.....................................3.3 Structural design of A new Spatial Enhancement Software: Ambidio 21
3.4 ...........................................Crosstalk Cancellation Filter Design: Modified RACE Algorithm 23
...........................................................................................................................3.6 User Interface Design 25
...............................................................................................................4. Subjective Evaluation 27
..............................................................................................................4.1 Subjective Evaluation Design 27
............................................................................................................................4.1.1 Participants 27
iii
Contents
CONTENTS
...............................................................................................................................4.1.2 Apparatus 28
...................................................................................................................4.1.3 Process Methods 28
.....................................................................................................................................4.1.4 Stimuli 29
...............................................................................................................................4.1.5 Procedure 30
.........................................................................................................................4.1.6 Data Analysis 32
..............................................................................................................4.2 Subjective Evaluation Results 33
........................................................................................................4.2.1 Perceived Stage Width 33
..........................................................................................4.2.2 Perceived Depth and Presence 35
..........................................................................................4.2.3 Sound Quality and Immersion 38
...............................................................................................................................4.2.4 Preference 40
.......................................................................................................4.3 Subjective Evaluation Discussion 42
.................................................................................................................5. Objective Evaluation 46
...............................................................................................................5.1 Objective Evaluation Design 46
...............................................................................................................................4.1.1 Apparatus 46
.....................................................................................................................................4.1.2 Stimuli 46
.........................................................................................................................4.1.3 Data Analysis 47
...............................................................................................................5.2 Objective Evaluation Results 48
.......................................................................................................5.3 Subjective Evaluation Discussion 50
......................................................................................................6. Discussion and Conclusion 51
...................................................................................................................6.1 Contribution of the Thesis 51
...................................................................................................................6.2 Limitation to General Use 52
..............................................................................................................................................6.3 Conclusions 53
.................................................................................................................6.4 Directions for Future Work 54
......................................................................................................................................References 55
..........................................................................................................................................Appendix 57
A ...............................................................................................................................................Subjects Background 57
...........................................................................................................................................B Perceived Stage Width 59
........................................................................................................................................................C Perceived Depth 62
..................................................................................................................................................D Perceived Presence 64
E .......................................................................................................Sound Quality, Immersion, and Preference 66
........................................................................................................................................................F The Pilot Study 69
iv
CONTENTS

Table 4.1 Description of the Selected Sequences ..................................................................................................................................................... 29
Table 4.2 Dummy Variables for Depth and Presence Rating .............................................................................................................................. 31
Table 4.3 Summary of ANOVA analysis of variance-Preference ....................................................................................................................... 33
Table 4.4 All Possible Combinations for Multiple Choices .................................................................................................................................... 41
Table 4.5 Stage Width Boost Results Comparison of the Pilot Study and the Present Evaluation ................................................................. 43
Table 5.1 Test Signals for Objective Evaluation ..................................................................................................................................................... 47
Table A.1 Descriptive Statistics of the Background Questionnaire .................................................................................................................... 57
Table A.2 Descriptive Statistics of the Equipment in the Frequency of Use..................................................................................................... 58
Table A.3 Descriptive Statistics of the Main Consideration When Choosing the Equipment ......................................................................... 58
Table B.1 Descriptive Statistics of the Perceived Stage Width ........................................................................................................................... 59
Table B.2 Average Perceived Stage Width in Degree for the Reference Stereo Clip of Each Sequence .......................................................... 60
Table B.3 Average Perceived Stage Width in Degree for the Clips Presented as the First Trial ..................................................................... 60
Table B.4 Descriptive Statistics of the Perceived Stage Width Boost ................................................................................................................ 60
Table B.5 ANOVA Summary for Stage Width Boost by Varies Subjects’ Background ................................................................................... 61
Table B.6 ANOVA Summary for Stage Width Boost by Sequence and Process Method .................................................................................. 61
Table B.7 Simple Mean Effect Test for Stage Width Boost by Sequence and Process Method ....................................................................... 61
Table C.1 Descriptive Statistics of the Perceived Depth ...................................................................................................................................... 62
Table C.2 ANOVA Summary for Perceived Depth by Varies Subjects’ Background ......................................................................................... 63
Table C.3 ANOVA Summary for Perceived Depth by Sequence and Process Method ....................................................................................... 63
Table C.4 Simple Mean Effect Test for Perceived Depth by Sequence and Process Method ............................................................................. 63
Table D.1 Descriptive Statistics of the Perceived Presence .................................................................................................................................. 64
Table D.2 ANOVA Summary for Perceived Presence by Varies Subjects’ Background ..................................................................................... 65
Table D.3 ANOVA Summary for Perceived Presence by Sequence and Process Method ................................................................................... 65
Table D.4 Simple Mean Effect Test for Perceived Presence by Sequence and Process Method......................................................................... 65
Table E.1 Descriptive Statistics of the Best Sound Quality, Most Immersive, and Most Favorite Selection ................................................... 66
Table E.2 ANOVA Summary for the Selected Best Quality Selection by Varies Subjects’ Background ........................................................... 66
Table E.3 Scheffe’s Post-Hoc Test Summary for the Selected Best Quality Clip by Age .................................................................................. 67
Table E.4 ANOVA Summary for the Selected Most Immersive Clip by Varies Subjects’ Background ............................................................. 67
Table E.5 ANOVA Summary for the Selected Most Favorite Clip by Varies Subjects’ Background ............................................................... 67
Table E.6 ANOVA Summary for the Selection When Forced to Choose From Sound Quality and Immersion .............................................. 68
Table F.1 Descriptive Statistics of the Perceived Stage Width in the Pilot Study ........................................................................................... 72
Table F.2 Descriptive Statistics of the Best Sound Quality, Most Immersion, and Preference in the Pilot Study ........................................ 72
v
List of Tables
LIST OF TABLES
Figure 1.1 ......................................................................................................................................................................... Main Objective: Ambidio 3
Figure 2.1 ........................................................................................................................................................... Localization in Horizontal Plane 4
Figure 2.2 ............................................................................................................................................................ Head-Related Transfer Function 5
Figure 2.3 .........................................................................................................................................................Listening Triangle & Its Problems 6
Figure 2.4 ............................................................................................................................................................................... Spatial Enhancement 7
Figure 2.5 .......................................................................................................................................... Summary of Spatial Enhancement Method 8
Figure 2.6 ............................................................................................................................................................Crosstalk Causes Conflicting Cues 9
Figure 2.7 ............................................................................................................................................................................... Crosstalk Cancellation 9
Figure 2.8 ...............................................................................................................................................................................Mid/Side Processing 10
Figure 2.9 .......................................................................................................................... QXpender (QSound) Spatial Enhancement Concept 12
Figure 2.10 ............................................................................................................................ VMAx (Harman) Spatial Enhancement Concept 13
Figure 2.11 .......................................................................................................................... SRS WOW (DTS) Spatial Enhancement Concept 14
Figure 2.12 ....................................................................................................... Surround Virtualizer (Dolby) Spatial Enhancement Concept 15
Figure 3.1 .................................................................................................................................................................Two Speakers Ambiophonics 19
Figure 3.2 .................................................................................................................................................... RACE Algorithm of Ambiophonics 20
Figure 3.3 The Structural Design of .....................................................................................................................................................Ambidio 22
Figure 3.4 .................................................................................................................................................................Modified RACE Algorithm 23
Figure 3.5 ................................................................................................................ Sample Impulsed Used in Frequency Domain Processing 25
Figure 3.6 ...........................................................................................................................................................................................Ambidio Icon 26
Figure 3.7 .............................................................................................................................................................The Control Panel of Ambidio 26
Figure 4.1 ............................................................................................................................................................... Subjective Experiment Setting 28
Figure 4.2 ......................................................................................................... Screenshot of the Questionnaire Page Used in the Experiment 30
Figure 4.3 ........................................................................................................ Screenshot of One of the Trial Pages Used in the Experiment 31
Figure 4.4 ....................................................................................................................................................................... Data Analysis Flowchart 32
Figure 4.5 ....................................................................... Distribution of Perceived Stage Width by Process Methods and Presented Order 34
Figure 4.6 ..........................................................................................................................................................Summary for Stage Width Boost 35
Figure 4.7 ............................................................................................................................................................... Summary for Perceived Depth 36
Figure 4.8 ...........................................................................................................................................................Summary for Perceived Presence 37
Figure 4.9 ............................................................................................................................................. Summary for Best Quality Clip Selection 39
Figure 4.10 .....................................................................................................................................Summary for Most Immersive Clip Selection 39
Figure 4.11 ............................................................................................................................Feature Rating vs Most Immersive Clip Selection 40
Figure 4.12 ....................................................................................................................................... Summary for Most Favorite Clip Selection 40
Figure 4.13 ............................................The Relationship Between the Best Quality, the Most Immersive, and the Most Favorite Selection 41
Figure 4.14 .......................................The Relationship Between the three Selections When Subjects’ First Consideration is Sound Quality 42
vi
List of Figures
LIST OF FIGURES
Figure 4.15 ..............................................................................................................................................Summary for Rated Depth & Presence 43
Figure 4.16 Rated Sound Quality & Immersion Comparison of the Pilot Study and the Present Evaluation ............................................. 44
Figure 4.17 ....................................................................................... Preference Comparison of the Pilot Study and the Present Evaluation 45
Figure 5.1 .................................................................................................................................................................Objective Experiment Setting 46
Figure 5.2 ...........................................................................................................Illustration of the Signal Chain in the Objective Experiment 47
Figure 5.3 .......................................................................................................................The Measured Responses of the Pink Noise Test Clips 48
Figure 5.4 ...................................................................................................................................The Measured Responses of the Jazz Sequence 49
Figure 6.1 ............................................................................................................ Summary of Equipment Chosen for Laptop Entertainment. 51
Figure 6.2 ...............................................................Main ReasoFns Drawing Back Consumers from Using Headphone/External Speakers 51
Figure A.1 ....................................................................................... Main Reasons Drawing Back Consumers from Using Internal Speakers 58
Figure F.1 ................................................................................................................................................ Experiment Setting in the Pilot Study 69
Figure F.2 ............................................................... Frequency Responses with and without the Screen (Parts Express Speaker Grill Cloth) 70
Figure F.3 ............................................................................................................................... Sample Survey Question Used in the Pilot Study 71
vii
LIST OF FIGURES
Chapter 1 Introduction
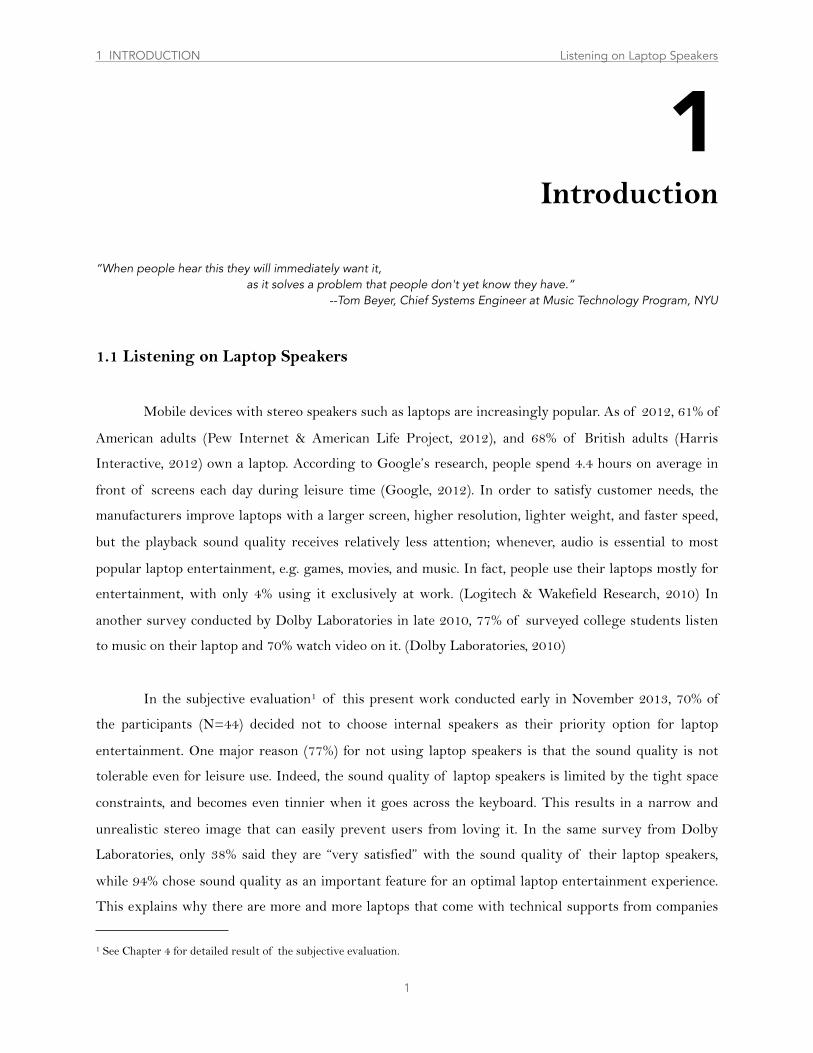
“When people hear this they will immediately want it, as it solves a problem that people don't yet know they have.”
--Tom Beyer, Chief Systems Engineer at Music Technology Program, NYU
1.1 Listening on Laptop Speakers
Mobile devices with stereo speakers such as laptops are increasingly popular. As of 2012, 61% of
American adults (Pew Internet & American Life Project, 2012), and 68% of British adults (Harris
Interactive, 2012) own a laptop. According to Google’s research, people spend 4.4 hours on average in
front of screens each day during leisure time (Google, 2012). In order to satisfy customer needs, the
manufacturers improve laptops with a larger screen, higher resolution, lighter weight, and faster speed,
but the playback sound quality receives relatively less attention; whenever, audio is essential to most
popular laptop entertainment, e.g. games, movies, and music. In fact, people use their laptops mostly for
entertainment, with only 4% using it exclusively at work. (Logitech & Wakefield Research, 2010) In
another survey conducted by Dolby Laboratories in late 2010, 77% of surveyed college students listen
to music on their laptop and 70% watch video on it. (Dolby Laboratories, 2010)
In the subjective evaluation1 of this present work conducted early in November 2013, 70% of
the participants (N=44) decided not to choose internal speakers as their priority option for laptop
entertainment. One major reason (77%) for not using laptop speakers is that the sound quality is not
tolerable even for leisure use. Indeed, the sound quality of laptop speakers is limited by the tight space
constraints, and becomes even tinnier when it goes across the keyboard. This results in a narrow and
unrealistic stereo image that can easily prevent users from loving it. In the same survey from Dolby
Laboratories, only 38% said they are “very satisfied” with the sound quality of their laptop speakers,
while 94% chose sound quality as an important feature for an optimal laptop entertainment experience.
This explains why there are more and more laptops that come with technical supports from companies
1
1 See Chapter 4 for detailed result of the subjective evaluation.
1 INTRODUCTION Listening on Laptop Speakers
1Introduction
like Dolby and DTS. As how Logitech concluded their survey: “Listening to digital files on the built-in
speakers on a laptop leaves room for improvement,” there is a need to improve the sound quality of
built-in laptop loudspeaker sound to accompany the rich graphics users normally get from the screen,
for more immersive experiences.
1.2 Can People Have Better Sound with Laptop Speakers?
The sound stage is defined as “the distance perceived between the left and right limits of the
stereophonic scene.” (Rumsey, 2001) Whereas the stereo image is those phantom images that appear to
occupy the area. (the sound stage in this case) (Moylan, 2002) A good stereo image is needed in order to
convey a natural listening environment. (Maher et al., 1996) In contrast, a flat and narrow stereo image,
like the one most laptop internal speakers would create, makes all sound perceived as coming from one
direction, and appear to be more monophonic. The perceived width can be widened and given more
spatial characteristics by applying spatial enhancement techniques and psychoacoustics principles
(Schroeder, 1993) to different stages of the music production pipeline from recording with stereo
microphone techniques (Savage, 2011), mixing with stereo widening plug-ins (Schroeder, 1958; Kendall,
1995b; Senior, 2012), to reproducing with more advanced digital signal processing (DSP) algorithms.
(Aarts, 2000; Jot & Avendano, 2003; Glasgal, 2009; Floros & Tatlas, 2011)
Among all, achieving spatial enhancement passively during playback is ideal for laptop
entertainment since it would be compatible with existing stereo recordings. As the time of this writing,
there are several commercial products, such as DTS’s WOW (DTS, 2013) and QSound’s QXpander
(QSound Lab, 2012), include passive spatial enhancement (or stereo image widening) features for laptop
internal speakers. The previous general approach was to create virtual surround sound speakers by
simulating the effect of Head-Related Transfer Functions (HRTFs). Also the ideal listening area of the
virtual surround speakers is then very narrow in stereo loudspeaker reproduction, and the effect is
sensitive to an individual’s body shape. (Kendall, 1995; Blauert, 1997; Yost, 2007) Moreover, the theory
those products rely on is mostly built on normal external loudspeakers with standard 60º separation
angle. This paper proposes a new approach that addresses these problems.
As far as the author’s knowledge, there is still no detailed work in the literature that enhances
the perceived stereo image of laptop internal speakers. This present work aims to provide laptop
entertainers another option to deliver an improved overall immersive experience and relatively
2
1 INTRODUCTION Can People Have Better Sound with Laptop Speakers ?
unrestricted range of motion without a complicated setup or required additional equipment. The main
algorithmic contribution leverages the combination of Ambiophonics principles (Glasgal, 2007; Glasgal,
2009) and dynamic Mid-Side techniques to project any stereo components playing in a laptop to a wider
sound stage, on-the-fly, while keeping a static center image. The present algorithm works without any
measured/synthesized HRTFs. A Mac OS X menu bar application (Ambidio) is introduced. Finally, the
performance of the present algorithm is validated by comparing it with the competitive technology, SRS
iWOW, and traditional stereo in both subjective and objective ways.
1.3 Chapter Arrangement
The present master’s thesis is divided into six chapters. Following this introduction, Chapter 2
provides several important background topics relevant to this work. The mechanism of human sound
localization is briefly reviewed, and a general scheme of spatial enhancement is discussed. Hereby, the
basic theory of the two main techniques used in most of the spatial enhancement through loudspeaker
playback—M/S processing and crosstalk cancellation—will be especially emphasized. Next, several
existing commercial techniques are presented. In Chapter 3, a modified spatial enhancement algorithm
based on Ambiophonics principles will be proposed and a real-time software will be introduced. The
description of the subjective and objective evaluation of the present algorithm and its results are
included in Chapter 4 and Chapter 5. Finally, Chapter 6 discusses and concludes the present thesis.
3
1 INTRODUCTION Chapter Arrangement
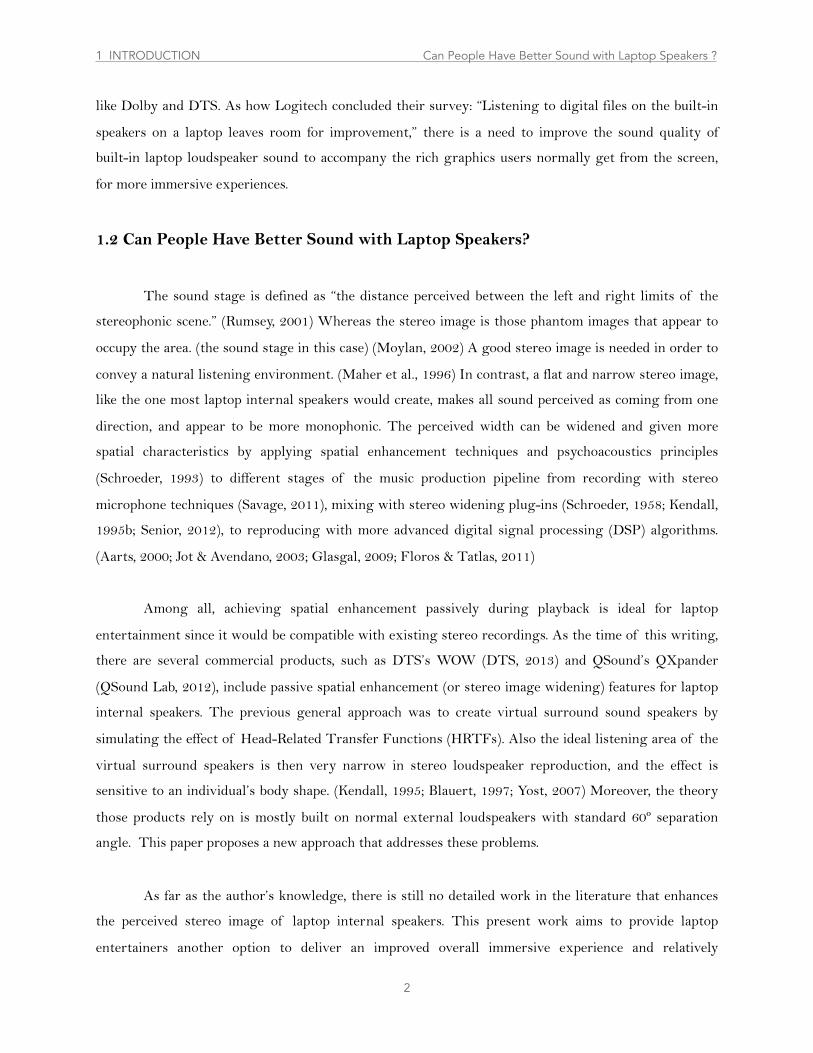
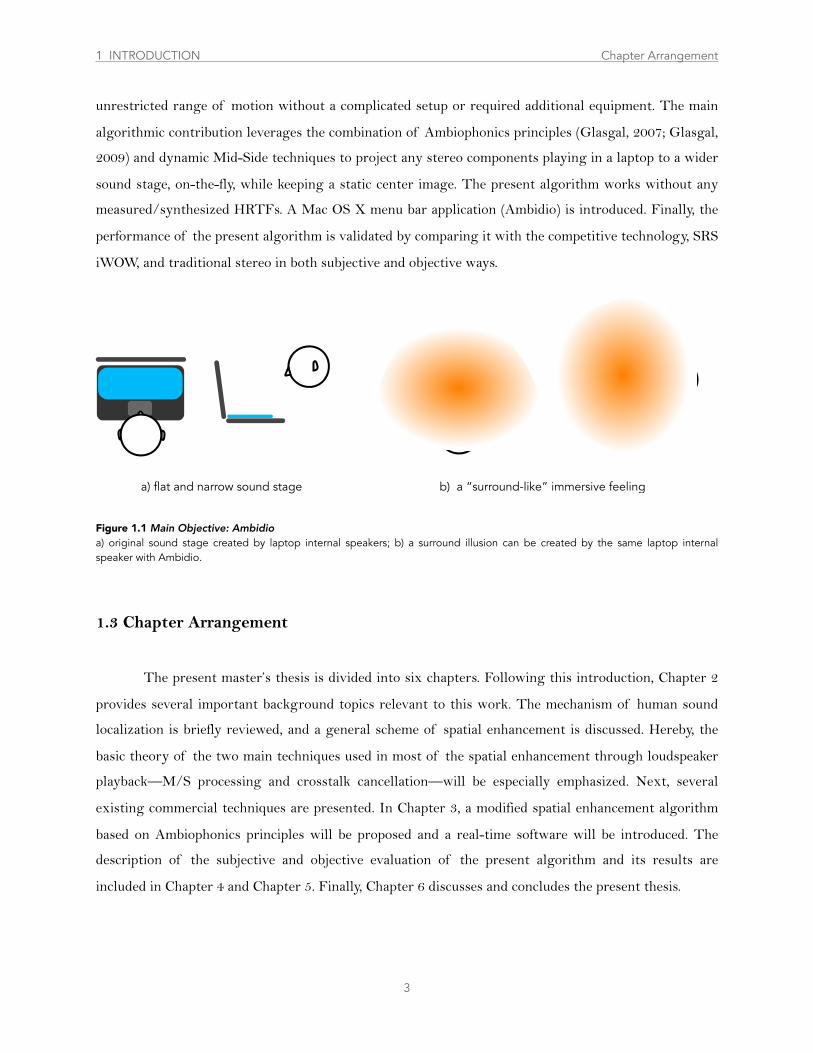
Figure 1.1 Main Objective: Ambidioa) original sound stage created by laptop internal speakers; b) a surround illusion can be created by the same laptop internal speaker with Ambidio.
a) flat and narrow sound stage b) a “surround-like” immersive feeling
Chapter 2 Background
2.1 How Humans Locate Sound?
Although we are not aware of it, sound localization happens nearly every minute in our lives.
Since sound itself has no directional difference, it is the auditory system that processes several physical
cues received by the two ears, and correlates them to the spatial location.(Yost, 2007)
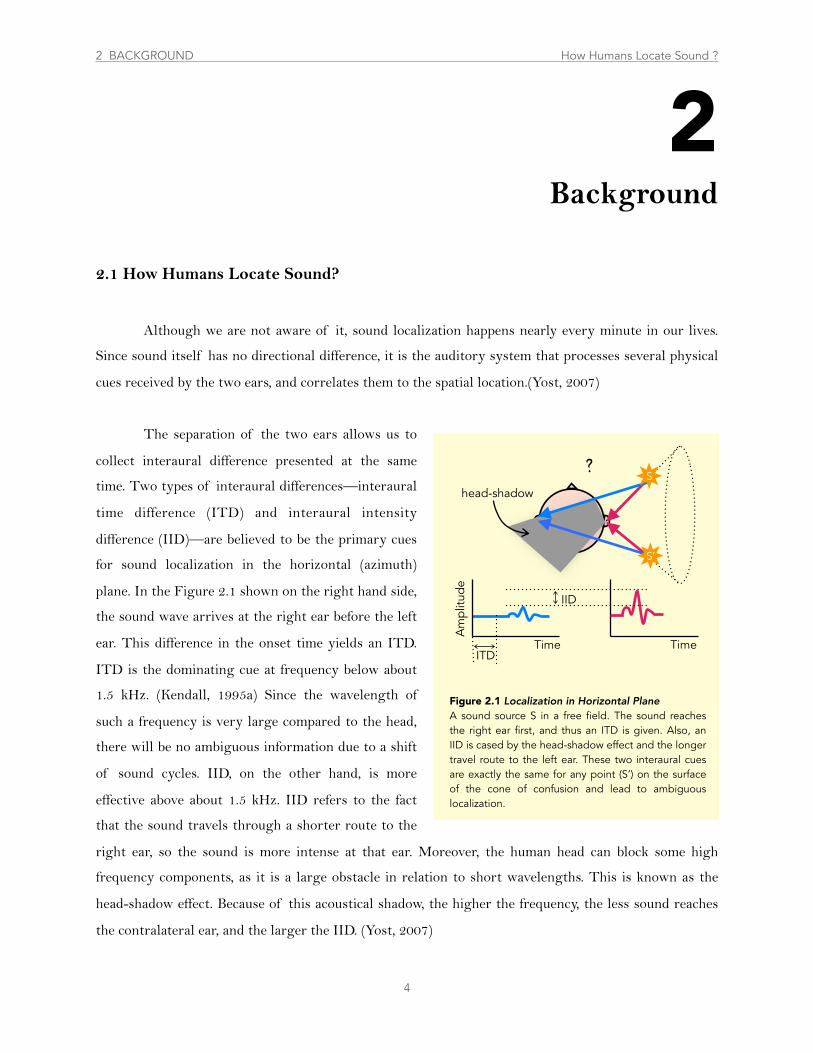
The separation of the two ears allows us to
collect interaural difference presented at the same
time. Two types of interaural differences––interaural
time difference (ITD) and interaural intensity
difference (IID)––are believed to be the primary cues
for sound localization in the horizontal (azimuth)
plane. In the Figure 2.1 shown on the right hand side,
the sound wave arrives at the right ear before the left
ear. This difference in the onset time yields an ITD.
ITD is the dominating cue at frequency below about
1.5 kHz. (Kendall, 1995a) Since the wavelength of
such a frequency is very large compared to the head,
there will be no ambiguous information due to a shift
of sound cycles. IID, on the other hand, is more
effective above about 1.5 kHz. IID refers to the fact
that the sound travels through a shorter route to the
right ear, so the sound is more intense at that ear. Moreover, the human head can block some high
frequency components, as it is a large obstacle in relation to short wavelengths. This is known as the
head-shadow effect. Because of this acoustical shadow, the higher the frequency, the less sound reaches
the contralateral ear, and the larger the IID. (Yost, 2007)
4
2 BACKGROUND How Humans Locate Sound ?x
Figure 2.1 Localization in Horizontal Plane A sound source S in a free field. The sound reaches the right ear first, and thus an ITD is given. Also, an IID is cased by the head-shadow effect and the longer travel route to the left ear. These two interaural cues are exactly the same for any point (S’) on the surface of the cone of confusion and lead to ambiguous localization.
Time Time
head-shadowS
Am
plitu
de
IID
ITD
S’
�
2Background
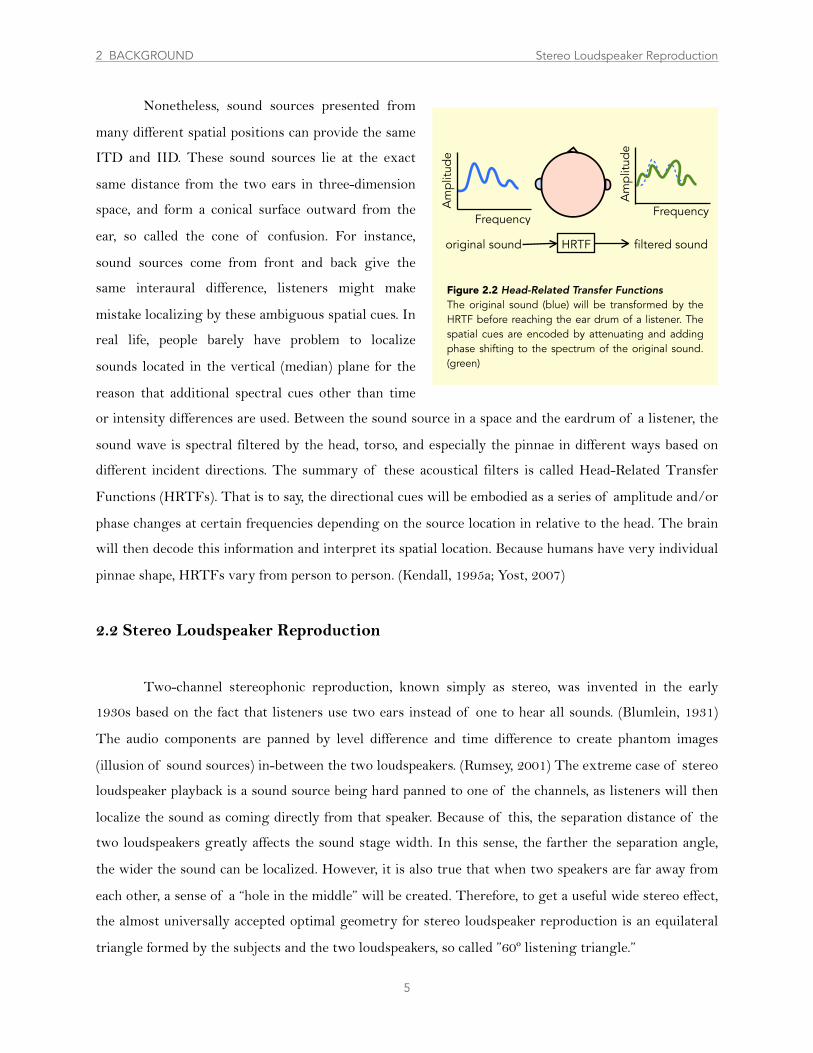
Nonetheless, sound sources presented from
many different spatial positions can provide the same
ITD and IID. These sound sources lie at the exact
same distance from the two ears in three-dimension
space, and form a conical surface outward from the
ear, so called the cone of confusion. For instance,
sound sources come from front and back give the
same interaural difference, listeners might make
mistake localizing by these ambiguous spatial cues. In
real life, people barely have problem to localize
sounds located in the vertical (median) plane for the
reason that additional spectral cues other than time
or intensity differences are used. Between the sound source in a space and the eardrum of a listener, the
sound wave is spectral filtered by the head, torso, and especially the pinnae in different ways based on
different incident directions. The summary of these acoustical filters is called Head-Related Transfer
Functions (HRTFs). That is to say, the directional cues will be embodied as a series of amplitude and/or
phase changes at certain frequencies depending on the source location in relative to the head. The brain
will then decode this information and interpret its spatial location. Because humans have very individual
pinnae shape, HRTFs vary from person to person. (Kendall, 1995a; Yost, 2007)
2.2 Stereo Loudspeaker Reproduction
Two-channel stereophonic reproduction, known simply as stereo, was invented in the early
1930s based on the fact that listeners use two ears instead of one to hear all sounds. (Blumlein, 1931)
The audio components are panned by level difference and time difference to create phantom images
(illusion of sound sources) in-between the two loudspeakers. (Rumsey, 2001) The extreme case of stereo
loudspeaker playback is a sound source being hard panned to one of the channels, as listeners will then
localize the sound as coming directly from that speaker. Because of this, the separation distance of the
two loudspeakers greatly affects the sound stage width. In this sense, the farther the separation angle,
the wider the sound can be localized. However, it is also true that when two speakers are far away from
each other, a sense of a “hole in the middle” will be created. Therefore, to get a useful wide stereo effect,
the almost universally accepted optimal geometry for stereo loudspeaker reproduction is an equilateral
triangle formed by the subjects and the two loudspeakers, so called ”60º listening triangle.”
5
Figure 2.2 Head-Related Transfer FunctionsThe original sound (blue) will be transformed by the HRTF before reaching the ear drum of a listener. The spatial cues are encoded by attenuating and adding phase shifting to the spectrum of the original sound. (green)
Frequency
Am
plitu
de
Frequency
Am
plitu
de
original sound HRTF filtered sound
2 BACKGROUND Stereo Loudspeaker Reproduction d
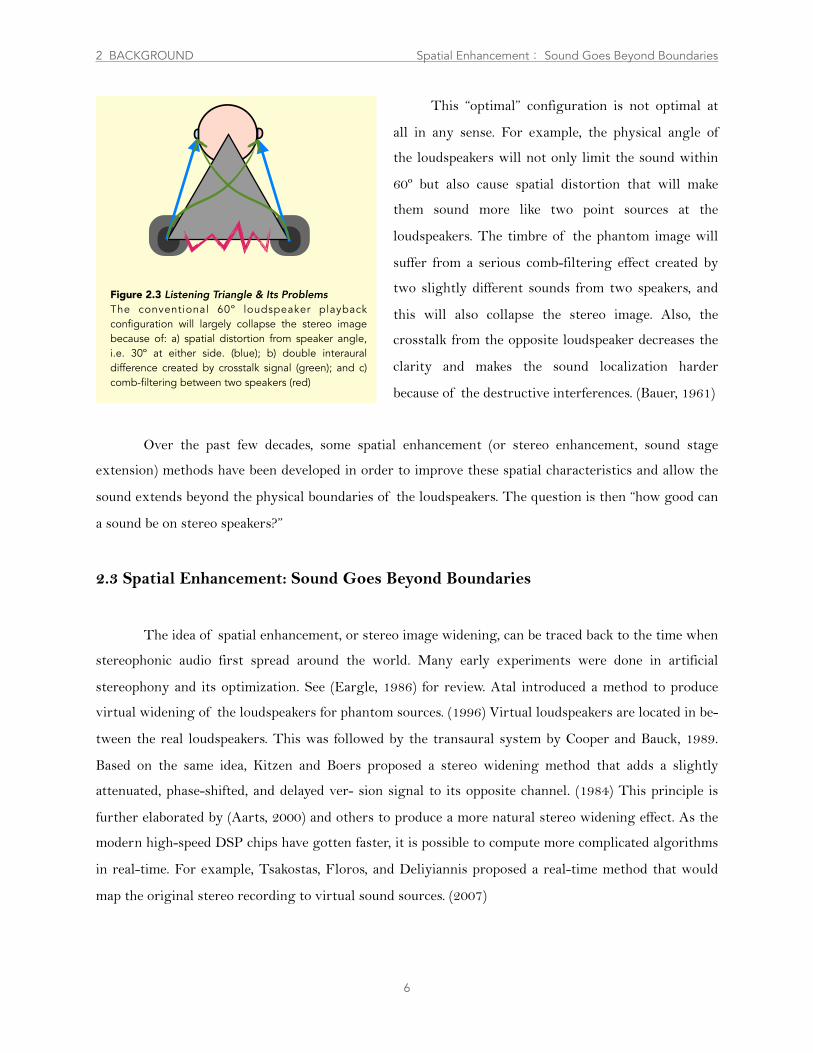
This “optimal” configuration is not optimal at
all in any sense. For example, the physical angle of
the loudspeakers will not only limit the sound within
60º but also cause spatial distortion that will make
them sound more like two point sources at the
loudspeakers. The timbre of the phantom image will
suffer from a serious comb-filtering effect created by
two slightly different sounds from two speakers, and
this will also collapse the stereo image. Also, the
crosstalk from the opposite loudspeaker decreases the
clarity and makes the sound localization harder
because of the destructive interferences. (Bauer, 1961)
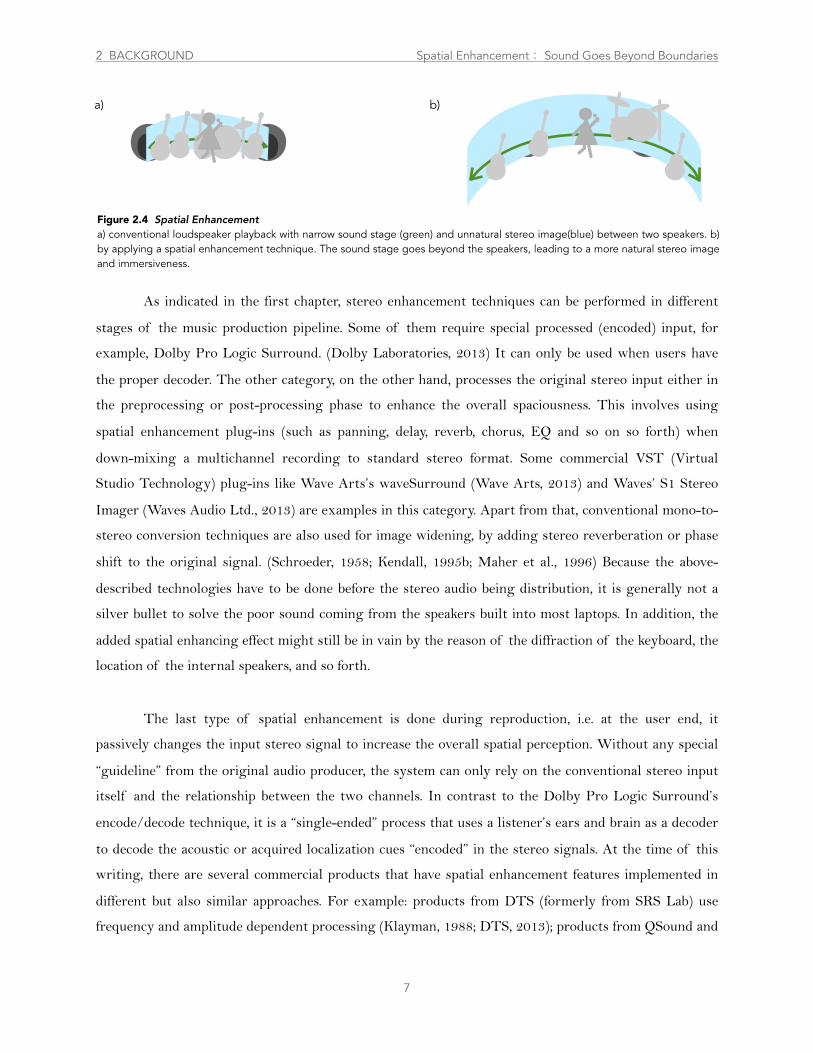
Over the past few decades, some spatial enhancement (or stereo enhancement, sound stage
extension) methods have been developed in order to improve these spatial characteristics and allow the
sound extends beyond the physical boundaries of the loudspeakers. The question is then “how good can
a sound be on stereo speakers?”
2.3 Spatial Enhancement: Sound Goes Beyond Boundaries
The idea of spatial enhancement, or stereo image widening, can be traced back to the time when
stereophonic audio first spread around the world. Many early experiments were done in artificial
stereophony and its optimization. See (Eargle, 1986) for review. Atal introduced a method to produce
virtual widening of the loudspeakers for phantom sources. (1996) Virtual loudspeakers are located in be-
tween the real loudspeakers. This was followed by the transaural system by Cooper and Bauck, 1989.
Based on the same idea, Kitzen and Boers proposed a stereo widening method that adds a slightly
attenuated, phase-shifted, and delayed ver- sion signal to its opposite channel. (1984) This principle is
further elaborated by (Aarts, 2000) and others to produce a more natural stereo widening effect. As the
modern high-speed DSP chips have gotten faster, it is possible to compute more complicated algorithms
in real-time. For example, Tsakostas, Floros, and Deliyiannis proposed a real-time method that would
map the original stereo recording to virtual sound sources. (2007)
6
2 BACKGROUND Spatial Enhancement� Sound Goes Beyond Boundaries
Figure 2.3 Listening Triangle & Its Problems The conventional 60º loudspeaker playback configuration will largely collapse the stereo image because of: a) spatial distortion from speaker angle, i.e. 30º at either side. (blue); b) double interaural difference created by crosstalk signal (green); and c) comb-filtering between two speakers (red)
As indicated in the first chapter, stereo enhancement techniques can be performed in different
stages of the music production pipeline. Some of them require special processed (encoded) input, for
example, Dolby Pro Logic Surround. (Dolby Laboratories, 2013) It can only be used when users have
the proper decoder. The other category, on the other hand, processes the original stereo input either in
the preprocessing or post-processing phase to enhance the overall spaciousness. This involves using
spatial enhancement plug-ins (such as panning, delay, reverb, chorus, EQ and so on so forth) when
down-mixing a multichannel recording to standard stereo format. Some commercial VST (Virtual
Studio Technology) plug-ins like Wave Arts’s waveSurround (Wave Arts, 2013) and Waves’ S1 Stereo
Imager (Waves Audio Ltd., 2013) are examples in this category. Apart from that, conventional mono-to-
stereo conversion techniques are also used for image widening, by adding stereo reverberation or phase
shift to the original signal. (Schroeder, 1958; Kendall, 1995b; Maher et al., 1996) Because the above-
described technologies have to be done before the stereo audio being distribution, it is generally not a
silver bullet to solve the poor sound coming from the speakers built into most laptops. In addition, the
added spatial enhancing effect might still be in vain by the reason of the diffraction of the keyboard, the
location of the internal speakers, and so forth.
The last type of spatial enhancement is done during reproduction, i.e. at the user end, it
passively changes the input stereo signal to increase the overall spatial perception. Without any special
“guideline” from the original audio producer, the system can only rely on the conventional stereo input
itself and the relationship between the two channels. In contrast to the Dolby Pro Logic Surround’s
encode/decode technique, it is a “single-ended” process that uses a listener’s ears and brain as a decoder
to decode the acoustic or acquired localization cues “encoded” in the stereo signals. At the time of this
writing, there are several commercial products that have spatial enhancement features implemented in
different but also similar approaches. For example: products from DTS (formerly from SRS Lab) use
frequency and amplitude dependent processing (Klayman, 1988; DTS, 2013); products from QSound and
7
a) b)
Figure 2.4 Spatial Enhancement a) conventional loudspeaker playback with narrow sound stage (green) and unnatural stereo image(blue) between two speakers. b) by applying a spatial enhancement technique. The sound stage goes beyond the speakers, leading to a more natural stereo image and immersiveness.
2 BACKGROUND Spatial Enhancement� Sound Goes Beyond Boundaries
Harman, on the other hand, make use of generalized HRTFs. (Lowe & Lees, 1991; QSound Lab, 2012;
Harman, 2013) The method proposed in this paper also belongs to this category. As mentioned in the
first chapter, this is the most flexible method among all spatial enhancement techniques since it doesn’t
require prepared audio, and thus ideal for laptop listening purposes. Nonetheless, just like a coin, there
are two sides to passive spatial enhancement, as it has the risk of making the playback sound even
worser than before because the system passively applies the same processing to every audio contents.
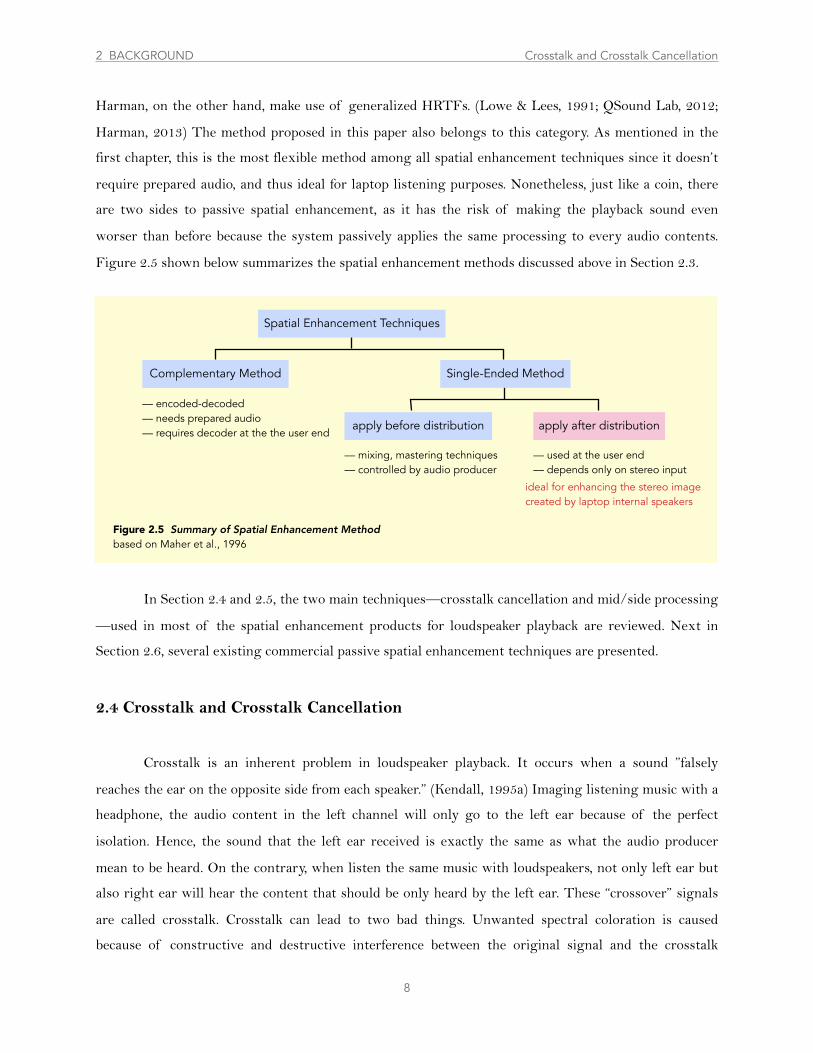
Figure 2.5 shown below summarizes the spatial enhancement methods discussed above in Section 2.3.
In Section 2.4 and 2.5, the two main techniques—crosstalk cancellation and mid/side processing
—used in most of the spatial enhancement products for loudspeaker playback are reviewed. Next in
Section 2.6, several existing commercial passive spatial enhancement techniques are presented.
2.4 Crosstalk and Crosstalk Cancellation
Crosstalk is an inherent problem in loudspeaker playback. It occurs when a sound ”falsely
reaches the ear on the opposite side from each speaker.” (Kendall, 1995a) Imaging listening music with a
headphone, the audio content in the left channel will only go to the left ear because of the perfect
isolation. Hence, the sound that the left ear received is exactly the same as what the audio producer
mean to be heard. On the contrary, when listen the same music with loudspeakers, not only left ear but
also right ear will hear the content that should be only heard by the left ear. These “crossover” signals
are called crosstalk. Crosstalk can lead to two bad things. Unwanted spectral coloration is caused
because of constructive and destructive interference between the original signal and the crosstalk
8
–– encoded-decoded–– needs prepared audio–– requires decoder at the the user end
–– mixing, mastering techniques–– controlled by audio producer
–– used at the user end–– depends only on stereo input
Spatial Enhancement Techniques
Complementary Method
apply before distribution apply after distribution
Single-Ended Method
ideal for enhancing the stereo image created by laptop internal speakers
Figure 2.5 Summary of Spatial Enhancement Method based on Maher et al., 1996
2 BACKGROUND Crosstalk and Crosstalk Cancellation d
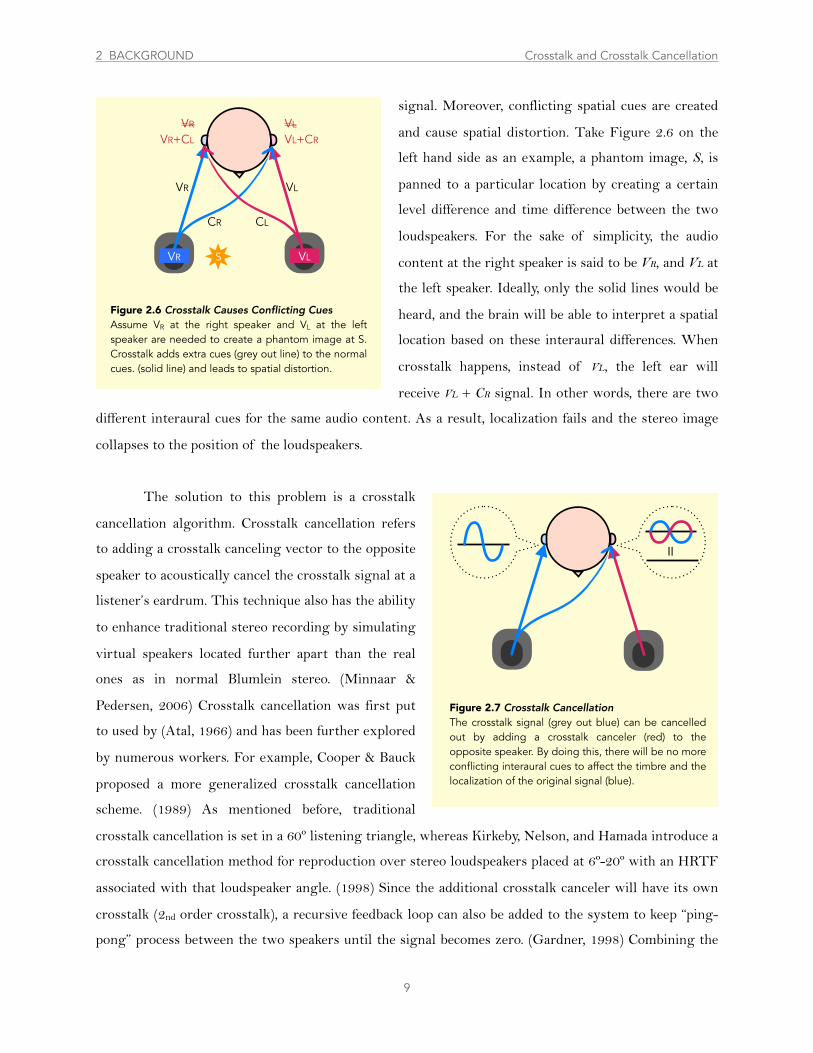
signal. Moreover, conflicting spatial cues are created
and cause spatial distortion. Take Figure 2.6 on the
left hand side as an example, a phantom image, S, is
panned to a particular location by creating a certain
level difference and time difference between the two
loudspeakers. For the sake of simplicity, the audio
content at the right speaker is said to be VR, and VL at
the left speaker. Ideally, only the solid lines would be
heard, and the brain will be able to interpret a spatial
location based on these interaural differences. When
crosstalk happens, instead of VL, the left ear will
receive VL + CR signal. In other words, there are two
different interaural cues for the same audio content. As a result, localization fails and the stereo image
collapses to the position of the loudspeakers.
The solution to this problem is a crosstalk
cancellation algorithm. Crosstalk cancellation refers
to adding a crosstalk canceling vector to the opposite
speaker to acoustically cancel the crosstalk signal at a
listener’s eardrum. This technique also has the ability
to enhance traditional stereo recording by simulating
virtual speakers located further apart than the real
ones as in normal Blumlein stereo. (Minnaar &
Pedersen, 2006) Crosstalk cancellation was first put
to used by (Atal, 1966) and has been further explored
by numerous workers. For example, Cooper & Bauck
proposed a more generalized crosstalk cancellation
scheme. (1989) As mentioned before, traditional
crosstalk cancellation is set in a 60º listening triangle, whereas Kirkeby, Nelson, and Hamada introduce a
crosstalk cancellation method for reproduction over stereo loudspeakers placed at 6º-20º with an HRTF
associated with that loudspeaker angle. (1998) Since the additional crosstalk canceler will have its own
crosstalk (2nd order crosstalk), a recursive feedback loop can also be added to the system to keep “ping-
pong” process between the two speakers until the signal becomes zero. (Gardner, 1998) Combining the
9
Figure 2.7 Crosstalk CancellationThe crosstalk signal (grey out blue) can be cancelled out by adding a crosstalk canceler (red) to the opposite speaker. By doing this, there will be no more conflicting interaural cues to affect the timbre and the localization of the original signal (blue).
||
Figure 2.6 Crosstalk Causes Conflicting CuesAssume VR at the right speaker and VL at the left speaker are needed to create a phantom image at S. Crosstalk adds extra cues (grey out line) to the normal cues. (solid line) and leads to spatial distortion.
SVR
VR VL
CR CL
VL
VL+CR
VR
VR+CL
VL
2 BACKGROUND Crosstalk and Crosstalk Cancellation d
two, the RACE (Recursive Ambiophonic Crosstalk Elimination) algorithm is designed for loudspeakers
spaced at a 24º angle or less and theoretically yields a stereo image up to 180º wide and a broader
listening area without HRTF convolution. (Glasgal, 2007; Glasgal, 2009) The standard was to use
generalized HRTFs to represent the angles of the two physical loudspeakers for crosstalk cancellation.
(Kendall, 1995; Rumsey, 2001)
In short, crosstalk cancellation is a loudspeaker-only technique. With properly positioned
speakers, it has potential to create stunning binaural experiences. The placement of the external
loudspeakers is relatively critical so that any tiny deviation will lead the playback audio sound worse
than the original. (Kraemer, 2001) However, it is still the most ideal technique for multimedia system,
such as television and computer, because listeners are located in a known and relatively fixed position in
front of the screen. (Maher et al., 1996; Rumsey, 2001) Most of the plug-ins that aim to enhance the
spatial perceptions through loudspeaker playback perform crosstalk cancellation either with an HRTF
filter or with an inverted, delayed, and attenuated signal.
2.5 Mid/Side Processing
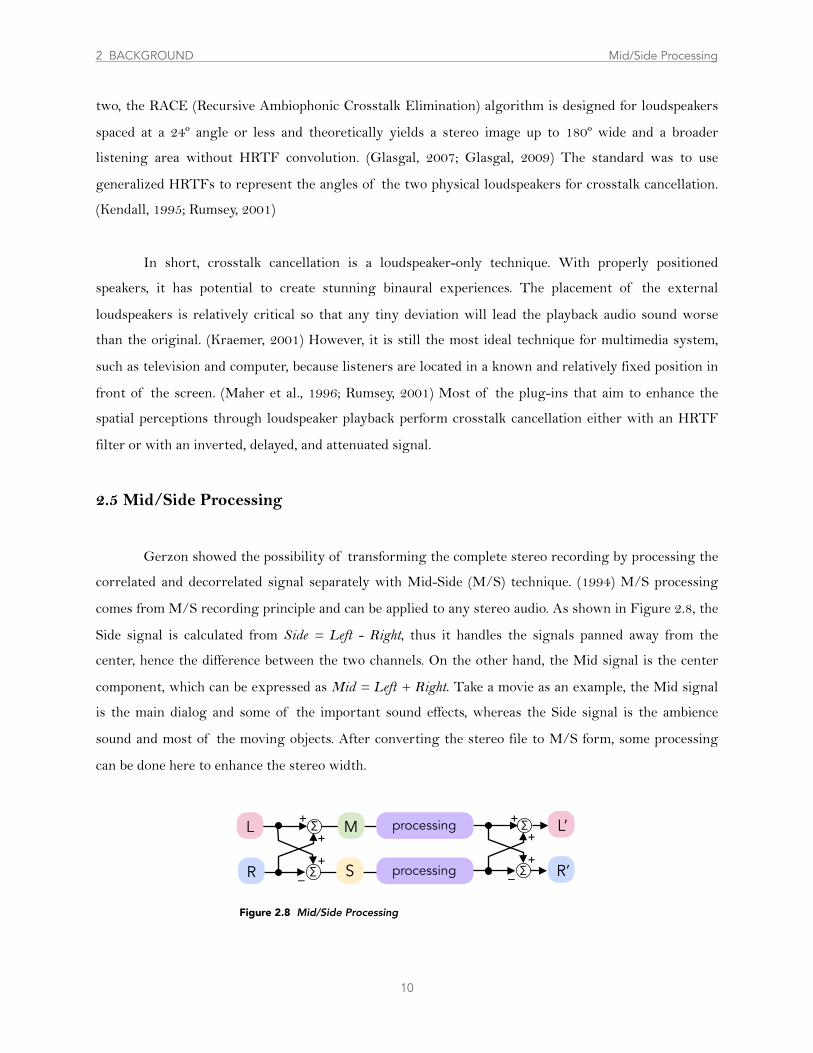
Gerzon showed the possibility of transforming the complete stereo recording by processing the
correlated and decorrelated signal separately with Mid-Side (M/S) technique. (1994) M/S processing
comes from M/S recording principle and can be applied to any stereo audio. As shown in Figure 2.8, the
Side signal is calculated from Side = Left - Right, thus it handles the signals panned away from the
center, hence the difference between the two channels. On the other hand, the Mid signal is the center
component, which can be expressed as Mid = Left + Right. Take a movie as an example, the Mid signal
is the main dialog and some of the important sound effects, whereas the Side signal is the ambience
sound and most of the moving objects. After converting the stereo file to M/S form, some processing
can be done here to enhance the stereo width.
10
+
–
∑
∑
+
+
L’
R’
∑
∑
L
R
M
S
++
+–
processing
processing
Figure 2.8 Mid/Side Processing
2 BACKGROUND Mid/Side Processing

The easiest way is to simply bring up the gain of the Side signal in order to boost the
decorrelation components, and then convert back to Left and Right channel. (Senior, 2012) The same
equation can be expressed as another way to give one more example. Say Left = Mid + SideL and Right =
Mid + SideR, where SideL and SideR is the left-only and the right-only sound respectively. Therefore,
adding the Side signal back to the Left channel will be Left + Side = Mid + 2SideL - SideR, in which the
left-only side component is boosted and the invert right-only component helps to cancel the crosstalk, as
mentioned previously, to give more spaciousness. (Maher et al., 1996) The same process could be done
for right channel. One other possibility is to further decorrelate the signal during the process. Say, there
are two channels presented to the listeners, a low degree of correlation between the two channels will
give more spatial impression leading to wider perceived sound stage through stereo loudspeaker
playback. (Kurozumi & Ohgushi, 1983; Kendall, 1995b) Decorrelation is often included in a spatial
enhancement plug-in which is involved with M/S processing. Many of the simple spatial enhancement
plug-ins employ M/S techniques, and most of them are freeware. Apart from those, this technique is
also incorporated in some commercial software but in a more complex form. For example, SRS iWOW
uses frequency-dependent M/S processing. (DTS, 2013)
2.6 A Brief Review of Commercial Passive Spatial Enhancement Products
In this section, several existing commercial products with passive spatial enhancement feature
are briefly introduced. It is important to note that all the block diagrams and the technical descriptions
are simply based on the author’s own interpretation of the patents and white papers of each companies.
That is to say, the mentioned companies do not verify any of the statements made in this section.
2.6.1 QSound Labs, Inc.
Starting in the early 1990s, the technologies of QSound Lab are mature and well developed.
QXpander is introduced as software as early as 1994. Now it is only available as a bipolar analog chip.
QXpander performs on already-mixed stereo files intending to produce a stereo output with increased
sound stage width. The technique is patented in U.S. Patent #5,046,097, which filed at Sep. 2, 1988, and
issued at Sep. 3 1991. (Lowe & Lees, 1991) Experimenting on how humans localize sound sources
reproduced by stereo loudspeakers, QSound Lab gathered over 550,000 subjective test data (QSound
Lab, 1998) to form an HRTF crosstalk cancellation algorithm for stereo speakers.
11
2 BACKGROUND A Brief Review of Commercial Passive Spatial Enhancement Products d
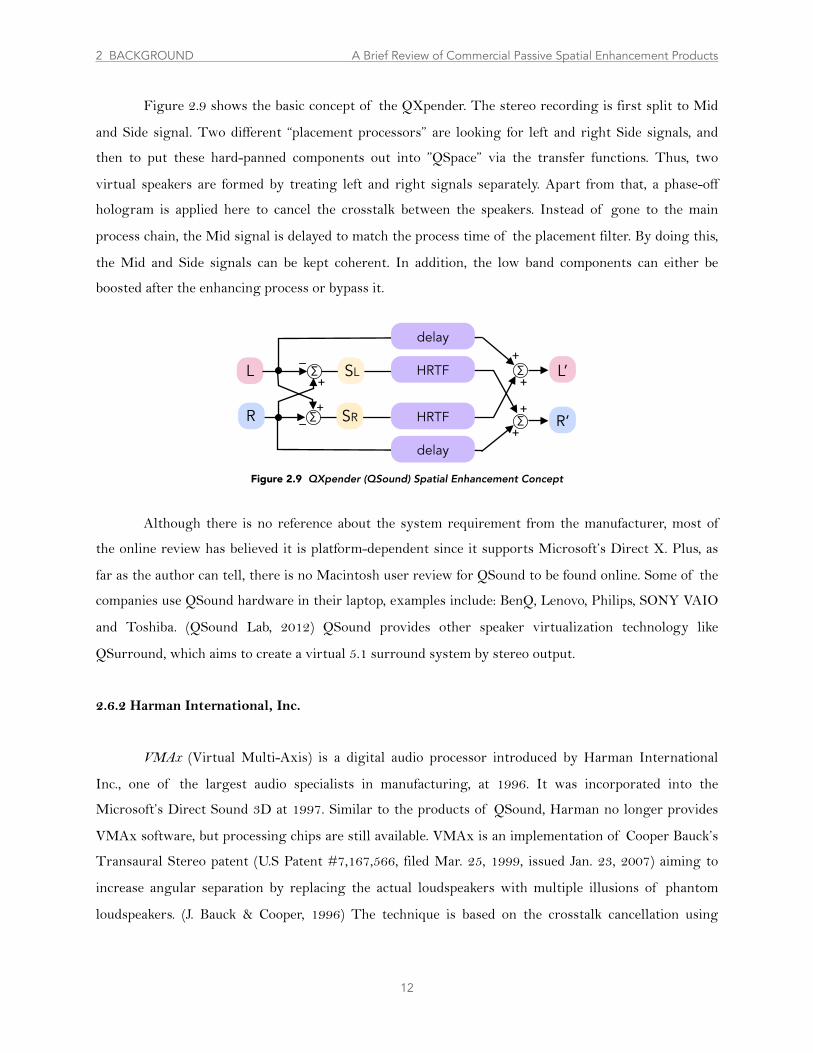
Figure 2.9 shows the basic concept of the QXpender. The stereo recording is first split to Mid
and Side signal. Two different “placement processors” are looking for left and right Side signals, and
then to put these hard-panned components out into ”QSpace” via the transfer functions. Thus, two
virtual speakers are formed by treating left and right signals separately. Apart from that, a phase-off
hologram is applied here to cancel the crosstalk between the speakers. Instead of gone to the main
process chain, the Mid signal is delayed to match the process time of the placement filter. By doing this,
the Mid and Side signals can be kept coherent. In addition, the low band components can either be
boosted after the enhancing process or bypass it.
Although there is no reference about the system requirement from the manufacturer, most of
the online review has believed it is platform-dependent since it supports Microsoft’s Direct X. Plus, as
far as the author can tell, there is no Macintosh user review for QSound to be found online. Some of the
companies use QSound hardware in their laptop, examples include: BenQ, Lenovo, Philips, SONY VAIO
and Toshiba. (QSound Lab, 2012) QSound provides other speaker virtualization technology like
QSurround, which aims to create a virtual 5.1 surround system by stereo output.
2.6.2 Harman International, Inc.
VMAx (Virtual Multi-Axis) is a digital audio processor introduced by Harman International
Inc., one of the largest audio specialists in manufacturing, at 1996. It was incorporated into the
Microsoft’s Direct Sound 3D at 1997. Similar to the products of QSound, Harman no longer provides
VMAx software, but processing chips are still available. VMAx is an implementation of Cooper Bauck’s
Transaural Stereo patent (U.S Patent #7,167,566, filed Mar. 25, 1999, issued Jan. 23, 2007) aiming to
increase angular separation by replacing the actual loudspeakers with multiple illusions of phantom
loudspeakers. (J. Bauck & Cooper, 1996) The technique is based on the crosstalk cancellation using
12
Figure 2.9 QXpender (QSound) Spatial Enhancement Concept
∑
∑
L’
R’
HRTF
HRTF
+
+
+
+
SL
SR
∑
∑
L
R
+
+–
–
delay
delay
2 BACKGROUND A Brief Review of Commercial Passive Spatial Enhancement Products d
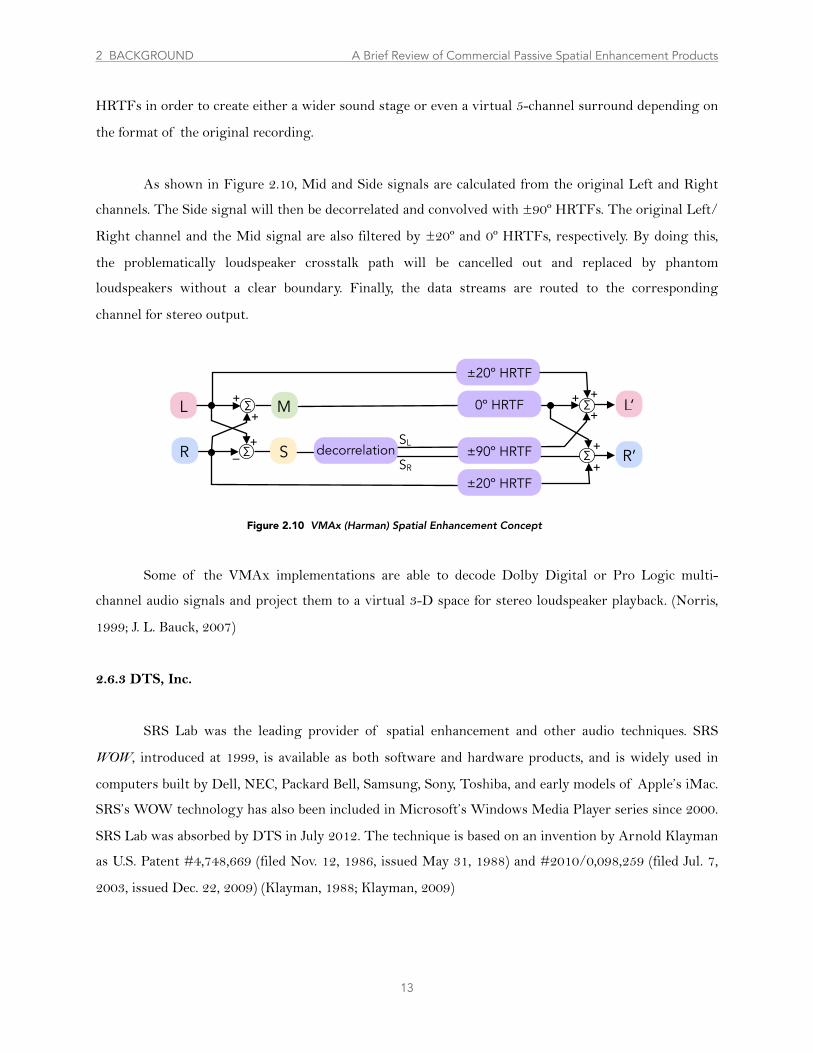
HRTFs in order to create either a wider sound stage or even a virtual 5-channel surround depending on
the format of the original recording.
As shown in Figure 2.10, Mid and Side signals are calculated from the original Left and Right
channels. The Side signal will then be decorrelated and convolved with ±90º HRTFs. The original Left/
Right channel and the Mid signal are also filtered by ±20º and 0º HRTFs, respectively. By doing this,
the problematically loudspeaker crosstalk path will be cancelled out and replaced by phantom
loudspeakers without a clear boundary. Finally, the data streams are routed to the corresponding
channel for stereo output.
Some of the VMAx implementations are able to decode Dolby Digital or Pro Logic multi-
channel audio signals and project them to a virtual 3-D space for stereo loudspeaker playback. (Norris,
1999; J. L. Bauck, 2007)
2.6.3 DTS, Inc.
SRS Lab was the leading provider of spatial enhancement and other audio techniques. SRS
WOW, introduced at 1999, is available as both software and hardware products, and is widely used in
computers built by Dell, NEC, Packard Bell, Samsung, Sony, Toshiba, and early models of Apple’s iMac.
SRS’s WOW technology has also been included in Microsoft’s Windows Media Player series since 2000.
SRS Lab was absorbed by DTS in July 2012. The technique is based on an invention by Arnold Klayman
as U.S. Patent #4,748,669 (filed Nov. 12, 1986, issued May 31, 1988) and #2010/0,098,259 (filed Jul. 7,
2003, issued Dec. 22, 2009) (Klayman, 1988; Klayman, 2009)
13
Figure 2.10 VMAx (Harman) Spatial Enhancement Concept
∑
∑
L’
R’
∑
∑
L
R
M
S
++
+– decorrelation
±20º HRTF
0º HRTF
±90º HRTF
±20º HRTF
SL
SR
+
+
+
+
+
2 BACKGROUND A Brief Review of Commercial Passive Spatial Enhancement Products d
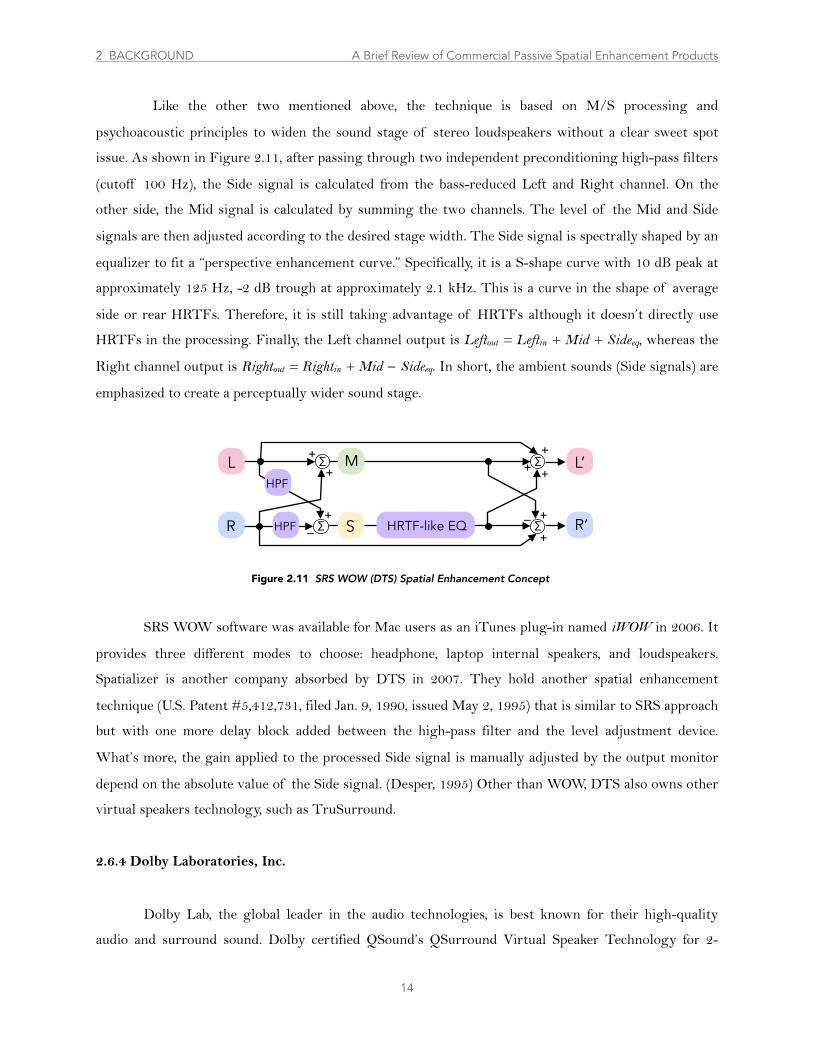
Like the other two mentioned above, the technique is based on M/S processing and
psychoacoustic principles to widen the sound stage of stereo loudspeakers without a clear sweet spot
issue. As shown in Figure 2.11, after passing through two independent preconditioning high-pass filters
(cutoff 100 Hz), the Side signal is calculated from the bass-reduced Left and Right channel. On the
other side, the Mid signal is calculated by summing the two channels. The level of the Mid and Side
signals are then adjusted according to the desired stage width. The Side signal is spectrally shaped by an
equalizer to fit a “perspective enhancement curve.” Specifically, it is a S-shape curve with 10 dB peak at
approximately 125 Hz, -2 dB trough at approximately 2.1 kHz. This is a curve in the shape of average
side or rear HRTFs. Therefore, it is still taking advantage of HRTFs although it doesn’t directly use
HRTFs in the processing. Finally, the Left channel output is Leftout = Leftin + Mid + Sideeq, whereas the
Right channel output is Rightout = Rightin + Mid − Sideeq. In short, the ambient sounds (Side signals) are
emphasized to create a perceptually wider sound stage.
SRS WOW software was available for Mac users as an iTunes plug-in named iWOW in 2006. It
provides three different modes to choose: headphone, laptop internal speakers, and loudspeakers.
Spatializer is another company absorbed by DTS in 2007. They hold another spatial enhancement
technique (U.S. Patent #5,412,731, filed Jan. 9, 1990, issued May 2, 1995) that is similar to SRS approach
but with one more delay block added between the high-pass filter and the level adjustment device.
What’s more, the gain applied to the processed Side signal is manually adjusted by the output monitor
depend on the absolute value of the Side signal. (Desper, 1995) Other than WOW, DTS also owns other
virtual speakers technology, such as TruSurround.
2.6.4 Dolby Laboratories, Inc.
Dolby Lab, the global leader in the audio technologies, is best known for their high-quality
audio and surround sound. Dolby certified QSound’s QSurround Virtual Speaker Technology for 2-
14
Figure 2.11 SRS WOW (DTS) Spatial Enhancement Concept
L
R
M
S
∑+
+
∑+
–HPF
HPF
HRTF-like EQ
L’
R’
∑+ +
∑+–
+
+
2 BACKGROUND A Brief Review of Commercial Passive Spatial Enhancement Products d
channel source applications at 1998. Four years later, Dolby, co-developed with Lake Technology, Ltd.,
launched Dolby Virtual Speaker project that aims to create immersive 5.1-speaker system audio
experience using two laptop speakers. Lake Technology became a part of Dolby at 2004. Dolby Virtual
Speaker is refers to as the Surround Virtualizer later and integrated to Dolby Home Theater suit as one
of the features. Since it is optimized for each model individually, Dolby Home Theater is not available
for direct purchase. Dolby Home Theater v4 is introduced in 2011, and is included by several models
from Acer, HP, Lenovo, Sony, and Toshiba. (Dolby Labs, 2013) It is hard to tell which patent hold by
former Lake Technology is the core algorithm that Dolby Virtual Speaker based on. Figure 2.12
illustrates the basic concept of Dolby’s approach from a newer patent. (U.S. Patent #2011/0,243,338,
filed Dec. 1, 2009, issued Oct. 6, 2011) (Brown, 2011)
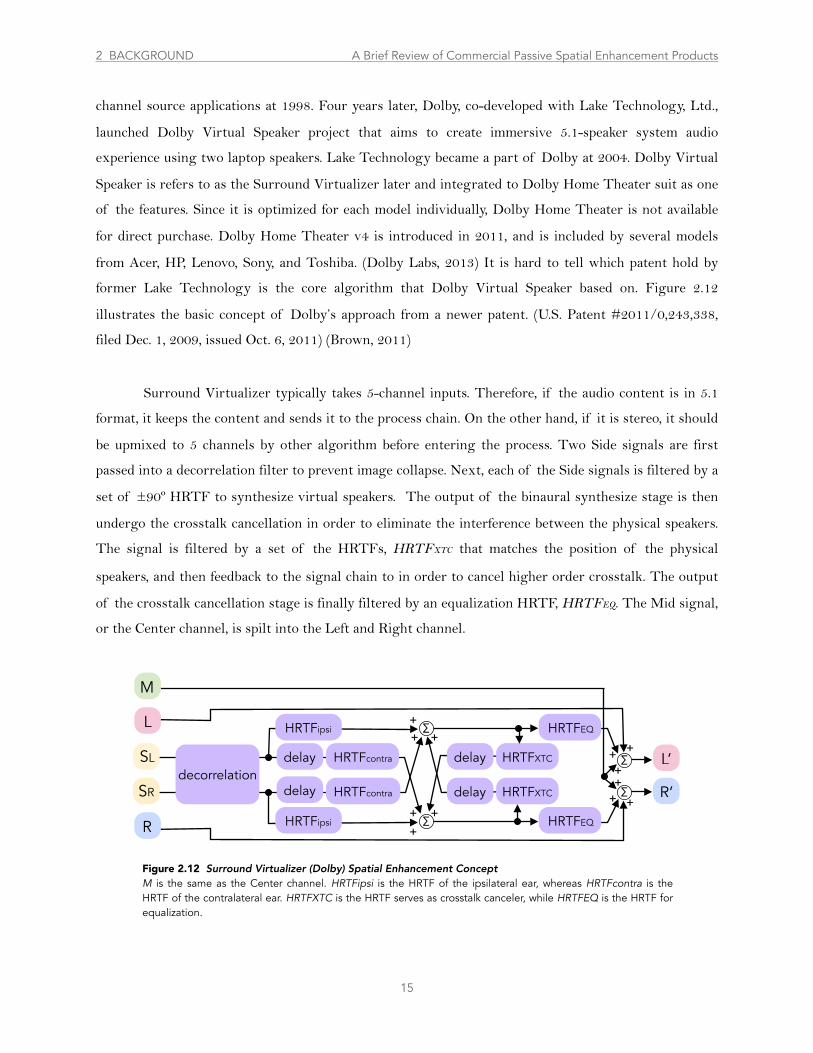
Surround Virtualizer typically takes 5-channel inputs. Therefore, if the audio content is in 5.1
format, it keeps the content and sends it to the process chain. On the other hand, if it is stereo, it should
be upmixed to 5 channels by other algorithm before entering the process. Two Side signals are first
passed into a decorrelation filter to prevent image collapse. Next, each of the Side signals is filtered by a
set of ±90º HRTF to synthesize virtual speakers. The output of the binaural synthesize stage is then
undergo the crosstalk cancellation in order to eliminate the interference between the physical speakers.
The signal is filtered by a set of the HRTFs, HRTFXTC that matches the position of the physical
speakers, and then feedback to the signal chain to in order to cancel higher order crosstalk. The output
of the crosstalk cancellation stage is finally filtered by an equalization HRTF, HRTFEQ. The Mid signal,
or the Center channel, is spilt into the Left and Right channel.
15
Figure 2.12 Surround Virtualizer (Dolby) Spatial Enhancement ConceptM is the same as the Center channel. HRTFipsi is the HRTF of the ipsilateral ear, whereas HRTFcontra is the HRTF of the contralateral ear. HRTFXTC is the HRTF serves as crosstalk canceler, while HRTFEQ is the HRTF for equalization.
L’
R’+
+
L
R
M
∑+
∑
+
+decorrelation
HRTFEQ
HRTFXTC
HRTFipsi
SR
SL HRTFcontra
HRTFipsi
HRTFcontra
delay
delay
∑
∑ HRTFEQ
HRTFXTC
delay
delay
+
++
++
+
+
2 BACKGROUND A Brief Review of Commercial Passive Spatial Enhancement Products d
Although only Side signals are virtualized here, all five channels should be processed in a similar
procedure in order to create full 5-channel virtual surround speakers. Dolby pays attention to the fact
that the HRTFs vary greatly from person to person and a single set of HRTFs will not be suitable for
every listener. In a white paper, Dolby mentioned: “This is important because HRTFs are unique to each
listener; therefore, a “golden” set of HRTFs was chosen, one that works well for the majority of
listeners.” (Dolby Labs, 2012)
2.6.5 3D3A Lab of Princeton University
The 3D3A (3D Audio & Applied Acoustics) Lab is a research lab is led by Dr. Edgar Choueiri
and works on spatial hearing and 3D audio. (Princeton University,2013) Based on BACCH filters,
BACCH 3D Sound is one of their main developments, and a breakthrough in audio industry. BACCH
(Band-Assembled Crosstalk Cancellation Hierarchy) filter aims to reproduce a three-dimensional sonic
space by stereo speakers. It is an optimal crosstalk cancellation filter that will create a flat frequency
response at the loudspeakers. By doing this, all the tonal distortion caused either by the playback
hardware, the speakers, or the crosstalk will be eliminated. BACCH filter is patented in U.S. Patent
#2013/0,163,766 (filed Sep. 1, 2011, issued Jun. 27, 2013) (Choueiri,2013) At 2011, BACCH filter is
included in Jawbone, a portable sound bar. In addition, several BACCH 3D Sound products, for example
BACCH-SP, were introduced to the market at 2013. MASIS Audio is the company outside the US to
provide the at-home installation and calibration service.
Different from all the previously mentioned approaches, BACCH filter doesn’t involve
generalized HRTFs1, it uses actual impulse responses measured from a dummy head or listener’s ear
canals. The program will be based on several acoustic measurements of the a listener’s entire listening
chain––from the hardware to the listener himself––to design a customized filter that suit only for that
particular listener. Without the customized measurement, the spatial image will not be accurate since it
uses general HRTFs. The spectrum coloration is controlled by the frequency-dependent regularization
parameter (FDRP). FRDP applies different filters to different frequencies in the measured result and an
optimal crosstalk cancellation filter can be designed. Since the filters can be stored in an accompany
software, it can be designed for a pair loudspeakers in any geometric configuration. Multiple sweet spots
are achieved by adding motion capturing device. (Choueiri, 2010)
16
1 Technical speaking, all of the listening activity involve with the HRTF since people listen with their own head and ears––their own HRTF. The HRTF convolution here means the use of any kind of HRTF filtering in a DSP chain.
2 BACKGROUND A Brief Review of Commercial Passive Spatial Enhancement Products d
2.6.6 Other Commercial Products
There are some other hardware developed based on Microsoft’s DirectSound 3D (D3D) or Aureal
3D (A3D) audio API (application programming interfaces). Examples include Creative Technology’s
Sound Blaster Audigy and Turtle Beach’s Montego DDL. Some other technologies that is rarely used
today includes Creative Lab’s EAX and Sensaura’s S-3DPA. All of them are sound card that take
advantage of HRTF filters and crosstalk cancellation.
In terms of commercial software for spatial enhancement, one of the examples is Prosoft
Engineering, Inc.’s Hear, formerly named 4Font OSS3D. It is a plug-in for music players and operates on
Windows and Linux platform. The DFX Audio Enhancer introduced by FXSound (formerly Power
Technology) and SOrient’s SoftAmp Virtual Sound are plug-in for Windows. Those are all examples
that aim to create an illusion of virtual surround sound through stereo speakers using HRTFs.
17
2 BACKGROUND A Brief Review of Commercial Passive Spatial Enhancement Products d
3.1 Whose Ears Should We Listen With?
All of the technologies mentioned in the previous section use either analyzed or measured
HRTFs to enhance immersion. Most of them are virtual speakers technologies as they use HRTFs to
recreate virtual sources of a multichannel surround system. It is conventional to use generalized
HRTFs to create virtual speakers or to cancel crosstalk. As noted, HRTFs are very individualized, so
none of the generalized HRTFs can compete with a listener’s own. Listening with someone else’s “ear”
can cause spatial distortion resulting degraded sound localization. Although a 1998 research shows that
human is able to adapt to the new “ears” within 3-6 weeks, there was still only one set of HRTFs is used
in this adaption experiment since the researcher blocked subjects’ pinnae. (Hofman, Van Riswick, & Van
Opstal, 1998) On the contrary, when people listen to HRTFs-related virtual speakers through physical
loudspeakers, the convolved generalized HRTFs will be superimposed on top of their own HRTFs, and
consequently they listen with two pairs of “ears.”
On the other side, using the HRTFs representing the angles of the two physical loudspeakers is
a widely accepted method for crosstalk cancellation. (Kendall, 1995a; Rumsey, 2001) Since the HRTFs
have fixed angles, a listener needs to stay at the same fixed position as the HRTFs to get the benefit of
the crosstalk cancellation. If a listener moves away from the sweet spot, which accordingly changes the
HRTFs necessary to cancel the crosstalk, the image collapses. (Begault, 1994) In addition, the small
sweet spot makes it not possible for multiple listeners unless they sit in a row along the central line
between the two physical speakers. The sweet spot issue can be solved by using head tracking device.
So, why listening with someone else’s ears?
18
3 METHODOLOGY Whose Ears Should We Listen With? d
3Methodology
3.2 Ambiophonics: The Key to Unlock Worlds of Sonic Reality
Introduced by Ralph Glasgal in the 1980s, Ambiophonics is an HRTF-free method taking
advantage of psychoacoustic principles to project an existing stereo file up to an 180º stage by using
two closely spaced (10º-20º) frontal speakers and a crosstalk cancellation filter. It can also take 5.1
surround sound tracks and achieve a full 360º surround environment without “holes-at-the-sides” by
adding two additional rear speakers. See (Glasgal, 2007; Glasgal, 2009) for a detailed theory of
Ambiophonics.
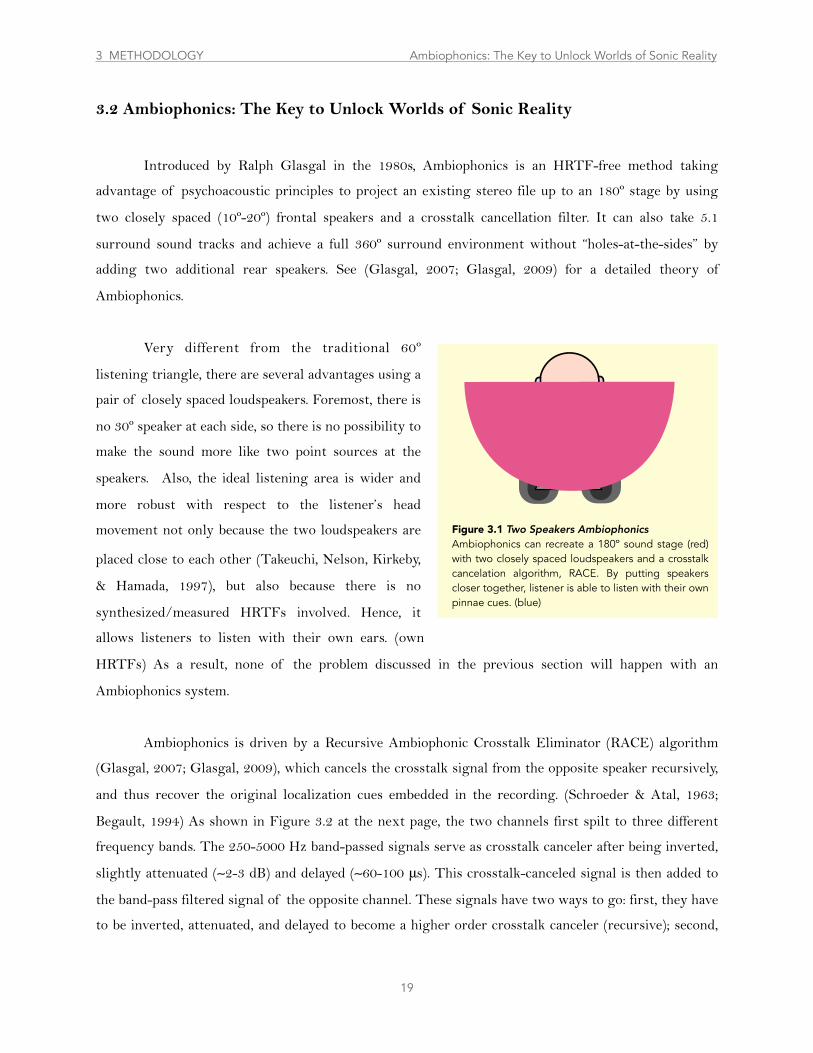
Very different from the traditional 60º
listening triangle, there are several advantages using a
pair of closely spaced loudspeakers. Foremost, there is
no 30º speaker at each side, so there is no possibility to
make the sound more like two point sources at the
speakers. Also, the ideal listening area is wider and
more robust with respect to the listener’s head
movement not only because the two loudspeakers are
placed close to each other (Takeuchi, Nelson, Kirkeby,
& Hamada, 1997), but also because there is no
synthesized/measured HRTFs involved. Hence, it
allows listeners to listen with their own ears. (own
HRTFs) As a result, none of the problem discussed in the previous section will happen with an
Ambiophonics system.
Ambiophonics is driven by a Recursive Ambiophonic Crosstalk Eliminator (RACE) algorithm
(Glasgal, 2007; Glasgal, 2009), which cancels the crosstalk signal from the opposite speaker recursively,
and thus recover the original localization cues embedded in the recording. (Schroeder & Atal, 1963;
Begault, 1994) As shown in Figure 3.2 at the next page, the two channels first spilt to three different
frequency bands. The 250-5000 Hz band-passed signals serve as crosstalk canceler after being inverted,
slightly attenuated (∼2-3 dB) and delayed (∼60-100 μs). This crosstalk-canceled signal is then added to
the band-pass filtered signal of the opposite channel. These signals have two ways to go: first, they have
to be inverted, attenuated, and delayed to become a higher order crosstalk canceler (recursive); second,
19
Figure 3.1 Two Speakers Ambiophonics Ambiophonics can recreate a 180º sound stage (red) with two closely spaced loudspeakers and a crosstalk cancelation algorithm, RACE. By putting speakers closer together, listener is able to listen with their own pinnae cues. (blue)
3 METHODOLOGY Ambiophonics: The Key to Unlock Worlds of Sonic Reality
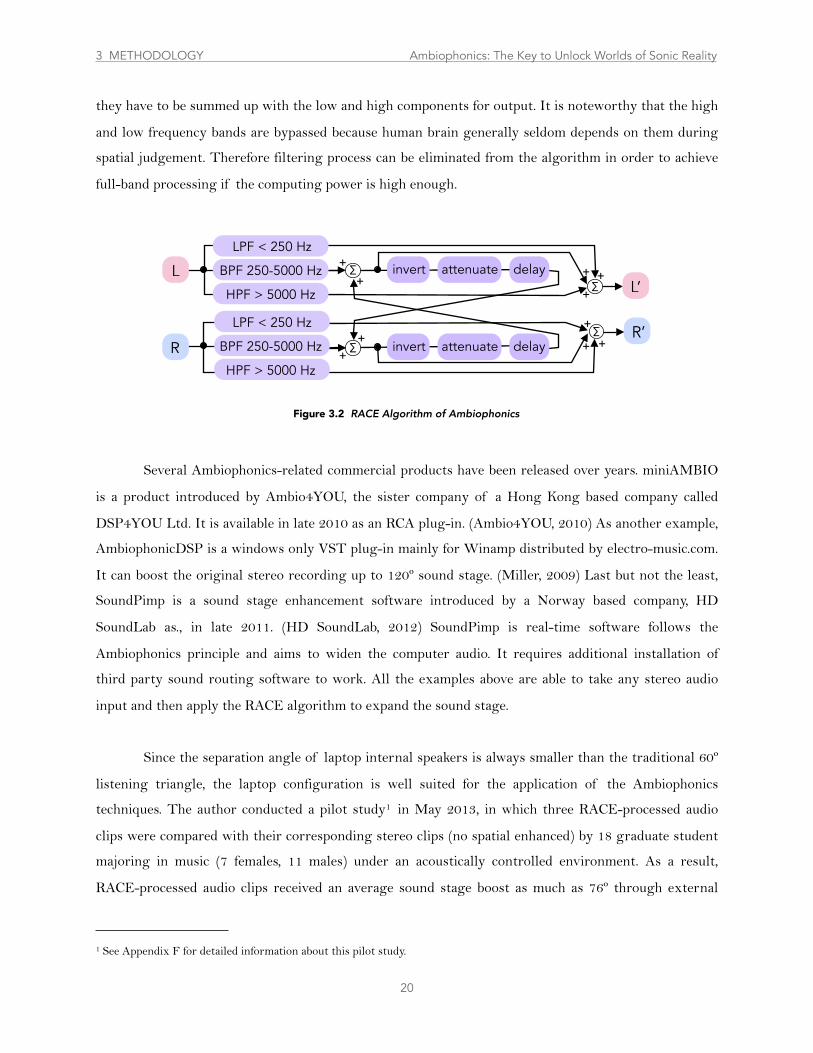
they have to be summed up with the low and high components for output. It is noteworthy that the high
and low frequency bands are bypassed because human brain generally seldom depends on them during
spatial judgement. Therefore filtering process can be eliminated from the algorithm in order to achieve
full-band processing if the computing power is high enough.
Several Ambiophonics-related commercial products have been released over years. miniAMBIO
is a product introduced by Ambio4YOU, the sister company of a Hong Kong based company called
DSP4YOU Ltd. It is available in late 2010 as an RCA plug-in. (Ambio4YOU, 2010) As another example,
AmbiophonicDSP is a windows only VST plug-in mainly for Winamp distributed by electro-music.com.
It can boost the original stereo recording up to 120º sound stage. (Miller, 2009) Last but not the least,
SoundPimp is a sound stage enhancement software introduced by a Norway based company, HD
SoundLab as., in late 2011. (HD SoundLab, 2012) SoundPimp is real-time software follows the
Ambiophonics principle and aims to widen the computer audio. It requires additional installation of
third party sound routing software to work. All the examples above are able to take any stereo audio
input and then apply the RACE algorithm to expand the sound stage.
Since the separation angle of laptop internal speakers is always smaller than the traditional 60º
listening triangle, the laptop configuration is well suited for the application of the Ambiophonics
techniques. The author conducted a pilot study1 in May 2013, in which three RACE-processed audio
clips were compared with their corresponding stereo clips (no spatial enhanced) by 18 graduate student
majoring in music (7 females, 11 males) under an acoustically controlled environment. As a result,
RACE-processed audio clips received an average sound stage boost as much as 76º through external
20
1 See Appendix F for detailed information about this pilot study.
Figure 3.2 RACE Algorithm of Ambiophonics
∑
∑L
R
∑
∑ R’
L’invert attenuate delay
++
+
++
+
invert attenuate delay
+
+
LPF < 250 Hz
BPF 250-5000 Hz
HPF > 5000 Hz
LPF < 250 Hz
BPF 250-5000 Hz
HPF > 5000 Hz
+
+
3 METHODOLOGY Ambiophonics: The Key to Unlock Worlds of Sonic Reality

speakers. The sound stage boost here defines as the difference in rated width between the stage
enhanced clip and the reference stereo clip. This result revealed that RACE algorithm has potential to
significantly widen the sound stage even with easy setup and cheap equipment.
3.3 Structural Design of A new Spatial Enhancement Software: Ambidio
The name “Ambidio” suggests the underlying theory––as is “Ambiophonics Audio.” As
mentioned in the Introduction, Ambidio is the main output of this thesis as a real-time application for
Mac OS X system. Ambidio is a stereo-in-stereo-out program mainly written in C++. It is built in
Xcode 4.6.3 and developed on Mac OS X 10.8. The program can be divided into four parts: First, a
kernel is implemented which serves as a virtual audio device that captures the system audio output from
core audio. The captured output is then routed to a separate application in the user space where the
present spatial enhancement algorithm is applied. The spatial enhancement algorithm is modified from
the RACE algorithm and will be discussed in Section 3.4. The processed signals are then routed to the
default output. In order to keep flexibility, the default output can be either laptop internal speakers or
external speakers. It is worth noting that Mac computer only allows one input and one output at a time.
Since the system output is set to be the virtual audio device, the default output (internal speakers or
external speakers) used to play the processed sound is created by adding an extra “monitor” route. An
intuitive user interface will be discussed later in Section 3.5.
Figure 3.3 shown at the next page illustrates the basic structure design of Ambidio.
21
3 METHODOLOGY Structural Design of A new Spatial Enhancement Software: Ambidio
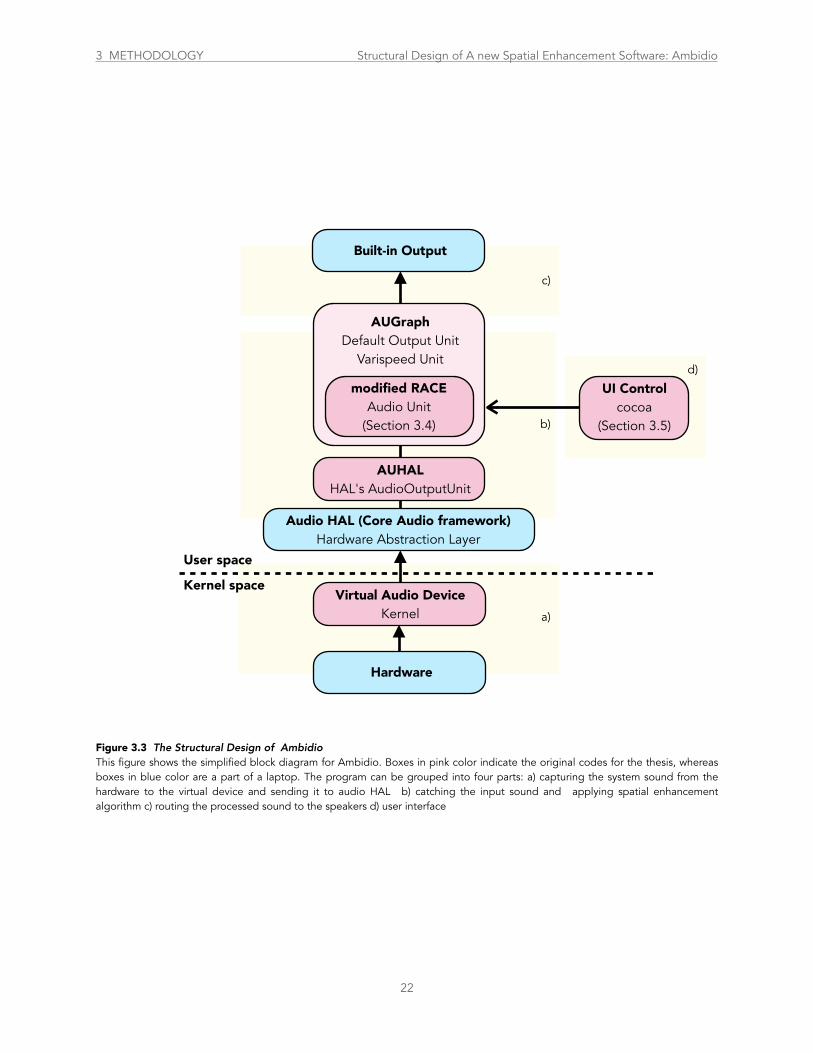
22
Figure 3.3 The Structural Design of AmbidioThis figure shows the simplified block diagram for Ambidio. Boxes in pink color indicate the original codes for the thesis, whereas boxes in blue color are a part of a laptop. The program can be grouped into four parts: a) capturing the system sound from the hardware to the virtual device and sending it to audio HAL b) catching the input sound and applying spatial enhancement algorithm c) routing the processed sound to the speakers d) user interface
User space
Kernel space
Built-in Output
AUHALHAL's AudioOutputUnit
AUGraphDefault Output Unit
Varispeed Unit
modified RACEAudio Unit
(Section 3.4)
Audio HAL (Core Audio framework)Hardware Abstraction Layer
Virtual Audio DeviceKernel a)
b)
c)
d)
Hardware
UI Controlcocoa
(Section 3.5)
3 METHODOLOGY Structural Design of A new Spatial Enhancement Software: Ambidio
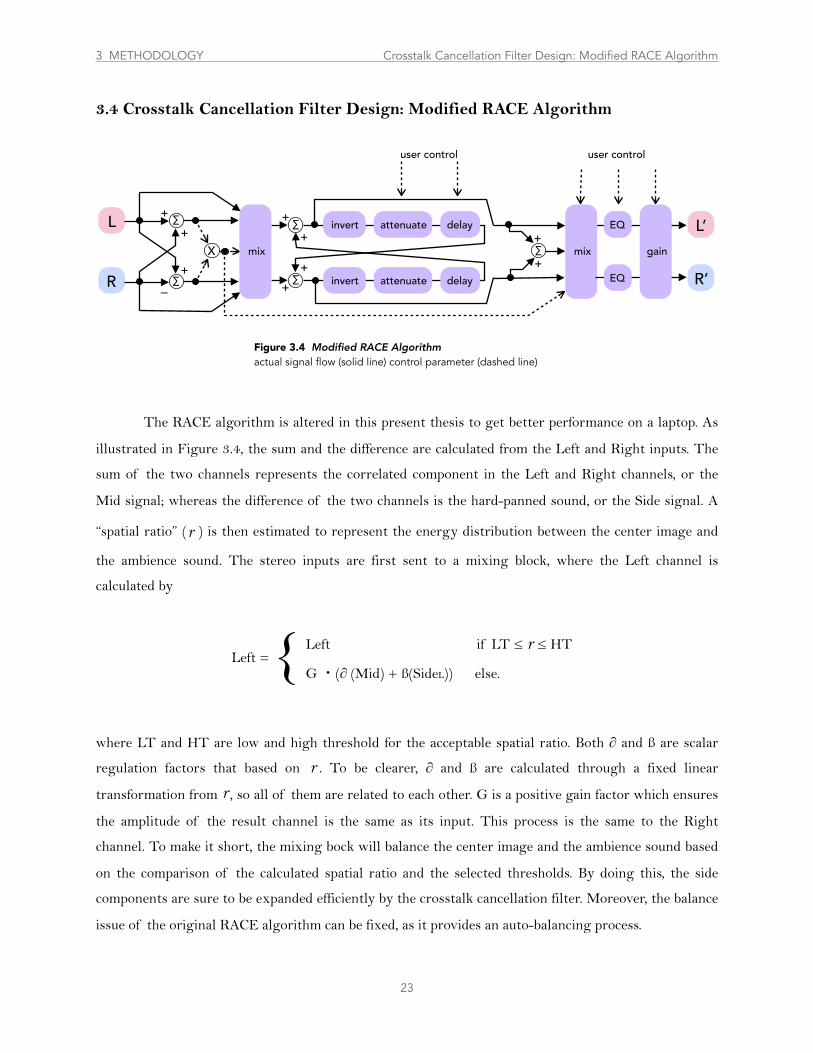
3.4 Crosstalk Cancellation Filter Design: Modified RACE Algorithm
The RACE algorithm is altered in this present thesis to get better performance on a laptop. As
illustrated in Figure 3.4, the sum and the difference are calculated from the Left and Right inputs. The
sum of the two channels represents the correlated component in the Left and Right channels, or the
Mid signal; whereas the difference of the two channels is the hard-panned sound, or the Side signal. A
“spatial ratio” ( ) is then estimated to represent the energy distribution between the center image and
the ambience sound. The stereo inputs are first sent to a mixing block, where the Left channel is
calculated by
where LT and HT are low and high threshold for the acceptable spatial ratio. Both ∂ and ß are scalar
regulation factors that based on . To be clearer, ∂ and ß are calculated through a fixed linear
transformation from , so all of them are related to each other. G is a positive gain factor which ensures
the amplitude of the result channel is the same as its input. This process is the same to the Right
channel. To make it short, the mixing bock will balance the center image and the ambience sound based
on the comparison of the calculated spatial ratio and the selected thresholds. By doing this, the side
components are sure to be expanded efficiently by the crosstalk cancellation filter. Moreover, the balance
issue of the original RACE algorithm can be fixed, as it provides an auto-balancing process.
23
3 METHODOLOGY Crosstalk Cancellation Filter Design: Modified RACE Algorithm d
Figure 3.4 Modified RACE Algorithmactual signal flow (solid line) control parameter (dashed line)
R’
L’+∑
invert attenuate delay+
mix+
∑ invert attenuate delay+
user control
EQ
EQ
L
R+
+
–
+ ∑
∑
X mix
∑+
+
user control
gain
r
Left if LT ≤ r ≤ HT
G ・(∂ (Mid) + ß(SideL)) else.{Left =
rr
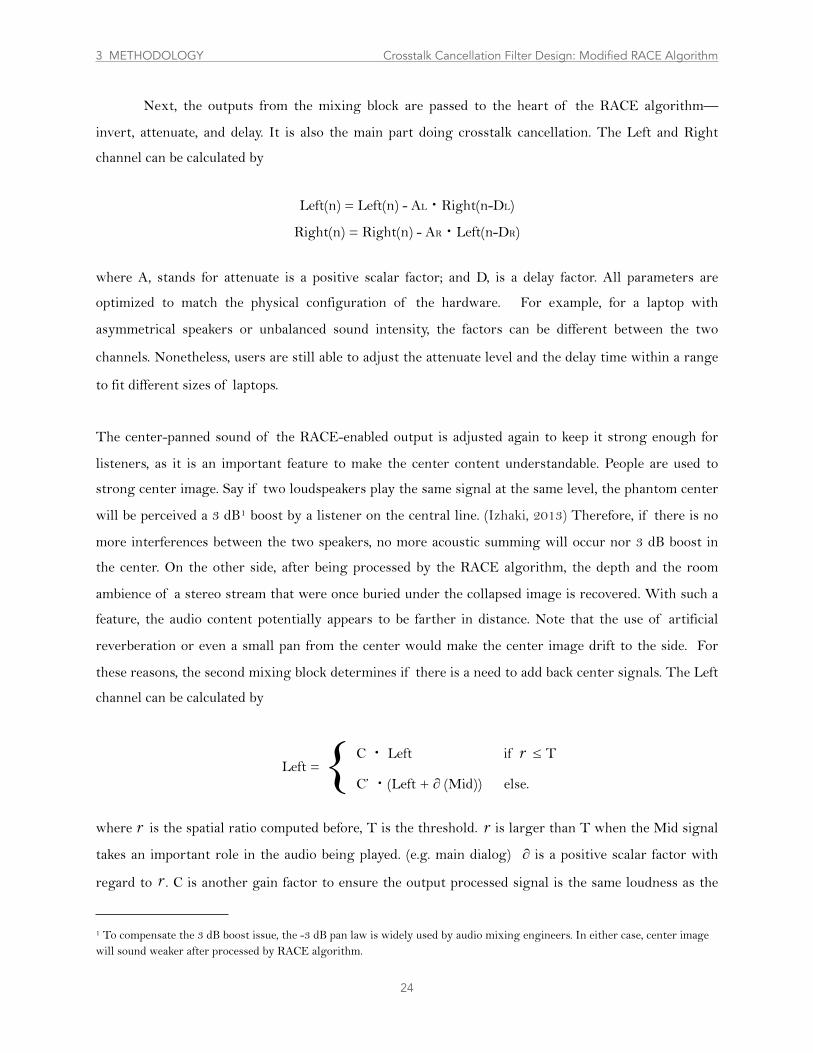
Next, the outputs from the mixing block are passed to the heart of the RACE algorithm––
invert, attenuate, and delay. It is also the main part doing crosstalk cancellation. The Left and Right
channel can be calculated by
where A, stands for attenuate is a positive scalar factor; and D, is a delay factor. All parameters are
optimized to match the physical configuration of the hardware. For example, for a laptop with
asymmetrical speakers or unbalanced sound intensity, the factors can be different between the two
channels. Nonetheless, users are still able to adjust the attenuate level and the delay time within a range
to fit different sizes of laptops.
The center-panned sound of the RACE-enabled output is adjusted again to keep it strong enough for
listeners, as it is an important feature to make the center content understandable. People are used to
strong center image. Say if two loudspeakers play the same signal at the same level, the phantom center
will be perceived a 3 dB1 boost by a listener on the central line. (Izhaki, 2013) Therefore, if there is no
more interferences between the two speakers, no more acoustic summing will occur nor 3 dB boost in
the center. On the other side, after being processed by the RACE algorithm, the depth and the room
ambience of a stereo stream that were once buried under the collapsed image is recovered. With such a
feature, the audio content potentially appears to be farther in distance. Note that the use of artificial
reverberation or even a small pan from the center would make the center image drift to the side. For
these reasons, the second mixing block determines if there is a need to add back center signals. The Left
channel can be calculated by
where is the spatial ratio computed before, T is the threshold. is larger than T when the Mid signal
takes an important role in the audio being played. (e.g. main dialog) ∂ is a positive scalar factor with
regard to . C is another gain factor to ensure the output processed signal is the same loudness as the
24
1 To compensate the 3 dB boost issue, the -3 dB pan law is widely used by audio mixing engineers. In either case, center image will sound weaker after processed by RACE algorithm.
r
C ・ Left if r ≤ T
C’ ・(Left + ∂ (Mid)) else.{Left =
r
r
3 METHODOLOGY Crosstalk Cancellation Filter Design: Modified RACE Algorithm d
Left(n) = Left(n) - AL・Right(n-DL)
Right(n) = Right(n) - AR・Left(n-DR)

original input signal. The same process is also applied to the Right channel. This keeps the center image
strong and stable enough for listeners, as it is an important feature to make the content understandable.
Users have the ability to adjust the amount of the center image to fit their own tastes. Following by the
second mixing block, an EQ is applied to eliminate the audible coloration in high frequency bands
created by using non- ideal factors in respect to the size of the head and the laptop. Finally, a gain
control block makes sure every signal is within the proper amplitude range and is at the same loudness
as the original input signal. Likewise, users have freedom to control the volume.
The present algorithm can also be implemented in the
frequency domain to improve computational performance, and to
produce cleaner filtered result. As shown in the Figure 3.5, a set of
impulse responses is generated to represent the whole recursive
crosstalk cancellation process as described before. The “Same-Side
Impulse” summarizes the sound that the ear at the same side to the
speaker will receive. When a signal is being convolved with the first
peak of the “Same-Side Impulse”, the result is the original signal
itself (as it has neither delay nor attenuation), following by a series of
even-order crosstalk cancellation signals. Similarly, the “Opposite-
Side Impulse” represents the signal received by the opposite ear, but
all of the peaks are odd-order crosstalk cancelers. Unlike having
infinite recursive crosstalk cancellation in time domain processing, it
only reduces the crosstalk signals to -90 dB, yet still enough to make
the crosstalk inaudible.
3.5 User Interface Design
Ambidio has a very simple and intuitive user interface. After launching the application, a small
Ambidio icon appears on the menu bar. As a menu bar application, it will not occupy any position on the
Dock (toolbar). Furthermore, users don’t have to change the window focus if they want to adjust the
effect while doing other laptop activities. As shown in the Figure 3.6 and 3.7 at the next page, clicking
on the icon can bring up a drop-down menu. On the bottom of the menu list is the Quit button where
users can quit Ambidio. There is another Control button on the menu list. When clicking on it, a control
25
3 METHODOLOGY User Interface Design d
Figure 3.5 Sample Impulses Used in Frequency Domain Processing
0
-0.2
-0.4
-0.6
-0.8
-10 20 40 60 80
Opposite-Side Impulse
Sample
Ampl
itude
1
0.8
0.6
0.4
0.2
0
Same-Side Impulse
Ampl
itude
0 20 40 60 80Sample
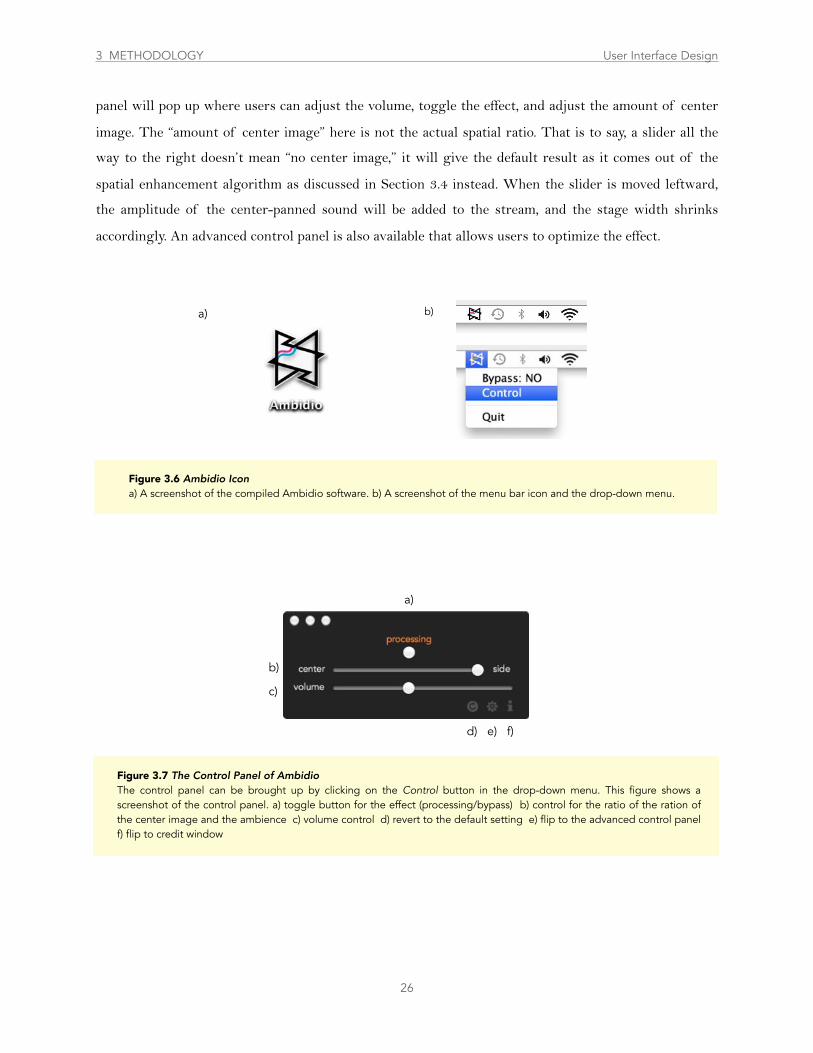
panel will pop up where users can adjust the volume, toggle the effect, and adjust the amount of center
image. The “amount of center image” here is not the actual spatial ratio. That is to say, a slider all the
way to the right doesn’t mean “no center image,” it will give the default result as it comes out of the
spatial enhancement algorithm as discussed in Section 3.4 instead. When the slider is moved leftward,
the amplitude of the center-panned sound will be added to the stream, and the stage width shrinks
accordingly. An advanced control panel is also available that allows users to optimize the effect.
26
b)
c)
d) e) f)
a)
Figure 3.7 The Control Panel of AmbidioThe control panel can be brought up by clicking on the Control button in the drop-down menu. This figure shows a screenshot of the control panel. a) toggle button for the effect (processing/bypass) b) control for the ratio of the ration of the center image and the ambience c) volume control d) revert to the default setting e) flip to the advanced control panel f) flip to credit window
3 METHODOLOGY User Interface Design d
a) b)
Figure 3.6 Ambidio Icona) A screenshot of the compiled Ambidio software. b) A screenshot of the menu bar icon and the drop-down menu.

4.1 Subjective Evaluation Design
A subjective experiment was designed to compare the present work and a commercial product,
SRS iWOW, in order to investigate listeners’ interpretations of the width of the sound stage created by
laptop internal speakers as well as other features like sound quality. The basic experiment paradigm
following (Olive, 2001). Ideally, there should be a significant difference in rated width or other selected
features between the present algorithm and the selected commercial software.
4.1.1 Participants
Forty-four graduate students and faculty members from
New York University with normal hearing (17 females, 27 males,
27.0±5.01 years old) voluntarily participated in all portions of the
listening test. Thirty-two out of 44 subjects (73%) were music
majors or worked in a music-related field. On average, subjects had
7.5±6.1 years formal music training; 4.0±5.3 years experiences in
sound editing and mixing; and 3.4±5.7 years experiences in sound
recording and sound reinforcement. Before the experiment,
informed consent was read and checked from all participants. All
participants were assigned to the same task in the experiment. The
experiment was approved by the University Committee on
Activities Involving Human Subjects of New York University. See
Appendix A for detailed information and analysis about subject
background.
27
1 Data are reported as Mean±SE
4Subjective Evaluation
61%39%
Subjects (N=44)
Female Male
27%
73%
work/study in music filedothers
4 SUBJECTIVE EVALUATION Subjective Evaluation Design
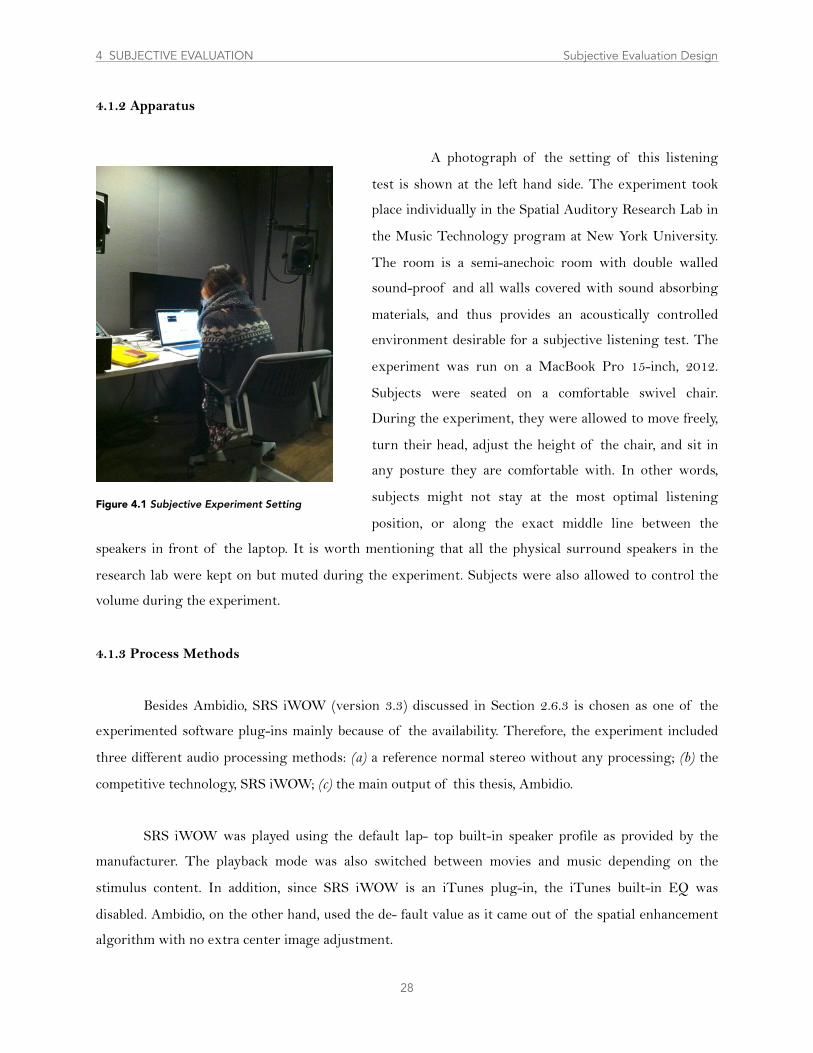
4.1.2 Apparatus
A photograph of the setting of this listening
test is shown at the left hand side. The experiment took
place individually in the Spatial Auditory Research Lab in
the Music Technology program at New York University.
The room is a semi-anechoic room with double walled
sound-proof and all walls covered with sound absorbing
materials, and thus provides an acoustically controlled
environment desirable for a subjective listening test. The
experiment was run on a MacBook Pro 15-inch, 2012.
Subjects were seated on a comfortable swivel chair.
During the experiment, they were allowed to move freely,
turn their head, adjust the height of the chair, and sit in
any posture they are comfortable with. In other words,
subjects might not stay at the most optimal listening
position, or along the exact middle line between the
speakers in front of the laptop. It is worth mentioning that all the physical surround speakers in the
research lab were kept on but muted during the experiment. Subjects were also allowed to control the
volume during the experiment.
4.1.3 Process Methods
Besides Ambidio, SRS iWOW (version 3.3) discussed in Section 2.6.3 is chosen as one of the
experimented software plug-ins mainly because of the availability. Therefore, the experiment included
three different audio processing methods: (a) a reference normal stereo without any processing; (b) the
competitive technology, SRS iWOW; (c) the main output of this thesis, Ambidio.
SRS iWOW was played using the default lap- top built-in speaker profile as provided by the
manufacturer. The playback mode was also switched between movies and music depending on the
stimulus content. In addition, since SRS iWOW is an iTunes plug-in, the iTunes built-in EQ was
disabled. Ambidio, on the other hand, used the de- fault value as it came out of the spatial enhancement
algorithm with no extra center image adjustment.
28
Figure 4.1 Subjective Experiment Setting
4 SUBJECTIVE EVALUATION Subjective Evaluation Design
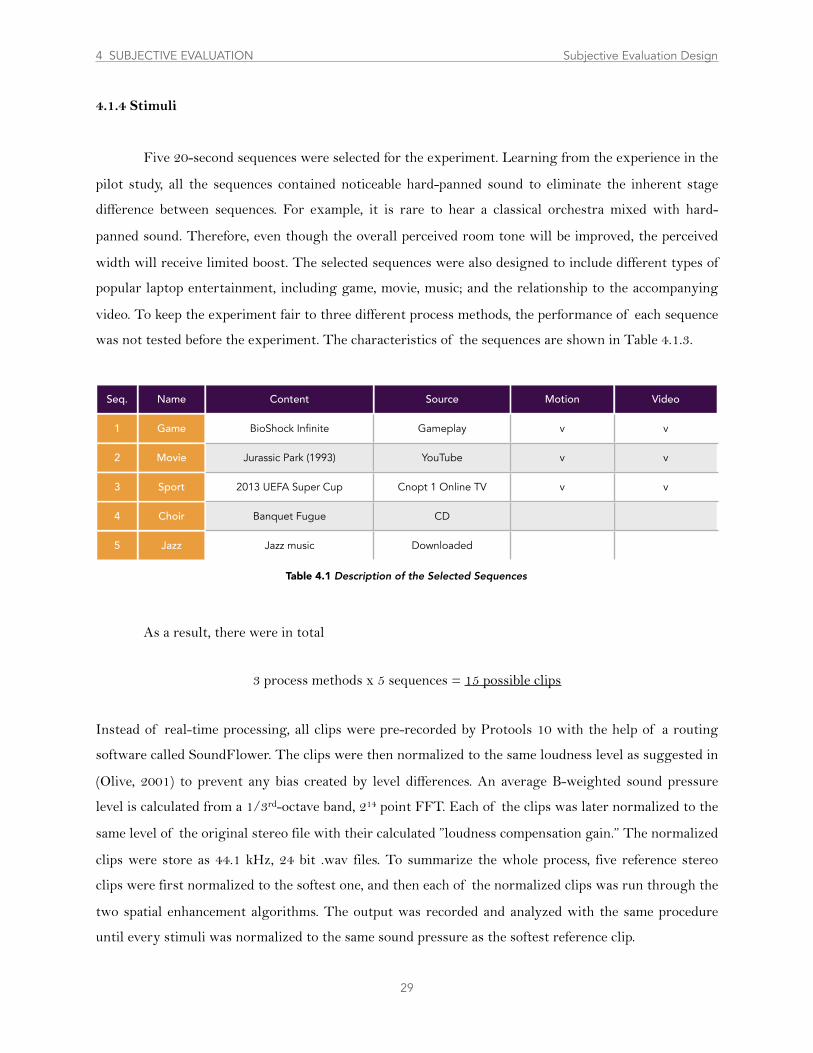
4.1.4 Stimuli
Five 20-second sequences were selected for the experiment. Learning from the experience in the
pilot study, all the sequences contained noticeable hard-panned sound to eliminate the inherent stage
difference between sequences. For example, it is rare to hear a classical orchestra mixed with hard-
panned sound. Therefore, even though the overall perceived room tone will be improved, the perceived
width will receive limited boost. The selected sequences were also designed to include different types of
popular laptop entertainment, including game, movie, music; and the relationship to the accompanying
video. To keep the experiment fair to three different process methods, the performance of each sequence
was not tested before the experiment. The characteristics of the sequences are shown in Table 4.1.3.
Seq. Name Content Source Motion Video
1 Game BioShock Infinite Gameplay v v
2 Movie Jurassic Park (1993) YouTube v v
3 Sport 2013 UEFA Super Cup Cnopt 1 Online TV v v
4 Choir Banquet Fugue CD
5 Jazz Jazz music Downloaded
As a result, there were in total
3 process methods x 5 sequences = 15 possible clips
Instead of real-time processing, all clips were pre-recorded by Protools 10 with the help of a routing
software called SoundFlower. The clips were then normalized to the same loudness level as suggested in
(Olive, 2001) to prevent any bias created by level differences. An average B-weighted sound pressure
level is calculated from a 1/3rd-octave band, 214 point FFT. Each of the clips was later normalized to the
same level of the original stereo file with their calculated ”loudness compensation gain.” The normalized
clips were store as 44.1 kHz, 24 bit .wav files. To summarize the whole process, five reference stereo
clips were first normalized to the softest one, and then each of the normalized clips was run through the
two spatial enhancement algorithms. The output was recorded and analyzed with the same procedure
until every stimuli was normalized to the same sound pressure as the softest reference clip.
29
Table 4.1 Description of the Selected Sequences
4 SUBJECTIVE EVALUATION Subjective Evaluation Design
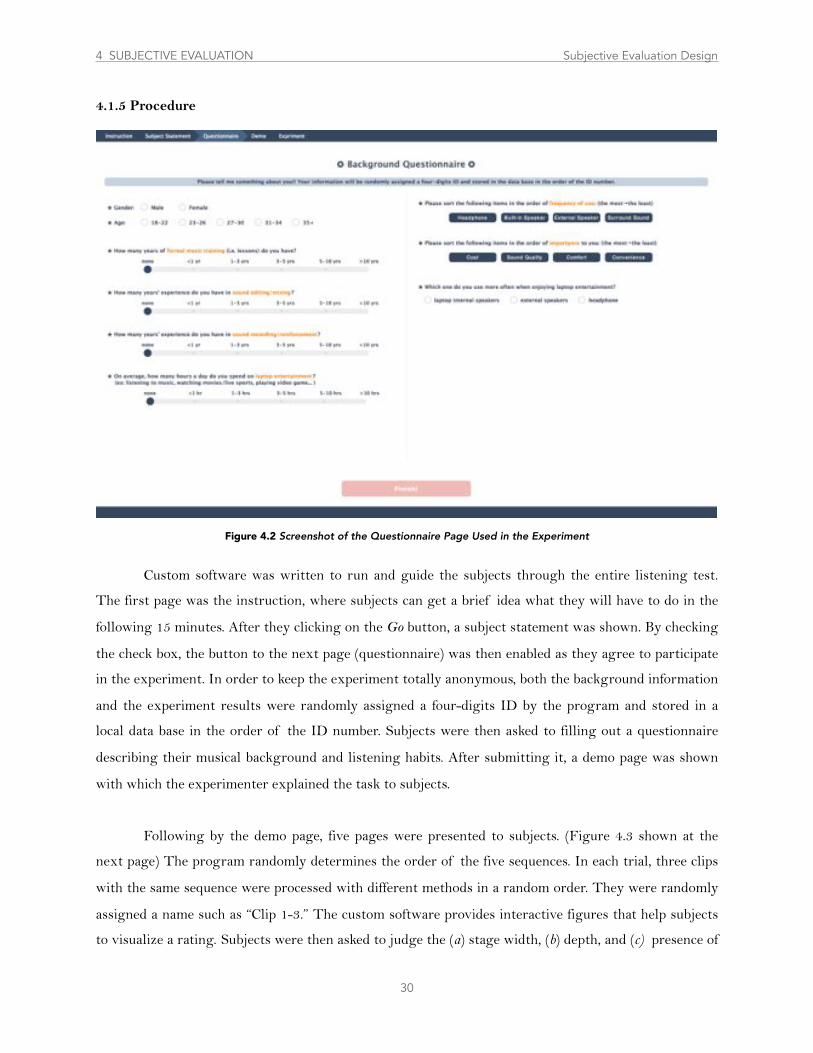
4.1.5 Procedure
Custom software was written to run and guide the subjects through the entire listening test.
The first page was the instruction, where subjects can get a brief idea what they will have to do in the
following 15 minutes. After they clicking on the Go button, a subject statement was shown. By checking
the check box, the button to the next page (questionnaire) was then enabled as they agree to participate
in the experiment. In order to keep the experiment totally anonymous, both the background information
and the experiment results were randomly assigned a four-digits ID by the program and stored in a
local data base in the order of the ID number. Subjects were then asked to filling out a questionnaire
describing their musical background and listening habits. After submitting it, a demo page was shown
with which the experimenter explained the task to subjects.
Following by the demo page, five pages were presented to subjects. (Figure 4.3 shown at the
next page) The program randomly determines the order of the five sequences. In each trial, three clips
with the same sequence were processed with different methods in a random order. They were randomly
assigned a name such as “Clip 1-3.” The custom software provides interactive figures that help subjects
to visualize a rating. Subjects were then asked to judge the (a) stage width, (b) depth, and (c) presence of
30
4 SUBJECTIVE EVALUATION Subjective Evaluation Design
Figure 4.2 Screenshot of the Questionnaire Page Used in the Experiment
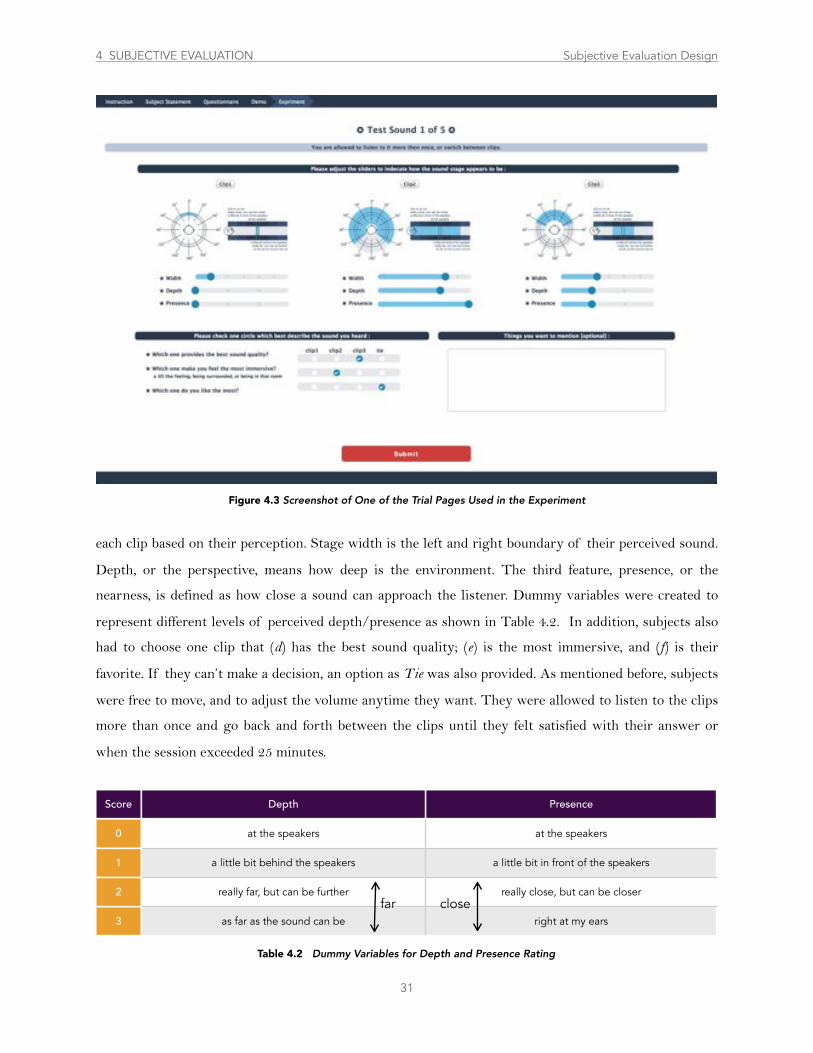
each clip based on their perception. Stage width is the left and right boundary of their perceived sound.
Depth, or the perspective, means how deep is the environment. The third feature, presence, or the
nearness, is defined as how close a sound can approach the listener. Dummy variables were created to
represent different levels of perceived depth/presence as shown in Table 4.2. In addition, subjects also
had to choose one clip that (d) has the best sound quality; (e) is the most immersive, and (f) is their
favorite. If they can’t make a decision, an option as Tie was also provided. As mentioned before, subjects
were free to move, and to adjust the volume anytime they want. They were allowed to listen to the clips
more than once and go back and forth between the clips until they felt satisfied with their answer or
when the session exceeded 25 minutes.
31
4 SUBJECTIVE EVALUATION Subjective Evaluation Design
Score Depth Presence
0 at the speakers at the speakers
1 a little bit behind the speakers a little bit in front of the speakers
2 really far, but can be further really close, but can be closer
3 as far as the sound can be right at my ears
far close
Table 4.2 Dummy Variables for Depth and Presence Rating
Figure 4.3 Screenshot of One of the Trial Pages Used in the Experiment
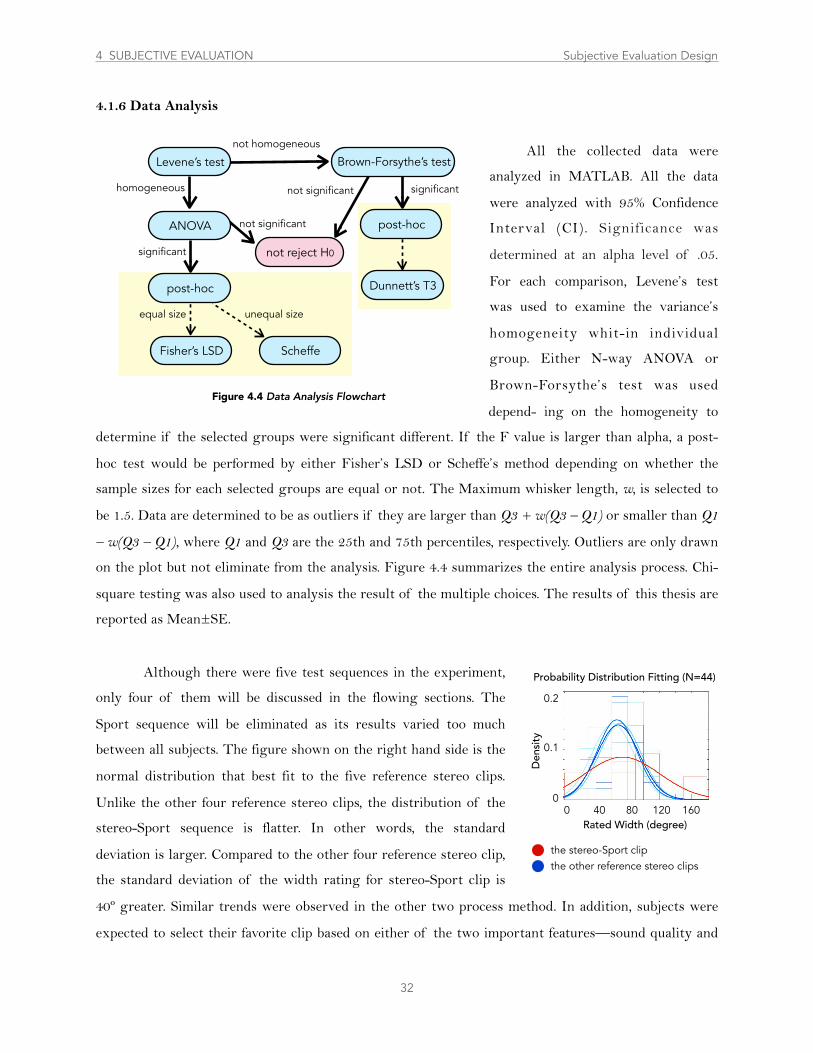
4.1.6 Data Analysis
All the collected data were
analyzed in MATLAB. All the data
were analyzed with 95% Confidence
Interval (CI). Significance was
determined at an alpha level of .05.
For each comparison, Levene’s test
was used to examine the variance’s
homogeneity whit-in individual
group. Either N-way ANOVA or
Brown-Forsythe’s test was used
depend- ing on the homogeneity to
determine if the selected groups were significant different. If the F value is larger than alpha, a post-
hoc test would be performed by either Fisher’s LSD or Scheffe’s method depending on whether the
sample sizes for each selected groups are equal or not. The Maximum whisker length, w, is selected to
be 1.5. Data are determined to be as outliers if they are larger than Q3 + w(Q3 – Q1) or smaller than Q1
– w(Q3 – Q1), where Q1 and Q3 are the 25th and 75th percentiles, respectively. Outliers are only drawn
on the plot but not eliminate from the analysis. Figure 4.4 summarizes the entire analysis process. Chi-
square testing was also used to analysis the result of the multiple choices. The results of this thesis are
reported as Mean±SE.
Although there were five test sequences in the experiment,
only four of them will be discussed in the flowing sections. The
Sport sequence will be eliminated as its results varied too much
between all subjects. The figure shown on the right hand side is the
normal distribution that best fit to the five reference stereo clips.
Unlike the other four reference stereo clips, the distribution of the
stereo-Sport sequence is flatter. In other words, the standard
deviation is larger. Compared to the other four reference stereo clip,
the standard deviation of the width rating for stereo-Sport clip is
40º greater. Similar trends were observed in the other two process method. In addition, subjects were
expected to select their favorite clip based on either of the two important features––sound quality and
32
0.2
0.1
0
Rated Width (degree)
Den
sity
0 40 80 120 160
Probability Distribution Fitting (N=44)
the stereo-Sport clip the other reference stereo clips
4 SUBJECTIVE EVALUATION Subjective Evaluation Design
Levene’s test
ANOVA
homogeneous
not homogeneous
significant
post-hoc
equal size
Fisher’s LSD
Brown-Forsythe’s test
significant
post-hoc
Dunnett’s T3
not reject H0
not significant
not significant
unequal size
Scheffe
Figure 4.4 Data Analysis Flowchart
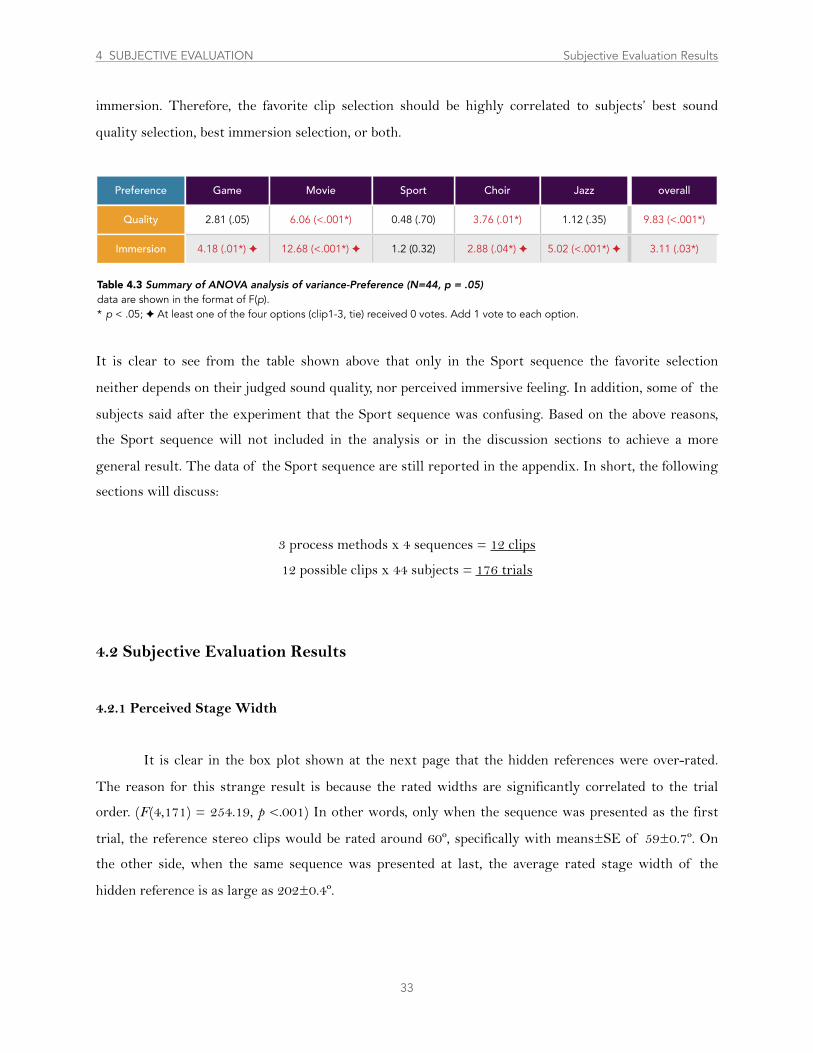
immersion. Therefore, the favorite clip selection should be highly correlated to subjects’ best sound
quality selection, best immersion selection, or both.
Preference Game Movie Sport Choir Jazz overall
Quality 2.81 (.05) 6.06 (<.001*) 0.48 (.70) 3.76 (.01*) 1.12 (.35) 9.83 (<.001*)
Immersion 4.18 (.01*) ✦ 12.68 (<.001*) ✦ 1.2 (0.32) 2.88 (.04*) ✦ 5.02 (<.001*) ✦ 3.11 (.03*)
It is clear to see from the table shown above that only in the Sport sequence the favorite selection
neither depends on their judged sound quality, nor perceived immersive feeling. In addition, some of the
subjects said after the experiment that the Sport sequence was confusing. Based on the above reasons,
the Sport sequence will not included in the analysis or in the discussion sections to achieve a more
general result. The data of the Sport sequence are still reported in the appendix. In short, the following
sections will discuss:
3 process methods x 4 sequences = 12 clips
12 possible clips x 44 subjects = 176 trials
4.2 Subjective Evaluation Results
4.2.1 Perceived Stage Width
It is clear in the box plot shown at the next page that the hidden references were over-rated.
The reason for this strange result is because the rated widths are significantly correlated to the trial
order. (F(4,171) = 254.19, p <.001) In other words, only when the sequence was presented as the first
trial, the reference stereo clips would be rated around 60º, specifically with means±SE of 59±0.7º. On
the other side, when the same sequence was presented at last, the average rated stage width of the
hidden reference is as large as 202±0.4º.
33
4 SUBJECTIVE EVALUATION Subjective Evaluation Results
Table 4.3 Summary of ANOVA analysis of variance-Preference (N=44, p = .05) data are shown in the format of F(p).* p < .05; ✦ At least one of the four options (clip1-3, tie) received 0 votes. Add 1 vote to each option.
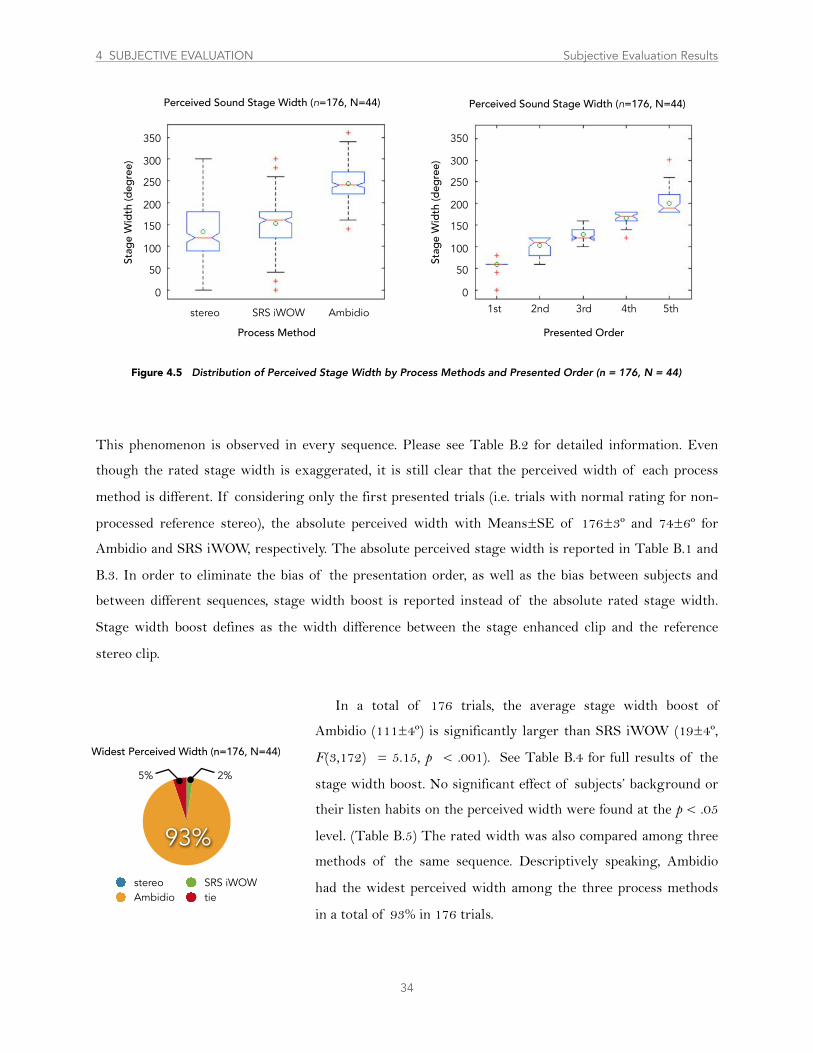
This phenomenon is observed in every sequence. Please see Table B.2 for detailed information. Even
though the rated stage width is exaggerated, it is still clear that the perceived width of each process
method is different. If considering only the first presented trials (i.e. trials with normal rating for non-
processed reference stereo), the absolute perceived width with Means±SE of 176±3º and 74±6º for
Ambidio and SRS iWOW, respectively. The absolute perceived stage width is reported in Table B.1 and
B.3. In order to eliminate the bias of the presentation order, as well as the bias between subjects and
between different sequences, stage width boost is reported instead of the absolute rated stage width.
Stage width boost defines as the width difference between the stage enhanced clip and the reference
stereo clip.
In a total of 176 trials, the average stage width boost of
Ambidio (111±4º) is significantly larger than SRS iWOW (19±4º,
F(3,172) = 5.15, p < .001). See Table B.4 for full results of the
stage width boost. No significant effect of subjects’ background or
their listen habits on the perceived width were found at the p < .05
level. (Table B.5) The rated width was also compared among three
methods of the same sequence. Descriptively speaking, Ambidio
had the widest perceived width among the three process methods
in a total of 93% in 176 trials.
34
350
300
250
200
150
100
50
0
Process Method
Stag
e W
idth
(deg
ree)
Perceived Sound Stage Width (n=176, N=44)
stereo SRS iWOW Ambidio 1st 2nd 3rd 4th 5th
350
300
250
200
150
100
50
0
Presented Order
Stag
e W
idth
(deg
ree)
Perceived Sound Stage Width (n=176, N=44)
Figure 4.5 Distribution of Perceived Stage Width by Process Methods and Presented Order (n = 176, N = 44)
93%
Widest Perceived Width (n=176, N=44)
stereo SRS iWOWAmbidio tie
2%5%
4 SUBJECTIVE EVALUATION Subjective Evaluation Results

A two-way ANOVA was performed for
stage width boost by sequence and process method.
The result suggests that the process method
(F(1,344) = 274.55, p < .001), and the interaction
between the sequence and the process method
(F(3,344) = 4.77, p < .001) have a significant
impact on stage width judgement. Since the
interaction between them is significant, the simple
main effect test is performed. First set the process
method as the main effect. When the process
method is SRS iWOW, there is a significant
difference between sequences. (F(3,172) = 5.15, p
< .001) In other words, the type of the sequence will affect the stage width boost when the process
method is SRS iWOW. A post-hoc test is then performed using Fisher’s LSD test. As the result, two out
of six paired tests achieve a .05 significant level. With SRS iWOW as the process method, when the
sequence is Movie (M±SE = 41±7º), the stage width boost is significantly greater then the other two
musical sequences––Jazz (1±8º, p < .001) and Choir (13±5º, p < .001) On the other hand, there is no
significant difference between sequences when the process method is Ambidio. (F(3,172) = 1.49, p = .22)
When the main effect is set to be the sequence, the result shows that there was a significant effect of the
process method on the stage width boost at an alpha level of .05 in all four different sequences.
To summarize, Ambidio works equally well on four sequences, whereas there was a significant
difference between sequences when the method is SRS iWOW. Combining two sequences with
accompanying video (Game and Movie) and two sequences without visual stimuli (Choir and Jazz)
together, there is no significant effect of the presence of video on the stage width boost (t(176) = 0.71, p
= .40) when the process method is Ambidio, but a significant impact is observed when the process
method is SRS iWOW (t(176) = 9.42, p < .001) See Table B.7 for summary.
4.2.2 Perceived Depth and Presence
As for the stage width rating, a similar trend was observed in the rated depth and presence that both of
them were gradually increased by the presented order. Although a boost can be calculated from the
35
overall Game Movie Choir Jazz
0
20
40
60
80
100
120
140
SRS iWOW Ambidio
Perceived Stage Width Boost (N=44)D
iffer
ence
(deg
ree)
Figure 4.6 Summary for Stage Width Boost (N=44)
4 SUBJECTIVE EVALUATION Subjective Evaluation Results
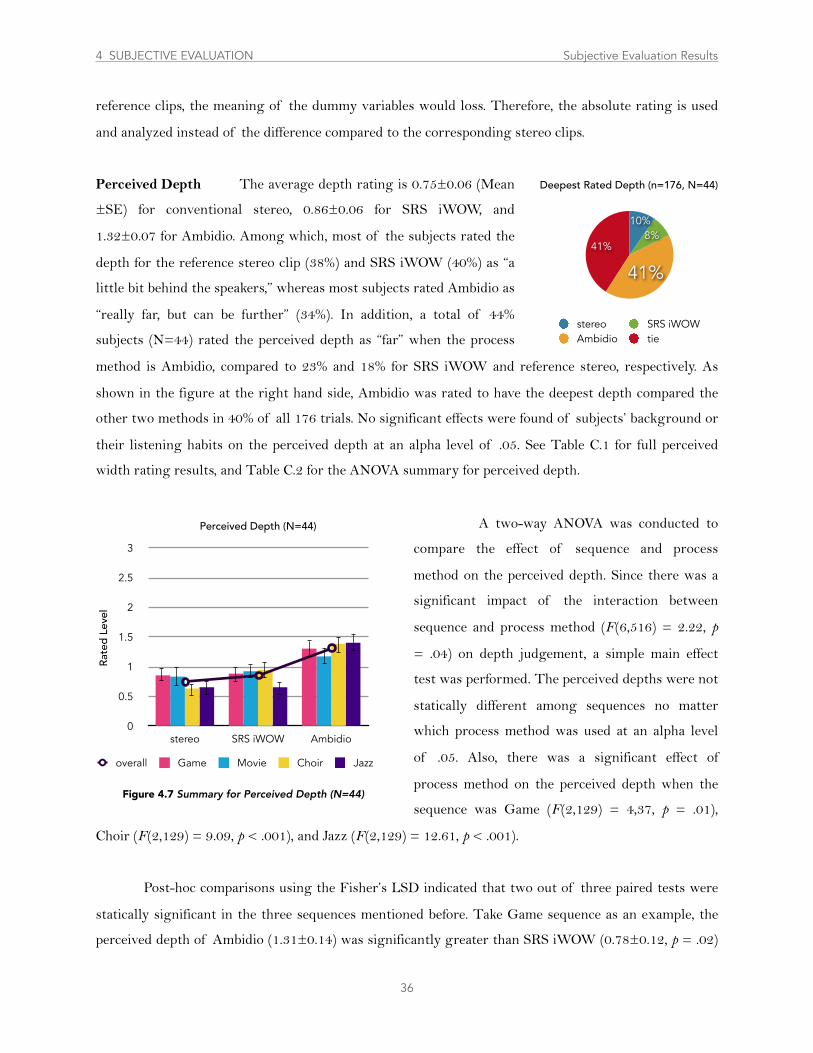
reference clips, the meaning of the dummy variables would loss. Therefore, the absolute rating is used
and analyzed instead of the difference compared to the corresponding stereo clips.
Perceived Depth The average depth rating is 0.75±0.06 (Mean
±SE) for conventional stereo, 0.86±0.06 for SRS iWOW, and
1.32±0.07 for Ambidio. Among which, most of the subjects rated the
depth for the reference stereo clip (38%) and SRS iWOW (40%) as “a
little bit behind the speakers,” whereas most subjects rated Ambidio as
“really far, but can be further” (34%). In addition, a total of 44%
subjects (N=44) rated the perceived depth as “far” when the process
method is Ambidio, compared to 23% and 18% for SRS iWOW and reference stereo, respectively. As
shown in the figure at the right hand side, Ambidio was rated to have the deepest depth compared the
other two methods in 40% of all 176 trials. No significant effects were found of subjects’ background or
their listening habits on the perceived depth at an alpha level of .05. See Table C.1 for full perceived
width rating results, and Table C.2 for the ANOVA summary for perceived depth.
A two-way ANOVA was conducted to
compare the effect of sequence and process
method on the perceived depth. Since there was a
significant impact of the interaction between
sequence and process method (F(6,516) = 2.22, p
= .04) on depth judgement, a simple main effect
test was performed. The perceived depths were not
statically different among sequences no matter
which process method was used at an alpha level
of .05. Also, there was a significant effect of
process method on the perceived depth when the
sequence was Game (F(2,129) = 4,37, p = .01),
Choir (F(2,129) = 9.09, p < .001), and Jazz (F(2,129) = 12.61, p < .001).
Post-hoc comparisons using the Fisher’s LSD indicated that two out of three paired tests were
statically significant in the three sequences mentioned before. Take Game sequence as an example, the
perceived depth of Ambidio (1.31±0.14) was significantly greater than SRS iWOW (0.78±0.12, p = .02)
36
4 SUBJECTIVE EVALUATION Subjective Evaluation Results
41%
41%
8%10%
Deepest Rated Depth (n=176, N=44)
stereo SRS iWOWAmbidio tie
0
0.5
1
1.5
2
2.5
3
stereo SRS iWOW Ambidio
Perceived Depth (N=44)
Rate
d Le
vel
overall Game Movie Choir Jazz
Figure 4.7 Summary for Perceived Depth (N=44)
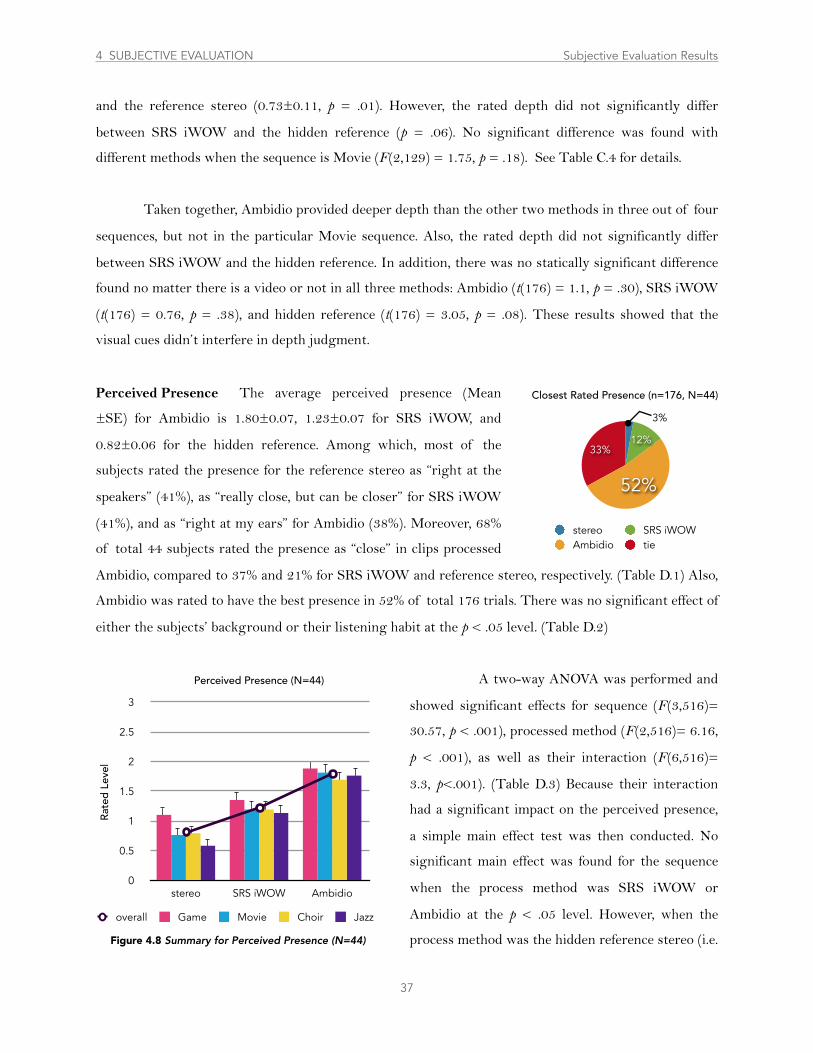
and the reference stereo (0.73±0.11, p = .01). However, the rated depth did not significantly differ
between SRS iWOW and the hidden reference (p = .06). No significant difference was found with
different methods when the sequence is Movie (F(2,129) = 1.75, p = .18). See Table C.4 for details.
Taken together, Ambidio provided deeper depth than the other two methods in three out of four
sequences, but not in the particular Movie sequence. Also, the rated depth did not significantly differ
between SRS iWOW and the hidden reference. In addition, there was no statically significant difference
found no matter there is a video or not in all three methods: Ambidio (t(176) = 1.1, p = .30), SRS iWOW
(t(176) = 0.76, p = .38), and hidden reference (t(176) = 3.05, p = .08). These results showed that the
visual cues didn’t interfere in depth judgment.
Perceived Presence The average perceived presence (Mean
±SE) for Ambidio is 1.80±0.07, 1.23±0.07 for SRS iWOW, and
0.82±0.06 for the hidden reference. Among which, most of the
subjects rated the presence for the reference stereo as “right at the
speakers” (41%), as “really close, but can be closer” for SRS iWOW
(41%), and as “right at my ears” for Ambidio (38%). Moreover, 68%
of total 44 subjects rated the presence as “close” in clips processed
Ambidio, compared to 37% and 21% for SRS iWOW and reference stereo, respectively. (Table D.1) Also,
Ambidio was rated to have the best presence in 52% of total 176 trials. There was no significant effect of
either the subjects’ background or their listening habit at the p < .05 level. (Table D.2)
A two-way ANOVA was performed and
showed significant effects for sequence (F(3,516)=
30.57, p < .001), processed method (F(2,516)= 6.16,
p < .001), as well as their interaction (F(6,516)=
3.3, p<.001). (Table D.3) Because their interaction
had a significant impact on the perceived presence,
a simple main effect test was then conducted. No
significant main effect was found for the sequence
when the process method was SRS iWOW or
Ambidio at the p < .05 level. However, when the
process method was the hidden reference stereo (i.e.
37
4 SUBJECTIVE EVALUATION Subjective Evaluation Results
33%
52%
12%
Closest Rated Presence (n=176, N=44)
stereo SRS iWOWAmbidio tie
3%
overall Game Movie Choir Jazz
0
0.5
1
1.5
2
2.5
3
stereo SRS iWOW Ambidio
Perceived Presence (N=44)
Rate
d Le
vel
Figure 4.8 Summary for Perceived Presence (N=44)
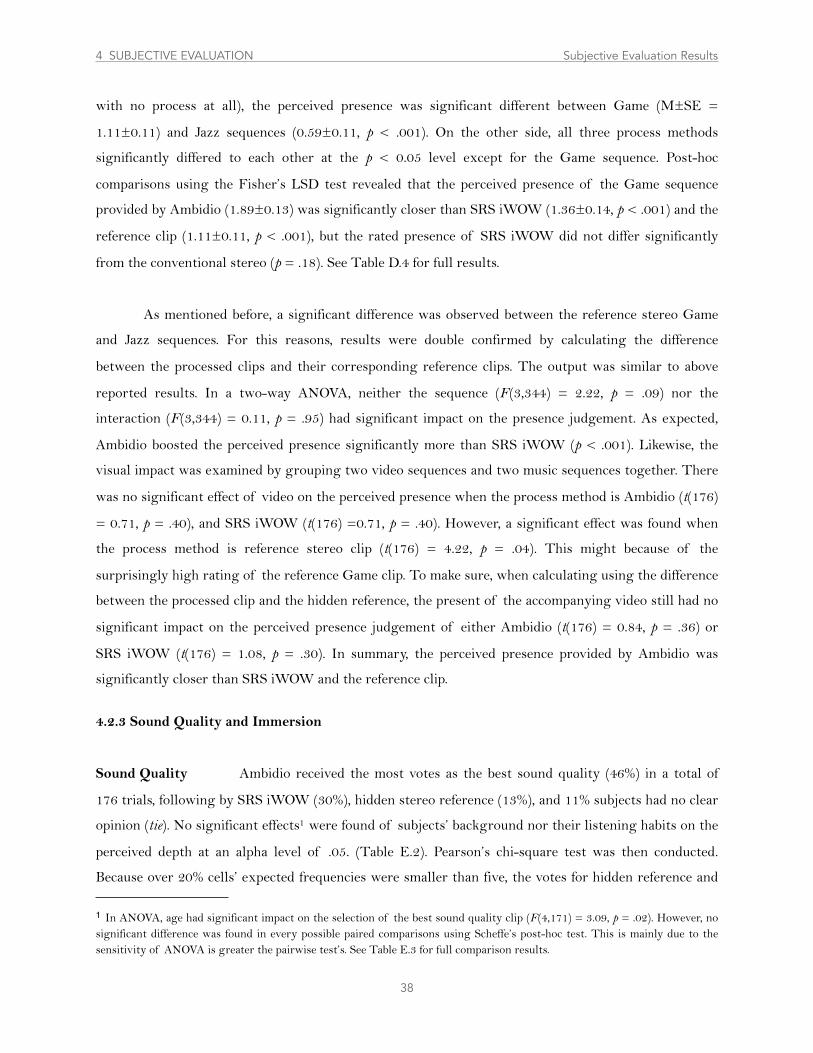
with no process at all), the perceived presence was significant different between Game (M±SE =
1.11±0.11) and Jazz sequences (0.59±0.11, p < .001). On the other side, all three process methods
significantly differed to each other at the p < 0.05 level except for the Game sequence. Post-hoc
comparisons using the Fisher’s LSD test revealed that the perceived presence of the Game sequence
provided by Ambidio (1.89±0.13) was significantly closer than SRS iWOW (1.36±0.14, p < .001) and the
reference clip (1.11±0.11, p < .001), but the rated presence of SRS iWOW did not differ significantly
from the conventional stereo (p = .18). See Table D.4 for full results.
As mentioned before, a significant difference was observed between the reference stereo Game
and Jazz sequences. For this reasons, results were double confirmed by calculating the difference
between the processed clips and their corresponding reference clips. The output was similar to above
reported results. In a two-way ANOVA, neither the sequence (F(3,344) = 2.22, p = .09) nor the
interaction (F(3,344) = 0.11, p = .95) had significant impact on the presence judgement. As expected,
Ambidio boosted the perceived presence significantly more than SRS iWOW (p < .001). Likewise, the
visual impact was examined by grouping two video sequences and two music sequences together. There
was no significant effect of video on the perceived presence when the process method is Ambidio (t(176)
= 0.71, p = .40), and SRS iWOW (t(176) =0.71, p = .40). However, a significant effect was found when
the process method is reference stereo clip (t(176) = 4.22, p = .04). This might because of the
surprisingly high rating of the reference Game clip. To make sure, when calculating using the difference
between the processed clip and the hidden reference, the present of the accompanying video still had no
significant impact on the perceived presence judgement of either Ambidio (t(176) = 0.84, p = .36) or
SRS iWOW (t(176) = 1.08, p = .30). In summary, the perceived presence provided by Ambidio was
significantly closer than SRS iWOW and the reference clip.
4.2.3 Sound Quality and Immersion
Sound Quality Ambidio received the most votes as the best sound quality (46%) in a total of
176 trials, following by SRS iWOW (30%), hidden stereo reference (13%), and 11% subjects had no clear
opinion (tie). No significant effects1 were found of subjects’ background nor their listening habits on the
perceived depth at an alpha level of .05. (Table E.2). Pearson’s chi-square test was then conducted.
Because over 20% cells’ expected frequencies were smaller than five, the votes for hidden reference and
38
1 In ANOVA, age had significant impact on the selection of the best sound quality clip (F(4,171) = 3.09, p = .02). However, no significant difference was found in every possible paired comparisons using Scheffe’s post-hoc test. This is mainly due to the sensitivity of ANOVA is greater the pairwise test’s. See Table E.3 for full comparison results.
4 SUBJECTIVE EVALUATION Subjective Evaluation Results
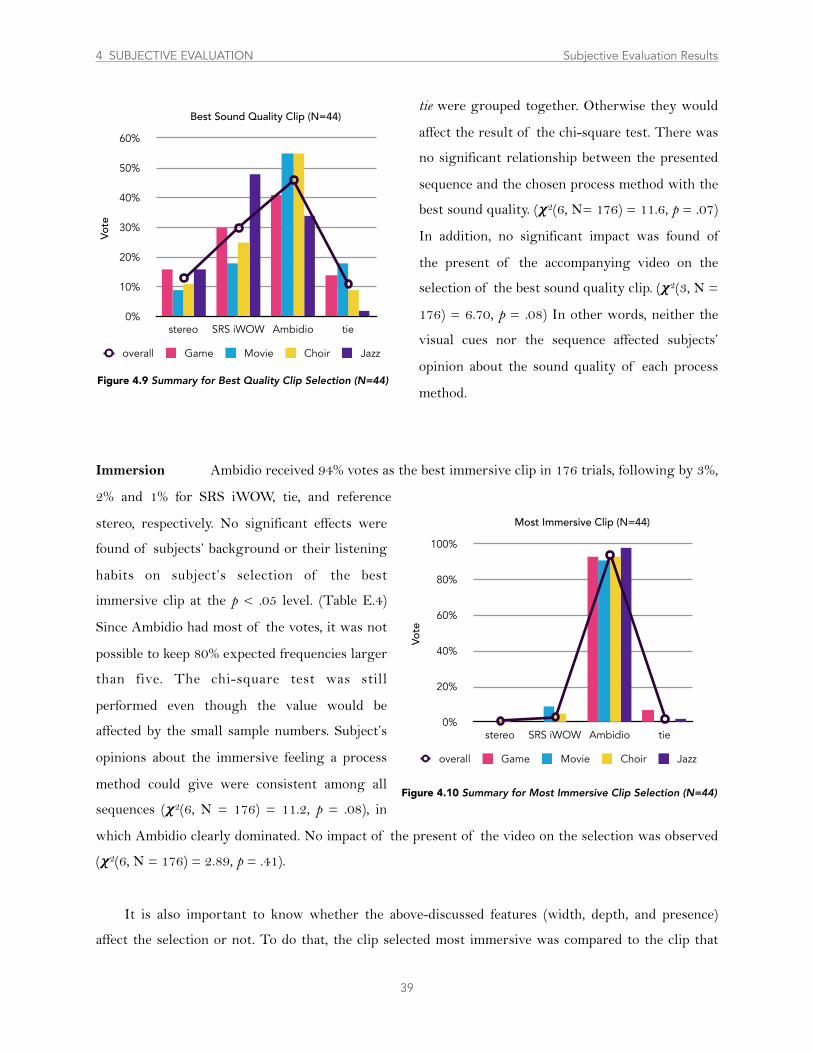
tie were grouped together. Otherwise they would
affect the result of the chi-square test. There was
no significant relationship between the presented
sequence and the chosen process method with the
best sound quality. (!2(6, N= 176) = 11.6, p = .07)
In addition, no significant impact was found of
the present of the accompanying video on the
selection of the best sound quality clip. (!2(3, N =
176) = 6.70, p = .08) In other words, neither the
visual cues nor the sequence affected subjects’
opinion about the sound quality of each process
method.
Immersion Ambidio received 94% votes as the best immersive clip in 176 trials, following by 3%,
2% and 1% for SRS iWOW, tie, and reference
stereo, respectively. No significant effects were
found of subjects’ background or their listening
habits on subject’s selection of the best
immersive clip at the p < .05 level. (Table E.4)
Since Ambidio had most of the votes, it was not
possible to keep 80% expected frequencies larger
than five. The chi-square test was still
performed even though the value would be
affected by the small sample numbers. Subject’s
opinions about the immersive feeling a process
method could give were consistent among all
sequences (!2(6, N = 176) = 11.2, p = .08), in
which Ambidio clearly dominated. No impact of the present of the video on the selection was observed
(!2(6, N = 176) = 2.89, p = .41).
It is also important to know whether the above-discussed features (width, depth, and presence)
affect the selection or not. To do that, the clip selected most immersive was compared to the clip that
39
4 SUBJECTIVE EVALUATION Subjective Evaluation Results
overall Game Movie Choir Jazz
0%
10%
20%
30%
40%
50%
60%
stereo SRS iWOW Ambidio tie
Best Sound Quality Clip (N=44)Vo
te
Figure 4.9 Summary for Best Quality Clip Selection (N=44)
Figure 4.10 Summary for Most Immersive Clip Selection (N=44)
overall Game Movie Choir Jazz
0%
20%
40%
60%
80%
100%
stereo SRS iWOW Ambidio tie
Most Immersive Clip (N=44)
Vote
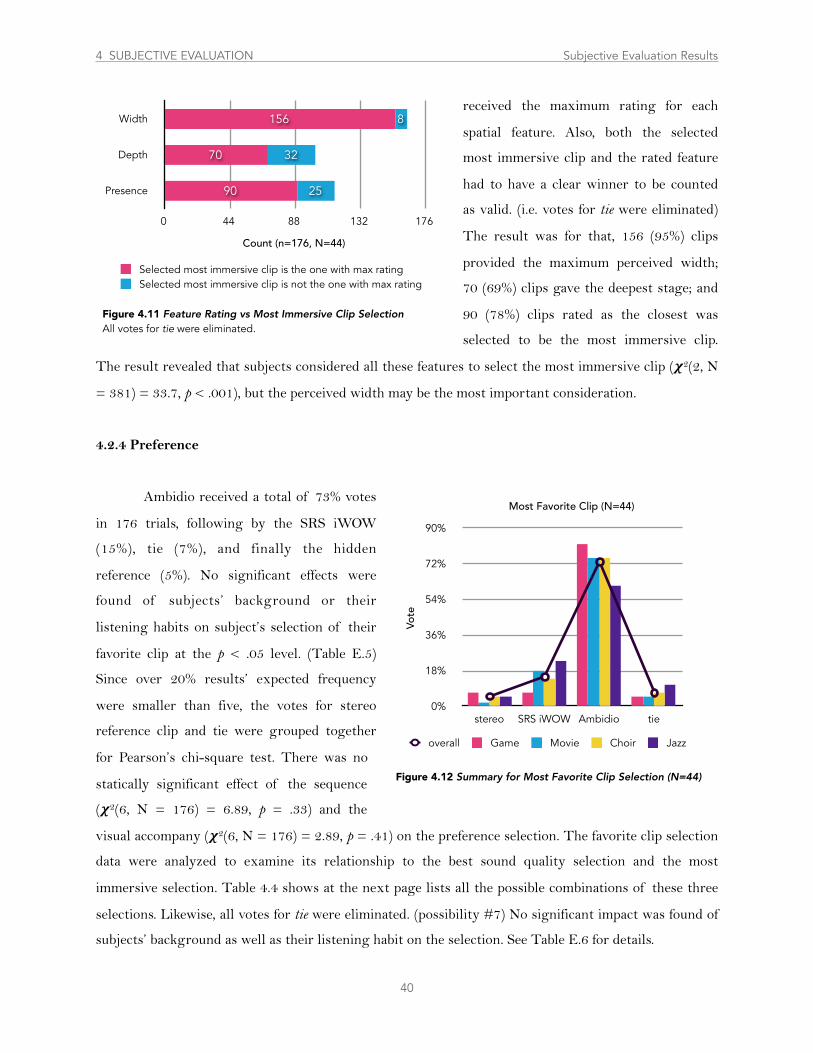
received the maximum rating for each
spatial feature. Also, both the selected
most immersive clip and the rated feature
had to have a clear winner to be counted
as valid. (i.e. votes for tie were eliminated)
The result was for that, 156 (95%) clips
provided the maximum perceived width;
70 (69%) clips gave the deepest stage; and
90 (78%) clips rated as the closest was
selected to be the most immersive clip.
The result revealed that subjects considered all these features to select the most immersive clip (!2(2, N
= 381) = 33.7, p < .001), but the perceived width may be the most important consideration.
4.2.4 Preference
Ambidio received a total of 73% votes
in 176 trials, following by the SRS iWOW
(15%), tie (7%), and finally the hidden
reference (5%). No significant effects were
found of subjects’ background or their
listening habits on subject’s selection of their
favorite clip at the p < .05 level. (Table E.5)
Since over 20% results’ expected frequency
were smaller than five, the votes for stereo
reference clip and tie were grouped together
for Pearson’s chi-square test. There was no
statically significant effect of the sequence
(!2(6, N = 176) = 6.89, p = .33) and the
visual accompany (!2(6, N = 176) = 2.89, p = .41) on the preference selection. The favorite clip selection
data were analyzed to examine its relationship to the best sound quality selection and the most
immersive selection. Table 4.4 shows at the next page lists all the possible combinations of these three
selections. Likewise, all votes for tie were eliminated. (possibility #7) No significant impact was found of
subjects’ background as well as their listening habit on the selection. See Table E.6 for details.
40
4 SUBJECTIVE EVALUATION Subjective Evaluation Results
Width
Depth
Presence
0 44 88 132 176
25
32
8
90
70
156
Count (n=176, N=44)
Selected most immersive clip is the one with max ratingSelected most immersive clip is not the one with max rating
Figure 4.11 Feature Rating vs Most Immersive Clip SelectionAll votes for tie were eliminated.
Figure 4.12 Summary for Most Favorite Clip Selection (N=44)
overall Game Movie Choir Jazz
0%
18%
36%
54%
72%
90%
stereo SRS iWOW Ambidio tie
Most Favorite Clip (N=44)
Vote
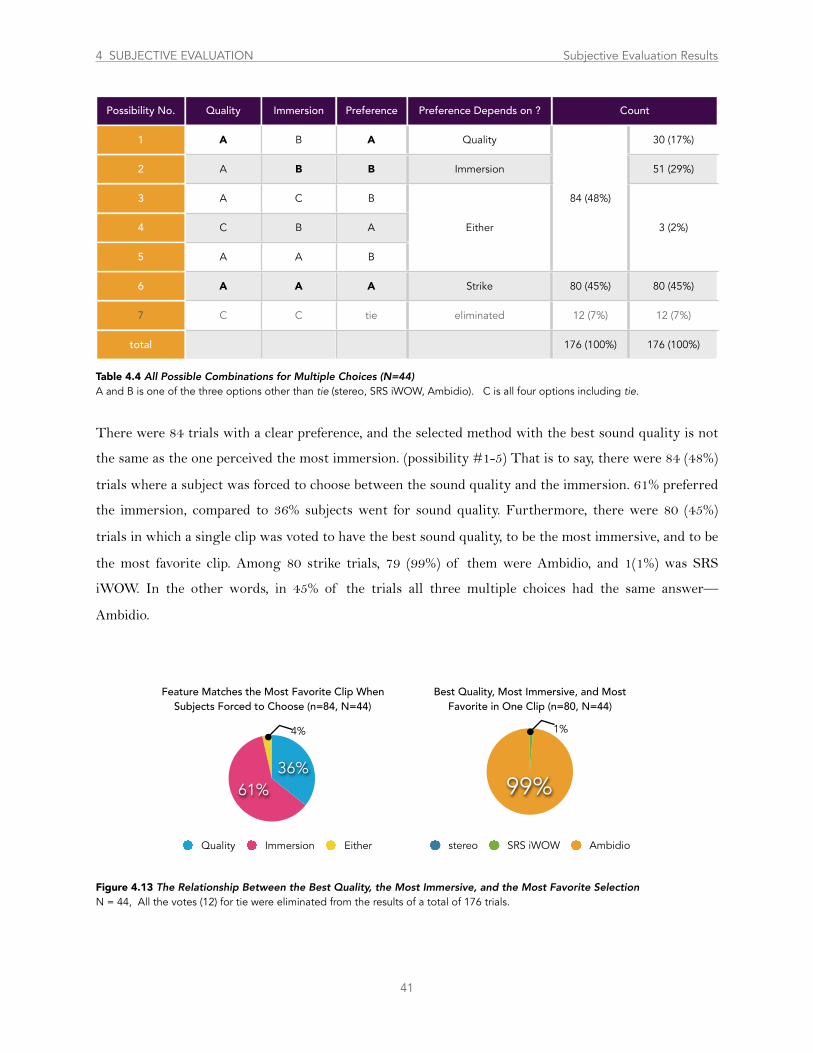
Possibility No. Quality Immersion Preference Preference Depends on ? CountCount
1 A B A Quality
84 (48%)
30 (17%)
2 A B B Immersion
84 (48%)
51 (29%)
3 A C B
Either
84 (48%)
3 (2%)4 C B A Either
84 (48%)
3 (2%)
5 A A B
Either
84 (48%)
3 (2%)
6 A A A Strike 80 (45%) 80 (45%)
7 C C tie eliminated 12 (7%) 12 (7%)
total 176 (100%) 176 (100%)
There were 84 trials with a clear preference, and the selected method with the best sound quality is not
the same as the one perceived the most immersion. (possibility #1-5) That is to say, there were 84 (48%)
trials where a subject was forced to choose between the sound quality and the immersion. 61% preferred
the immersion, compared to 36% subjects went for sound quality. Furthermore, there were 80 (45%)
trials in which a single clip was voted to have the best sound quality, to be the most immersive, and to be
the most favorite clip. Among 80 strike trials, 79 (99%) of them were Ambidio, and 1(1%) was SRS
iWOW. In the other words, in 45% of the trials all three multiple choices had the same answer—
Ambidio.
41
4 SUBJECTIVE EVALUATION Subjective Evaluation Results
Table 4.4 All Possible Combinations for Multiple Choices (N=44)A and B is one of the three options other than tie (stereo, SRS iWOW, Ambidio). C is all four options including tie.
Figure 4.13 The Relationship Between the Best Quality, the Most Immersive, and the Most Favorite SelectionN = 44, All the votes (12) for tie were eliminated from the results of a total of 176 trials.
99%
stereo SRS iWOW Ambidio
Best Quality, Most Immersive, and Most Favorite in One Clip (n=80, N=44)
1%4%
61%36%
Quality Immersion Either
Feature Matches the Most Favorite Clip When Subjects Forced to Choose (n=84, N=44)
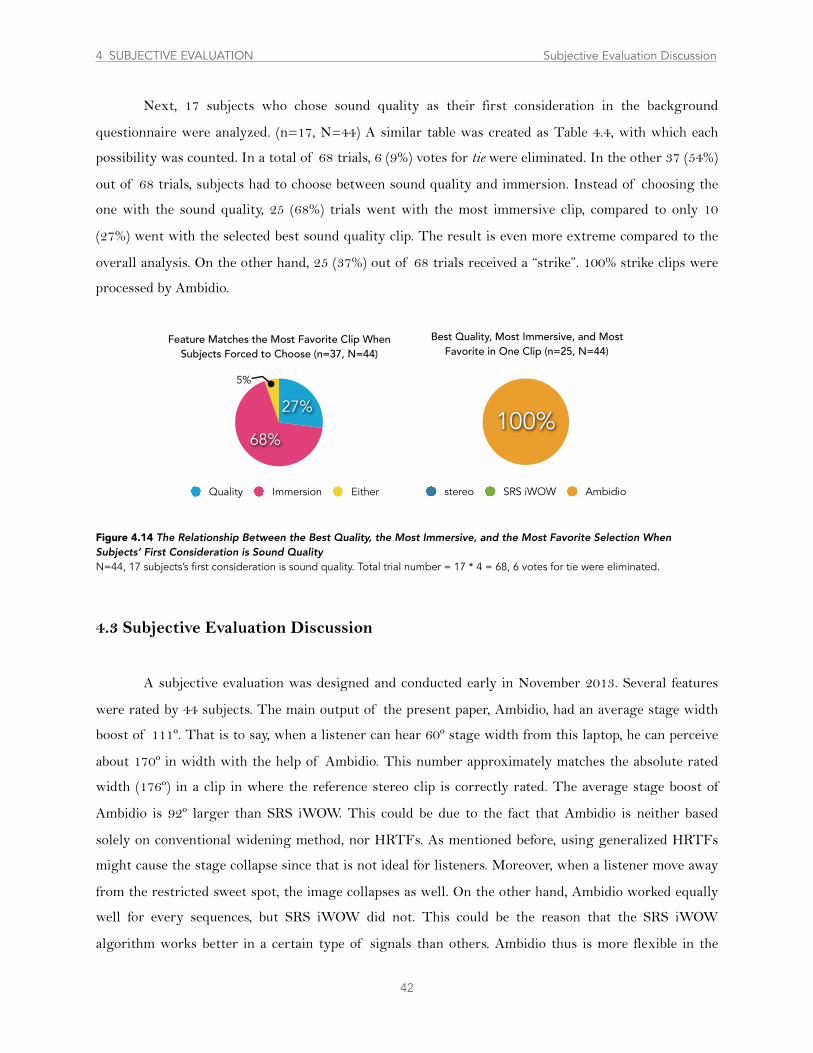
Next, 17 subjects who chose sound quality as their first consideration in the background
questionnaire were analyzed. (n=17, N=44) A similar table was created as Table 4.4, with which each
possibility was counted. In a total of 68 trials, 6 (9%) votes for tie were eliminated. In the other 37 (54%)
out of 68 trials, subjects had to choose between sound quality and immersion. Instead of choosing the
one with the sound quality, 25 (68%) trials went with the most immersive clip, compared to only 10
(27%) went with the selected best sound quality clip. The result is even more extreme compared to the
overall analysis. On the other hand, 25 (37%) out of 68 trials received a “strike”. 100% strike clips were
processed by Ambidio.
4.3 Subjective Evaluation Discussion
A subjective evaluation was designed and conducted early in November 2013. Several features
were rated by 44 subjects. The main output of the present paper, Ambidio, had an average stage width
boost of 111º. That is to say, when a listener can hear 60º stage width from this laptop, he can perceive
about 170º in width with the help of Ambidio. This number approximately matches the absolute rated
width (176º) in a clip in where the reference stereo clip is correctly rated. The average stage boost of
Ambidio is 92º larger than SRS iWOW. This could be due to the fact that Ambidio is neither based
solely on conventional widening method, nor HRTFs. As mentioned before, using generalized HRTFs
might cause the stage collapse since that is not ideal for listeners. Moreover, when a listener move away
from the restricted sweet spot, the image collapses as well. On the other hand, Ambidio worked equally
well for every sequences, but SRS iWOW did not. This could be the reason that the SRS iWOW
algorithm works better in a certain type of signals than others. Ambidio thus is more flexible in the
42
4 SUBJECTIVE EVALUATION Subjective Evaluation Discussion
Quality Immersion Either
68%
27%
5%
Feature Matches the Most Favorite Clip When Subjects Forced to Choose (n=37, N=44)
100%
stereo SRS iWOW Ambidio
Best Quality, Most Immersive, and Most Favorite in One Clip (n=25, N=44)
Figure 4.14 The Relationship Between the Best Quality, the Most Immersive, and the Most Favorite Selection When Subjects’ First Consideration is Sound QualityN=44, 17 subjects’s first consideration is sound quality. Total trial number = 17 * 4 = 68, 6 votes for tie were eliminated.
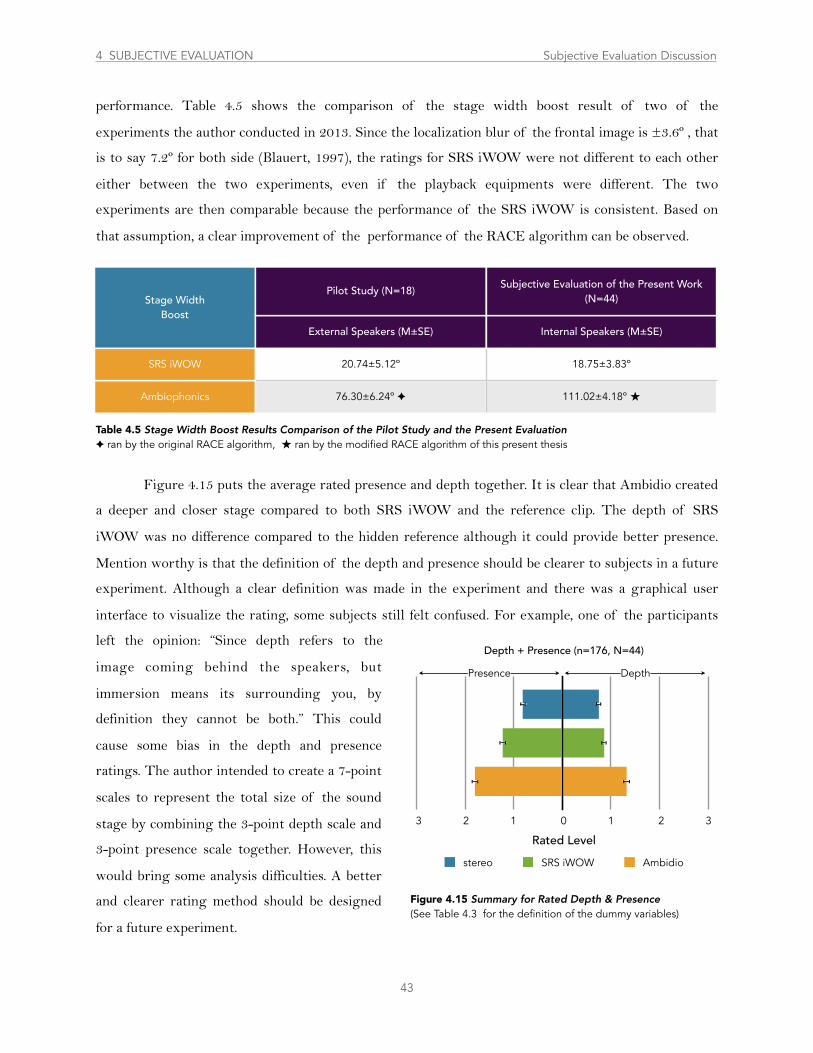
performance. Table 4.5 shows the comparison of the stage width boost result of two of the
experiments the author conducted in 2013. Since the localization blur of the frontal image is ±3.6º , that
is to say 7.2º for both side (Blauert, 1997), the ratings for SRS iWOW were not different to each other
either between the two experiments, even if the playback equipments were different. The two
experiments are then comparable because the performance of the SRS iWOW is consistent. Based on
that assumption, a clear improvement of the performance of the RACE algorithm can be observed.
Figure 4.15 puts the average rated presence and depth together. It is clear that Ambidio created
a deeper and closer stage compared to both SRS iWOW and the reference clip. The depth of SRS
iWOW was no difference compared to the hidden reference although it could provide better presence.
Mention worthy is that the definition of the depth and presence should be clearer to subjects in a future
experiment. Although a clear definition was made in the experiment and there was a graphical user
interface to visualize the rating, some subjects still felt confused. For example, one of the participants
left the opinion: “Since depth refers to the
image coming behind the speakers, but
immersion means its surrounding you, by
definition they cannot be both.” This could
cause some bias in the depth and presence
ratings. The author intended to create a 7-point
scales to represent the total size of the sound
stage by combining the 3-point depth scale and
3-point presence scale together. However, this
would bring some analysis difficulties. A better
and clearer rating method should be designed
for a future experiment.
43
Table 4.5 Stage Width Boost Results Comparison of the Pilot Study and the Present Evaluation✦ ran by the original RACE algorithm, � ran by the modified RACE algorithm of this present thesis
Depth + Presence (n=176, N=44)
stereo SRS iWOW Ambidio
Rated Level3 2 1 0 1 2 3
DepthPresence
Figure 4.15 Summary for Rated Depth & Presence (See Table 4.3 for the definition of the dummy variables)
Stage WidthBoost
Pilot Study (N=18) Subjective Evaluation of the Present Work (N=44)Stage Width
BoostExternal Speakers (M±SE) Internal Speakers (M±SE)
SRS iWOW 20.74±5.12º 18.75±3.83º
Ambiophonics 76.30±6.24º ✦ 111.02±4.18º �
4 SUBJECTIVE EVALUATION Subjective Evaluation Discussion
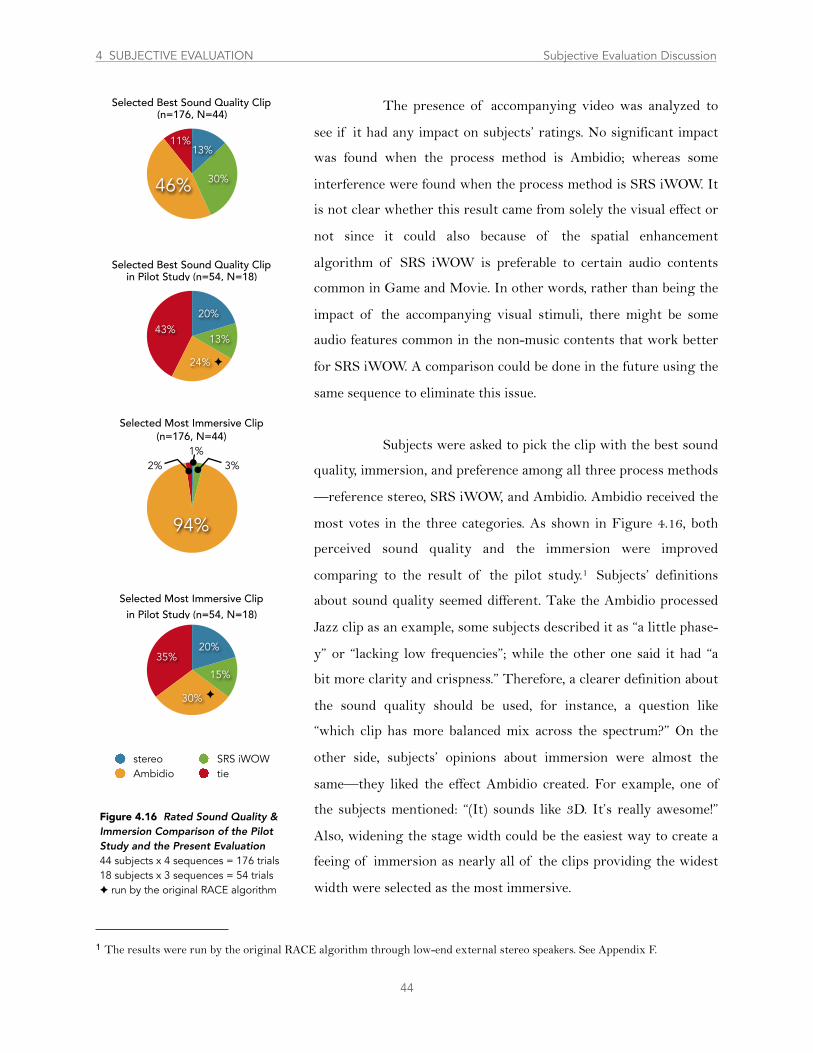
The presence of accompanying video was analyzed to
see if it had any impact on subjects’ ratings. No significant impact
was found when the process method is Ambidio; whereas some
interference were found when the process method is SRS iWOW. It
is not clear whether this result came from solely the visual effect or
not since it could also because of the spatial enhancement
algorithm of SRS iWOW is preferable to certain audio contents
common in Game and Movie. In other words, rather than being the
impact of the accompanying visual stimuli, there might be some
audio features common in the non-music contents that work better
for SRS iWOW. A comparison could be done in the future using the
same sequence to eliminate this issue.
Subjects were asked to pick the clip with the best sound
quality, immersion, and preference among all three process methods
—reference stereo, SRS iWOW, and Ambidio. Ambidio received the
most votes in the three categories. As shown in Figure 4.16, both
perceived sound quality and the immersion were improved
comparing to the result of the pilot study.1 Subjects’ definitions
about sound quality seemed different. Take the Ambidio processed
Jazz clip as an example, some subjects described it as “a little phase-
y” or “lacking low frequencies”; while the other one said it had “a
bit more clarity and crispness.” Therefore, a clearer definition about
the sound quality should be used, for instance, a question like
“which clip has more balanced mix across the spectrum?” On the
other side, subjects’ opinions about immersion were almost the
same—they liked the effect Ambidio created. For example, one of
the subjects mentioned: “(It) sounds like 3D. It’s really awesome!”
Also, widening the stage width could be the easiest way to create a
feeing of immersion as nearly all of the clips providing the widest
width were selected as the most immersive.
44
1 The results were run by the original RACE algorithm through low-end external stereo speakers. See Appendix F.
4 SUBJECTIVE EVALUATION Subjective Evaluation Discussion
Figure 4.16 Rated Sound Quality & Immersion Comparison of the Pilot Study and the Present Evaluation44 subjects x 4 sequences = 176 trials18 subjects x 3 sequences = 54 trials✦ run by the original RACE algorithm
stereo SRS iWOWAmbidio tie
43%
24%
13%
20%
Selected Best Sound Quality Clipin Pilot Study (n=54, N=18)
✦
35%
30%
15%
20%
Selected Most Immersive Clipin Pilot Study (n=54, N=18)
✦
11%
46% 30%
13%
Selected Best Sound Quality Clip(n=176, N=44)
94%
(n=176, N=44)1%
3%2%
Selected Most Immersive Clip
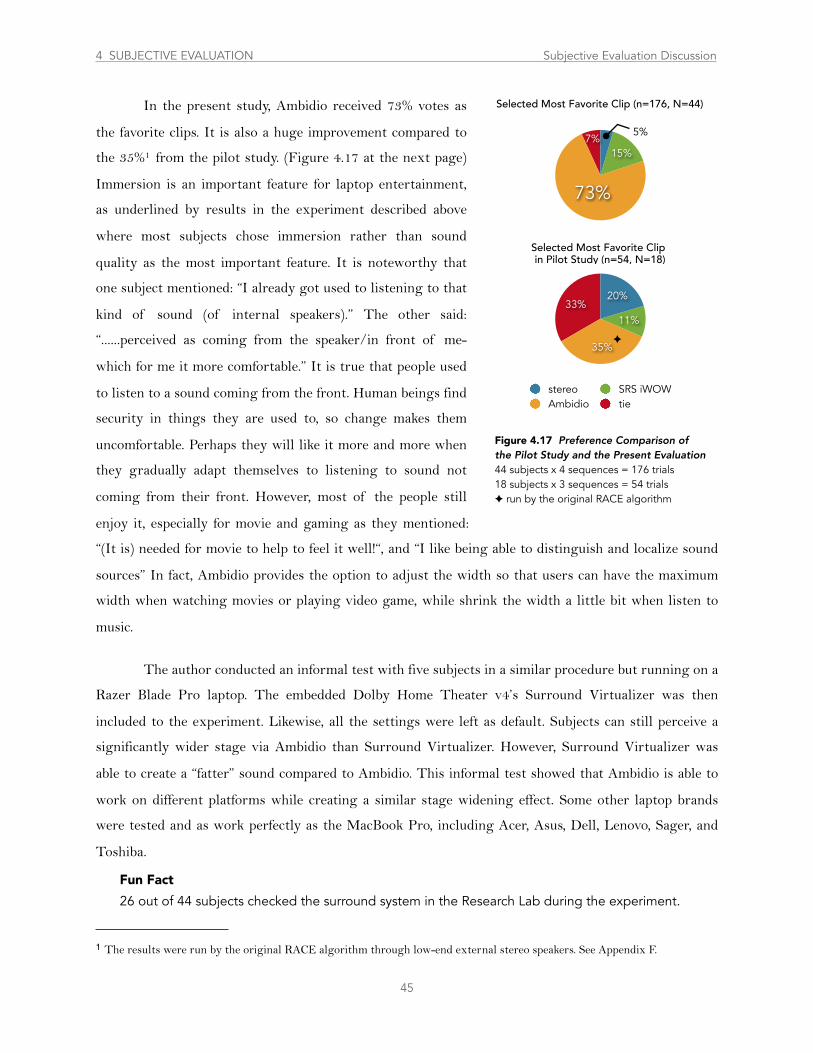
In the present study, Ambidio received 73% votes as
the favorite clips. It is also a huge improvement compared to
the 35%1 from the pilot study. (Figure 4.17 at the next page)
Immersion is an important feature for laptop entertainment,
as underlined by results in the experiment described above
where most subjects chose immersion rather than sound
quality as the most important feature. It is noteworthy that
one subject mentioned: “I already got used to listening to that
kind of sound (of internal speakers).” The other said:
“......perceived as coming from the speaker/in front of me-
which for me it more comfortable.” It is true that people used
to listen to a sound coming from the front. Human beings find
security in things they are used to, so change makes them
uncomfortable. Perhaps they will like it more and more when
they gradually adapt themselves to listening to sound not
coming from their front. However, most of the people still
enjoy it, especially for movie and gaming as they mentioned:
“(It is) needed for movie to help to feel it well!“, and “I like being able to distinguish and localize sound
sources” In fact, Ambidio provides the option to adjust the width so that users can have the maximum
width when watching movies or playing video game, while shrink the width a little bit when listen to
music.
The author conducted an informal test with five subjects in a similar procedure but running on a
Razer Blade Pro laptop. The embedded Dolby Home Theater v4’s Surround Virtualizer was then
included to the experiment. Likewise, all the settings were left as default. Subjects can still perceive a
significantly wider stage via Ambidio than Surround Virtualizer. However, Surround Virtualizer was
able to create a “fatter” sound compared to Ambidio. This informal test showed that Ambidio is able to
work on different platforms while creating a similar stage widening effect. Some other laptop brands
were tested and as work perfectly as the MacBook Pro, including Acer, Asus, Dell, Lenovo, Sager, and
Toshiba.
45
1 The results were run by the original RACE algorithm through low-end external stereo speakers. See Appendix F.
33%
35%
11%
20%
Selected Most Favorite Clip
stereo SRS iWOWAmbidio tie
7%
73%
15%
Selected Most Favorite Clip (n=176, N=44)
5%
Figure 4.17 Preference Comparison of the Pilot Study and the Present Evaluation44 subjects x 4 sequences = 176 trials18 subjects x 3 sequences = 54 trials✦ run by the original RACE algorithm
in Pilot Study (n=54, N=18)
✦
4 SUBJECTIVE EVALUATION Subjective Evaluation Discussion
26 out of 44 subjects checked the surround system in the Research Lab during the experiment.
Fun Fact
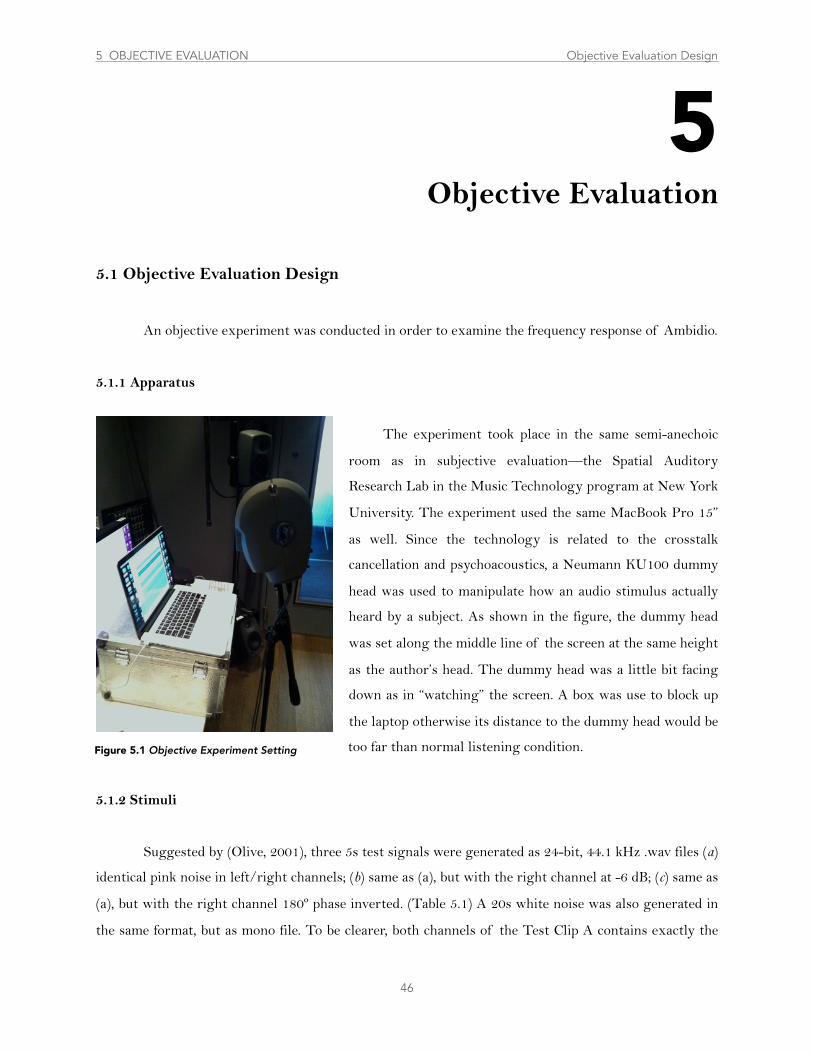
5.1 Objective Evaluation Design
An objective experiment was conducted in order to examine the frequency response of Ambidio.
5.1.1 Apparatus
The experiment took place in the same semi-anechoic
room as in subjective evaluation––the Spatial Auditory
Research Lab in the Music Technology program at New York
University. The experiment used the same MacBook Pro 15”
as well. Since the technology is related to the crosstalk
cancellation and psychoacoustics, a Neumann KU100 dummy
head was used to manipulate how an audio stimulus actually
heard by a subject. As shown in the figure, the dummy head
was set along the middle line of the screen at the same height
as the author’s head. The dummy head was a little bit facing
down as in “watching” the screen. A box was use to block up
the laptop otherwise its distance to the dummy head would be
too far than normal listening condition.
5.1.2 Stimuli
Suggested by (Olive, 2001), three 5s test signals were generated as 24-bit, 44.1 kHz .wav files (a)
identical pink noise in left/right channels; (b) same as (a), but with the right channel at -6 dB; (c) same as
(a), but with the right channel 180º phase inverted. (Table 5.1) A 20s white noise was also generated in
the same format, but as mono file. To be clearer, both channels of the Test Clip A contains exactly the
46
5Objective Evaluation
5 OBJECTIVE EVALUATION Objective Evaluation Design
Figure 5.1 Objective Experiment Setting
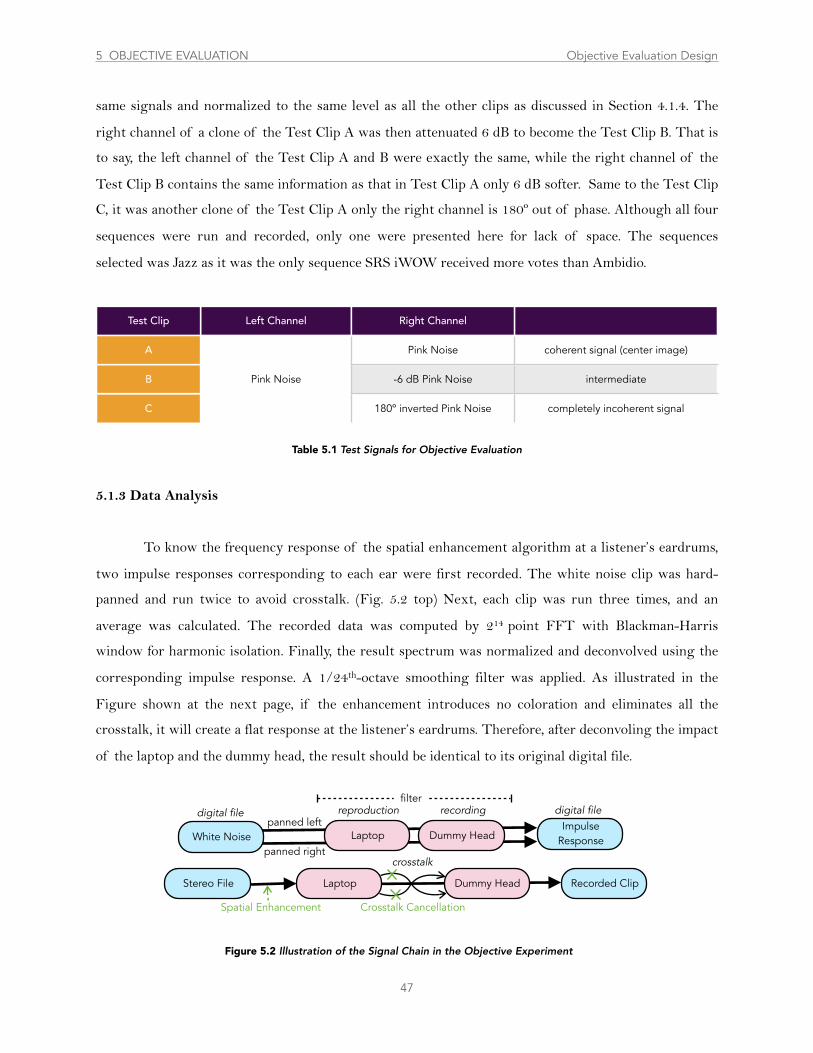
same signals and normalized to the same level as all the other clips as discussed in Section 4.1.4. The
right channel of a clone of the Test Clip A was then attenuated 6 dB to become the Test Clip B. That is
to say, the left channel of the Test Clip A and B were exactly the same, while the right channel of the
Test Clip B contains the same information as that in Test Clip A only 6 dB softer. Same to the Test Clip
C, it was another clone of the Test Clip A only the right channel is 180º out of phase. Although all four
sequences were run and recorded, only one were presented here for lack of space. The sequences
selected was Jazz as it was the only sequence SRS iWOW received more votes than Ambidio.
Test Clip Left Channel Right Channel
A
Pink Noise
Pink Noise coherent signal (center image)
B Pink Noise -6 dB Pink Noise intermediate
C
Pink Noise
180º inverted Pink Noise completely incoherent signal
5.1.3 Data Analysis
To know the frequency response of the spatial enhancement algorithm at a listener’s eardrums,
two impulse responses corresponding to each ear were first recorded. The white noise clip was hard-
panned and run twice to avoid crosstalk. (Fig. 5.2 top) Next, each clip was run three times, and an
average was calculated. The recorded data was computed by 214 point FFT with Blackman-Harris
window for harmonic isolation. Finally, the result spectrum was normalized and deconvolved using the
corresponding impulse response. A 1/24th-octave smoothing filter was applied. As illustrated in the
Figure shown at the next page, if the enhancement introduces no coloration and eliminates all the
crosstalk, it will create a flat response at the listener’s eardrums. Therefore, after deconvoling the impact
of the laptop and the dummy head, the result should be identical to its original digital file.
47
Table 5.1 Test Signals for Objective Evaluation
White Noise Laptop Dummy HeadImpulse
Response
filter
panned left
panned right
digital file reproduction recording digital file
Spatial Enhancement
Laptop Dummy Head Recorded ClipStereo File
crosstalk
Crosstalk Cancellation
Figure 5.2 Illustration of the Signal Chain in the Objective Experiment
5 OBJECTIVE EVALUATION Objective Evaluation Design
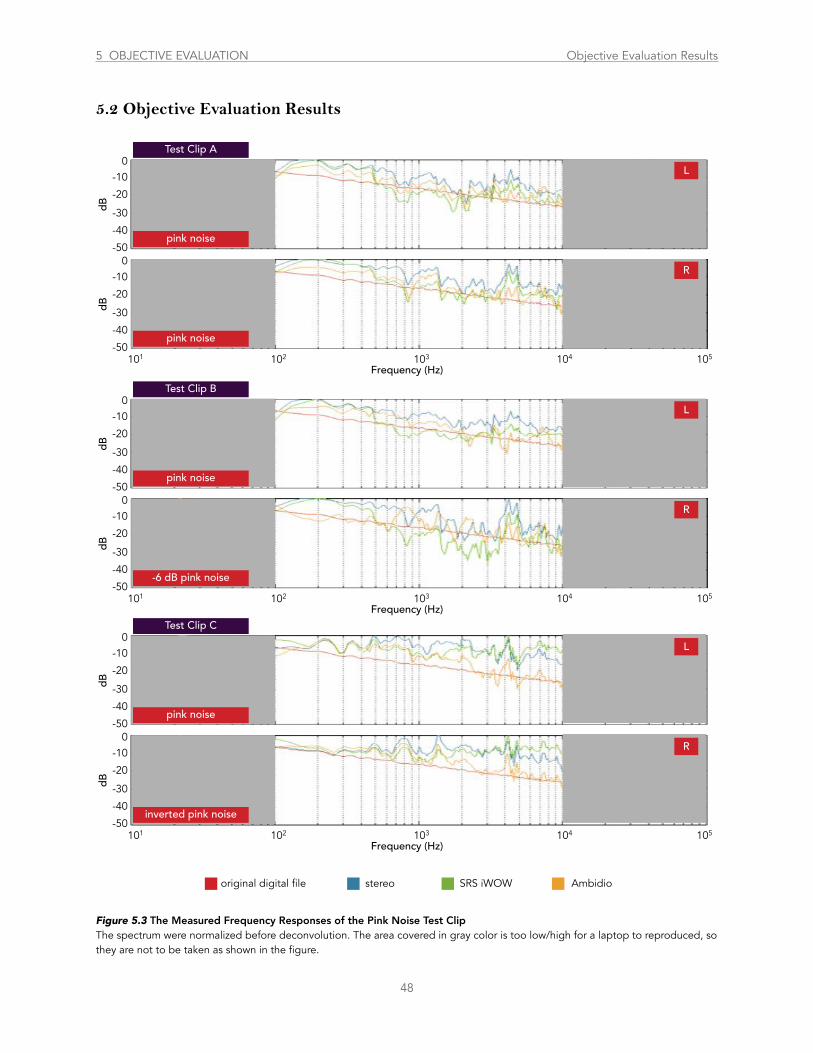
5.2 Objective Evaluation Results
48
5 OBJECTIVE EVALUATION Objective Evaluation Results
Figure 5.3 The Measured Frequency Responses of the Pink Noise Test ClipThe spectrum were normalized before deconvolution. The area covered in gray color is too low/high for a laptop to reproduced, so they are not to be taken as shown in the figure.
101 102 103 104 105
0-10
-20
-30
-40
-50
dB
L
pink noise
0-10
-20
-30
-40
-50
dB
R
pink noise
Frequency (Hz)
101 102 103 104 105
0-10
-20
-30
-40
-50
dB
L
pink noise
0-10
-20
-30
-40
-50
dB
R
-6 dB pink noise
Frequency (Hz)
Test Clip A
Test Clip B
original digital file stereo SRS iWOW Ambidio
101 102 103 104 105
0-10
-20
-30
-40
-50
dB
L
pink noise
0-10
-20
-30
-40
-50
dB
R
inverted pink noise
Frequency (Hz)
Test Clip C
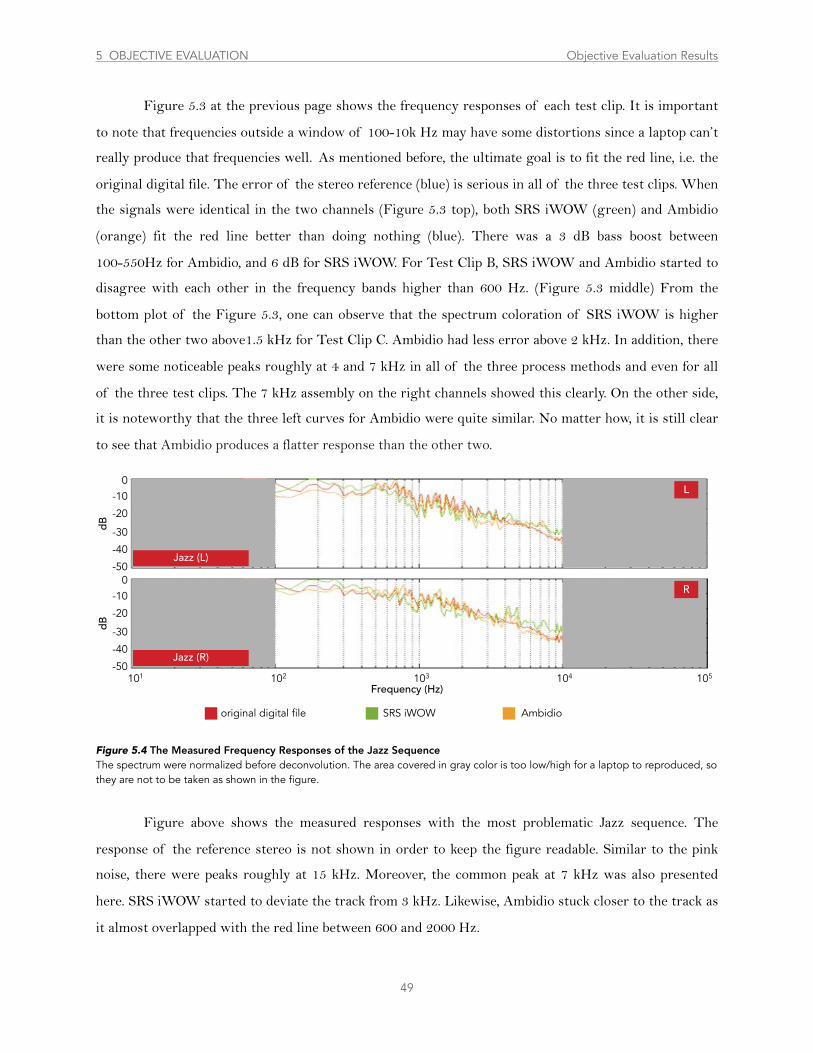
Figure 5.3 at the previous page shows the frequency responses of each test clip. It is important
to note that frequencies outside a window of 100-10k Hz may have some distortions since a laptop can’t
really produce that frequencies well. As mentioned before, the ultimate goal is to fit the red line, i.e. the
original digital file. The error of the stereo reference (blue) is serious in all of the three test clips. When
the signals were identical in the two channels (Figure 5.3 top), both SRS iWOW (green) and Ambidio
(orange) fit the red line better than doing nothing (blue). There was a 3 dB bass boost between
100-550Hz for Ambidio, and 6 dB for SRS iWOW. For Test Clip B, SRS iWOW and Ambidio started to
disagree with each other in the frequency bands higher than 600 Hz. (Figure 5.3 middle) From the
bottom plot of the Figure 5.3, one can observe that the spectrum coloration of SRS iWOW is higher
than the other two above1.5 kHz for Test Clip C. Ambidio had less error above 2 kHz. In addition, there
were some noticeable peaks roughly at 4 and 7 kHz in all of the three process methods and even for all
of the three test clips. The 7 kHz assembly on the right channels showed this clearly. On the other side,
it is noteworthy that the three left curves for Ambidio were quite similar. No matter how, it is still clear
to see that Ambidio produces a flatter response than the other two.
Figure above shows the measured responses with the most problematic Jazz sequence. The
response of the reference stereo is not shown in order to keep the figure readable. Similar to the pink
noise, there were peaks roughly at 15 kHz. Moreover, the common peak at 7 kHz was also presented
here. SRS iWOW started to deviate the track from 3 kHz. Likewise, Ambidio stuck closer to the track as
it almost overlapped with the red line between 600 and 2000 Hz.
49
Figure 5.4 The Measured Frequency Responses of the Jazz SequenceThe spectrum were normalized before deconvolution. The area covered in gray color is too low/high for a laptop to reproduced, so they are not to be taken as shown in the figure.
original digital file SRS iWOW Ambidio
101 102 103 104 105
0-10
-20
-30
-40
-50
dB
L
Jazz (L)
0-10
-20
-30
-40
-50
dB
R
Jazz (R)
Frequency (Hz)
5 OBJECTIVE EVALUATION Objective Evaluation Results
5.3 Objective Evaluation Discussion
The frequency response was measured and evaluated. The distortion of the stereo reference is
serious in all cases. Since there was no extra processing, such distortion was certainly due to crosstalk
signals. The more crosstalk signals are cleaned up, the less the spatial distortion, and the more
successful a spatial enhancement algorithm is. However, there may be a general issue besides the spatial
enhancement algorithms since there were peaks roughly at 4 and 7 kHz in all three process methods. This may cause by the impulse responses used in deconvolution as an average impulse response (20s
white noise ) rather than a true response. For this reason, the frequency response in the high frequency
bands might not be accurate and thus can’t complete deconvolve the filter of the signal chain.
The curves from SRS iWOW and Ambidio were quite similar in a completely coherent signal,
but when the incoherent components became larger, SRS iWOW starts to have distortions. Ambidio, on
the other hand, produced a frequency response that close to the spectrum of the original file. The
noticeable peak at 15 kHz might due to the imperfect speaker response correction, so that Ambidio and
the laptop failing to precisely cancel the crosstalk allow the error to rise close to that of stereo. It is
noteworthy that the human auditory system does not depend on these high frequencies to localize so the
crosstalk or a lack of crosstalk here won’t affect the spatial image. Moreover, observing the three left
channels’ plots, the three curves representing the same process method should be the same if the
crosstalk is perfectly cancelled. It is clear that only the left Ambidio curves were close to each other.
Say the low frequencies below 90 Hz are always perceived mono since the wavelength is too
large compared to the human head. Although there is no crosstalk there, an acoustic cancellation will
happened when a pair of opposite polarity signals being added up by the ears. A loss of bass is normal
when listening to a wideband out of phase signal by a pair of stereo loudspeakers. Based on this, the
bass loss in the Test Clip C is a must happened thing as in the curves of stereo and Ambidio, but not in
SRS iWOW. This may because its algorithm makes the output not fully out of phase. It is also
important to point out that, in the author’s own perspective, a laptop has problem to create such a low
frequency below 80 Hz. Therefore, the spectrum below 80 Hz should not be taken as shown.
50
5 OBJECTIVE EVALUATION Objective Evaluation Discussion
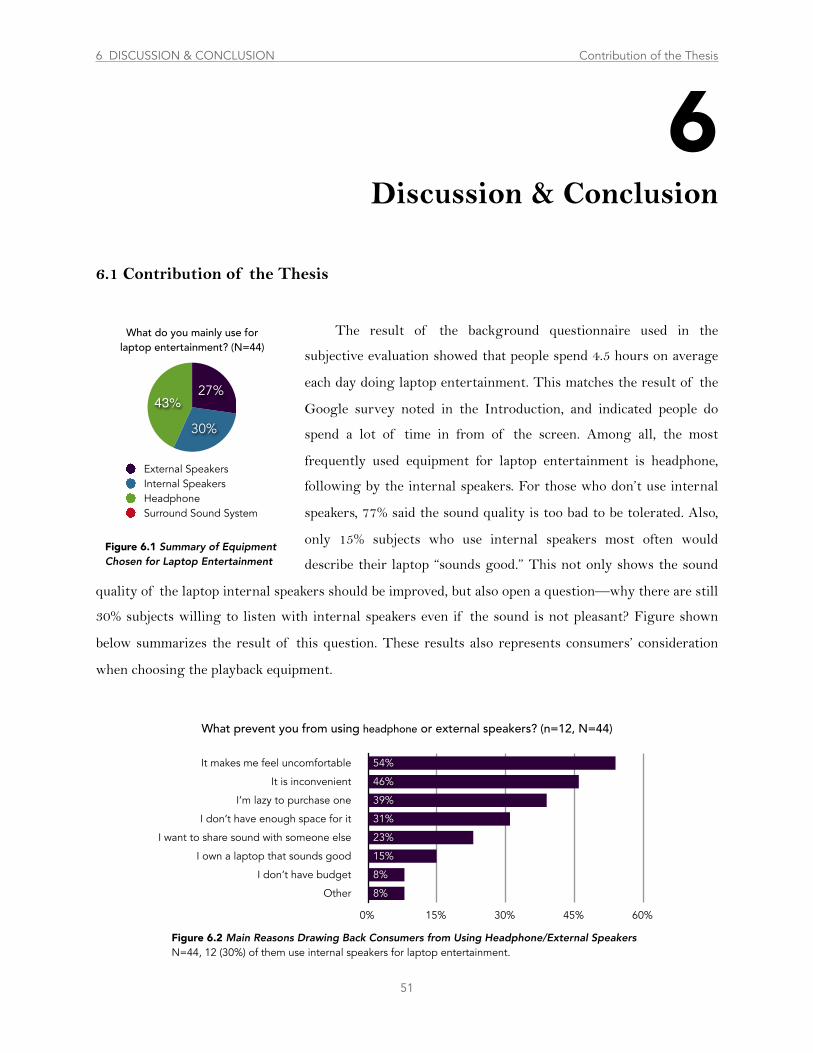
6.1 Contribution of the Thesis
The result of the background questionnaire used in the
subjective evaluation showed that people spend 4.5 hours on average
each day doing laptop entertainment. This matches the result of the
Google survey noted in the Introduction, and indicated people do
spend a lot of time in from of the screen. Among all, the most
frequently used equipment for laptop entertainment is headphone,
following by the internal speakers. For those who don’t use internal
speakers, 77% said the sound quality is too bad to be tolerated. Also,
only 15% subjects who use internal speakers most often would
describe their laptop “sounds good.” This not only shows the sound
quality of the laptop internal speakers should be improved, but also open a question––why there are still
30% subjects willing to listen with internal speakers even if the sound is not pleasant? Figure shown
below summarizes the result of this question. These results also represents consumers’ consideration
when choosing the playback equipment.
51
6Discussion & Conclusion
6 DISCUSSION & CONCLUSION Contribution of the Thesis d
Figure 6.2 Main Reasons Drawing Back Consumers from Using Headphone/External SpeakersN=44, 12 (30%) of them use internal speakers for laptop entertainment.
It makes me feel uncomfortable
It is inconvenient
I’m lazy to purchase one
I don’t have enough space for it
I want to share sound with someone else
I own a laptop that sounds good
I don’t have budget
Other
0% 15% 30% 45% 60%
8%
8%
15%
23%
31%
39%
46%
54%
What prevent you from using headphone or external speakers? (n=12, N=44)
43%
30%
27%
External SpeakersInternal SpeakersHeadphoneSurround Sound System
What do you mainly use for laptop entertainment? (N=44)
Figure 6.1 Summary of Equipment Chosen for Laptop Entertainment
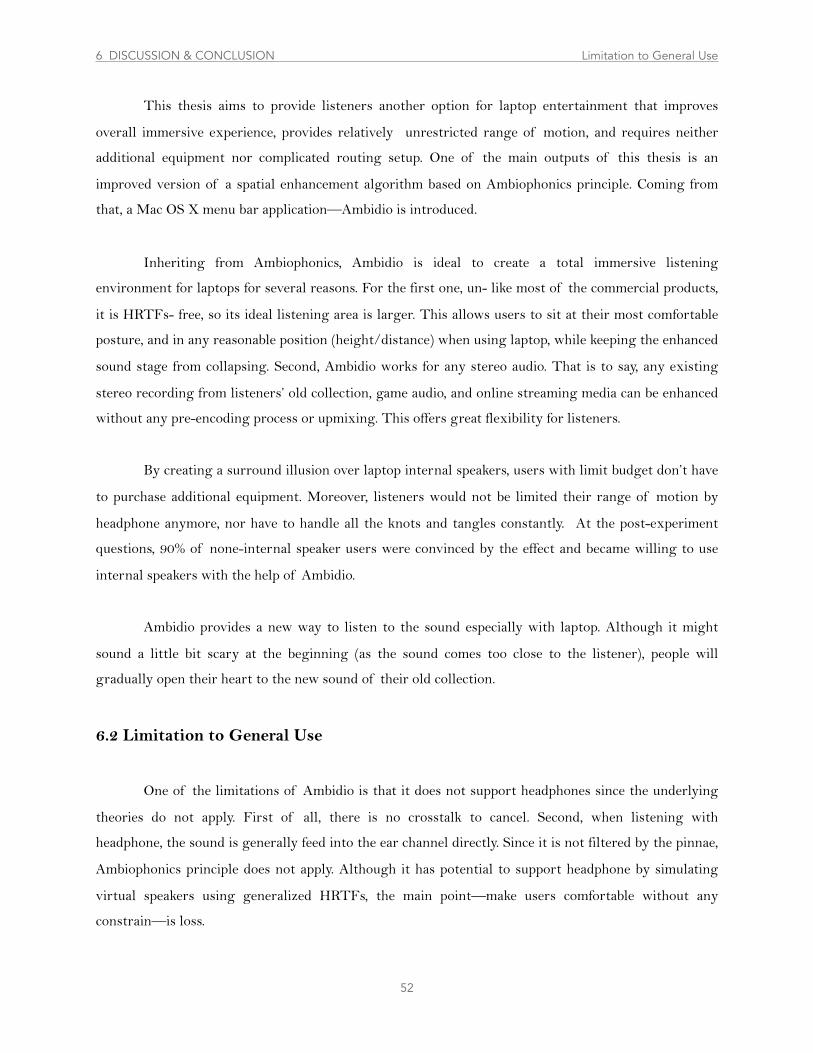
This thesis aims to provide listeners another option for laptop entertainment that improves
overall immersive experience, provides relatively unrestricted range of motion, and requires neither
additional equipment nor complicated routing setup. One of the main outputs of this thesis is an
improved version of a spatial enhancement algorithm based on Ambiophonics principle. Coming from
that, a Mac OS X menu bar application––Ambidio is introduced.
Inheriting from Ambiophonics, Ambidio is ideal to create a total immersive listening
environment for laptops for several reasons. For the first one, un- like most of the commercial products,
it is HRTFs- free, so its ideal listening area is larger. This allows users to sit at their most comfortable
posture, and in any reasonable position (height/distance) when using laptop, while keeping the enhanced
sound stage from collapsing. Second, Ambidio works for any stereo audio. That is to say, any existing
stereo recording from listeners’ old collection, game audio, and online streaming media can be enhanced
without any pre-encoding process or upmixing. This offers great flexibility for listeners.
By creating a surround illusion over laptop internal speakers, users with limit budget don’t have
to purchase additional equipment. Moreover, listeners would not be limited their range of motion by
headphone anymore, nor have to handle all the knots and tangles constantly. At the post-experiment
questions, 90% of none-internal speaker users were convinced by the effect and became willing to use
internal speakers with the help of Ambidio.
Ambidio provides a new way to listen to the sound especially with laptop. Although it might
sound a little bit scary at the beginning (as the sound comes too close to the listener), people will
gradually open their heart to the new sound of their old collection.
6.2 Limitation to General Use
One of the limitations of Ambidio is that it does not support headphones since the underlying
theories do not apply. First of all, there is no crosstalk to cancel. Second, when listening with
headphone, the sound is generally feed into the ear channel directly. Since it is not filtered by the pinnae,
Ambiophonics principle does not apply. Although it has potential to support headphone by simulating
virtual speakers using generalized HRTFs, the main point––make users comfortable without any
constrain––is loss.
52
6 DISCUSSION & CONCLUSION Limitation to General Use d
On the other hand, no stage widening effect will be created from a mono sound. As discussed in
Chapter 2, human sound localization chain includes proper ITD, IID, and HRTFs as spectral cues. In a
normal stereo mixing, the panning information can be used as a markup ITD/IID. It is also possible
that the actual interaural cues were captured by a stereo microphone. Combining these information to a
listener's own HRTFs, an illusion can be created. Therefore, when there is no interaural differences
available (both channels identical), no realistic stage width can be auralized. This is also one of the
reasons that what the output of Ambidio highly depends on how the audio was recorded/mixed. Say if
a mixing engineer adding too many artificial reverb to a mix, although it will not be heard on the
conventional stereo configuration, all the ITD/IID created by the reverb will be recovered by Ambidio.
As a result, the signer will seems to be recorded in either a sewer, or in St. Peter's Basilica.
Although not much has been observed, the front-back reversal was reported by two out of 44
participants in the subjective experiment. The interaural cues for a front source and a back source are
identical, so people depend on their own HRTFs to distinguish between them. When listening with
Ambidio, the HRTFs are always from the frontal source, the laptop. Plus, the screen presents
accompanying visual cues at front. It is easy for the auditory system to decide such a sound is coming
from the front although it is not. This may be critical when people are playing video games. However,
they can adapt to it by analyzing the visual cues as they always are when listening through conventional
stereo. This can also be solved by adding two additional speakers at the back to provide the rear HRTFs,
or altering the spectrum of the content.
The last limitation of Ambidio is, unfortunately, it is designed for people with normal hearing
for now. The author conducted another informal test, in which subjects had to listen to the stimuli with
one ear plugged. The results shows that the sound stage can still extended in one side. However, no
actual subjects with hearing deficiency was tested.
6.3 Conclusions
With the increasing importance of media entertainment using consumer-grade hardware,
passive spatial enhancement techniques have the potential to expand the sound stage during playback,
thus providing a more immersive listening experience for gaming, movies, or pure music listening
purposes. This paper introduces a method, Ambidio, to extend the width of the sound stage for built-in
laptop loudspeakers. Ambidio relies on the traditional stereo inputs and does not need additional
53
6 DISCUSSION & CONCLUSION Conclusions d
preprocessing to extend the perceived stage width, immersiveness and realism. A subjective experiment
was conducted in which Ambidio was compared with a commercial spatial enhancement program—SRS
iWOW by 44 subjects in an acoustic controlled environment using laptop internal speakers. Results
from subjective tests indicate that the method presented here shows promise in significantly extending
the sound stage width, increasing the sense of immersion and minimizing spectral coloration.
6.4 Directions for Future Work
Although receiving 46% votes as the best sound quality clip, Ambidio received two negative
adjectives more than twice––“phase-y” and “shallow.” Both of these adjectives imply high frequency
distortion. An objective experiment should be conducted in order to examine the frequency response of
Ambidio and find a way to equalize that distortion if needed.
On the other side, even though it is only an application for Mac OS X for now, thanks to the
concept of the Ambiophonics, the algorithm of Ambidio is highly flexible that can fit to various
situation form PC, laptop, tablet, to sound bar, stereo loudspeakers, television, or even to surround
speakers and car audio system. More detailed works should be done for different platforms other than
laptop. Ambiophonics is a highly potential concept that can be used, and should be used, in daily
listening to get better sound and greater effect.
54
6 DISCUSSION & CONCLUSION Directions for Future Work d
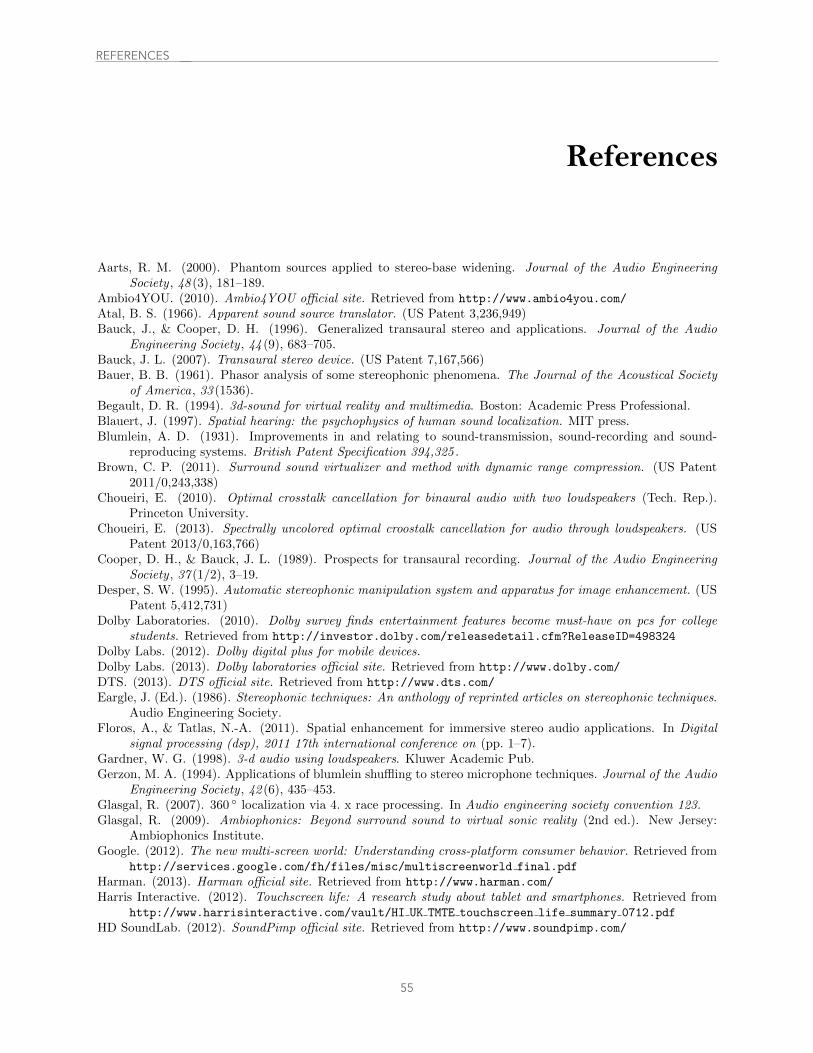
Independent Study Report: Sound Stage Extension Using Internal and External Stereo Speaker Tsai-Yi Wu May 15, 2013
References
Aarts, R. M. (2000). Phantom sources applied to stereo-base widening. Journal of the Audio EngineeringSociety , 48 (3), 181–189.
Ambio4YOU. (2010). Ambio4YOU o�cial site. Retrieved from http://www.ambio4you.com/Atal, B. S. (1966). Apparent sound source translator. (US Patent 3,236,949)Bauck, J., & Cooper, D. H. (1996). Generalized transaural stereo and applications. Journal of the Audio
Engineering Society , 44 (9), 683–705.Bauck, J. L. (2007). Transaural stereo device. (US Patent 7,167,566)Bauer, B. B. (1961). Phasor analysis of some stereophonic phenomena. The Journal of the Acoustical Society
of America, 33 (1536).Begault, D. R. (1994). 3d-sound for virtual reality and multimedia. Boston: Academic Press Professional.Blauert, J. (1997). Spatial hearing: the psychophysics of human sound localization. MIT press.Blumlein, A. D. (1931). Improvements in and relating to sound-transmission, sound-recording and sound-
reproducing systems. British Patent Specification 394,325 .Brown, C. P. (2011). Surround sound virtualizer and method with dynamic range compression. (US Patent
2011/0,243,338)Choueiri, E. (2010). Optimal crosstalk cancellation for binaural audio with two loudspeakers (Tech. Rep.).
Princeton University.Choueiri, E. (2013). Spectrally uncolored optimal croostalk cancellation for audio through loudspeakers. (US
Patent 2013/0,163,766)Cooper, D. H., & Bauck, J. L. (1989). Prospects for transaural recording. Journal of the Audio Engineering
Society , 37 (1/2), 3–19.Desper, S. W. (1995). Automatic stereophonic manipulation system and apparatus for image enhancement. (US
Patent 5,412,731)Dolby Laboratories. (2010). Dolby survey finds entertainment features become must-have on pcs for college
students. Retrieved from http://investor.dolby.com/releasedetail.cfm?ReleaseID=498324Dolby Labs. (2012). Dolby digital plus for mobile devices.Dolby Labs. (2013). Dolby laboratories o�cial site. Retrieved from http://www.dolby.com/DTS. (2013). DTS o�cial site. Retrieved from http://www.dts.com/Eargle, J. (Ed.). (1986). Stereophonic techniques: An anthology of reprinted articles on stereophonic techniques.
Audio Engineering Society.Floros, A., & Tatlas, N.-A. (2011). Spatial enhancement for immersive stereo audio applications. In Digital
signal processing (dsp), 2011 17th international conference on (pp. 1–7).Gardner, W. G. (1998). 3-d audio using loudspeakers. Kluwer Academic Pub.Gerzon, M. A. (1994). Applications of blumlein shu✏ing to stereo microphone techniques. Journal of the Audio
Engineering Society , 42 (6), 435–453.Glasgal, R. (2007). 360 � localization via 4. x race processing. In Audio engineering society convention 123.Glasgal, R. (2009). Ambiophonics: Beyond surround sound to virtual sonic reality (2nd ed.). New Jersey:
Ambiophonics Institute.Google. (2012). The new multi-screen world: Understanding cross-platform consumer behavior. Retrieved from
http://services.google.com/fh/files/misc/multiscreenworld final.pdfHarman. (2013). Harman o�cial site. Retrieved from http://www.harman.com/Harris Interactive. (2012). Touchscreen life: A research study about tablet and smartphones. Retrieved from
http://www.harrisinteractive.com/vault/HI UK TMTE touchscreen life summary 0712.pdfHD SoundLab. (2012). SoundPimp o�cial site. Retrieved from http://www.soundpimp.com/Hofman, P. M., Van Riswick, J. G., & Van Opstal, A. J. (1998). Relearning sound localization with new ears.
Nature neuroscience, 1 (5), 417-421.Izhaki, R. (2013). Mixing audio: concepts, practices and tools. Focal Press.Jot, J., & Avendano, C. (2003). Spatial enhancement of audio recordings. In Audio engineering society
conference: 23rd international conference: Signal processing in audio recording and reproduction.Kendall, G. S. (1995a). A 3-d sound primer: directional hearing and stereo reproduction. Computer music
journal , 19 (4), 23–46.Kendall, G. S. (1995b). The decorrelation of audio signals and its impact on spatial imagery. Computer Music
Journal , 19 (4), 71–87.
12
55
References
REFERENCES
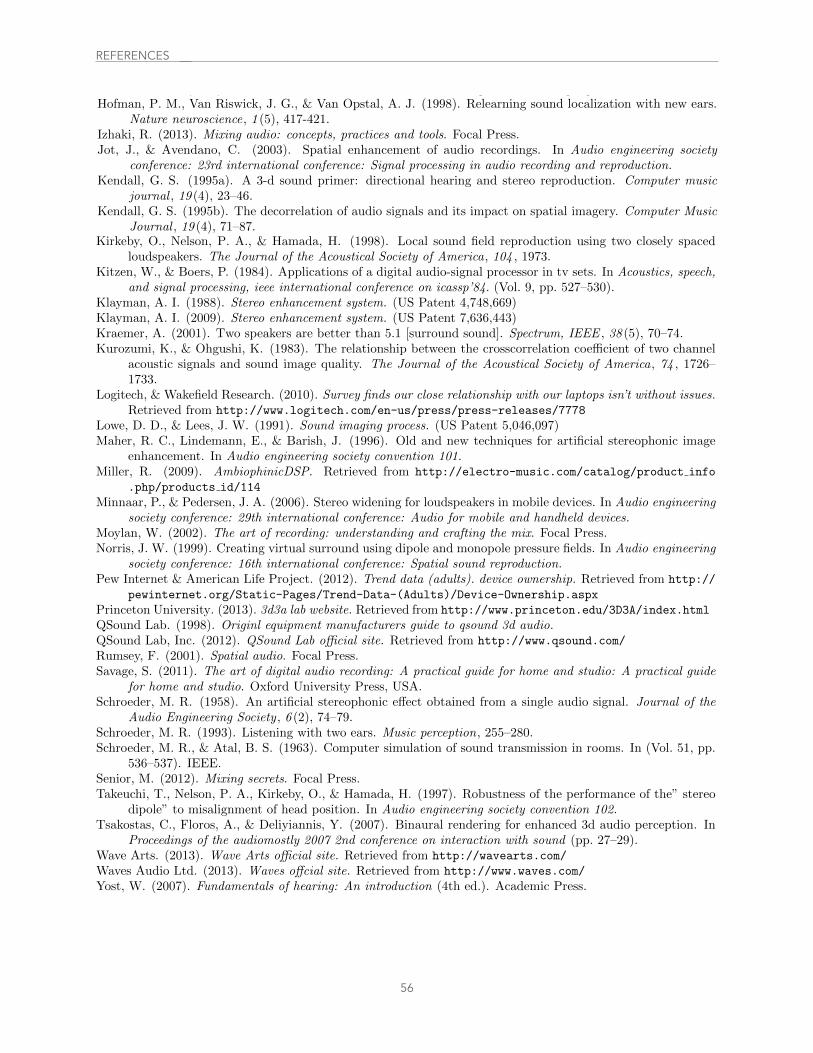
Independent Study Report: Sound Stage Extension Using Internal and External Stereo Speaker Tsai-Yi Wu May 15, 2013
References
Aarts, R. M. (2000). Phantom sources applied to stereo-base widening. Journal of the Audio EngineeringSociety , 48 (3), 181–189.
Ambio4YOU. (2010). Ambio4YOU o�cial site. Retrieved from http://www.ambio4you.com/Atal, B. S. (1966). Apparent sound source translator. (US Patent 3,236,949)Bauck, J., & Cooper, D. H. (1996). Generalized transaural stereo and applications. Journal of the Audio
Engineering Society , 44 (9), 683–705.Bauck, J. L. (2007). Transaural stereo device. (US Patent 7,167,566)Bauer, B. B. (1961). Phasor analysis of some stereophonic phenomena. The Journal of the Acoustical Society
of America, 33 (1536).Begault, D. R. (1994). 3d-sound for virtual reality and multimedia. Boston: Academic Press Professional.Blauert, J. (1997). Spatial hearing: the psychophysics of human sound localization. MIT press.Blumlein, A. D. (1931). Improvements in and relating to sound-transmission, sound-recording and sound-
reproducing systems. British Patent Specification 394,325 .Brown, C. P. (2011). Surround sound virtualizer and method with dynamic range compression. (US Patent
2011/0,243,338)Choueiri, E. (2010). Optimal crosstalk cancellation for binaural audio with two loudspeakers (Tech. Rep.).
Princeton University.Choueiri, E. (2013). Spectrally uncolored optimal croostalk cancellation for audio through loudspeakers. (US
Patent 2013/0,163,766)Cooper, D. H., & Bauck, J. L. (1989). Prospects for transaural recording. Journal of the Audio Engineering
Society , 37 (1/2), 3–19.Desper, S. W. (1995). Automatic stereophonic manipulation system and apparatus for image enhancement. (US
Patent 5,412,731)Dolby Laboratories. (2010). Dolby survey finds entertainment features become must-have on pcs for college
students. Retrieved from http://investor.dolby.com/releasedetail.cfm?ReleaseID=498324Dolby Labs. (2012). Dolby digital plus for mobile devices.Dolby Labs. (2013). Dolby laboratories o�cial site. Retrieved from http://www.dolby.com/DTS. (2013). DTS o�cial site. Retrieved from http://www.dts.com/Eargle, J. (Ed.). (1986). Stereophonic techniques: An anthology of reprinted articles on stereophonic techniques.
Audio Engineering Society.Floros, A., & Tatlas, N.-A. (2011). Spatial enhancement for immersive stereo audio applications. In Digital
signal processing (dsp), 2011 17th international conference on (pp. 1–7).Gardner, W. G. (1998). 3-d audio using loudspeakers. Kluwer Academic Pub.Gerzon, M. A. (1994). Applications of blumlein shu✏ing to stereo microphone techniques. Journal of the Audio
Engineering Society , 42 (6), 435–453.Glasgal, R. (2007). 360 � localization via 4. x race processing. In Audio engineering society convention 123.Glasgal, R. (2009). Ambiophonics: Beyond surround sound to virtual sonic reality (2nd ed.). New Jersey:
Ambiophonics Institute.Google. (2012). The new multi-screen world: Understanding cross-platform consumer behavior. Retrieved from
http://services.google.com/fh/files/misc/multiscreenworld final.pdfHarman. (2013). Harman o�cial site. Retrieved from http://www.harman.com/Harris Interactive. (2012). Touchscreen life: A research study about tablet and smartphones. Retrieved from
http://www.harrisinteractive.com/vault/HI UK TMTE touchscreen life summary 0712.pdfHD SoundLab. (2012). SoundPimp o�cial site. Retrieved from http://www.soundpimp.com/Hofman, P. M., Van Riswick, J. G., & Van Opstal, A. J. (1998). Relearning sound localization with new ears.
Nature neuroscience, 1 (5), 417-421.Izhaki, R. (2013). Mixing audio: concepts, practices and tools. Focal Press.Jot, J., & Avendano, C. (2003). Spatial enhancement of audio recordings. In Audio engineering society
conference: 23rd international conference: Signal processing in audio recording and reproduction.Kendall, G. S. (1995a). A 3-d sound primer: directional hearing and stereo reproduction. Computer music
journal , 19 (4), 23–46.Kendall, G. S. (1995b). The decorrelation of audio signals and its impact on spatial imagery. Computer Music
Journal , 19 (4), 71–87.
12
56
Independent Study Report: Sound Stage Extension Using Internal and External Stereo Speaker Tsai-Yi Wu May 15, 2013
Kirkeby, O., Nelson, P. A., & Hamada, H. (1998). Local sound field reproduction using two closely spacedloudspeakers. The Journal of the Acoustical Society of America, 104 , 1973.
Kitzen, W., & Boers, P. (1984). Applications of a digital audio-signal processor in tv sets. In Acoustics, speech,and signal processing, ieee international conference on icassp’84. (Vol. 9, pp. 527–530).
Klayman, A. I. (1988). Stereo enhancement system. (US Patent 4,748,669)Klayman, A. I. (2009). Stereo enhancement system. (US Patent 7,636,443)Kraemer, A. (2001). Two speakers are better than 5.1 [surround sound]. Spectrum, IEEE , 38 (5), 70–74.Kurozumi, K., & Ohgushi, K. (1983). The relationship between the crosscorrelation coe�cient of two channel
acoustic signals and sound image quality. The Journal of the Acoustical Society of America, 74 , 1726–1733.
Logitech, & Wakefield Research. (2010). Survey finds our close relationship with our laptops isn’t without issues.Retrieved from http://www.logitech.com/en-us/press/press-releases/7778
Lowe, D. D., & Lees, J. W. (1991). Sound imaging process. (US Patent 5,046,097)Maher, R. C., Lindemann, E., & Barish, J. (1996). Old and new techniques for artificial stereophonic image
enhancement. In Audio engineering society convention 101.Miller, R. (2009). AmbiophinicDSP. Retrieved from http://electro-music.com/catalog/product info
.php/products id/114Minnaar, P., & Pedersen, J. A. (2006). Stereo widening for loudspeakers in mobile devices. In Audio engineering
society conference: 29th international conference: Audio for mobile and handheld devices.Moylan, W. (2002). The art of recording: understanding and crafting the mix. Focal Press.Norris, J. W. (1999). Creating virtual surround using dipole and monopole pressure fields. In Audio engineering
society conference: 16th international conference: Spatial sound reproduction.Pew Internet & American Life Project. (2012). Trend data (adults). device ownership. Retrieved from http://
pewinternet.org/Static-Pages/Trend-Data-(Adults)/Device-Ownership.aspxPrinceton University. (2013). 3d3a lab website. Retrieved from http://www.princeton.edu/3D3A/index.htmlQSound Lab. (1998). Originl equipment manufacturers guide to qsound 3d audio.QSound Lab, Inc. (2012). QSound Lab o�cial site. Retrieved from http://www.qsound.com/Rumsey, F. (2001). Spatial audio. Focal Press.Savage, S. (2011). The art of digital audio recording: A practical guide for home and studio: A practical guide
for home and studio. Oxford University Press, USA.Schroeder, M. R. (1958). An artificial stereophonic e↵ect obtained from a single audio signal. Journal of the
Audio Engineering Society , 6 (2), 74–79.Schroeder, M. R. (1993). Listening with two ears. Music perception, 255–280.Schroeder, M. R., & Atal, B. S. (1963). Computer simulation of sound transmission in rooms. In (Vol. 51, pp.
536–537). IEEE.Senior, M. (2012). Mixing secrets. Focal Press.Takeuchi, T., Nelson, P. A., Kirkeby, O., & Hamada, H. (1997). Robustness of the performance of the” stereo
dipole” to misalignment of head position. In Audio engineering society convention 102.Tsakostas, C., Floros, A., & Deliyiannis, Y. (2007). Binaural rendering for enhanced 3d audio perception. In
Proceedings of the audiomostly 2007 2nd conference on interaction with sound (pp. 27–29).Wave Arts. (2013). Wave Arts o�cial site. Retrieved from http://wavearts.com/Waves Audio Ltd. (2013). Waves o↵cial site. Retrieved from http://www.waves.com/Yost, W. (2007). Fundamentals of hearing: An introduction (4th ed.). Academic Press.
13
REFERENCES
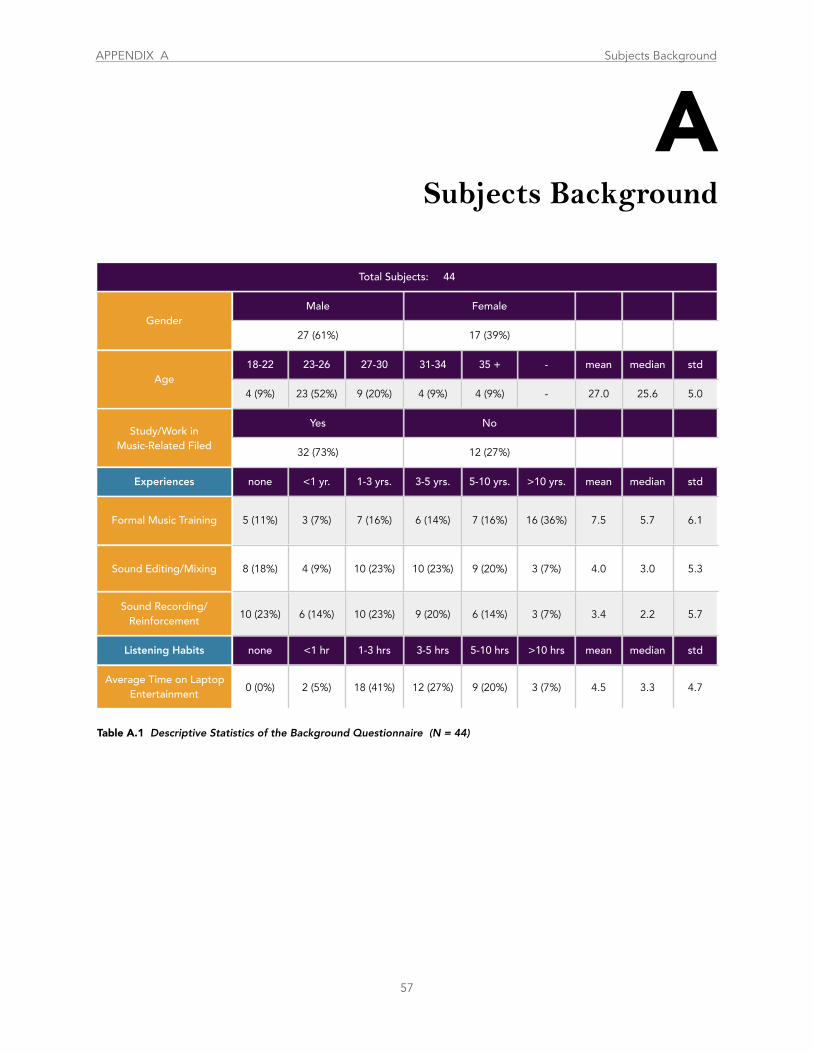
Total Subjects: 44Total Subjects: 44Total Subjects: 44Total Subjects: 44Total Subjects: 44Total Subjects: 44Total Subjects: 44Total Subjects: 44Total Subjects: 44Total Subjects: 44
GenderMaleMaleMale FemaleFemaleFemale
Gender27 (61%)27 (61%)27 (61%) 17 (39%)17 (39%)17 (39%)
Age18-22 23-26 27-30 31-34 35 + - mean median std
Age4 (9%) 23 (52%) 9 (20%) 4 (9%) 4 (9%) - 27.0 25.6 5.0
Study/Work inMusic-Related Filed
YesYesYes NoNoNoStudy/Work in
Music-Related Filed32 (73%)32 (73%)32 (73%) 12 (27%)12 (27%)12 (27%)
Experiences none <1 yr. 1-3 yrs. 3-5 yrs. 5-10 yrs. >10 yrs. mean median std
Formal Music Training 5 (11%) 3 (7%) 7 (16%) 6 (14%) 7 (16%) 16 (36%) 7.5 5.7 6.1
Sound Editing/Mixing 8 (18%) 4 (9%) 10 (23%) 10 (23%) 9 (20%) 3 (7%) 4.0 3.0 5.3
Sound Recording/ Reinforcement 10 (23%) 6 (14%) 10 (23%) 9 (20%) 6 (14%) 3 (7%) 3.4 2.2 5.7
Listening Habits none <1 hr 1-3 hrs 3-5 hrs 5-10 hrs >10 hrs mean median std
Average Time on Laptop Entertainment 0 (0%) 2 (5%) 18 (41%) 12 (27%) 9 (20%) 3 (7%) 4.5 3.3 4.7
57
ASubjects Background
Table A.1 Descriptive Statistics of the Background Questionnaire (N = 44)
APPENDIX A Subjects Background
Frequency of Use most 2nd 3rd leastcount mean std
weight 4 3 2 1count mean std
Headphone 22 (50%) 16 (37%) 5 (11%) 1 (2%) 147 3.3 0.8
Internal Speakers 11 (25%) 18 (41%) 14 (32%) 1 (2%) 127 2.9 0.8
External Speakers 10 (23%) 9 (20%) 22 (50%) 3 (7%) 114 2.6 0.9
Surround Sound 1 (2%) 1 (2%) 3 (7%) 39 (89%) 52 1.2 0.6
Headphone > Internal Speakers > External Speakers > Surround Sound System Headphone > Internal Speakers > External Speakers > Surround Sound System Headphone > Internal Speakers > External Speakers > Surround Sound System Headphone > Internal Speakers > External Speakers > Surround Sound System Headphone > Internal Speakers > External Speakers > Surround Sound System Headphone > Internal Speakers > External Speakers > Surround Sound System Headphone > Internal Speakers > External Speakers > Surround Sound System
Importance most 2nd 3rd leastcount mean std
weight 4 3 2 1count mean std
Cost 14 (32%) 10 (23%) 14 (32%) 6 (13%) 120 2.7 1.1
Sound Quality 17 (39%) 14 (32%) 8 (18%) 5 (11%) 131 3.0 1.0
Comfort 7 (16%) 14 (32%) 11 (25%) 12 (27%) 104 2.4 1.1
Convenience 6 (13%) 6 (13%) 11 (25%) 21 (48%) 84 1.9 1.1
Sound Quality > Cost > Comfort > ConvenienceSound Quality > Cost > Comfort > ConvenienceSound Quality > Cost > Comfort > ConvenienceSound Quality > Cost > Comfort > ConvenienceSound Quality > Cost > Comfort > ConvenienceSound Quality > Cost > Comfort > ConvenienceSound Quality > Cost > Comfort > Convenience
58
Table A.2 Descriptive Statistics of the Equipment in the Frequency of Use (N = 44)
Table A.3 Descriptive Statistics of the Main Consideration When Choosing the Equipment (N = 44)
The sound quality isn’t tolerable even for leisure use
I don’t want to bother anybody around
Other
What I’m listening is a secret
0% 20% 40% 60% 80%
7%
10%
42%
77%
What prevent you from using laptop internal speakers? (n=32, N=44)
Figure A.1 Main Reasons Drawing Back Consumers from Using Internal Speakers (n=32, N= 44)N = 44, 32 (70%) of them chose not to use internal speakers for laptop entertainment.
APPENDIX A Subjects Background
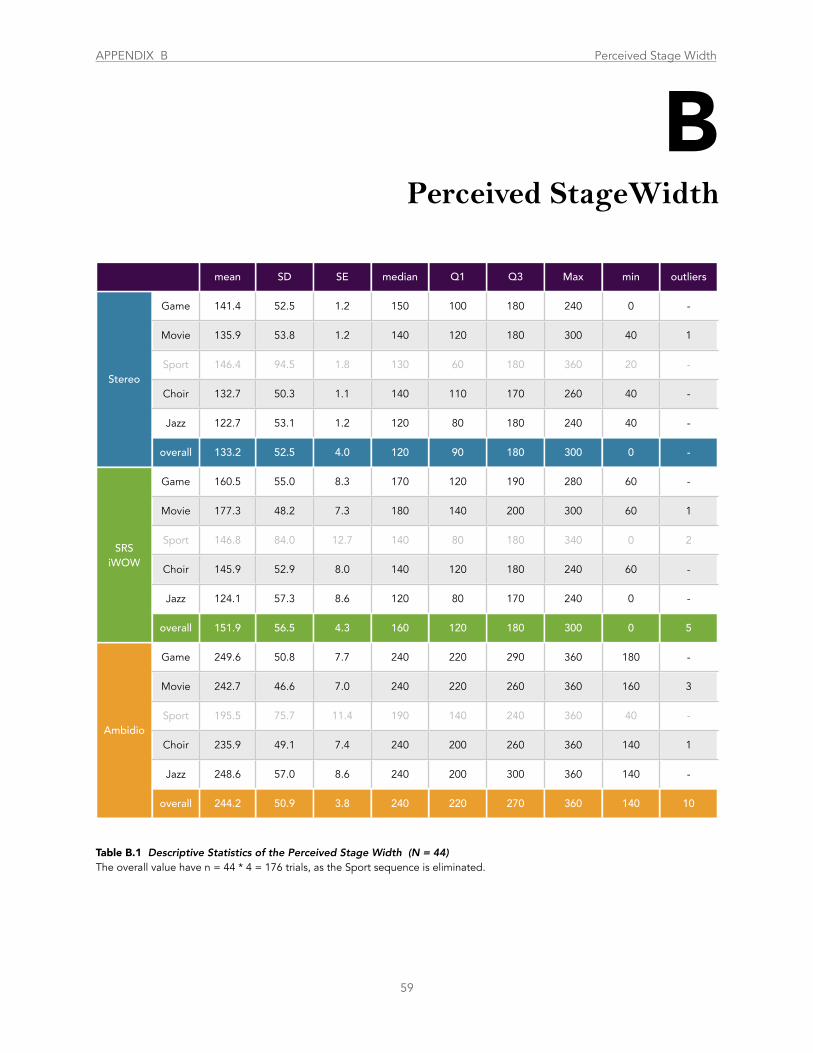
mean SD SE median Q1 Q3 Max min outliers
Stereo
Game 141.4 52.5 1.2 150 100 180 240 0 -
Stereo
Movie 135.9 53.8 1.2 140 120 180 300 40 1
StereoSport 146.4 94.5 1.8 130 60 180 360 20 -
StereoChoir 132.7 50.3 1.1 140 110 170 260 40 -
Stereo
Jazz 122.7 53.1 1.2 120 80 180 240 40 -
Stereo
overall 133.2 52.5 4.0 120 90 180 300 0 -
SRS iWOW
Game 160.5 55.0 8.3 170 120 190 280 60 -
SRS iWOW
Movie 177.3 48.2 7.3 180 140 200 300 60 1
SRS iWOW
Sport 146.8 84.0 12.7 140 80 180 340 0 2SRS
iWOWChoir 145.9 52.9 8.0 140 120 180 240 60 -
SRS iWOW
Jazz 124.1 57.3 8.6 120 80 170 240 0 -
SRS iWOW
overall 151.9 56.5 4.3 160 120 180 300 0 5
Ambidio
Game 249.6 50.8 7.7 240 220 290 360 180 -
Ambidio
Movie 242.7 46.6 7.0 240 220 260 360 160 3
AmbidioSport 195.5 75.7 11.4 190 140 240 360 40 -
AmbidioChoir 235.9 49.1 7.4 240 200 260 360 140 1
Ambidio
Jazz 248.6 57.0 8.6 240 200 300 360 140 -
Ambidio
overall 244.2 50.9 3.8 240 220 270 360 140 10
59
BPerceived StageWidth
Table B.1 Descriptive Statistics of the Perceived Stage Width (N = 44)The overall value have n = 44 * 4 = 176 trials, as the Sport sequence is eliminated.
APPENDIX B Perceived Stage Width
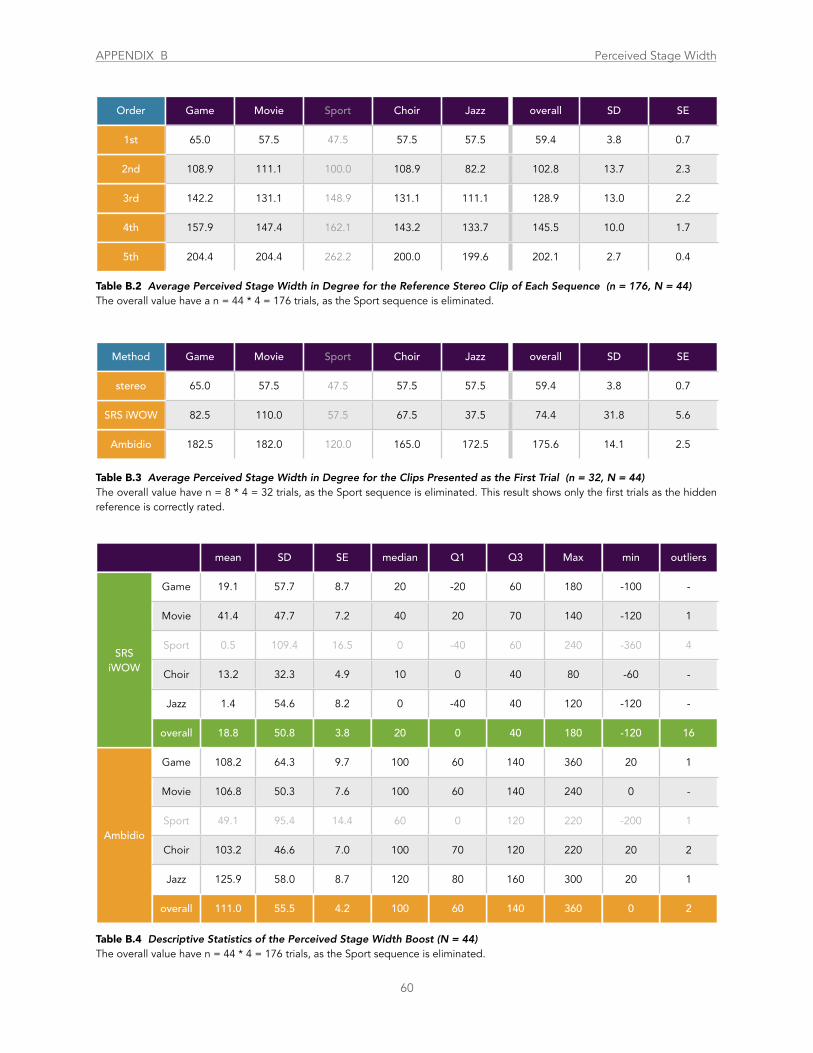
Order Game Movie Sport Choir Jazz overall SD SE
1st 65.0 57.5 47.5 57.5 57.5 59.4 3.8 0.7
2nd 108.9 111.1 100.0 108.9 82.2 102.8 13.7 2.3
3rd 142.2 131.1 148.9 131.1 111.1 128.9 13.0 2.2
4th 157.9 147.4 162.1 143.2 133.7 145.5 10.0 1.7
5th 204.4 204.4 262.2 200.0 199.6 202.1 2.7 0.4
Method Game Movie Sport Choir Jazz overall SD SE
stereo 65.0 57.5 47.5 57.5 57.5 59.4 3.8 0.7
SRS iWOW 82.5 110.0 57.5 67.5 37.5 74.4 31.8 5.6
Ambidio 182.5 182.0 120.0 165.0 172.5 175.6 14.1 2.5
mean SD SE median Q1 Q3 Max min outliers
SRS iWOW
Game 19.1 57.7 8.7 20 -20 60 180 -100 -
SRS iWOW
Movie 41.4 47.7 7.2 40 20 70 140 -120 1
SRS iWOW
Sport 0.5 109.4 16.5 0 -40 60 240 -360 4SRS
iWOWChoir 13.2 32.3 4.9 10 0 40 80 -60 -
SRS iWOW
Jazz 1.4 54.6 8.2 0 -40 40 120 -120 -
SRS iWOW
overall 18.8 50.8 3.8 20 0 40 180 -120 16
Ambidio
Game 108.2 64.3 9.7 100 60 140 360 20 1
Ambidio
Movie 106.8 50.3 7.6 100 60 140 240 0 -
AmbidioSport 49.1 95.4 14.4 60 0 120 220 -200 1
AmbidioChoir 103.2 46.6 7.0 100 70 120 220 20 2
Ambidio
Jazz 125.9 58.0 8.7 120 80 160 300 20 1
Ambidio
overall 111.0 55.5 4.2 100 60 140 360 0 2
60
Table B.2 Average Perceived Stage Width in Degree for the Reference Stereo Clip of Each Sequence (n = 176, N = 44)The overall value have a n = 44 * 4 = 176 trials, as the Sport sequence is eliminated.
Table B.4 Descriptive Statistics of the Perceived Stage Width Boost (N = 44)The overall value have n = 44 * 4 = 176 trials, as the Sport sequence is eliminated.
Table B.3 Average Perceived Stage Width in Degree for the Clips Presented as the First Trial (n = 32, N = 44)The overall value have n = 8 * 4 = 32 trials, as the Sport sequence is eliminated. This result shows only the first trials as the hidden reference is correctly rated.
APPENDIX B Perceived Stage Width
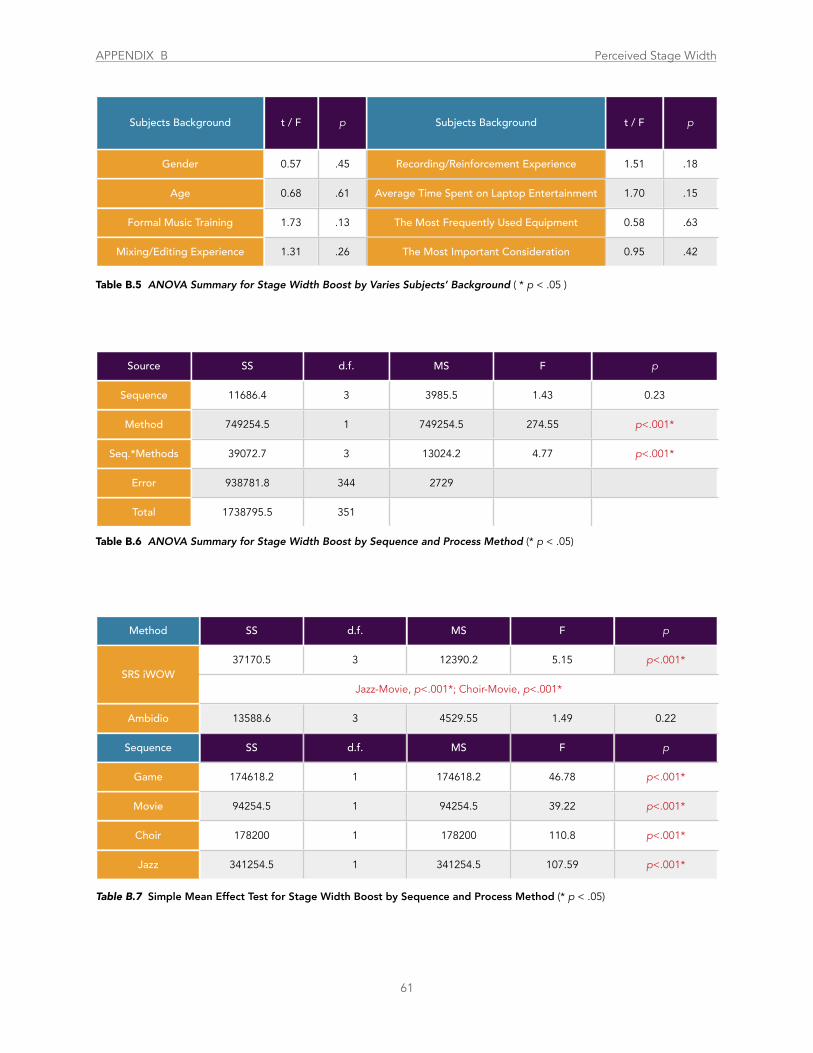
Subjects Background t / F p Subjects Background t / F p
Gender 0.57 .45 Recording/Reinforcement Experience 1.51 .18
Age 0.68 .61 Average Time Spent on Laptop Entertainment 1.70 .15
Formal Music Training 1.73 .13 The Most Frequently Used Equipment 0.58 .63
Mixing/Editing Experience 1.31 .26 The Most Important Consideration 0.95 .42
Source SS d.f. MS F p
Sequence 11686.4 3 3985.5 1.43 0.23
Method 749254.5 1 749254.5 274.55 p<.001*
Seq.*Methods 39072.7 3 13024.2 4.77 p<.001*
Error 938781.8 344 2729
Total 1738795.5 351
Method SS d.f. MS F p
SRS iWOW37170.5 3 12390.2 5.15 p<.001*
SRS iWOWJazz-Movie, p<.001*; Choir-Movie, p<.001*Jazz-Movie, p<.001*; Choir-Movie, p<.001*Jazz-Movie, p<.001*; Choir-Movie, p<.001*Jazz-Movie, p<.001*; Choir-Movie, p<.001*Jazz-Movie, p<.001*; Choir-Movie, p<.001*
Ambidio 13588.6 3 4529.55 1.49 0.22
Sequence SS d.f. MS F p
Game 174618.2 1 174618.2 46.78 p<.001*
Movie 94254.5 1 94254.5 39.22 p<.001*
Choir 178200 1 178200 110.8 p<.001*
Jazz 341254.5 1 341254.5 107.59 p<.001*
61
Table B.6 ANOVA Summary for Stage Width Boost by Sequence and Process Method (* p < .05)
Table B.5 ANOVA Summary for Stage Width Boost by Varies Subjects’ Background ( * p < .05 )
Table B.7 Simple Mean Effect Test for Stage Width Boost by Sequence and Process Method (* p < .05)
APPENDIX B Perceived Stage Width
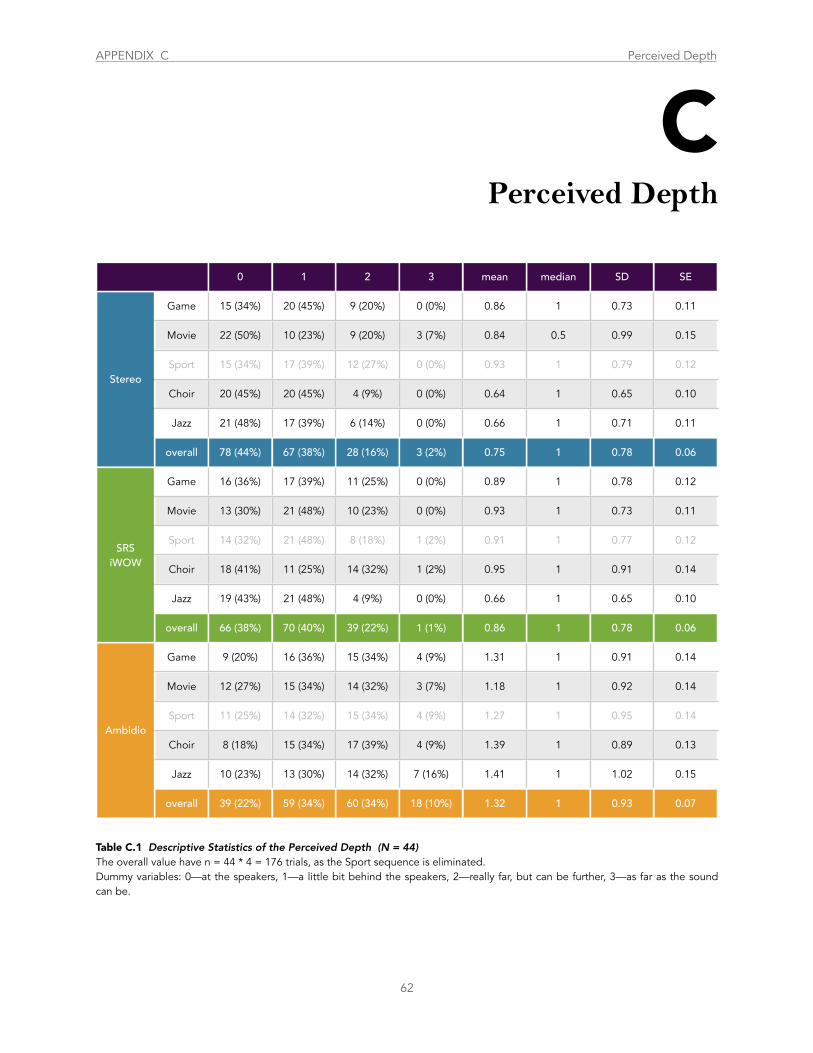
0 1 2 3 mean median SD SE
Stereo
Game 15 (34%) 20 (45%) 9 (20%) 0 (0%) 0.86 1 0.73 0.11
Stereo
Movie 22 (50%) 10 (23%) 9 (20%) 3 (7%) 0.84 0.5 0.99 0.15
StereoSport 15 (34%) 17 (39%) 12 (27%) 0 (0%) 0.93 1 0.79 0.12
StereoChoir 20 (45%) 20 (45%) 4 (9%) 0 (0%) 0.64 1 0.65 0.10
Stereo
Jazz 21 (48%) 17 (39%) 6 (14%) 0 (0%) 0.66 1 0.71 0.11
Stereo
overall 78 (44%) 67 (38%) 28 (16%) 3 (2%) 0.75 1 0.78 0.06
SRS iWOW
Game 16 (36%) 17 (39%) 11 (25%) 0 (0%) 0.89 1 0.78 0.12
SRS iWOW
Movie 13 (30%) 21 (48%) 10 (23%) 0 (0%) 0.93 1 0.73 0.11
SRS iWOW
Sport 14 (32%) 21 (48%) 8 (18%) 1 (2%) 0.91 1 0.77 0.12SRS
iWOWChoir 18 (41%) 11 (25%) 14 (32%) 1 (2%) 0.95 1 0.91 0.14
SRS iWOW
Jazz 19 (43%) 21 (48%) 4 (9%) 0 (0%) 0.66 1 0.65 0.10
SRS iWOW
overall 66 (38%) 70 (40%) 39 (22%) 1 (1%) 0.86 1 0.78 0.06
Ambidio
Game 9 (20%) 16 (36%) 15 (34%) 4 (9%) 1.31 1 0.91 0.14
Ambidio
Movie 12 (27%) 15 (34%) 14 (32%) 3 (7%) 1.18 1 0.92 0.14
AmbidioSport 11 (25%) 14 (32%) 15 (34%) 4 (9%) 1.27 1 0.95 0.14
AmbidioChoir 8 (18%) 15 (34%) 17 (39%) 4 (9%) 1.39 1 0.89 0.13
Ambidio
Jazz 10 (23%) 13 (30%) 14 (32%) 7 (16%) 1.41 1 1.02 0.15
Ambidio
overall 39 (22%) 59 (34%) 60 (34%) 18 (10%) 1.32 1 0.93 0.07
62
CPerceived Depth
Table C.1 Descriptive Statistics of the Perceived Depth (N = 44)The overall value have n = 44 * 4 = 176 trials, as the Sport sequence is eliminated.Dummy variables: 0––at the speakers, 1––a little bit behind the speakers, 2––really far, but can be further, 3––as far as the sound can be.
APPENDIX C Perceived Depth

Subjects Background t / F p Subjects Background t / F p
Gender 0.97 .33 Recording/Reinforcement Experience 0.46 .81
Age 0.30 .88 Average Time Spent on Laptop Entertainment 1.27 .28
Formal Music Training 1.76 .12 The Most Frequently Used Equipment 2.26 .08
Mixing/Editing Experience 1.21 .30 The Most Important Consideration 0.25 .85
Source SS d.f. MS F p
Sequence 28.42 3 9.47 13.61 <.001*
Method 0.72 2 0.36 0.51 .60
Seq.*Methods 9.27 6 1.54 2.22 .04*
Error 359.32 516 0.70
Total 397.73 527
Method SS d.f. MS F p
stereo 1.86 3 0.62 1.02 .39
SRS iWOW 2.42 3 0.81 1.35 .26
Ambidio 1.38 3 0.46 0.52 .67
Sequence SS d.f. MS F p
Game5.77 2 2.89 4.37 .01*
Gamestereo-SRS iWOW p = .89; stereo-Ambidio p=.01, SRS iWOW-Ambidio p=.02stereo-SRS iWOW p = .89; stereo-Ambidio p=.01, SRS iWOW-Ambidio p=.02stereo-SRS iWOW p = .89; stereo-Ambidio p=.01, SRS iWOW-Ambidio p=.02stereo-SRS iWOW p = .89; stereo-Ambidio p=.01, SRS iWOW-Ambidio p=.02stereo-SRS iWOW p = .89; stereo-Ambidio p=.01, SRS iWOW-Ambidio p=.02
Movie 2.74 2 1.37 1.75 0.18
Choir12.47 2 6.23 9.09 < .001*
Choirstereo-SRS iWOW p = .06; stereo-Ambidio p<.001*, SRS iWOW-Ambidio p=.03*stereo-SRS iWOW p = .06; stereo-Ambidio p<.001*, SRS iWOW-Ambidio p=.03*stereo-SRS iWOW p = .06; stereo-Ambidio p<.001*, SRS iWOW-Ambidio p=.03*stereo-SRS iWOW p = .06; stereo-Ambidio p<.001*, SRS iWOW-Ambidio p=.03*stereo-SRS iWOW p = .06; stereo-Ambidio p<.001*, SRS iWOW-Ambidio p=.03*
Jazz16.5 2 8.25 12.61 < .001*
Jazzstereo-SRS iWOW p=1.0; stereo-Ambidio p<.001*, SRS iWOW-Ambidio p<.001*stereo-SRS iWOW p=1.0; stereo-Ambidio p<.001*, SRS iWOW-Ambidio p<.001*stereo-SRS iWOW p=1.0; stereo-Ambidio p<.001*, SRS iWOW-Ambidio p<.001*stereo-SRS iWOW p=1.0; stereo-Ambidio p<.001*, SRS iWOW-Ambidio p<.001*stereo-SRS iWOW p=1.0; stereo-Ambidio p<.001*, SRS iWOW-Ambidio p<.001*
63
Table C.2 ANOVA Summary for Perceived Depth by Varies Subjects’ Background ( * p < .05 )
Table C.3 ANOVA Summary for Perceived Depth by Sequence and Process Method (* p < .05)
Table C.4 Simple Mean Effect Test for Perceived Depth by Sequence and Process Method (* p < .05)
APPENDIX C Perceived Depth
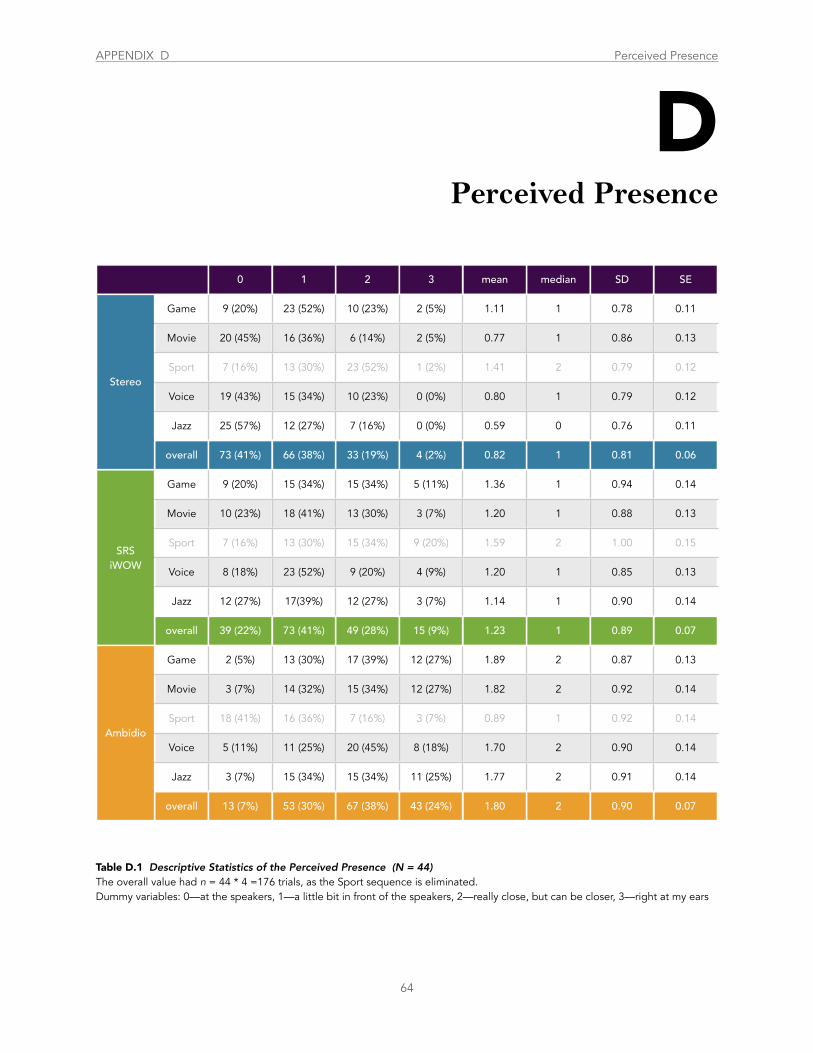
0 1 2 3 mean median SD SE
Stereo
Game 9 (20%) 23 (52%) 10 (23%) 2 (5%) 1.11 1 0.78 0.11
Stereo
Movie 20 (45%) 16 (36%) 6 (14%) 2 (5%) 0.77 1 0.86 0.13
StereoSport 7 (16%) 13 (30%) 23 (52%) 1 (2%) 1.41 2 0.79 0.12
StereoVoice 19 (43%) 15 (34%) 10 (23%) 0 (0%) 0.80 1 0.79 0.12
Stereo
Jazz 25 (57%) 12 (27%) 7 (16%) 0 (0%) 0.59 0 0.76 0.11
Stereo
overall 73 (41%) 66 (38%) 33 (19%) 4 (2%) 0.82 1 0.81 0.06
SRS iWOW
Game 9 (20%) 15 (34%) 15 (34%) 5 (11%) 1.36 1 0.94 0.14
SRS iWOW
Movie 10 (23%) 18 (41%) 13 (30%) 3 (7%) 1.20 1 0.88 0.13
SRS iWOW
Sport 7 (16%) 13 (30%) 15 (34%) 9 (20%) 1.59 2 1.00 0.15SRS
iWOWVoice 8 (18%) 23 (52%) 9 (20%) 4 (9%) 1.20 1 0.85 0.13
SRS iWOW
Jazz 12 (27%) 17(39%) 12 (27%) 3 (7%) 1.14 1 0.90 0.14
SRS iWOW
overall 39 (22%) 73 (41%) 49 (28%) 15 (9%) 1.23 1 0.89 0.07
Ambidio
Game 2 (5%) 13 (30%) 17 (39%) 12 (27%) 1.89 2 0.87 0.13
Ambidio
Movie 3 (7%) 14 (32%) 15 (34%) 12 (27%) 1.82 2 0.92 0.14
AmbidioSport 18 (41%) 16 (36%) 7 (16%) 3 (7%) 0.89 1 0.92 0.14
AmbidioVoice 5 (11%) 11 (25%) 20 (45%) 8 (18%) 1.70 2 0.90 0.14
Ambidio
Jazz 3 (7%) 15 (34%) 15 (34%) 11 (25%) 1.77 2 0.91 0.14
Ambidio
overall 13 (7%) 53 (30%) 67 (38%) 43 (24%) 1.80 2 0.90 0.07
64
DPerceived Presence
Table D.1 Descriptive Statistics of the Perceived Presence (N = 44)The overall value had n = 44 * 4 =176 trials, as the Sport sequence is eliminated.Dummy variables: 0––at the speakers, 1––a little bit in front of the speakers, 2––really close, but can be closer, 3––right at my ears
APPENDIX D Perceived Presence d
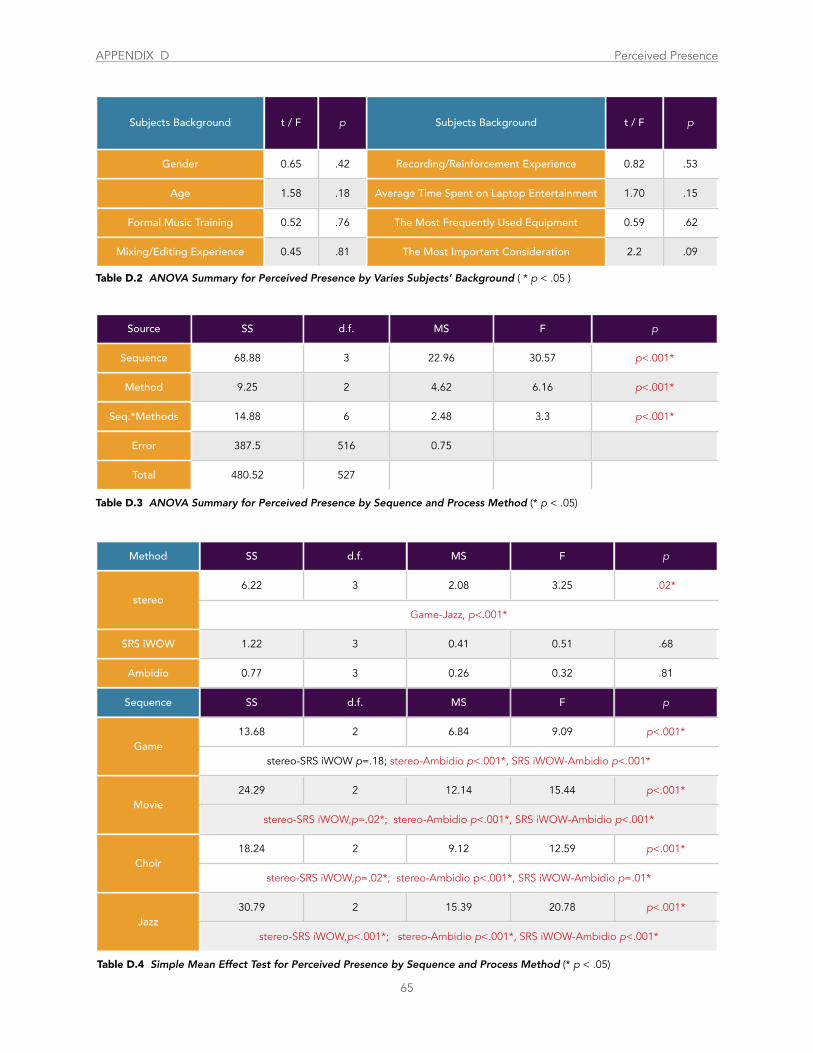
Subjects Background t / F p Subjects Background t / F p
Gender 0.65 .42 Recording/Reinforcement Experience 0.82 .53
Age 1.58 .18 Average Time Spent on Laptop Entertainment 1.70 .15
Formal Music Training 0.52 .76 The Most Frequently Used Equipment 0.59 .62
Mixing/Editing Experience 0.45 .81 The Most Important Consideration 2.2 .09
Source SS d.f. MS F p
Sequence 68.88 3 22.96 30.57 p<.001*
Method 9.25 2 4.62 6.16 p<.001*
Seq.*Methods 14.88 6 2.48 3.3 p<.001*
Error 387.5 516 0.75
Total 480.52 527
Method SS d.f. MS F p
stereo6.22 3 2.08 3.25 .02*
stereoGame-Jazz, p<.001*Game-Jazz, p<.001*Game-Jazz, p<.001*Game-Jazz, p<.001*Game-Jazz, p<.001*
SRS iWOW 1.22 3 0.41 0.51 .68
Ambidio 0.77 3 0.26 0.32 .81
Sequence SS d.f. MS F p
Game13.68 2 6.84 9.09 p<.001*
Gamestereo-SRS iWOW p=.18; stereo-Ambidio p<.001*, SRS iWOW-Ambidio p<.001*stereo-SRS iWOW p=.18; stereo-Ambidio p<.001*, SRS iWOW-Ambidio p<.001*stereo-SRS iWOW p=.18; stereo-Ambidio p<.001*, SRS iWOW-Ambidio p<.001*stereo-SRS iWOW p=.18; stereo-Ambidio p<.001*, SRS iWOW-Ambidio p<.001*stereo-SRS iWOW p=.18; stereo-Ambidio p<.001*, SRS iWOW-Ambidio p<.001*
Movie24.29 2 12.14 15.44 p<.001*
Moviestereo-SRS iWOW,p=.02*; stereo-Ambidio p<.001*, SRS iWOW-Ambidio p<.001*stereo-SRS iWOW,p=.02*; stereo-Ambidio p<.001*, SRS iWOW-Ambidio p<.001*stereo-SRS iWOW,p=.02*; stereo-Ambidio p<.001*, SRS iWOW-Ambidio p<.001*stereo-SRS iWOW,p=.02*; stereo-Ambidio p<.001*, SRS iWOW-Ambidio p<.001*stereo-SRS iWOW,p=.02*; stereo-Ambidio p<.001*, SRS iWOW-Ambidio p<.001*
Choir18.24 2 9.12 12.59 p<.001*
Choirstereo-SRS iWOW,p=.02*; stereo-Ambidio p<.001*, SRS iWOW-Ambidio p=.01*stereo-SRS iWOW,p=.02*; stereo-Ambidio p<.001*, SRS iWOW-Ambidio p=.01*stereo-SRS iWOW,p=.02*; stereo-Ambidio p<.001*, SRS iWOW-Ambidio p=.01*stereo-SRS iWOW,p=.02*; stereo-Ambidio p<.001*, SRS iWOW-Ambidio p=.01*stereo-SRS iWOW,p=.02*; stereo-Ambidio p<.001*, SRS iWOW-Ambidio p=.01*
Jazz30.79 2 15.39 20.78 p<.001*
Jazzstereo-SRS iWOW,p<.001*; stereo-Ambidio p<.001*, SRS iWOW-Ambidio p<.001*stereo-SRS iWOW,p<.001*; stereo-Ambidio p<.001*, SRS iWOW-Ambidio p<.001*stereo-SRS iWOW,p<.001*; stereo-Ambidio p<.001*, SRS iWOW-Ambidio p<.001*stereo-SRS iWOW,p<.001*; stereo-Ambidio p<.001*, SRS iWOW-Ambidio p<.001*stereo-SRS iWOW,p<.001*; stereo-Ambidio p<.001*, SRS iWOW-Ambidio p<.001*
65
Table D.2 ANOVA Summary for Perceived Presence by Varies Subjects’ Background ( * p < .05 )
Table D.3 ANOVA Summary for Perceived Presence by Sequence and Process Method (* p < .05)
Table D.4 Simple Mean Effect Test for Perceived Presence by Sequence and Process Method (* p < .05)
APPENDIX D Perceived Presence d
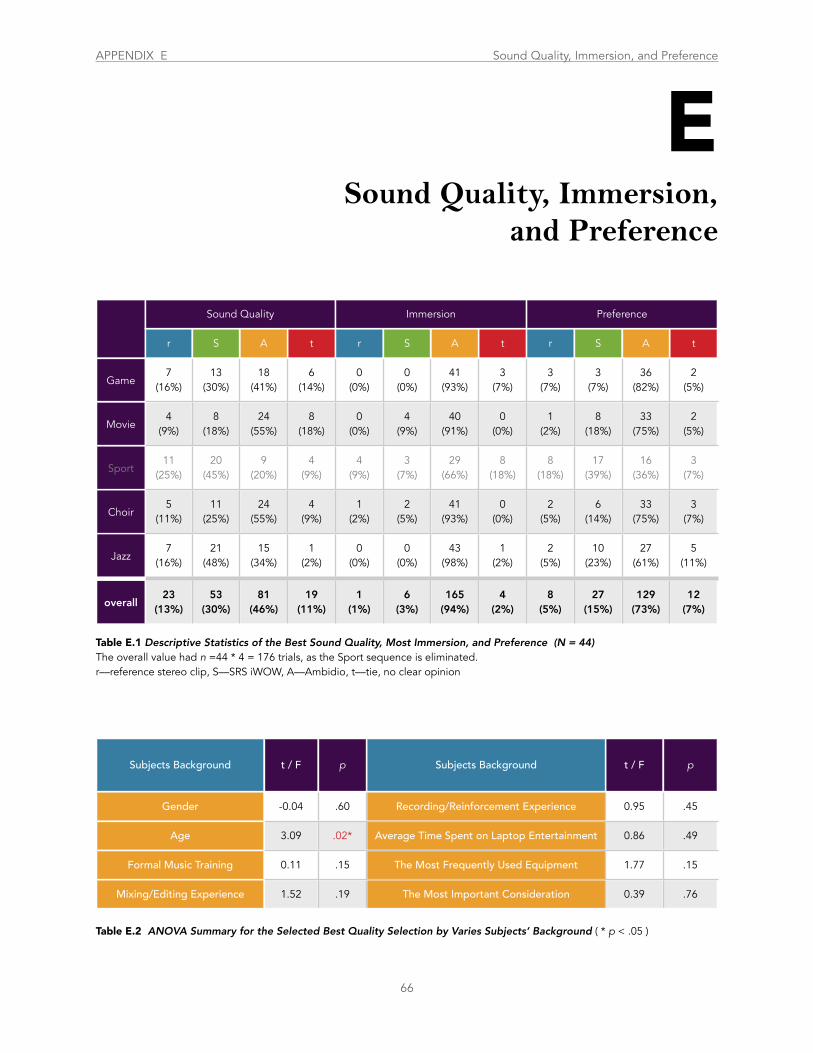
Sound QualitySound QualitySound QualitySound Quality ImmersionImmersionImmersionImmersion PreferencePreferencePreferencePreference
r S A t r S A t r S A t
Game7
(16%)13
(30%)18
(41%)6
(14%)0
(0%)0
(0%)41
(93%)3
(7%)3
(7%)3
(7%)36
(82%)2
(5%)
Movie4
(9%)8
(18%)24
(55%)8
(18%)0
(0%)4
(9%)40
(91%)0
(0%)1
(2%)8
(18%)33
(75%)2
(5%)
Sport11
(25%)20
(45%)9
(20%)4
(9%)4
(9%)3
(7%)29
(66%)8
(18%)8
(18%)17
(39%)16
(36%)3
(7%)
Choir5
(11%)11
(25%)24
(55%)4
(9%)1
(2%)2
(5%)41
(93%)0
(0%)2
(5%)6
(14%)33
(75%)3
(7%)
Jazz7
(16%)21
(48%)15
(34%)1
(2%)0
(0%)0
(0%)43
(98%)1
(2%)2
(5%)10
(23%)27
(61%)5
(11%)
overall23
(13%)53
(30%)81
(46%)19
(11%)1
(1%)6
(3%)165
(94%)4
(2%)8
(5%)27
(15%)129
(73%)12
(7%)
Subjects Background t / F p Subjects Background t / F p
Gender -0.04 .60 Recording/Reinforcement Experience 0.95 .45
Age 3.09 .02* Average Time Spent on Laptop Entertainment 0.86 .49
Formal Music Training 0.11 .15 The Most Frequently Used Equipment 1.77 .15
Mixing/Editing Experience 1.52 .19 The Most Important Consideration 0.39 .76
66
ESound Quality, Immersion,
and Preference
Table E.1 Descriptive Statistics of the Best Sound Quality, Most Immersion, and Preference (N = 44)The overall value had n =44 * 4 = 176 trials, as the Sport sequence is eliminated.r––reference stereo clip, S––SRS iWOW, A––Ambidio, t––tie, no clear opinion
Table E.2 ANOVA Summary for the Selected Best Quality Selection by Varies Subjects’ Background ( * p < .05 )
APPENDIX E Sound Quality, Immersion, and Preference d
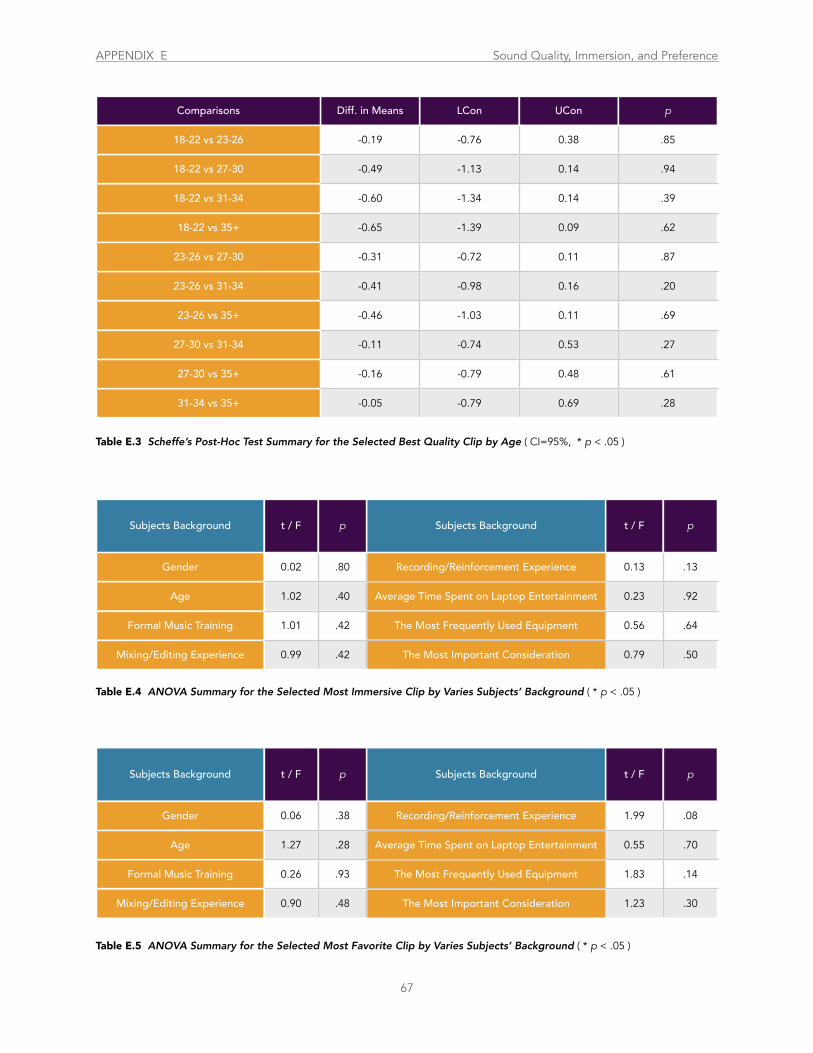
Comparisons Diff. in Means LCon UCon p
18-22 vs 23-26 -0.19 -0.76 0.38 .85
18-22 vs 27-30 -0.49 -1.13 0.14 .94
18-22 vs 31-34 -0.60 -1.34 0.14 .39
18-22 vs 35+ -0.65 -1.39 0.09 .62
23-26 vs 27-30 -0.31 -0.72 0.11 .87
23-26 vs 31-34 -0.41 -0.98 0.16 .20
23-26 vs 35+ -0.46 -1.03 0.11 .69
27-30 vs 31-34 -0.11 -0.74 0.53 .27
27-30 vs 35+ -0.16 -0.79 0.48 .61
31-34 vs 35+ -0.05 -0.79 0.69 .28
Subjects Background t / F p Subjects Background t / F p
Gender 0.02 .80 Recording/Reinforcement Experience 0.13 .13
Age 1.02 .40 Average Time Spent on Laptop Entertainment 0.23 .92
Formal Music Training 1.01 .42 The Most Frequently Used Equipment 0.56 .64
Mixing/Editing Experience 0.99 .42 The Most Important Consideration 0.79 .50
Subjects Background t / F p Subjects Background t / F p
Gender 0.06 .38 Recording/Reinforcement Experience 1.99 .08
Age 1.27 .28 Average Time Spent on Laptop Entertainment 0.55 .70
Formal Music Training 0.26 .93 The Most Frequently Used Equipment 1.83 .14
Mixing/Editing Experience 0.90 .48 The Most Important Consideration 1.23 .30
67
Table E.3 Scheffe’s Post-Hoc Test Summary for the Selected Best Quality Clip by Age ( CI=95%, * p < .05 )
Table E.4 ANOVA Summary for the Selected Most Immersive Clip by Varies Subjects’ Background ( * p < .05 )
Table E.5 ANOVA Summary for the Selected Most Favorite Clip by Varies Subjects’ Background ( * p < .05 )
APPENDIX E Sound Quality, Immersion, and Preference d
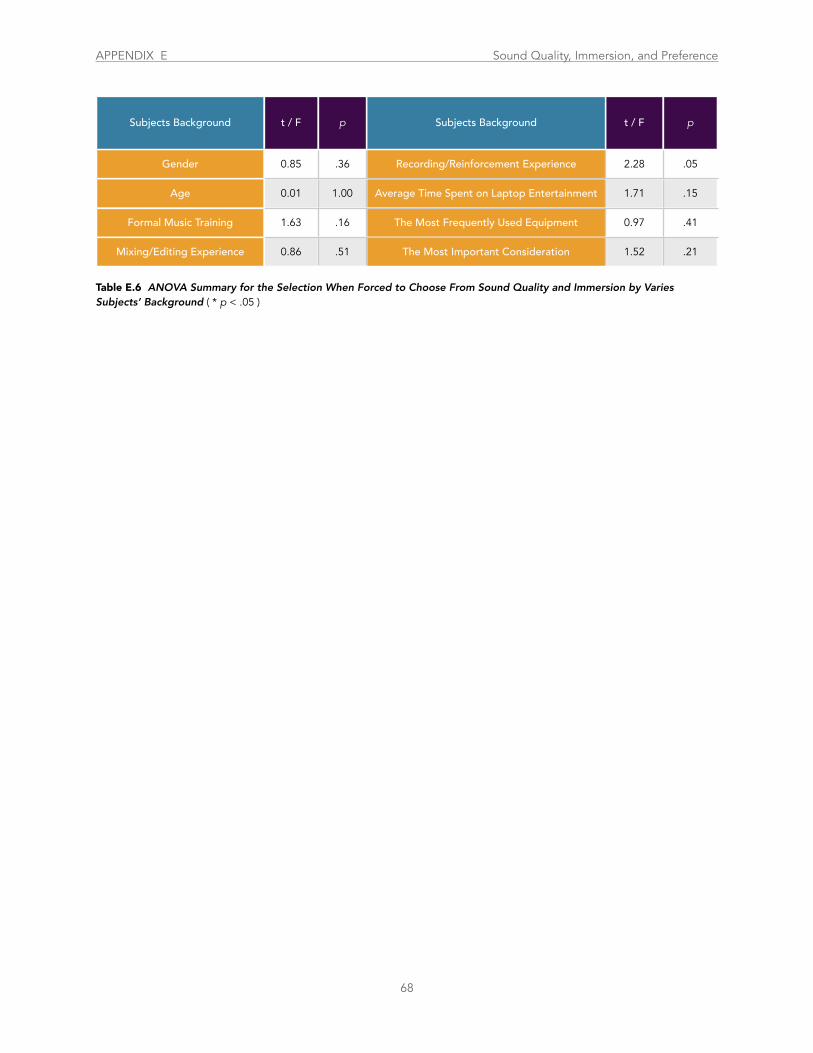
Subjects Background t / F p Subjects Background t / F p
Gender 0.85 .36 Recording/Reinforcement Experience 2.28 .05
Age 0.01 1.00 Average Time Spent on Laptop Entertainment 1.71 .15
Formal Music Training 1.63 .16 The Most Frequently Used Equipment 0.97 .41
Mixing/Editing Experience 0.86 .51 The Most Important Consideration 1.52 .21
68
Table E.6 ANOVA Summary for the Selection When Forced to Choose From Sound Quality and Immersion by Varies Subjects’ Background ( * p < .05 )
APPENDIX E Sound Quality, Immersion, and Preference d
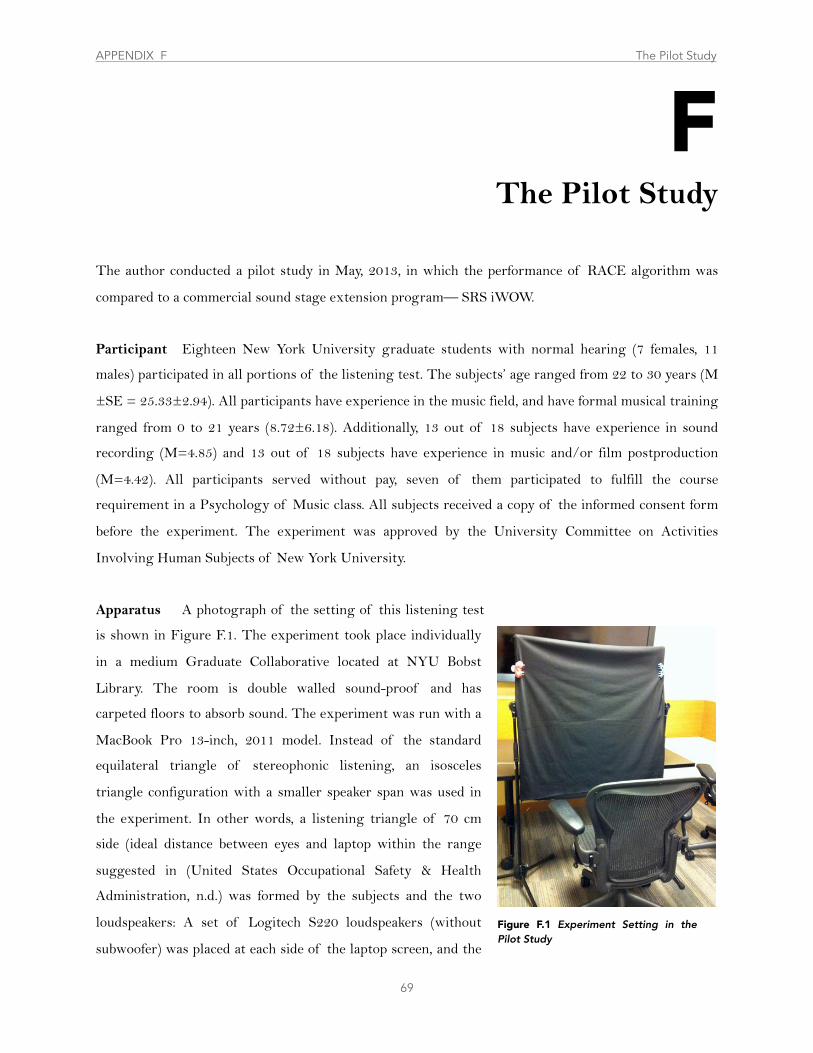
The author conducted a pilot study in May, 2013, in which the performance of RACE algorithm was
compared to a commercial sound stage extension program–– SRS iWOW.
Participant Eighteen New York University graduate students with normal hearing (7 females, 11
males) participated in all portions of the listening test. The subjects’ age ranged from 22 to 30 years (M
±SE = 25.33±2.94). All participants have experience in the music field, and have formal musical training
ranged from 0 to 21 years (8.72±6.18). Additionally, 13 out of 18 subjects have experience in sound
recording (M=4.85) and 13 out of 18 subjects have experience in music and/or film postproduction
(M=4.42). All participants served without pay, seven of them participated to fulfill the course
requirement in a Psychology of Music class. All subjects received a copy of the informed consent form
before the experiment. The experiment was approved by the University Committee on Activities
Involving Human Subjects of New York University.
Apparatus A photograph of the setting of this listening test
is shown in Figure F.1. The experiment took place individually
in a medium Graduate Collaborative located at NYU Bobst
Library. The room is double walled sound-proof and has
carpeted floors to absorb sound. The experiment was run with a
MacBook Pro 13-inch, 2011 model. Instead of the standard
equilateral triangle of stereophonic listening, an isosceles
triangle configuration with a smaller speaker span was used in
the experiment. In other words, a listening triangle of 70 cm
side (ideal distance between eyes and laptop within the range
suggested in (United States Occupational Safety & Health
Administration, n.d.) was formed by the subjects and the two
loudspeakers: A set of Logitech S220 loudspeakers (without
subwoofer) was placed at each side of the laptop screen, and the
69
FThe Pilot Study
APPENDIX F The Pilot Study
Figure F.1 Experiment Setting in the Pilot Study
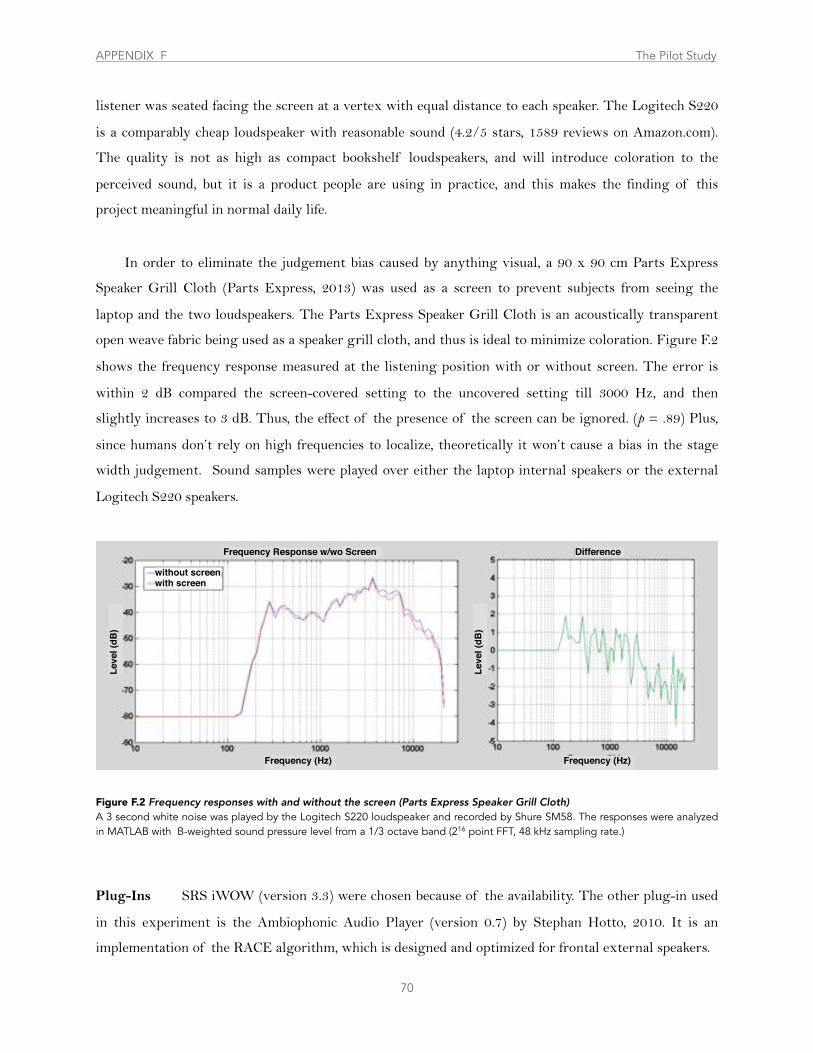
listener was seated facing the screen at a vertex with equal distance to each speaker. The Logitech S220
is a comparably cheap loudspeaker with reasonable sound (4.2/5 stars, 1589 reviews on Amazon.com).
The quality is not as high as compact bookshelf loudspeakers, and will introduce coloration to the
perceived sound, but it is a product people are using in practice, and this makes the finding of this
project meaningful in normal daily life.
In order to eliminate the judgement bias caused by anything visual, a 90 x 90 cm Parts Express
Speaker Grill Cloth (Parts Express, 2013) was used as a screen to prevent subjects from seeing the
laptop and the two loudspeakers. The Parts Express Speaker Grill Cloth is an acoustically transparent
open weave fabric being used as a speaker grill cloth, and thus is ideal to minimize coloration. Figure F.2
shows the frequency response measured at the listening position with or without screen. The error is
within 2 dB compared the screen-covered setting to the uncovered setting till 3000 Hz, and then
slightly increases to 3 dB. Thus, the effect of the presence of the screen can be ignored. (p = .89) Plus,
since humans don’t rely on high frequencies to localize, theoretically it won’t cause a bias in the stage
width judgement. Sound samples were played over either the laptop internal speakers or the external
Logitech S220 speakers.
Plug-Ins SRS iWOW (version 3.3) were chosen because of the availability. The other plug-in used
in this experiment is the Ambiophonic Audio Player (version 0.7) by Stephan Hotto, 2010. It is an
implementation of the RACE algorithm, which is designed and optimized for frontal external speakers.
70
Figure F.2 Frequency responses with and without the screen (Parts Express Speaker Grill Cloth)A 3 second white noise was played by the Logitech S220 loudspeaker and recorded by Shure SM58. The responses were analyzed in MATLAB with B-weighted sound pressure level from a 1/3 octave band (216 point FFT, 48 kHz sampling rate.)
Frequency Response w/wo Screen Difference
Frequency (Hz) Frequency (Hz)
Leve
l (dB
)
Leve
l (dB
)
without screenwith screen
APPENDIX F The Pilot Study
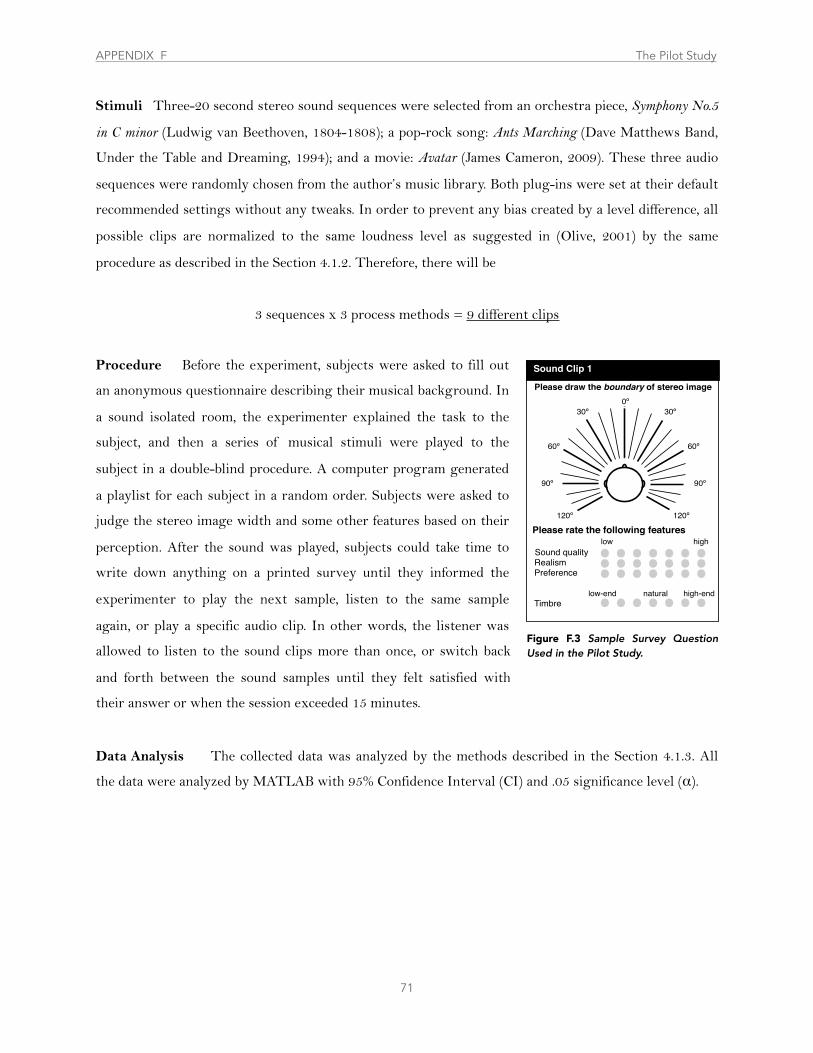
Stimuli Three-20 second stereo sound sequences were selected from an orchestra piece, Symphony No.5
in C minor (Ludwig van Beethoven, 1804-1808); a pop-rock song: Ants Marching (Dave Matthews Band,
Under the Table and Dreaming, 1994); and a movie: Avatar (James Cameron, 2009). These three audio
sequences were randomly chosen from the author’s music library. Both plug-ins were set at their default
recommended settings without any tweaks. In order to prevent any bias created by a level difference, all
possible clips are normalized to the same loudness level as suggested in (Olive, 2001) by the same
procedure as described in the Section 4.1.2. Therefore, there will be
3 sequences x 3 process methods = 9 different clips
Procedure Before the experiment, subjects were asked to fill out
an anonymous questionnaire describing their musical background. In
a sound isolated room, the experimenter explained the task to the
subject, and then a series of musical stimuli were played to the
subject in a double-blind procedure. A computer program generated
a playlist for each subject in a random order. Subjects were asked to
judge the stereo image width and some other features based on their
perception. After the sound was played, subjects could take time to
write down anything on a printed survey until they informed the
experimenter to play the next sample, listen to the same sample
again, or play a specific audio clip. In other words, the listener was
allowed to listen to the sound clips more than once, or switch back
and forth between the sound samples until they felt satisfied with
their answer or when the session exceeded 15 minutes.
Data Analysis The collected data was analyzed by the methods described in the Section 4.1.3. All
the data were analyzed by MATLAB with 95% Confidence Interval (CI) and .05 significance level (α).
71
APPENDIX F The Pilot Study
Please draw the boundary of stereo image
Please rate the following features ! ! low high Sound quality Realism Preference low-end natural high-end Timbre
0º30º30º
60º 60º
90º 90º
120º 120º
Sound Clip 1
Figure F.3 Sample Survey Question Used in the Pilot Study.
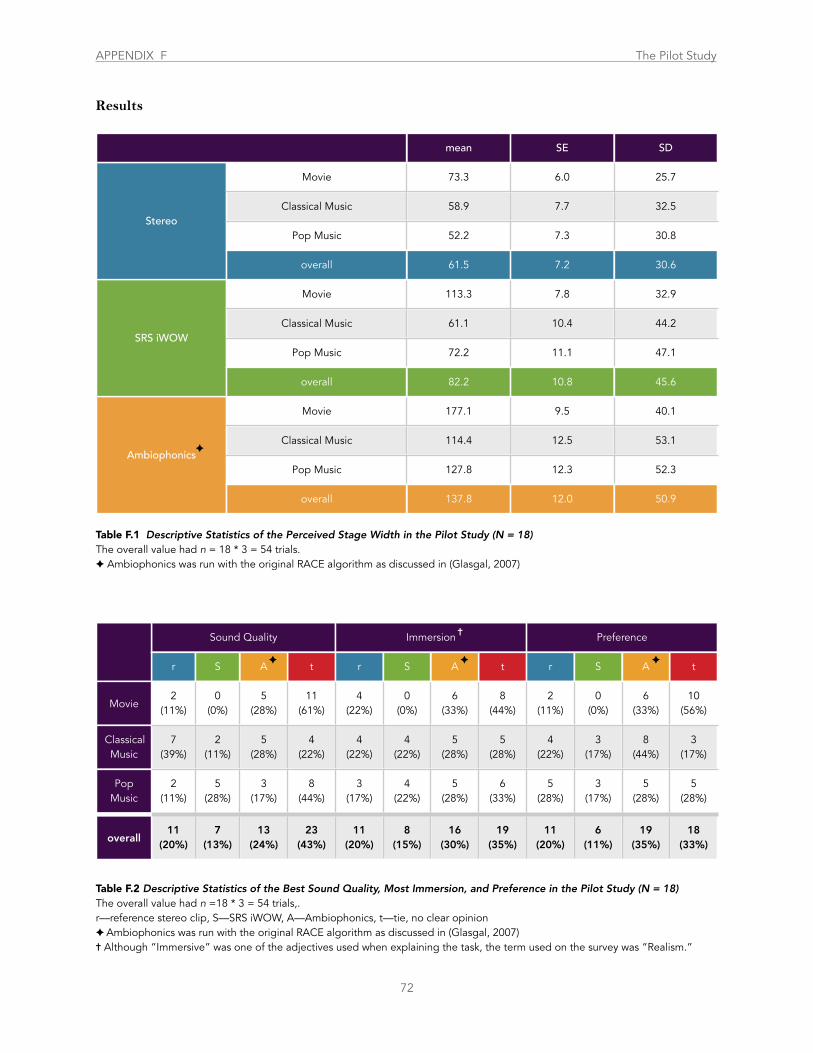
Results
mean SE SD
Stereo
Movie 73.3 6.0 25.7
StereoClassical Music 58.9 7.7 32.5
StereoPop Music 52.2 7.3 30.8
Stereo
overall 61.5 7.2 30.6
SRS iWOW
Movie 113.3 7.8 32.9
SRS iWOWClassical Music 61.1 10.4 44.2
SRS iWOWPop Music 72.2 11.1 47.1
SRS iWOW
overall 82.2 10.8 45.6
Ambiophonics
Movie 177.1 9.5 40.1
AmbiophonicsClassical Music 114.4 12.5 53.1
AmbiophonicsPop Music 127.8 12.3 52.3
Ambiophonics
overall 137.8 12.0 50.9
Sound QualitySound QualitySound QualitySound Quality ImmersionImmersionImmersionImmersion PreferencePreferencePreferencePreference
r S A t r S A t r S A t
Movie2
(11%)0
(0%)5
(28%)11
(61%)4
(22%)0
(0%)6
(33%)8
(44%)2
(11%)0
(0%)6
(33%)10
(56%)
Classical Music
7(39%)
2(11%)
5(28%)
4(22%)
4(22%)
4(22%)
5(28%)
5(28%)
4(22%)
3(17%)
8(44%)
3(17%)
Pop Music
2(11%)
5(28%)
3(17%)
8(44%)
3(17%)
4(22%)
5(28%)
6(33%)
5(28%)
3(17%)
5(28%)
5(28%)
overall11
(20%)7
(13%)13
(24%)23
(43%)11
(20%)8
(15%)16
(30%)19
(35%)11
(20%)6
(11%)19
(35%)18
(33%)
72
Table F.1 Descriptive Statistics of the Perceived Stage Width in the Pilot Study (N = 18)The overall value had n = 18 * 3 = 54 trials.✦ Ambiophonics was run with the original RACE algorithm as discussed in (Glasgal, 2007)
Table F.2 Descriptive Statistics of the Best Sound Quality, Most Immersion, and Preference in the Pilot Study (N = 18)The overall value had n =18 * 3 = 54 trials,.r––reference stereo clip, S––SRS iWOW, A––Ambiophonics, t––tie, no clear opinion✦ Ambiophonics was run with the original RACE algorithm as discussed in (Glasgal, 2007)✝ Although “Immersive” was one of the adjectives used when explaining the task, the term used on the survey was “Realism.”
✦
✦ ✦ ✦
✝
APPENDIX F The Pilot Study