listening test experiments for comparisons of sound ... · listening test experiments for...
TRANSCRIPT
Listening test experiments for comparisons of sound transmitted through light weight and heavy weight walls
Monika Rychtáriková1,2, a, Bert Roozen1,b, Herbert Müllner3,c, Mathias Stani3,d, Vojtech Chmelík2,e, Christ Glorieux1,f
1 Lab. of Acoustics and Thermal Physics, KU Leuven, Celestijnenlaan 200D, Heverlee, Belgium 2Department of Building Structures, STU SvF Bratislava, Radlinského 11, Bratislava, Slovakia 3Versuchsanstalt TGM, Fachbereich Akustik und Bauphysik, Wexstrasse 19-23, A-1200 Wien.
[email protected] (corresponding author) [email protected], [email protected], [email protected],
[email protected], [email protected]
Keywords: building acoustics, auralization, listening tests, subjective perception, noise from neighbours, lightweight constructions, masonry walls, standardization
Abstract. When assessing the sound insulation quality of buildings constructions, policy makers and investors typically demand for single number ratings and sound insulation classes that allow for easy ranking of building products. Converting the full frequency content of a precisely measured or calculated structure into a single number, which takes into account all aspects of the insulation performance in a balanced way, is a challenging task. The recently proposed draft standard 717 proposes to take into account also frequencies below 100 Hz. This makes the single value rating even more complicated, since the transmission spectra R (dB) of walls can be qualitatively very different above and below 100 Hz, and even more, since, particularly at low frequencies, human hearing depends not only on frequency but also on the absolute sound level. This article presents a comparison between masonry and light-weight walls with different R value, in terms of the perception of loudness of typical living room noise transmitted through the walls. The effect of temporal and spectral features of the presented stimuli on loudness perception is analyzed.
Introduction
Ongoing discussions on international standards in building acoustics have brought a number of interesting research questions that concern not only the development of more accurate simulation and measurement methods, but also of suitable methodologies for subjective assessment of acoustic comfort in apartments. Interdisciplinary collaboration turned out to be essential to tackle these issues and different European actions are strongly involved in this process, with the perspective of establishing harmonized standards and internationally accepted sound insulation classes.
Working group 2 of the COST action TU 0901 “Integrating and Harmonizing Sound Insulation Aspects in Sustainable Urban Housing Constructions“ [1] deals with the issue of subjective perception of sound insulation in dwellings. The work is performed through noise surveys in dwellings (using questionnaires) on one hand and by laboratory listening tests experiments on the other hand. The methodology used in the noise surveys is based on discussions between international partners and on knowledge obtained from the standard ISO/TS 15666 [2]. At this moment, listening tests are still performed in many different ways and no generally accepted methodology has been set so far.
When speaking about sound insulation between two adjacent apartments, several aspects can be tested in laboratory conditions. Sometimes noise annoyance can be the main scope of interest [3], and other times the loudness of the transmitted sound. Also many other effects may play a role in the overall perception of sound, such as the room acoustical properties of and the background noise
in the receiving room, the activity of the listener, and the question if one can localise the noise source [4]. Also the way the stimuli are presented might play role [5]. The research presented in this paper follows up previous research presented in [6] and deals with the subjective assessment of perceived loudness (of neighbour noise) by listening tests in laboratory conditions. In those experiments 40 subjects participated in listening tests, in which 64 different stimuli representing sounds that typically occur in households were presented via headphones. The results indicated that using Rw,living as a single number quantifier of the sound insulation of walls might not adequately correspond with the perception of people. However, the question whether the content of sounds influences the loudness perception remained unanswered.
This article presents some preliminary results and trends based on answers from 8 persons performing listening tests in which sound signals with content and without content are compared in terms of their perceived loudness after transmission through a heavy weight and light weight wall. 15 different stimuli with a duration of 5 seconds were presented to subjects via headphones in three ways: (1) original daily life signals, auralized as they would sound as after being transmitted through the wall between neighboring apartments. Obviously, these sounds were carrying information on the activity producing them, e.g. on the kind music being played by the neighbor’s hifi, or on the mood and subject of the neighbour’s conversation. (2) the time inverted version of the signals in (1). The signals were inverted in order to scramble the semantic information in the sound while maintaining the dynamic character of its modulations (only the order of the modulation was reversed). The goal of comparing (2) with (1) is to see the effect of semantic information on the perceived loudness. (3) noise stimuli filtered such that they had the same spectrum as the signals in (1), but without the amplitude modulations. The goal of comparing (3) with (1) was to assess the influence of amplitude modulations on the loudness perception of transmitted sounds.
Listening tests
Listening tests as a research tool in acoustics have been used over the years by many researchers, mainly for experiments that led to the conception or validation of room acoustical parameters [7], and ultimately to their standardization. Similar approaches have been occasionally employed also in building acoustics, but they are less common. In some way this is logical. When speaking e.g. about sound insulation in buildings, one usually deals with the improvement of the building structure, which is not a source of sound, and thus cannot be listened to as such [8]. In comparison with room acoustic experiments, the requirements on the laboratory conditions needed to perform sound insulation experiments are much more stringent, since the sound transmitted through a building construction is typically reaching much lower sound levels. To avoid masking by background sounds, transmission experiments can only be performed within in a very well insulated building shell.
With respect to this, it has been shown that compensating the background noise masking problem by playing sound stimuli on louder levels is distorting the results, as loudness perception not only depends on frequency, but also on intensity [9,10]. The influence of background noise on the subjective assessment of sound insulation has been investigated by Horvat et al [5].
Description of the experiments The experiments were performed as a continuation of the experiment presented at Euronoise 2012 [6], in which a lightweight and heavy weight wall with a different spectrum but with the same single value rating Rliving = 51dB were compared. The name Rliving has been recently introduced and

discussed in NWIP ISO 16717-1 and can be calculated as Rw + C50-5000, with Rw the weighted sound transmission index and C50-5000 a spectrum adaptation term [10,11]. C50-5000, and therefore also Rliving, was conceived with the presumption that the spectrum of living noise activity in dwellings is quite similar to the one of the pink noise, and that A-weighting adequately taking into account the spectrum of human hearing (albeit only for 40 dB SPL at 1000 Hz).
The two considered walls were: 1) a heavy weight (masonry) wall with a basic thickness of 175 mm, surface density m` around
1 746 kg/m³ (ca. 305 kg/m²) and plastered from one side 2) a light-weight wall made out of gypsum boards on metal studs that consisted of two 12,5
mm Safeboard plates with surface density m` = 17,7 kg/m², 60 mm Knauf Insulation Thermolan TI 140 T mineral wool, with m` = 1,04 kg/m² between 75 mm C studs, and of two 12,5 mm Safeboard plates with m` = 17,7 kg/m².
The (laboratory measured) sound insulation spectra (R) of the two walls were very different (Fig. 1) as well as their Rw values, which were Rw = 52 dB and Rw = 69 dB for the masonry and light-weight wall respectively.
0"
10"
20"
30"
40"
50"
60"
70"
80"
90"
50"
63"
80"
100"
125"
160"
200"
250"
315"
400"
500"
630"
800"
1000"
1250"
1600"
2000"
2500"
3150"
4000"
5000"
Light1weight"wall"Masonry"wall"
Soun
d&redu
c*on
&inde
x,&R&(d
B)&
frequency,&f&(Hz)&
Figure 1: Sound reduction index of the two considered walls
Listening subjects
Eight (8) listening subjects have participated in this preliminary study. 4 subjects were young normal hearing male and female (22-28 years old), 2 were normal hearing female and male (37 and 47 years old) and 2 were 63 years old subjects (one female, one male) with unknown audiogram, but without complaints about hearing.
Stimuli
A representative (diverse) selection of 15 stimuli of each 5 seconds duration were chosen out of 64 sound signals used in [6]. The 15 sound signals were processed in order to test the influence of recognition of their semantic content of sound and of the presence of modulation on the perception of their loudness (after being transmitted through the walls). As anticipated in the Introduction section, the stimuli were presented to the subjects via headphones in three ways:
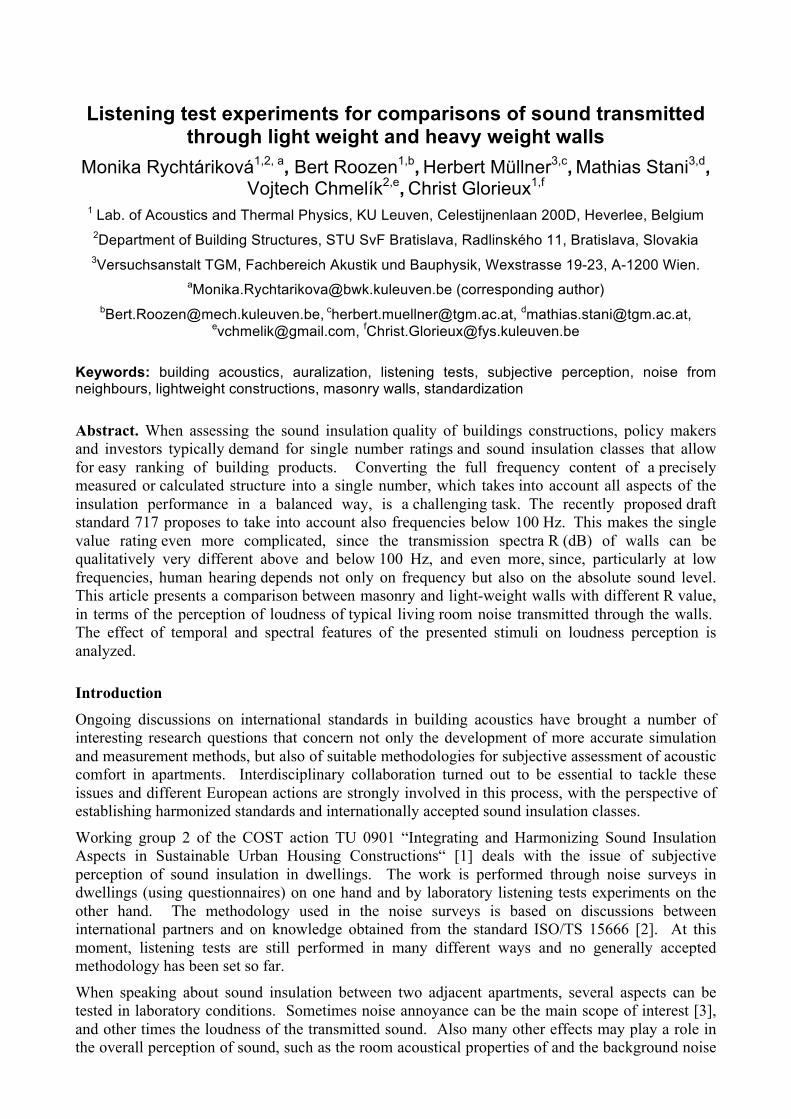
(1) original signals (OS), i.e. daily life sounds with semantic content, as transmitted through the walls (2) inverted signals (IS) in time domain, suitable to test the effect of the presence/absence of semantic content on the loudness perception (3) noise stimuli (NS) with the same spectra as the OS sounds, but without their semantic content and modulations
!
Figure 2. Interior of anechoic room with one of the test persons performing listening test (left) and home made listening test user interface (right)
0"
10"
20"
30"
40"
50"
60"
70"
80"
90"
100"
20" 200" 2000"
Lp#(d
B)#
f#(Hz)#0 0.5 1 1.5 2 2.5
x 105
−0.4
−0.3
−0.2
−0.1
0
0.1
0.2
0.3
0.4
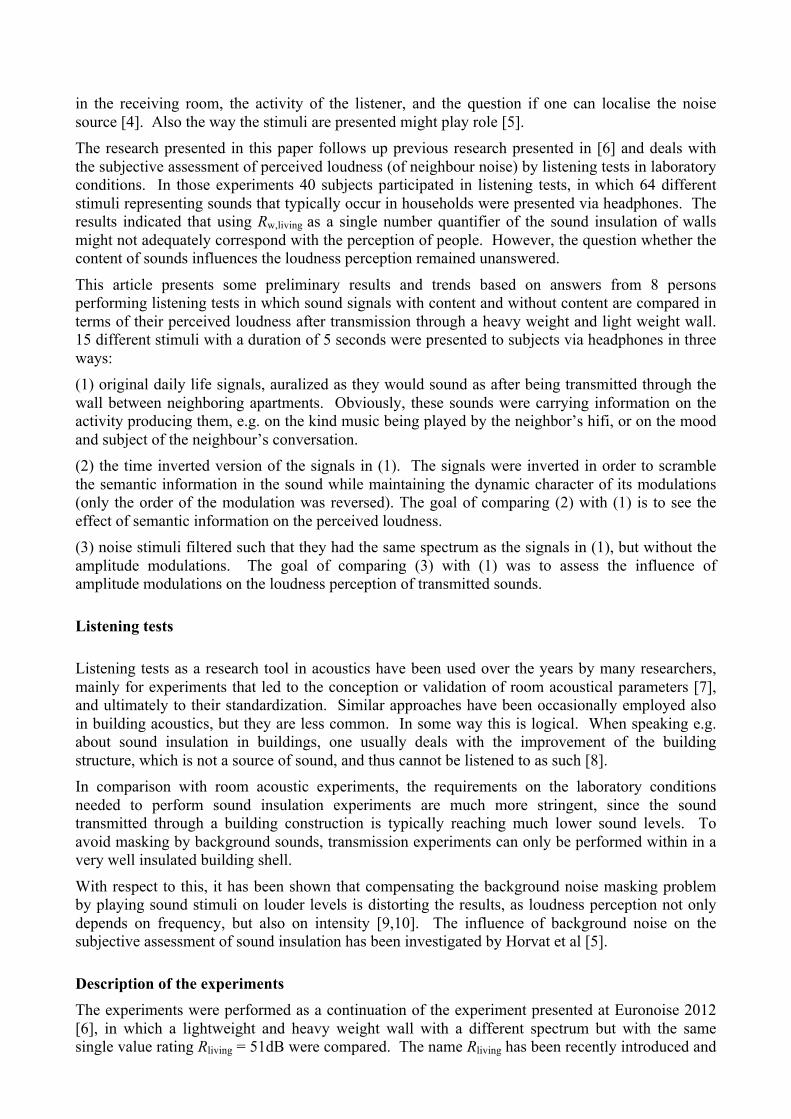
Figure 3: Spectrum (left) and time evolution (right, in arbitrary units) of one of the sound signals as recorded in sending room. The chosen example (5 seconds duration) concerns party sound (with music from Moby), e.g. a combination of talking and laughing people with music that contains low frequency components.
0 0.5 1 1.5 2 2.5x 10⁵
−0.4
−0.3
−0.2
−0.1
0
0.1
0.2
0.3
0.4
0 0.5 1 1.5 2 2.5x 10⁵
−0.4
−0.3
−0.2
−0.1
0
0.1
0.2
0.3
0.4
0 0.5 1 1.5 2 2.5x 10⁵
−0.4
−0.3
−0.2
−0.1
0
0.1
0.2
0.3
0.4
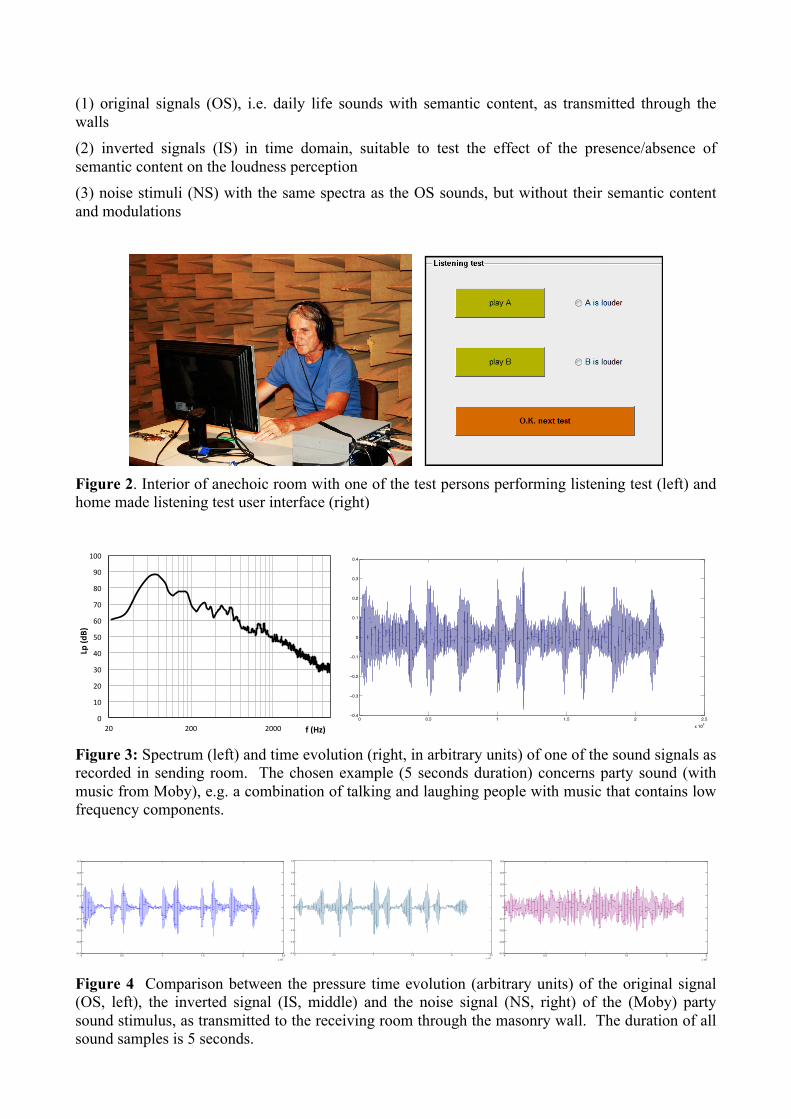
Figure 4 Comparison between the pressure time evolution (arbitrary units) of the original signal (OS, left), the inverted signal (IS, middle) and the noise signal (NS, right) of the (Moby) party sound stimulus, as transmitted to the receiving room through the masonry wall. The duration of all sound samples is 5 seconds.
20#
25#
30#
35#
40#
45#
50#
0# 0.5# 1# 1.5# 2# 2.5# 3# 3.5# 4# 4.5#
L p,A$(dB)$
t$(s)$
OS$
NS$
IS$
NS$
IS$OS$
Light3weight$wall$
Heavy$weight$wall$
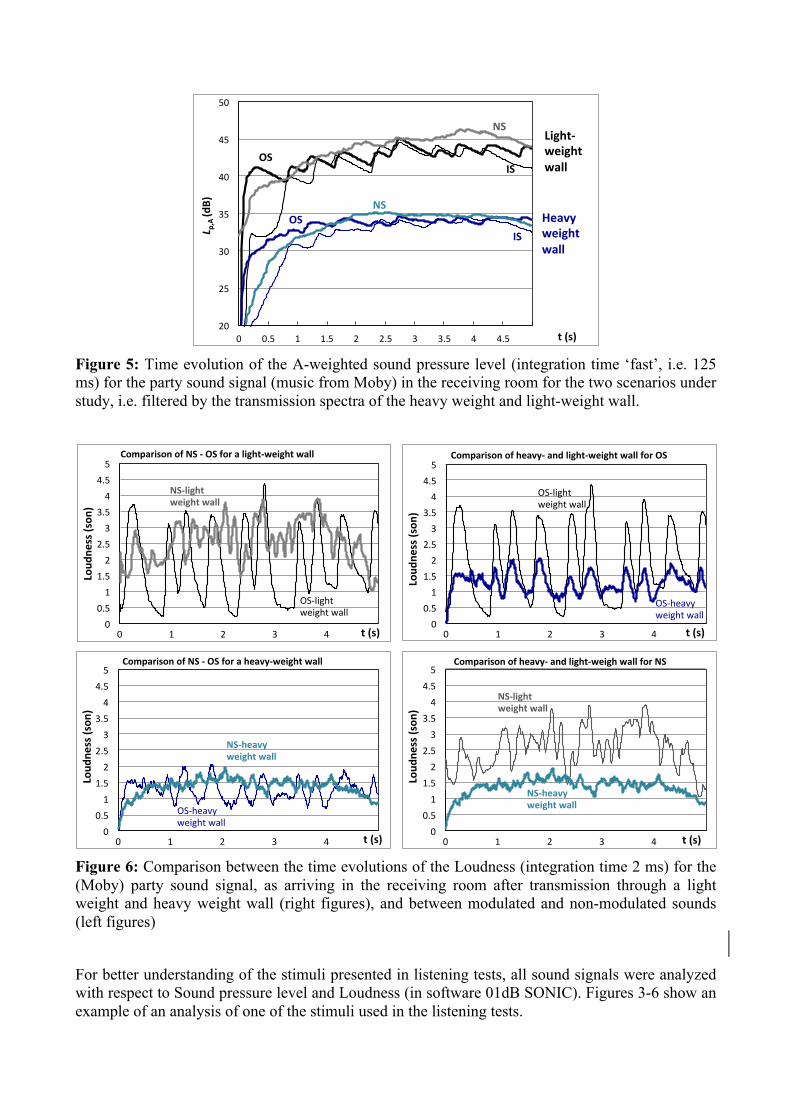
Figure 5: Time evolution of the A-weighted sound pressure level (integration time ‘fast’, i.e. 125 ms) for the party sound signal (music from Moby) in the receiving room for the two scenarios under study, i.e. filtered by the transmission spectra of the heavy weight and light-weight wall.
0"0.5"1"
1.5"2"
2.5"3"
3.5"4"
4.5"5"
0" 1" 2" 3" 4"
Loud
ness((son
)(
t((s)(
OS+light"weight"wall"
NS.light(weight(wall(
Comparison(of(NS(.(OS(for(a(light.weight(wall((
0"0.5"1"
1.5"2"
2.5"3"
3.5"4"
4.5"5"
0" 1" 2" 3" 4"
Loud
ness((son
)(
t((s)(
Comparison(of(NS(.(OS(for(a(heavy.weight(wall((
NS.heavy(weight(wall(
OS+heavy"weight"wall"
0"0.5"1"
1.5"2"
2.5"3"
3.5"4"
4.5"5"
0" 1" 2" 3" 4"
Loud
ness((son
)(
t((s)(
OS+light"weight"wall"
OS+heavy"weight"wall"
Comparison(of(heavy.(and(light.weight(wall(for(OS((
0"0.5"1"
1.5"2"
2.5"3"
3.5"4"
4.5"5"
0" 1" 2" 3" 4"
Loud
ness((son
)(
t((s)(
NS.light(weight(wall(
NS.heavy(weight(wall(
Comparison(of(heavy.(and(light.weigh(wall(for(NS(
Figure 6: Comparison between the time evolutions of the Loudness (integration time 2 ms) for the (Moby) party sound signal, as arriving in the receiving room after transmission through a light weight and heavy weight wall (right figures), and between modulated and non-modulated sounds (left figures)
For better understanding of the stimuli presented in listening tests, all sound signals were analyzed with respect to Sound pressure level and Loudness (in software 01dB SONIC). Figures 3-6 show an example of an analysis of one of the stimuli used in the listening tests.
Listening test protocol and presentation of stimuli
The listening tests were interactive, i.e. each subject could freely decide when to start the sound playing and input his or her answer by using the computer mouse and menu on the computer screen (user interface shown in Fig 2-right). For potential help with technical issues, there was a microphone placed next to the person (in the semi-anechoic room) for communication with an operator who was standby in an adjacent room. In practice, none of the persons have made use of the intercom system. In order to give each person some time to accommodate to the silent and anechoic environment (which was for a few of the subjects also a new experience), all the instructions and explanations were given inside the anechoic room.
Stimuli were presented in pairs (A-masonry wall : B-light-weight wall or vice versa) in random order with two repetitions, by using a home made Matlab user interface. The subjects were asked to indicate which of both sounds was heard as louder. They were not told that they were actually comparing sound transmitted through two walls (Fig.1). The sound stimuli with original signals were presented in one listening test, while the inverted signals and noise signals were presented in a randomly mixed way in a second test.
The answers were saved in a file and analysed later. The average duration of one test was about 40 minutes. Shortly after the test, each subject was asked to give feedback, e.g. concerning his or her personal impression about the heard sounds, and about the level of difficulty to compare the loudness of the A and B sounds.
All experiments were performed in a semi-anechoic room (Fig. 2) with a background noise level smaller Lp,A = 15dB, which was suitable for playing sounds on their exact absolute level, which is essential for the reliability of the study. The sound level in the headphones was calibrated by using an artificial ear device. In order to keep the background noise as low as possible and to avoid sounds from electronic equipment, only a listening unit from Head Acoustics® with electrostatic headphones, a computer screen and a PC mouse and were present in the room. A computer with soundcard connected with the unit via an SPDIF connection was placed in the operator room. Results and conclusion
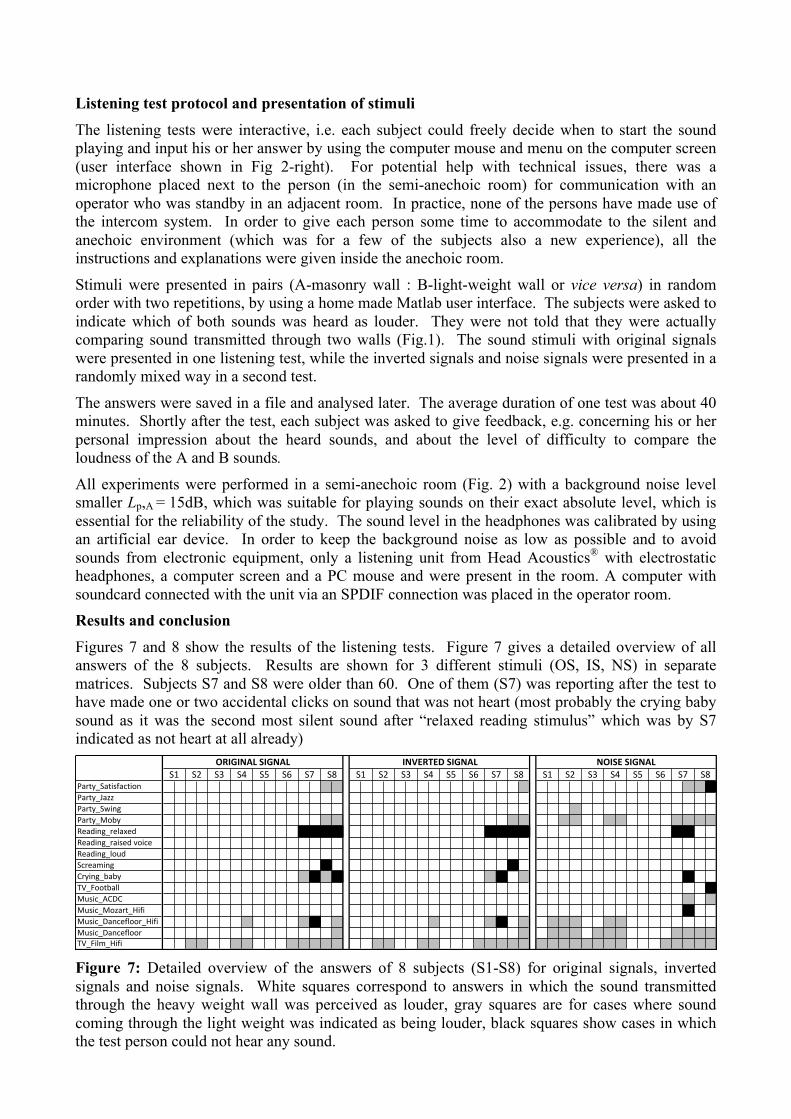
Figures 7 and 8 show the results of the listening tests. Figure 7 gives a detailed overview of all answers of the 8 subjects. Results are shown for 3 different stimuli (OS, IS, NS) in separate matrices. Subjects S7 and S8 were older than 60. One of them (S7) was reporting after the test to have made one or two accidental clicks on sound that was not heart (most probably the crying baby sound as it was the second most silent sound after “relaxed reading stimulus” which was by S7 indicated as not heart at all already)
Party_SatisfactionParty_JazzParty_SwingParty_MobyReading_relaxedReading_raised9voiceReading_loudScreamingCrying_babyTV_FootballMusic_ACDCMusic_Mozart_HifiMusic_Dancefloor_HifiMusic_DancefloorTV_Film_Hifi
S7 S8NOISE&SIGNALORIGINAL&SIGNAL INVERTED&SIGNAL
S1 S2 S3 S4S1 S2 S3 S4 S5 S6 S7 S8 S5 S6S7 S8S1 S2 S3 S4 S5 S6
Figure 7: Detailed overview of the answers of 8 subjects (S1-S8) for original signals, inverted signals and noise signals. White squares correspond to answers in which the sound transmitted through the heavy weight wall was perceived as louder, gray squares are for cases where sound coming through the light weight was indicated as being louder, black squares show cases in which the test person could not hear any sound.
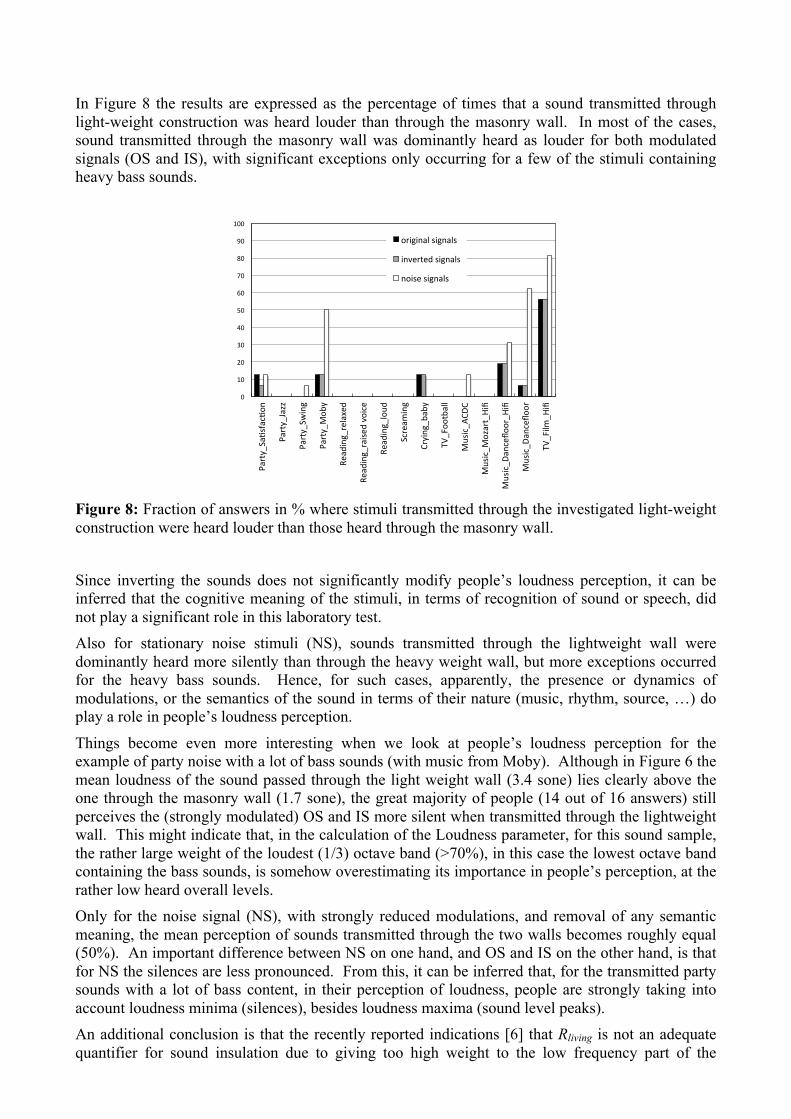
In Figure 8 the results are expressed as the percentage of times that a sound transmitted through light-weight construction was heard louder than through the masonry wall. In most of the cases, sound transmitted through the masonry wall was dominantly heard as louder for both modulated signals (OS and IS), with significant exceptions only occurring for a few of the stimuli containing heavy bass sounds.
0"
10"
20"
30"
40"
50"
60"
70"
80"
90"
100"
Party_Sa3sfac3on
"
Party_Jazz"
Party_Sw
ing"
Party_Mob
y"
Reading_relaxed"
Reading_raise
d"voice"
Reading_loud
"
Scream
ing"
Crying_b
aby"
TV_Foo
tball"
Music_A
CDC"
Music_M
ozart_Hifi"
Music_D
anceflo
or_H
ifi"
Music_D
anceflo
or"
TV_Film
_Hifi"
original"signals"
inverted"signals"
noise"signals"
Figure 8: Fraction of answers in % where stimuli transmitted through the investigated light-weight construction were heard louder than those heard through the masonry wall.
Since inverting the sounds does not significantly modify people’s loudness perception, it can be inferred that the cognitive meaning of the stimuli, in terms of recognition of sound or speech, did not play a significant role in this laboratory test. Also for stationary noise stimuli (NS), sounds transmitted through the lightweight wall were dominantly heard more silently than through the heavy weight wall, but more exceptions occurred for the heavy bass sounds. Hence, for such cases, apparently, the presence or dynamics of modulations, or the semantics of the sound in terms of their nature (music, rhythm, source, …) do play a role in people’s loudness perception.
Things become even more interesting when we look at people’s loudness perception for the example of party noise with a lot of bass sounds (with music from Moby). Although in Figure 6 the mean loudness of the sound passed through the light weight wall (3.4 sone) lies clearly above the one through the masonry wall (1.7 sone), the great majority of people (14 out of 16 answers) still perceives the (strongly modulated) OS and IS more silent when transmitted through the lightweight wall. This might indicate that, in the calculation of the Loudness parameter, for this sound sample, the rather large weight of the loudest (1/3) octave band (>70%), in this case the lowest octave band containing the bass sounds, is somehow overestimating its importance in people’s perception, at the rather low heard overall levels. Only for the noise signal (NS), with strongly reduced modulations, and removal of any semantic meaning, the mean perception of sounds transmitted through the two walls becomes roughly equal (50%). An important difference between NS on one hand, and OS and IS on the other hand, is that for NS the silences are less pronounced. From this, it can be inferred that, for the transmitted party sounds with a lot of bass content, in their perception of loudness, people are strongly taking into account loudness minima (silences), besides loudness maxima (sound level peaks). An additional conclusion is that the recently reported indications [6] that Rliving is not an adequate quantifier for sound insulation due to giving too high weight to the low frequency part of the
spectrum (in view of the low hearing sensitivity of people for low frequency at rather low (transmitted) sound levels), are confirmed when testing with inverted and stationary noisy stimuli without cognitive, semantic or modulation content.
As a final remark we would like to stress that these preliminary results were obtained from listening tests of only 8 test persons. In order to interpret the indications in a more robust way, tests of more people are ongoing.
References
[1] COST action TU 0901 “Integrating and Harmonizing Sound Insulation Aspects in Sustainable Urban Housing Constructions”
[2] ISO/TS 15666:2003 Acoustics - Assessment of noise annoyance by means of social and socio-acoustic surveys.
[3] T.H. Pedersen, S. Antunes, B. Rasmussen: Online listening tests on sound insulation of walls – A feasibility study, Proceedings of Euronoise 2012, Prague, Czech rep.
[4] J. Brunskog, H.D. Hwang, Ch.H. Jeong, Subjective response to foot-fall noise, including localization of the source position Acta Acustica united with Acustica 97 (2011), 904-908.
[5] M. Horvat, K. Jambrošić, H. Domitrović: Suitability of 3D Sound Reproduction and the Influence of Background Noise on Subjective Assessment of Sound Insulation, Proceedings of Euronoise 2012, Prague, Czech rep.
[6] M. Rychtáriková, H. Mülner, M. Stani, V. Chmelík, C. Glorieux, Does the living noise spectrum adaptation of sound insulation match the subjective perception? Proceedings Euronoise 2012, Prague, Czech rep.
[7] Rychtáriková, M., Vermeir, G., Vorländer, M. (2010): Laboratory listening tests in building and room acoustics, European symposium: Harmonisation of European Sound Insulation Descriptors and Classification Standards, Florence, Italy, 14 December 2010.
[8] Rychtáriková M. (2012): Listening Matters in Building and Room Acoustics, Proceedings of Euronoise 2012, Prague, Czech rep (a plenary talk)
[9] Y. Suzuki and H. Takeshima: Equal-loudness-level contours for pure tones, J. Acoust. Soc. Am. 116(2), (2004) 918-933.
[10] ISO 717-1:1996, “Acoustics - Rating of sound insulation in buildings and of buildings elements – Airborne sound insulation.”
[11] ISO/TC 43/SC 2 N 1100: NWIP. ISO 16717-1 "Acoustics - Evaluation of sound insulation spectra by single-numbers - Part 1: Airborne sound insulation".
[12] M. Vorländer: Auralization of spaces. Physics Today 62(6) (2009) 35–40. [13] E. Zwicker and R. Feldtkeller: Das Ohr als Nachrichtenempfanger, Hirzel-Verlag, Stuttgart,
Germany, 1967. English translation by H. Musch, S. Buus, and M. Florentine, The Ear as a Communication Receiver Acoust. Soc. Am., Woodbury, NY, 1999.
[14] W. Scholl, J. Lang, V. Wittstoc: Rating of Sound Insulation at Present and in Future. The Revision of ISO 717. Acta Acustica united with Acustica 97 (2011) 686-698.