lis 397.1 introduction to research in library and information science summer, 2003 day 4
DESCRIPTION
LIS 397.1 Introduction to Research in Library and Information Science Summer, 2003 Day 4. Old Business. Typo on syllabus Here’s the REAL reading schedule: Before week 1 – Nothing Before week 2 – Huff Best Hinton, Ch. 1, 2, 3 S, Z, & Z, Ch. 1, 2, 3 Before Week 3 – Dethier - PowerPoint PPT PresentationTRANSCRIPT

R. G. Bias | School of Information | SZB 562BB | Phone: 512 471 7046 | [email protected] 1
i
LIS 397.1Introduction to Research in Library and
Information Science
Summer, 2003
Day 4

R. G. Bias | School of Information | SZB 562BB | Phone: 512 471 7046 | [email protected] 2
iOld Business
• Typo on syllabus– Here’s the REAL reading schedule:– Before week 1 – Nothing– Before week 2 –
• Huff• Best• Hinton, Ch. 1, 2, 3• S, Z, & Z, Ch. 1, 2, 3
– Before Week 3 –• Dethier• Hinton, Ch. 4, 5, 6, 7, 8• S, Z, & Z, Ch. 7, 8, 14• Harris

R. G. Bias | School of Information | SZB 562BB | Phone: 512 471 7046 | [email protected] 3
iUpdated Reading Sched. (Cont’d.)
• Before Week 4 –– S, Z, &, Z, Ch. 4, 5, 6, 10, 11– Cronin– Groman articles
• Before Week 5 –– Hinton, Ch. 9 – 16, 19– S, Z, & Z, Ch. 12, 13
• Before Week 6 –– MacCoun– (No S, Z, & Z, Ch. 16)
• Also, I listed the “17th day of class” wrongly – it’s 7/10/2003.

R. G. Bias | School of Information | SZB 562BB | Phone: 512 471 7046 | [email protected] 4
iMore Old Business
• Web site
• Room
• Normal curve example

R. G. Bias | School of Information | SZB 562BB | Phone: 512 471 7046 | [email protected] 5
iFrom Jaisingh (2000)


R. G. Bias | School of Information | SZB 562BB | Phone: 512 471 7046 | [email protected] 7
iCalculating percentiles
• From Runyon et al. (2000)

R. G. Bias | School of Information | SZB 562BB | Phone: 512 471 7046 | [email protected] 9
iGraphs
• Graphs/tables/charts do a good job (done well) of depicting all the data.
• But they cannot be manipulated mathematically.
• Plus it can be ROUGH when you have LOTS of data.
• Let’s look at your examples.

R. G. Bias | School of Information | SZB 562BB | Phone: 512 471 7046 | [email protected] 10
iSome rules . . .
• . . . For building graphs/tables/charts:– Label axes.– Divide up the axes evenly.– Indicate when there’s a break in the rhythm!– Keep the “aspect ratio” reasonable.– Histogram, bar chart, line graph, pie chart,
stacked bar chart, which when?– Keep the user in mind.

R. G. Bias | School of Information | SZB 562BB | Phone: 512 471 7046 | [email protected] 11
i• http://www.who.int/csr/sars/country/2003_06_06/en/• http://www.econmodel.com/phillips/index2.php?graph=4969.png• http://www.time.com/time/covers/1101030505/sars/index.html• http://factfinder.census.gov/bf/_lang=en_vt_name=DEC_2000_SF3_U_DP3_ge
o_id=01000US.html• http://www.understandingusa.com/chaptercc=14&cs=302.html• http://www.pbs.org/wgbh/pages/frontline/shows/race/economics/analysis.html• http://www.ischool.utexas.edu/~annashin/StatisticsRepresentation.doc• http://www.austin360.com/search/content/shared/money/salarysurvey/browse.ht
ml• http://money.cnn.com/2003/05/07/pf/saving/q_jobless_grads/index.htm• http://www.dps.state.la.us/TIGER/PollFrequencies.htm• http://story.news.yahoo.com/news?tmpl=story2&u=/030529/246/486h6.html• http://www.blooberry.com/indexdot/history/browsers.htm

R. G. Bias | School of Information | SZB 562BB | Phone: 512 471 7046 | [email protected] 12
iSo far . . .
• . . . we’ve talked of summarizing ONE distribution of scores. – By ordering the scores.– By organizing them in graphs/tables/charts.– By calculating a measure of central
tendency and a measure of dispersion.
• What happens when we want to compare TWO distributions of scores?

R. G. Bias | School of Information | SZB 562BB | Phone: 512 471 7046 | [email protected] 13
i“Now, why would I want to do that”?
• Is your child taller or heavier?• Is this month’s SAT test any easier or harder than last
month’s?• Is my 91 in my Research Methods class better than
my 95 in my Digital Libraries class?• Is the new library lay-out better than the old one?• Can more employees sign up, more quickly, for
benefits with our new intranet site than with our old one?
• Did my class perform better on the TAKS test than they did on the TAAS test?
R. G. Bias | School of Information | SZB 562BB | Phone: 512 471 7046 | [email protected] 14
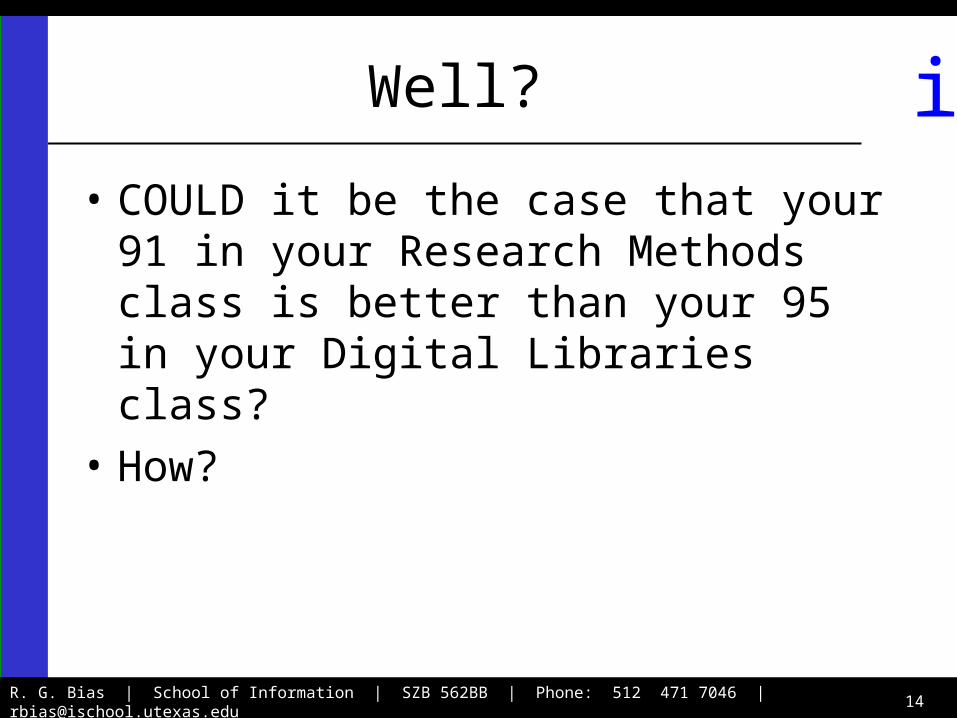
iWell?
• COULD it be the case that your 91 in your Research Methods class is better than your 95 in your Digital Libraries class?
• How?
R. G. Bias | School of Information | SZB 562BB | Phone: 512 471 7046 | [email protected] 15
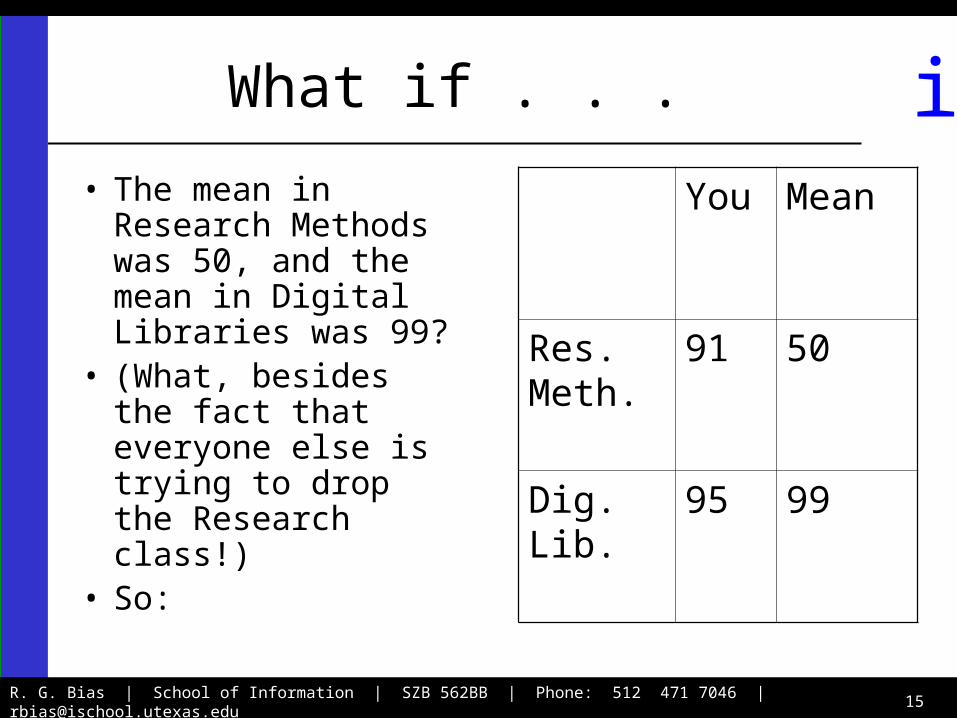
iWhat if . . .
• The mean in Research Methods was 50, and the mean in Digital Libraries was 99?
• (What, besides the fact that everyone else is trying to drop the Research class!)
• So:
You Mean
Res. Meth.
91 50
Dig. Lib. 95 99

R. G. Bias | School of Information | SZB 562BB | Phone: 512 471 7046 | [email protected] 16
iThe Point
• As I said yesterday, you need to know BOTH a measure of central tendency AND a measure of spread to understand a distribution.
• BUT STILL, this can be convoluted . . .
• “Well, daughter, how are you doing in grad school this semester”?

R. G. Bias | School of Information | SZB 562BB | Phone: 512 471 7046 | [email protected] 17
i“Well, Mom . . .
• “. . . I have a 91 in Research Methods but the mean is 50 and the standard deviation is 12, but I only have a 95 in Digital Libraries, whereas the mean in that class is 99 with a standard deviation of 1.”
• Of course, your mom’s reaction will be, “Just call home more often, dear.”

R. G. Bias | School of Information | SZB 562BB | Phone: 512 471 7046 | [email protected] 18
iWouldn’t it be nice . . .
• . . . if there could be one score we could use for BOTH classes, for BOTH the TAKS test and the TAAS test, for BOTH your child’s height and weight?
• There is – and it’s called the “standard score,” or “z score.” (Get ready for another headache.)

R. G. Bias | School of Information | SZB 562BB | Phone: 512 471 7046 | [email protected] 19
iStandard Score
• z = (X - µ)/σ• “Hunh”?• Each score can be expressed as the number
of standard deviations it is from the mean of its own distribution.
• “Hunh”?• (X - µ) – This is how far the score is from the
mean. (Note: Could be negative! No squaring, this time.)
• Then divide by the SD to figure out how many SDs you are from the mean.

R. G. Bias | School of Information | SZB 562BB | Phone: 512 471 7046 | [email protected] 20
iZ scores (cont’d.)
• z = (X - µ)/σ
• Notice, if your score (X) equals the mean, then z is, what?
• If your score equals the mean PLUS one standard deviation, then z is, what?
• If your score equals the mean MINUS one standard deviation, then z is, what?
R. G. Bias | School of Information | SZB 562BB | Phone: 512 471 7046 | [email protected] 21
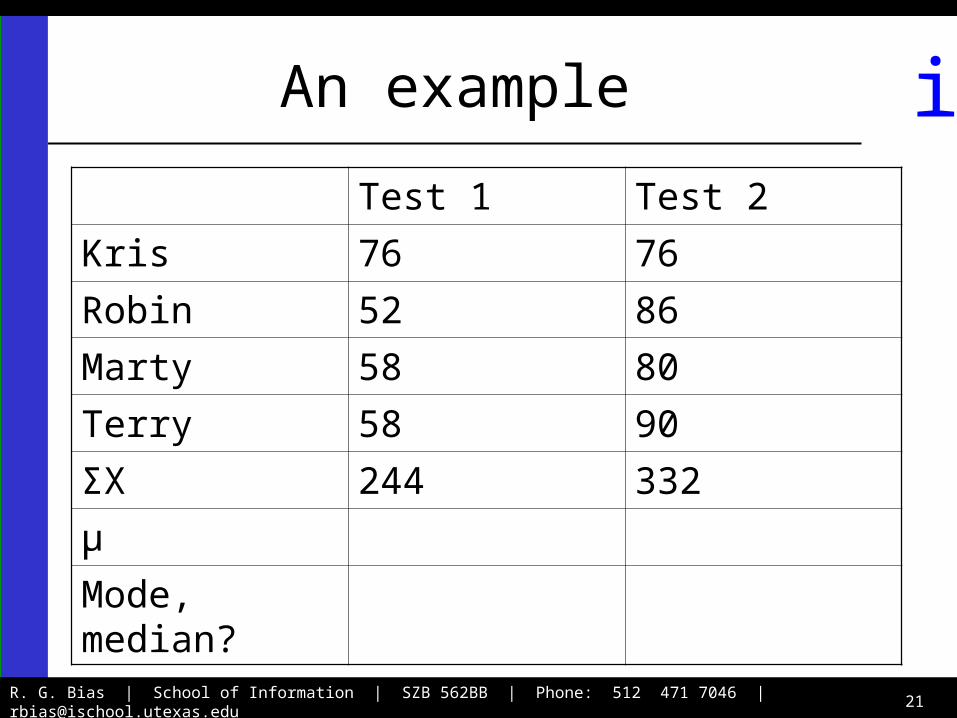
iAn example
Test 1 Test 2
Kris 76 76
Robin 52 86
Marty 58 80
Terry 58 90
ΣX 244 332
µ
Mode, median?

R. G. Bias | School of Information | SZB 562BB | Phone: 512 471 7046 | [email protected] 22
iLet’s calculate σ – Test 1
X X-µ (X-µ)2
Kris 76 15 225
Robin 52 -9 81
Marty 58 -3 9
Terry 58 -3 9
Σ 244 0 324
/N 61 81
σ 9
R. G. Bias | School of Information | SZB 562BB | Phone: 512 471 7046 | [email protected] 23
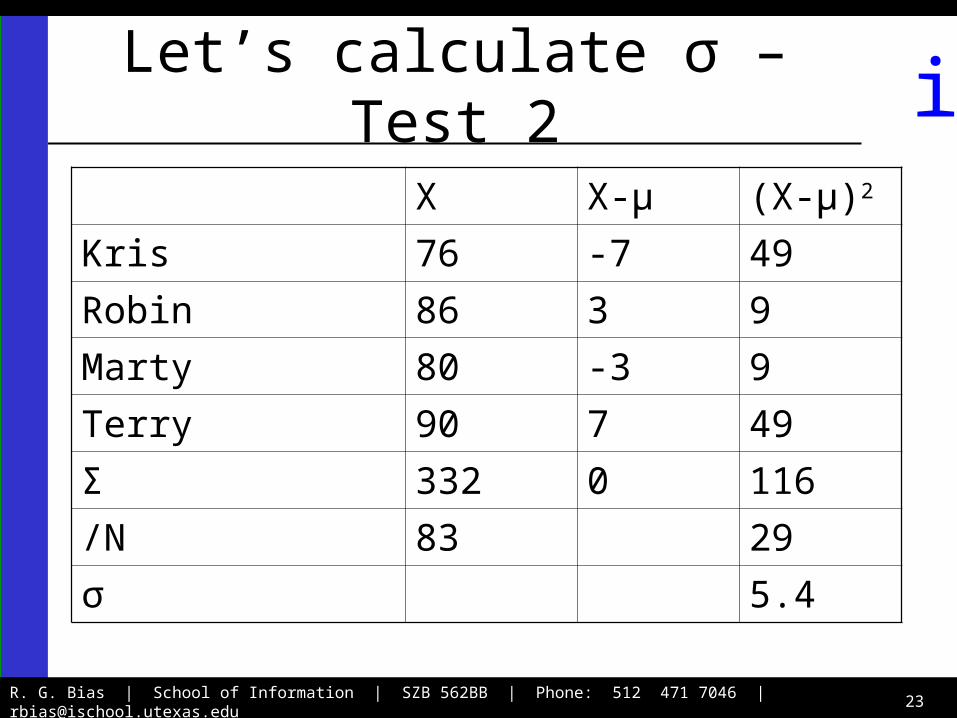
iLet’s calculate σ – Test 2
X X-µ (X-µ)2
Kris 76 -7 49
Robin 86 3 9
Marty 80 -3 9
Terry 90 7 49
Σ 332 0 116
/N 83 29
σ 5.4
R. G. Bias | School of Information | SZB 562BB | Phone: 512 471 7046 | [email protected] 24
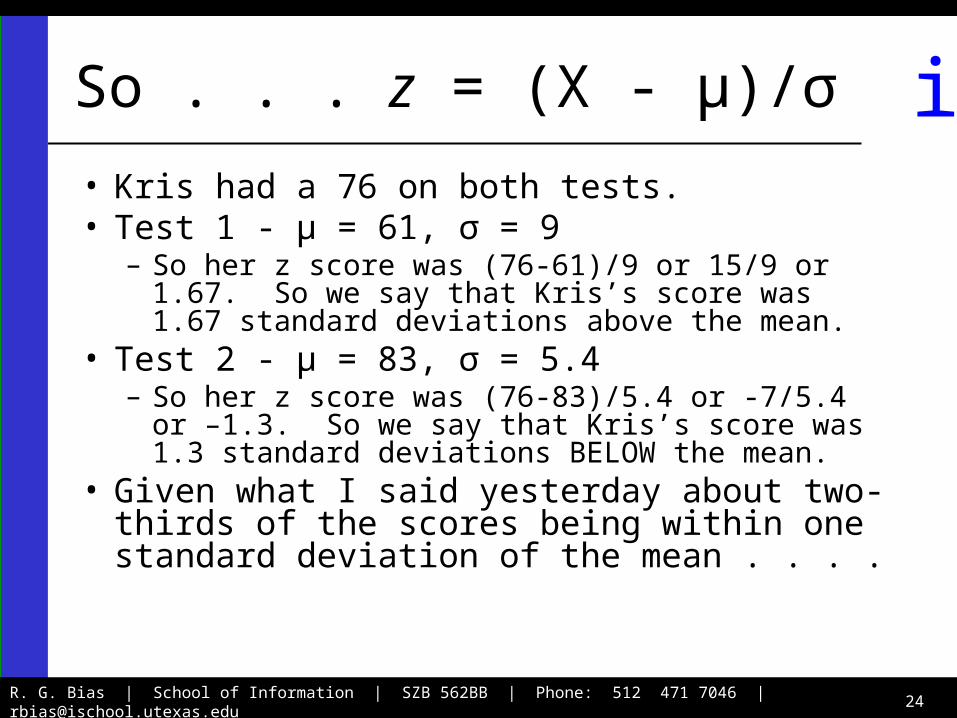
iSo . . . z = (X - µ)/σ
• Kris had a 76 on both tests.• Test 1 - µ = 61, σ = 9
– So her z score was (76-61)/9 or 15/9 or 1.67. So we say that Kris’s score was 1.67 standard deviations above the mean.
• Test 2 - µ = 83, σ = 5.4– So her z score was (76-83)/5.4 or -7/5.4 or –1.3.
So we say that Kris’s score was 1.3 standard deviations BELOW the mean.
• Given what I said yesterday about two-thirds of the scores being within one standard deviation of the mean . . . .

R. G. Bias | School of Information | SZB 562BB | Phone: 512 471 7046 | [email protected] 25
iz = (X - µ)/σ
• If I tell you that the average IQ score is 100, and that the SD of IQ scores is 16, and that Bob’s IQ score is 2 SD above the mean, what’s Bob’s IQ?
• If I tell you that your 75 was 1.5 standard deviations below the mean of a test that had a mean score of 90, what was the SD of that test?

R. G. Bias | School of Information | SZB 562BB | Phone: 512 471 7046 | [email protected] 26
iNotice . . .
• The mean of all z scores (for a particular distribution) will be zero, as will be their sum.
• With z scores, we transform raw scores into standard scores.
• These standard scores are RELATIVE distances from their (respective) means.
• All are expressed in units of σ.

R. G. Bias | School of Information | SZB 562BB | Phone: 512 471 7046 | [email protected] 27
iProbability
• Remember all those decisions we talked about, last week.
• VERY little of life is certain.– One person wore her new Snoopy shirt
because she THOUGHT it would make her feel happy. (Or maybe she thought to herself: “The probability that wearing this shirt will make me happy is ≥ .50.”) (But I doubt it.)

R. G. Bias | School of Information | SZB 562BB | Phone: 512 471 7046 | [email protected] 28
iProb. (cont’d.)
• Life’s a gamble!• Just about every decision is based on a
probable outcomes.• None of you raised your hands last
Wednesday when I asked for “statistical wizards.” Yet every one of you does a pretty good job of navigating an uncertain world.– None of you touched a hot stove (on purpose.)– All of you made it to class.

R. G. Bias | School of Information | SZB 562BB | Phone: 512 471 7046 | [email protected] 29
iProbabilities
• Always between one and zero.• Something with a probability of “one” will
happen. (e.g., Death, Taxes).• Something with a probability of “zero” will not
happen. (e.g., My becoming a Major League Baseball player).
• Something that’s unlikely has a small, but still positive, probability. (e.g., probability of someone else having the same birthday as you is 1/365 = .0027, or .27%.)

R. G. Bias | School of Information | SZB 562BB | Phone: 512 471 7046 | [email protected] 30
iJust because . . .
• . . . There are two possible outcomes, doesn’t mean there’s a “50/50 chance” of each happening.
• When driving to school today, I could have arrived alive, or been killed in a fiery car crash. (Two possible outcomes, as I’ve defined them.) Not equally likely.
• But the odds of a flipped coin being “heads,” . . . .

R. G. Bias | School of Information | SZB 562BB | Phone: 512 471 7046 | [email protected] 31
iProb (cont’d.)
• Probability of something happening is – # of “successes” / # of all events– P(one flip of a coin landing heads) = ½ = .5– P(one die landing as a “2” = 1/6 = 1.67– P(some score in a distribution of scores is greater
than the median) = ½ = .5– P(some score in a normal distribution of scores is
greater than the mean but has a z score of 1 or less is . . . ?
– P(drawing a diamond from a complete deck of cards) = ?

R. G. Bias | School of Information | SZB 562BB | Phone: 512 471 7046 | [email protected] 32
iProbability Rules (and Rocks!)
• Addition Rule (And rule): If there are two or more mutually exclusive outcomes.– Chances of rolling a two or a three, on one die. 1/6
+ 1/6 = 2/6
• Multiplication Rule (Or rule): Prob. of getting BOTH of two or more independent outcomes. – Chances of rolling a two and THEN a three, on one
die. 1/6 x 1/6 = 1/36

R. G. Bias | School of Information | SZB 562BB | Phone: 512 471 7046 | [email protected] 33
iThink this through.
• What are the odds (“what are the chances”) (“what is the probability”) of getting two “heads” in a row?
• Three heads in a row?
• Three flips the same (heads or tails) in a row?

R. G. Bias | School of Information | SZB 562BB | Phone: 512 471 7046 | [email protected] 34
iSo then . . .
• WHY were the odds in favor of having two people in our class with the same birthday?
• Think about the problem!
• What if there were 367 people in the class. – P(2 people with same b’day) = 1.00

R. G. Bias | School of Information | SZB 562BB | Phone: 512 471 7046 | [email protected] 35
iHappy B’day to Us
• But we had 46.• Probability that the first person has a
birthday: 1.00.• Prob of the second person having the
same b’day: 1/365• Prob of the third person having the same
b’day as Person 1 and Person 2 is 1/365 + 1/365 – the chances of all three of them having the same birthday.

R. G. Bias | School of Information | SZB 562BB | Phone: 512 471 7046 | [email protected] 36
iSooooo . . .
• http://www.people.virginia.edu/~rjh9u/birthday.html

R. G. Bias | School of Information | SZB 562BB | Phone: 512 471 7046 | [email protected] 37
iHomework
Keep reading.
See you tomorrow.