liquid gold copyrighted material · pdf fileearth’s water fresh surface water (liquid)...
TRANSCRIPT

7
1C H A P T E R
We have really no idea how bad off we are. It’s a disaster waiting to happen. —Daniel E. Williams,
Sustainable Design: Ecology, Architecture, and Planning
Water is Earth’s most abundant resource—70 percent of Earth’s surface is water—yet less than 1 percent is the readily accessible freshwater we human beings must have to survive. That’s not much to meet the needs of the world’s nearly 6.9 billion people, about 310 million of them in the United States.1
Water was once without question a renewable resource, but that’s not necessarily the case today. We’ve overused it, polluted it, drained it, and built up and over Earth’s natural means to replen-ish it, especially when drought and changing climate are part of the equation. Even our approach to development has encroached on our ability to replenish our most needed, if not most valuable, resource. Parking lots, streets, and walkways pave out the water by interfering with the planet’s natural ability to restock its freshwater supplies.
Where does Earth’s water come from? Figure 1.1 illustrates the breakdown of Earth’s water supplies.
L I Q U I D G O L D
CH001.indd 7CH001.indd 7 2/18/11 7:43:19 AM2/18/11 7:43:19 AM
COPYRIG
HTED M
ATERIAL

8 AQUA SHOCK
According to a 2003 report from the U.S. General Accounting Offi ce:2
Oceans provide 97 percent—salty and undrinkable, and not usable for irrigation without costly desalination.Glaciers, polar ice caps, and groundwater contribute 2 percent—generally frozen and inaccessible.Surface water, including rivers and lakes, supplies 0.3 percent—generally accessible to satisfy freshwater needs that include energy, agriculture, and industrial and personal use.
The water crisis is global in scope, yet hits each of us person-ally. Not only do we need water to live, but we require massive quantities of it to produce energy, power industries, develop com-munities, and grow food. Even processing water for consumption requires huge amounts of water to produce the energy necessary for pumping, conveyance, treatment, and more. If water is in short supply, the costs of goods and services that rely on it go up, too.
For years, recycling bathtub and dishwasher water into the garden or onto the yard was the norm in water- short states like
•
•
•
Saline(oceans)
97%Icecaps and
glaciers 68.7%
Groundwater30.1%
Lakes 87%
Other 0.9%Freshwater 3%
Earth’s water Fresh surface water (liquid)
Freshwater
Surfacewater0.3% Swamps 11%
Rivers 2%
FIGURE 1 .1 Distribution of Earth’s WaterSource: U.S. Geological Survey.
CH001.indd 8CH001.indd 8 2/18/11 7:43:20 AM2/18/11 7:43:20 AM

L IQUID GOLD 9
California. Periodic restrictions on water use also are a way of life in other desert and mountain states like Colorado, Arizona, and New Mexico. But what about water shortages and restrictions in places like Pittsburgh, Pennsylvania; Boston, Massachusetts; Sarasota, Florida; Richmond, Virginia; Colstrip, Montana; Dodge City, Kansas; or Brentwood, New Hampshire?
OUR ENDLESS THIRST
The United States sucks up about 410 billion gallons of water every single day, 349 billion of which are freshwater. That’s nearly 150 trillion gallons of water used every year in this country, according to the latest (2005) data from the U.S. Geological Survey (USGS), which compiles water- use numbers every fi ve years.3 To put water use in perspective, consider that the average American uses about one hundred gallons of water every day. That’s about 36,000 gallons a year. (An average- sized backyard swimming pool might hold 18,000 to 20,000 gallons or more of water.) These numbers vary, depending on who’s counting and where they’re counting— geography, weather, personal use, and politics fi gure into the equation, too.
WATER FACTS
How much is one million gallons of water? According to the U.S. Geological Survey:
A good- sized bathtub holds 50 gallons, so it takes 20,000 baths to equal one million gallons.A swimming pool that holds a million gallons would have to be about 267 feet long (almost as long as a foot-ball fi eld), 50 feet wide, and 10 feet deep.For more, check out the USGS web site, http://ga.water .usgs.gov/edu/mgd.html.
Beyond those numbers, the amount of water our lifestyles require can be mind- boggling. It takes about fi ve gallons of water just to produce a single gallon of gasoline! If that’s not consump-tion enough, to pump, treat, and supply water to our homes also
•
•
•
CH001.indd 9CH001.indd 9 2/18/11 7:43:20 AM2/18/11 7:43:20 AM

10 AQUA SHOCK
BIGGEST CONSUMERS
The biggest guzzler of water in the United States is thermoelectric power. The nation’s power plants require 201 billion gallons of water daily to make steam to turn turbines, for cooling purposes, and more. That’s up 3 percent from 2000. Irrigation is the second- largest water user, requiring 128 billion gallons every day. Domestic water use takes a distant third, with 44.2 billion gallons of water required a day to meet Americans’ personal needs, followed by 31 billion gallons of water daily for industrial, mining, commercial, and aquaculture uses.4 These numbers sound simple enough, but satisfying our nation’s water demands is anything but simple.
IN OUR BACKYARDS
These numbers may sound mind- boggling and the idea of a water cri-sis here at home more like science fi ction. After all, you turn on the tap and plentiful clean water comes out. Until recently the idea of a water crisis, if it existed at all, was someone else’s problem. Few Americans other than environmentalists, a handful of government offi cials, farm-ers, and workers for world aid organizations like the United Nations actually paid much attention to the extent of the world’s water issues.
Reality, however, is that the United States has tapped into, sucked up, and maxed out its once- abundant and replenishable supplies of freshwater on the surface and underground. In this country, too, thousands of people fall ill every year from waterborne diseases, according to data from the U.S. Environmental Protection Agency.5
Every place has its own issues with water, says Daniel E. Williams, FAIA (Fellow, American Institute of Architects) APA member
requires a tremendous amount of energy, which in turn requires lots of water. U.S. public water, sewer, and treatment facilities use about 56 billion kilowatt- hours of electricity every year, enough elec-tricity to power more than 5 million homes, according to the U.S. Environmental Protection Agency’s WaterSense program.**U.S. Environmental Protection Agency, “WaterSense,” http://epa.gov/watersense/.
CH001.indd 10CH001.indd 10 2/18/11 7:43:23 AM2/18/11 7:43:23 AM
L IQUID GOLD 11
(American Planning Association), and author of Sustainable Design: Ecology, Architecture, and Planning ( John Wiley & Sons, 2007). As an architect and urban and regional planner, Williams has stud-ied water and planning issues in Hawaii, Washington, Florida, Colorado, Arizona, New York, Louisiana, and points in between.
For example, he says, “Colorado sells its water to Arizona, which is basically one desert selling it to the other. The aquifer that serves Tucson, Arizona, is down three hundred feet from water levels one hundred years ago. We’re irrigating desert for our food source, because we’ve built all over the best arable land. A large percent-age of our breadbasket right now is irrigated with million- year- old [ancient aquifer] water and water from Canada through the Columbia River and some of the other large transcontinental rivers. No city in the country supplies its own water within its geopolitical boundaries. So it’s literally stealing water from another place, which isn’t a problem as long as that other place doesn’t need it. But once they need it, there’s a big problem.
“It’s a disaster waiting to happen,” adds Williams, who currently is working on a book on urban design with climate change in mind.
“No one thinks the United States has a water problem,” says Mike Hightower, water expert, environmental engineer, and Distinguished Member of the Technical Staff, Sandia National Laboratories. Based in Albuquerque, New Mexico, Sandia is part of the U.S. government’s National Nuclear Security Administration, which studies water as a national security issue. “We have developed an extensive network of dams over the last hundred years, which has helped harness our vast fresh surface water resources. But we haven’t built any major dams in the last twenty- fi ve years, and we’ve maximized the use of our avail-able surface water resources. To meet the growing demand for fresh-water over the past several decades, we’ve gone to major utilization of groundwater in our aquifers [underground water supplies], and we’ve begun to overpump those.”
A consequence of overpumping water from many of the aquifers that have been drawn down is that the water left over is often brackish or salty. Saltwater is heavier than freshwater and generally settles closer to the bottom of an aquifer, says Hightower. States that have had to deal with overpumping and salinity issues in parts of their aquifers include Arizona, North Dakota, Nebraska, California, Minnesota, Ohio, Illinois,
CH001.indd 11CH001.indd 11 2/18/11 7:43:23 AM2/18/11 7:43:23 AM

12 AQUA SHOCK
New York, Pennsylvania, Florida, Wyoming, Montana, South Carolina, Alabama, Louisiana, Arkansas, Texas, and Oklahoma, he adds.
Source Water
“We don’t run out of water,” says Eric Evenson, the USGS’s National Water Census Coordinator. “Instead, the demand for it overstrips the supply. We still have a lot of water in various areas, but when we develop our population and our landscape, we don’t always match up our water demands well with our water availability.”
That’s what’s happened in Atlanta. The city’s size and subsequent demand for water have mushroomed while what has been its pri-mary water resource, Lake Lanier, hasn’t. In fact, just the opposite has happened. In recent years, Lake Lanier, on the Chattahoochee River in north Georgia, has been under a veritable siege from drought, downstream demands from Alabama and Florida, and what Hightower calls “the giant sucking sound that is Atlanta try-ing to get all the water resources it can.” Alabama and Florida want their water from the Chattahoochee, too, and the result is that the courts have a seat at the dispute table these days. (We delve more into water laws in Chapter 5.) The Chattahoochee forms a portion of the border between Georgia and Alabama, and then fl ows into the state of Florida, where it combines with the Flint River, subsequently becoming the Apalachicola River, which fl ows to the Gulf of Mexico. So there are three states and three groups—not including Atlanta—that want their share of what is a limited supply of water.
WATER FACTS
Source water: Water from rivers, lakes, streams, or aqui-fers that has not been treated; is used to provide drink-ing water via wells or public water supplyGroundwater: Water found beneath the surface, such as in aquifers; can be the source water for various suppliesSurface water: Water found above ground, such as in lakes, rivers, and streams; can be a source for various water supplies
•
•
•
CH001.indd 12CH001.indd 12 2/18/11 7:43:23 AM2/18/11 7:43:23 AM
L IQUID GOLD 13
Water Shortages on Tap
Water woes across the country remain the norm, despite persis-tent on- again, off- again spotty wet and extreme weather. At least 36 states expect some kind of water shortage to continue through 2013 under normal climate conditions, according to a 2003 report from the U.S. General Accounting Offi ce.6 Factor in drought condi-tions that already affect areas of the United States, and that number climbs to 46 states!
The National Climatic Data Center reported that as of the end of August 2010, nearly 10 percent of the contiguous United States was affected by drought. The same report also said that nationally, summer 2010 was the fourth- warmest on record, with 10 Eastern states experiencing record warm summers—Rhode Island, New Jersey, Delaware, Maryland, Virginia, North Carolina, Tennessee, South Carolina, Georgia, and Alabama.7
Some other grim numbers to think about include:
The temperature- related national energy demand for summer 2010 was the highest in 116 years. Keep in mind that energy is the single- largest daily consumer of water in the United States.8
The Great Lakes is the largest freshwater lake system in the world and holds one- fifth of Earth’s freshwater. Yet Lake Superior, the largest lake, hit record lows in August 2007.9 The lake remained 13 inches below its average level as of August 2010, despite above- average precipitation for that month.10
The United States had its fifth- driest December to February on record (2008–2009), with Texas recording its driest win-ter ever. Twelve states in the southern plains, Southeast, and Northeast had at least their tenth- driest January to February since 1895, according to the National Climatic Data Center.11
Alaskans worry about water availability in some smaller cit-ies because the rivers freeze above ground, making their water inaccessible for major portions of the year. Therefore, they have to store water during short spring and summer periods, which presents a number of water- quality issues, according to Sandia’s Hightower.
•
•
•
•
CH001.indd 13CH001.indd 13 2/18/11 7:43:26 AM2/18/11 7:43:26 AM

14 AQUA SHOCK
Along the East Coast, methyl tertiary butyl ether (MTBE), an air pollution–reducing chemical additive to gasoline whose use was banned in 2007, has been found in some groundwater.12 In general, the MTBE ended up in groundwater supplies as a result of leaking fuel tanks or runoff contaminated by gasoline.In September 2010, Governor Steven L. Beshear of Kentucky sought federal disaster assistance for 35 counties hit hard by drought in the western and west- central portions of the commonwealth.13
Tennessee also looked to federal relief in September 2010 for water- related natural disasters. In some parts of the state, the problem was too much water, as in flooding, and in others it was too little water that left parched fields and decimated crops. It’s not the first year water has been an issue for the state. As of February 2009, 57 counties in the state had been designated natural disaster areas for agriculture as a result of persistent drought conditions.14
In Massachusetts, minimal rainfall along the upper Charles River one recent year left Bostonians wondering just how much longer their water will last, especially if one factors in the pollution runoff problems in the Charles and Mystic riv-ers, which serve the area. Brockton residents, however, have an alternative. In fall 2008, the Aquaria desalination plant came online; it taps brackish water from the Taunton River.In Florida—the Southwest Florida Water Management District (including Sarasota) declared a water shortage emergency in spring 2008. Low water levels in the area’s primary water supply source, the Peace River watershed, prompted that dec-laration. Indicative of the changing nature of weather and water (or lack of) accompanying it, Florida experienced its all- time wettest May in 2009.15
Arnold Schwarzenegger, then governor of California, declared a state of emergency in February 2009, to help the state cope with three consecutive years of drought. According to esti-mates, the cost of drought at that time amounted to up to $644 million16 and it’s not over yet.
•
•
•
•
•
•
CH001.indd 14CH001.indd 14 2/18/11 7:43:26 AM2/18/11 7:43:26 AM
L IQUID GOLD 15
The Farm Connection
What if you don’t live in any of those “drought” states, on Lake Superior, in Georgia or in Alaska, or any other area with water prob-lems? Water issues in the Midwest, the Southeast, California, and beyond affect you, too. When the nation’s breadbasket withers, so does your pocketbook. If Midwestern farmers and Florida, Oregon, and California producers and fruit growers don’t have adequate moisture or access to water to grow their crops, that means less grain, less corn, less ethanol, fewer vegetables, smaller fruit crops, and higher prices for everyone.
Although today’s technology enables farmers to grow more crops on less acreage, farming still takes water. The amount is “stag-gering,” says Brad Rippey, an agricultural meteorologist in the Offi ce of the Chief Economist, U.S. Department of Agriculture (USDA), and an author of the U.S. Drought Monitor, a weekly
WATER FACTS
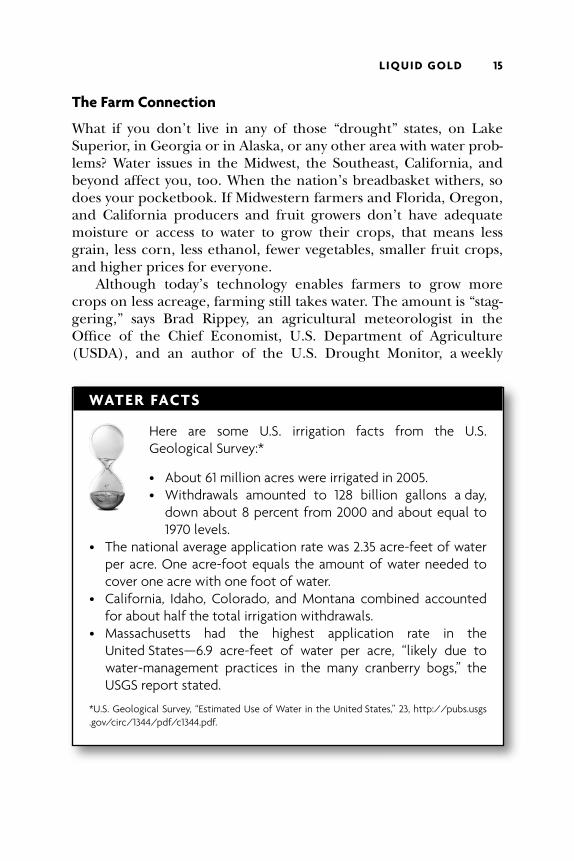
Here are some U.S. irrigation facts from the U.S. Geological Survey:*
About 61 million acres were irrigated in 2005.Withdrawals amounted to 128 billion gallons a day, down about 8 percent from 2000 and about equal to 1970 levels.
The national average application rate was 2.35 acre- feet of water per acre. One acre- foot equals the amount of water needed to cover one acre with one foot of water.California, Idaho, Colorado, and Montana combined accounted for about half the total irrigation withdrawals.Massachusetts had the highest application rate in the United States—6.9 acre- feet of water per acre, “likely due to water- management practices in the many cranberry bogs,” the USGS report stated.
*U.S. Geological Survey, “Estimated Use of Water in the United States,” 23, http://pubs.usgs .gov/circ/1344/pdf/c1344.pdf.
••
•
•
•
CH001.indd 15CH001.indd 15 2/18/11 7:43:26 AM2/18/11 7:43:26 AM

16 AQUA SHOCK
report that closely follows water availability across the country. (Check it out at http://drought.unl.edu/DM/monitor.html.)
Not all the water used by agriculture, however, disappears, adds Rippey. A percentage used for irrigation is returned to the ground. How much depends on the amount absorbed by the crops; the par-ticular crop and its water needs; the type of soil (some soils, like clay, are not as porous as others are); the weather (more evapo-ration occurs in hot weather); and the climate—arid or not, for example. “As we fi nd with everything to do with water, it’s all more complicated than a simple question and answer,” Rippey adds.
The Food and Agriculture Organization (FAO) of the United Nations estimates that the average individual requires two to four liters of drinking water a day (or slightly more than a half gallon to more than a gallon). Compare that with the 2,000 to 5,000 liters (520 to 1,300 gallons) of water it takes to produce that same person’s daily food.17 See Figure 1.2.
Though experts differ on the amount of water actually used to grow a particular crop or raise certain livestock, there’s no ques-tion that it takes a lot. In fact, it takes so much that the amount of irrigated, cultivated cropland acreage in the United States has declined, in part due to dwindling groundwater supplies, according to a report from the National Water Management Center, part of the U.S. Department of Agriculture’s Natural Resources Conservation Service.18 The report points to the following areas of concern:
The High Plains of Texas lost 1.435 million acres of irrigated, cultivated cropland over the period 1982–1997, according
•
Volume of water required to produce the following food:
Wheat: 1,000–2,000 liters (260–520 gallons) to produce one kilogram of wheat.Other grain: 1,000–3,000 liters (260–780 gallons) of water to produce one kilogram of grain.Grain-fed beef: 13,000–15,000 liters (3,380–3,900 gallons) to produce one kilogram of grain-fed beef.
••
•
FIGURE 1 .2 How Much Does It Take?Source: Food and Agriculture Organization of the United Nations (FAO).
CH001.indd 16CH001.indd 16 2/18/11 7:43:29 AM2/18/11 7:43:29 AM

L IQUID GOLD 17
to the National Resources Inventory, which states, “Most of the loss is due to dwindling groundwater supplies from the Ogallala aquifer. Aquifer level declines have ranged from fifty feet to one hundred feet since 1980, with saturated thickness reductions of 50 percent.” South- central Arizona has seen water table declines of 200 feet.In the southern section of the Central Valley of California (Kern, Kings, and Tulare counties), an overdraft of 800,000 acre- feet per year has resulted in declines of more than 200 feet in some areas.The Mississippi River Alluvial Aquifer in Arkansas has declined 100 feet in 90 years in the Grand Prairie region, and well yields have declined accordingly.
THE ENERGY PRODUCTION SQUEEZE
As we mentioned earlier, water also is essential to the production of energy, whether to cool drills as they search for oil and gas; to create steam to turn turbines that power generators and produce hydroelectric power; or to harness harmful carbon emissions in the air and inject them underground (carbon sequestration).
Adding to the stress that energy production imposes on water supplies, many options for alternative fuels are in geographic areas with limited and already stressed water resources. People tout oil shale, for example, as a great domestic option to meet future energy needs. Not only is exploiting oil shale a costly process that uses huge amounts of water to extract oil from rock, but the nation’s big oil shale reserves are in arid states like Colorado, Wyoming, and Utah that are facing drought conditions and have no water to spare.
••
•
WATER FACTS
Water is required to produce fuel. Sandia National Labora-tories, in Albuquerque, New Mexico, offers an estimate of how much water it takes to produce one gallon of various types of fuel:
CH001.indd 17CH001.indd 17 2/18/11 7:43:29 AM2/18/11 7:43:29 AM

18 AQUA SHOCK
THE POCKETBOOK PINCH
Too little or too much water is a no- win situation from a pocketbook perspective. When Hurricane Ike threatened offshore oil- drilling platforms and onshore refi neries in the Gulf of Mexico in 2008, oil prices shot upward. At the other end of the spectrum, drought the same year cost California farmers tens of millions of dollars in crop losses. (The April 2010 disastrous BP Deepwater Horizon drill-ing rig explosion was catastrophic environmentally to the Gulf of Mexico. But ironically, a report from the Obama administration points to no effect on oil prices long term.)19
The fi nancial cost of water shortages is tough to measure. But, according to a 2003 GAO report,20 the U.S. Department of Commerce’s National Oceanic and Atmospheric Administration identifi ed eight specifi c water shortages resulting from drought or heat waves over the past 20 years, each costing $1 billion or more. The largest shortage, costing $40 billion, hit the central and eastern United States in summer 1988.
The Federal Emergency Management Agency goes a step fur-ther and attributes an estimated $6 billion to $8 billion in losses annually to drought in the United States.21 That’s a lot of cash, no matter where you live (or how wealthy you are).
WASHED AWAY
Even cities and states that you would assume have no water issues grapple with major water troubles. In September 2010, ongoing drought mixed with declining surface and groundwater supplies
Conventional oil and gas: 1.5 gallons of water to extract and refi ne fuelGrain ethanol (biofuel): 4 gallons of water for processingCorn (ethanol): 980 gallons of water to irrigate cornOil shale: 2–3 gallons of water to extract and refi ne productHydrogen (synthetic fuel): 3–7 gallons of water for processingCoal to liquid synthetic fuel: 4.5–9 gallons of water for processing*
* Ron Pate, Mike Hightower, Chris Cameron, and Wayne Einfeld, “Overview of Energy- Water Interdependencies and the Emerging Energy Demands on Water Resources,” SAND2007-1349C (Albuquerque, NM: Sandia National Laboratories, March 2007).
••••••
CH001.indd 18CH001.indd 18 2/18/11 7:43:31 AM2/18/11 7:43:31 AM
L IQUID GOLD 19
led Pennsylvania to declare a drought warning in 24 of its counties, and a drought watch for another 43 counties.
The western Great Lakes, says Sandia’s Hightower, including Minnesota and Illinois, and Ohio along Lake Erie have their own water issues. They face population growth and development, limited aqui-fer supplies, drainage patterns that preclude pulling water from the nearby Great Lakes (because what you take out generally has to be put back into the same drainage basin), and laws relating to water rights. In December 2008, the Ontario (Canada) Ministry of the Environment accused the city of Detroit of stealing water from the Windsor, Ontario, side of the border, a practice it claims has been going on since 1964.
Areas of the Great Lakes Basin—the lakes and the area surrounding them—including parts of Illinois, Indiana, Michigan, Minnesota, New York, Ohio, Pennsylvania, and Wisconsin, and the Canadian provinces of Ontario and Quebec—are facing water con-fl icts, agrees USGS’s Evenson: “As you move farther away from the lake shores, where people are using aquifers/groundwater, you can fi nd areas of confl icts, where either there is not a lot of [water] or moving water out of the basin raises concerns.”
Across the country, antiquated infrastructure contributes to more water supplies washing away. That infrastructure includes crumbling water- delivery systems—think water main breaks—and outdated storm sewers and drainage systems that leach huge amounts of freshwater out of aquifers and carry it away as “waste” water.
Leaking pipes lose an estimated 7 billion gallons of clean drink-ing water every day, according to the “2009 Report Card for America’s Infrastructure,” from the American Society of Civil Engineers.22
Suburban sprawl, which creates impervious surfaces like pavement, parking lots, buildings, and roofs, adds to the runoff. Data from a 2002 study by the nonprofi ts American Rivers, Natural Resources Defense Council, and Smart Growth America,23 paint a grim picture of billions of gallons of freshwater that used to soak into the ground and now runs off and away from major metropoli-tan areas in the United States. This lost infi ltration ranges from a low of between 6.2 billion and 14.4 billion gallons a year in Dallas, to a high of between 56.9 billion and 132.8 billion gallons annually in Atlanta. The Atlanta runoff in 1997 alone was enough water to sup-ply the average daily household needs of 1.5 million to 3.6 million people for a year! You can read more about this study in Chapter 3.
CH001.indd 19CH001.indd 19 2/18/11 7:43:32 AM2/18/11 7:43:32 AM

20 AQUA SHOCK
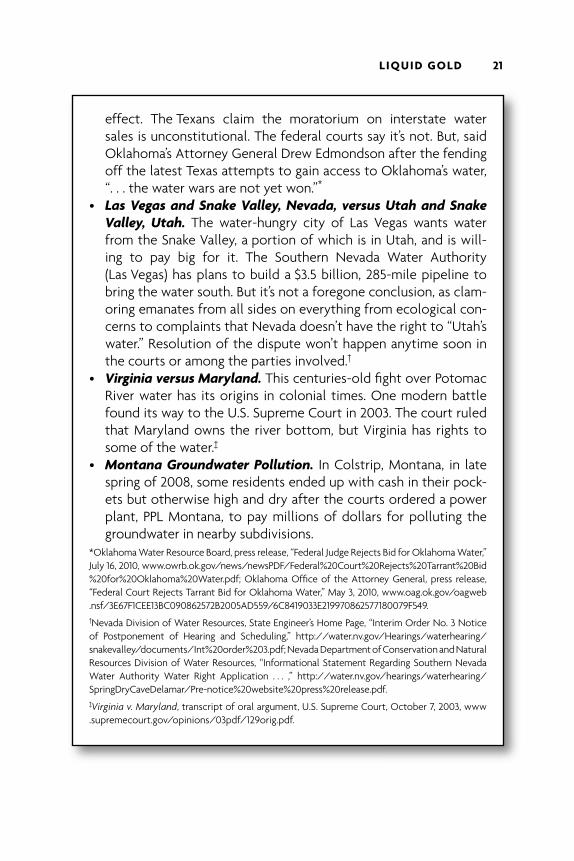
WATER WARS AND MORE
With all these concerns and problems, it’s easy to understand how water wars can brew across North America, as well as around the globe. Such confl icts aren’t new, but they become increasingly more contentious and tougher to swallow as demand intensifi es and sup-plies grow scarcer in a country where the resource has been taken for granted for centuries.
WATER TALES
Is there a battle over water in your neighborhood, town, state, or region? You might be surprised at how pervasive disputes over this “liquid gold” really are. Here’s an abbre-viated version of just a few of the battles, large and small.
The Colorado River Basin. Bickering has been the norm for decades over the water fl owing (or not fl owing) in this river, which is essential to the southwestern United States and north-ern Mexico. Among the states in the fray have been Arizona, California, Colorado, Nevada, New Mexico, Utah, and Wyoming. One of the most contentious fi ghts occurred in the early part of the twentieth century over the proposed construction of the Boulder Dam, which is now called the Hoover Dam. The dispute pitted states against each other, private business interests against government ownership interests, the federal government against states’ rights, and more. The dam was built, but the groups, includ-ing Mexico, still battle. Everyone wants a piece of the Colorado River’s bounty, which isn’t bountiful enough to go around.*
North Central Texas versus Oklahoma and vice versa. The Tarrant County (Texas) Regional Water District and other Dallas- area water suppliers want water from Oklahoma and have gone to court over it. Oklahoma doesn’t want to relin-quish water across state lines and has passed legislation to that
•
•
*U.S. Department of the Interior, Bureau of Reclamation, Colorado River Compact 1922 (November 24, 1922), www.usbr.gov/lc/region/g1000/pdfi les/crcompct.pdf.
CH001.indd 20CH001.indd 20 2/18/11 7:43:32 AM2/18/11 7:43:32 AM
L IQUID GOLD 21
effect. The Texans claim the moratorium on interstate water sales is unconstitutional. The federal courts say it’s not. But, said Oklahoma’s Attorney General Drew Edmondson after the fending off the latest Texas attempts to gain access to Oklahoma’s water, “. . . the water wars are not yet won.”*
Las Vegas and Snake Valley, Nevada, versus Utah and Snake Valley, Utah. The water- hungry city of Las Vegas wants water from the Snake Valley, a portion of which is in Utah, and is will-ing to pay big for it. The Southern Nevada Water Authority (Las Vegas) has plans to build a $3.5 billion, 285-mile pipeline to bring the water south. But it’s not a foregone conclusion, as clam-oring emanates from all sides on everything from ecological con-cerns to complaints that Nevada doesn’t have the right to “Utah’s water.” Resolution of the dispute won’t happen anytime soon in the courts or among the parties involved.†
Virginia versus Maryland. This centuries- old fi ght over Potomac River water has its origins in colonial times. One modern battle found its way to the U.S. Supreme Court in 2003. The court ruled that Maryland owns the river bottom, but Virginia has rights to some of the water.‡
Montana Groundwater Pollution. In Colstrip, Montana, in late spring of 2008, some residents ended up with cash in their pock-ets but otherwise high and dry after the courts ordered a power plant, PPL Montana, to pay millions of dollars for polluting the groundwater in nearby subdivisions.
*Oklahoma Water Resource Board, press release, “Federal Judge Rejects Bid for Oklahoma Water,” July 16, 2010, www.owrb.ok.gov/news/newsPDF/Federal%20Court%20Rejects%20Tarrant%20Bid%20for%20Oklahoma%20Water.pdf; Oklahoma Offi ce of the Attorney General, press release, “Federal Court Rejects Tarrant Bid for Oklahoma Water,” May 3, 2010, www.oag.ok.gov/oagweb .nsf/3E67F1CEE13BC090862572B2005AD559/6C8419033E219970862577180079F549.†Nevada Division of Water Resources, State Engineer’s Home Page, “Interim Order No. 3 Notice of Postponement of Hearing and Scheduling,” http://water.nv.gov/Hearings/waterhearing/snakevalley/documents/Int%20order%203.pdf; Nevada Department of Conservation and Natural Resources Division of Water Resources, “Informational Statement Regarding Southern Nevada Water Authority Water Right Application . . . ,” http://water.nv.gov/hearings/ waterhearing/SpringDryCaveDelamar/Pre-notice%20website%20press%20release.pdf.‡Virginia v. Maryland, transcript of oral argument, U.S. Supreme Court, October 7, 2003, www .supremecourt.gov/opinions/03pdf/129orig.pdf.
•
•
•
CH001.indd 21CH001.indd 21 2/18/11 7:43:35 AM2/18/11 7:43:35 AM

22 AQUA SHOCK
THE NEW WAY OF LIFE
As hundreds of water battles rage on across the country, the reality of our water supply’s future becomes clearer. The current and growing shortage isn’t just an isolated case. Experts agree that even without factoring in drought or climate change, water short-ages and disputes over this fi nite resource aren’t likely to go away anytime soon. That’s especially true in the West, where increasing populations exert pressure on already short water supplies. “There are so many demands on the limited resource that unless there is something like a widespread ocean water desaliniation effort, there simply is not going to be enough to go around,” says USDA’s Rippey.
More water restrictions have become a way of life across the country. Those restrictions take many forms, can be voluntary or mandatory, and can be as minimal as suggested use of low- water plumbing and cutbacks on outside yard watering or as stringent as laws that stipulate the type of plumbing required, forbid out-door watering, limit indoor use, and impose fi nancial penalties for violations and exceeding certain water use limitations.
The root of the water crisis historically is not so much population growth but change in the way we use water, change in per- capita water demand, says Joseph Dellapenna, internation-ally known water law expert and professor at Villanova University School of Law in Philadelphia. “Many people think, ‘I don’t take more showers than I used to; what do you mean by change in demand?’ Everything we consume consumes water, and as our affl u-ence has grown, we have all consumed a great deal more water.
“While the population of the United States doubled between 1950 and 1980, per capita water consumption increased sixfold during that same period. It has leveled off but at a much higher level,” says Dellapenna. “Factor in continued population growth—at this very high level of water consumption—with global climate change or, as I like to call it, ‘global climate disruption,’ which wreaks havoc on our expected patterns of precipitation. Even with the most modest concep-tion of global climate change, there are very good reasons to under-stand that dry areas like the southwestern United States are going to become larger and drier. And formerly humid areas are becoming drier. This is most obvious in the southeastern United States,” he adds.
CH001.indd 22CH001.indd 22 2/18/11 7:43:36 AM2/18/11 7:43:36 AM

L IQUID GOLD 23
As a longtime resident of the Northeast, Dellapenna says this means that declared water emergencies are much more common today than 25 years ago in his part of the country, including New England and the mid- Atlantic states of Pennsylvania, New Jersey, New York, and Delaware. “In the Northeast we’ve generally been able to deal with relatively modest water restrictions like no water-ing of lawns or gardens, or no washing of cars outside of car washes that recycle their water. We haven’t had the kind of crisis they’ve had in the Southeast, where there have been actual requirements of serious reductions in water usage. But we (in the Northeast) have had these problems on a recurring and frequent basis,” Dellapenna adds.
TALLYING INDIVIDUAL WATER USE
For a moment, forget the massive amounts of water required by the nation, region, or state, and consider what water scarcity can mean to each of us at home. The amount of water used by a city’s residents can be overwhelming.
The average person uses about 80 to 100 gallons of water every day at home—whether home is Portland, Oregon, or Portland, Maine—for fl ushing toilets, washing, bathing, and other household needs. That translates to each of us requiring about 36,000 gallons of water a year, according to estimates from the U.S. Geological Survey.24 (Those usage numbers vary, though, depending on how they’re determined, location, climate, and so on.) Atlanta, for example, with its population of 429,500 (not including its suburbs), would require nearly 15.5 billion gallons of water a year for home use, based on the 36,000-gallons- per- person fi gure. Let’s look at more Atlanta numbers.
The city’s geographic area covers the equivalent of 87,000 acres.The USGS estimates that a one- inch rainstorm deposits 27,152 gallons of water on one acre, or 2.36 billion gallons of water on Atlanta.It would take more than six one- inch deluges to provide enough water to satisfy Atlantans’ annual water needs just at home.
•
•
•
CH001.indd 23CH001.indd 23 2/18/11 7:43:36 AM2/18/11 7:43:36 AM

24 AQUA SHOCK
However, comparing per- capita water- usage numbers city to city, state to state, or coast to coast isn’t always an accurate indica-tor of water use, experts agree. “It’s sometimes erroneous, or at least much more complicated than the fi gures might indicate,” says Ken Kramer of Austin, Texas, director of the 23,000-member Texas chapter of the Sierra Club.
“Generally, when people talk about per- capita water consump-tion, they mean the amount of water that goes through a particular water system, dividing it by the population of an area and com-ing up with a per- capita fi gure,” says Kramer. “But different areas vary in terms of their water customers. For example, you may have one huge industry that sucks up a lot of water and actually buys it from a utility system. That can skew per- capita water consumption to a much higher fi gure than in, say, a bedroom community that doesn’t use as much water.
“The best use of per- capita consumption is to note the differ-ences in water use over time in one particular utility,” adds Kramer. “How much a utility has reduced that fi gure over a particular period of time is a more reasonable comparison.”
Pat Mulroy agrees. She’s general manager of the Southern Nevada Water Authority, which serves a thirsty Las Vegas. “You can’t compare city to city,” says Mulroy. “It’s all driven by climate and what you use your water for, and how the various entities calculate their per- capita consumption. The only usefulness of a per- capita number is benchmarking against yourself. Everything else gets you into a fruit cocktail argument that no one can penetrate. . . . It’s a PR tool that’s pulled out of the hip pocket every time someone wants to fl og someone.”
WATER FACTS
The amount of water that falls from the sky in an ordinary rainstorm might surprise you. Learn more about it with the U.S. Geological Survey’s interactive calculator, found at http://ga.water.usgs.gov/edu/sc2.html.
CH001.indd 24CH001.indd 24 2/18/11 7:43:37 AM2/18/11 7:43:37 AM

L IQUID GOLD 25
Water Use Levels Out
The good news is that growth in U.S. water usage from the 1980s to today has remained relatively fl at or slowed despite population growth. But, says USGS’s Evenson, as the population continues to grow, water use will increase, too. Unfortunately, growth doesn’t necessarily happen in places where water is abundant. “As our pop-ulation grows, we tend to push into more and more areas where our water supplies are more and more marginal,” Evenson says.
The number of gallons of water used per person per day actu-ally declined between 1980 and 2000, according to Susan Hutson, lead author of the U.S. Geological Survey’s report entitled “Water Use in the United States, 1950–2000” and contributing author to the 2005 report.25 (See Figure 1.3.) That’s in part due to the Clean Water Act, says Hutson. That statute limited water discharge for industries and thermoelectric power plants. Because of those lim-its, industries aggressively developed technology to recycle and reuse water, thus minimizing their water withdrawals. In 1950, it took an average 63 gallons of water to produce one kilowatt- hour of energy. In 2005, it took just about a third of that. Also contribut-ing to the decline in water- use numbers is the loss of some of the nation’s industrial base, which used to withdraw water directly from rivers and lakes, or drill private wells. New industries today often go to the public water supply instead, adds Hutson. Improvements in land irrigation technology mean less water is needed, and they make a difference in consumption numbers, too, she adds.
More highlights from that report:26
Despite growing demands, the total amount of water with-drawn per day for all uses in the United States (410 billion gallons) is down from the peak withdrawal year of 1980.Fresh surface water accounted for 78 percent of total with-drawals in 1950, and only 66 percent in 2005. Saline surface water (mainly for thermo- electric power generation) makes up the rest.California, Texas, Idaho, and Florida accounted for more than one- fourth of all water withdrawals in 2005.California had the largest surface- water withdrawals in 2005, with irrigation as the primary use.
•
•
•
•
CH001.indd 25CH001.indd 25 2/18/11 7:43:39 AM2/18/11 7:43:39 AM

26 AQUA SHOCK
Illinois, Texas, and Michigan counted on large quantities of surface- water withdrawals for thermoelectric power generation.Irrigation was the largest use of fresh groundwater in 25 states; California, Nebraska, Arkansas, and Texas were the biggest users.The bottom line: If it hasn’t done so already, the battle for water will soon hit home for all of us.
•
•
•
GroundwaterSurface waterTotalPopulation
POPU
LATI
ON
, IN
MIL
LIO
NS
0
50
100
150
200
250
300
350
400
1950 1955 1960 1965 1970 1975 1980 1985 1990 1995 2000 20050
50
100
150
200
250
350
300
WIT
HD
RAW
ALS
, IN
BIL
LIO
N G
ALL
ON
S PE
R D
AY
FIGURE 1 .3 Trends in Population and Freshwater Withdrawals by Source, 1950–2005Source: U.S. Geological Survey, “Estimated Use of Water in the United States in 2005,” http://pubs.usgs.gov/circ/1344/pdf/c1344.pdf.
WATER REALITIES
The Earth is 70 percent water, but less than 1 percent is readily available fresh water humans need to survive.The United States withdraws 410 billion gallons of water a year.The average person uses about 80 to 100 gallons of water every day just at home. But those numbers can vary
dramatically depending on how they’re tallied, geographic loca-tion, and more.
•
•
•
CH001.indd 26CH001.indd 26 2/18/11 7:43:39 AM2/18/11 7:43:39 AM

L IQUID GOLD 27
NOTES
1. U.S. Census Bureau, “U.S. and World Population Clocks—POPClocks,” http://www.census.gov/main/www/popclock.html.
2. U.S. Geological Survey, “The Water Cycle: Water Science Basics,” http://ga.water.usgs.gov/edu/watercyclesummary.html#global.
3. J. F. Kenny, N. L. Barber, S. S. Hutson, K. S. Linsey, J. K. Lovelace, and M. A. Maupin, “Estimated Use of Water in the United States in 2005: U.S. Geological Survey Circular 1344” (2009), http://pubs.usgs.gov/circ/1344/pdf/c1344.pdf.
4. Ibid. 5. Michael F. Craun, Gunther F. Craun, Rebecca L. Cauldron, and Michael J.
Beach, “Waterborne Outbreaks Reported in the United States,” Journal of Water and Health 4. Suppl. 06 (2006): 22–24, http://epa.gov/nheerl/articles/ 2006/waterborne_disease/waterborne_outbreaks.pdf.
6. U.S. General Accounting Office, “Freshwater Supply: States’ Views of How Federal Agencies Could Help Them Meet the Challenges of Expected Shortages,” Report to Congressional Requesters, GAO-03-514 ( July 2003): 8, http://gao.gov/new.items/d03514.pdf.
7. National Oceanic and Atmospheric Administration, National Climatic Data Center, “State of the Climate National Overview August 2010, ” http://lwf .ncdc.noaa.gov/sotc/?report=national.
8. Ibid. 9. National Oceanic and Atmospheric Administration, Great Lakes Environmental
Research Laboratory, “Great Lakes Water Level Observations,” http://www.glerl .noaa.gov/data/now/wlevels/levels.html.
Adding to the stress on water supplies from energy production, many sources of alternative fuels are in geographic areas with limited and already stressed water resources.Water shortages and concerns have become a way of life from the Atlantic to the Pacifi c and from the Canadian border to the Mexican one, with various factions fi ghting over this shrinking twenty-fi rst-century resource.Billions of gallons of wasted water wash away every year because of antiquated infrastructure.Water shortages hit the pocketbook hard. The National Oceanic and Atmospheric Administration identifi ed eight specifi c water shortages resulting from drought or heat waves over the past 20 years, each costing $1 billion or more.
•
•
•
•
CH001.indd 27CH001.indd 27 2/18/11 7:43:41 AM2/18/11 7:43:41 AM
28 AQUA SHOCK
10. U.S. Army Corps of Engineers Detroit District, “Monthly Bulletin of Lake Levels for the Great Lakes, September 2010,” http://www.lre.usace.army.mil/_kd/Items/actions.cfm?action=Show&item_id=3887&destination=ShowItem.
11. “Climate of 2009: February in Historical Perspective,” http://www.ncdc.noaa .gov/oa/climate/research/2009/feb/feb09.html.
12. News from the New Hampshire Department of Environmental Services, “MTBE Widespread in New Hampshire’s Groundwater” ( January 2, 2008), http://des.nh.gov/media/pr/documents/080102_mbte.pdf.
13. Kentucky.gov, press release, “Gov. Beshear Requests UDA Disaster Assistance,” http://governor.ky.gov/pressrelease.htm?PostingGUID=7B6313482D-E371-47C7 -A131-6244A57C72F2%7D.
14. TN.gov Newsroom, press releases, “Governor Bredesen Announces SBA Loan Program Available to Upper Cumberland Residents,” http://news . tennesseeanytime.org/node/5913; “Bredesen Requests Presidential Disaster Declaration for 10 Counties,” http://news.tennesseeanytime.org/node/5908; and “Bredesen Requests Federal Farm Assistance for Knox, Sumner Counties,” http://news. tennesseeanytime.org/node/5893; “Bredesen Announces Federal Farm Assistance Granted for Giles and Macon Counties,” http://news . tennesseeanytime.org/node/993.
15. NOAA Satellite and Information Service National Climatic Data Center/U.S. Department of Commerce, “U.S. National Overview: May 2009, National Climatic Data Center, Asheville, North Carolina (Updated 08 June 2009),” http://www.ncdc.noaa.gov/oa/climate/research/2009/may/national.html.
16. Governor of State of California, press release, “Gov. Schwarzenegger Joins Water March to Highlight Urgent Need to Improve California’s Water Supply,” April 17, 2009.
17. FAO Newsroom, press release, “Coping with water scarcity: Q&A with FAO Director- General Dr. Jacques Diouf,” http://www.fao.org/newsroom/en/focus/2007/1000521/index.html; “FAO urges action to cope with increasing water scarcity,” March 22, 2007, http://www.fao.org/newsroom/en/news/2007/1000520/index.html.
18. U.S. Department of Agriculture, “Long Range Planning for Drought Management—The Groundwater Component,” http://wmc.ar.nrcs.usda.gov/technical/GW/Drought.html.
19. Rebecca M. Blank, Under Secretary for Economic Affairs, U.S. Department of Commerce, “Understanding the Impact of the Drilling Moratorium on the Gulf Coast Economy,” testimony to U.S. Senate Committee on Small Business and Entrepreneurship, September 16, 2010, http://sbc.senate.gov/public/?a=Files.Serve&File_id=31647442-c186-48c8-b199-eea8fde7a0e1.
20. U.S. General Accounting Office, “Freshwater Supply: States’ Views of How Federal Agencies Could Help Them Meet the Challenges of Expected Shortages,” Report to Congressional Requesters, GAO-03-514 ( July 2003), http://gao.gov/new.items/d03514.pdf.
21. Lifeng Luo, Justin Sheffield, and Eric F. Wood, “Towards a Global Drought Monitoring and Forecasting Capability,” National Oceanic and Atmospheric
CH001.indd 28CH001.indd 28 2/18/11 7:43:42 AM2/18/11 7:43:42 AM
L IQUID GOLD 29
Administration’s National Weather Service, 33rd NOAA Annual Climate Diagnostics and Prediction Workshop, Lincoln, Nebraska, October 20–24, 2008, http://www.nws.noaa.gov/ost/climate/STIP/33CDPW/Luo_33cdpw.htm.
22. American Society of Civil Engineers, press release, “2009 Report Card for America’s Infrastructure,” January 28, 2009, http://apps.asce.org/ reportcard/2009/RC_2009_noembargo.pdf.
23. Betsy Otto, Katherine Ransel, and Jason Todd (American Rivers); Deron Lovaas and Hannah Stutzman (NRDC); John Bailey (Smart Growth America), “Paving Our Way to Water Shortages: How Sprawl Aggravates the Effects of Drought,” American Rivers, Natural Resources Defense Council, and Smart Growth America (2002): 1–2, http://www.nrdc.org/ media/docs/020828.pdf.
24. U.S. Geological Survey, Water Science for Schools, “Water Q&A: Water use at home,” http://ga.water.usgs.gov/edu/qahome.html.
25. Joan F. Kenny, Nancy L. Barber, Susan S. Hutson, Kristin S. Linsey, John K. Lovelace, and Molly A. Maupin “Estimated Use of Water in the United States in 2005,” U.S. Geological Survey Circular 1344 (2009), http://pubs.usgs.gov/circ/1344/pdf/c1344.pdf.
26. Ibid.
CH001.indd 29CH001.indd 29 2/18/11 7:43:42 AM2/18/11 7:43:42 AM

CH001.indd 30CH001.indd 30 2/18/11 7:43:42 AM2/18/11 7:43:42 AM