liquid column deformation and particle size distribution in gas
TRANSCRIPT

Materials Sciences and Applications, 2011, 2, 87-96 doi:10.4236/msa.2011.22012 Published Online February 2011 (http://www.SciRP.org/journal/msa)
Copyright © 2011 SciRes. MSA
87
Liquid Column Deformation and Particle Size Distribution in Gas Atomization
Georgios S. E. Antipas
Department of Mining Engineering and Metallurgy National Technical University of Athens Zografou Campus, Athens, Greece. Email: [email protected] Received December 22nd, 2010; revised January 5th, 2011; accepted February 12th, 2011.
ABSTRACT
A water-gas flow injected by a close coupled atomizer was studied via High Speed Photography and Phase Doppler Anemometry. The formation of a wave disturbance on the surface of the water column was confirmed. The flow con-verged within an area approximately 3 mm in diameter, independent of atomization conditions. The particle size distri-bution across the spray suggested a trend of decreasing particle sizes and particle velocities with increasing distance from the spray axis of symmetry. Keywords: Liquid Column Deformation, Two Phase Flow, Atomization, High Speed Photography, Laser Doppler
Anemometry
1. Introduction
During close coupled atomization, a liquid column or sheet is perturbed by a high velocity gas flow and is bro-ken up into droplets, in a two stage process. In the first stage, that of primary atomization [1], the surface of the melt is disturbed by a sinusoidal oscillation [2] and is subsequently broken up into large drops or unstable bod-ies, the ligaments [3]. During the subsequent stage of secondary atomization, the drops/ligaments may further disintegrate in flight, either via a low-turbulence mecha-nism [4] or in a more chaotic high-turbulence stripping fashion [5]. The principle of gas atomization is shown in Figure 1. In spray forming, atomization of a molten metal or alloy causes rapid solidification of the drops in flight. The spray’s subsequent impingement on a sub-strate produces a spray cast of varying microstructure. It is in fact the localized size distribution of particle diame-ters inside the spray, which dictates the spray cast micro-structure and mechanical properties. In turn, local size distributions depend on the break up mechanisms. The latter, have received considerable attention in earlier phenomenological studies [4-14] in respect to atomiza-tion parameters – such as nature of the gas and melt phase, gas injection pressures and melt superheat. More recently, experimental treatises of atomizing geometries have been presented [15-16]. Liquid break up phenomena, however – although described in the macro scale early on
(e.g. [17-20]) – have not been reflected on rigorous mod-eling implementations. Modern atomization modeling ap-
Figure 1. The principle of atomization.

Liquid Column Deformation and Particle Size Distribution in Gas Atomization 88
pears to be focusing on CPU-intensive stochastic simula-tion of the liquid jet and primary atomization in terms of Reynolds- averaged Navier-Stokes mixing (e.g. [21]). Recently, the more realistic cases of turbulent atomiza-tion conditions have been addressed – e.g. by CFD (see [22-24]) and integrated models [15] have been proposed.
The current study investigates the initial stage of tur-bulent mixing in a close coupled atomizer, which is as-sumed to take place within a finite convergence region; this region constitutes a crucial subtlety of a flexible mathematical model for the atomization of liquid metals already presented elsewhere [25]. The model - covering both primary and secondary atomization - is applicable to any liquid//gas system and is based on the formation of sinusoidal traveling waves along the surface of a liquid [26,27]. Estimation of the convergence region diameter is of great importance to modeling of the gas flow [28], as it determines the Mach number, static temperature and sonic velocities of the gas inducing break up of the liquid column.
2. Experimental Procedure
A cross section of the close coupled assembly used in this study is shown in Figure 2. The atomizer consisted of 20 gas jets arranged in a ring configuration. Each jet outlet diameter was 0.75 mm and its each inclination from the vertical direction was 20˚.
2.1. High Speed Photography
The behavior of a water column perturbed by Nitrogen and Helium gases was studied. The choice of water as the atomized medium was due to its low viscosity, which in turn was expected to lead to the formation of larger sur-face wave amplitudes for a given gas velocity, as out-lined in [25]. An Imacon 790 high speed camera fitted with a Nikon micro-Nikkor 55 mm lens was used; the camera was capable of speeds ranging between 104 and 107 frames per second. An intermediate tube of 21 mm between the lens and the aperture offered a fixed magni-fication of × 1.5. The diameter of the water column was either 2 or 3 mm. The experiments were conducted in ambient pressure (0.1 MPa) and temperature (17˚C). The high speed frames presented in this study are based on original photographs in which the contrast between the actual water column and the background has been en-hanced by means of response curve filtering. The ex-perimental assembly used in the high speed photography studies is shown in Figure 3.
2.2. Phase Doppler Anemometry (PDA)
The dynamic history of moving water particles during
atomization was studied by a Dantec Particle Dynamics Analyser. The system is based on the Phase Doppler principle for non-intrusive real time measurements of a wide range of particle sizes. An Ar-ion laser with a maximum output of 5 W was employed, capable of mea- suring particles in the range of 1-1000 μm over 1.2 m away from the source with an error of 4%. The maximum measurable velocity was 500 m/s with an error of 1%. The output included the mean and turbulent components of particle velocities in the downstream and radial direc- tion of the flow, the mass flux inside the measurement volume and a number of characteristic mean diameters such as the D32 (Sauter) particle size. The disintegration of a water column 3 mm in diameter atomized by Nitro-gen, Argon and Helium gases at a pressure of 100 psi (0.68 MPa) was studied. A fixed 70˚ angle was main-
Figure 2. Geometry of the close coupled atomizer.
Figure 3. High speed photography assembly.
Copyright © 2011 SciRes. MSA

Liquid Column Deformation and Particle Size Distribution in Gas Atomization
Copyright © 2011 SciRes. MSA
89
tained between the laser source and the detector. A fixed horizontal spacing of 600 mm was kept between the de-tector and the point of convergence of the individual la-ser beams. The Phase Doppler apparatus used in this study is shown in Figure 4.
5(a) and (b) give supporting evidence. In the case of wa-ter issuing from the delivery tube at a velocity of 7 m/s atomized by Nitrogen at 20 psi (0.14 MPa), the conical spray jet is formed at the tip of the tube – see Figure 5(a) – while at a higher water velocity of 13 m/s - e.g. Figure 5(b) – there is an unbroken core of water 6 mm in length before the formation of the spray cone. At sufficiently high melt velocities and at relatively low gas pressures the column exhibited a tendency for sinusoidal antisym-metric oscillations, as shown in Figure 5(c).
3. Results and Discussion
3.1 High Speed Photography
The flow was studied between the tip of the melt tube and approximately 12 mm below the melt tube.
Superimposed on the antisymmetric mode, oscillations of the symmetric type, as shown in Figure 5(d) gave rise to the formation of crests which normally led to the de-tachment of fragments from the disturbed column surface, shown in Figure 5(e). The symmetric instability ampli-tudes were an order of magnitude smaller than those of the antisymmetric type. An increase in the diameter of the water column caused a reduction in the wavelengths disturbing the surface of the water column. This in turn led to the disintegration of the column further down-stream from the point of initial atomization.
Atomization and complete disintegration of the water column was found to depend strongly on the velocities of the two phases. With reducing initial water velocity, break up of the column was more complete further up-stream. A low water velocity amounts to a high relative velocity between the melt and gas phase and a corre-spondingly high growth rate of the surface disturbance [25]. Higher growth rates also mean that the time re-quired for the instability to acquire sufficiently large am-plitudes is relatively large and as a result, the break up length of the jet is correspondingly decreased. Figures
Figure 4. Phase Doppler Anemometry apparatus.

Liquid Column Deformation and Particle Size Distribution in Gas Atomization 90
Figure 5. (a) Water (2 mm) at 7 m/s, N2 at 20 psi, 2.5 * 104 frames/s; (b) Water (2 mm) at 13 m/s, N2 at 20 psi, 2.5 * 104 frames/s; (c) Water (2 mm) at 13 m/s, N2 at 10 psi, 2.5 * 104 frames/s; (d) Water (2 mm) at 13 m/s, He at 50 psi, 105 frames/s; (e) Water (3 mm) at 7 m/s, N2 at 30 psi, 106 frames/s; (f) Water (3 mm) at 7 m/s, N2 at 30 psi, 105 frames/s.
Formation of a conical spray jet a certain distance be-low the point of convergence of the gas jets was always a predominant feature. This seemingly uniform spray jet initiated approximately 5 mm downstream from the tip of the water delivery tube for any set of experimental pa-rameters. The angle of the jet was constant and roughly equal to 20˚ as long as turbulent conditions for the gas phase were satisfied – see Figure 5(f). In general, no crest observed reached amplitude greater than the water column radius. The diameter of the convergence region, taken to be the point at which the spray jet appeared to have the smallest diameter, was also measured on every photograph and was found to be equal to a constant value of 3 mm. This diameter was found to be independent of the radius of the water column, the type of atomizing gas
and the injection pressure.
3.2. Phase Doppler Anemometry
In the water sprays examined by PDA, the radial distri-bution of drops 40 mm downstream from the tip of the melt tube was always found to be irregular. Figures 6(a), (b) and (c), for Nitrogen, Argon and Helium flows re-spectively, suggest that the coarser fragments of the spray lie in close proximity of the central axis, defined as the point of maximum flux and their diameter decreases with increasing distance from the central axis. The as-sumption of maximum particle flux along the centre axis
Figure 6. Radial distribution of particle size, velocity and volume flux for water atomized by: (a) N2 at 50 psi (0.34 MPa); (b) Ar at 50 psi; (c) He at 50 psi.
Copyright © 2011 SciRes. MSA

Liquid Column Deformation and Particle Size Distribution in Gas Atomization 91
of the spray has been experimentally confirmed by spray forming experiments of Al alloys [29]. In addition, it has been shown that particle sizes monotonically decrease with distance from the centre of the flow [25]. The pro-files in Figure 6 may appear asymmetric due to the mismatch between the vertical axis of motion of the PDA apparatus and the actual vertical axis of symmetry of the spray. It is unlikely that the two axes can be made to overlap, due to the highly turbulent nature of the flow which causes the spray’s axis of symmetry to fluctuate. The largest measured diameters produced by Nitrogen and Argon, Figures 6(a) and (b) respectively, were of the order of 700 μm, while Helium, as shown in Figure 6(c), produced finer particles. Numerical data underlying to Figure 6 are presented in, Table 1.
Variation of the D32 particle size and the mean down-stream particle velocity as a function of distance from the point of initial atomization are shown in Figures 7(a) and (b), for Nitrogen and Argon respectively. Compari-son of the two plots suggests that the spray in its infancy contained globules of diameter 550 μm in the case of Nitrogen and 600 μm in the case of Argon. The nature of the gas did not substantially influence the products of primary atomization at this pressure, since the initial drop
Figure 7. Variation of particle velocities along the center axis for water atomized by: (a) N2 at 100 psi (0.68 MPa); (b) Ar at 100 psi.
diameters for both flows were quite similar. It is possible that the primary particles formed during the disintegra-tion of the melt column were even larger in diameter. This is suggested by the fact that the PDA technique cannot accurately measure drop sizes upstream a 50 mm distance from the tip of the melt tube, as Figure 7(a) indicates. Break up of the water particles was complete within 150 mm downstream of the point of initial atomi-zation, resulting in a spray that consisted of particles 100 μm in diameter. In the case of Argon, completion of break up as a slight change in the D32 slope could be dis-tinguished at approximately 200 mm below the die. The overall reduction in diameters for the Nitrogen flow was 80% while in the case of Argon it was 65%. These fig-ures, however, are by no means indicative of the atomi-zation efficiency of the configuration, since they only serve as a comparison between the fragments of primary and secondary break up. In general, the velocity followed the inverse trend of the particle size, i.e. in the early at-omization stages fragments decreased in size whilst gaining in velocity. After completion of the break up
Figure 8. (a) Effect of the injection pressure of Ar on the radial variation of the D32 size; (b) Effect of type of atomiz-ing gas on the radial variation of the D32 size.
Copyright © 2011 SciRes. MSA

Liquid Column Deformation and Particle Size Distribution in Gas Atomization
Copyright © 2011 SciRes. MSA
92
Table 1. Particle size, velocity and volume flux for water atomized at 50 psi (0.34 MPa).
Nitrogen Argon Helium
Radial distance (mm)
Velocity (m/s)
D32 (μm) Flux
(cm3/s * cm2)Velocity
(m/s) D32 (μm)
Flux (cm3/s * cm2)
Velocity (m/s)
D32 (μm) Flux
(cm3/s * cm2)
−100 4.609 554.2 7.482 0.397 564.2 −1.143 3.053 579.1 5.395
−90 3.016 588.7 8.886 12.829 531.6 0.667 9.223 422.7 2.493
−80 5.946 537 4.972 7.782 569.2 1.222 7.276 98.79 0.017
−70 7.707 571.8 18.563 7.228 345.1 0.652 12.563 421.4 4.59
−60 8.308 431.3 0.737 5.949 345.7 0.374 11.297 656.1 6.518
−50 15.363 583 20.503 13.164 660.3 27.612 18.361 514.7 4.274
−40 19.927 298.2 2.406 18.035 574.4 15.101 13.978 555.9 −18.754
−30 18.534 493.8 22.55 17.596 592.8 23.36 20.3 611 11.38
−20 18.286 578.5 12.516 19.739 612.1 13.564 18.464 630.5 −15.865
−10 17.651 515.8 24.898 17.177 614.4 20.185 19.923 565.4 35.828
0 16.736 632 104.02 18.058 637.8 29.867 18.153 621.4 75.328
10 13.271 618.3 89.053 13.686 645 33.475 14.746 634.5 105.015
20 11.494 642.1 117.685 11.1 661.5 65.545 12.318 625.9 76.575
30 6.869 664.8 198.979 6.956 649.3 57.443 9.341 652.5 89.29
40 5.738 667.2 276.583 5.942 672.8 63.682 6.804 615.3 58.847
50 4.178 655.2 208.98 5.247 680.6 67.619 4.884 675.5 104.651
60 3.561 657 176.506 5.219 682.8 52.473 4.212 662.9 54.669
70 3.766 655 138.849 2.999 666.4 90.94 1.541 623.5 7.183
80 3.078 687.4 113.705 3.501 684 42.072 2.585 646 18.388
90 3.919 681.3 59.745 2.598 705.8 75.618 1.739 658.6 13.604
100 3.163 692.6 46.703 3.953 678.5 15.569
process (e.g. 200 mm in the case of water/Nitrogen, see Figure 7(a) the velocities remained constant within a limited distance and started decaying from that point downstream. Numerical data underlying to Figure 7 are presented in, Table 2.
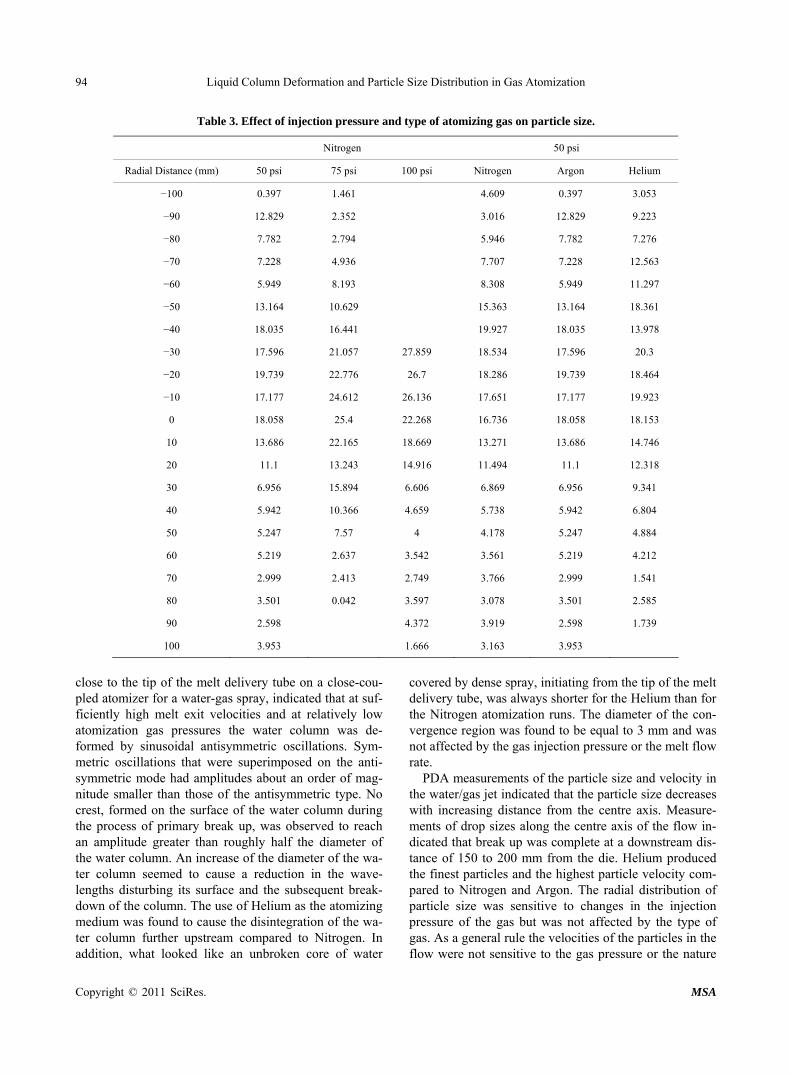
The effect of the atomizing pressure on the particle size distribution inside the flow, in the case of Argon, is shown in Figure 8(a). D32 decreased in all regions of the spray with increasing injection pressure of the gas phase. The primary fragments (in the centre of the spray) were not substantially affected by the change in injection pressure, while the fragments on the flow edge decreased in size. At 50 psi (0.34 MPa) the majority of the spray, lying in the outer 16o of the spray cone, was made up by particles in the region of 650 μm. The inner region of the cone, within an angle of 4o from the centre axis, con-tained particles approximately 50% smaller compared to
the rest of the spray. At 75 psi (0.52 MPa) there was a wide variety of sizes along the radial direction, ranging from primary fragments in the centre of the flow, to the finer by 80% particles on the spray edge, the latter being finer than the ones at the same point produced at a pres-sure of 50 psi (0.34 MPa). At an injection pressure of 100 psi (0.69 MPa) the diameter of the larger particles in the centre of the flow was reduced while the size of the finest particles was not affected. The mean particle size and the distribution of diameters in the spray were greatly de-pendent on the type of the atomizing gas. A comparison of the diameters produced by Nitrogen, Argon and He-lium, is shown in Figure 8(b), where the injection pres-sure of the gas was 50 psi (0.34 MPa). All types of gases produced similar primary fragments that covered most of the spray area. Nitrogen and Argon produced the largest particles whilst Helium yielded 25% finer particles along

Liquid Column Deformation and Particle Size Distribution in Gas Atomization 93
Table 2. Particle size and velocity for water atomized at 100 psi (0.68 MPa).
Nitrogen Argon
Downstream Distance (mm)
D32 (μm) Velocity
(m/s) D32 (μm)
Velocity (m/s)
0
10
20 593.588 28.697
30 604.923 30.053
40 621.754 27.211
50 632.666 27.093
60 544.833 21.675 526.565 23.551
70 531.433 18.286 486.413 25.384
80 373.715 26.177 468.743 25.546
90 436.078 25.095 575.132 27.055
100 313.379 26.176 596.728 26.912
110 223.32 25.545 561.224 29.751
120 213.557 29.024 501.027 29.857
130 248.314 29.399 455.383 30.491
140 208.515 29.026 450.582 29.678
150 117.699 29.411 472.545 30.128
160 108.976 29.299 429.566 28.851
170 140.312 29.563 398.381 30.137
180 193.437 29.922 319.572 28.601
374.255 27.774
210 95.953 29.158 361.140 28.376
220 120.225 28.747 285.585 27.313
230 128.376 29.242 256.276 29.007
240 107.711 29.749 263.700 27.991
250 104.118 27.507 261.941 27.704
260 113.444 29.225 322.845 27.855
270 97.457 28.187 253.981 28.875
280 84.317 29.467 200.456 27.089
290 96.488 29.468 207.036 28.986
300 119.16 28.846 234.194 27.088
310 96.471 29.329 262.674 26.515
320 79.099 27.939 221.533 25.216
330 94.125 26.964 241.347 26.66
340 89.702 25.862 252.457 25.087
350 89.6 28.215 253.982 26.716
360 118.154 26.308 258.658 26.684
370 116.628 25.67 273.361 24.693
380 94.316 26.784 306.736 25.681
390 85.658 26.584 224.107 24.143
400 87.688 25.123 22.105
the central axis of the spray, compared to Nitrogen and Argon. Numerical data underlying to Figure 7 are pre-sented in, Table 3.
The effect of the injection pressure on the distribution of particle velocities is shown in Figure 9(a), in the case of Argon. The mean components of the downstream ve-locities were normalized by the component measured on the theoretical centre axis of the spray for the flow gen-erated by Argon at 100 psi (0.69 MPa). The general trend suggests that the particle velocities increase with de-creasing distance from the real axis of symmetry of the spray and with increasing atomization pressure. Every 50 psi (0.34 MPa) increase in injection pressure seems to result in a 20% increase in the maximum velocity of the distribution. Figure 9(b) indicates that the type of atom-izing gas does not affect the particle velocities substan-tially. Numerical data underlying to Figure 9 are pre-sented in, Table 4.
4. Conclusions
High Speed Photography studies of the area of the spray
Figure 9. (a) Effect of the injection pressure of Ar on the radial variation of particle velocity; (b) Effect of type of atomizing gas on the radial vari tion of particle velocity. a
Copyright © 2011 SciRes. MSA
Liquid Column Deformation and Particle Size Distribution in Gas Atomization
Copyright © 2011 SciRes. MSA
94
Table 3. Effect of injection pressure and type of atomizing gas on particle size.
Nitrogen 50 psi
Radial Distance (mm) 50 psi 75 psi 100 psi Nitrogen Argon Helium
−100 0.397 1.461 4.609 0.397 3.053
−90 12.829 2.352 3.016 12.829 9.223
−80 7.782 2.794 5.946 7.782 7.276
−70 7.228 4.936 7.707 7.228 12.563
−60 5.949 8.193 8.308 5.949 11.297
−50 13.164 10.629 15.363 13.164 18.361
−40 18.035 16.441 19.927 18.035 13.978
−30 17.596 21.057 27.859 18.534 17.596 20.3
−20 19.739 22.776 26.7 18.286 19.739 18.464
−10 17.177 24.612 26.136 17.651 17.177 19.923
0 18.058 25.4 22.268 16.736 18.058 18.153
10 13.686 22.165 18.669 13.271 13.686 14.746
20 11.1 13.243 14.916 11.494 11.1 12.318
30 6.956 15.894 6.606 6.869 6.956 9.341
40 5.942 10.366 4.659 5.738 5.942 6.804
50 5.247 7.57 4 4.178 5.247 4.884
60 5.219 2.637 3.542 3.561 5.219 4.212
70 2.999 2.413 2.749 3.766 2.999 1.541
80 3.501 0.042 3.597 3.078 3.501 2.585
90 2.598 4.372 3.919 2.598 1.739
100 3.953 1.666 3.163 3.953
close to the tip of the melt delivery tube on a close-cou-pled atomizer for a water-gas spray, indicated that at suf- ficiently high melt exit velocities and at relatively low atomization gas pressures the water column was de-formed by sinusoidal antisymmetric oscillations. Sym-metric oscillations that were superimposed on the anti-symmetric mode had amplitudes about an order of mag-nitude smaller than those of the antisymmetric type. No crest, formed on the surface of the water column during the process of primary break up, was observed to reach an amplitude greater than roughly half the diameter of the water column. An increase of the diameter of the wa-ter column seemed to cause a reduction in the wave-lengths disturbing its surface and the subsequent break-down of the column. The use of Helium as the atomizing medium was found to cause the disintegration of the wa-ter column further upstream compared to Nitrogen. In addition, what looked like an unbroken core of water
covered by dense spray, initiating from the tip of the melt delivery tube, was always shorter for the Helium than for the Nitrogen atomization runs. The diameter of the con-vergence region was found to be equal to 3 mm and was not affected by the gas injection pressure or the melt flow rate.
PDA measurements of the particle size and velocity in the water/gas jet indicated that the particle size decreases with increasing distance from the centre axis. Measure-ments of drop sizes along the centre axis of the flow in-dicated that break up was complete at a downstream dis-tance of 150 to 200 mm from the die. Helium produced the finest particles and the highest particle velocity com-pared to Nitrogen and Argon. The radial distribution of particle size was sensitive to changes in the injection pressure of the gas but was not affected by the type of gas. As a general rule the velocities of the particles in the flow were not sensitive to the gas pressure or the nature

Liquid Column Deformation and Particle Size Distribution in Gas Atomization 95
Table 4. Effect of injection pressure and type of atomizing gas on particle velocity.
Nitrogen 50 psi
Radial Distance (mm) 50 psi 75 psi 100 psi Nitrogen Argon Helium
−100 564.164 269.102 554.217 564.164 579.054
−90 531.587 286.673 588.707 531.587 422.689
−80 569.249 285.843 666.897 537.049 569.249 98.789
−70 345.137 245.258 650 571.783 345.137 421.375
−60 345.739 295.274 640 431.27 345.739 656.091
−50 660.251 226.992 630 582.973 660.251 514.699
−40 574.352 151.418 620 298.166 574.352 555.862
−30 592.781 170.734 614.405 493.848 592.781 611.016
−20 612.055 93.579 560 578.485 612.055 630.541
−10 614.374 174.542 517.619 515.82 614.374 565.442
0 637.826 208.524 566.447 631,966 637.826 621.402
10 645.004 211.822 138.862 618.253 645.004 634.517
20 661.508 450.575 660.894 642.143 661.508 625.893
30 649.298 445.947 623.267 664.796 649.298 652.534
40 672.778 472.901 697.247 667.218 672.778 615.272
50 680.584 493.555 650 655.248 680.584 675.549
60 682.835 630.771 612.531 656.987 682.835 662.894
70 666.44 606.578 664.22 655.005 666.44 623.471
80 684.008 645.132 665.866 687.355 684.008 646.001
90 705.803 602.265 611.01 681.273 705.803 658.556
100 678.458 652.001 737.323 692.584 678.458
of the gas phase.
REFERENCES
[1] C. Dumouchel, J. Cousin and K. Triballier, “Experimen-tal Analysis of Liquid-Gas Interface at Low Weber Num-ber: Interface Length and Fractal Dimension,” Experi-ments in Fluids, Vol. 39, No. 4, 2005, pp. 651-666. doi:10.1007/s00348-005-1005-5
[2] L. Fei, S. Xu and S. Huang, “Relaxation and Breakup of a Cylindrical Liquid Column,” Science in China Series E: Technological Sciences, Vol. 51, No. 2, 2008, pp. 145-152. doi:10.1007/s11431-008-0018-8
[3] J. Shinjo and A. Umemura, “Simulation of Liquid Jet Primary Breakup: Dynamics of Ligament and Droplet Formation,” International Journal of Multiphase Flow, Vol. 36, No. 7, 2010, pp. 513-532. doi:10.1016/j.ijmultiphaseflow.2010.03.008
[4] C. L. Ng, R. Sankarakrishnana and K. A. Sallam, “Bag
Breakup of Nonturbulent Liquid Jets in Crossflow,” In-ternational Journal of Multiphase Flow, Vol. 34, No. 3, 2008, pp. 241-259.
[5] D. R. Guildenbecher, C. López-Rivera and P. E. Sojka, “Secondary Atomization,” Experiments in Fluids, Vol. 46, No. 3, 2009, pp. 371-402. doi:10.1007/s00348-008-0593-2
[6] M. Arai, M. Shimizu and H. Hiroyasu, “Break-up Length and Spray Formation Mechanism of a High Speed Liquid Jet,” Proceedings of the International Conference of Liq-uid Atomization and Spray Systems (ICLASS-88), London, 1988, pp. 177-184.
[7] H. Hiroyasu, M. Shimizu and M. Arai, “The Breakup of a High Speed Jet in a High Pressure Gaseous Atmosphere,” Proceedings of the International Conference of Liquid Atomization and Spray Systems (ICLASS-82), Madison, 1982, pp. 69-74.
[8] R. Ingebo, “Experimental and Theoretical Effects of Ni-trogen Gas Flow Rate on Liquid-Jet Atomization,” Jour-
Copyright © 2011 SciRes. MSA

Liquid Column Deformation and Particle Size Distribution in Gas Atomization 96
nal of Propulsion and Power, Vol. 4, No. 5, 1988, pp. 406-411. doi:10.2514/3.23081
[9] M. Kim and H. Jones, “Effect of Process Variables in Gas-Jet Atomization and Production of Multilayer De-posits,” Proceedings of the Fourth International Confer-ence on Rapidly Quenched Metals, Sendai, 1981, pp. 85-88.
[10] B. Pai and B. Nijaguna, “The Charecterization of Sprays,” International Conference on Liquid Atomization and Spray Systems, Madison, 1982, pp. 29-35.
[11] R. Reitz, “Modeling Atomization Processes in High-Pres-sure Vaporizing Sprays,” Atomization and Spray Technol-ogy, Vol. 3, No. 4, 1987, pp. 309-337.
[12] J. See and G. Johnston, “Interactions between Nitrogen Jets and Liquid Lead and Tin Streams,” Powder Tech-nology, Vol. 21, No. 1, 1978, pp. 119-133. doi:10.1016/0032-5910(78)80115-6
[13] A. Ünal, “Effect of Processing Variables on Particle Size in Gas Atomization of Rapidly Solidified Aluminium Powders,” Materials Science and Technology, Vol. 3, 1987, pp. 1029-1039.
[14] S. Zanelli, “Behaviour of a Liquid Jet near the Nozzle,” International Conference on Liquid Atomization and Spray Systems, 1988, pp. 1-14.
[15] C. Dumouchel, “On the Experimental Investigation on Primary Atomization of Liquid Streams,” Experiments in Fluids, Vol. 45, No. 3, 2008, pp. 371-422. doi:10.1007/s00348-008-0526-0
[16] B. Vukasinovic, M. K. Smith, and A. Glezer, “Mecha-nisms of Free-Surface Breakup in Vibration-Induced Liq-uid Atomization,” Physics of Fluids, Vol. 19, No. 1, 2007, pp. 012104-012104-15. doi:10.1063/1.2434799
[17] G. Gordon, “Mechanism and Speed of Breakup of Drops,” Journal of Applied Physics, Vol. 30, No. 11, 1959, pp. 1759-1761. doi:10.1063/1.1735050
[18] F. Haas, “Stability of Droplets Suddenly Exposed to a High Velocity Gas Stream,” AIChE Journal, Vol. 10, No. 6, 1964, pp. 920-924. doi:10.1002/aic.690100627
[19] J. Hinze, “Fundamentals of the Hydrodynamic Mecha-nism of Splitting in Dispersion Processes,” AIChE Jour-nal, Vol. 1, No. 3, 1955, pp. 289-295. doi:10.1002/aic.690010303
[20] S. Mehrota, “Mathematical Modeling of Gas Atomization Process for Metal Powder Production,” Powder Metal-lurgy International, Vol. 13, No. 2, 1998, pp. 80-84.
[21] M. Gorokhovski and M. Herrmann, “Modeling Primary Atomization,” Annual Review of Fluid Mechanics, Vol. 40, No. 1, 2008, pp. 343-366. doi:10.1146/annurev.fluid.40.111406.102200
[22] H. P. Trinh, C. P. Chen and M. S. Balasubramanyam, “Numerical Simulation of Liquid Jet Atomization In-cluding Turbulence Effects,” Journal of Engineering for Gas Turbines and Power, Vol. 129, No. 4, 2007, pp. 920-928.
[23] J. Ishimoto, K. Ohira, K. Okabayashi and K. Chitose, “Integrated Numerical Prediction of Atomization Process of Liquid Hydrogen Jet,” Cryogenics, Vol. 48, No. 5-6, 2008, pp. 238-247. doi:10.1016/j.cryogenics.2008.03.006
[24] K. Pougatcha, M. Salcudeana, E. Chanb and B. Knapper, “A Two-Fluid Model of Gas-Assisted Atomization In-cluding Flow through the Nozzle, Phase Inversion, and Spray Dispersion,” International Journal of Multiphase Flow, Vol. 35, No. 7, 2009, pp. 661-675. doi:10.1016/j.ijmultiphaseflow.2009.03.001
[25] G. S. E. Antipas, “Modeling of the Break up Mechanism in Gas Atomization of Liquid Metals, Part I. The Surface Wave Formation Model,” Computational Materials Sci-ence, Vol. 35, No. 4, 2006, pp. 416-422. doi:10.1016/j.commatsci.2005.03.009
[26] D. Bradley, “On the Atomization of Liquids by High- Velocity Gases,” Journal of Physics D: Applied Physics, Vol. 6, No. 14, 1973, pp. 1724-1736. doi:10.1088/0022-3727/6/14/309
[27] N. Dombrowski and W. Johns, “The Aerodynamic Insta-bility and Disintegration of Viscous Liquid Sheets,” Chemical Engineering Science, Vol. 18, No. 3, 1963, pp. 203-214. doi:10.1016/0009-2509(63)85005-8
[28] G. S. E. Antipas, “Modeling of the Break up Mechanism in Gas Atomization of Liquid Metals, Part II. The Gas Flow Model,” Computational Materials Science, Vol. 46, No. 4, 2009, pp. 955-959. doi:10.1016/j.commatsci.2009.04.046
[29] G. Antipas, C. Lekakou and P. Tsakiropoulos, “The Break up of Melt Streams by High Pressure Gases in Spray Forming,” Proceedings of the Second International Conference on Spray Forming, Swansea, 1993, pp. 15-24.
Copyright © 2011 SciRes. MSA