linux&performance&tools& - · pdf filelinux&performance&tools&...
TRANSCRIPT

Linux Performance Tools
Brendan Gregg Senior Performance Architect
[email protected] @brendangregg
August, 2014
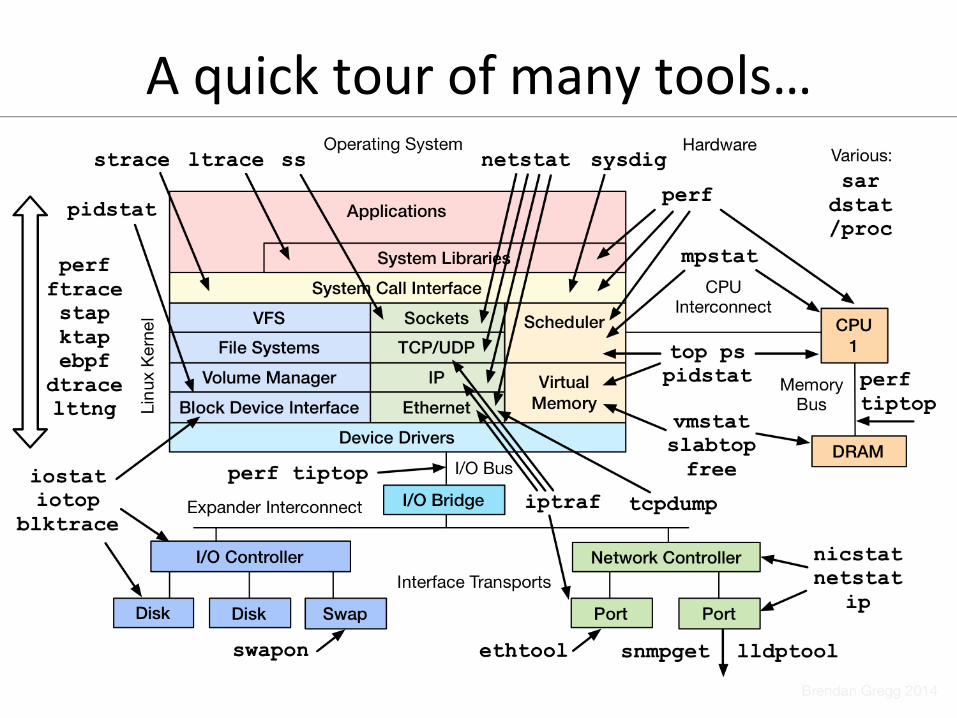
A quick tour of many tools…

• Massive AWS EC2 Linux cloud – Tens of thousands of instances – Autoscale by ~3k each day – CentOS and Ubuntu
• FreeBSD for content delivery – Approx 33% of US Internet traffic at night
• Performance is criVcal – Customer saVsfacVon: >50M subscribers – $$$ price/performance – Develop tools for cloud-‐wide analysis; use server tools as needed

Brendan Gregg
• Senior Performance Architect, Ne8lix – Linux and FreeBSD performance – Performance Engineering team (@coburnw)
• Recent work: – Linux perf-‐tools, using crace & perf_events – Systems Performance, PrenVce Hall, 2014
• Previous work includes: – USE Method, flame graphs, latency & uVlizaVon heat maps, DTraceToolkit, iosnoop and others on OS X, ZFS L2ARC
• Twiker @brendangregg (these slides)

Agenda
• Methodologies & Tools • Tool Types: – Observability – Benchmarking – Tuning
• Tracing

Methodologies & Tools

Methodologies & Tools
• There are dozens of performance tools for Linux – Packages: sysstat, procps, coreuVls, … – Commercial products
• Methodologies can provide guidance for choosing and using tools effecVvely

An0-‐Methodologies
• The lack of a deliberate methodology… • Street Light AnV-‐Method: – 1. Pick observability tools that are • Familiar • Found on the Internet or at random
– 2. Run tools – 3. Look for obvious issues
• Drunk Man AnV-‐Method: – Tune things at random unVl the problem goes away

Methodologies
• For example, the USE Method: – For every resource, check: • UVlizaVon • SaturaVon • Errors
• Other methods include: – Workload characterizaVon, drill-‐down analysis, event tracing, baseline stats, staVc performance tuning, …
• Start with the quesVons, then find the tools
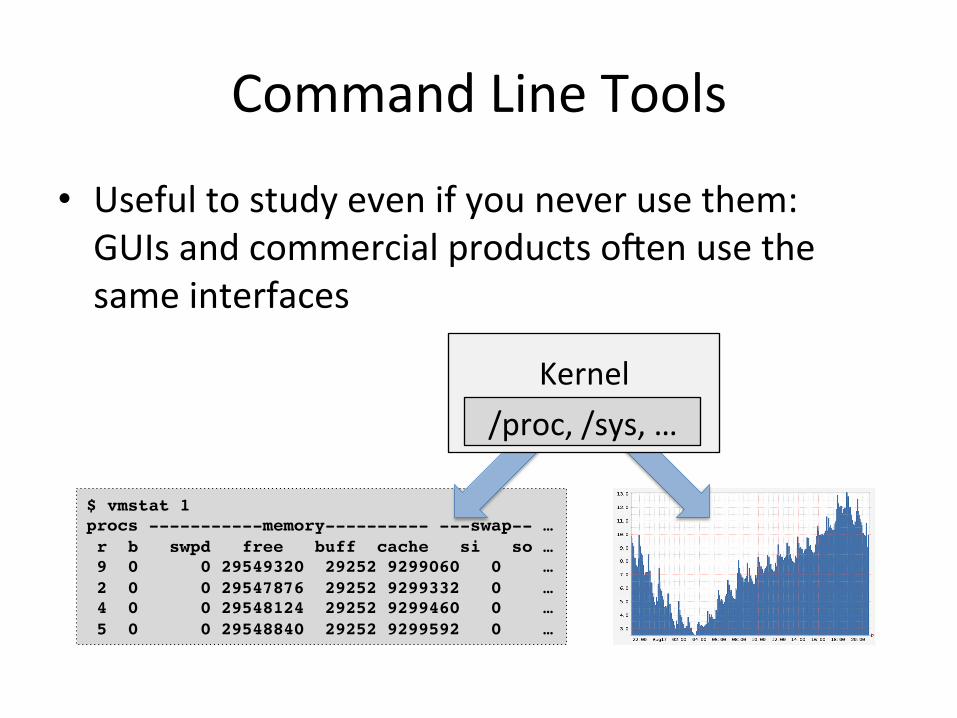
Command Line Tools
• Useful to study even if you never use them: GUIs and commercial products ocen use the same interfaces
$ vmstat 1!procs -----------memory---------- ---swap-- …! r b swpd free buff cache si so …! 9 0 0 29549320 29252 9299060 0 …! 2 0 0 29547876 29252 9299332 0 …! 4 0 0 29548124 29252 9299460 0 …! 5 0 0 29548840 29252 9299592 0 …!
Kernel /proc, /sys, …
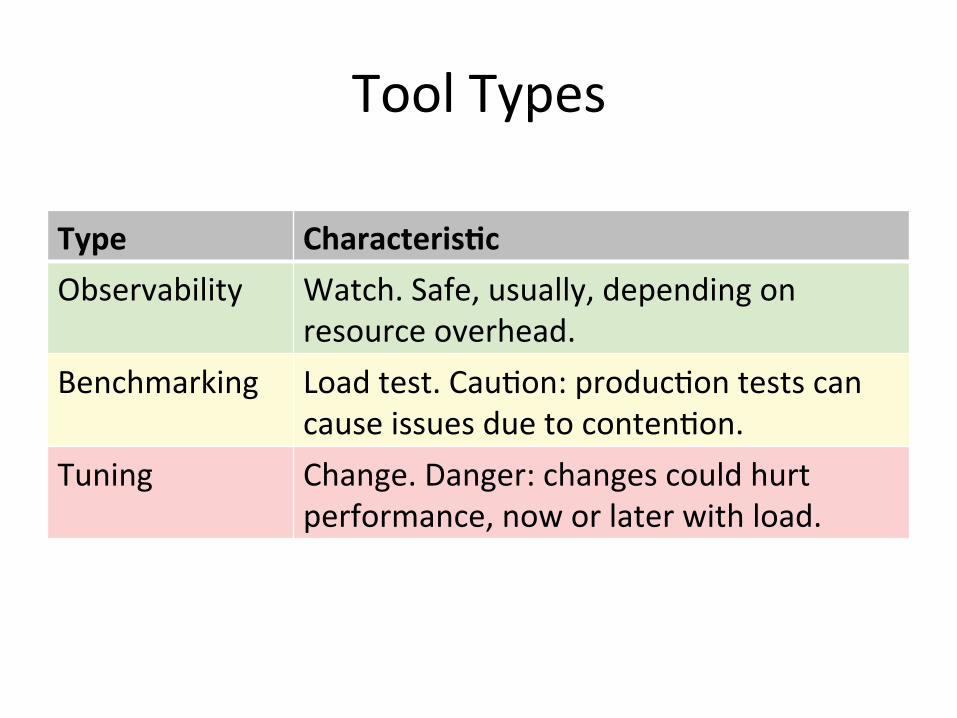
Tool Types
Type Characteris.c Observability Watch. Safe, usually, depending on
resource overhead. Benchmarking Load test. CauVon: producVon tests can
cause issues due to contenVon. Tuning Change. Danger: changes could hurt
performance, now or later with load.

Observability Tools
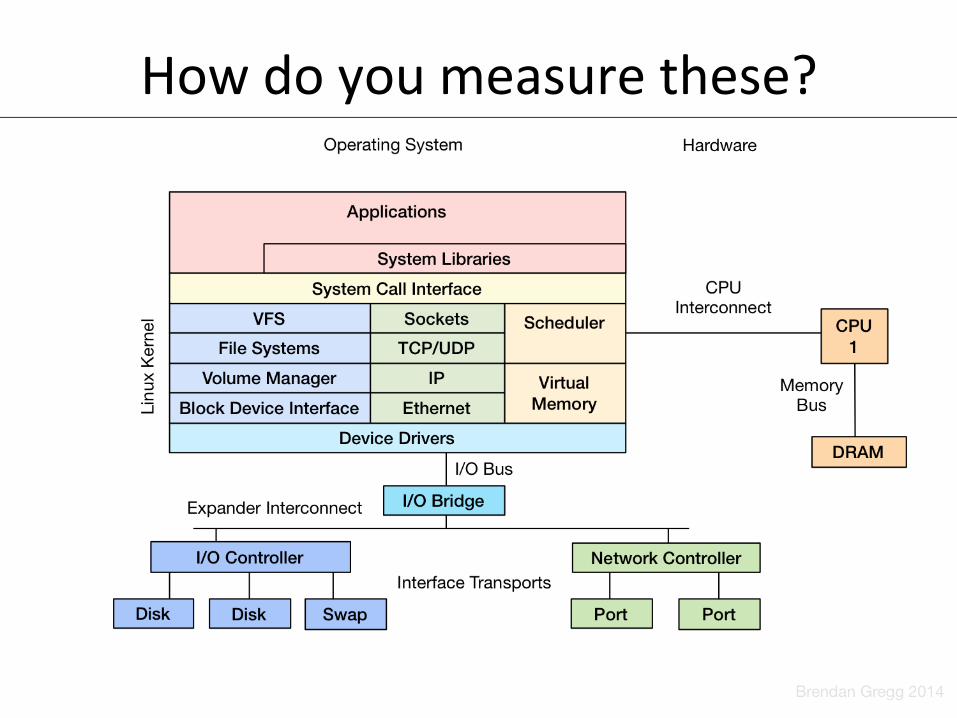
How do you measure these?
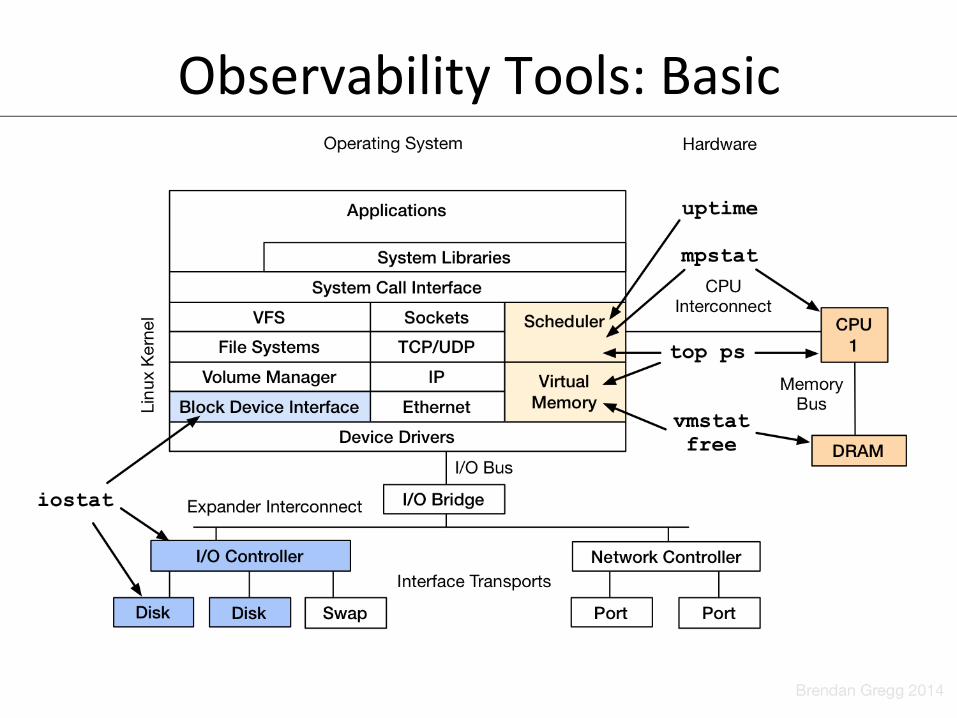
Observability Tools: Basic
• upVme • top (or htop) • ps • vmstat • iostat • mpstat • free

upVme
• One way to print load averages: • A measure of resource demand: CPUs + disks – Other OSes only show CPUs: easier to interpret
• ExponenVally-‐damped moving averages with Vme constants of 1, 5, and 15 minutes – Historic trend without the line graph
• Load > # of CPUs, may mean CPU saturaVon – Don’t spend more than 5 seconds studying these
$ uptime! 07:42:06 up 8:16, 1 user, load average: 2.27, 2.84, 2.91!
top (or htop)
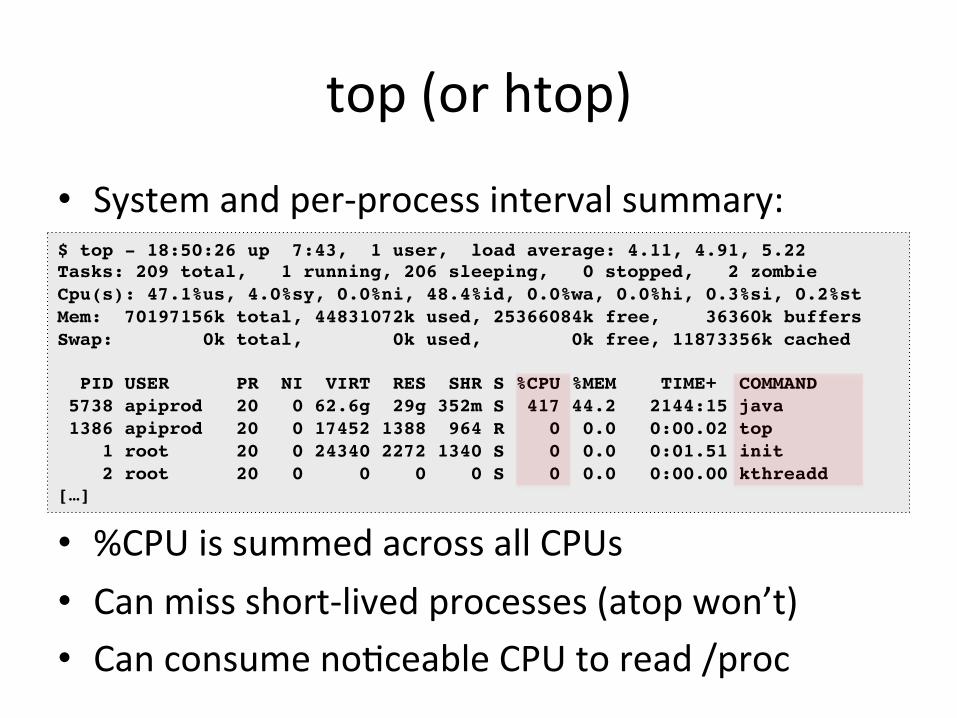
• System and per-‐process interval summary:
• %CPU is summed across all CPUs • Can miss short-‐lived processes (atop won’t) • Can consume noVceable CPU to read /proc
$ top - 18:50:26 up 7:43, 1 user, load average: 4.11, 4.91, 5.22!Tasks: 209 total, 1 running, 206 sleeping, 0 stopped, 2 zombie!Cpu(s): 47.1%us, 4.0%sy, 0.0%ni, 48.4%id, 0.0%wa, 0.0%hi, 0.3%si, 0.2%st!Mem: 70197156k total, 44831072k used, 25366084k free, 36360k buffers!Swap: 0k total, 0k used, 0k free, 11873356k cached!! PID USER PR NI VIRT RES SHR S %CPU %MEM TIME+ COMMAND ! 5738 apiprod 20 0 62.6g 29g 352m S 417 44.2 2144:15 java ! 1386 apiprod 20 0 17452 1388 964 R 0 0.0 0:00.02 top ! 1 root 20 0 24340 2272 1340 S 0 0.0 0:01.51 init ! 2 root 20 0 0 0 0 S 0 0.0 0:00.00 kthreadd ![…]!
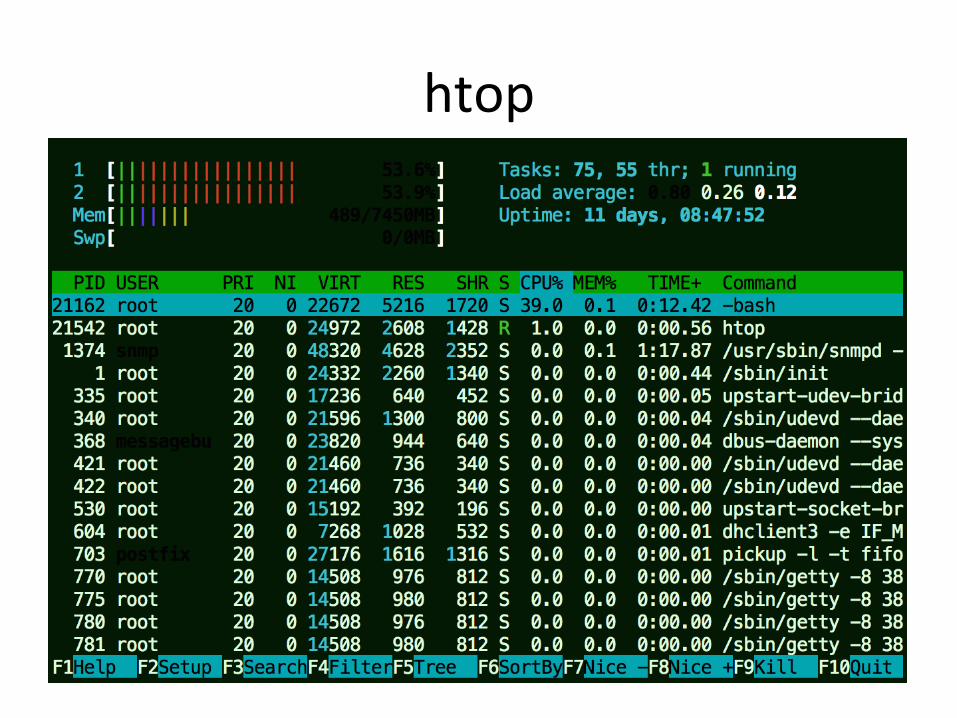
htop
ps
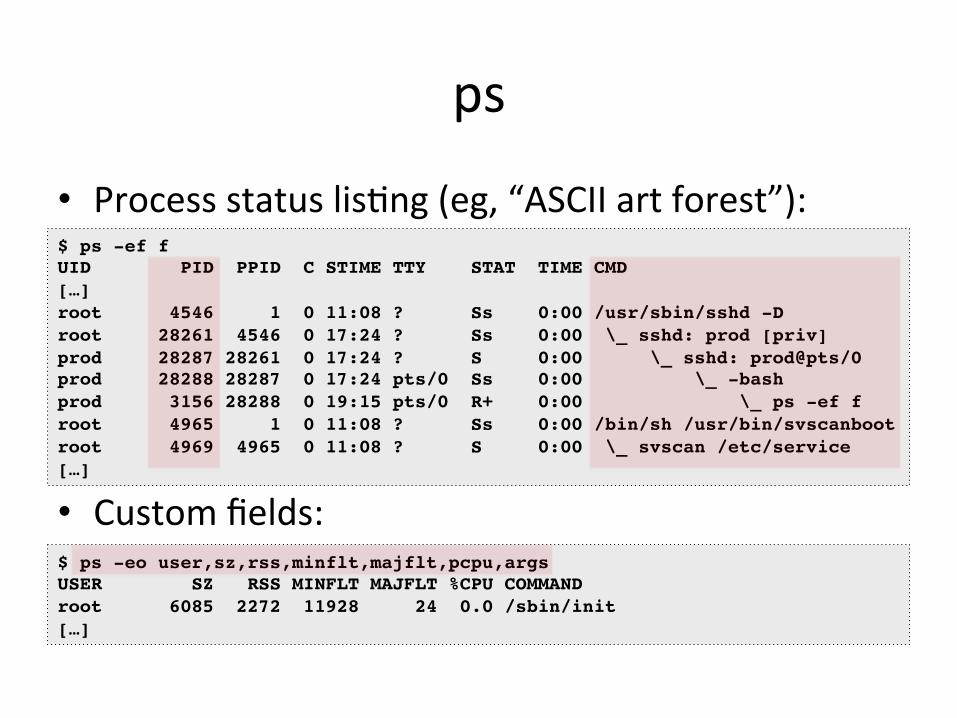
• Process status lisVng (eg, “ASCII art forest”):
• Custom fields:
$ ps -ef f!UID PID PPID C STIME TTY STAT TIME CMD![…]!root 4546 1 0 11:08 ? Ss 0:00 /usr/sbin/sshd -D!root 28261 4546 0 17:24 ? Ss 0:00 \_ sshd: prod [priv]!prod 28287 28261 0 17:24 ? S 0:00 \_ sshd: prod@pts/0 !prod 28288 28287 0 17:24 pts/0 Ss 0:00 \_ -bash!prod 3156 28288 0 19:15 pts/0 R+ 0:00 \_ ps -ef f!root 4965 1 0 11:08 ? Ss 0:00 /bin/sh /usr/bin/svscanboot!root 4969 4965 0 11:08 ? S 0:00 \_ svscan /etc/service![…]!
$ ps -eo user,sz,rss,minflt,majflt,pcpu,args!USER SZ RSS MINFLT MAJFLT %CPU COMMAND!root 6085 2272 11928 24 0.0 /sbin/init![…]!
vmstat
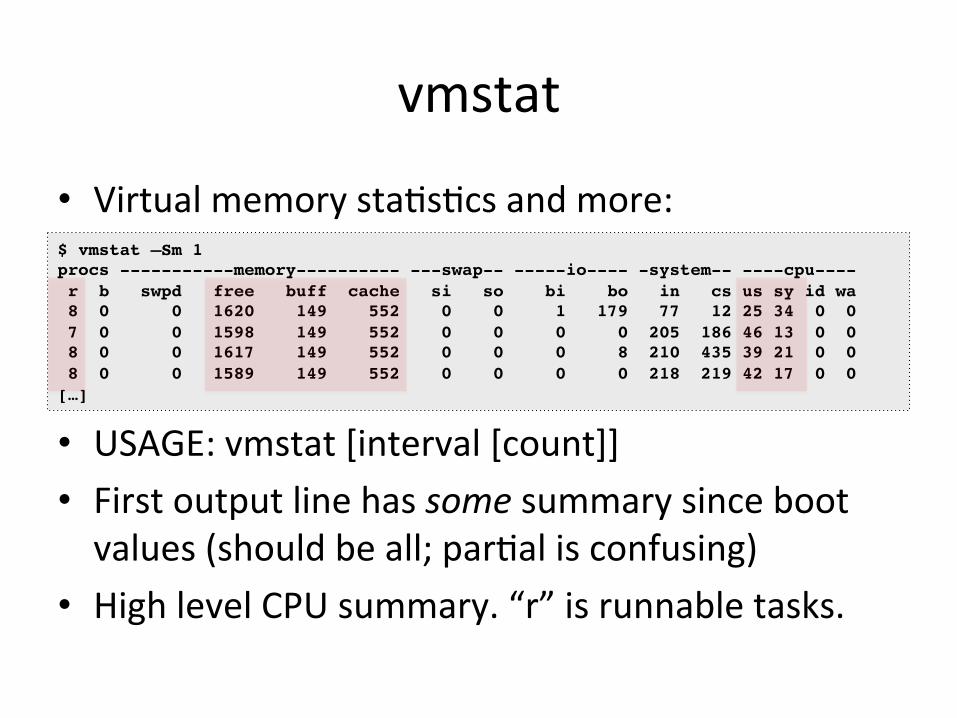
• Virtual memory staVsVcs and more:
• USAGE: vmstat [interval [count]] • First output line has some summary since boot values (should be all; parVal is confusing)
• High level CPU summary. “r” is runnable tasks.
$ vmstat –Sm 1!procs -----------memory---------- ---swap-- -----io---- -system-- ----cpu----! r b swpd free buff cache si so bi bo in cs us sy id wa! 8 0 0 1620 149 552 0 0 1 179 77 12 25 34 0 0! 7 0 0 1598 149 552 0 0 0 0 205 186 46 13 0 0! 8 0 0 1617 149 552 0 0 0 8 210 435 39 21 0 0! 8 0 0 1589 149 552 0 0 0 0 218 219 42 17 0 0![…]!

iostat
• Block I/O (disk) stats. 1st output is since boot.
• Very useful set of stats
$ iostat -xmdz 1!!Linux 3.13.0-29 (db001-eb883efa) 08/18/2014 _x86_64_ (16 CPU)!!Device: rrqm/s wrqm/s r/s w/s rMB/s wMB/s \ ...!xvda 0.00 0.00 0.00 0.00 0.00 0.00 / ...!xvdb 213.00 0.00 15299.00 0.00 338.17 0.00 \ ...!xvdc 129.00 0.00 15271.00 3.00 336.65 0.01 / ...!md0 0.00 0.00 31082.00 3.00 678.45 0.01 \ ...!
... \ avgqu-sz await r_await w_await svctm %util! ... / 0.00 0.00 0.00 0.00 0.00 0.00! ... \ 126.09 8.22 8.22 0.00 0.06 86.40! ... / 99.31 6.47 6.47 0.00 0.06 86.00! ... \ 0.00 0.00 0.00 0.00 0.00 0.00!
Workload
ResulVng Performance
mpstat
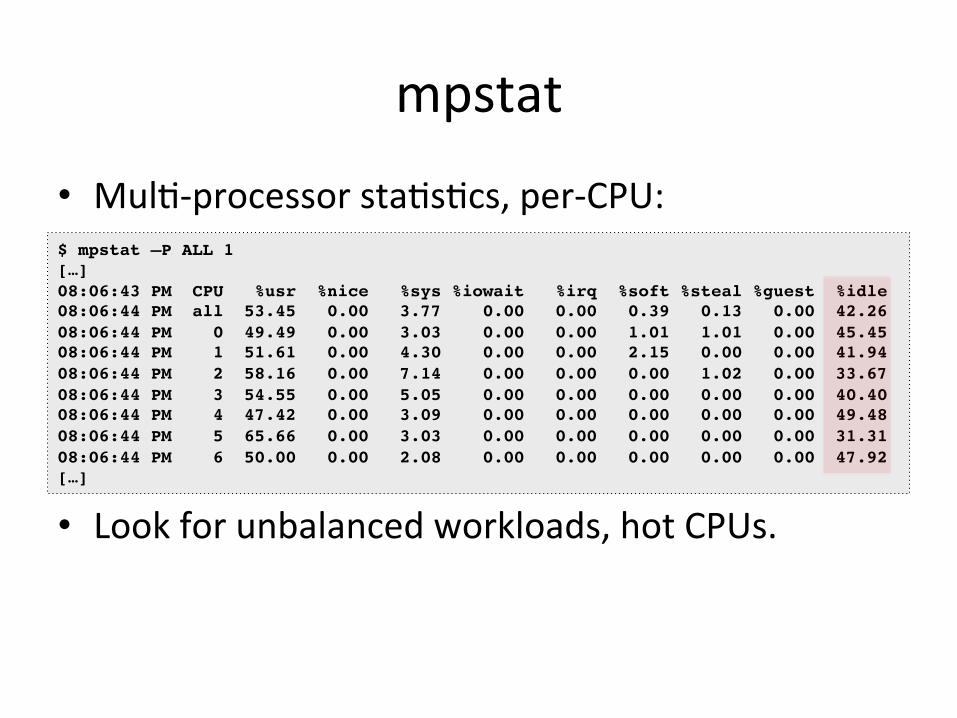
• MulV-‐processor staVsVcs, per-‐CPU:
• Look for unbalanced workloads, hot CPUs.
$ mpstat –P ALL 1![…]!08:06:43 PM CPU %usr %nice %sys %iowait %irq %soft %steal %guest %idle!08:06:44 PM all 53.45 0.00 3.77 0.00 0.00 0.39 0.13 0.00 42.26!08:06:44 PM 0 49.49 0.00 3.03 0.00 0.00 1.01 1.01 0.00 45.45!08:06:44 PM 1 51.61 0.00 4.30 0.00 0.00 2.15 0.00 0.00 41.94!08:06:44 PM 2 58.16 0.00 7.14 0.00 0.00 0.00 1.02 0.00 33.67!08:06:44 PM 3 54.55 0.00 5.05 0.00 0.00 0.00 0.00 0.00 40.40!08:06:44 PM 4 47.42 0.00 3.09 0.00 0.00 0.00 0.00 0.00 49.48!08:06:44 PM 5 65.66 0.00 3.03 0.00 0.00 0.00 0.00 0.00 31.31!08:06:44 PM 6 50.00 0.00 2.08 0.00 0.00 0.00 0.00 0.00 47.92![…]!

free
• Main memory usage:
• buffers: block device I/O cache • cached: virtual page cache
$ free -m! total used free shared buffers cached!Mem: 3750 1111 2639 0 147 527!-/+ buffers/cache: 436 3313!Swap: 0 0 0!
Observability Tools: Basic
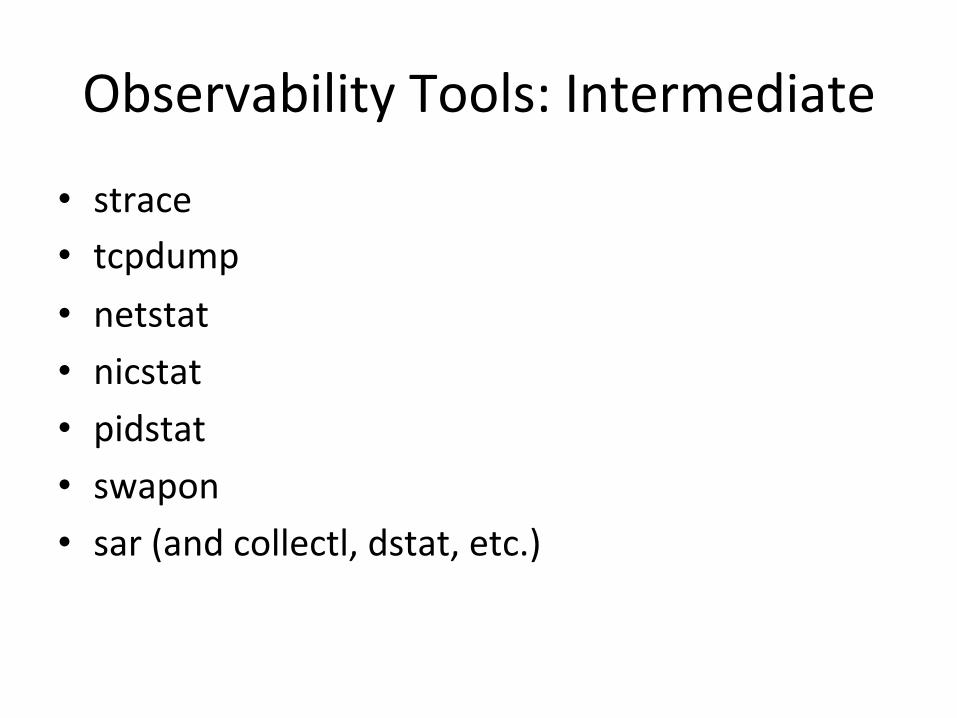
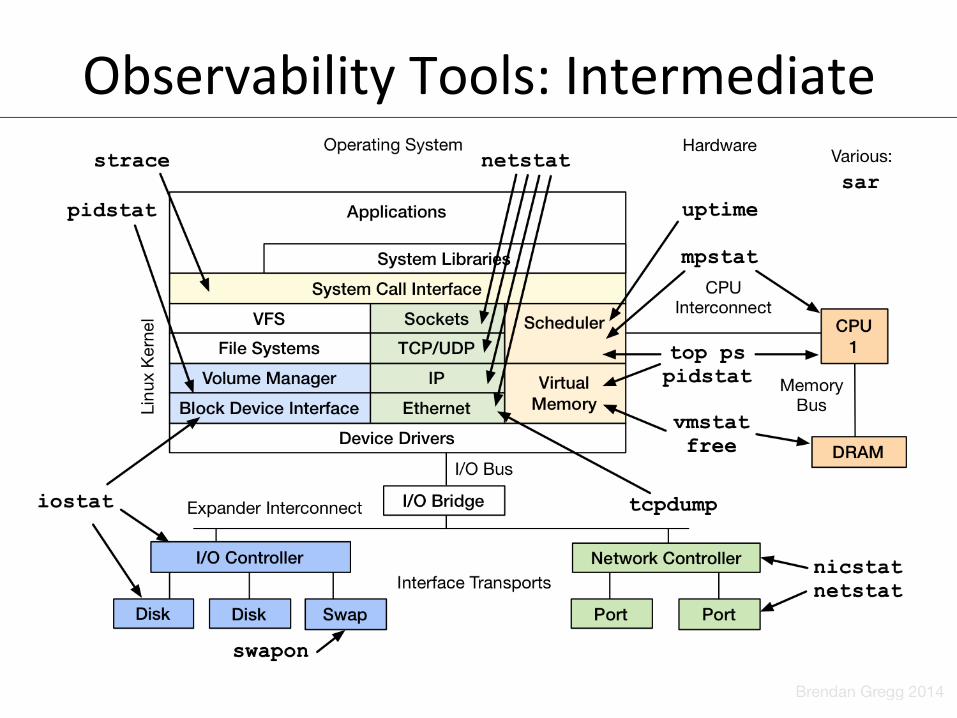
Observability Tools: Intermediate
• strace • tcpdump • netstat • nicstat • pidstat • swapon • sar (and collectl, dstat, etc.)

strace
• System call tracer:
• Eg, -‐kt: Vme (us) since epoch; -‐T: syscall Vme (s) • Translates syscall args – Very helpful for solving system usage issues
• Currently has massive overhead (ptrace based) – Can slow the target by > 100x. Use extreme cauVon.
$ strace –tttT –p 313!1408393285.779746 getgroups(0, NULL) = 1 <0.000016>!1408393285.779873 getgroups(1, [0]) = 1 <0.000015>!1408393285.780797 close(3) = 0 <0.000016>!1408393285.781338 write(1, "LinuxCon 2014!\n", 15LinuxCon 2014!!) = 15 <0.000048>!

tcpdump
• Sniff network packets for post analysis:
• Study packet sequences with Vmestamps (us) • CPU overhead opVmized (socket ring buffers), but can sVll be significant. Use cauVon.
$ tcpdump -i eth0 -w /tmp/out.tcpdump!tcpdump: listening on eth0, link-type EN10MB (Ethernet), capture size 65535 bytes!^C7985 packets captured!8996 packets received by filter!1010 packets dropped by kernel!# tcpdump -nr /tmp/out.tcpdump | head !reading from file /tmp/out.tcpdump, link-type EN10MB (Ethernet) !20:41:05.038437 IP 10.44.107.151.22 > 10.53.237.72.46425: Flags [P.], seq 18...!20:41:05.038533 IP 10.44.107.151.22 > 10.53.237.72.46425: Flags [P.], seq 48...!20:41:05.038584 IP 10.44.107.151.22 > 10.53.237.72.46425: Flags [P.], seq 96...![…]!

netstat
• Various network protocol staVsVcs using -‐s: • A mulV-‐tool:
-‐i: interface stats -‐r: route table default: list conns
• netstat -‐p: shows process details!
• Per-‐second interval with -‐c
$ netstat –s![…]!Tcp:! 736455 active connections openings! 176887 passive connection openings! 33 failed connection attempts! 1466 connection resets received! 3311 connections established! 91975192 segments received! 180415763 segments send out! 223685 segments retransmited! 2 bad segments received.! 39481 resets sent![…]!TcpExt:! 12377 invalid SYN cookies received! 2982 delayed acks sent![…]!
nicstat
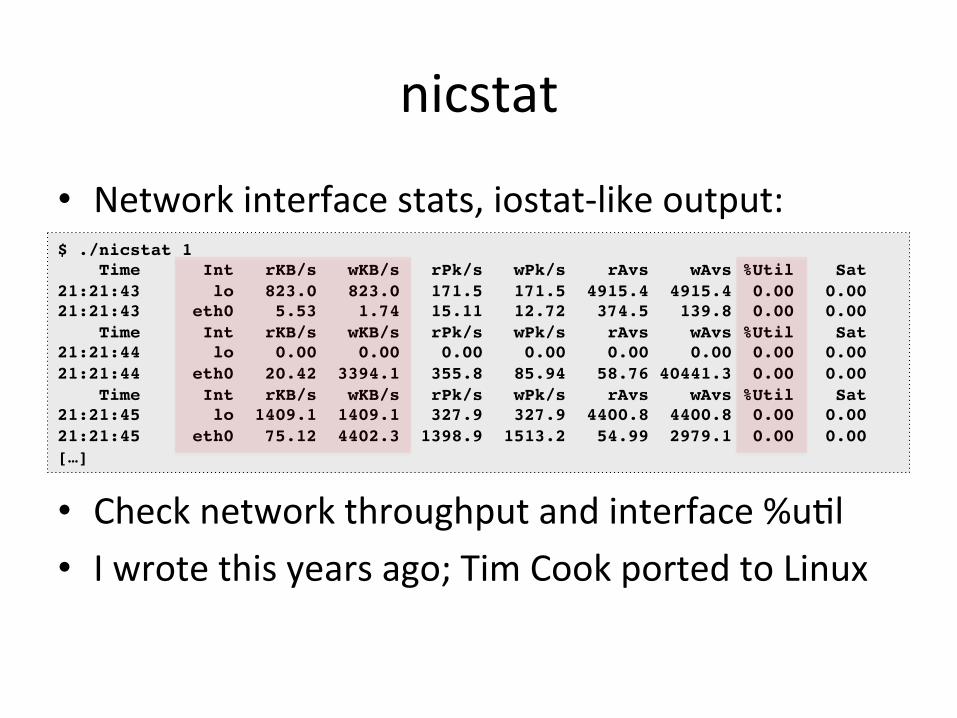
• Network interface stats, iostat-‐like output:
• Check network throughput and interface %uVl • I wrote this years ago; Tim Cook ported to Linux
$ ./nicstat 1! Time Int rKB/s wKB/s rPk/s wPk/s rAvs wAvs %Util Sat!21:21:43 lo 823.0 823.0 171.5 171.5 4915.4 4915.4 0.00 0.00!21:21:43 eth0 5.53 1.74 15.11 12.72 374.5 139.8 0.00 0.00! Time Int rKB/s wKB/s rPk/s wPk/s rAvs wAvs %Util Sat!21:21:44 lo 0.00 0.00 0.00 0.00 0.00 0.00 0.00 0.00!21:21:44 eth0 20.42 3394.1 355.8 85.94 58.76 40441.3 0.00 0.00! Time Int rKB/s wKB/s rPk/s wPk/s rAvs wAvs %Util Sat!21:21:45 lo 1409.1 1409.1 327.9 327.9 4400.8 4400.8 0.00 0.00!21:21:45 eth0 75.12 4402.3 1398.9 1513.2 54.99 2979.1 0.00 0.00![…]!

pidstat
• Very useful process stats. eg, by-‐thread, disk I/O:
• I usually prefer this over top(1)
$ pidstat -t 1!Linux 3.2.0-54 (db002-91befe03) !08/18/2014 !_x86_64_!(8 CPU)!!08:57:52 PM TGID TID %usr %system %guest %CPU CPU Command!08:57:54 PM 5738 - 484.75 39.83 0.00 524.58 1 java!08:57:54 PM - 5817 0.85 0.00 0.00 0.85 2 |__java!08:57:54 PM - 5931 1.69 1.69 0.00 3.39 4 |__java!08:57:54 PM - 5981 0.85 0.00 0.00 0.85 7 |__java!08:57:54 PM - 5990 0.85 0.00 0.00 0.85 4 |__java![…]!$ pidstat -d 1![…]!08:58:27 PM PID kB_rd/s kB_wr/s kB_ccwr/s Command!08:58:28 PM 5738 0.00 815.69 0.00 java![…]!

swapon
• Show swap device usage:
• If you have swap enabled…
$ swapon -s!Filename Type Size Used Priority!/dev/sda3 partition 5245212 284 -1!

sar
• System AcVvity Reporter. Many stats, eg:
• Archive or live mode: (interval [count]) • Well designed. Header naming convenVon, logical groups: TCP, ETCP, DEV, EDEV, …
$ sar -n TCP,ETCP,DEV 1!Linux 3.2.55 (test-e4f1a80b) !08/18/2014 !_x86_64_!(8 CPU)!!09:10:43 PM IFACE rxpck/s txpck/s rxkB/s txkB/s rxcmp/s txcmp/s rxmcst/s!09:10:44 PM lo 14.00 14.00 1.34 1.34 0.00 0.00 0.00!09:10:44 PM eth0 4114.00 4186.00 4537.46 28513.24 0.00 0.00 0.00!!09:10:43 PM active/s passive/s iseg/s oseg/s!09:10:44 PM 21.00 4.00 4107.00 22511.00!!09:10:43 PM atmptf/s estres/s retrans/s isegerr/s orsts/s!09:10:44 PM 0.00 0.00 36.00 0.00 1.00![…]!

Observability: sar

collectl
• sar-‐like mulVtool • Supports distributed environments – designed for HPC
• One ~6k line Perl program (hackable) • Exposes /proc/PID/io syscr & syscw stats, so gets a doked line to syscalls…

Observability: collectl

Other Tools
• With these measure-‐all-‐tools, the point isn’t to use sar or collectl (or dstat or whatever); it’s to have a way to measure everything you want
• In cloud environments, you are probably using a monitoring product, developed in-‐house or commercial. Same method applies…

How does your monitoring tool measure these?
Observability Tools: Intermediate
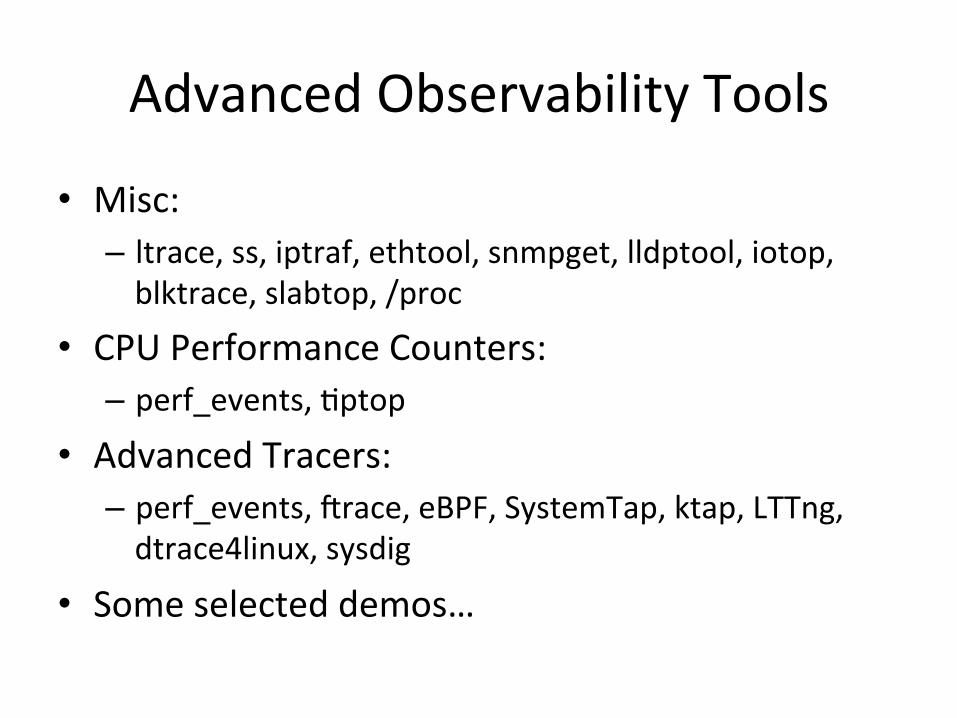
Advanced Observability Tools
• Misc: – ltrace, ss, iptraf, ethtool, snmpget, lldptool, iotop, blktrace, slabtop, /proc
• CPU Performance Counters: – perf_events, Vptop
• Advanced Tracers: – perf_events, crace, eBPF, SystemTap, ktap, LTTng, dtrace4linux, sysdig
• Some selected demos…

ss
• More socket staVsVcs: $ ss -mop!State Recv-Q Send-Q Local Address:Port Peer Address:Port !CLOSE-WAIT 1 0 127.0.0.1:42295 127.0.0.1:28527 users:(("apacheLogParser",2702,3))!
! mem:(r1280,w0,f2816,t0)!ESTAB 0 0 127.0.0.1:5433 127.0.0.1:41312 timer:(keepalive,36min,0) users:(("postgres",2333,7))!
! mem:(r0,w0,f0,t0)![…]!$ ss –i!State Recv-Q Send-Q Local Address:Port Peer Address:Port !CLOSE-WAIT 1 0 127.0.0.1:42295 127.0.0.1:28527 ! cubic wscale:6,6 rto:208 rtt:9/6 ato:40 cwnd:10 send 145.6Mbps rcv_space:32792!ESTAB 0 0 10.144.107.101:ssh 10.53.237.72:4532 ! cubic wscale:4,6 rto:268 rtt:71.5/3 ato:40 cwnd:10 send 1.5Mbps rcv_rtt:72 rcv_space:14480![…]!

iptraf
iotop
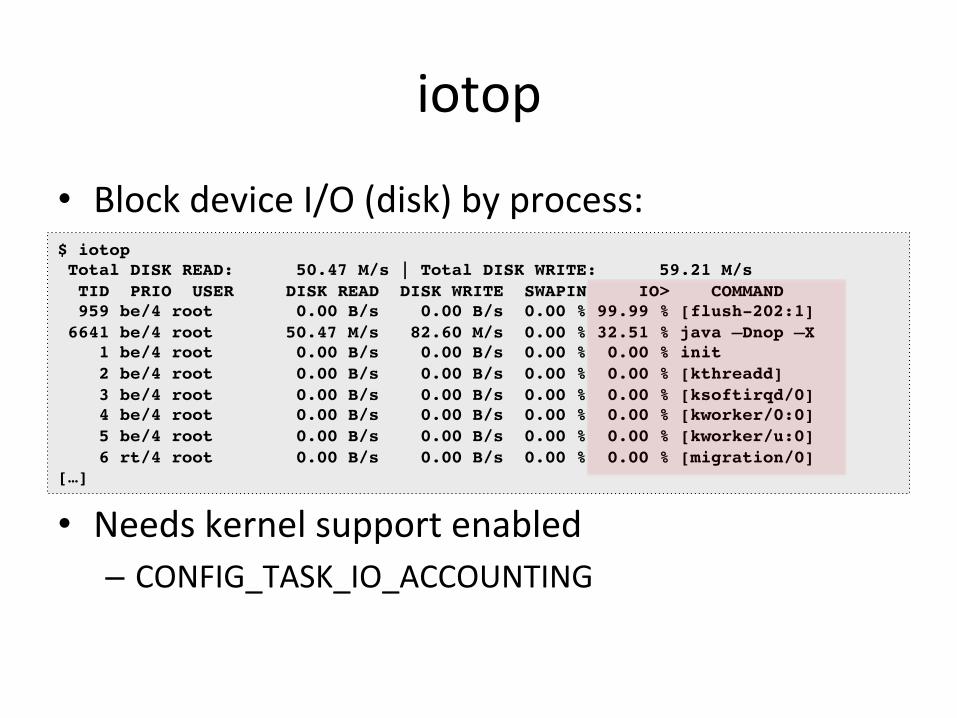
• Block device I/O (disk) by process:
• Needs kernel support enabled – CONFIG_TASK_IO_ACCOUNTING
$ iotop! Total DISK READ: 50.47 M/s | Total DISK WRITE: 59.21 M/s! TID PRIO USER DISK READ DISK WRITE SWAPIN IO> COMMAND ! 959 be/4 root 0.00 B/s 0.00 B/s 0.00 % 99.99 % [flush-202:1]! 6641 be/4 root 50.47 M/s 82.60 M/s 0.00 % 32.51 % java –Dnop –X! 1 be/4 root 0.00 B/s 0.00 B/s 0.00 % 0.00 % init! 2 be/4 root 0.00 B/s 0.00 B/s 0.00 % 0.00 % [kthreadd]! 3 be/4 root 0.00 B/s 0.00 B/s 0.00 % 0.00 % [ksoftirqd/0]! 4 be/4 root 0.00 B/s 0.00 B/s 0.00 % 0.00 % [kworker/0:0]! 5 be/4 root 0.00 B/s 0.00 B/s 0.00 % 0.00 % [kworker/u:0]! 6 rt/4 root 0.00 B/s 0.00 B/s 0.00 % 0.00 % [migration/0]![…]!

slabtop
• Kernel slab allocator memory usage: $ slabtop! Active / Total Objects (% used) : 4692768 / 4751161 (98.8%)! Active / Total Slabs (% used) : 129083 / 129083 (100.0%)! Active / Total Caches (% used) : 71 / 109 (65.1%)! Active / Total Size (% used) : 729966.22K / 738277.47K (98.9%)! Minimum / Average / Maximum Object : 0.01K / 0.16K / 8.00K!! OBJS ACTIVE USE OBJ SIZE SLABS OBJ/SLAB CACHE SIZE NAME !3565575 3565575 100% 0.10K 91425 39 365700K buffer_head!314916 314066 99% 0.19K 14996 21 59984K dentry!184192 183751 99% 0.06K 2878 64 11512K kmalloc-64!138618 138618 100% 0.94K 4077 34 130464K xfs_inode!138602 138602 100% 0.21K 3746 37 29968K xfs_ili!102116 99012 96% 0.55K 3647 28 58352K radix_tree_node! 97482 49093 50% 0.09K 2321 42 9284K kmalloc-96! 22695 20777 91% 0.05K 267 85 1068K shared_policy_node! 21312 21312 100% 0.86K 576 37 18432K ext4_inode_cache! 16288 14601 89% 0.25K 509 32 4072K kmalloc-256![…]!
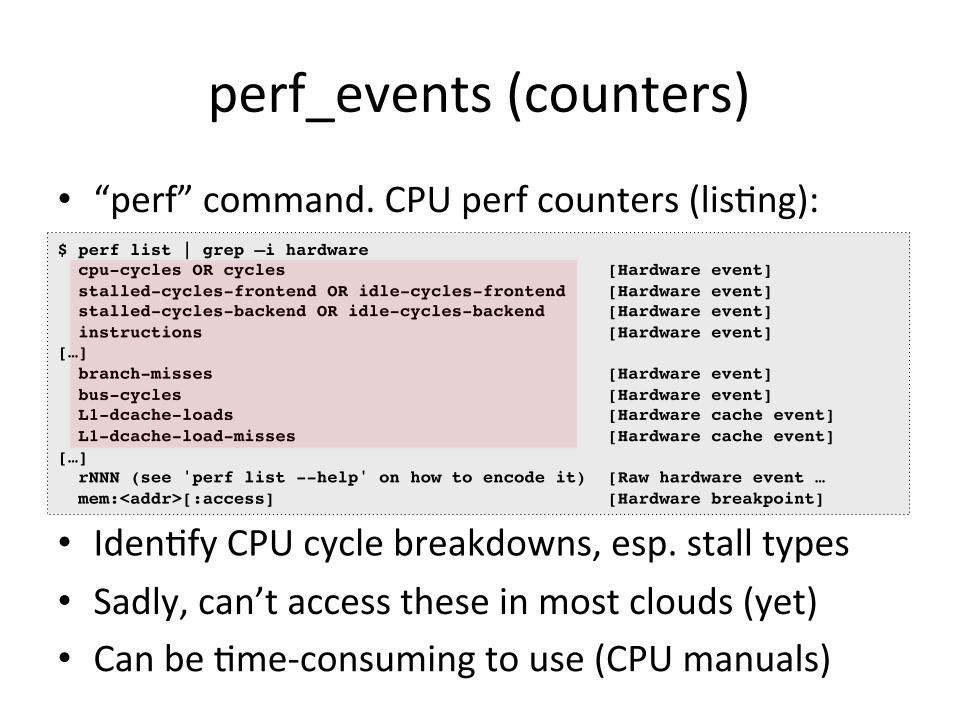
perf_events (counters)
• “perf” command. CPU perf counters (lisVng):
• IdenVfy CPU cycle breakdowns, esp. stall types • Sadly, can’t access these in most clouds (yet) • Can be Vme-‐consuming to use (CPU manuals)
$ perf list | grep –i hardware! cpu-cycles OR cycles [Hardware event]! stalled-cycles-frontend OR idle-cycles-frontend [Hardware event]! stalled-cycles-backend OR idle-cycles-backend [Hardware event]! instructions [Hardware event]![…]! branch-misses [Hardware event]! bus-cycles [Hardware event]! L1-dcache-loads [Hardware cache event]! L1-dcache-load-misses [Hardware cache event]![…]! rNNN (see 'perf list --help' on how to encode it) [Raw hardware event … ! mem:<addr>[:access] [Hardware breakpoint]!

Vptop
• IPC by process? %MISS? %BUS? Awesome! • Needs some love. SVll can’t use it yet (cloud)
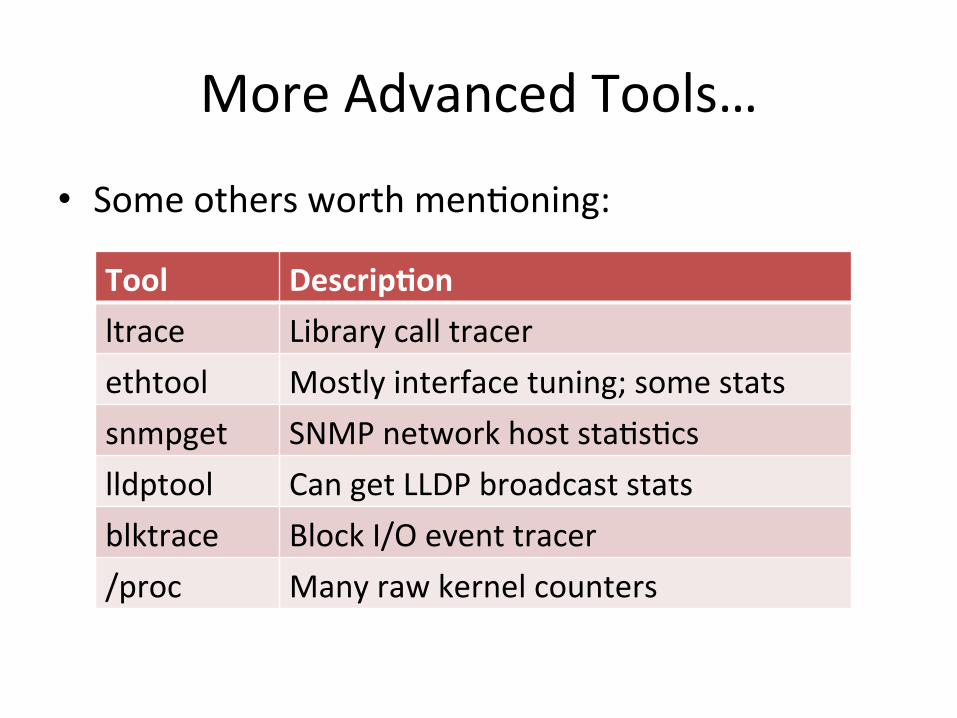
More Advanced Tools…
• Some others worth menVoning:
Tool Descrip.on ltrace Library call tracer ethtool Mostly interface tuning; some stats snmpget SNMP network host staVsVcs lldptool Can get LLDP broadcast stats blktrace Block I/O event tracer /proc Many raw kernel counters
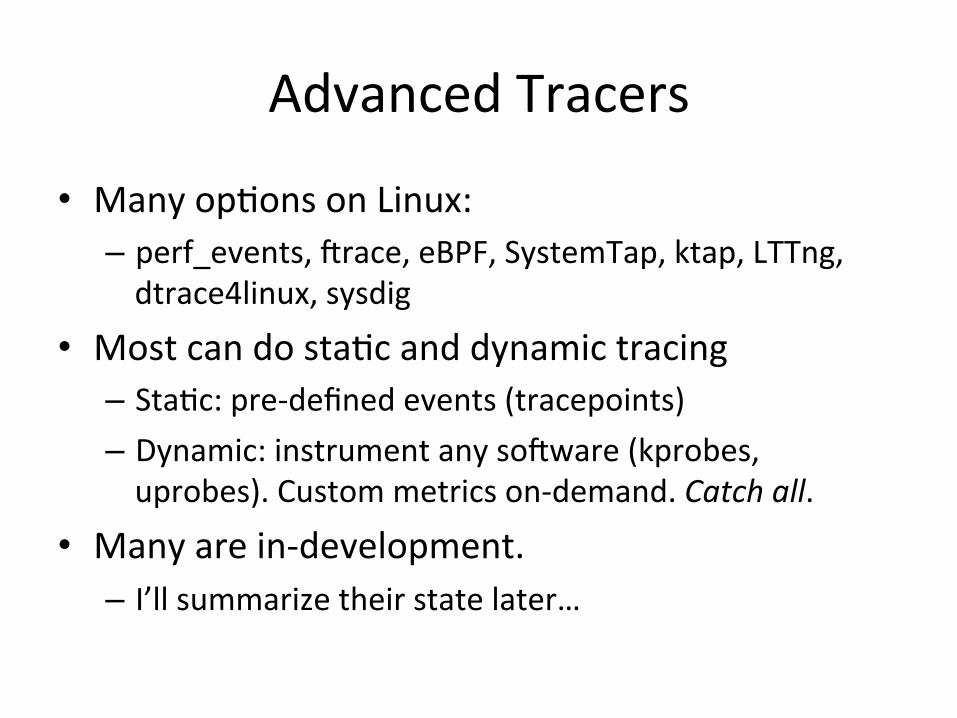
Advanced Tracers
• Many opVons on Linux: – perf_events, crace, eBPF, SystemTap, ktap, LTTng, dtrace4linux, sysdig
• Most can do staVc and dynamic tracing – StaVc: pre-‐defined events (tracepoints) – Dynamic: instrument any socware (kprobes, uprobes). Custom metrics on-‐demand. Catch all.
• Many are in-‐development. – I’ll summarize their state later…
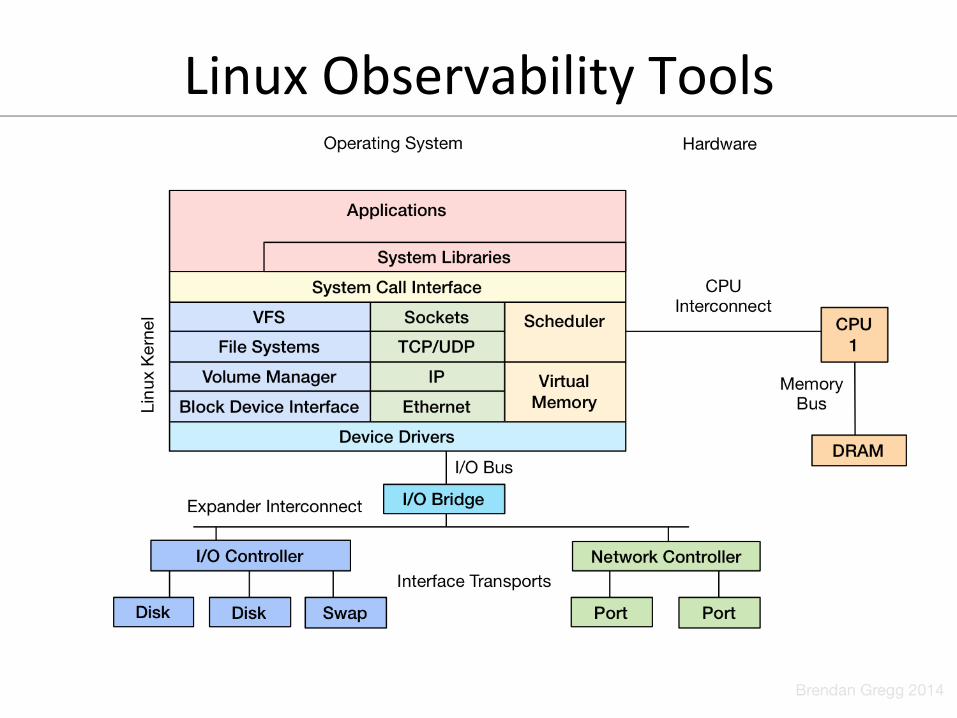
Linux Observability Tools
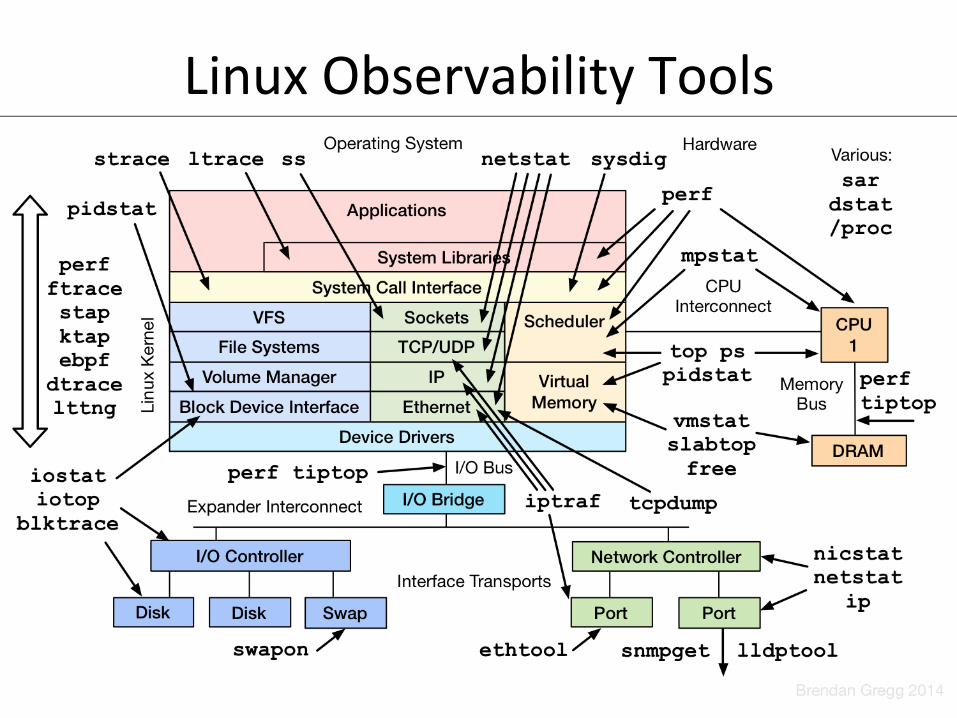
Linux Observability Tools

Benchmarking Tools
Benchmarking Tools
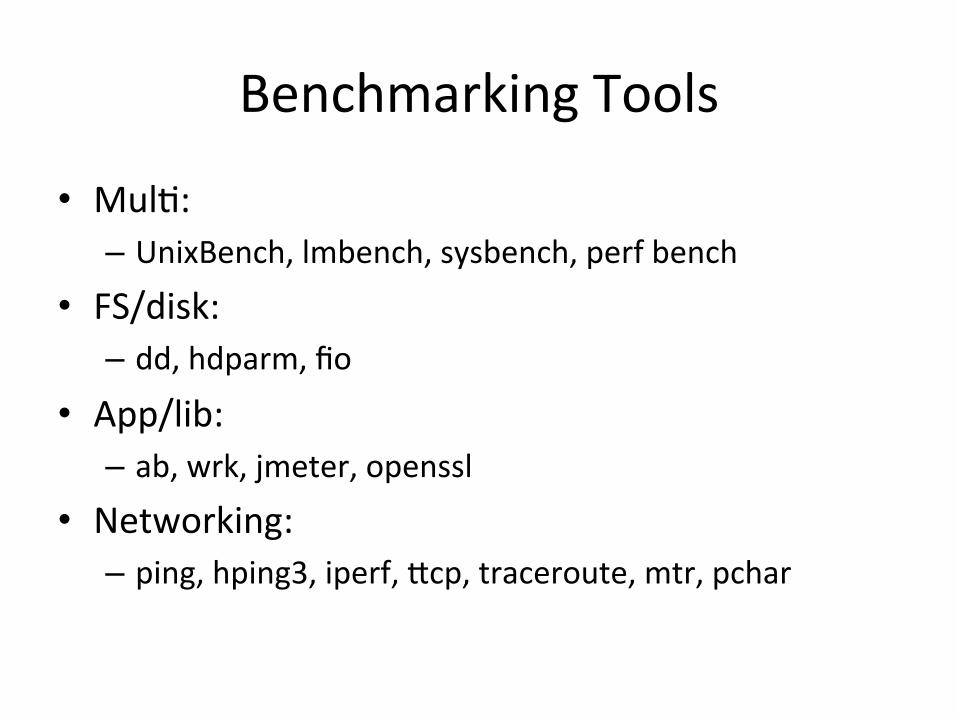
• MulV: – UnixBench, lmbench, sysbench, perf bench
• FS/disk: – dd, hdparm, fio
• App/lib: – ab, wrk, jmeter, openssl
• Networking: – ping, hping3, iperf, kcp, traceroute, mtr, pchar
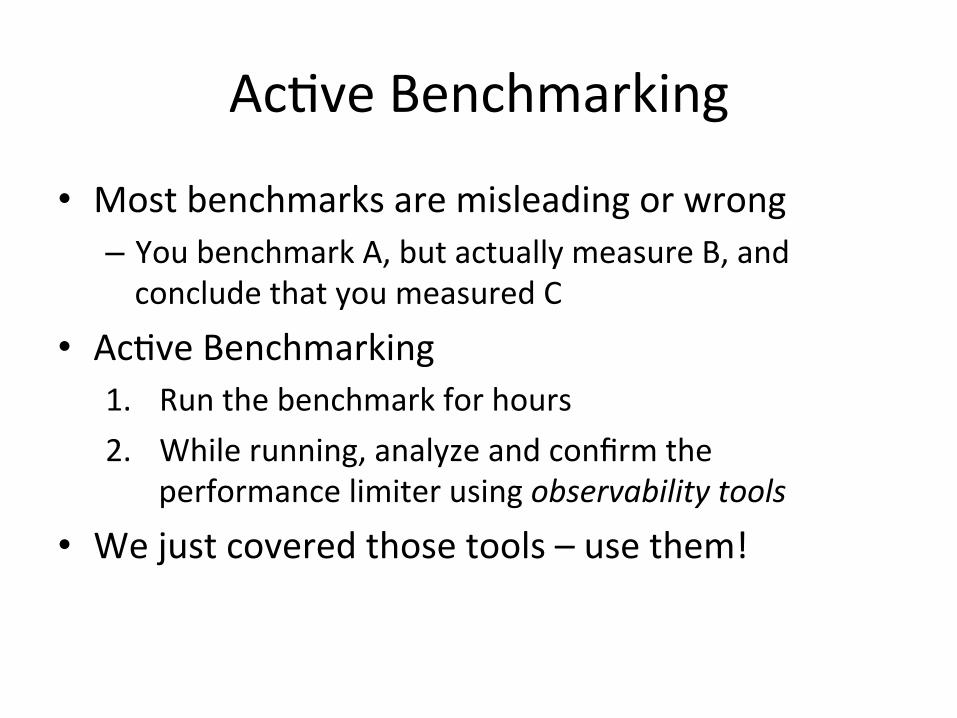
AcVve Benchmarking
• Most benchmarks are misleading or wrong – You benchmark A, but actually measure B, and conclude that you measured C
• AcVve Benchmarking 1. Run the benchmark for hours 2. While running, analyze and confirm the
performance limiter using observability tools
• We just covered those tools – use them!
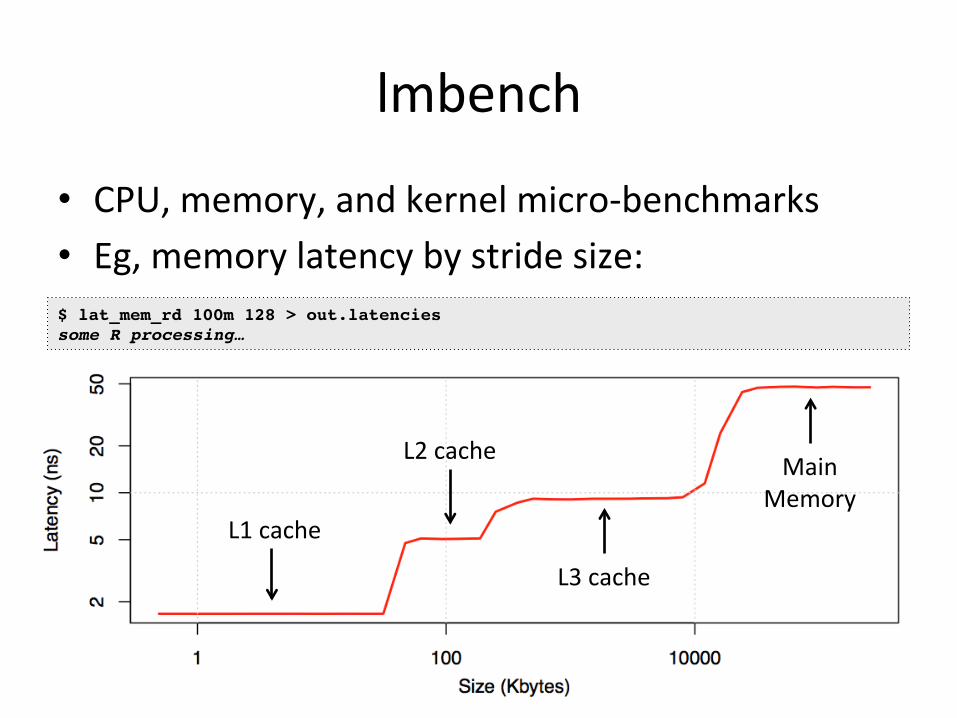
lmbench
• CPU, memory, and kernel micro-‐benchmarks • Eg, memory latency by stride size: $ lat_mem_rd 100m 128 > out.latencies!some R processing…!
L1 cache
L2 cache Main Memory
L3 cache
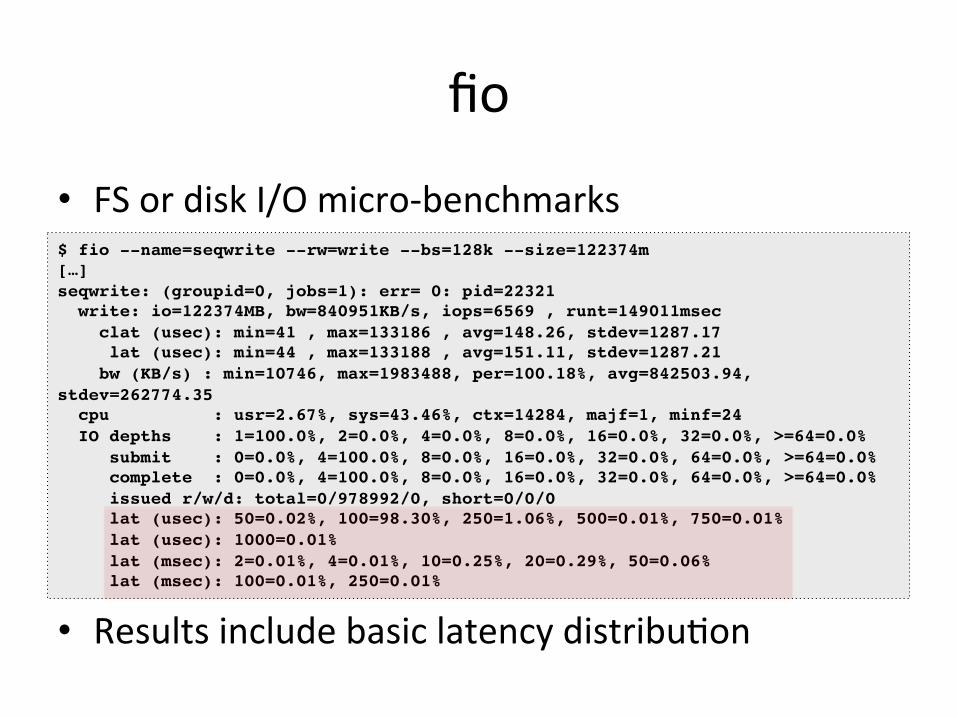
fio
• FS or disk I/O micro-‐benchmarks $ fio --name=seqwrite --rw=write --bs=128k --size=122374m![…]!seqwrite: (groupid=0, jobs=1): err= 0: pid=22321! write: io=122374MB, bw=840951KB/s, iops=6569 , runt=149011msec! clat (usec): min=41 , max=133186 , avg=148.26, stdev=1287.17! lat (usec): min=44 , max=133188 , avg=151.11, stdev=1287.21! bw (KB/s) : min=10746, max=1983488, per=100.18%, avg=842503.94, stdev=262774.35! cpu : usr=2.67%, sys=43.46%, ctx=14284, majf=1, minf=24! IO depths : 1=100.0%, 2=0.0%, 4=0.0%, 8=0.0%, 16=0.0%, 32=0.0%, >=64=0.0%! submit : 0=0.0%, 4=100.0%, 8=0.0%, 16=0.0%, 32=0.0%, 64=0.0%, >=64=0.0%! complete : 0=0.0%, 4=100.0%, 8=0.0%, 16=0.0%, 32=0.0%, 64=0.0%, >=64=0.0%! issued r/w/d: total=0/978992/0, short=0/0/0! lat (usec): 50=0.02%, 100=98.30%, 250=1.06%, 500=0.01%, 750=0.01%! lat (usec): 1000=0.01%! lat (msec): 2=0.01%, 4=0.01%, 10=0.25%, 20=0.29%, 50=0.06%! lat (msec): 100=0.01%, 250=0.01%!
• Results include basic latency distribuVon
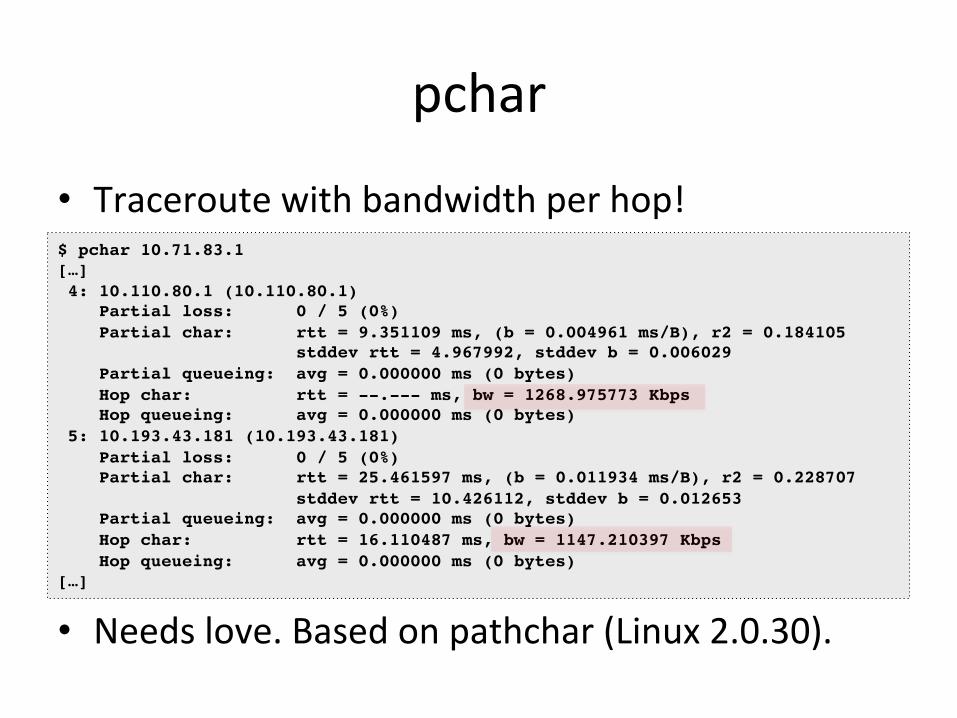
pchar
• Traceroute with bandwidth per hop! $ pchar 10.71.83.1![…]! 4: 10.110.80.1 (10.110.80.1)! Partial loss: 0 / 5 (0%)! Partial char: rtt = 9.351109 ms, (b = 0.004961 ms/B), r2 = 0.184105! stddev rtt = 4.967992, stddev b = 0.006029! Partial queueing: avg = 0.000000 ms (0 bytes)! Hop char: rtt = --.--- ms, bw = 1268.975773 Kbps! Hop queueing: avg = 0.000000 ms (0 bytes)! 5: 10.193.43.181 (10.193.43.181)! Partial loss: 0 / 5 (0%)! Partial char: rtt = 25.461597 ms, (b = 0.011934 ms/B), r2 = 0.228707! stddev rtt = 10.426112, stddev b = 0.012653! Partial queueing: avg = 0.000000 ms (0 bytes)! Hop char: rtt = 16.110487 ms, bw = 1147.210397 Kbps! Hop queueing: avg = 0.000000 ms (0 bytes)![…]!
• Needs love. Based on pathchar (Linux 2.0.30).

Benchmarking Tools
Tuning Tools

Tuning Tools
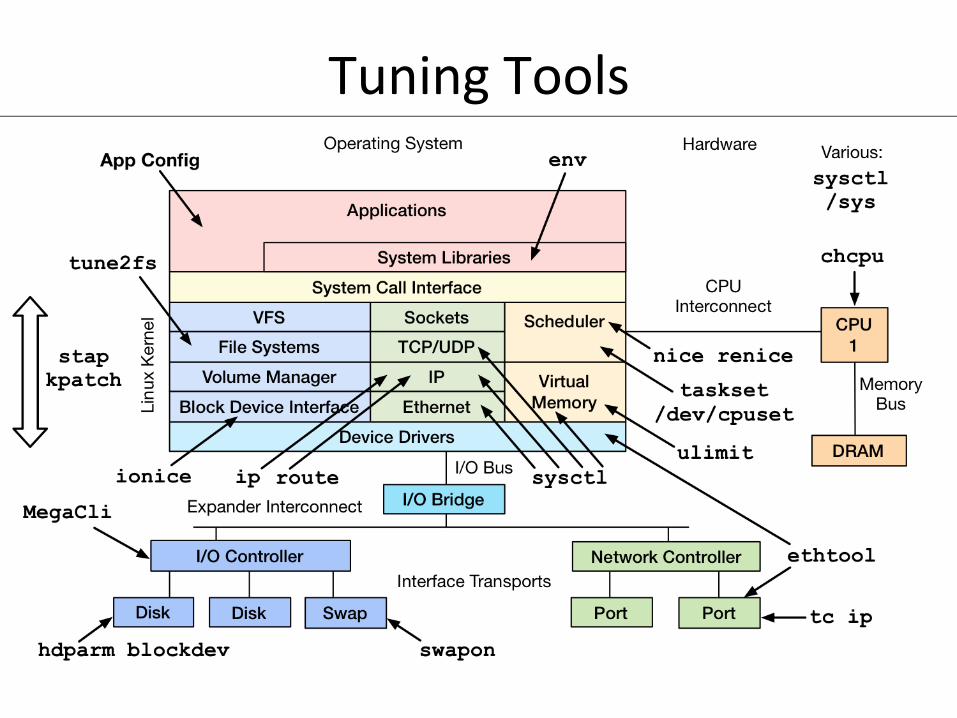
• Generic interfaces: – sysctl, /sys
• Many areas have custom tuning tools: – ApplicaVons: their own config – CPU/scheduler: nice, renice, taskset, ulimit, chcpu – Storage I/O: tune2fs, ionice, hdparm, blockdev, … – Network: ethtool, tc, ip, route – Dynamic patching: stap, kpatch

Tuning Methods
• ScienVfic Method: 1. QuesVon 2. Hypothesis 3. PredicVon 4. Test 5. Analysis
• Any observa0onal or benchmarking tests you can try before tuning?
• Consider risks, and see previous tools
Tuning Tools

Tracing

Tracing Frameworks: Tracepoints
• StaVcally placed at logical places in the kernel • Provides key event details as a “format” string

Tracing Frameworks: + probes
• kprobes: dynamic kernel tracing – funcVon calls, returns, line numbers
• uprobes: dynamic user-‐level tracing

• OpVons: – crace – perf_events – eBPF – SystemTap – ktap – LTTng – dtrace4linux – sysdig
• Too many choices, and many sVll in-‐development
Tracing Tools

Imagine Linux with Tracing
• With a programmable tracer, high level tools can be wriken, such as: – iosnoop – iolatency – opensnoop – …
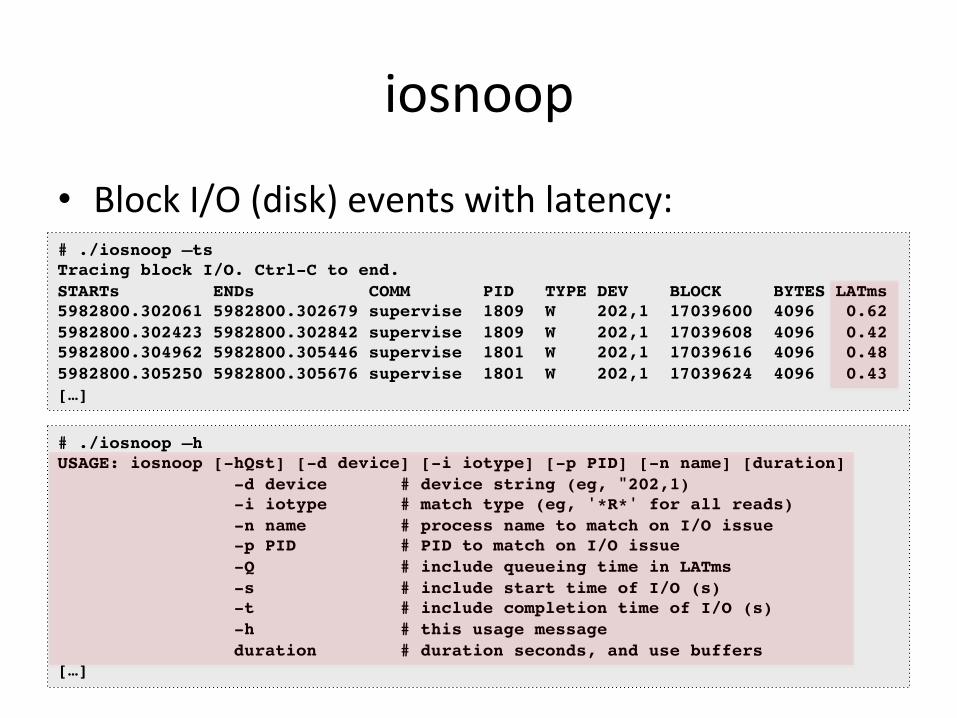
iosnoop
• Block I/O (disk) events with latency: # ./iosnoop –ts!Tracing block I/O. Ctrl-C to end.!STARTs ENDs COMM PID TYPE DEV BLOCK BYTES LATms!5982800.302061 5982800.302679 supervise 1809 W 202,1 17039600 4096 0.62!5982800.302423 5982800.302842 supervise 1809 W 202,1 17039608 4096 0.42!5982800.304962 5982800.305446 supervise 1801 W 202,1 17039616 4096 0.48!5982800.305250 5982800.305676 supervise 1801 W 202,1 17039624 4096 0.43![…]!
# ./iosnoop –h!USAGE: iosnoop [-hQst] [-d device] [-i iotype] [-p PID] [-n name] [duration]! -d device # device string (eg, "202,1)! -i iotype # match type (eg, '*R*' for all reads)! -n name # process name to match on I/O issue! -p PID # PID to match on I/O issue! -Q # include queueing time in LATms! -s # include start time of I/O (s)! -t # include completion time of I/O (s)! -h # this usage message! duration # duration seconds, and use buffers![…]!
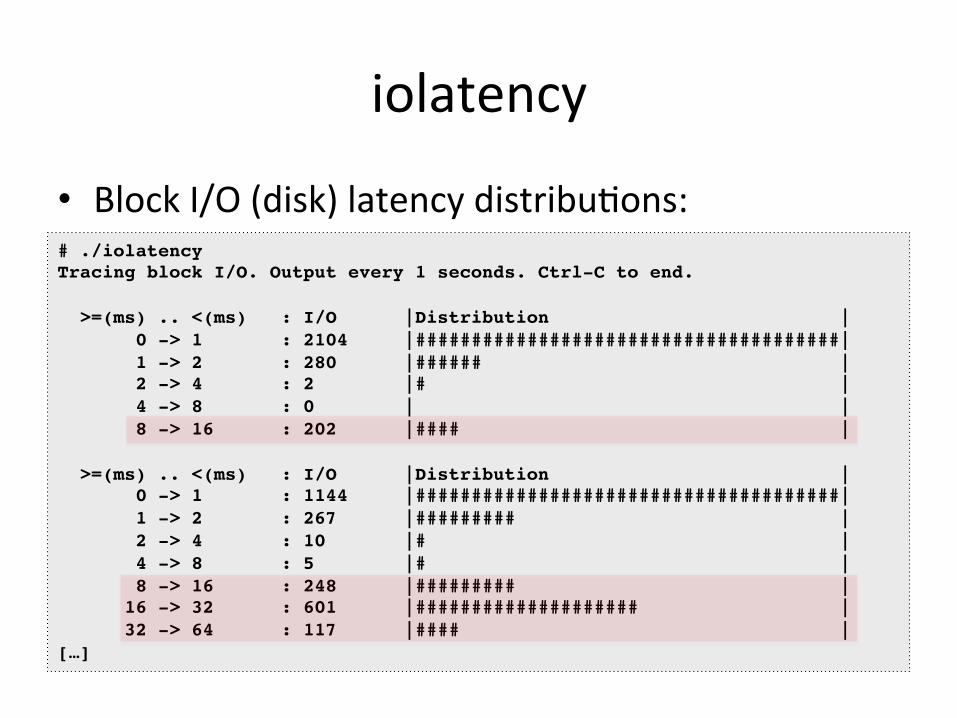
iolatency
• Block I/O (disk) latency distribuVons: # ./iolatency !Tracing block I/O. Output every 1 seconds. Ctrl-C to end.!! >=(ms) .. <(ms) : I/O |Distribution |! 0 -> 1 : 2104 |######################################|! 1 -> 2 : 280 |###### |! 2 -> 4 : 2 |# |! 4 -> 8 : 0 | |! 8 -> 16 : 202 |#### |!! >=(ms) .. <(ms) : I/O |Distribution |! 0 -> 1 : 1144 |######################################|! 1 -> 2 : 267 |######### |! 2 -> 4 : 10 |# |! 4 -> 8 : 5 |# |! 8 -> 16 : 248 |######### |! 16 -> 32 : 601 |#################### |! 32 -> 64 : 117 |#### |![…]!
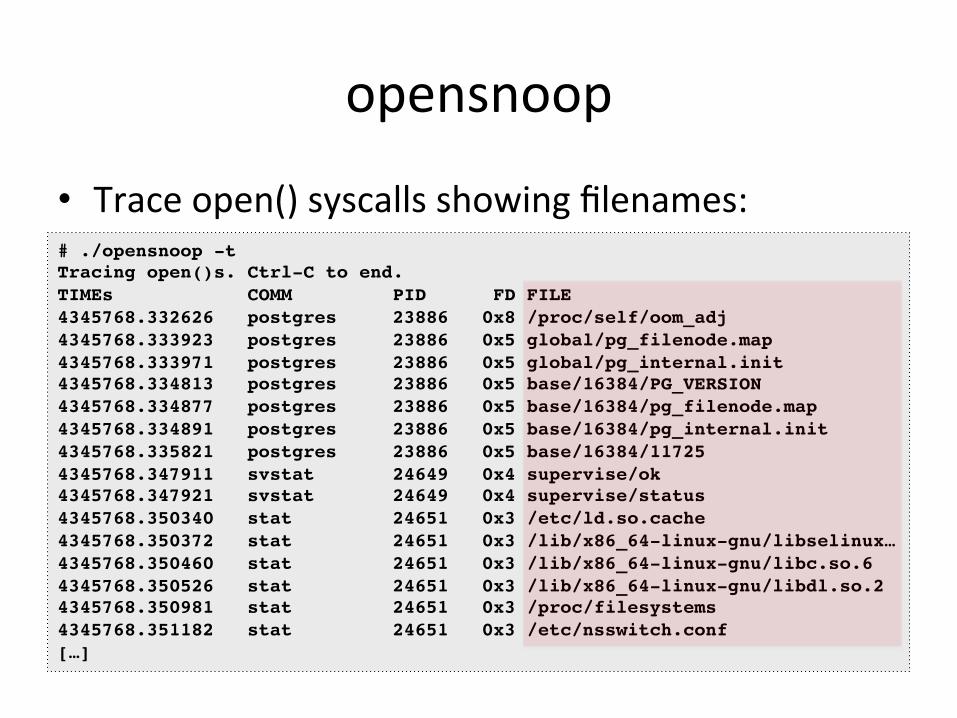
opensnoop
• Trace open() syscalls showing filenames: # ./opensnoop -t!Tracing open()s. Ctrl-C to end.!TIMEs COMM PID FD FILE!4345768.332626 postgres 23886 0x8 /proc/self/oom_adj!4345768.333923 postgres 23886 0x5 global/pg_filenode.map!4345768.333971 postgres 23886 0x5 global/pg_internal.init!4345768.334813 postgres 23886 0x5 base/16384/PG_VERSION!4345768.334877 postgres 23886 0x5 base/16384/pg_filenode.map!4345768.334891 postgres 23886 0x5 base/16384/pg_internal.init!4345768.335821 postgres 23886 0x5 base/16384/11725!4345768.347911 svstat 24649 0x4 supervise/ok!4345768.347921 svstat 24649 0x4 supervise/status!4345768.350340 stat 24651 0x3 /etc/ld.so.cache!4345768.350372 stat 24651 0x3 /lib/x86_64-linux-gnu/libselinux…!4345768.350460 stat 24651 0x3 /lib/x86_64-linux-gnu/libc.so.6!4345768.350526 stat 24651 0x3 /lib/x86_64-linux-gnu/libdl.so.2!4345768.350981 stat 24651 0x3 /proc/filesystems!4345768.351182 stat 24651 0x3 /etc/nsswitch.conf![…]!

funcgraph
• Trace a graph of kernel code flow: # ./funcgraph -Htp 5363 vfs_read!Tracing "vfs_read" for PID 5363... Ctrl-C to end.!# tracer: function_graph!#!# TIME CPU DURATION FUNCTION CALLS!# | | | | | | | |!4346366.073832 | 0) | vfs_read() {!4346366.073834 | 0) | rw_verify_area() {!4346366.073834 | 0) | security_file_permission() {!4346366.073834 | 0) | apparmor_file_permission() {!4346366.073835 | 0) 0.153 us | common_file_perm();!4346366.073836 | 0) 0.947 us | }!4346366.073836 | 0) 0.066 us | __fsnotify_parent();!4346366.073836 | 0) 0.080 us | fsnotify();!4346366.073837 | 0) 2.174 us | }!4346366.073837 | 0) 2.656 us | }!4346366.073837 | 0) | tty_read() {!4346366.073837 | 0) 0.060 us | tty_paranoia_check();![…]!
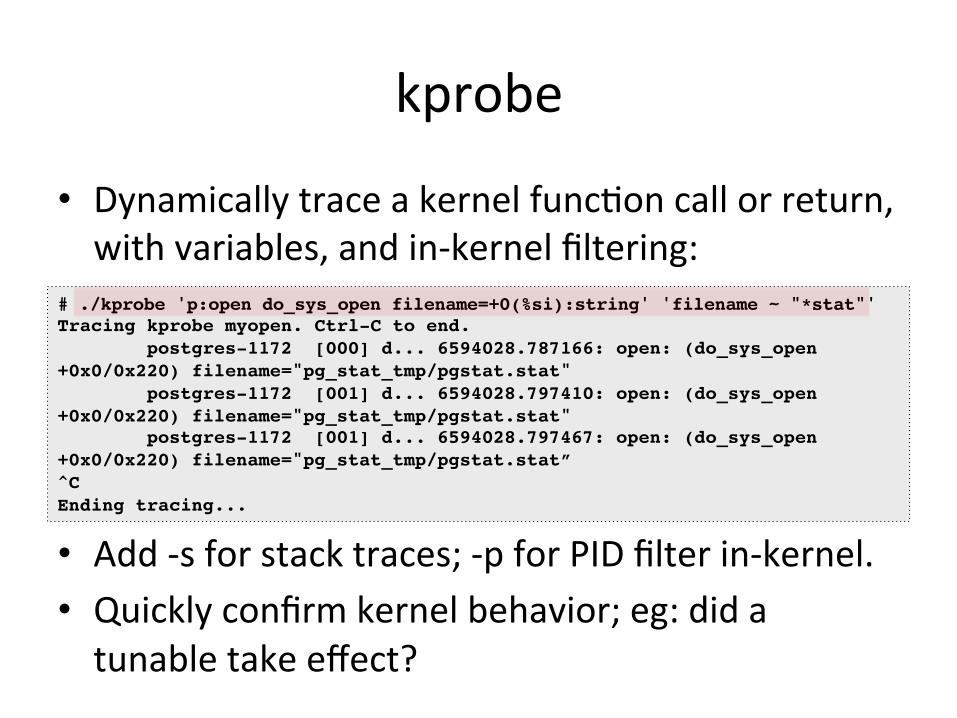
kprobe
• Dynamically trace a kernel funcVon call or return, with variables, and in-‐kernel filtering:
# ./kprobe 'p:open do_sys_open filename=+0(%si):string' 'filename ~ "*stat"'!Tracing kprobe myopen. Ctrl-C to end.! postgres-1172 [000] d... 6594028.787166: open: (do_sys_open+0x0/0x220) filename="pg_stat_tmp/pgstat.stat"! postgres-1172 [001] d... 6594028.797410: open: (do_sys_open+0x0/0x220) filename="pg_stat_tmp/pgstat.stat"! postgres-1172 [001] d... 6594028.797467: open: (do_sys_open+0x0/0x220) filename="pg_stat_tmp/pgstat.stat”!^C!Ending tracing...!
• Add -‐s for stack traces; -‐p for PID filter in-‐kernel. • Quickly confirm kernel behavior; eg: did a tunable take effect?
Imagine Linux with Tracing
• These tools aren’t using dtrace4linux, SystemTap, ktap, or any other add-‐on tracer
• These tools use exis.ng Linux capabili.es – No extra kernel bits, not even kernel debuginfo – Just Linux’s built-‐in 8race profiler – Demoed on Linux 3.2
• Solving real issues now

crace
• Added by Steven Rostedt and others since 2.6.27 • Already enabled on our servers (3.2+) – CONFIG_FTRACE, CONFIG_FUNCTION_PROFILER, … – Use directly via /sys/kernel/debug/tracing
• My front-‐end tools to aid usage – hkps://github.com/brendangregg/perf-‐tools – Unsupported hacks: see WARNINGs
• Also see the trace-‐cmd front-‐end, as well as perf • lwn.net today: “Ftrace: The Hidden Light Switch”

My perf-‐tools (so far…)
Tracing Summary
• crace • perf_events • eBPF • SystemTap • ktap • LTTng • dtrace4linux • sysdig
perf_events
• aka “perf” command • In Linux. Add from linux-‐tools-‐common. • Powerful mulV-‐tool and profiler – interval sampling, CPU performance counter events – user and kernel dynamic tracing – kernel line tracing and local variables (debuginfo) – kernel filtering, and in-‐kernel counts (perf stat)
• Not very programmable, yet – limited kernel summaries. May improve with eBPF.

perf_events Example # perf record –e skb:consume_skb -ag!^C[ perf record: Woken up 1 times to write data ]![ perf record: Captured and wrote 0.065 MB perf.data (~2851 samples) ]!# perf report![...]! 74.42% swapper [kernel.kallsyms] [k] consume_skb! |! --- consume_skb! arp_process! arp_rcv! __netif_receive_skb_core! __netif_receive_skb! netif_receive_skb! virtnet_poll! net_rx_action! __do_softirq! irq_exit! do_IRQ! ret_from_intr! default_idle! cpu_idle! start_secondary![…]!
Summarizing stack traces for a tracepoint perf_events can do many things – hard to pick just one example

eBPF
• Extended BPF: programs on tracepoints – High performance filtering: JIT – In-‐kernel summaries: maps
• Linux in 3.18? Enhance perf_events/crace/…? # ./bitesize 1!writing bpf-5 -> /sys/kernel/debug/tracing/events/block/block_rq_complete/filter!!I/O sizes:! Kbytes : Count! 4 -> 7 : 131! 8 -> 15 : 32! 16 -> 31 : 1! 32 -> 63 : 46! 64 -> 127 : 0! 128 -> 255 : 15![…]!
in-‐kernel summary

SystemTap
• Fully programmable, fully featured • Compiles tracing programs into kernel modules – Needs a compiler, and takes Vme
• “Works great on Red Hat” – I keep trying on other distros and have hit trouble in the past; make sure you are on the latest version.
– I’m liking it a bit more acer finding ways to use it without kernel debuginfo (a difficult requirement in our environment). Work in progress.
• Ever be mainline?
ktap
• Sampling, staVc & dynamic tracing • Lightweight, simple. Uses bytecode. • Suited for embedded devices • Development appears suspended acer suggesVons to integrate with eBPF (which itself is in development)
• ktap + eBPF would be awesome: easy, lightweight, fast. Likely?

sysdig
• sysdig: InnovaVve new tracer. Simple expressions:
• Replacement for strace? (or “perf trace” will) • Programmable “chisels”. Eg, one of mine:
• Currently syscalls and user-‐level processing only. It is
opVmized, but I’m not sure it can be enough for kernel tracing
# sysdig -c fileslower 1!TIME PROCESS TYPE LAT(ms) FILE!2014-04-13 20:40:43.973 cksum read 2 /mnt/partial.0.0!2014-04-13 20:40:44.187 cksum read 1 /mnt/partial.0.0!2014-04-13 20:40:44.689 cksum read 2 /mnt/partial.0.0![…]!
sysdig fd.type=file and evt.failed=true!sysdig evt.type=open and fd.name contains /etc!sysdig -p"%proc.name %fd.name" "evt.type=accept and proc.name!=httpd”!
Present & Future
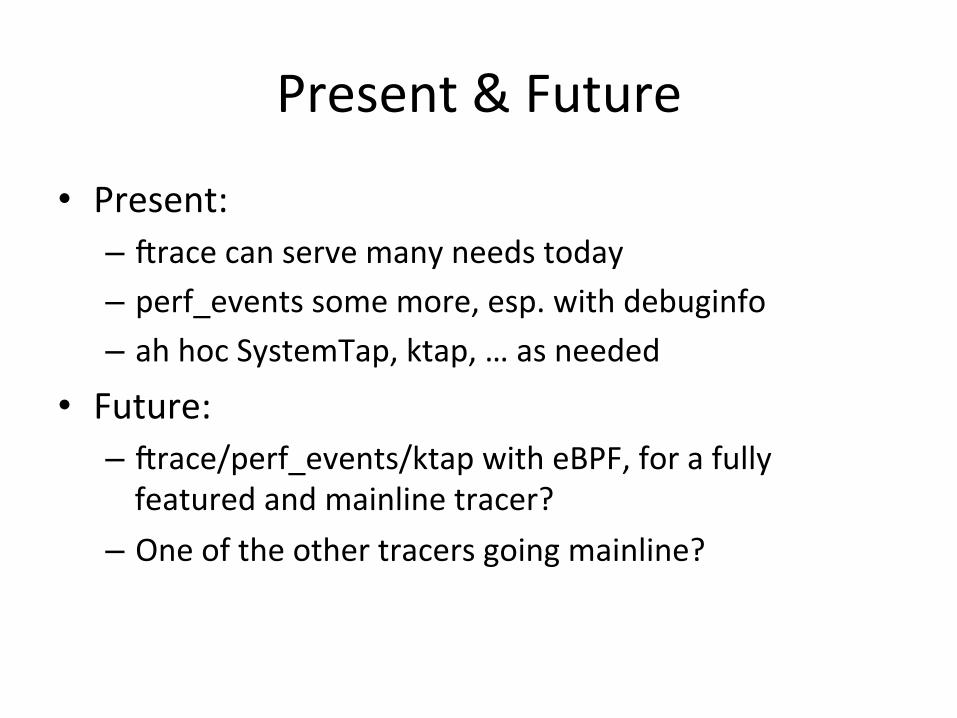
• Present: – crace can serve many needs today – perf_events some more, esp. with debuginfo – ah hoc SystemTap, ktap, … as needed
• Future: – crace/perf_events/ktap with eBPF, for a fully featured and mainline tracer?
– One of the other tracers going mainline?
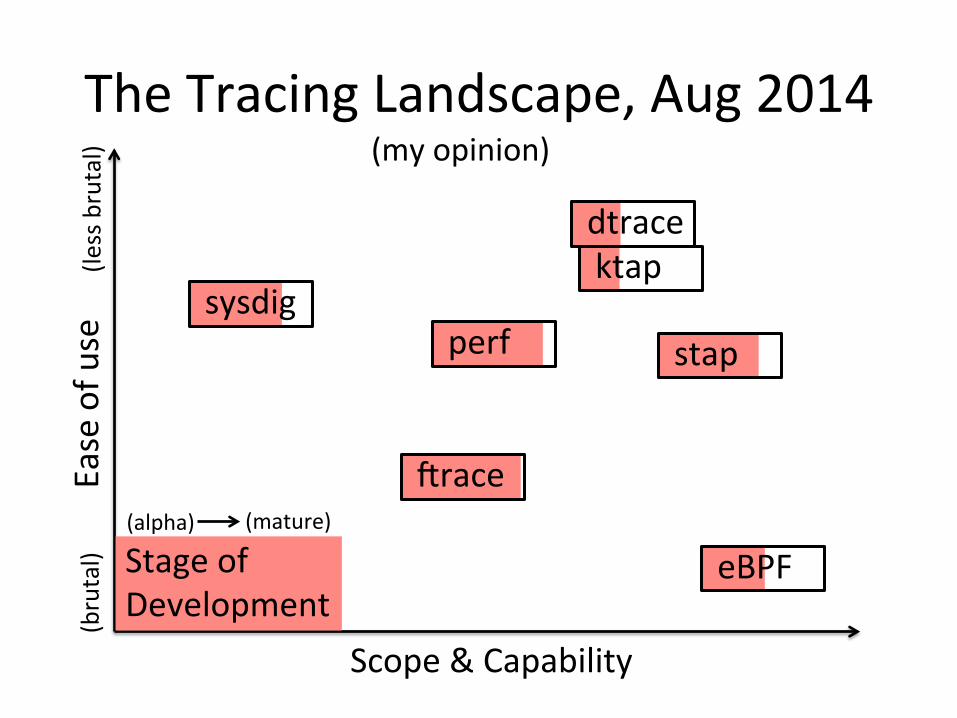
The Tracing Landscape, Aug 2014
Scope & Capability
Ease of u
se sysdig
perf
crace
eBPF
ktap
stap
Stage of Development
(my opinion)
dtrace
(brutal)
(less brutal)
(alpha) (mature)

In Summary

In Summary…
• Plus diagrams for benchmarking, tuning, tracing • Try to start with the quesVons (methodology), to help guide your use of the tools
• I hopefully turned some unknown unknowns into known unknowns
References & Links – Systems Performance: Enterprise and the Cloud, PrenVce Hall, 2014 – hkp://www.brendangregg.com/linuxperf.html – nicstat: hkp://sourceforge.net/projects/nicstat/ – Vptop: hkp://Vptop.gforge.inria.fr/ • Tiptop: Hardware Performance Counters for the Masses, Erven
Rohou, Inria Research Report 7789, Nov 2011. – crace & perf-‐tools • hkps://github.com/brendangregg/perf-‐tools • hkp://lwn.net/ArVcles/608497/
– eBPF: hkp://lwn.net/ArVcles/603983/ – ktap: hkp://www.ktap.org/ – SystemTap: hkps://sourceware.org/systemtap/ – sysdig: hkp://www.sysdig.org/ – hkp://www.slideshare.net/brendangregg/linux-‐performance-‐analysis-‐and-‐tools – Tux by Larry Ewing; Linux® is the registered trademark of Linus Torvalds
in the U.S. and other countries.

Thanks
• QuesVons? • hkp://slideshare.net/brendangregg • hkp://www.brendangregg.com • [email protected] • @brendangregg