linux® application tuning guide - risc
TRANSCRIPT

Linux® Application Tuning Guide
007–4639–008

COPYRIGHT© 2003, 2004, 2005, 2006, 2007, SGI. All rights reserved; provided portions may be copyright in third parties, as indicated elsewhereherein. No permission is granted to copy, distribute, or create derivative works from the contents of this electronic documentation inany manner, in whole or in part, without the prior written permission of SGI.
LIMITED RIGHTS LEGENDThe software described in this document is "commercial computer software" provided with restricted rights (except as to includedopen/free source) as specified in the FAR 52.227-19 and/or the DFAR 227.7202, or successive sections. Use beyond license provisions isa violation of worldwide intellectual property laws, treaties and conventions. This document is provided with limited rights as definedin 52.227-14.
TRADEMARKS AND ATTRIBUTIONSSGI, the SGI logo, Altix, IRIX, and XFS are registered trademarks and NUMAflex, OpenMP, Performance Co-Pilot, SGI Linux, SGIProPack, and SHMEM are trademarks of SGI, in the United States and/or other countries worldwide.
Cray is a registered trademark of Cray, Inc. Dinkumware is a registered trademark of Dinkumware, Ltd. Intel, GuideView, Itanium,KAP/Pro Toolset, and VTune are trademarks or registered trademarks of Intel Corporation, in the United States and other countries.Java is a registered trademark of Sun Microsystems, Inc., in the United States and other countries. Linux is a registered trademark ofLinus Torvalds in several countries. Red Hat is a registered trademark of Red Hat, Inc. PostScript is a trademark of Adobe SystemsIncorporated. TotalView is a registered trademark of Etnus, LLC. Windows is a registered trademark of Microsoft Corporation in theUnited States and/or other countries. All other trademarks are the property of their respective owners.

New Features in This Manual
This rewrite of the Linux Application Tuning Guide supports the SGI ProPack 5 forLinux Service Pack 3 operating system.
Major Documentation ChangesAdded the following:
• Information about the taskset(1) command in "taskset Command" on page 45
• A new section called "OpenMP Nested Parallelism" on page 76
• A new chapter about flexible file I/O (FFIO) in Chapter 7, "Flexible File I/O" onpage 87
• A new chapter about I/O tuning information in Chapter 8, "I/O Tuning" on page95
007–4639–008 iii


Record of Revision
Version Description
001 October 2003Original publication.
002 May 2004Updated to support the SGI ProPack 3 for Linux release.
003 August 2004Updated to support the SGI ProPack 3 for Linux Service Pack 1release.
004 January 2005Updated to support the SGI ProPack 3 for Linux Service Pack 3release.
005 August 2005Updated to support the SGI ProPack 4 for Linux Service Pack 2release.
006 April 2007Updated to support the SGI ProPack 5 for Linux Service Pack 1release.
007 June 2007Updated to support the SGI ProPack 5 for Linux Service Pack 2release.
008 October 2007Updated to support the SGI ProPack 5 for Linux Service Pack 3release.
007–4639–008 v


Contents
About This Document . . . . . . . . . . . . . . . . . . . xiii
Related Publications . . . . . . . . . . . . . . . . . . . . . . xiii
Related Operating System Documentation . . . . . . . . . . . . . . . xiii
Hardware Reference Manuals . . . . . . . . . . . . . . . . . . . xiv
Application Guides . . . . . . . . . . . . . . . . . . . . . . xv
Conventions . . . . . . . . . . . . . . . . . . . . . . . . . xvi
Obtaining Publications . . . . . . . . . . . . . . . . . . . . . . xvi
Reader Comments . . . . . . . . . . . . . . . . . . . . . . . xvii
1. System Overview . . . . . . . . . . . . . . . . . . . . 1
Scalable Computing . . . . . . . . . . . . . . . . . . . . . . 1
An Overview of Altix Architecture . . . . . . . . . . . . . . . . . . 1
Altix 3000 Series Systems . . . . . . . . . . . . . . . . . . . . 2
Altix 4000 Series Systems . . . . . . . . . . . . . . . . . . . . 3
The Basics of Memory Management . . . . . . . . . . . . . . . . . 5
2. The SGI Compiling Environment . . . . . . . . . . . . . . 7
Compiler Overview . . . . . . . . . . . . . . . . . . . . . . . 7
Modules . . . . . . . . . . . . . . . . . . . . . . . . . . 8
Library Overview . . . . . . . . . . . . . . . . . . . . . . . 9
Static Libraries . . . . . . . . . . . . . . . . . . . . . . . 9
Dynamic Libraries . . . . . . . . . . . . . . . . . . . . . . 9
C/C++ Libraries . . . . . . . . . . . . . . . . . . . . . . . 9
SHMEM Message Passing Libraries . . . . . . . . . . . . . . . . . 10
Other Compiling Environment Features . . . . . . . . . . . . . . . . 11
007–4639–008 vii

Contents
3. Performance Analysis and Debugging . . . . . . . . . . . . . 13
Determining System Configuration . . . . . . . . . . . . . . . . . . 13
Sources of Performance Problems . . . . . . . . . . . . . . . . . . 14
Profiling with pfmon . . . . . . . . . . . . . . . . . . . . . 15
Profiling with profile.pl . . . . . . . . . . . . . . . . . . . 15
profile.pl with MPI programs . . . . . . . . . . . . . . . . . 16
Using histx . . . . . . . . . . . . . . . . . . . . . . . . 16
histx Data Collection . . . . . . . . . . . . . . . . . . . . 16
histx Filters . . . . . . . . . . . . . . . . . . . . . . . 19
histx Event Sources and Types of Sampling . . . . . . . . . . . . . 19
Using VTune for Remote Sampling . . . . . . . . . . . . . . . . . . 20
Using GuideView . . . . . . . . . . . . . . . . . . . . . . . 20
Other Performance Tools . . . . . . . . . . . . . . . . . . . . . 21
Debugging Tools . . . . . . . . . . . . . . . . . . . . . . . 22
Using ddd . . . . . . . . . . . . . . . . . . . . . . . . . 23
4. Monitoring Tools . . . . . . . . . . . . . . . . . . . . 27
System Monitoring Tools . . . . . . . . . . . . . . . . . . . . . 27
Hardware Inventory and Usage Commands . . . . . . . . . . . . . . 27
hinv(1) Command . . . . . . . . . . . . . . . . . . . . . 28
topology(1) Command . . . . . . . . . . . . . . . . . . . 28
gtopology(1) Command . . . . . . . . . . . . . . . . . . . 30
Performance Co-Pilot Monitoring Tools . . . . . . . . . . . . . . . . 32
pmshub(1) Command . . . . . . . . . . . . . . . . . . . . 33
shubstats(1) Command . . . . . . . . . . . . . . . . . . . 33
linkstat(1) Command . . . . . . . . . . . . . . . . . . . 34
Other Performance Co-Pilot Monitoring Tools . . . . . . . . . . . . . 34
viii 007–4639–008

Linux®
Application Tuning Guide
System Usage Commands . . . . . . . . . . . . . . . . . . . . 36
5. Data Placement Tools . . . . . . . . . . . . . . . . . . . 43
Data Placement Tools Overview . . . . . . . . . . . . . . . . . . . 43
taskset Command . . . . . . . . . . . . . . . . . . . . . . 45
runon Command . . . . . . . . . . . . . . . . . . . . . . . 48
dplace Command . . . . . . . . . . . . . . . . . . . . . . . 48
Using the dplace Command . . . . . . . . . . . . . . . . . . . 49
dplace for Compute Thread Placement Troubleshooting Case Study . . . . . . 54
dlook Command . . . . . . . . . . . . . . . . . . . . . . . 56
Using the dlook Command . . . . . . . . . . . . . . . . . . . 56
Installing NUMA Tools . . . . . . . . . . . . . . . . . . . . . 63
6. Performance Tuning . . . . . . . . . . . . . . . . . . . 65
Single Processor Code Tuning . . . . . . . . . . . . . . . . . . . 65
Getting the Correct Results . . . . . . . . . . . . . . . . . . . 66
Managing Heap Corruption Problems . . . . . . . . . . . . . . . . 66
Using Tuned Code . . . . . . . . . . . . . . . . . . . . . . 68
Determining Tuning Needs . . . . . . . . . . . . . . . . . . . 68
Using Compiler Options Where Possible . . . . . . . . . . . . . . . 69
Tuning the Cache Performance . . . . . . . . . . . . . . . . . . 70
Managing Memory . . . . . . . . . . . . . . . . . . . . . . 72
Multiprocessor Code Tuning . . . . . . . . . . . . . . . . . . . . 72
Data Decomposition . . . . . . . . . . . . . . . . . . . . . . 73
Parallelizing Your Code . . . . . . . . . . . . . . . . . . . . 74
Use MPT . . . . . . . . . . . . . . . . . . . . . . . . 75
Use XPMEM DAPL Library with MPI . . . . . . . . . . . . . . . 75
Use OpenMP . . . . . . . . . . . . . . . . . . . . . . . 76
007–4639–008 ix

Contents
OpenMP Nested Parallelism . . . . . . . . . . . . . . . . . . 76
Use Compiler Options . . . . . . . . . . . . . . . . . . . . 77
Identifying Parallel Opportunities in Existing Code . . . . . . . . . . . 77
Fixing False Sharing . . . . . . . . . . . . . . . . . . . . . . 78
Using dplace and runon . . . . . . . . . . . . . . . . . . . . 79
Environment Variables for Performance Tuning . . . . . . . . . . . . . 79
Understanding Parallel Speedup and Amdahl’s Law . . . . . . . . . . . . 80
Adding CPUs to Shorten Execution Time . . . . . . . . . . . . . . . 80
Understanding Parallel Speedup . . . . . . . . . . . . . . . . . . 81
Understanding Superlinear Speedup . . . . . . . . . . . . . . . . 82
Understanding Amdahl’s Law . . . . . . . . . . . . . . . . . . 82
Calculating the Parallel Fraction of a Program . . . . . . . . . . . . . . 83
Predicting Execution Time with n CPUs . . . . . . . . . . . . . . . 84
Floating-point Programs Performance . . . . . . . . . . . . . . . . . 84
7. Flexible File I/O . . . . . . . . . . . . . . . . . . . . . 87
FFIO Operation . . . . . . . . . . . . . . . . . . . . . . . . 87
Environment Variables . . . . . . . . . . . . . . . . . . . . . . 88
Simple Examples . . . . . . . . . . . . . . . . . . . . . . . 89
Multithreading Considerations . . . . . . . . . . . . . . . . . . . 92
Application Examples . . . . . . . . . . . . . . . . . . . . . . 93
Event Tracing . . . . . . . . . . . . . . . . . . . . . . . . 94
System Information and Issues . . . . . . . . . . . . . . . . . . . 94
8. I/O Tuning . . . . . . . . . . . . . . . . . . . . . . . 95
Layout of Filesystems and XVM for Multiple RAIDs . . . . . . . . . . . . 95
9. Suggested Shortcuts and Workarounds . . . . . . . . . . . . 97
x 007–4639–008

Linux®
Application Tuning Guide
Determining Process Placement . . . . . . . . . . . . . . . . . . . 97
Example Using pthreads . . . . . . . . . . . . . . . . . . . . 98
Example Using OpenMP . . . . . . . . . . . . . . . . . . . . 100
Combination Example (MPI and OpenMP) . . . . . . . . . . . . . . . 101
Resetting System Limits . . . . . . . . . . . . . . . . . . . . . 104
Resetting the File Limit Resource Default . . . . . . . . . . . . . . . 105
Resetting the Default Stack Size . . . . . . . . . . . . . . . . . . 106
Resetting Virtual Memory Size . . . . . . . . . . . . . . . . . . 107
Linux Shared Memory Accounting . . . . . . . . . . . . . . . . . . 108
Index . . . . . . . . . . . . . . . . . . . . . . . . . . 111
007–4639–008 xi


About This Document
This publication provides information about tuning application programs on the SGIAltix 3000 and Altix 4000 families of servers and superclusters running the Linuxoperating system. Application programs includes Fortran and C programs writtenwith the Intel-provided compilers on SGI Linux systems.
This document does not include information about configuring or tuning your system.For details about those topics, see the Linux Configuration and Operations Guide.
This guide is written for experienced programmers, familiar with Linux commandsand with either the C or Fortran programming languages. The focus in this documentis on achieving the highest possible performance by exploiting the features of yourSGI Altix system. The material assumes that you know the basics of softwareengineering and that you are familiar with standard methods and data structures. Ifyou are new to programming or software design, this guide will not be of use.
Related PublicationsThe following publications provide information that can supplement the informationin this document.
Related Operating System Documentation
The following documents provide information about IRIX and Linux implementationson SGI systems:
• Linux Installation and Getting Started
• Linux Configuration and Operations Guide
Provides information on how to perform system configuration and operations forSGI ProPack servers.
• Linux Resource Administration Guide
Provides a reference for people who manage the operation of SGI ProPack serversand contains information needed in the administration of various system resourcemanagement features such as Comprehensive System Accounting (CSA), ArrayServices, CPU memory sets and scheduling, and the Cpuset System.
007–4639–008 xiii

About This Document
• SGI ProPack for Linux Start Here
Provides information about the SGI ProPack 3 for Linux Service Pack x release.
• SGI ProPack 4 for Linux Start Here
Provides information about the SGI ProPack 4 for Linux Service Pack x release.
• SGI ProPack 5 for Linux Service Pack 2 Start Here
Provides information about the SGI ProPack 5 for Linux Service Pack x release.
• Message Passing Toolkit (MPT) User’s Guide
Describes industry-standard message passing protocol optimized for SGIcomputers.
See the release notes which are shipped with your system for a list of otherdocuments that are available. All books are available on the Tech Pubs Library athttp://docs.sgi.com.
Release notes for Linux systems are stored in/usr/share/doc/sgi-scsl-versionnumber/README.relnotes.
Hardware Reference Manuals
The following documents provide information about Altix system hardware.
• SGI Altix 330 System User’s Guide
Provides an overview of the Altix 330 system components, and it describes how toset up and operate this system.
• SGI Altix 350 System User’s Guide
Provides an overview of the Altix 350 system components, and it describes how toset up and operate this system.
• SGI Altix 3000 User’s Guide
Provides an overview of the architecture and describes the major components ofthe SGI Altix 3000 family of servers and superclusters. It also describes thestandard procedures for powering up and powering down the system, providesbasic troubleshooting information, and includes important safety and regulatoryspecifications.
xiv 007–4639–008

Linux®
Application Tuning Guide
• SGI Altix 3700 Bx2 User’s Guide
This guide provides an overview of the architecture and descriptions of the majorcomponents that compose the SGI Altix 3700 Bx2 family of servers. It also providesthe standard procedures for powering on and powering off the system, basictroubleshooting information, and important safety and regulatory specifications.
• SGI Altix 4700 User’s Guide
Provides an overview of the architecture and describes the major components ofthe SGI Altix 4700 family of servers. It also describes the standard procedures forpowering up and powering down the system, provides basic troubleshootinginformation, and includes important safety and regulatory specifications.
• Silicon Graphics Prism Visualization System User’s Guide
Provides an overview of the Silicon Graphics Prism Visualization Systemcomponents, and it describes how to set up and operate this system.
• Silicon Graphics Prism Deskside Visualization System User’s Guide
Provides an overview of the Silicon Graphics Prism Deskside system components,and it describes how to set up and operate this system.
• Reconfigurable Application-Specific Computing User’s Guide
Provides information about the SGI reconfigurable application-specific softwarecomputing (RASC) program that delivers scalable, configurable computingelements for the SGI Altix family of servers and superclusters.
Application Guides
The following documentation is provided for the compilers and performance toolswhich run on SGI Linux systems:
• http://sources.redhat.com/gdb/onlinedocs/gdb_toc.html
• http://intel.com/software/perflib; documentation for Intel compiler products canbe downloaded from this website.
• http://developer.intel.com/software/products/vtune/vtune61/index.htm/
• Information about the OpenMP Standard can be found athttp://www.openmp.org/specs.
007–4639–008 xv

About This Document
ConventionsThe following conventions are used in this documentation:
[ ] Brackets enclose optional portions of a command ordirective line.
command This fixed-space font denotes literal items such ascommands, files, routines, path names, signals,messages, and programming language structures.
... Ellipses indicate that a preceding element can berepeated.
user input This bold, fixed-space font denotes literal items that theuser enters in interactive sessions. (Output is shown innonbold, fixed-space font.)
variable Italic typeface denotes variable entries and words orconcepts being defined.
manpage(x) Man page section identifiers appear in parentheses afterman page names.
Obtaining PublicationsYou can obtain SGI documentation as follows:
• See the SGI Technical Publications Library at http://docs.sgi.com. Various formatsare available. This library contains the most recent and most comprehensive set ofonline books, release notes, man pages, and other information.
• If it is installed on your SGI system, you can use InfoSearch, an online tool thatprovides a more limited set of online books, release notes, and man pages. Withan IRIX system, enter infosearch at a command line or select Help >InfoSearch from the Toolchest.
• On IRIX systems, you can view release notes by entering either grelnotes orrelnotes at a command line.
• On Linux systems, you can view release notes on your system by accessing theREADME.txt file for the product. This is usually located in the/usr/share/doc/productname directory, although file locations may vary.
• You can view man pages by typing man title at a command line.
xvi 007–4639–008

Linux®
Application Tuning Guide
Reader CommentsIf you have comments about the technical accuracy, content, or organization of thispublication, contact SGI. Be sure to include the title and document number of thepublication with your comments. (Online, the document number is located in thefront matter of the publication. In printed publications, the document number islocated at the bottom of each page.)
You can contact SGI in any of the following ways:
• Send e-mail to the following address:
• Contact your customer service representative and ask that an incident be filed inthe SGI incident tracking system.
• Send mail to the following address:
SGITechnical Publications1140 East Arques AvenueSunnyvale, CA 94085–4602
SGI values your comments and will respond to them promptly.
007–4639–008 xvii


Chapter 1
System Overview
Tuning an application involves making your program run its fastest on the availablehardware. The first step is to make your program run as efficiently as possible on asingle processor system and then consider ways to use parallel processing.
Application tuning is different from system tuning, which involves topics such asdisk partitioning, optimizing memory management, and configuration of the system.The Linux Configuration and Operations Guide discusses those topics in detail.
This chapter provides an overview of concepts involved in working in parallelcomputing environments.
Scalable ComputingScalability is computational power that can grow over a large number of CPUs.Scalability depends on the time between nodes on the system. Latency is the time tosend the first byte between nodes.
A Symmetric Multiprocessor (SMP) is a parallel programming environment in whichall processors have equally fast (symmetric) access to memory. These types of systemsare easy to assemble and have limited scalability due to memory access times.
Another parallel environment is that of arrays, or clusters. Any networked computercan participate in a cluster. These are highly scalable, easy to assemble, but are oftenhard to use. There is no shared memory and there are frequently long latency times.
Massively Parallel Processors (MPPs) have a distributed memory and can scale tothousands of processors; they have large memories and large local memorybandwidth.
Scalable Symmetric Multiprocessors (S2MPs), as in the ccNUMA environment,combine qualities of SMPs and MPPs. They are logically programmable like an SMPand have MPP-like scability.
An Overview of Altix ArchitectureThis section provides a brief overview of the SGI Altix 3000 and 4000 series systems.
007–4639–008 1

1: System Overview
Altix 3000 Series Systems
In order to optimize your application code, some understanding of the SGI Altixarchitecture is needed. This section provides a broad overview of the systemarchitecture.
The SGI Altix 3000 family of servers and superclusters can have as many as 256processors and 2048 gigabytes of memory. It uses Intel’s Itanium 2 processors anduses nonuniform memory access (NUMA) in SGI’s NUMAflex global shared-memoryarchitecture. An SGI Altix 350 system can have as many as 16 processors and 96gigabytes of memory.
The NUMAflex design permits modular packaging of CPU, memory, I/O, graphics,and storage into components known as bricks. The bricks can then be combined andconfigured into different systems, based on customer needs.
On Altix 3700 systems, two Itanium processors share a common frontside bus andmemory. This constitutes a node in the NUMA architecture. Access to other memory(on another node) by these processors has a higher latency, and slightly differentbandwidth characteristics. Two such nodes are packaged together in each computerbrick. For a detailed overview, see the SGI Altix 3000 User’s Guide.
On an SGI Altix 3700 Bx2 system, the CR-brick contains the processors (8 processorsper CR-brick) and two internal high-speed routers. The routers connect to othersystem bricks via NUMAlink cables and expand the compute or memory capacity ofthe Altix 3700 Bx2. For a detailed overview, see the SGI Altix 3700 Bx2 User’s Guide.
All Altix 350 systems contain at least one base compute module that contains thefollowing components:
• One or two Intel Itanium 2 processors; each processor has integrated L1, L2, andL3 caches
• Up to 24 GB of local memory
• Four PCI/PCI-X slots
• One IO9 PCI card that comes factory-installed in the lowermost PCI/PCI-X slotFor a detailed overview, see the SGI Altix 350 System User’s Guide.
The system software consists of a standard Linux distribution (Red Hat) andSGI ProPack, which is an overlay providing additional features such as optimizedlibraries and enhanced kernel support. See Chapter 2, "The SGI CompilingEnvironment" on page 7, for details about the compilers and libraries included withthe distribution.
2 007–4639–008

Linux®
Application Tuning Guide
Altix 4000 Series Systems
In the new SGI Altix 4000 series systems, functional blades - interchangeablecompute, memory, I/O, and special purpose blades in an innovativeblade-to-NUMAlink architecture are the basic building blocks for the system.Compute blades with a bandwidth configuration have one processor socket per blade.Compute blades with a density configuration have two processor sockets per blade.Cost-effective compute density is one advantage of this compact blade packaging.
The Altix 4000 series is a family of multiprocessor distributed shared memory (DSM)computer systems that currently scales from 8 to 512 CPU sockets (up to 1,024processor cores) and can accommodate up to 6TB of globally shared memory in asingle system while delivering a teraflop of performance in a small-footprint rack.The SGI Altix 450 currently scales from 2 to 76 cores as a cache-coherent singlesystem image (SSI). In a DSM system, each processor board contains memory that itshares with the other processors in the system. Because the DSM system is modular,it combines the advantages of low entry-level cost with global scalability inprocessors, memory, and I/O. You can install and operate the Altix 4700 series systemin a rack in your lab or server room. Each 42U SGI rack holds from one to four 10Uhigh enclosures that support up to ten processor and I/O sub modules known as"blades." These blades are single printed circuit boards (PCBs) with ASICS,processors, and memory components mounted on a mechanical carrier. The bladesslide directly in and out of the Altix 4700 1RU enclosures. Each individual rack unit(IRU) is 10U in height (see Figure 1-1 on page 4).
007–4639–008 3

1: System Overview
Blade
Rack(Contains 4 IRUs)
Bla
de s
lot 5
Bla
de s
lot 6
Bla
de s
lot 7
Bla
de s
lot 8
Bla
de s
lot 9
Bla
de s
lot 0
Bla
de s
lot 1
Bla
de s
lot 2
Bla
de s
lot 3
Bla
de s
lot 4
Fill
er p
anel
Fill
er p
anel
Individual Rack Unit (IRU)(Contains 10 blades)
Figure 1-1 Altix 4700 Blade, Individual Rack Unit, and Rack
For more information on this system, see the SGI Altix 4700 System User’s Guideavailable on the SGI Technical Publications Library. It provides a detailed overview ofthe SGI Altix 4700 system components and it describes how to set up and operate thesystem. For an overview of the new SGI Altix 450 system, see Chapter 3, "SystemOverview" in the SGI Altix 450 System User’s Guide.
4 007–4639–008

Linux®
Application Tuning Guide
The Basics of Memory ManagementVirtual memory (VM), also known as virtual addressing, is used to divide a system’srelatively small amount of physical memory among the potentially larger amount oflogical processes in a program. It does this by dividing physical memory into pages,and then allocating pages to processes as the pages are needed.
A page is the smallest unit of system memory allocation. Pages are added to aprocess when either a validity fault occurs or an allocation request is issued. Processsize is measured in pages and two sizes are associated with every process: the totalsize and the resident set size (RSS). The number of pages being used in a process andthe process size can be determined by using either the ps(1) or the top(1) command.
Swap space is used for temporarily saving parts of a program when there is notenough physical memory. The swap space may be on the system drive, on anoptional drive, or in a filesystem. To avoid swapping, try not to overburden memory.Lack of adequate swap space limits the number and the size of applications that canrun simultaneously on the system, and it can limit system performance.
Linux is a demand paging operating system, using a least-recently-used pagingalgorithm. On a validity fault, pages are mapped into physical memory when firstreferenced and pages are brought back into memory if swapped out.
007–4639–008 5


Chapter 2
The SGI Compiling Environment
This chapter provides an overview of the SGI compiling environment on the SGIAltix family of servers and superclusters and covers the following topics:
• "Compiler Overview" on page 7
• "Modules" on page 8
• "Library Overview" on page 9
• "Other Compiling Environment Features" on page 11
The remainder of this book provides more detailed examples of the use of the SGIcompiling environment elements.
Compiler OverviewThe Intel Fortran and C/C++ compilers are provided with the SGI Altix distribution.The Fortran compiler supports OpenMP 2.0 and the C/C++ compiler is compatiblewith gcc and the C99 standard.
In addition, the GNU Fortran and C compilers are available on Altix systems.
The following is the general form of the compiler command line (note that theFortran command is used in this example):
% ifort [options] filename.extension
An appropriate filename extension is required for each compiler, according to theprogramming language used (Fortran, C, C++, or FORTRAN 77).
Some common compiler options are:
• -o filename: renames the output to filename.
• -g: produces additional symbol information for debugging.
• -O[level]: invokes the compiler at different optimization levels, from 0 to 3.
• -ldirectory_name: looks for include files in directory_name.
• -c: compiles without invoking the linker; this options produces an a.o file only.
007–4639–008 7

2: The SGI Compiling Environment
Many processors do not handle denormalized arithmetic (for gradual underflow) inhardware. The support of gradual underflow is implementation-dependent. Use the-ftz option with the Intel compilers to force the flushing of denormalized results tozero.
Note that frequent gradual underflow arithmetic in a program causes the program torun very slowly, consuming large amounts of system time (this can be determinedwith the time command). In this case, it is best to trace the source of the underflowsand fix the code; gradual underflow is often a source of reduced accuracy anyway..prctl(1) allows you to query or control certain process behavior. In a program,prctl tracks where floating point errors occur.
ModulesA module is a user interface that provides for the dynamic modification of a user’senvironment. By changing the module a user does not have to change environmentvariables in order to access the correct compilers, loader, libraries, and utilities.
Modules can be used in the SGI compiling environment to customize theenvironment. If the use of modules is not available on your system, its installationand use is highly recommended.
To view which modules are available on your system, use the following command(for any shell environment):
% module avail
To load modules into your environment (for any shell), use the following commands:
% module load intel-compilers-latest mpt-1.7.1rel
% module load scsl-1.4.1-1
Note: The above commands are for example use only; the actual release numbersmay vary depending on the version of the software you are using. See the releasenotes that are distributed with your system for the pertinent release version numbers.
For details about using modules, see the module man page (you must have themodule man page loaded).
8 007–4639–008

Linux®
Application Tuning Guide
Library OverviewLibraries are files that contain one or more object (.o) files. Libraries are used tosimplify local software development by hiding compilation details. Libraries aresometimes also called archives.
The SGI compiling environment contains several types of libraries; an overview abouteach library is provided in this subsection.
Static Libraries
Static libraries are used when calls to the library components are satisfied at link timeby copying text from the library into the executable. To create a static library, use thear(1), or an archiver command.
To use a static library, include the library name on the compiler’s command line. Ifthe library is not in a standard library directory, be sure to use the -L option tospecify the directory and the -l option to specify the library filename.
To build an appplication to have all static versions of standard libraries in theapplication binary, use the -static option on the compiler command line.
Dynamic Libraries
Dynamic libraries are linked into the program at run time and when loaded intomemory can be accessed by multiple programs. Dynamic libraries are formed bycreating a Dynamic Shared Object (DSO).
Use the link editor command (ld(1)) to create a dynamic library from a series ofobject files or to create a DSO from an existing static library.
To use a dynamic library, include the library on the compiler’s command line. If thedynamic library is not in one of the standard library directories, use the -rpathcompiler option during linking. You must also set the LD_LIBRARY_PATHenvironment variable to the directory where the library is stored before running theexecutable.
C/C++ Libraries
The following C/C++ libraries are provided with the Intel compiler:
007–4639–008 9
2: The SGI Compiling Environment
• libguide.a, libguide.so: for support of OpenMP-based programs.
• libsvml.a: short vector math library
• libirc.a: Intel’s support for Profile-Guided Optimizations (PGO) and CPUdispatch
• libimf.a, libimf.so: Intel’s math library
• libcprts.a, libcprts.so: Dinkumware C++ library
• libunwind.a, libunwind.so: Unwinder library
• libcxa.a, libcxa.so: Intel’s runtime support for C++ features
SHMEM Message Passing Libraries
The Shared Memory Access Library (libsma) is part of the Message Passing Toolkit(MPT) product on SGI Altix systems. The SHMEM programming model consists oflibrary routines that provide low-latency, high-bandwidth communication for use inhighly parallelized, scalable programs. The routines in the SHMEM applicationprogramming interface (API) provide a programming model for exchanging databetween cooperating parallel processes. The resulting programs are similar in style toMessage Passing Interface (MPI) programs. The SHMEM API can be used eitheralone or in combination with MPI routines in the same parallel program.
A SHMEM program is SPMD (single program, multiple data) in style. The SHMEMprocesses, called processing elements or PEs, all start at the same time, and they allrun the same program. Usually the PEs perform computation on their ownsubdomains of the larger problem, and periodically communicate with other PEs toexchange information on which the next computation phase depends.
The SHMEM routines minimize the overhead associated with data transfer requests,maximize bandwidth, and minimize data latency. Data latency is the period of timethat starts when a PE initiates a transfer of data and ends when a PE can use the data.
SHMEM routines support remote data transfer through put operations, which transferdata to a different PE, get operations, which transfer data from a different PE, andremote pointers, which allow direct references to data objects owned by another PE.Other operations supported are collective broadcast and reduction, barriersynchronization, and atomic memory operations. An atomic memory operation is anatomic read-and-update operation, such as a fetch-and-increment, on a remote or localdata object.
10 007–4639–008

Linux®
Application Tuning Guide
For details about using the SHMEM routines, see the intro_shmem(3) man page orthe Message Passing Toolkit (MPT) User’s Guide.
Other Compiling Environment FeaturesThe SGI compiling environment includes several other products as part of itsdistribution:
• idb: the Intel debugger (available if your system is licensed for the Intelcompilers). This is a fully symbolic debugger and supports Fortran, C, and C++debugging.
• gdb: the GNU project debugger, which supports C, C++ and Modula-2. It alsosupports Fortran 95 debugging when the gdbf95 patch is installed.
• ddd: a graphical user interface to gdb and the other debuggers.
• TotalView: a licensed graphical debugger useful in an MPI environment (seehttp://www.entus.com/
These and other performance analysis tools are discussed in Chapter 3, "PerformanceAnalysis and Debugging" on page 13.
007–4639–008 11


Chapter 3
Performance Analysis and Debugging
Tuning an application involves determining the source of performance problems andthen rectifying those problems to make your programs run their fastest on theavailable hardware. Performance gains usually fall into one of three categories ofmesured time:
• User CPU time: time accumulated by a user process when it is attached to a CPUand is executing.
• Elapsed (wall-clock) time: the amount of time that passes between the start andthe termination of a process.
• System time: the amount of time performing kernel functions like system calls,sched_yield, for example, or floating point errors.
Any application tuning process involves:
1. Analyzing and identifying a problem
2. Locating where in the code the problem is
3. Applying an optimization technique
This chapter describes the process of analyzing your code to determine performancebottlenecks. See Chapter 6, "Performance Tuning" on page 65, for details about tuningyour application for a single processor system and then tuning it for parallelprocessing.
Determining System ConfigurationOne of the first steps in application tuning is to determine the details of the systemthat you are running. Depending on your system configuration, different options mayor may not provide good results.
To determine the details of the system you are running, you can browse files from the/proc pseudo-filesystem (see the proc(5) man page for details). Following is someof the information you can obtain:
• /proc/cpuinfo: displays processor information, one entry per processor. Usethis to determine clock speed and processor stepping.
007–4639–008 13

3: Performance Analysis and Debugging
• /proc/meminfo: provides a global view of system memory usage, such as totalmemory, free memory, swap space, and so on.
• /proc/discontig: shows memory usage (in pages).
• /proc/pal/cpu0/cache_info: provides detailed information about L1, L2, andL3 cache structure, such as size, latency, associativity, line size, and so on. Otherfiles in /proc/pal/cpu0 provide information about the Translation LookasideBuffer (TLB) structure, clock ratios, and other details.
• /proc/version: provides information about the installed kernel.
• /proc/perfmon: if this file does not exist in/proc (that is, if it has not beenexported), performance counters have not been started by the kernel and none ofthe performance tools that use the counters will work.
• /proc/mounts: provides details about the filesystems that are currently mounted.
• /proc/modules: contains details about currently installed kernel modules.
You can also use the uname command, which returns the kernel version and othermachine information. In addition, the topology command displays systemconfiguration information. See Chapter 4, "Monitoring Tools" on page 27 for moreinformation.
Sources of Performance ProblemsThere are usually three areas of program execution that can have performanceslowdowns:
• CPU-bound processes: processes that are performing slow operations (such assqrt or floating-point divides) or non-pipelined operations such as switchingbetween add and multiply operations.
• Memory-bound processes: code which uses poor memory strides, occurrences ofpage thrashing or cache misses, or poor data placement in NUMA systems.
• I/O-bound processes: processes which are waiting on synchronous I/O, formattedI/O, or when there is library or system level buffering.
Several profiling tools can help pinpoint where performance slowdowns areoccurring. The following sections describe some of these tools.
14 007–4639–008

Linux®
Application Tuning Guide
Profiling with pfmon
The pfmon tool is a performance monitoring tool designed for Linux. It uses theItanium Performance Monitoring Unit (PMU) to count and sample unmodifiedbinaries. In addition, it can be used for the following tasks:
• To monitor unmodified binaries in its per-CPU mode.
• To run system-wide monitoring sessions. Such sessions are active across allprocesses executing on a given CPU.
• Launch a system-wide session on a dedicated CPU or a set of CPUs in parallel.
• Monitor activities happening at the user level or at the kernel level.
• Collect basic hardware event counts (There are 477 hardware events.)
• Sample program or system execution, monitoring up to four events at a time.
To see a list of available options, use the pfmon -help command. You can only runpfmon one CPU or conflict at a time.
Profiling with profile.pl
The profile.pl script handles the entire user program profiling process. Typicalusage is as follows:
% profile.pl -c0-3 -x6 command args
This script designates processors 0 through 3. The -x6 option is necessary only forOpenMP codes. The x-6 option is used for ProPack 2.4 using glibc 2.2.4 andlinuxthreads. If the application is built on SGI ProPack 3 for Linux using the NativePosix Thread Library (NPTL), use the -x2 option. In ProPack 3, to revert to the to oldLinux threads behavior, set the following kernel parameter;
setenv LD_ASSUME_KERNEL 2.4.19
The result is a profile taken on the CPU_CYCLES PMU event and placed intoprofile.out. This script also supports profiling on other events such asIA64_INST_RETIRED, L3_MISSES, and so on; see pfmon -l for a complete list ofPMU events. The script handles running the command under the performancemonitor, creating a map file of symbol names and addresses from the executable andany associated dynamic libraries, and running the profile analyzer.
007–4639–008 15

3: Performance Analysis and Debugging
See the profile.pl(1), analyze.pl(1), and makemap.pl(1) man pages for details.You can run profile.pl one at a time per CPU or conflict. Profiles all processes onthe specified CPUs.
profile.pl with MPI programs
For MPI programs, use the profile.pl command with the -s1 option, as in thefollowing example:
% mpirun -np 4 profile.pl -s1 -c0-3 test_prog </dev/null
The use of /dev/null ensures that MPI programs run in the background withoutasking for TTY input.
Using histx
The histx software is a set of tools used to assist with application performanceanalysis. It includes three data collection programs and three filters for performancedata post-processing and display. The following sections describe this set of tools.
histx Data Collection
Three programs can be used to gather data for later profiling:
• histx: A profiling tool that can sample either the program counter or the callstack.
The histx data collection programs monitors child processes only, not allproccesses on a CPU like pfmon. It will not show the profile conflicts that thepfmon command shows.
The syntax of the histx command is as, as follows:
histx [-b width] [-f] [-e source] [-h] [-k] -o file [-s type] [-t signo] command args...
The histx command accepts the following options:
-b width Specifies bin bits when using instruction pointersampling: 16,32 or 64 (default: 16).
-e source Specifies event source (default: timer@1).
-f Follow fork (default: off).
16 007–4639–008

Linux®
Application Tuning Guide
-h This message (command not run).
-k Also count kernel events for program source(default: off).
-o file Sends output to file.prog.pid. (REQUIRED).
-s type Includes line level counts in instruction pointersampling report (default: off).
-t signo ‘Toggles’ signal number (default: none).
• lipfpm: Reports counts of desired events for the entire run of a program.
The syntax of the lipfpm command is as, as follows:
lipfpm [-c name] [-e name]* [-f] [-i] [-h] [-k] [-l] [-o path] [-p] command args...
The lipfpm command accepts the following options:
-c name Requests named collection of events; may not beused with -i or -e arguments.
-e name Specifies events to monitor (for event names seeIntel documents).
-f Follow fork (default: off).
-i Specify events interactively, as follows:
– Use space bar or Tab key to display next event.
– Use Backspace key to display previous event.
– Use Enter key to select event.
– Type letters to skip to events starting with thesame letters
– Note that Ctrl - c, and so on, are treated asletters.
– Use the Esc key to finish.
-h This message (command not run)
-k Counts at privilege level 0 as well (default: off)
-l Lists names of all events (other arguments areignored).
007–4639–008 17

3: Performance Analysis and Debugging
-o path Send output to path.cmd.pid instead of standardoutput.
-p Produces easier to parse output.
When using the lipfpm command, you can specify up to four events at a time. ForMPI codes, the -f option is required. Event names are specified slightly differentlythan in the pfmon command.The -c options shows the named collection of events, asfollows:
Event Description
mi Retired M and I type instructions
mi_nop Retired M and I type NOP instructions
fb Retired F and B type instructions
fb_nop Retired F and B type NOP instructions
dlatNNN Times L1D miss latency exceeded NNN
dtlb DTLB misses
ilatNNN Times L1I miss latency exceeded NNN
itlb ITLB misses
bw Counters associated with (read) bandwidth
Sample output from the lipfpm command is, as follows:
% lipfpm -c bw stream.1
Function Rate (MB/s) Avg time Min time Max time
Copy: 3188.8937 0.0216 0.0216 0.0217
Scale: 3154.0994 0.0218 0.0218 0.0219
Add: 3784.2948 0.0273 0.0273 0.0274
Triad: 3822.2504 0.0270 0.0270 0.0272
lipfpm summary
====== =======
L1 Data Cache Read Misses -- all L1D read misses will be
counted.................................................... 10791782L2 Misses.................................................. 55595108
L3 Reads -- L3 Load Misses (excludes reads for ownership
used to satisfy stores).................................... 55252613
CPU Cycles................................................. 3022194261
Average read MB/s requested by L1D......................... 342.801
18 007–4639–008

Linux®
Application Tuning Guide
Average MB/s requested by L2............................... 3531.96Average data read MB/s requested by L3..................... 3510.2
• samppm: Samples selected counter values at a rate specified by the user.
histx Filters
Three programs can be used to generate reports from the histx data collectioncommands:
• iprep: Generates a report from one or more raw sampling reports produced byhistx.
• csrep: Generates a butterfly report from one or more raw call stack samplingreports produced by histx.
• dumppm: Generates a human-readable or script-readable tabular listing frombinary files produced by samppm.
histx Event Sources and Types of Sampling
The following list describes the event sources and types of sampling for the histxprogram.
Event Sources Description
timer@N Profiling timer events. A sample is recorded every Nticks.
pm:event@N Performance monitor events. A sample is recordedwhenever the number of occurrences of event is Nlarger than the number of occurrences at the time of theprevious sample.
dlatM@N A sample is recorded whenever the number of loadswhose latency exceeded M cycles is N larger than thenumber at the time of the previous sample. M must bea power of 2 between 4 and 4096.
Types of sample are, as follows:
Types of Sampling Description
ip Sample instruction pointer
007–4639–008 19

3: Performance Analysis and Debugging
callstack[N] Sample callstack. N, if given, specifies the maximumcallstack depth (default: 8)
Using VTune for Remote SamplingThe Intel VTune performance analyzer does remote sampling experiments. TheVTune data collector runs on the Linux system and an accompanying GUI runs on anIA-32 Windows machine, which is used for analyzing the results. The version ofVTune that runs on Linux does not have the full set of options of the Windows GUI.
For details about using VTune, see the following URL:
http://developer.intel.com/software/products/vtune/vpa/
Note: VTune may not be available for this release. Consult your release notes fordetails about its availability.
Using GuideViewGuideView is a graphical tool that presents a window into the performance details ofa program’s parallel execution. GuideView is part of the KAP/Pro Toolset, which alsoincludes the Guide OpenMP compiler and the Assure Thread Analyzer. GuideView isnot a part of the default software installation with your system. GuideView is part otIntel compilers.
GuideView uses an intuitive, color-coded display of parallel performance bottleneckswhich helps pinpoint performance anomalies. It graphically illustrates eachprocessor’s activity at various levels of detail by using a hierarchical summary.
Statistical data is collapsed into relevant summaries that indicate where attentionshould be focused (for example, regions of the code where improvements in localperformance will have the greatest impact on overall performance).
To gather programming statistics, use the -O3, -openmp, and -openmp_profilecompiler options. This causes the linker to use libguide_stats.a instead of thedefault libguide.a. The following example demonstrates the compiler commandline to produce a file named swim:
% efc -O3 -openmp -openmp_profile -o swim swim.f
20 007–4639–008

Linux®
Application Tuning Guide
To obtain profiling data, run the program, as in this example:
% export OMP_NUM_THREADS=8
% ./swim < swim.in
When the program finishes, the swim.gvs file is produced and it can be used withGuideView. To invoke GuideView with that file, use the following command:
% guideview -jpath=your_path_to_Java -mhz=998 ./swim.gvs.
The graphical portions of GuideView require the use of Java. Java 1.1.6-8 and Java1.2.2 are supported and later versions appear to work correctly. Without Java, thefunctionality is severely limited but text output is still available and is useful, as thefollowing portion of the text file that is produced demonstrates:
Program execution time (in seconds):
cpu : 0.07 sec
elapsed : 69.48 sec
serial : 0.96 secparallel : 68.52 sec
cpu percent : 0.10 %
end
Summary over all regions (has 4 threads):
# Thread #0 #1 #2 #3Sum Parallel : 68.304 68.230 68.240 68.185
Sum Imbalance : 1.020 0.592 0.892 0.838
Sum Critical Section: 0.011 0.022 0.021 0.024
Sum Sequential : 0.011 4.4e-03 4.6e-03 1.6e-03
Min Parallel : -5.1e-04 -5.1e-04 4.2e-04 -5.2e-04Max Parallel : 0.090 0.090 0.090 0.090
Max Imbalance : 0.036 0.087 0.087 0.087
Max Critical Section: 4.6e-05 9.8e-04 6.0e-05 9.8e-04
Max Sequential : 9.8e-04 9.8e-04 9.8e-04 9.8e-04
end
Other Performance ToolsThe following performance tools also can be of benefit when you are trying tooptimize your code:
• Guide OpenMP Compiler is an OpenMP implementation for C, C++, and Fortranfrom Intel.
007–4639–008 21

3: Performance Analysis and Debugging
• Assure Thread Analyzer from Intel locates programming errors in threadedapplications with no recoding required.
For details about these products, see the following website:
http://developer.intel.com/software/products/threading
Note: These products have not been thoroughly tested on SGI systems. SGI takes noresponsibility for the correct operation of third party products described or theirsuitability for any particular purpose.
Debugging ToolsThree debuggers are available to help you analyze your code:
• gdb: the GNU project debugger. This is useful for debugging programs written inC, C++, and Fortran 95. When compiling with C and C++, include the -g optionon the compiler command line to produce the dwarf2 symbols database used bygdb.
When using gdb for Fortran debugging, include the -g and -O0 options. Do notuse gdb for Fortran debugging when compiling with -O1 or higher.
The debugger to be used for Fortran 95 codes can be downloaded fromhttp://sourceforge.net/project/showfiles.php?group_id=56720 . (Note that thestandard gdb compiler does not support Fortran 95 codes.) To verify that youhave the correct version of gdb installed, use the gdb -v command. The outputshould appear similar to the following:
GNU gdb 5.1.1 FORTRAN95-20020628 (RC1)
Copyright 2002 Free Software Foundation, Inc.
For a complete list of gdb commands, see the gdb user guide online athttp://sources.redhat.com/gdb/onlinedocs/gdb_toc.html or use the help option.Note that current instances of gdb do not report ar.ec registers correctly. If youare debugging rotating, register-based, software-pipelined loops at the assemblycode level, try using idb instead.
• idb: the Intel debugger. This is a fully symbolic debugger for the Linux platform.The debugger provides extensive support for debugging programs written in C,C++, FORTRAN 77, and Fortran 90.
22 007–4639–008

Linux®
Application Tuning Guide
Running idb with the -gdb option on the shell command line provides gdb-likeuser commands and debugger output.
• ddd: a GUI to a command line debugger. It supports gdb and idb. For detailsabout usage, see the following subsection.
• TotalView: a licensed graphical debugger useful in an MPI environment (seehttp://www.entus.com/
Using ddd
The DataDisplayDebugger ddd(1) tool is a GUI to an arbitrary command linedebugger as shown in Figure 3-1 on page 24. When starting ddd, use the--debugger option to specify the debugger used (for example, --debugger"idb"). The default debugger used is gdb.
007–4639–008 23

3: Performance Analysis and Debugging
Figure 3-1 DataDisplayDebugger(ddd)(1)
When the debugger is loaded the DataDisplayDebugger screen appears divided intopanes that show the following information:
• Array inspection
• Source code
• Disassembled code
• A command line window to the debugger engine
These panes can be switched on and off from the View menu.
Some commonly used commands can be found on the menus. In addition, thefollowing actions can be useful:
24 007–4639–008
Linux®
Application Tuning Guide
• Select an address in the assembly view, click the right mouse button, and selectlookup. The gdb command is executed in the command pane and it shows thecorresponding source line.
• Select a variable in the source pane and click the right mouse button. The currentvalue is displayed. Arrays are displayed in the array inspection window. You canprint these arrays to PostScript by using the Menu>Print Graph option.
• You can view the contents of the register file, including general, floating-point,NaT, predicate, and application registers by selecting Registers from the Statusmenu. The Status menu also allows you to view stack traces or to switch OpenMPthreads.
007–4639–008 25


Chapter 4
Monitoring Tools
This chapter describes several tools that you can use to monitor system performance.The tools are divided into two general categories: system monitoring tools andnonuniform memory access (NUMA) tools.
System monitoring tools include the hinv(1), topology(1), top(1) commands andthe Performance Co-Pilot pmchart(1) commmand and other operating systemcommands such as the vmstat(1) , iostat(1) command and the sar(1) commandsthat can help you determine where system resources are being spent.
The gtopology(1) command displays a 3D scene of the system interconnect usingthe output from the topology(1) command.
System Monitoring ToolsYou can use system utilities to better understand the usage and limits of your system.These utilities allow you to observe both overall system performance andsingle-performance execution characteristics. This section covers the following topics:
• "Hardware Inventory and Usage Commands" on page 27
• "Performance Co-Pilot Monitoring Tools" on page 32
• "System Usage Commands" on page 36
Hardware Inventory and Usage Commands
This section descibes hardware inventory and usage commands and covers thefollowing topics:
• "hinv(1) Command" on page 28
• "topology(1) Command" on page 28
• "gtopology(1) Command" on page 30
007–4639–008 27
4: Monitoring Tools
hinv(1) Command
The hinv(1) command displays the contents of the system’s hardware inventory. Theinformation displayed includes brick configuration, processor type, main memorysize, and disk drive information, as follows:
[user1@profit user1]# hinv
1 Ix-Brick
4 R-Brick
8 C-Brick
32 1500 MHz Itanium 2 Rev. 5 ProcessorMain memory size: 121.75 Gb
Broadcom Corporation NetXtreme BCM5701 Gigabit Ethernet (rev 21). on pci01.04.0
Integral SCSI controller pci01.03.0: QLogic 12160 Dual Channel Ultra3 SCSI (Rev 6) pci01.03.0
Disk Drive: unit 1 lun 0 on SCSI controller pci01.03.0 0
Disk Drive: unit 2 lun 0 on SCSI controller pci01.03.0 0Disk Drive: unit 1 lun 0 on SCSI controller pci01.03.0 0
Disk Drive: unit 2 lun 0 on SCSI controller pci01.03.0 0
SCSI storage controller: QLogic Corp. QLA2200 (rev 5). pci03.01.0
Disk Drive: unit 10 lun 0 on SCSI controller pci03.01.0 0
Disk Drive: unit 11 lun 0 on SCSI controller pci03.01.0 0Disk Drive: unit 12 lun 0 on SCSI controller pci03.01.0 0
Disk Drive: unit 13 lun 0 on SCSI controller pci03.01.0 0
Disk Drive: unit 14 lun 0 on SCSI controller pci03.01.0 0
Disk Drive: unit 15 lun 0 on SCSI controller pci03.01.0 0
Disk Drive: unit 16 lun 0 on SCSI controller pci03.01.0 0
Disk Drive: unit 17 lun 0 on SCSI controller pci03.01.0 0Disk Drive: unit 18 lun 0 on SCSI controller pci03.01.0 0
Disk Drive: unit 19 lun 0 on SCSI controller pci03.01.0 0
Co-processor: Silicon Graphics, Inc. IOC4 I/O controller (rev 79). on pci01.01.0
CD-ROM MATSHITADVD-ROM SR-8588 7Z20 on pci01.01.0 target0/lun0
Use the hinv -b command to display partition number, metarouter, and nodeinformation.
topology(1) Command
The topology(1) command provides topology information about your system.
Applications programmers can use the topology command to help optimizeexecution layout for their applications. For more information, see the topology(1)man page.
28 007–4639–008

Linux®
Application Tuning Guide
Output from the topology command is similar to the following: (Note that thefollowing output has been abbreviated.)
% topology
Machine parrot.americas.sgi.com has:
64 cpu’s
32 memory nodes
8 routers
8 repeaterrouters
The cpus are:
cpu 0 is /dev/hw/module/001c07/slab/0/node/cpubus/0/a
cpu 1 is /dev/hw/module/001c07/slab/0/node/cpubus/0/c
cpu 2 is /dev/hw/module/001c07/slab/1/node/cpubus/0/acpu 3 is /dev/hw/module/001c07/slab/1/node/cpubus/0/c
cpu 4 is /dev/hw/module/001c10/slab/0/node/cpubus/0/a
...
The nodes are:
node 0 is /dev/hw/module/001c07/slab/0/nodenode 1 is /dev/hw/module/001c07/slab/1/node
node 2 is /dev/hw/module/001c10/slab/0/node
node 3 is /dev/hw/module/001c10/slab/1/node
node 4 is /dev/hw/module/001c17/slab/0/node
...
The routers are:/dev/hw/module/002r15/slab/0/router
/dev/hw/module/002r17/slab/0/router
/dev/hw/module/002r19/slab/0/router
/dev/hw/module/002r21/slab/0/router
...The repeaterrouters are:
/dev/hw/module/001r13/slab/0/repeaterrouter
/dev/hw/module/001r15/slab/0/repeaterrouter
/dev/hw/module/001r29/slab/0/repeaterrouter
/dev/hw/module/001r31/slab/0/repeaterrouter...
The topology is defined by:
/dev/hw/module/001c07/slab/0/node/link/1 is /dev/hw/module/001c07/slab/1/node
/dev/hw/module/001c07/slab/0/node/link/2 is /dev/hw/module/001r13/slab/0/repeaterrouter
/dev/hw/module/001c07/slab/1/node/link/1 is /dev/hw/module/001c07/slab/0/node
/dev/hw/module/001c07/slab/1/node/link/2 is /dev/hw/module/001r13/slab/0/repeaterrouter
007–4639–008 29
4: Monitoring Tools
/dev/hw/module/001c10/slab/0/node/link/1 is /dev/hw/module/001c10/slab/1/node/dev/hw/module/001c10/slab/0/node/link/2 is /dev/hw/module/001r13/slab/0/repeaterrouter
gtopology(1) Command
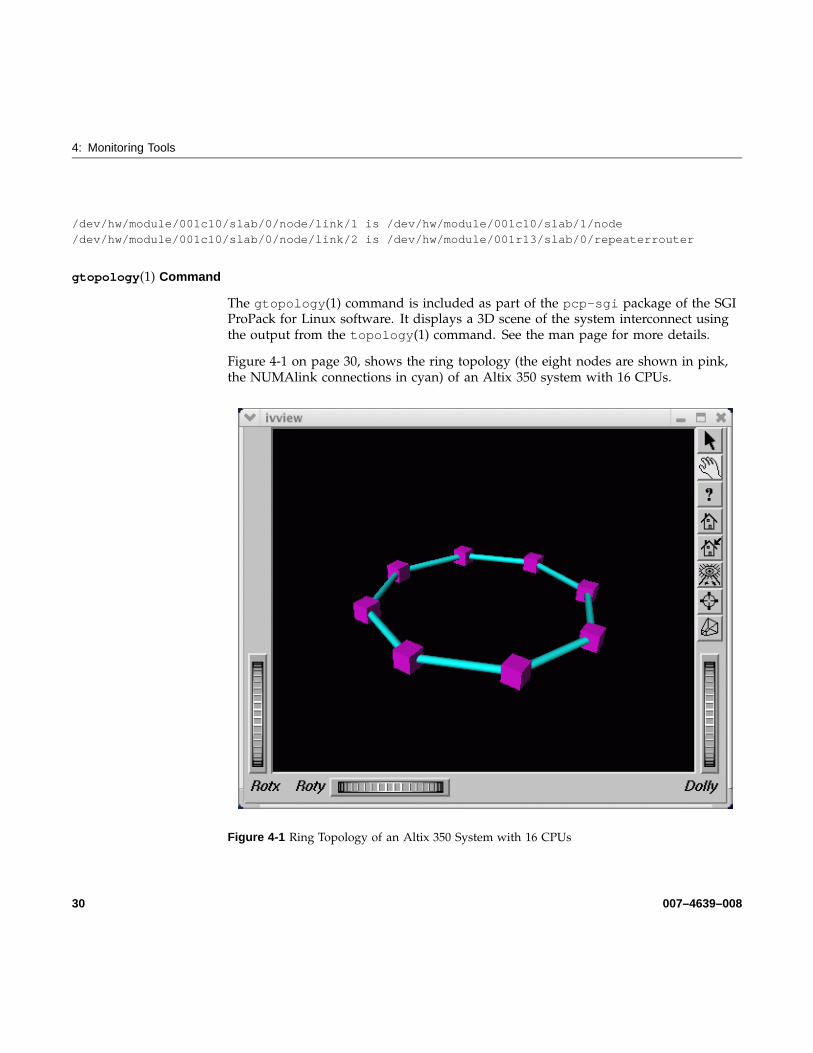
The gtopology(1) command is included as part of the pcp-sgi package of the SGIProPack for Linux software. It displays a 3D scene of the system interconnect usingthe output from the topology(1) command. See the man page for more details.
Figure 4-1 on page 30, shows the ring topology (the eight nodes are shown in pink,the NUMAlink connections in cyan) of an Altix 350 system with 16 CPUs.
Figure 4-1 Ring Topology of an Altix 350 System with 16 CPUs
30 007–4639–008

Linux®
Application Tuning Guide
Figure 4-2 on page 31, shows the fat-tree topology of an Altix 3700 system with 32CPUs. Again, nodes are the pink cubes. Routers are shown as blue spheres (if allports are used) otherwise, yellow.
Figure 4-2 An Altix 3700 System with 32 CPUs Fat-tree Topology
Figure 4-3 on page 32, shows an Altix 3700 system with 512 CPUs. The dual planes ofthe fat-tree topology are clearly visible.
007–4639–008 31

4: Monitoring Tools
Figure 4-3 An Altix 3700 System with 512 CPUs
Performance Co-Pilot Monitoring Tools
This section describes Performance Co-Pilot monitoring tools and covers thefollowing topics:
• "pmshub(1) Command" on page 33
• "shubstats(1) Command" on page 33
• "linkstat(1) Command" on page 34
• "Other Performance Co-Pilot Monitoring Tools" on page 34
32 007–4639–008
Linux®
Application Tuning Guide
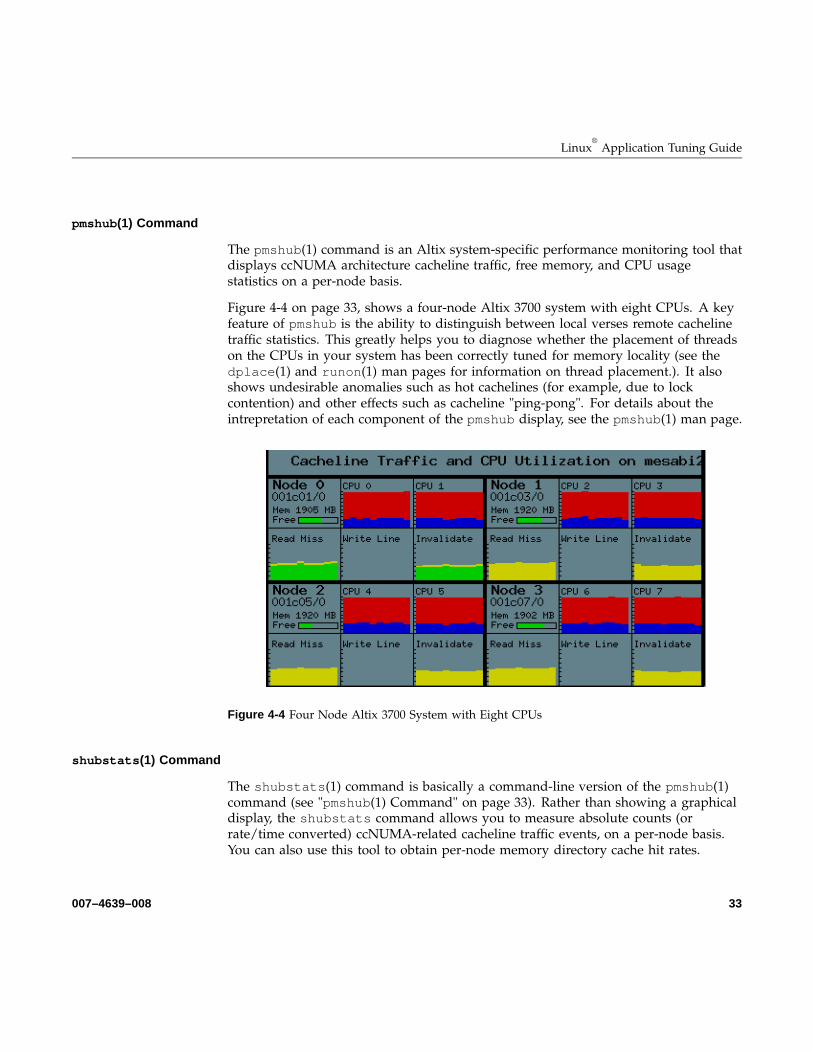
pmshub(1) Command
The pmshub(1) command is an Altix system-specific performance monitoring tool thatdisplays ccNUMA architecture cacheline traffic, free memory, and CPU usagestatistics on a per-node basis.
Figure 4-4 on page 33, shows a four-node Altix 3700 system with eight CPUs. A keyfeature of pmshub is the ability to distinguish between local verses remote cachelinetraffic statistics. This greatly helps you to diagnose whether the placement of threadson the CPUs in your system has been correctly tuned for memory locality (see thedplace(1) and runon(1) man pages for information on thread placement.). It alsoshows undesirable anomalies such as hot cachelines (for example, due to lockcontention) and other effects such as cacheline "ping-pong". For details about theintrepretation of each component of the pmshub display, see the pmshub(1) man page.
Figure 4-4 Four Node Altix 3700 System with Eight CPUs
shubstats(1) Command
The shubstats(1) command is basically a command-line version of the pmshub(1)command (see "pmshub(1) Command" on page 33). Rather than showing a graphicaldisplay, the shubstats command allows you to measure absolute counts (orrate/time converted) ccNUMA-related cacheline traffic events, on a per-node basis.You can also use this tool to obtain per-node memory directory cache hit rates.
007–4639–008 33

4: Monitoring Tools
linkstat(1) Command
The linkstat(1) command is a command-line tool for monitoring NUMAlink trafficand error rates on SGI Altix systems. This tool shows packets and Mbytessent/received on each NUMAlink in the system, as well as error rates. It is useful asa performance monitoring tool, as well as, a tool for helping you to diagnose andidentify faulty hardware. For more information, see the linkstat(1) man page.
Other Performance Co-Pilot Monitoring Tools
In addition to the Altix specific tools described above, the pcp and pcp-sgipackages also provide numerous other performance monitoring tools, both graphicaland text-based. It is important to remember that all of the performance metricsdisplayed by any of the tools described in this chapter can also be monitored withother tools such as pmchart(1), pmval(1), pminfo(1) and others. Additionally, thepmlogger(1) command can be used to capture Performance Co-Pilot archives, whichcan then be "replayed" during a retrospective performance analysis.
A very brief description of other Performance Co-Pilot monitoring tools follows. Seethe associated man page for each tool for more details.
• pmchart(1) — graphical stripchart tool, chiefly used for investigative performanceanalysis.
• pmgsys(1) — graphical tool showing miniature CPU, Disk, Network, LoadAvgand memory/swap in a miniature display, for example, useful for permanentresidence on your desktop for the servers you care about.
• pmgcluster(1) — pmgsys, but for multiple hosts and thus useful for monitoringa cluster of hosts or servers.
• mpvis(1) — 3D display of per-CPU usage.
• clustervis(1) — 3D display showing per-CPU and per-Network performancefor multiple hosts.
• nfsvis(1) — 3D display showing NFS client/server traffic, grouped by NFSoperation type
• nodevis(1) — 3D display showing per-node CPU and memory usage.
• webvis(1) — 3D display showing per-httpd traffic.
• dkvis(1) - 3D display showing per-disk traffic, grouped by controller.
34 007–4639–008

Linux®
Application Tuning Guide
• diskstat(1) — command line tool for monitoring disk traffic.
• topdisk(1) — command line, curses-based tool, for monitoring disk traffic.
• topsys(1) — command line, curses-based tool, for monitoring processes making alarge numbers of system calls or spending a large percentage of their executiontime in system mode using assorted system time measures.
• pmgxvm(1) — miniature graphical display showing XVM volume topology andperformance statistics.
• osvis(1) — 3D display showing assorted kernel and system statistics.
• mpivis(1) — 3D display for monitoring multithreaded MPI applications.
• pmdumptext(1) — command line tool for monitoring multiple performancemetrics with a highly configurable output format. Therefore, it is a useful tools forscripted monitoring tasks.
• pmval(1) — command line tool, similar to pmdumptext(1), but less flexible.
• pminfo(1) — command line tool, useful for printing raw performance metricvalues and associated help text.
• pmprobe(1) — command line tool useful for scripted monitoring tasks.
• pmie(1) — a performance monitoring inference engine. This is a command linetool with an extraordinarily powerful underlying language. It can also be used asa system service for monitoring and reporting on all sorts of performance issues ofinterest.
• pmieconf(1) — command line tool for creating and customizing "canned"pmie(1) configurations.
• pmlogger(1) — command line tool for capturing Performance Co-Pilotperformance metrics archives for replay with other tools.
• pmlogger_daily(1) and pmlogger_check(1) — cron driven infrastructure forautomated logging with pmlogger(1).
• pmcd(1) — the Performance Co-Pilot metrics collector daemon
• PCPIntro(1) — introduction to Performance Co-Pilot monitoring tools, genericcommand line usage and environment variables
007–4639–008 35
4: Monitoring Tools
• PMAPI(3) — introduction to the Performance Co-Pilot API libraries for developingnew performance monitoring tools
• PMDA(3) — introduction to the Performance Co-Pilot Metrics Domain Agent API,for developing new Performance Co-Pilot agents
System Usage Commands
Several commands can be used to determine user load, system usage, and activeprocesses.
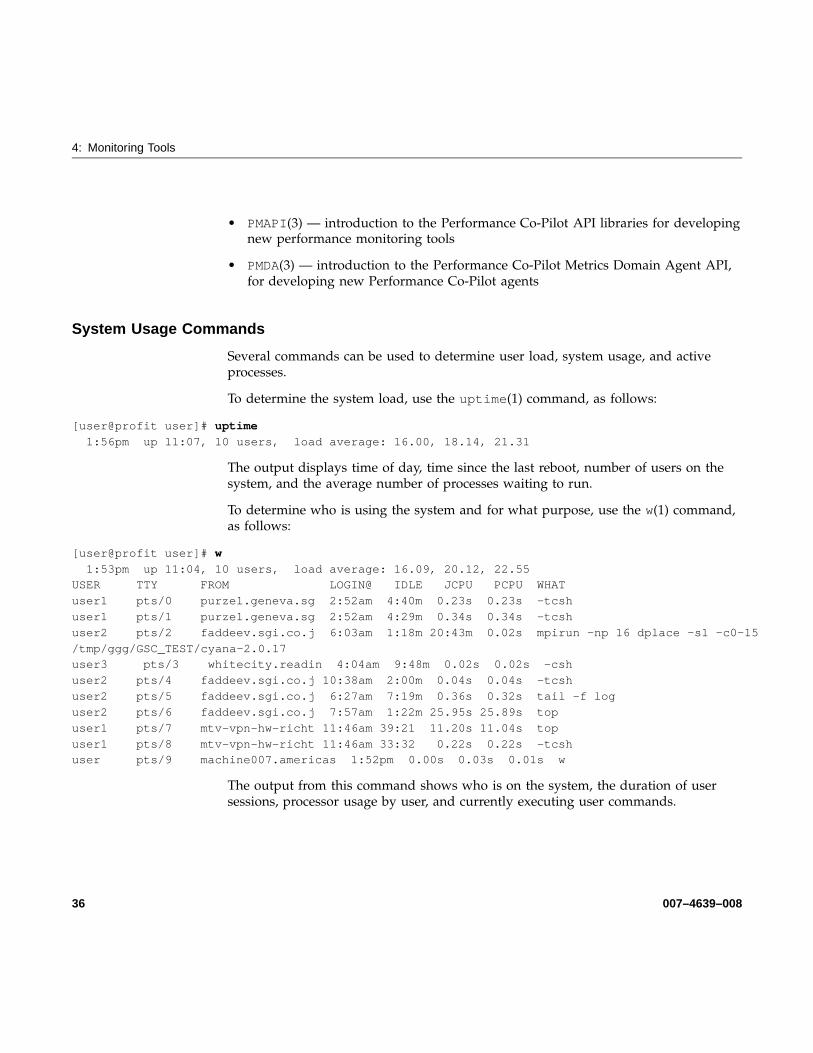
To determine the system load, use the uptime(1) command, as follows:
[user@profit user]# uptime
1:56pm up 11:07, 10 users, load average: 16.00, 18.14, 21.31
The output displays time of day, time since the last reboot, number of users on thesystem, and the average number of processes waiting to run.
To determine who is using the system and for what purpose, use the w(1) command,as follows:
[user@profit user]# w
1:53pm up 11:04, 10 users, load average: 16.09, 20.12, 22.55USER TTY FROM LOGIN@ IDLE JCPU PCPU WHAT
user1 pts/0 purzel.geneva.sg 2:52am 4:40m 0.23s 0.23s -tcsh
user1 pts/1 purzel.geneva.sg 2:52am 4:29m 0.34s 0.34s -tcsh
user2 pts/2 faddeev.sgi.co.j 6:03am 1:18m 20:43m 0.02s mpirun -np 16 dplace -s1 -c0-15
/tmp/ggg/GSC_TEST/cyana-2.0.17user3 pts/3 whitecity.readin 4:04am 9:48m 0.02s 0.02s -csh
user2 pts/4 faddeev.sgi.co.j 10:38am 2:00m 0.04s 0.04s -tcsh
user2 pts/5 faddeev.sgi.co.j 6:27am 7:19m 0.36s 0.32s tail -f log
user2 pts/6 faddeev.sgi.co.j 7:57am 1:22m 25.95s 25.89s top
user1 pts/7 mtv-vpn-hw-richt 11:46am 39:21 11.20s 11.04s top
user1 pts/8 mtv-vpn-hw-richt 11:46am 33:32 0.22s 0.22s -tcshuser pts/9 machine007.americas 1:52pm 0.00s 0.03s 0.01s w
The output from this command shows who is on the system, the duration of usersessions, processor usage by user, and currently executing user commands.
36 007–4639–008

Linux®
Application Tuning Guide
To determine active processes, use the ps(1) command, which displays a snapshot ofthe process table. The ps –A command selects all the processes currently running on asystem as follows:
[user@profit user]# ps -A
PID TTY TIME CMD
1 ? 00:00:06 init
2 ? 00:00:00 migration/0
3 ? 00:00:00 migration/14 ? 00:00:00 migration/2
5 ? 00:00:00 migration/3
6 ? 00:00:00 migration/4
...
1086 ? 00:00:00 sshd1120 ? 00:00:00 xinetd
1138 ? 00:00:05 ntpd
1171 ? 00:00:00 arrayd
1363 ? 00:00:01 amd
1420 ? 00:00:00 crond1490 ? 00:00:00 xfs
1505 ? 00:00:00 sesdaemon
1535 ? 00:00:01 sesdaemon
1536 ? 00:00:00 sesdaemon
1538 ? 00:00:00 sesdaemon
To monitor running processes, use the top(1) command. This command displays asorted list of top CPU utilization processes as shown in Figure 4-5 on page 38.
007–4639–008 37

4: Monitoring Tools
Figure 4-5 Using top(1) to Show Top CPU Utilization processes
The vmstat(1) command reports virtual memory statistics. It reports informationabout processes, memory, paging, block IO, traps, and CPU activity. For moreinformation, see the vmstat(1) man page.
[user@machine3 user]# vmstat
procs memory swap io system cpur b swpd free buff cache si so bi bo in cs us sy id wa
1 0 0 81174720 80 11861232 0 0 0 1 1 1 0 0 0 0
The first report produced gives averages since the last reboot. Additional reports giveinformation on a sampling period of length delay. The process and memory reportsare instantaneous in either case.
38 007–4639–008

Linux®
Application Tuning Guide
The iostat(1) command is used for monitoring system input/output device loadingby observing the time the devices are active in relation to their average transfer rates.The iostat command generates reports that can be used to change systemconfiguration to better balance the input/output load between physical disks. Formore information, see the iostat(1) man page.
user@machine3 user]# iostat
Linux 2.4.21-sgi302c19 (revenue3.engr.sgi.com) 11/04/2004
avg-cpu: %user %nice %sys %idle
40.46 0.00 0.16 59.39
Device: tps Blk_read/s Blk_wrtn/s Blk_read Blk_wrtn
The sar(1) command writes to standard output the contents of selected cumulativeactivity counters in the operating system. The accounting system, based on the valuesin the count and interval parameters, writes information the specified number oftimes spaced at the specified intervals in seconds. For more information, see thesar(1) man page.
[user@machine3 user]# sar
Linux 2.4.21-sgi302c19 (revenue3.engr.sgi.com) 11/04/2004
12:00:00 AM CPU %user %nice %system %idle
12:10:00 AM all 49.85 0.00 0.19 49.97
12:20:00 AM all 49.85 0.00 0.19 49.97
12:30:00 AM all 49.85 0.00 0.18 49.9712:40:00 AM all 49.88 0.00 0.16 49.97
12:50:00 AM all 49.88 0.00 0.15 49.97
01:00:00 AM all 49.88 0.00 0.15 49.97
01:10:00 AM all 49.91 0.00 0.13 49.97
01:20:00 AM all 49.88 0.00 0.15 49.9701:30:00 AM all 49.88 0.00 0.16 49.97
01:40:00 AM all 49.91 0.00 0.13 49.97
01:50:00 AM all 49.87 0.00 0.16 49.97
02:00:00 AM all 49.91 0.00 0.13 49.97
02:10:00 AM all 49.91 0.00 0.13 49.97
02:20:00 AM all 49.90 0.00 0.13 49.9702:30:00 AM all 49.90 0.00 0.13 49.97
02:40:00 AM all 49.90 0.00 0.13 49.97
007–4639–008 39

4: Monitoring Tools
02:50:00 AM all 49.90 0.00 0.14 49.9603:00:00 AM all 49.90 0.00 0.13 49.97
03:10:00 AM all 49.90 0.00 0.13 49.97
03:20:00 AM all 49.90 0.00 0.14 49.97
03:30:01 AM all 49.89 0.00 0.14 49.97
03:40:00 AM all 49.90 0.00 0.14 49.9603:50:01 AM all 49.90 0.00 0.14 49.96
04:00:00 AM all 49.89 0.00 0.14 49.97
04:10:00 AM all 50.18 0.01 0.66 49.14
04:20:00 AM all 49.90 0.00 0.14 49.96
04:30:00 AM all 49.90 0.00 0.14 49.96
04:40:00 AM all 49.94 0.00 0.10 49.9604:50:00 AM all 49.89 0.00 0.15 49.96
05:00:00 AM all 49.94 0.00 0.09 49.97
05:10:00 AM all 49.89 0.00 0.16 49.96
05:20:00 AM all 49.94 0.00 0.10 49.96
05:30:00 AM all 49.89 0.00 0.16 49.9605:40:00 AM all 49.94 0.00 0.10 49.96
05:50:00 AM all 49.93 0.00 0.11 49.96
06:00:00 AM all 49.89 0.00 0.15 49.96
06:10:00 AM all 49.94 0.00 0.10 49.96
06:20:01 AM all 49.88 0.00 0.17 49.95
06:30:00 AM all 49.93 0.00 0.10 49.9606:40:01 AM all 49.93 0.00 0.11 49.96
06:50:00 AM all 49.88 0.00 0.16 49.96
07:00:00 AM all 49.93 0.00 0.10 49.96
07:10:00 AM all 49.93 0.00 0.11 49.96
07:20:00 AM all 49.87 0.00 0.17 49.9607:30:00 AM all 49.99 0.00 0.13 49.88
07:40:00 AM all 50.68 0.00 0.14 49.18
07:50:00 AM all 49.94 0.00 0.11 49.94
08:00:00 AM all 49.92 0.00 0.13 49.94
08:10:00 AM all 49.88 0.00 0.18 49.9508:20:00 AM all 49.93 0.00 0.13 49.95
08:30:00 AM all 49.93 0.00 0.12 49.95
08:40:00 AM all 49.93 0.00 0.12 49.95
08:50:00 AM all 25.33 0.00 0.08 74.59
09:00:00 AM all 0.02 0.00 0.04 99.95
09:10:00 AM all 1.52 0.00 0.05 98.4309:20:00 AM all 0.41 0.00 0.10 99.49
09:30:00 AM all 0.01 0.00 0.02 99.97
40 007–4639–008

Linux®
Application Tuning Guide
09:40:00 AM all 0.01 0.00 0.02 99.9709:50:00 AM all 0.01 0.00 0.02 99.97
10:00:00 AM all 0.01 0.00 0.02 99.97
10:10:00 AM all 0.01 0.00 0.08 99.91
10:20:00 AM all 2.93 0.00 0.55 96.52
10:30:00 AM all 3.13 0.00 0.02 96.84
10:30:00 AM CPU %user %nice %system %idle
10:40:00 AM all 3.13 0.00 0.03 96.84
10:50:01 AM all 3.13 0.00 0.03 96.84
Average: all 40.55 0.00 0.13 59.32
007–4639–008 41


Chapter 5
Data Placement Tools
This chapter describes data placement tools you can use on an SGI Altix system. Itcovers the following topics:
• "Data Placement Tools Overview" on page 43
• "taskset Command" on page 45
• "runon Command" on page 48
• "dplace Command" on page 48
• "dlook Command" on page 56
• "Installing NUMA Tools" on page 63
Data Placement Tools OverviewOn an SMP machine, all data is visible from all processors. Special optimizationapplies to SGI Altix systems to exploit multiple paths to memory, as follows:
• By default, all pages are allocated with a “first touch” policy.
• The initialization loop, if executed serially, will get pages from single node.
• In the parallel loop, multiple processors will access that one memory.
So, perform initialization in parallel, such that each processor initializes data that it islikely to access later for calculation.
Figure 5-1 on page 44, shows how to code to get good data placement.
007–4639–008 43

5: Data Placement Tools
Figure 5-1 Coding to Get Good Data Placement
Placement facilities include cpusets, runon(1), and dplace(1), all built uponCpuMemSets API:
• cpusets — Named subsets of system cpus/memories, used extensively in batchenvironments.
• runon and dplace — Avoid poor data locality caused by process or thread driftfrom CPU to CPU.
– runon restricts execution to the listed set of CPUs (for example, runon 1-3a.out); however, processes are still free to move among listed CPUs.
– dplace binds processes to specified CPUs in round-robin fashion; oncepinned, they do not migrate. Use this for high performance and reproducibilityof parallel codes.
44 007–4639–008

Linux®
Application Tuning Guide
For more information on CpuMemSets and cpusets, see chapter 4, “CPU Memory Setsand Scheduling” and chapter 5, “Cpuset System”, respectively, in the Linux ResourceAdministration Guide.
taskset CommandThe taskset(1) command retrieves or sets a CPU affinity of a process, as follows:
taskset [options] [mask | list ] [pid | command [arg]...]
The taskset command is used to set or retrieve the CPU affinity of a runningprocess given its PID or to launch a new command with a given CPU affinity. CPUaffinity is a scheduler property that "bonds" a process to a given set of CPUs on thesystem. The Linux scheduler will honor the given CPU affinity and the process willnot run on any other CPUs. Note that the Linux scheduler also supports natural CPUaffinity; the scheduler attempts to keep processes on the same CPU as long aspractical for performance reasons. Therefore, forcing a specific CPU affinity is usefulonly in certain applications.
The CPU affinity is represented as a bitmask, with the lowest order bit correspondingto the first logical CPU and the highest order bit corresponding to the last logicalCPU. Not all CPUs may exist on a given system but a mask may specify more CPUsthan are present. A retrieved mask will reflect only the bits that correspond to CPUsphysically on the system. If an invalid mask is given (that is, one that corresponds tono valid CPUs on the current system) an error is returned. The masks are typicallygiven in hexadecimal. For example:
0x00000001 is processor #0
0x00000003 is processors #0 and #1
0xFFFFFFFF is all processors (#0 through #31)
When taskset returns, it is guaranteed that the given program has been scheduledto a legal CPU.
The taskset command does not pin a task to a specific CPU. It only restricts a taskso that it does not run on any CPU that is not in the cpulist. For example, if youuse taskset to launch an application that forks multiple tasks, it is possible thatmultiple tasks will initially be assigned to the same CPU even though there are idleCPUs that are in the cpulist. Scheduler load balancing software will eventuallydistribute the tasks so that CPU bound tasks run on different CPUs. However, theexact placement is not predictable and can vary from run-to-run. After the tasks are
007–4639–008 45

5: Data Placement Tools
evenly distributed (assuming that happens), nothing prevents tasks from jumping todifferent CPUs. This can affect memory latency since pages that were node-localbefore the jump may be remote after the jump.
If you are running an MPI application, SGI recommends that you do not use thetaskset command. The taskset command can pin the MPI shepherd process(which is a waste of a CPU) and then putting the remaining working MPI rank onone of the CPUs that already had some other rank running on it. Instead of taskset,SGI recommnds using the the dplace(1) (see "dplace Command" on page 48) or theenvironment variable MPI_DSM_CPULIST. The following example assumes a jobrunning on eight CPUs. For example:
# mpirun -np 8 dplace -s1 -c10,11,16-21 myMPIapplication ...
To set MPI_DSM_CPULIST variable, perform a command similar to the following:
setenv MPI_DSM_CPULIST 10,11,16-21 mpirun -np 8 myMPIapplication ...
If they are using a batch scheduler that creates and destroys cpusets dynamically, youshould use MPI_DSM_DISTRIBUTE environment variable instead of eitherMPI_DSM_CPULIST enviroment variable or the dplace command.
For more detailed information, see the taskset(1) man page.
To run an executable on CPU 1 (the cpumask for CPU 1 is 0x2), perform the following:
# taskset 0x2 executable name
To move pid 14057 to CPU 0 (the cpumask for cpu 0 is 0x1), perform the following:
# taskset -p 0x1 14057
To run an MPI Abaqus/Std job on Altix 4000 series system with eight CPUs, performthe following:
# taskset -c 8-15 ./runme < /dev/null &
The stdin is redirected to /dev/null to avoid a SIGTTIN signal for MPTapplications.
The following example uses the taskset command to lock a given process to aparticular CPU (CPU5) and then uses the profile(1) command to profile it. It thenshows how to use taskset to move the process to another CPU (CPU3).
# taskset -p -c 5 16269
pid 16269’s current affinity list: 0-15
46 007–4639–008

Linux®
Application Tuning Guide
pid 16269’s new affinity list: 5
# profile.pl -K -KK -c 5 /bin/sleep 60
The analysis showed
====================================================================
user ticks: 0 0 %kernel ticks: 6001 100 %
idle ticks: 5999 99.97 %
Using /boot/System.map-2.6.5-7.282-rtgfx as the kernel map file.
====================================================================Kernel
Ticks Percent Cumulative Routine
Percent
--------------------------------------------------------------------5999 99.97 99.97 default_idle
2 0.03 100.00 run_timer_softirq
====================================================================
Looking at the analysis for the processor, every 100th of a second,
the process has pretty much the same ip.This might tell us that the process is in a pretty tight infinite loop.
63 16269 5 0x2000000005c3cc00 0x0005642bd60d9c5f 4 16000000
64 16269 5 0x2000000005c3cc00 0x0005642bd701c36c 4 16000000
65 16269 5 0x2000000005c3cc00 0x0005642bd7f5ea7c 4 1600000066 16269 5 0x2000000005c3cc00 0x0005642bd8ea178a 4 16000000
67 16269 5 0x2000000005c3cc00 0x0005642bd9de3ea5 4 16000000
68 16269 5 0x2000000005c3cc00 0x0005642bdad265cb 4 16000000
69 16269 5 0x2000000005c3cbe0 0x0005642bdbc68ce6 4 16000000
70 16269 5 0x2000000005c3cc00 0x0005642bdcbab3fe 4 1600000071 16269 5 0x2000000005c3cc00 0x0005642bddaedb13 4 16000000
72 16269 5 0x2000000005c3cc00 0x0005642bdea3021c 4 16000000
73 16269 5 0x2000000005c3cc00 0x0005642bdf97292f 4 16000000
74 16269 5 0x2000000005c3cc00 0x0005642be08b503f 4 16000000
007–4639–008 47

5: Data Placement Tools
# taskset -p 16269 -c 3pid 16269’s current affinity list: 5
pid 16269’s new affinity list: 3
runon CommandThe runon(1) command allows you to run a command on a specified list of CPUs, asfollows;
runon cpu ... command [args ...]
runon cpu ... -p [pid ...]
Note: The runon(1) command is a deprecated package on SGI ProPack 4 for LinuxService Pack 2. You can use the taskset(1) command to retrieve or set the CPUaffinity of a process. For more information, see "taskset Command" on page 45 andthe taskset(1) man page or enter taskset at the command line for a usagestatement.
runon executes a command, assigning it to run only on the listed CPUs. Listed CPUsmay include individual CPUs, or an inclusive range of CPUs separated by a hyphen.Alternatively, the CPU placement of existing processes can be specified, using the -poption. This CPU affinity is inherited across fork(2) and exec(2) system calls.
All options are passed in the argv list to the executable being run.
For example, to execute the echo command on CPUs 1, 3, 4, 5, or 9, perform thefollowing:
machineA:~ # runon 1 3-5 9 echo Hello World
Hello World
dplace CommandYou can use the dplace(1) command to bind a related set of processes to specificCPUs or nodes to prevent process migration. This can improve the performance ofyour application since it increases the percentage of memory accesses that are local.
48 007–4639–008

Linux®
Application Tuning Guide
Using the dplace Command
The dplace command allows you to control the placement of a process ontospecified CPUs, as follows:
dplace [-c cpu_numbers] [-s skip_count] [-n process_name] [-x skip_mask][-p placement_file] command [command-args]
dplace -q
Scheduling and memory placement policies for the process are set up according todplace command line arguments.
By default, memory is allocated to a process on the node on which the process isexecuting. If a process moves from node to node while it running, a higherpercentage of memory references are made to remote nodes. Because remote accessestypically have higher access times, process performance can be diminished. CPUinstruction pipelines also have to be reloaded.
You can use the dplace command to bind a related set of processes to specific CPUsor nodes to prevent process migrations. In some cases, this improves performancesince a higher percentage of memory accesses are made to local nodes.
Processes always execute within a CpuMemSet. The CpuMemSet specifies the CPUson which a process can execute. By default, processes usually execute in aCpuMemSet that contains all the CPUs in the system (for detailed information onCpusMemSets, see the Linux Resource Administration Guide).
The dplace command invokes an SGI kernel hook (module called numatools) tocreate a placement container consisting of all the CPUs (or a or a subset of CPUs) of acpuset. The dplace process is placed in this container and by default is bound to thefirst CPU of the cpuset associated with the container. Then dplace invokes exec toexecute the command.
The command executes within this placement container and remains bound to thefirst CPU of the container. As the command forks child processes, they inherit thecontainer and are bound to the next available CPU of the container.
If you do not specify a placement file, dplace binds processes sequentially in around-robin fashion to CPUs of the placement container. For example, if the currentcpuset consists of physical CPUs 2, 3, 8, and 9, the first process launched by dplaceis bound to CPU 2. The first child process forked by this process is bound to CPU 3,the next process (regardless of whether it is forked by parent or child) to 8, and so on.
007–4639–008 49

5: Data Placement Tools
If more processes are forked than there are CPUs in the cpuset, binding starts overwith the first CPU in the cpuset.
For more information on dplace(1) and examples of how to use the command, seethe dplace(1) man page.
The dplace(1) command accepts the following options:
• -c cpu_numbers: The cpu_numbers variable specifies a list of CPU ranges, forexample: "-c1", "-c2-4", "-c1, 4-8, 3". CPU numbers are not physical CPU numbers.They are logical CPU numbers that are relative to the CPUs that are in the set ofallowed CPUs as specified by the current cpuset or runon(1) command. CPUnumbers start at 0. If this option is not specified, all CPUs of the current cpusetare available.
• -s skip_count: Skips the first skip_count processes before starting to placeprocesses onto CPUs. This option is useful if the first skip_count processes are“shepherd" processes that are used only for launching the application. Ifskip_count is not specified, a default value of 0 is used.
• -n process_name: Only processes named process_name are placed. Other processesare ignored and are not explicitly bound to CPUs.
The process_name argument is the basename of the executable.
• -x skip_mask: Provides the ability to skip placement of processes. The skip_maskargument is a bitmask. If bit N of skip_mask is set, then the N+1th process thatis forked is not placed. For example, setting the mask to 6 prevents the secondand third processes from being placed. The first process (the process named bythe command) will be assigned to the first CPU. The second and third processesare not placed. The fourth process is assigned to the second CPU, and so on. Thisoption is useful for certain classes of threaded applications that spawn a fewhelper processes that typically do not use much CPU time.
Note: OpenMP with Intel applications runnint on ProPack 2.4, should beplaced using the -x option with a skip_mask of 6 (-x6). For applicationscompiled on ProPack 3 (or later) using the Native Posix Thread Library (NPTL),use the -x2 option.
50 007–4639–008

Linux®
Application Tuning Guide
• -p placement_file: Specifies a placement file that contains additional directives thatare used to control process placement. (Implemented in SGI ProPack 3 Sevice Pack2).
• command [command-args]: Specifies the command you want to place and itsarguments.
• -q: Lists the global count of the number of active processes that have been placed(by dplace) on each CPU in the current cpuset. Note that CPU numbers arelogical CPU numbers within the cpuset, not physical CPU numbers.
Example 5-1 Using the dplace command with MPI Programs
You can use the dplace command to improve placement of MPI programs onNUMA systems and verify placement of certain data structures of a long runningMPI program by running a command such as the following:
mpirun -np 64 /usr/bin/dplace -s1 -c 0-63 ./a.out
You can then use the dlook(1) command to verify placement of certain data structuresof a long running MPI program by using the dlook command in another window onone of the slave thread PIDs to verify placement. For more information on using thedlook command, see "dlook Command" on page 56 and the dlook(1) man page.
Example 5-2 Using dplace command with OpenMP Programs
To run an OpenMP program on logical CPUs 4 through 7 within the current cpuset,perform the following:
%efc -o prog -openmp -O3 program.f%setenv OMP_NUM_THREADS 4%dplace -x6 -c4-7 ./prog
The dplace(1) command has a static load balancing feature so that you do notnecessarily have to supply a CPU list. To place prog1 on logical CPUs 0 through 3and prog2 on logical CPUs 4 through 7, perform the following:
%setenv OMP_NUM_THREADS 4%dplace -x6 ./prog1 &
%dplace -x6 ./prog2 &
You can use the dplace -q command to display the static load information.
007–4639–008 51

5: Data Placement Tools
Example 5-3 Using the dplace command with Linux commands
The following examples assume that the command is executed from a shell runningin a cpuset consisting of physical CPUs 8 through 15.
Command Run Location
dplace -c2 date Runs the date command on physical CPU 10.
dplace make linux Runs gcc and related processes on physical CPUs 8through 15.
dplace -c0-4,6make linux
Runs gcc and related processes on physical CPUs 8through 12 or 14.
runon 4-7 dplaceapp
The runon command restricts execution to physicalCPUs 12 through 15. The dplace commandsequentially binds processes to CPUs 12 through 15.
To use the dplace command accurately, you should know how your placed tasks arebeing created in terms of the fork, exec, and pthread_create calls. Determinewhether each of these worker calls are an MPI rank task or are they groups ofpthreads created by rank tasks? Here is an example of two MPI ranks, each creatingthree threads:
cat <<EOF > placefile
firsttask cpu=0exec name=mpiapp cpu=1
fork name=mpiapp cpu=4-8:4 exact
thread name=mpiapp oncpu=4 cpu=5-7 exact thread name=mpiapp oncpu=8
cpu=9-11 exact EOF
# mpirun is placed on cpu 0 in this example # the root mpiapp is
placed on cpu 1 in this example
# or, if your version of dplace supports the "cpurel=" option:
# firsttask cpu=0# fork name=mpiapp cpu=4-8:4 exact
# thread name=mpiapp oncpu=4 cpurel=1-3 exact
# create 2 rank tasks, each will pthread_create 3 more # ranks will be
on 4 and 8# thread children on 5,6,7 9,10,11
52 007–4639–008

Linux®
Application Tuning Guide
dplace -p placefile mpirun -np 2 ~cpw/bin/mpiapp -P 3 -l
exit
You can use the debugger to determine if it is working. It should show two MPI rankapplications, each with three pthreads, as follows:
>> pthreads | grep mpiapp
px *(task_struct *)e00002343c528000 17769 17769 17763 0 mpiapp
member task: e000013817540000 17795 17769 17763 0 5 mpiappmember task: e000013473aa8000 17796 17769 17763 0 6 mpiapp
member task: e000013817c68000 17798 17769 17763 0 mpiapp
px *(task_struct *)e0000234704f0000 17770 17770 17763 0 mpiapp
member task: e000023466ed8000 17794 17770 17763 0 9 mpiapp
member task: e00002384cce0000 17797 17770 17763 0 mpiappmember task: e00002342c448000 17799 17770 17763 0 mpiapp
And you can use the debugger, to see a root application, the parent of the two MPIrank applications, as follows:
>> ps | grep mpiapp
0xe00000340b300000 1139 17763 17729 1 0xc800000 - mpiapp
0xe00002343c528000 1139 17769 17763 0 0xc800040 - mpiapp
0xe0000234704f0000 1139 17770 17763 0 0xc800040 8 mpiapp
Placed as specified:
>> oncpus e00002343c528000 e000013817540000 e000013473aa8000>> e000013817c68000 e0
000234704f0000 e000023466ed8000 e00002384cce0000 e00002342c448000
task: 0xe00002343c528000 mpiapp cpus_allowed: 4
task: 0xe000013817540000 mpiapp cpus_allowed: 5
task: 0xe000013473aa8000 mpiapp cpus_allowed: 6task: 0xe000013817c68000 mpiapp cpus_allowed: 7
task: 0xe0000234704f0000 mpiapp cpus_allowed: 8
task: 0xe000023466ed8000 mpiapp cpus_allowed: 9
task: 0xe00002384cce0000 mpiapp cpus_allowed: 10
task: 0xe00002342c448000 mpiapp cpus_allowed: 11
007–4639–008 53

5: Data Placement Tools
dplace for Compute Thread Placement Troubleshooting Case Study
This section describes common reasons why compute threads do not end up onunique processors when using commands such a dplace(1) or profile.pl (see"Profiling with profile.pl" on page 15).
In the example that follows, a user used the dplace -s1 -c0-15 command to bind16 processes to run on 0-15 CPUs. However, output from the top(1) command showsonly 13 CPUs running with CPUs 13, 14, and 15 still idle and CPUs 0, 1 and 2 areshared with 6 processes.
263 processes: 225 sleeping, 18 running, 3 zombie, 17 stopped
CPU states: cpu user nice system irq softirq iowait idletotal 1265.6% 0.0% 28.8% 0.0% 11.2% 0.0% 291.2%
cpu00 100.0% 0.0% 0.0% 0.0% 0.0% 0.0% 0.0%
cpu01 90.1% 0.0% 0.0% 0.0% 9.7% 0.0% 0.0%
cpu02 99.9% 0.0% 0.0% 0.0% 0.0% 0.0% 0.0%
cpu03 99.9% 0.0% 0.0% 0.0% 0.0% 0.0% 0.0%
cpu04 100.0% 0.0% 0.0% 0.0% 0.0% 0.0% 0.0%
cpu05 100.0% 0.0% 0.0% 0.0% 0.0% 0.0% 0.0%
cpu06 100.0% 0.0% 0.0% 0.0% 0.0% 0.0% 0.0%
cpu07 88.4% 0.0% 10.6% 0.0% 0.8% 0.0% 0.0%
cpu08 100.0% 0.0% 0.0% 0.0% 0.0% 0.0% 0.0%
cpu09 99.9% 0.0% 0.0% 0.0% 0.0% 0.0% 0.0%
cpu10 99.9% 0.0% 0.0% 0.0% 0.0% 0.0% 0.0%
cpu11 88.1% 0.0% 11.2% 0.0% 0.6% 0.0% 0.0%
cpu12 99.7% 0.0% 0.2% 0.0% 0.0% 0.0% 0.0%
cpu13 0.0% 0.0% 2.5% 0.0% 0.0% 0.0% 97.4%
54 007–4639–008

Linux®
Application Tuning Guide
cpu14 0.8% 0.0% 1.6% 0.0% 0.0% 0.0% 97.5%
cpu15 0.0% 0.0% 2.4% 0.0% 0.0% 0.0% 97.5%
Mem: 60134432k av, 15746912k used, 44387520k free, 0k shrd,
672k buff351024k active, 13594288k inactive
Swap: 2559968k av, 0k used, 2559968k free
2652128k cached
PID USER PRI NI SIZE RSS SHARE STAT %CPU %MEM TIME CPU COMMAND
7653 ccao 25 0 115G 586M 114G R 99.9 0.9 0:08 3 mocassin
7656 ccao 25 0 115G 586M 114G R 99.9 0.9 0:08 6 mocassin
7654 ccao 25 0 115G 586M 114G R 99.8 0.9 0:08 4 mocassin
7655 ccao 25 0 115G 586M 114G R 99.8 0.9 0:08 5 mocassin
7658 ccao 25 0 115G 586M 114G R 99.8 0.9 0:08 8 mocassin
7659 ccao 25 0 115G 586M 114G R 99.8 0.9 0:08 9 mocassin
7660 ccao 25 0 115G 586M 114G R 99.8 0.9 0:08 10 mocassin
7662 ccao 25 0 115G 586M 114G R 99.7 0.9 0:08 12 mocassin
7657 ccao 25 0 115G 586M 114G R 88.5 0.9 0:07 7 mocassin
7661 ccao 25 0 115G 586M 114G R 88.3 0.9 0:07 11 mocassin
7649 ccao 25 0 115G 586M 114G R 55.2 0.9 0:04 2 mocassin
7651 ccao 25 0 115G 586M 114G R 54.1 0.9 0:03 1 mocassin
7650 ccao 25 0 115G 586M 114G R 50.0 0.9 0:04 0 mocassin
7647 ccao 25 0 115G 586M 114G R 49.8 0.9 0:03 0 mocassin
007–4639–008 55
5: Data Placement Tools
7652 ccao 25 0 115G 586M 114G R 44.7 0.9 0:04 2 mocassin
7648 ccao 25 0 115G 586M 114G R 35.9 0.9 0:03 1 mocassin
An application can start some threads executing for a very short time yet the threadsstill have taken a token in the CPU list. Then, when the compute threads are finallystarted, the list is exhausted and restarts from the beginning. Consequently, somethreads end up sharing the same CPU. To bypass this, try to eliminate the "ghost"thread creation, as follows:
• Check for a call to the "system" function. This is often responsible for theplacement failure due to unexpected thread creation.
• When all the compute processes have the same name, you can do this by issuing acommand, such as the following:
dplace -c0-15 -n compute-process-name ...
• You can also run dplace -e -c0-32 on 16 CPUs to understand the pattern ofthe thread creation. If by chance, this pattern is the same from one run to theother (unfortunately race between thread creation often occurs), you can find theright flag to dplace. For example, if you want to run on CPU 0-3, with dplace-e -C0-16 and you see that threads are always placed on CPU 0, 1, 5, and 6,then dplace -e -c0,1,x,x,x,2,3 or dplace -x24 -c0-3 (24 =11000, placethe 2 first and skip 3 before placing) should place your threads correctly.
dlook CommandYou can use dlook(1) to find out where in memory the operating system is placingyour application’s pages and how much system and user CPU time it is consuming.
Using the dlook Command
The dlook(1) command allows you to display the memory map and CPU usage for aspecified process as follows:
dlook [-a] [-c] [-h] [-l] [-o outfile] [-s secs] command [command-args]dlook [-a] [-c] [-h] [-l] [-o outfile] [-s secs] pid
56 007–4639–008

Linux®
Application Tuning Guide
For each page in the virtual address space of the process, dlook(1) prints thefollowing information:
• The object that owns the page, such as a file, SYSV shared memory, a devicedriver, and so on.
• The type of page, such as random access memory (RAM), FETCHOP, IOSPACE,and so on.
• If the page type is RAM memory, the following information is displayed:
– Memory attributes, such as, SHARED, DIRTY, and so on
– The node on which the page is located
– The physical address of the page (optional)
• Optionally, the dlook(1) command also prints the amount of user and systemCPU time that the process has executed on each physical CPU in the system.
Two forms of the dlook(1) command are provided. In one form, dlook printsinformation about an existing process that is identified by a process ID (PID). To usethis form of the command, you must be the owner of the process or be running withroot privilege. In the other form, you use dlook on a command you are launchingand thus are the owner.
The dlook(1) command accepts the following options:
• -a: Shows the physical addresses of each page in the address space.
• -c: Shows the user and system CPU time, that is, how long the process hasexecuted on each CPU.
• -h: Explicitly lists holes in the address space.
• -l: Shows libraries.
• -o: Outputs to file name (outfile). If not specified, output is written to stdout.
• -s: Specifies a sample interval in seconds. Information about the process isdisplayed every second (secs) of CPU usage by the process.
An example for the sleep process with a PID of 4702 is as follows:
007–4639–008 57

5: Data Placement Tools
Note: The output has been abbreviated to shorten the example and bold headingsadded for easier reading.
dlook 4702
Peek: sleep
Pid: 4702 Thu Aug 22 10:45:34 2002
Cputime by cpu (in seconds):
user systemTOTAL 0.002 0.033
cpu1 0.002 0.033
Process memory map:
2000000000000000-2000000000030000 r-xp 0000000000000000 04:03 4479 /lib/ld-2.2.4.so[2000000000000000-200000000002c000] 11 pages on node 1 MEMORY|SHARED
2000000000030000-200000000003c000 rw-p 0000000000000000 00:00 0
[2000000000030000-200000000003c000] 3 pages on node 0 MEMORY|DIRTY
...
2000000000128000-2000000000370000 r-xp 0000000000000000 04:03 4672 /lib/libc-2.2.4.so
[2000000000128000-2000000000164000] 15 pages on node 1 MEMORY|SHARED
[2000000000174000-2000000000188000] 5 pages on node 2 MEMORY|SHARED
[2000000000188000-2000000000190000] 2 pages on node 1 MEMORY|SHARED[200000000019c000-20000000001a8000] 3 pages on node 1 MEMORY|SHARED
[20000000001c8000-20000000001d0000] 2 pages on node 1 MEMORY|SHARED
[20000000001fc000-2000000000204000] 2 pages on node 1 MEMORY|SHARED
[200000000020c000-2000000000230000] 9 pages on node 1 MEMORY|SHARED
[200000000026c000-2000000000270000] 1 page on node 1 MEMORY|SHARED
[2000000000284000-2000000000288000] 1 page on node 1 MEMORY|SHARED[20000000002b4000-20000000002b8000] 1 page on node 1 MEMORY|SHARED
[20000000002c4000-20000000002c8000] 1 page on node 1 MEMORY|SHARED
[20000000002d0000-20000000002d8000] 2 pages on node 1 MEMORY|SHARED
[20000000002dc000-20000000002e0000] 1 page on node 1 MEMORY|SHARED
[2000000000340000-2000000000344000] 1 page on node 1 MEMORY|SHARED[200000000034c000-2000000000358000] 3 pages on node 2 MEMORY|SHARED
58 007–4639–008

Linux®
Application Tuning Guide
....
20000000003c8000-20000000003d0000 rw-p 0000000000000000 00:00 0
[20000000003c8000-20000000003d0000] 2 pages on node 0 MEMORY|DIRTY
The dlook command gives the name of the process (Peek: sleep), the process ID,and time and date it was invoked. It provides total user and system CPU time inseconds for the process.
Under the heading Process memory map, the dlook command prints informationabout a process from the /proc/pid/cpu and /proc/pid/maps files. On the left, itshows the memory segment with the offsets below in decimal. In the middle of theoutput page, it shows the type of access, time of execution, the PID, and the objectthat owns the memory (in this case, /lib/ld-2.2.4.so). The characters s or pindicate whether the page is mapped as sharable (s) with other processes or is private(p). The right side of the output page shows the number of pages of memoryconsumed and on which nodes the pages reside. A page is 16, 384 bytes. Dirtymemory means that the memory has been modified by a user.
In the second form of the dlook command, you specify a command and optionalcommand arguments. The dlook command issues an exec call on the command andpasses the command arguments. When the process terminates, dlook printsinformation about the process, as shown in the following example:
dlook date
Thu Aug 22 10:39:20 CDT 2002
_______________________________________________________________________________
Exit: date
Pid: 4680 Thu Aug 22 10:39:20 2002
Process memory map:
2000000000030000-200000000003c000 rw-p 0000000000000000 00:00 0
[2000000000030000-200000000003c000] 3 pages on node 3 MEMORY|DIRTY
20000000002dc000-20000000002e4000 rw-p 0000000000000000 00:00 0
[20000000002dc000-20000000002e4000] 2 pages on node 3 MEMORY|DIRTY
2000000000324000-2000000000334000 rw-p 0000000000000000 00:00 0
[2000000000324000-2000000000328000] 1 page on node 3 MEMORY|DIRTY
007–4639–008 59

5: Data Placement Tools
4000000000000000-400000000000c000 r-xp 0000000000000000 04:03 9657220 /bin/date[4000000000000000-400000000000c000] 3 pages on node 1 MEMORY|SHARED
6000000000008000-6000000000010000 rw-p 0000000000008000 04:03 9657220 /bin/date
[600000000000c000-6000000000010000] 1 page on node 3 MEMORY|DIRTY
6000000000010000-6000000000014000 rwxp 0000000000000000 00:00 0
[6000000000010000-6000000000014000] 1 page on node 3 MEMORY|DIRTY
60000fff80000000-60000fff80004000 rw-p 0000000000000000 00:00 0
[60000fff80000000-60000fff80004000] 1 page on node 3 MEMORY|DIRTY
60000fffffff4000-60000fffffffc000 rwxp ffffffffffffc000 00:00 0
[60000fffffff4000-60000fffffffc000] 2 pages on node 3 MEMORY|DIRTY
If you use the dlook command with the -s secs option, the information is sampled atregular internals. The output for the command dlook -s 5 sleep 50 is as follows:
Exit: sleep
Pid: 5617 Thu Aug 22 11:16:05 2002
Process memory map:
2000000000030000-200000000003c000 rw-p 0000000000000000 00:00 0
[2000000000030000-200000000003c000] 3 pages on node 3 MEMORY|DIRTY
2000000000134000-2000000000140000 rw-p 0000000000000000 00:00 0
20000000003a4000-20000000003a8000 rw-p 0000000000000000 00:00 0
[20000000003a4000-20000000003a8000] 1 page on node 3 MEMORY|DIRTY
20000000003e0000-20000000003ec000 rw-p 0000000000000000 00:00 0[20000000003e0000-20000000003ec000] 3 pages on node 3 MEMORY|DIRTY
4000000000000000-4000000000008000 r-xp 0000000000000000 04:03 9657225 /bin/sleep
[4000000000000000-4000000000008000] 2 pages on node 3 MEMORY|SHARED
6000000000004000-6000000000008000 rw-p 0000000000004000 04:03 9657225 /bin/sleep
[6000000000004000-6000000000008000] 1 page on node 3 MEMORY|DIRTY
6000000000008000-600000000000c000 rwxp 0000000000000000 00:00 0
[6000000000008000-600000000000c000] 1 page on node 3 MEMORY|DIRTY
60 007–4639–008

Linux®
Application Tuning Guide
60000fff80000000-60000fff80004000 rw-p 0000000000000000 00:00 0
[60000fff80000000-60000fff80004000] 1 page on node 3 MEMORY|DIRTY
60000fffffff4000-60000fffffffc000 rwxp ffffffffffffc000 00:00 0
[60000fffffff4000-60000fffffffc000] 2 pages on node 3 MEMORY|DIRTY
You can run a Message Passing Interface (MPI) job using the mpirun command andprint the memory map for each thread, or redirect the ouput to a file, as follows:
Note: The output has been abbreviated to shorten the example and bold headingsadded for easier reading.
mpirun -np 8 dlook -o dlook.out ft.C.8
Contents of dlook.out:
_______________________________________________________________________________
Exit: ft.C.8
Pid: 2306 Fri Aug 30 14:33:37 2002
Process memory map:
2000000000030000-200000000003c000 rw-p 0000000000000000 00:00 0
[2000000000030000-2000000000034000] 1 page on node 21 MEMORY|DIRTY
[2000000000034000-200000000003c000] 2 pages on node 12 MEMORY|DIRTY|SHARED
2000000000044000-2000000000060000 rw-p 0000000000000000 00:00 0
[2000000000044000-2000000000050000] 3 pages on node 12 MEMORY|DIRTY|SHARED
...
_______________________________________________________________________________
_______________________________________________________________________________
Exit: ft.C.8
Pid: 2310 Fri Aug 30 14:33:37 2002
Process memory map:
2000000000030000-200000000003c000 rw-p 0000000000000000 00:00 0
[2000000000030000-2000000000034000] 1 page on node 25 MEMORY|DIRTY
[2000000000034000-200000000003c000] 2 pages on node 12 MEMORY|DIRTY|SHARED
2000000000044000-2000000000060000 rw-p 0000000000000000 00:00 0
007–4639–008 61

5: Data Placement Tools
[2000000000044000-2000000000050000] 3 pages on node 12 MEMORY|DIRTY|SHARED
[2000000000050000-2000000000054000] 1 page on node 25 MEMORY|DIRTY
...
_______________________________________________________________________________
_______________________________________________________________________________
Exit: ft.C.8
Pid: 2307 Fri Aug 30 14:33:37 2002
Process memory map:
2000000000030000-200000000003c000 rw-p 0000000000000000 00:00 0
[2000000000030000-2000000000034000] 1 page on node 30 MEMORY|DIRTY
[2000000000034000-200000000003c000] 2 pages on node 12 MEMORY|DIRTY|SHARED
2000000000044000-2000000000060000 rw-p 0000000000000000 00:00 0
[2000000000044000-2000000000050000] 3 pages on node 12 MEMORY|DIRTY|SHARED
[2000000000050000-2000000000054000] 1 page on node 30 MEMORY|DIRTY
...
_______________________________________________________________________________
_______________________________________________________________________________
Exit: ft.C.8
Pid: 2308 Fri Aug 30 14:33:37 2002
Process memory map:
2000000000030000-200000000003c000 rw-p 0000000000000000 00:00 0
[2000000000030000-2000000000034000] 1 page on node 0 MEMORY|DIRTY
[2000000000034000-200000000003c000] 2 pages on node 12 MEMORY|DIRTY|SHARED
2000000000044000-2000000000060000 rw-p 0000000000000000 00:00 0
[2000000000044000-2000000000050000] 3 pages on node 12 MEMORY|DIRTY|SHARED
[2000000000050000-2000000000054000] 1 page on node 0 MEMORY|DIRTY
...
For more information on the dlook command, see the dlook man page.
62 007–4639–008

Linux®
Application Tuning Guide
Installing NUMA ToolsTo use the dlook(1), dplace(1), and topology(1) commands, you must load thenumatools kernel module. Perform the following steps:
1. To configure numatools kernel module to be started automatically duringsystem startup, use the chkconfig(8) command as follows:
chkconfig --add numatools
2. To turn on numatools, enter the following command:
/etc/rc.d/init.d/numatools start
This step will be done automatically for subsequent system reboots whennumatools are configured on by using the chkconfig(8) utility.
The following steps are required to disable numatools:
1. To turn off numatools, enter the following:
/etc/rc.d/init.d/numatools stop
2. To stop numatools from initiating after a system reboot, use the chkconfig(8)command as follows:
chkconfig --del numatools
007–4639–008 63


Chapter 6
Performance Tuning
After analyzing your code to determine where performance bottlenecks are occurring,you can turn your attention to making your programs run their fastest. One way todo this is to use multiple CPUs in parallel processing mode. However, this should bethe last step. The first step is to make your program run as efficiently as possible on asingle processor system and then consider ways to use parallel processing.
This chapter describes the process of tuning your application for a single processorsystem, and then tuning it for parallel processing in the following sections:
• "Single Processor Code Tuning"
• "Multiprocessor Code Tuning" on page 72
It also describes how to improve the performance of floating-point programs in
• "Floating-point Programs Performance" on page 84
Single Processor Code TuningSeveral basic steps are used to tune performance of single-processor code:
• Get the expected answers and then tune performance. For details, see "Getting theCorrect Results" on page 66.
• Use existing tuned code, such as that found in math libraries and scientific librarypackages. For details, see "Using Tuned Code" on page 68.
• Determine what needs tuning. For details, see "Determining Tuning Needs" onpage 68.
• Use the compiler to do the work. For details, see "Using Compiler Options WherePossible" on page 69.
• Consider tuning cache performance. For details, see "Tuning the CachePerformance" on page 70.
• Set environment variables to enable higher-performance memory managementmode. For details, see "Managing Memory" on page 72.
007–4639–008 65

6: Performance Tuning
Getting the Correct Results
One of the first steps in performance tuning is to verify that the correct answers arebeing obtained. Once the correct answers are obtained, tuning can be done. You canverify answers by initially disabling specific optimizations and limiting defaultoptimizations. This can be accomplished by using specific compiler options and byusing debugging tools.
The following compiler options emphasize tracing and porting over performance:
• -O: the -O0 option disables all optimization. The default is -O2.
• -g: the -g option preserves symbols for debugging.
• -mp: the -mp option limits floating-point optimizations and maintains declaredprecision.
• -IPF_fltacc: the -IPF_fltacc option disables optimizations that affectfloating-point accuracy.
• -r:, -i: the -r8 and -i8 options set default real, integer, and logical sizes to 8bytes, which are useful for porting codes from Cray, Inc. systems. This explicitlydeclares intrinsic and external library functions.
Some debugging tools can also be used to verify that correct answers are beingobtained. See "Debugging Tools" on page 22 for more details.
Managing Heap Corruption Problems
Two methods can be used to check for heap corruption problems in programs thatuse glibc malloc/free dynamic memory management routines: environmentvariables and Electric Fence.
Set the MALLOC_CHECK_ environment variable to 1 to print diagnostic messages or to2 to abort immediately when heap corruption is detected.
Electric Fence is a malloc debugger. It aligns either the start or end of an allocatedblock with an invalid page, causing segmentation faults to occur on buffer overrunsor underruns at the point of error. It can also detect accesses to previously freedregions of memory.
Overruns and underruns are circumstances where an access to an array is outside thedeclared boundary of the array. Underruns and overruns cannot be simultaneouslydetected. The default behavior is to place inaccessible pages immediately after
66 007–4639–008
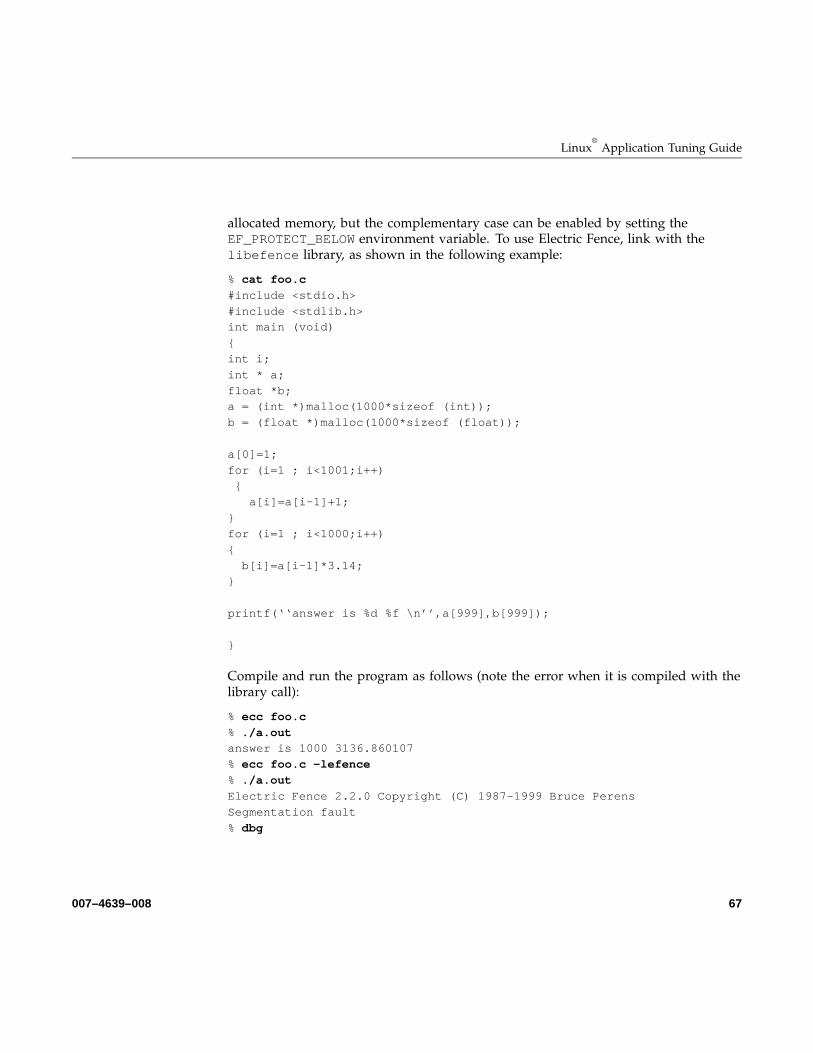
Linux®
Application Tuning Guide
allocated memory, but the complementary case can be enabled by setting theEF_PROTECT_BELOW environment variable. To use Electric Fence, link with thelibefence library, as shown in the following example:
% cat foo.c
#include <stdio.h>
#include <stdlib.h>int main (void)
{
int i;
int * a;
float *b;a = (int *)malloc(1000*sizeof (int));
b = (float *)malloc(1000*sizeof (float));
a[0]=1;
for (i=1 ; i<1001;i++)
{a[i]=a[i-1]+1;
}
for (i=1 ; i<1000;i++)
{
b[i]=a[i-1]*3.14;}
printf(‘‘answer is %d %f \n’’,a[999],b[999]);
}
Compile and run the program as follows (note the error when it is compiled with thelibrary call):
% ecc foo.c
% ./a.outanswer is 1000 3136.860107
% ecc foo.c -lefence
% ./a.out
Electric Fence 2.2.0 Copyright (C) 1987-1999 Bruce Perens
Segmentation fault
% dbg
007–4639–008 67

6: Performance Tuning
To avoid potentially large core files, the recommended method of using Electric Fenceis from within a debugger. See the efence man page for additional details.
Using Tuned Code
Where possible, use code that has already been tuned for optimum hardwareperformance.
The following mathematical functions should be used where possible to help obtainbest results:
• SCSL: SGI’s Scientific Computing Software Library. This library includes BLAS,LAPACK, FFT, convolution/correlation, and iterative/direct sparse solver routines.Documentation is available via online man pages (see intro_scsl) and the SCSLUser’s Guide available on the SGI Technical Publications Library athttp://docs.sgi.com.
• MKL: Intel’s Math Kernel Library. This library includes BLAS, LAPACK, and FFTroutines.
• VML: the Vector Math Library, available as part of the MKL package(libmkl_vml_itp.so).
• Standard Math library
Standard math library functions are provided with the Intel compiler’s libimf.afile. If the -lm option is specified, glibc libm routines are linked in first.
Documentation is available for MKL and VML, as follows:http://intel.com/software/products/perflib/index.htm?iid=ipp_home+software_libraries&.
Determining Tuning Needs
Use the following tools to determine what points in your code might benefit fromtuning:
• time: Use this command to obtain an overview of user, system, and elapsed time.
• gprof: Use this tool to obtain an execution profile of your program (a pcsampprofile). Use the -p compiler option to enable gprof use.
68 007–4639–008
Linux®
Application Tuning Guide
• VTune: This Intel performance monitoring tool is a Linux-server, Windows-clientapplication. It supports remote sampling on all Itanium and Linux systems.
• pfmon: This performance monitoring tool is designed for Itanium and Linux. Ituses the Itanium Performance Monitoring Unit (PMU) to do counting andsampling on unmodified binaries.
For information about other performance analysis tools, see Chapter 3, "PerformanceAnalysis and Debugging" on page 13.
Using Compiler Options Where Possible
Several compiler options can be used to optimize performance. For a short summaryof ifort or ecc options, use the -help option on the compiler command line. Usethe -dryrun option to show the driver tool commands that ifort or ecc generate.This option does not actually compile.
Use the following options to help tune performance:
• -ftz: Flushes underflow to zero to avoid kernel traps. Enabled by default at -O3optimization.
• -fno-alias: Assumes no pointer aliasing. Pointer aliasing can create uncertaintyabout the possibility that two unrelated names might refer to the identicalmemory; because of this uncertainty, the compiler will assume that any twopointers can point to the same location in memory. This can remove optimizationopportunities, particularly for loops.
Other aliasing options include -ansi_alias and -fno_fnalias. Note thatincorrect alias assertions may generate incorrect code.
• -ip: Generates single file, interprocedural optimization; -ipo generates multifile,interprocedural optimization.
Most compiler optimizations work within a single procedure (like a function or asubroutine) at a time. This intra-procedural focus restricts optimizationpossibilities because a compiler is forced to make worst-case assumptions aboutthe possible effects of a procedure. By using inter-procedural analysis, more thana single procedure is analyzed at once and code is optimized. It performs twopasses through the code and requires more compile time.
• -O3: Enables -O2 optimizations plus more aggressive optimizations, includingloop transformation and prefetching. Loop transformation are found in a
007–4639–008 69

6: Performance Tuning
transformation file created by the compiler; you can examine this file to see whatsuggested changes have been made to loops. Prefetch instructions allow data to bemoved into the cache before their use. A prefetch instruction is similar to a loadinstruction.
Note that Level 3 optimization may not improve performance for all programs.
• -opt_report: Generates an optimization report and places it in the file specifiedin -opt_report_file.
• -override_limits: This is an undocumented option that sometimes allows thecompiler to continue optimizing when it has hit an internal limit.
• -prof_gen and -prof_use: Generates and uses profiling information. Theseoptions require a three-step compilation process:
1. Compile with proper instrumentation using -prof_gen.
2. Run the program on one or more training datasets.
3. Compile with -prof_use, which uses the profile information from thetraining run.
• -S: Compiles and generates an assembly listing in the .s files and does not link.The assembly listing can be used in conjunction with the output generated by the-opt_report option to try to determine how well the compiler is optimizingloops.
Tuning the Cache Performance
There are several actions you can take to help tune cache performance:
• Avoid large power-of-2 (and multiples thereof) strides and dimensions that causecache thrashing. Cache thrashing occurs when multiple memory accesses requireuse of the same cache line. This can lead to an unnecessary number of cachemisses.
To prevent cache thrashing, redimension your vectors so that the size is not apower of two. Space the vectors out in memory so that concurrently accessedelements map to different locations in the cache. When working withtwo-dimensional arrays, make the leading dimension an odd number; formultidimensional arrays, change two or more dimensions to an odd number.
70 007–4639–008
Linux®
Application Tuning Guide
Consider the following example: a cache in the hierarchy has a size of 256 KB (or65536 4—byte words). A Fortran program contains the following loop:
real data(655360,24)
...
do i=1,23
do j=1,655360
diff=diff+data(j,i)-data(j,i+1)
enddoenddo
The two accesses to data are separated in memory by 655360*4 bytes, which is asimple multiple of the cache size; they consequently load to the same location inthe cache. Because both data items cannot simultaneously coexist in that cachelocation, a pattern of replace on reload occurs that considerably reducesperformance.
• Use a memory stride of 1 wherever possible. A loop over an array should accessarray elements from adjacent memory addresses. When the loop iterates throughmemory by consecutive word addresses, it uses every word of every cache line insequence and does not return to a cache line after finishing it.
If memory strides other than 1 are used, cache lines could be loaded multipletimes if an array is too large to be held in memory at one time.
• Cache bank conflicts can occur if there are two accesses to the same 16-byte-widebank at the same time. Try different padding of arrays if the output from thepfmon -e L2_OZQ_CANCELS1_BANK_CONF command and the output from thepfmon -e CPU_CYCLES command shows a high number of bank conflictsrelative to total CPU cycles. These can be combined into one command:
% pfmon -e CPU_CYCLES,L2_OZQ_CANCELS1_BANK_CONF a.out
A maximum of four performance monitoring events can be countedsimultaneously.
• Group together data that is used at the same time and do not use vectors in yourcode, if possible. If elements that are used in one loop iteration are contiguous inmemory, it can reduce traffic to the cache and fewer cache lines will be fetched foreach iteration of the loop.
• Try to avoid the use of temporary arrays and minimize data copies.
007–4639–008 71

6: Performance Tuning
Managing Memory
Nonuniform memory access (NUMA) uses hardware with memory and peripheralsdistributed among many CPUs. This allows scalability for a shared memory systembut a side effect is the time it takes for a CPU to access a memory location. Becausememory access times are nonuniform, program optimization is not alwaysstraightforward.
Codes that frequently allocate and deallocate memory through glibc malloc/freecalls may accrue significant system time due to memory management overhead. Bydefault, glibc strives for system-wide memory efficiency at the expense ofperformance.
In compilers up to and including version 7.1.x, to enable the higher-performancememory management mode, set the following environment variables:
% setenv MALLOC_TRIM_THRESHOLD_ -1
% setenv MALLOC_MMAP_MAX_ 0
Because allocations in ifort using the malloc intrinsic use the glibc mallocinternally, these environment variables are also applicable in Fortran codes using, forexample, Cray pointers with malloc/free. But they do not work for Fortran 90allocatable arrays, which are managed directly through Fortran library calls andplaced in the stack instead of the heap.
Multiprocessor Code TuningBefore beginning any multiprocessor tuning, first perform single processor tuning.This can often obtain good results in multiprocessor codes also. For details, see"Single Processor Code Tuning" on page 65.
Multiprocessor tuning consists of the following major steps:
• Determine what parts of your code can be parallelized. For backgroundinformation, see "Data Decomposition" on page 73.
• Choose the parallelization methodology for your code. For details, see"Parallelizing Your Code" on page 74.
• Analyze your code to make sure it is parallelizing properly. For details, seeChapter 3, "Performance Analysis and Debugging" on page 13.
72 007–4639–008

Linux®
Application Tuning Guide
• Check to determine if false sharing exists. For details, see "Fixing False Sharing"on page 78.
• Tune for data placement. For details, see "Using dplace and runon" on page 79.
• Use environment variables to assist with tuning. For details, see "EnvironmentVariables for Performance Tuning" on page 79.
Data Decomposition
In order to efficiently use multiple processors on a system, tasks have to be foundthat can be performed at the same time. There are two basic methods of definingthese tasks:
• Functional parallelism
Functional parallelism is achieved when different processors perform differentfunctions. This is a known approach for programmers trained in modularprogramming. Disadvantages to this approach include the difficulties of definingfunctions as the number of processors grow and finding functions that use anequivalent amount of CPU power. This approach may also require large amountsof synchronization and data movement.
• Data parallelism
Data parallelism is achieved when different processors perform the same functionon different parts of the data. This approach takes advantage of the largecumulative memory. One requirement of this approach, though, is that theproblem domain be decomposed. There are two steps in data parallelism:
1. Data decomposition
Data decomposition is breaking up the data and mapping data to processors.Data can be broken up explicitly by the programmer by using messagepassing (with MPI) and data passing (using the SHMEM library routines) orcan be done implicitly using compiler-based MP directives to find parallelismin implicitly decomposed data.
There are advantages and disadvantages to implicit and explicit datadecomposition:
– Implicit decomposition advantages: No data resizing is needed; allsynchonization is handled by the compiler; the source code is easier to
007–4639–008 73

6: Performance Tuning
develop and is portable to other systems with OpenMP or HighPerformance Fortran (HPF) support.
– Implicit decomposition disadvantages: The data communication is hiddenby the user; the compiler technology is not yet mature enough to deliverconsistent top performance.
– Explicit decomposition advantages: The programmer has full control overinsertion of communication and synchronization calls; the source code isportable to other systems; code performance can be better than implicitlyparallelized codes.
– Explicit decomposition disadvantages: Harder to program; the sourcecode is harder to read and the code is longer (typically 40% more).
2. The final step is to divide the work among processors.
Parallelizing Your Code
The first step in multiprocessor performance tuning is to choose the parallelizationmethodology that you want to use for tuning. This section discusses those options inmore detail.
You should first determine the amount of code that is parallelized. Use the followingformula to calculate the amount of code that is parallelized:
p=N(T(1)-T(N)) / T(1)(N-1)
In this equation, T(1) is the time the code runs on a single CPU and T(N) is the time itruns on N CPUs. Speedup is defined as T(1)/T(N).
If speedup/N is less than 50% (that is, N>(2-p)/(1-p)), stop using more CPUs and tunefor better scalability.
CPU activity can be displayed with the top or vmstat commands or accessed byusing the Performance Co-Pilot tools (for example, pmvalkernel.percpu.cpu.user) or by using the Performance Co-Pilot visualizationtools pmchart.
Next you should focus on a parallelization methodology, as discussed in thefollowing subsections.
74 007–4639–008

Linux®
Application Tuning Guide
Use MPT
You can use the Message Passing Interface (MPI) from the SGI Message PassingToolkit (MPT). MPI is optimized and more scalable for SGI Altix series systems thangeneric MPI libraries. It takes advantage of the SGI Altix architecture and SGI LinuxNUMA features.
Use the -lmpi compiler option to use MPI. For a list of environment variables thatare supported, see the mpi man page.
MPIO_DIRECT_READ and MPIO_DIRECT_WRITE are supported under Linux for localXFS filesystems in SGI MPT version 1.6.1 and beyond.
MPI provides the MPI-2 standard MPI I/O functions that provide file read and writecapabilities. A number of environment variables are available to tune MPI I/Operformance. See the mpi_io(3) man page for a description of these environmentvariables.
Performance tuning for MPI applications is described in more detail in Chapter 6 ofthe Message Passing Toolkit (MPT) User’s Guide.
Use XPMEM DAPL Library with MPI
A Direct Access Programming Library (DAPL) is provided for high performancecommunication between processes on a partitioned or single host Altix system. Thiscan be used with Intel MPI via the remote direct memory access (RDMA) MPI device.See dapl_xpmem(3) for more information.
To run Intel MPI with XPMEM DAPL on a system running SGI ProPack 5 for Linux,perform the following commands:
setenv I_MPI_DEVICE rdma:xpmem
To run an example program, perform commands similar to the following:
setenv DAPL_VERSION on ( to get confirmation that you are using DAPL )mpirun -np 2 /home/yoursystem/syslib/libtools/bin_linux/mpisanity.intel
On SGI ProPack 5 for Linux systems, to use XPMEM DAPL make sure you have thesgi-dapl module loaded, as follows:
module load sgi-dapl
007–4639–008 75

6: Performance Tuning
For more information, see the following files:
/opt/sgi-dapl/share/doc/README/opt/sgi-dapl/share/doc/README.sgi-dapl-api
See the following man pages: dapl_xpmem(3), libdat(3), and dat.conf(4).
Use OpenMP
OpenMP is a shared memory multiprocessing API, which standardizes existingpractice. It is scalable for fine or coarse grain parallelism with an emphasis onperformance. It exploits the strengths of shared memory and is directive-based. TheOpenMP implementation also contains library calls and environment variables.
To use OpenMP directives with C, C++, or Fortran codes, you can use the followingcompiler options:
• ifort -openmp or ecc -openmp: These options use the OpenMP front-end thatis built into the Intel compilers. The resulting executable file makes calls tolibguide.so, which is the OpenMP run-time library provided by Intel.
• guide: An alternate command to invoke the Intel compilers to use OpenMP code.Use guidec (in place of ifort), guideefc (in place of ifort), or guidec++ totranslate code with OpenMP directives into code with calls to libguide. See"Other Performance Tools" on page 21 for details.
The -openmp option to ifort is the long-term OpenMP compiler for Linuxprovided by Intel. However, if you have performance problems with this option,using guide might provide improved performance.
For details about OpenMP usage see the OpenMP standard, available athttp://www.openmp.org/specs.
OpenMP Nested Parallelism
This section describes OpenMP nested parallelism. For additional information, see thedplace(1) man page.
Here is a simple example for OpenMP nested parallelism with 2 "top" threads and 4"bottom" threads that are called master/nested below:
% cat place_nested
firsttask cpu=0
thread name=a.out oncpu=0 cpu=4 noplace=1 exact onetime thread name=a.out oncpu=0
76 007–4639–008

Linux®
Application Tuning Guide
cpu=1-3 exact thread name=a.out oncpu=4 cpu=5-7 exact
% dplace -p place_nested a.outMaster thread 0 running on cpu 0
Master thread 1 running on cpu 4
Nested thread 0 of master 0 gets task 0 on cpu 0 Nested thread 1 of master 0 gets task 1 on cpu 1
Nested thread 2 of master 0 gets task 2 on cpu 2 Nested thread 3 of master 0 gets task 3 on cpu 3
Nested thread 0 of master 1 gets task 0 on cpu 4 Nested thread 1 of master 1 gets task 1 on cpu 5
Nested thread 2 of master 1 gets task 2 on cpu 6 Nested thread 3 of master 1 gets task 3 on cpu 7
Use Compiler Options
Use the compiler to invoke automatic parallelization. Use the -parallel and-par_report option to the efc or ecc compiler. These options show which loopswere parallelized and the reasons why some loops were not parallelized. If a sourcefile contains many loops, it might be necessary to add the -override_limits flagto enable automatic parallelization. The code generated by -parallel is based onthe OpenMP API; the standard OpenMP environment variables and Intel extensionsapply.
There are some limitations to automatic parallelization:
• For Fortran codes, only DO loops are analyzed
• For C/C++ codes, only for loops using explicit array notation or those usingpointer increment notation are analyzed. In addition, for loops using pointerarithmetic notation are not analyzed nor are while or do/while loops. Thecompiler also does not check for blocks of code that can be run in parallel.
Identifying Parallel Opportunities in Existing Code
Another parallelization optimization technique is to identify loops that have apotential for parallelism, such as the following:
• Loops without data dependencies; a data dependency conflict occurs when a loophas results from one loop pass that are needed in future passes of the same loop.
• Loops witih data dependencies because of temporary variables, reductions, nestedloops, or function calls or subroutines.
Loops that do not have a potential for parallelism are those with premature exits, toofew iterations, or those where the programming effort to avoid data dependencies istoo great.
007–4639–008 77

6: Performance Tuning
Fixing False Sharing
If the parallel version of your program is slower than the serial version, false sharingmight be occurring. False sharing occurs when two or more data items that appearnot to be accessed by different threads in a shared memory application correspond tothe same cache line in the processor data caches. If two threads executing on differentCPUs modify the same cache line, the cache line cannot remain resident and correctin both CPUs, and the hardware must move the cache line through the memorysubsystem to retain coherency. This causes performance degradation and reduction inthe scalability of the application. If the data items are only read, not written, thecache line remains in a shared state on all of the CPUs concerned. False sharing canoccur when different threads modify adjacent elements in a shared array. When twoCPUs share the same cache line of an array and the cache is decomposed, theboundaries of the chunks split at the chache line.
You can use the following methods to verify that false sharing is happening:
• Use the performance monitor to look at output from pfmon and theBUS_MEM_READ_BRIL_SELF and BUS_RD_INVAL_ALL_HITM events.
• Use pfmon to check DEAR events to track common cache lines.
• Use the Performance Co-Pilot pmshub utility to monitor cache traffic and CPUutilization. You can also use the shubstats(1) tool to monitor Altix cache anddirectory traffic.
If false sharing is a problem, try the following solutions:
• Use the hardware counter to run a profile that monitors storage to shared cachelines. This will show the location of the problem. You can use the profile.pl-e command or histx -e command. For more information, see "Profiling withprofile.pl" on page 15, "Using histx" on page 16, and the profile.pl(1)man page.
• Revise data structures or algorithms.
• Check shared data, static variables, common blocks, and private and publicvariables in shared objects.
• Use critical regions to identify the part of the code that has the problem.
78 007–4639–008

Linux®
Application Tuning Guide
Using dplace and runon
The dplace command binds processes to specified CPUs in a round-robin fashion.Once bound to a process, they do not migrate. This is similar to _DSM_MUSTRUN onIRIX systems. dplace numbering is done in the context of the current CPU memoryset. See Chapter 4, "Monitoring Tools" on page 27 for details about dplace.
The runon command restricts execution to the listed set of CPUs; however, processesare still free to move among listed CPUs.
Environment Variables for Performance Tuning
You can use several different environment variables to assist in performance tuning.For details about environment variables used to control the behavior of MPI, see thempi(1) man page.
Several OpenMP environment variables can affect the actions of the OpenMP library.For example, some environment variables control the behavior of threads in theapplication when they have no work to perform or are waiting for other threads toarrive at a synchronization semantic; other variables can specify how the OpenMPlibrary schedules iterations of a loop across threads. The following environmentvariables are part of the OpenMP standard:
• OMP_NUM_THREADS (The default is the number of CPUs in the system.)
• OMP_SCHEDULE (The default is static.)
• OMP_DYNAMIC (The default is false.)
• OMP_NESTED (The default is false.)
In addition to the preceding environment variables, Intel provides several OpenMPextensions, two of which are provided through the use of the KMP_LIBRARY variable.
The KMP_LIBRARY variable sets the run-time execution mode, as follows:
• If set to serial, single-processor execution is used.
• If set to throughput, CPUs yield to other processes when waiting for work. Thisis the default and is intended to provide good overall system performance in amultiuser environment. This is analogous to the IRIX _DSM_WAIT=YIELD variable.
• If set to turnaround, worker threads do not yield while waiting for work. This isanalogous to the IRIX _DSM_WAIT=SPIN variable. Setting KMP_LIBRARY to
007–4639–008 79

6: Performance Tuning
turnaround may improve the performance of benchmarks run on dedicatedsystems, where multiple users are not contending for CPU resources.
If your program gets a segmentation fault immediately upon execution, you mayneed to increase KMP_STACKSIZE. This is the private stack size for threads. Thedefault is 4 MB. You may also need to increase your shell stacksize limit.
Understanding Parallel Speedup and Amdahl’s LawThere are two ways to obtain the use of multiple CPUs. You can take a conventionalprogram in C, C++, or Fortran, and have the compiler find the parallelism that isimplicit in the code.
You can write your source code to use explicit parallelism, stating in the source codewhich parts of the program are to execute asynchronously, and how the parts are tocoordinate with each other.
When your program runs on more than one CPU, its total run time should be less.But how much less? What are the limits on the speedup? That is, if you apply 16CPUs to the program, should it finish in 1/16th the elapsed time?
This section covers the following topics:
• "Adding CPUs to Shorten Execution Time" on page 80
• "Understanding Parallel Speedup" on page 81
• "Understanding Amdahl’s Law" on page 82
• "Calculating the Parallel Fraction of a Program" on page 83
• "Predicting Execution Time with n CPUs" on page 84
Adding CPUs to Shorten Execution Time
You can distribute the work your program does over multiple CPUs. However, thereis always some part of the program’s logic that has to be executed serially, by a singleCPU. This sets the lower limit on program run time.
Suppose there is one loop in which the program spends 50% of the execution time. Ifyou can divide the iterations of this loop so that half of them are done in one CPU
80 007–4639–008

Linux®
Application Tuning Guide
while the other half are done at the same time in a different CPU, the whole loop canbe finished in half the time. The result: a 25% reduction in program execution time.
The mathematical treatment of these ideas is called Amdahl’s law, for computerpioneer Gene Amdahl, who formalized it. There are two basic limits to the speedupyou can achieve by parallel execution:
• The fraction of the program that can be run in parallel, p, is never 100%.
• Because of hardware constraints, after a certain point, there is less and less benefitfrom each added CPU.
Tuning for parallel execution comes down to doing the best that you are able to dowithin these two limits. You strive to increase the parallel fraction, p, because in somecases even a small change in p (from 0.8 to 0.85, for example) makes a dramaticchange in the effectiveness of added CPUs.
Then you work to ensure that each added CPU does a full CPU’s work, and does notinterfere with the work of other CPUs. In the SGI Altix architectures this means:
• Spreading the workload equally among the CPUs
• Eliminating false sharing and other types of memory contention between CPUs
• Making sure that the data used by each CPU are located in a memory near thatCPU’s node
Understanding Parallel Speedup
If half the iterations of a DO-loop are performed on one CPU, and the other half run atthe same time on a second CPU, the whole DO-loop should complete in half the time.For example, consider the typical C loop in Example 6-1.
Example 6-1 Typical C Loop
for (j=0; j<MAX; ++j) {
z[j] = a[j]*b[j];}
The compiler can automatically distribute such a loop over n CPUs (with n decided atrun time based on the available hardware), so that each CPU performs MAX/niterations.
007–4639–008 81

6: Performance Tuning
The speedup gained from applying n CPUs, Speedup(n), is the ratio of the one-CPUexecution time to the n-CPU execution time: Speedup(n) = T(1) � T(n). If you measurethe one-CPU execution time of a program at 100 seconds, and the program runs in 60seconds with two CPUs, Speedup(2) = 100 � 60 = 1.67.
This number captures the improvement from adding hardware. T(n) ought to be lessthan T(1); if it is not, adding CPUs has made the program slower, and something iswrong! So Speedup(n) should be a number greater than 1.0, and the greater it is, thebetter. Intuitively you might hope that the speedup would be equal to the number ofCPUs (twice as many CPUs, half the time) but this ideal can seldom be achieved.
Understanding Superlinear Speedup
You expect Speedup(n) to be less than n, reflecting the fact that not all parts of aprogram benefit from parallel execution. However, it is possible, in rare situations, forSpeedup(n) to be larger than n. When the program has been sped up by more than theincrease of CPUs it is known as superlinear speedup.
A superlinear speedup does not really result from parallel execution. It comes aboutbecause each CPU is now working on a smaller set of memory. The problem datahandled by any one CPU fits better in cache, so each CPU executes faster than thesingle CPU could do. A superlinear speedup is welcome, but it indicates that thesequential program was being held back by cache effects.
Understanding Amdahl’s Law
There are always parts of a program that you cannot make parallel, where code mustrun serially. For example, consider the DO-loop. Some amount of code is devoted tosetting up the loop, allocating the work between CPUs. This housekeeping must bedone serially. Then comes parallel execution of the loop body, with all CPUs runningconcurrently. At the end of the loop comes more housekeeping that must be doneserially; for example, if n does not divide MAX evenly, one CPU must execute the fewiterations that are left over.
The serial parts of the program cannot be speeded up by concurrency. Let p be thefraction of the program’s code that can be made parallel (p is always a fraction lessthan 1.0.) The remaining fraction (1–p) of the code must run serially. In practicalcases, p ranges from 0.2 to 0.99.
The potential speedup for a program is proportional to p divided by the CPUs you canapply, plus the remaining serial part, 1-p. As an equation, this appears as Example 6-2.
82 007–4639–008

Linux®
Application Tuning Guide
Example 6-2 Amdahl’s law: Speedup(n) Given p
1
Speedup(n) = -----------
(p/n)+(1-p)
Suppose p = 0.8; then Speedup(2) = 1 / (0.4 + 0.2) = 1.67, and Speedup(4)= 1 / (0.2 +0.2) = 2.5. The maximum possible speedup (if you could apply an infinite number ofCPUs) would be 1 / (1-p). The fraction p has a strong effect on the possible speedup.
The reward for parallelization is small unless p is substantial (at least 0.8); or to putthe point another way, the reward for increasing p is great no matter how many CPUsyou have. The more CPUs you have, the more benefit you get from increasing p.Using only four CPUs, you need only p= 0.75 to get half the ideal speedup. Witheight CPUs, you need p= 0.85 to get half the ideal speedup.
Calculating the Parallel Fraction of a Program
You do not have to guess at the value of p for a given program. Measure theexecution times T(1) and T(2) to calculate a measured Speedup(2) = T(1) / T(2). TheAmdahl’s law equation can be rearranged to yield p when Speedup (2) is known, as inExample 6-3.
Example 6-3 Amdahl’s law: p Given Speedup(2)
2 SpeedUp(2) - 1
p = --- * --------------
1 SpeedUp(2)
Suppose you measure T(1) = 188 seconds and T(2) = 104 seconds.
SpeedUp(2) = 188/104 = 1.81
p = 2 * ((1.81-1)/1.81) = 2*(0.81/1.81) = 0.895
In some cases, the Speedup(2) = T(1)/T(2) is a value greater than 2; in other words, asuperlinear speedup ("Understanding Superlinear Speedup" on page 82). When thisoccurs, the formula in Example 6-3 returns a value of p greater than 1.0, which isclearly not useful. In this case you need to calculate p from two other more realistictimings, for example T(2) and T(3). The general formula for p is shown in Example6-4, where n and m are the two CPU counts whose speedups are known, n>m.
007–4639–008 83
6: Performance Tuning
Example 6-4 Amdahl’s Law: p Given Speedup(n) and Speedup(m)
Speedup(n) - Speedup(m)p = -------------------------------------------
(1 - 1/n)*Speedup(n) - (1 - 1/m)*Speedup(m)
Predicting Execution Time with n CPUs
You can use the calculated value of p to extrapolate the potential speedup with highernumbers of CPUs. The following example shows the expected time with four CPUs,if p=0.895 and T(1)=188 seconds:
Speedup(4)= 1/((0.895/4)+(1-0.895)) = 3.04
T(4)= T(1)/Speedup(4) = 188/3.04 = 61.8
The calculation can be made routine using the computer by creating a script thatautomates the calculations and extrapolates run times.
These calculations are independent of most programming issues such as language,library, or programming model. They are not independent of hardware issues,because Amdahl’s law assumes that all CPUs are equal. At some level of parallelism,adding a CPU no longer affects run time in a linear way. For example, on somearchitectures, cache-friendly codes scale closely with Amdahl’s law up to themaximum number of CPUs, but scaling of memory intensive applications slows asthe system bus approaches saturation. When the bus bandwidth limit is reached, theactual speedup is less than predicted.
Floating-point Programs PerformanceCertain floating-point programs experience slowdowns due to excessive floating pointtraps called Floating-Point Software Assist (FPSWA).
This happens when the hardware cannot complete a floating point operation andrequests help (emulation) from software. This happens, for instance, with denormalsnumbers. See the following document for more details:
http://www.intel.com/design/itanium/downloads/245415.htm
84 007–4639–008
Linux®
Application Tuning Guide
The symptoms are a slower than normal execution, FPSWA message in the system log(run dmesg). The average cost of a FPSWA fault is quite high around 1000cycles/fault.
By default, the kernel prints a message similar to the following in the system log:
foo(7716): floating-point assist fault at ip 40000000000200e1
isr 0000020000000008
The kernel throttles the message in order to avoid flooding the console.
It is possible to control the behavior of the kernel on FPSWA faults using theprctl(1) command. In particular, it is possible to get a signal delivered at the firstFPSWA. It is also possible to silence the console message.
Using pfmon you can count fp_true_sirstall to test for FPSWA faults, as follows:
$ pfmon --no-qual-check -ku --drange=fpswa_interface \
-eloads_retired,ia64_inst_retired,fp_true_sirstall -- test-fpswa
1 LOADS_RETIRED
2615140 IA64_INST_RETIRED
To see a list of available options, use the pfmon - help command.
007–4639–008 85


Chapter 7
Flexible File I/O
Flexible File I/O (FFIO) provides a mechanism for improving the file I/Operformance of existing applications without having to resort to source code changes,that is, the current executable remains unchanged. Knowledge of source code is notrequired, but some knowledge of how the source and the application software workcan help you better interpret and optimize FFIO results. To take advantage of FFIO,all you need to do is to set some environment variables before running yourapplication. This chapter covers the following topics:
• "FFIO Operation" on page 87
• "Environment Variables" on page 88
• "Simple Examples" on page 89
• "Multithreading Considerations" on page 92
• "Application Examples " on page 93
• "Event Tracing " on page 94
• "System Information and Issues " on page 94
FFIO OperationThe FFIO subsystem allows you to define one or more additional I/O buffer cachesfor specific files to augment the Linux kernel I/O buffer cache. The FFIO subsystemthen manages this buffer cache for you. In order to accomplish this, FFIO interceptsstandard I/O calls like open, read, and write, and replaces them with FFIO equivalentroutines. These routines route I/O requests through the FFIO subsystem whichutilizes the user defined FFIO buffer cache. FFIO can bypass the Linux kernel I/Obuffer cache by communicating with the disk subsystem via direct I/O. This givesyou precise control over cache I/O characteristics and allows for more efficient I/Orequests. For example, doing direct I/O in large chunks (say 16 megabytes) allows theFFIO cache to amortize disk access. All file buffering occurs in user space when FFIOis used with direct I/O enabled. This differs from the Linux buffer cache mechanismwhich requires a context switch in order to buffer data in kernel memory. Avoidingthis kind of overhead, helps FFIO to scale efficiently. Another important distinction isthat FFIO allows you to create an I/O buffer cache dedicated to a specific application.
007–4639–008 87

7: Flexible File I/O
The Linux kernel, on the other hand, has to manage all the jobs on the entire systemwith a single I/O buffer cache. As a result, FFIO typically outperforms the Linuxkernel buffer cache when it comes to I/O intensive throughput.
Environment VariablesThere are only two environment variables that you need to set in order to use FFIO.They are LD_PRELOAD and FF_IO_OPTS.
In order to enable FFIO to trap standard I/O calls, you must set the LD_PRELOADenvironment variable.
For SGI Altix 4000 series systems, perform the following:
setenv LD_PRELOAD /usr/lib/libFFIO.so
For SGI Altix XE systems, perform the following:
setenv LD_PRELOAD /usr/lib64/libFFIO.so
The LD_PRELOAD software is a Linux feature that instructs the linker to preload theindicated shared libraries. In this case, libFFIO.so is preloaded and provides theroutines which replace the standard I/O calls. An application that is not dynamicallylinked with the glibc library will not work with FFIO, since the standard I/O callswill not be intercepted. To disable FFIO, perform the following:
unsetenv LD_PRELOAD
The FFIO buffer cache is managed by the FF_IO_OPTS environment variable. Thesyntax for setting this variable can be quite complex. A simple method for definingthis variable is, as follows:
setenv FF_IO_OPTS ’<string>(eie.direct.mbytes:<size>:<num>:<lead>:<share>:<stride>:0)’
You can use the following parameters with the FF_IO_OPTS environment variable:
<string> Matches the names of files that can use the buffer cache.
<size> Number of 4k blocks in each page of the I/O buffercache.
<num> Number of pages in the I/O buffer cache.
<lead> The maximum number of "read ahead" pages.
<share> A value of 1 means a shared cache, 0 means private
88 007–4639–008

Linux®
Application Tuning Guide
<stride> Note that the number after the stride parameter isalways 0.
The following example shows a command that creates a shared buffer cache of 128pages where each page is 16 megabytes (that is, 4096*4k). The cache has a lead of sixpages and uses a stride of one, as follows:
setenv FF_IO_OPTS ’test*(eie.direct.mbytes:4096:128:6:1:1:0)’
Each time the application opens a file, the FFIO code checks the file name to see if itmatches the string supplied by FF_IO_OPTS. The file’s path name is not consideredwhen checking for a match against the string. So in the example supplied above, filenames like /tmp/test16 and /var/tmp/testit would both be a match.
More complicated usages of FF_IO_OPTS are built upon this simpler version. Forexample, multiple types of file names can share the same cache, as follows:
setenv FF_IO_OPTS ’output* test*(eie.direct.mbytes:4096:128:6:1:1:0)’
Multiple caches may also be specified with FF_IO_OPTS. In the example that follows,files of the form output* and test* share a 128 page cache of 16 megabyte pages.The file special42 has a 256 page private cache of 32 megabyte pages, as follows:
setenv FF_IO_OPTS ’output* test*(eie.direct.mbytes:4096:128:6:1:1:0) special42(eie.direct.mbytes:8192:25
Additional parameters can be added to FF_IO_OPTS to create feedback that is sent tostandard output. Examples of doing this diagnostic output will be presented in thefollowing section.
Simple ExamplesThis section walks you through some simple examples using FFIO.
Assume that LD_PRELOAD is set for the correct library and FF_IO_OPTS is defined,as follows:
setenv FF_IO_OPTS ’test*(eie.direct.mbytes:4096:128:6:1:1:0)’
This example uses a small C program called fio that reads four megabyte chunksfrom a file for 100 iterations. When the program runs it produces output, as follows:
./fio -n 100 /build/testitReading 4194304 bytes 100 times to /build/testit
Total time = 7.383761
007–4639–008 89

7: Flexible File I/O
Throughput = 56.804439 MB/sec
It can be difficult to tell what FFIO may or may not be doing even with a simpleprogram such as shown above. A summary of the FFIO operations that occurred canbe directed to standard output by making a simple addition to FF_IO_OPTS, asfollows:
setenv FF_IO_OPTS ’test*(eie.direct.mbytes:4096:128:6:1:1:0, event.summary.mbytes.notrace )’
This new setting for FF_IO_OPTS generates the following summary on standardoutput when the program is run:
./fio -n 100 /build/testit
Reading 4194304 bytes 100 times to /build/testit
Total time = 7.383761Throughput = 56.804439 MB/sec
event_close(testit) eie <-->syscall (496 mbytes)/( 8.72 s)= 56.85 mbytes/s
oflags=0x0000000000004042=RDWR+CREAT+DIRECT
sector size =4096(bytes)cblks =0 cbits =0x0000000000000000
current file size =512 mbytes high water file size =512 mbytes
function times wall all mbytes mbytes min max avg
called time hidden requested delivered request request request
open 1 0.00read 2 0.61 32 32 16 16 16
reada 29 0.01 0 464 464 16 16 16
fcntl
recall
reada 29 8.11other 5 0.00
flush 1 0.00
close 1 0.00
Two synchronous reads of 16 megabytes each were issued (for a total of 32megabytes) and 29 asynchronous reads (reada) were also issued (for a total of 464megabytes). Additional diagnostic information can be generated by specifying the.diag modifier, as follows:
setenv FF_IO_OPTS ’test*(eie.direct.diag.mbytes:4096:128:6:1:1:0 )’
90 007–4639–008

Linux®
Application Tuning Guide
The .diag modifier may also be used in conjunction with .event.summary, thetwo operate independently from one another, as follows:
setenv FF_IO_OPTS ’test*(eie.diag.direct.mbytes:4096:128:6:1:1:0, event.summary.mbytes.notrace )’
An example of the diagnostic output generated when just the .diag modifier is usedis, as follows:
./fio -n 100 /build/testit
Reading 4194304 bytes 100 times to /build/testit
Total time = 7.383761
Throughput = 56.804439 MB/sec
eie_close EIE final stats for file /build/testit
eie_close Used shared eie cache 1
eie_close 128 mem pages of 4096 blocks (4096 sectors), max_lead = 6 pages
eie_close advance reads used/started : 23/29 79.31% (1.78 seconds wasted)
eie_close write hits/total : 0/0 0.00%eie_close read hits/total : 98/100 98.00%
eie_close mbytes transferred parent --> eie --> child sync async
eie_close 0 0 0 0
eie_close 400 496 2 29 (0,0)
eie_close parent <-- eie <-- child
eie_close EIE stats for Shared cache 1
eie_close 128 mem pages of 4096 blocks
eie_close advance reads used/started : 23/29 79.31% (0.00 seconds wasted)
eie_close write hits/total : 0/0 0.00%
eie_close read hits/total : 98/100 98.00%eie_close mbytes transferred parent --> eie --> child sync async
eie_close 0 0 0
eie_close 400 496 2 29 (0,0)
Information is listed for both the file and the cache. An mbytes transferredexample is shown below:
eie_close mbytes transferred parent --> eie --> child sync async
eie_close 0 0 0eie_close 400 496 2 29 (0
The last two lines are for write and read operations, respectively. Only for very simpleI/O patterns, the difference between (parent –> eie) and (eie –> child) read statistics
007–4639–008 91
7: Flexible File I/O
can be explained by the number of read aheads. For random reads of a large file overa long period of time, this is not the case. All write operations count as async.
Multithreading ConsiderationsFFIO will work with applications that use MPI for parallel processing. An MPI jobassigns each thread a number or rank. The master thread has rank 0, while theremaining threads (called slave threads) have ranks from 1 to N-l where N is the totalnumber of threads in the MPI job. It is important to consider that the threadscomprising an MPI job do not (necessarily) have access to each others address space.As a result, there is no way for the different MPI threads to share the same FFIOcache. By default, each thread defines a separate FFIO cache based on the parametersdefined by FF_IO_OPTS.
Having each MPI thread define a separate FFIO cache based on a single environmentvariable (FF_IO_OPTS) can waste a lot of memory. Fortunately, FFIO provides amechanism that allows the user to specify a different FFIO cache for each MPI threadvia the following environment variables:
setenv FF_IO_OPTS_RANK0 ’result*(eie.direct.mbytes:4096:512:6:1:1:0)’
setenv FF_IO_OPTS_RANK1 ’output*(eie.direct.mbytes:1024:128:6:1:1:0)’setenv FF_IO_OPTS_RANK2 ’input*(eie.direct.mbytes:2048:64:6:1:1:0)’
.
.
.
setenv FF_IO_OPTS_RANKN-1 ... (N = number of threads).
Each rank environment variable is set using the exact same syntax as FF_IO_OPTSand each defines a distinct cache for the corresponding MPI rank. If the cache isdesignated shared, all files within the same ranking thread will use the same cache.FFIO works with SGI MPI, HP MPI, and LAM MPI. In order to work with MPIapplications, FFIO needs to determine the rank of callers by invoking thempi_comm_rank_() MPI library routine . Therefore, FFIO needs to determine thelocation of the MPI library used by the application. This is accomplished by havingthe user set one (and only one) of the following environment variables:
setenv SGI_MPI /usr/lib # ia64 only
or
setenv LAM_MPI *see below
or
setenv HP_MPI *see below
92 007–4639–008

Linux®
Application Tuning Guide
*LAM and HP MPIs are usually distributed via a third party application. The preci
paths to the LAM and the HP MPI libraries are application dependent. Please refe
application installation guide to find the correct path.
In order to use the rank functionality, both the MPI and FF_IO_OPTS_RANK0environment variables must be set. If either variable is not set, then the MPI threadsall use FF_IO_OPTS. If both the MPI and the FF_IO_OPTS_RANK0 variables aredefined but, for example, FF_IO_OPTS_RANK2 is undefined, all rank 2 files wouldgenerate a no match with FFIO. This means that none of the rank 2 files would becached by FFIO (in this case things DO NOT default to FF_IO_OPTS).
Fortran and C/C++ applications that use the pthreads interface will create threadsthat share the same address space. These threads can all make use of the single FFIOcache defined by FF_IO_OPTS.
Application ExamplesFFIO has been deployed successfully with several HPC applications such as Nastranand Abaqus. In a recent customer benchmark, an eight-way Abaqus throughput jobran approximately twice as fast when FFIO was used. The FFIO cache used 16megabyte pages (that is, page_size = 4096) and the cache size was 8.0 gigabytes. Asa rule of thumb, it was determined that setting the FFIO cache size to roughly 10-15%of the disk space required by Abaqus yielded reasonable I/O performance. For thisbenchmark, the FF_IO_OPTS environment variable was defined by:
setenv FF_IO_OPTS ’*.fct *.opr* *.ord *.fil *.mdl* *.stt* *.res *.sst *.hdx *.odb* *.023
*.nck* *.sct *.lop *.ngr *.elm *.ptn* *.stp* *.eig *.lnz* *.mass *.inp* *.scn* *.ddm*.dat* fort*(eie.direct.nodiag.mbytes:4096:512:6:1:1:0,event.summary.mbytes.notrace)’
For the MPI version of Abaqus, different caches were specified for each MPI rank, asfollows:
setenv FF_IO_OPTS_RANK0 ’*.fct *.opr* *.ord *.fil *.mdl* *.stt* *.res *.sst *.hdx *.odb* *.023
*.nck* *.sct *.lop *.ngr *.ptn* *.stp* *.elm *.eig *.lnz* *.mass *.inp *.scn* *.ddm
*.dat* fort*(eie.direct.nodiag.mbytes:4096:512:6:1:1:0,event.summary.mbytes.notrace)’
setenv FF_IO_OPTS_RANK1 ’*.fct *.opr* *.ord *.fil *.mdl* *.stt* *.res *.sst *.hdx *.odb* *.023*.nck* *.sct *.lop *.ngr *.ptn* *.stp* *.elm *.eig *.lnz* *.mass *.inp *.scn* *.ddm
*.dat* fort*(eie.direct.nodiag.mbytes:4096:16:6:1:1:0,event.summary.mbytes.notrace)’
007–4639–008 93

7: Flexible File I/O
setenv FF_IO_OPTS_RANK2 ’*.fct *.opr* *.ord *.fil *.mdl* *.stt* *.res *.sst *.hdx *.odb* *.023*.nck* *.sct *.lop *.ngr *.ptn* *.stp* *.elm *.eig *.lnz* *.mass *.inp *.scn* *.ddm
*.dat* fort*(eie.direct.nodiag.mbytes:4096:16:6:1:1:0,event.summary.mbytes.notrace)’
setenv FF_IO_OPTS_RANK3 ’*.fct *.opr* *.ord *.fil *.mdl* *.stt* *.res *.sst *.hdx *.odb* *.023
*.nck* *.sct *.lop *.ngr *.ptn* *.stp* *.elm *.eig *.lnz* *.mass *.inp *.scn* *.ddm*.dat* fort*(eie.direct.nodiag.mbytes:4096:16:6:1:1:0,event.summary.mbytes.notrace)’
Event TracingBy specifying the .trace option as part of the event parameter the user can enablethe event tracing feature in FFIO, as follows:
setenv FF_IO_OPTS ’test*(eie.direct.mbytes:4096:128:6:1:1:0, event.summary.mbytes.trace )’
This option generates files of the form ffio.events.pid for each process that ispart of the application. By default, event files are placed in /tmp but this destinationcan be changed by setting the FFIO_TMPDIR environment variable. These filescontain time stamped events for files using the FFIO cache and can be used to traceI/O activity (for example, I/O sizes and offsets).
System Information and IssuesThe SGI ProPack 5 Service Pack 1 release provided the first stable version of FFIO.Applications written in C, C++, and Fortran are supported. C and C++ applicationscan be built with either the Intel or gcc compiler. Only Fortran codes built with theIntel compiler will work.
The following restrictions on FFIO must also be observed:
• The FFIO implementation of pread/pwrite is not correct (the file offsetadvances).
• Do not use FFIO to do I/O on a socket.
• Do not link your application with the librt asynchronous I/O library.
• Calls that operate on files in /proc, /etc, and /dev are not intercepted by FFIO.
• Calls that operate on stdin, stdout, and stderr are not intercepted by FFIO.
• FFIO is not intended for generic I/O applications such as vi, cp, or mv, and so on.
94 007–4639–008

Chapter 8
I/O Tuning
This chapter describes tuning information that you can use to improve I/Othroughput and latency.
Layout of Filesystems and XVM for Multiple RAIDsThere can be latency spikes in response from a RAID and such a spikes can in effectslow down all of the RAIDs as one I/O completion waits for all of the striped piecesto complete.
These latency spikes impact on throughput may be to stall all the I/O or to delay afew I/Os while others continue. It depends on how the I/O is striped across thedevices. If the volumes are constructed as stripes to span all devices, and the I/Os aresized to be full stripes, the I/Os will stall, since every I/O has to touch every device.If the I/Os can be completed by touching a subset of the devices, then those that donot touch a high latency device can continue at full speed, while the stalled I/Os cancomplete and catch up later.
In large storage configurations, it is possible to lay out the volumes to maximize theopportunity for the I/Os to proceed in parallel, masking most of the effect of a fewinstances of high latency.
There are at least three classes of events that cause high latency I/O operations, asfollows:
• Transient disk delays - one disk pauses
• Slow disks
• Transient RAID controller delays
The first two events affect a single logical unit number (LUN). The third event affectsall the LUNs on a controller. The first and third events appear to happen at random.The second event is repeatable.
007–4639–008 95


Chapter 9
Suggested Shortcuts and Workarounds
This chapter contains suggested workarounds and shortcuts that you can use on yourSGI Altix system. It covers the following topics:
• "Determining Process Placement" on page 97
• "Resetting System Limits" on page 104
• "Linux Shared Memory Accounting" on page 108
Determining Process PlacementThis section describes methods that can be used to determine where differentprocesses are running. This can help you understand your application structure andhelp you decide if there are obvious placement issues.
There are some set-up steps to follow before determining process placement (note thatall examples use the C shell):
1. Set up an alias as in this example, changing guest to your username:
% pu
% alias pu "ps -edaf|grep guest"
The pu command shows current processes.
2. Create the .toprc preferences file in your login directory to set the appropriatetop options. If you prefer to use the top defaults, delete the .toprc file.
% cat <<EOF>> $HOME/.toprc
YEAbcDgHIjklMnoTP|qrsuzV{FWX
2mlt
EOF
3. Inspect all processes and determine which CPU is in use and create an alias file forthis procedure. The CPU number is shown in the first column of the top output:
% top -b -n 1 | sort -n | more
% alias top1 "top -b -n 1 | sort -n "
007–4639–008 97

9: Suggested Shortcuts and Workarounds
Use the following variation to produce output with column headings:
% alias top1 "top -b -n 1 | head -4 | tail -1;top -b -n 1 | sort -n"
4. View your files (replacing guest with your username):
% top -b -n 1 | sort -n | grep guest
Use the following variation to produce output with column headings:
% top -b -n 1 | head -4 | tail -1;top -b -n 1 | sort -n grep guest
Example Using pthreads
The following example demonstrates a simple usage with a program name of th. Itsets the number of desired OpenMP threads and runs the program. Notice theprocess hierarchy as shown by the PID and the PPID columns. The command usageis the following, where n is the number of threads:
% th n
% th 4
% pu
UID PID PPID C STIME TTY TIME CMD
root 13784 13779 0 12:41 pts/3 00:00:00 login --
guest1
guest1 13785 13784 0 12:41 pts/3 00:00:00 -csh
guest1 15062 13785 0 15:23 pts/3 00:00:00 th 4 <-- Main threadguest1 15063 15062 0 15:23 pts/3 00:00:00 th 4 <-- daemon thread
guest1 15064 15063 99 15:23 pts/3 00:00:10 th 4 <-- worker thread 1
guest1 15065 15063 99 15:23 pts/3 00:00:10 th 4 <-- worker thread 2
guest1 15066 15063 99 15:23 pts/3 00:00:10 th 4 <-- worker thread 3
guest1 15067 15063 99 15:23 pts/3 00:00:10 th 4 <-- worker thread 4
guest1 15068 13857 0 15:23 pts/5 00:00:00 ps -aefguest1 15069 13857 0 15:23 pts/5 00:00:00 grep guest1
% top -b -n 1 | sort -n | grep guest1
LC %CPU PID USER PRI NI SIZE RSS SHARE STAT %MEM TIME COMMAND3 0.0 15072 guest1 16 0 3488 1536 3328 S 0.0 0:00 grep
5 0.0 13785 guest1 15 0 5872 3664 4592 S 0.0 0:00 csh
5 0.0 15062 guest1 16 0 15824 2080 4384 S 0.0 0:00 th
5 0.0 15063 guest1 15 0 15824 2080 4384 S 0.0 0:00 th
98 007–4639–008
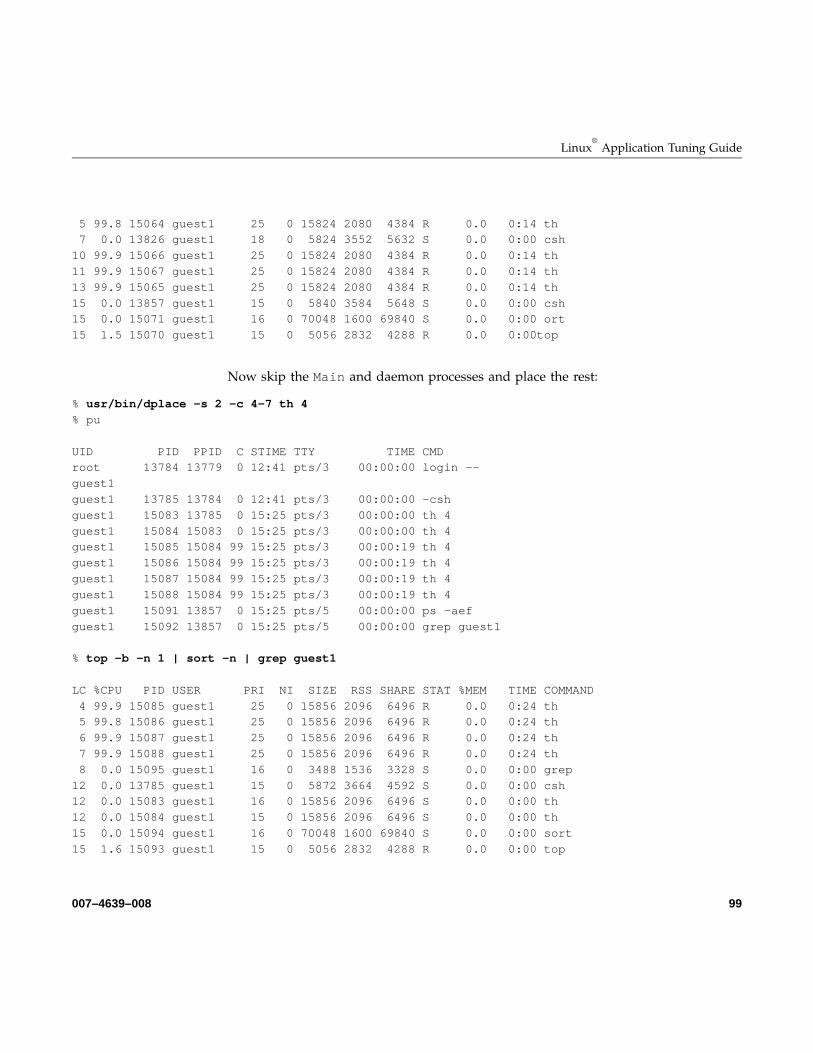
Linux®
Application Tuning Guide
5 99.8 15064 guest1 25 0 15824 2080 4384 R 0.0 0:14 th7 0.0 13826 guest1 18 0 5824 3552 5632 S 0.0 0:00 csh
10 99.9 15066 guest1 25 0 15824 2080 4384 R 0.0 0:14 th
11 99.9 15067 guest1 25 0 15824 2080 4384 R 0.0 0:14 th
13 99.9 15065 guest1 25 0 15824 2080 4384 R 0.0 0:14 th
15 0.0 13857 guest1 15 0 5840 3584 5648 S 0.0 0:00 csh15 0.0 15071 guest1 16 0 70048 1600 69840 S 0.0 0:00 ort
15 1.5 15070 guest1 15 0 5056 2832 4288 R 0.0 0:00top
Now skip the Main and daemon processes and place the rest:
% usr/bin/dplace -s 2 -c 4-7 th 4
% pu
UID PID PPID C STIME TTY TIME CMDroot 13784 13779 0 12:41 pts/3 00:00:00 login --
guest1
guest1 13785 13784 0 12:41 pts/3 00:00:00 -csh
guest1 15083 13785 0 15:25 pts/3 00:00:00 th 4
guest1 15084 15083 0 15:25 pts/3 00:00:00 th 4guest1 15085 15084 99 15:25 pts/3 00:00:19 th 4
guest1 15086 15084 99 15:25 pts/3 00:00:19 th 4
guest1 15087 15084 99 15:25 pts/3 00:00:19 th 4
guest1 15088 15084 99 15:25 pts/3 00:00:19 th 4
guest1 15091 13857 0 15:25 pts/5 00:00:00 ps -aef
guest1 15092 13857 0 15:25 pts/5 00:00:00 grep guest1
% top -b -n 1 | sort -n | grep guest1
LC %CPU PID USER PRI NI SIZE RSS SHARE STAT %MEM TIME COMMAND
4 99.9 15085 guest1 25 0 15856 2096 6496 R 0.0 0:24 th5 99.8 15086 guest1 25 0 15856 2096 6496 R 0.0 0:24 th
6 99.9 15087 guest1 25 0 15856 2096 6496 R 0.0 0:24 th
7 99.9 15088 guest1 25 0 15856 2096 6496 R 0.0 0:24 th
8 0.0 15095 guest1 16 0 3488 1536 3328 S 0.0 0:00 grep
12 0.0 13785 guest1 15 0 5872 3664 4592 S 0.0 0:00 csh12 0.0 15083 guest1 16 0 15856 2096 6496 S 0.0 0:00 th
12 0.0 15084 guest1 15 0 15856 2096 6496 S 0.0 0:00 th
15 0.0 15094 guest1 16 0 70048 1600 69840 S 0.0 0:00 sort
15 1.6 15093 guest1 15 0 5056 2832 4288 R 0.0 0:00 top
007–4639–008 99
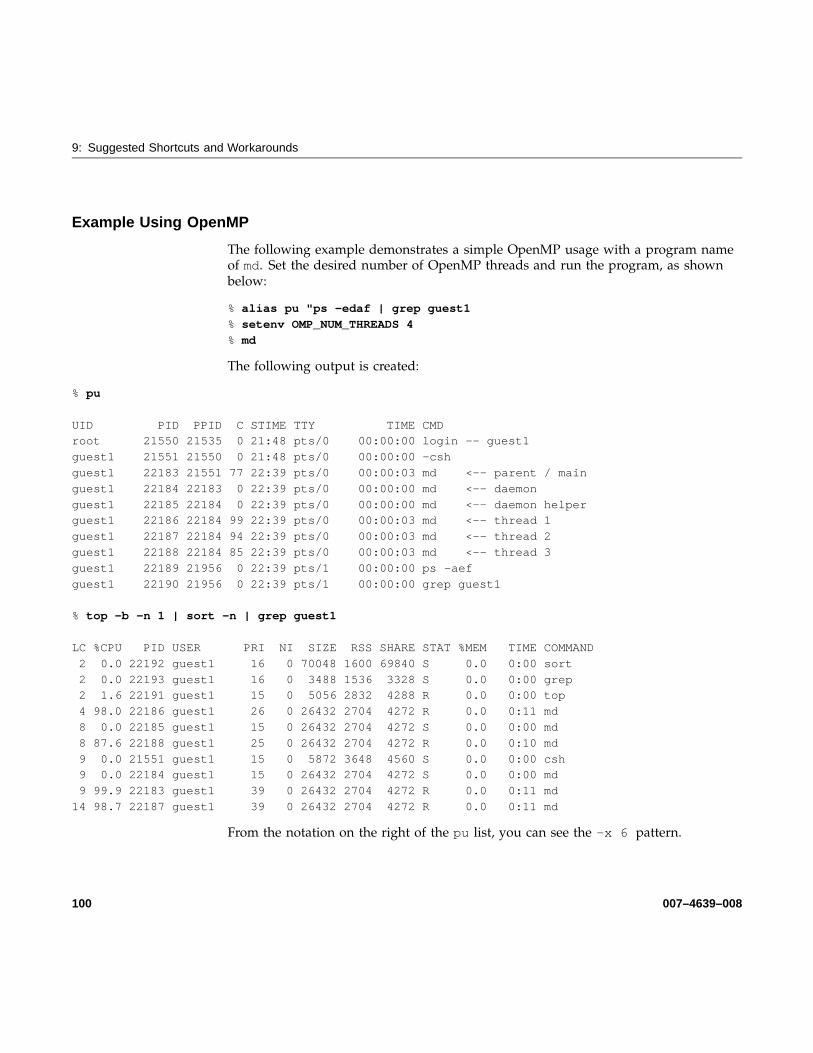
9: Suggested Shortcuts and Workarounds
Example Using OpenMP
The following example demonstrates a simple OpenMP usage with a program nameof md. Set the desired number of OpenMP threads and run the program, as shownbelow:
% alias pu "ps -edaf | grep guest1
% setenv OMP_NUM_THREADS 4
% md
The following output is created:
% pu
UID PID PPID C STIME TTY TIME CMDroot 21550 21535 0 21:48 pts/0 00:00:00 login -- guest1
guest1 21551 21550 0 21:48 pts/0 00:00:00 -csh
guest1 22183 21551 77 22:39 pts/0 00:00:03 md <-- parent / main
guest1 22184 22183 0 22:39 pts/0 00:00:00 md <-- daemon
guest1 22185 22184 0 22:39 pts/0 00:00:00 md <-- daemon helperguest1 22186 22184 99 22:39 pts/0 00:00:03 md <-- thread 1
guest1 22187 22184 94 22:39 pts/0 00:00:03 md <-- thread 2
guest1 22188 22184 85 22:39 pts/0 00:00:03 md <-- thread 3
guest1 22189 21956 0 22:39 pts/1 00:00:00 ps -aef
guest1 22190 21956 0 22:39 pts/1 00:00:00 grep guest1
% top -b -n 1 | sort -n | grep guest1
LC %CPU PID USER PRI NI SIZE RSS SHARE STAT %MEM TIME COMMAND
2 0.0 22192 guest1 16 0 70048 1600 69840 S 0.0 0:00 sort
2 0.0 22193 guest1 16 0 3488 1536 3328 S 0.0 0:00 grep2 1.6 22191 guest1 15 0 5056 2832 4288 R 0.0 0:00 top
4 98.0 22186 guest1 26 0 26432 2704 4272 R 0.0 0:11 md
8 0.0 22185 guest1 15 0 26432 2704 4272 S 0.0 0:00 md
8 87.6 22188 guest1 25 0 26432 2704 4272 R 0.0 0:10 md
9 0.0 21551 guest1 15 0 5872 3648 4560 S 0.0 0:00 csh9 0.0 22184 guest1 15 0 26432 2704 4272 S 0.0 0:00 md
9 99.9 22183 guest1 39 0 26432 2704 4272 R 0.0 0:11 md
14 98.7 22187 guest1 39 0 26432 2704 4272 R 0.0 0:11 md
From the notation on the right of the pu list, you can see the -x 6 pattern.
100 007–4639–008

Linux®
Application Tuning Guide
place 1, skip 2 of them, place 3 more [ 0 1 1 0 0 0 ]now, reverse the bit order and create the dplace -x mask
[ 0 0 0 1 1 0 ] --> [ 0x06 ] --> decimal 6
dplace does not currently process hex notation for this bit mask)
The following example confirms that a simple dplace placement works correctly:
% setenv OMP_NUM_THREADS 4
% /usr/bin/dplace -x 6 -c 4-7 md
% pu
UID PID PPID C STIME TTY TIME CMDroot 21550 21535 0 21:48 pts/0 00:00:00 login -- guest1
guest1 21551 21550 0 21:48 pts/0 00:00:00 -csh
guest1 22219 21551 93 22:45 pts/0 00:00:05 md
guest1 22220 22219 0 22:45 pts/0 00:00:00 md
guest1 22221 22220 0 22:45 pts/0 00:00:00 mdguest1 22222 22220 93 22:45 pts/0 00:00:05 md
guest1 22223 22220 93 22:45 pts/0 00:00:05 md
guest1 22224 22220 90 22:45 pts/0 00:00:05 md
guest1 22225 21956 0 22:45 pts/1 00:00:00 ps -aef
guest1 22226 21956 0 22:45 pts/1 00:00:00 grep guest1
% top -b -n 1 | sort -n | grep guest1
LC %CPU PID USER PRI NI SIZE RSS SHARE STAT %MEM TIME COMMAND
2 0.0 22228 guest1 16 0 70048 1600 69840 S 0.0 0:00 sort
2 0.0 22229 guest1 16 0 3488 1536 3328 S 0.0 0:00 grep2 1.6 22227 guest1 15 0 5056 2832 4288 R 0.0 0:00 top
4 0.0 22220 guest1 15 0 28496 2736 21728 S 0.0 0:00 md
4 99.9 22219 guest1 39 0 28496 2736 21728 R 0.0 0:12 md
5 99.9 22222 guest1 25 0 28496 2736 21728 R 0.0 0:11 md
6 99.9 22223 guest1 39 0 28496 2736 21728 R 0.0 0:11 md7 99.9 22224 guest1 39 0 28496 2736 21728 R 0.0 0:11 md
9 0.0 21551 guest1 15 0 5872 3648 4560 S 0.0 0:00 csh
15 0.0 22221 guest1 15 0 28496 2736 21728 S 0.0 0:00 md
Combination Example (MPI and OpenMP)
For this example, explicit placement using the dplace -e -c command is used toachieve the desired placement. If an x is used in one of the CPU positions, dplacedoes not explicitly place that process.
007–4639–008 101
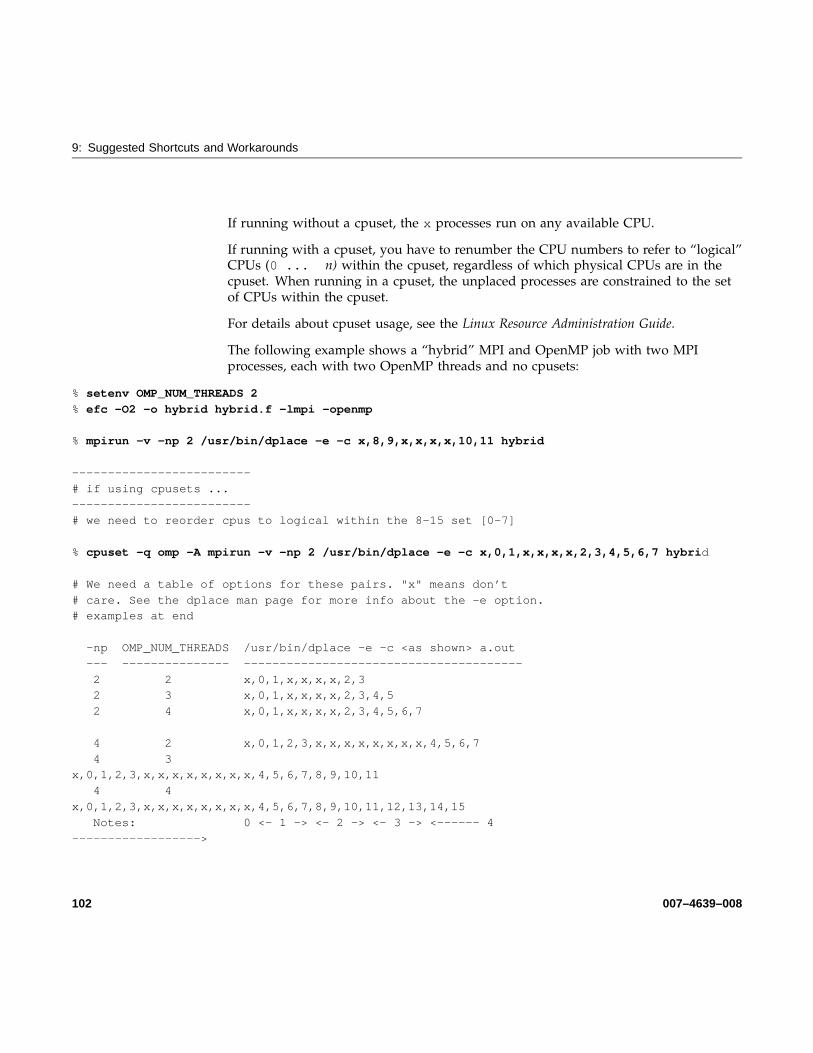
9: Suggested Shortcuts and Workarounds
If running without a cpuset, the x processes run on any available CPU.
If running with a cpuset, you have to renumber the CPU numbers to refer to “logical”CPUs (0 ... n) within the cpuset, regardless of which physical CPUs are in thecpuset. When running in a cpuset, the unplaced processes are constrained to the setof CPUs within the cpuset.
For details about cpuset usage, see the Linux Resource Administration Guide.
The following example shows a “hybrid” MPI and OpenMP job with two MPIprocesses, each with two OpenMP threads and no cpusets:
% setenv OMP_NUM_THREADS 2
% efc -O2 -o hybrid hybrid.f -lmpi -openmp
% mpirun -v -np 2 /usr/bin/dplace -e -c x,8,9,x,x,x,x,10,11 hybrid
-------------------------
# if using cpusets ...
-------------------------# we need to reorder cpus to logical within the 8-15 set [0-7]
% cpuset -q omp -A mpirun -v -np 2 /usr/bin/dplace -e -c x,0,1,x,x,x,x,2,3,4,5,6,7 hybrid
# We need a table of options for these pairs. "x" means don’t
# care. See the dplace man page for more info about the -e option.# examples at end
-np OMP_NUM_THREADS /usr/bin/dplace -e -c <as shown> a.out
--- --------------- ---------------------------------------
2 2 x,0,1,x,x,x,x,2,32 3 x,0,1,x,x,x,x,2,3,4,5
2 4 x,0,1,x,x,x,x,2,3,4,5,6,7
4 2 x,0,1,2,3,x,x,x,x,x,x,x,x,4,5,6,7
4 3x,0,1,2,3,x,x,x,x,x,x,x,x,4,5,6,7,8,9,10,11
4 4
x,0,1,2,3,x,x,x,x,x,x,x,x,4,5,6,7,8,9,10,11,12,13,14,15
Notes: 0 <- 1 -> <- 2 -> <- 3 -> <------ 4
------------------>
102 007–4639–008

Linux®
Application Tuning Guide
Notes:0. mpi daemon process
1. mpi child procs, one per np
2. omp daemon procs, one per np
3. omp daemon helper procs, one per np
4. omp thread procs, (OMP_NUM_THREADS - 1) per np
---------------------------------------------
# Example - -np 2 and OMP_NUM_THREADS 2
---------------------------------------------
% setenv OMP_NUM_THREADS 2% efc -O2 -o hybrid hybrid.f -lmpi -openmp
% mpirun -v -np 2 /usr/bin/dplace -e -c x,8,9,x,x,x,x,10,11 hybrid
% pu
UID PID PPID C STIME TTY TIME CMD
root 21550 21535 0 Mar17 pts/0 00:00:00 login -- guest1
guest1 21551 21550 0 Mar17 pts/0 00:00:00 -csh
guest1 23391 21551 0 00:32 pts/0 00:00:00 mpirun -v -np 2
/usr/bin/dplace
guest1 23394 23391 2 00:32 pts/0 00:00:00 hybrid <-- mpi daemon
guest1 23401 23394 99 00:32 pts/0 00:00:03 hybrid <-- mpi child 1
guest1 23402 23394 99 00:32 pts/0 00:00:03 hybrid <-- mpi child 2
guest1 23403 23402 0 00:32 pts/0 00:00:00 hybrid <-- omp daemon 2guest1 23404 23401 0 00:32 pts/0 00:00:00 hybrid <-- omp daemon 1
guest1 23405 23404 0 00:32 pts/0 00:00:00 hybrid <-- omp daemon hlpr 1
guest1 23406 23403 0 00:32 pts/0 00:00:00 hybrid <-- omp daemon hlpr 2
guest1 23407 23403 99 00:32 pts/0 00:00:03 hybrid <-- omp thread 2-1
guest1 23408 23404 99 00:32 pts/0 00:00:03 hybrid <-- omp thread 1-1guest1 23409 21956 0 00:32 pts/1 00:00:00 ps -aef
guest1 23410 21956 0 00:32 pts/1 00:00:00 grep guest1
% top -b -n 1 | sort -n | grep guest1
LC %CPU PID USER PRI NI SIZE RSS SHARE STAT %MEM TIME COMMAND0 0.0 21551 guest1 15 0 5904 3712 4592 S 0.0 0:00 csh
0 0.0 23394 guest1 15 0 883M 9456 882M S 0.1 0:00 hybrid
007–4639–008 103

9: Suggested Shortcuts and Workarounds
4 0.0 21956 guest1 15 0 5856 3616 5664 S 0.0 0:00 csh4 0.0 23412 guest1 16 0 70048 1600 69840 S 0.0 0:00 sort
4 1.6 23411 guest1 15 0 5056 2832 4288 R 0.0 0:00 top
5 0.0 23413 guest1 16 0 3488 1536 3328 S 0.0 0:00 grep
8 0.0 22005 guest1 15 0 5840 3584 5648 S 0.0 0:00 csh
8 0.0 23404 guest1 15 0 894M 10M 889M S 0.1 0:00 hybrid8 99.9 23401 guest1 39 0 894M 10M 889M R 0.1 0:09 hybrid
9 0.0 23403 guest1 15 0 894M 10M 894M S 0.1 0:00 hybrid
9 99.9 23402 guest1 25 0 894M 10M 894M R 0.1 0:09 hybrid
10 99.9 23407 guest1 25 0 894M 10M 894M R 0.1 0:09 hybrid
11 99.9 23408 guest1 25 0 894M 10M 889M R 0.1 0:09 hybrid
12 0.0 23391 guest1 15 0 5072 2928 4400 S 0.0 0:00 mpirun12 0.0 23406 guest1 15 0 894M 10M 894M S 0.1 0:00 hybrid
14 0.0 23405 guest1 15 0 894M 10M 889M S 0.1 0:00 hybrid
Resetting System LimitsTo regulate these limits on a per-user basis (for applications that do not rely onlimit.h), the limits.conf file can be modified. System limits that can bemodified include maximum file size, maximum number of open files, maximum stacksize, and so on. You can view this file is, as follows:
[user@machine user]# cat /etc/security/limits.conf
# /etc/security/limits.conf#
#Each line describes a limit for a user in the form:
#
# #
#Where:
# can be:# - an user name
# - a group name, with @group syntax
# - the wildcard *, for default entry
#
# can have the two values:# - "soft" for enforcing the soft limits
# - "hard" for enforcing hard limits
#
# can be one of the following:
# - core - limits the core file size (KB)
104 007–4639–008

Linux®
Application Tuning Guide
# - data - max data size (KB)# - fsize - maximum filesize (KB)
# - memlock - max locked-in-memory address space (KB)
# - nofile - max number of open files
# - rss - max resident set size (KB)
# - stack - max stack size (KB)# - cpu - max CPU time (MIN)
# - nproc - max number of processes
# - as - address space limit
# - maxlogins - max number of logins for this user
# - priority - the priority to run user process with
# - locks - max number of file locks the user can hold#
# #
#* soft core 0
#* hard rss 10000#@student hard nproc 20
#@faculty soft nproc 20
#@faculty hard nproc 50
#ftp hard nproc 0
#@student - maxlogins 4
# End of file
For instructions on how to change these limits, see "Resetting the File Limit ResourceDefault" on page 105.
Resetting the File Limit Resource Default
Several large user applications use the value set in the limit.h file as a hard limiton file descriptors and that value is noted at compile time. Therefore, someapplications may need to be recompiled in order to take advantage of the SGI Altixsystem hardware.
To regulate these limits on a per-user basis (for applications that do not rely onlimit.h), the limits.conf file can be modified. This allows the administrator toset the allowed number of open files per user and per group. This also requires aone-line change to the /etc/pam.d/login file.
Follow this procedure to execute these changes:
007–4639–008 105
9: Suggested Shortcuts and Workarounds
1. Add the following line to /etc/pam.d/login:
session required /lib/security/pam_limits.so
2. Add the following line to /etc/security/limits.conf, where username is theuser’s login and limit is the new value for the file limit resource:
[username] hard nofile [limit]
The following command shows the new limit:
ulimit -H -n
Because of the large number of file descriptors that that some applications require,such as MPI jobs, you might need to increase the system-wide limit on the number ofopen files on your Altix system. The default value for the file limit resource is 1024.The default 1024 file descriptors allows for approximately 199 MPI processes perhost.You can increase the file descriptor value to 8196 to allow for more than 512 MPIprocesses per host by adding adding the following lines to the/etc/security/limits.conf file:
* soft nofile 8196
* hard nofile 8196
For more information on setting system limits, see the Chapter 5, “Kernel TunableParameters on SGI ProPack Servers” in the Linux Configuration and Operations Guide.
Resetting the Default Stack Size
Some applications will not run well on an Altix system with a small stack size. To seta higher stack limit, follow the instructions in "Resetting the File Limit ResourceDefault" on page 105 and add the following lines to the/etc/security/limits.conf file:
Can some one send an example?
106 007–4639–008
Linux®
Application Tuning Guide
Resetting Virtual Memory Size
The virtual memory parameter vmemoryuse determines the amount of virtualmemory available to your application. You can use the ulimit -a command to viewyour current virtual memory setting, as follows:
% ulimit -a
core file size (blocks, -c) 0
data seg size (kbytes, -d) unlimitedfile size (blocks, -f) unlimited
max locked memory (kbytes, -l) 3300822
max memory size (kbytes, -m) 6680235
open files (-n) 1024
pipe size (512 bytes, -p) 8stack size (kbytes, -s) 8192
cpu time (seconds, -t) unlimited
max user processes (-u) 15515
virtual memory (kbytes, -v) 7128960
The following MPI program fails with a memory-mapping error because of a virtualmemory parameter vmemoryuse value set too low:
yoursystem2 483% limit vmemoryuse 7128960
yoursystem2 484% mpirun -v -np 4 ./program
MPI: libxmpi.so ’SGI MPI 4.9 MPT 1.14 07/18/06 08:43:15’
MPI: libmpi.so ’SGI MPI 4.9 MPT 1.14 07/18/06 08:41:05’
MPI: MPI_MSGS_MAX = 524288
MPI: MPI_BUFS_PER_PROC= 32mmap failed (memmap_base) for 504972 pages (8273461248
bytes) Killed n
The program now succeeds when virtual memory is unlimited:
yoursystem2 485% limit vmemoryuse unlimited
yoursystem2 486% mpirun -v -np 4 ./programMPI: libxmpi.so ’SGI MPI 4.9 MPT 1.14 07/18/06 08:43:15’
MPI: libmpi.so ’SGI MPI 4.9 MPT 1.14 07/18/06 08:41:05’
007–4639–008 107
9: Suggested Shortcuts and Workarounds
MPI: MPI_MSGS_MAX = 524288MPI: MPI_BUFS_PER_PROC= 32
HELLO WORLD from Processor 0
HELLO WORLD from Processor 2
HELLO WORLD from Processor 1
HELLO WORLD from Processor 3
Linux Shared Memory AccountingThe Linux operating system does not calculate memory utilization in a manner that isuseful for certain applications in situations where regions are shared among multipleprocesses. This can lead to over-reporting of memory and to processes being killed byschedulers erroneously detecting memory quota violation.
The get_weighted_memory_size function weighs shared memory regions by thenumber of processes using the regions. Thus, if 100 processes are each sharing a totalof 10GB of memory, the weighted memory calculation shows 100MB of memoryshared per process, rather than 10GB for each process.
Because this function applies mostly to applications with large shared-memoryrequirements, it is located in the SGI NUMA tools package and made available in thelibmemacct library available from a new package called memacct. The libraryfunction makes a call to the numatools kernel module, which returns the weightedsum back to the library, and then returns back to the application.
The usage statement for the memacct call is, as follows:
cc ... -lmemacct
#include <sys/types.h>
extern int get_weighted_memory_size(pid_t pid);
The syntax of the memacct call is, as follows:
int *get_weighted_memory_size(pid_t pid);
Returns the weighted memory (RSS) size for a pid, in bytes. This weights the size ofshared regions by the number of processes accessing it. Return -1 when an erroroccurs and set errno, as follows:
108 007–4639–008
Linux®
Application Tuning Guide
ESRCH Process pid was not found.
ENOSYS The function is not implemented. Check if numatoolskernel package is up-to-date.
Normally, the following errors should not occur:
ENOENT Can not open /proc/numatools device file.
EPERM No read permission on /proc/numatools device file.
ENOTTY Inappropriate ioctl operation on /proc/numatoolsdevice file.
EFAULT Invalid arguments. The ioctl() operation performedby the function failed with invalid arguments.
For more information, see the memacct(3) man page.
007–4639–008 109

Index
A
Altix architecture overviewAltix 3000 series systems, 2Altix 4000 series systems, 3
Amdahl’s law, 80execution time given n and p, 84parallel fraction p, 82parallel fraction p given speedup( n ), 83speedup(n ) given p, 82superlinear speedup, 82
analysissystem configuration, 13
application tuning process, 13automatic parallelization
limitations, 77
C
cache bank conflicts, 71cache performance, 70cacheline traffic and CPU utilization, 33cluster environment, 1commands
dlook, 57dplace, 49topology, 28
common compiler options, 7compiler command line, 7compiler libaries
C/C++, 9dynamic libraries, 9message passing, 10overview, 9
compiler librariesstatic libraries, 9
compiler optionstracing and porting, 66
compiler options for tuning, 69compiling environment, 7
compiler overview, 7debugger overview, 11libraries, 9modules, 8
CPU utilization, 33CPU-bound processes, 14csrep command, 19
D
data decomposition, 73data dependency, 77data parallelism, 73data placement tools, 43
cpusets, 44dplace, 44overview, 43runon, 44
debugger overview, 11debuggers, 22
gdb, 11idb, 11TotalView, 11
denormalized arithmetic, 8determining parallel code amount, 74determining tuning needs
tools used, 68dlook command, 57dplace command, 49dumppm, 19
007–4639–008 111
Index
E
Electric Fence debugger, 66Environment variables, 79explicit data decomposition, 73
F
False sharing, 78file limit resources
resetting, 105Flexible File I/O (FFIO), 92
environment variables to set, 88operation, 87overview, 87simple examples, 89
floating-point programs, 84Floating-Point Software Assist, 84FPSWA
See "Floating-Point Software Assist", 84functional parallelism, 73
G
gdb tool, 22GNU debugger, 22gtopology command, 30GuideView tool, 20
H
hinv command, 28histx, 16histx data collection, 16histx filters, 19
I
I/O-bound processes, 14idb tool, 23implicit data decomposition, 73iostat command, 39iprep command, 19
L
latency, 1limits
system, 104linkstat command, 34lipfpm command, 17
M
memory management, 5, 72memory page, 5memory strides, 71memory-bound processes, 14Message Passing Toolkit
for parallelization, 75using profile.pl, 16
modules, 8command examples, 8
MPP definition, 1
N
NUMA Toolscommand
dlook, 56dplace, 49runon, 48taskset, 48
installing, 63
112 007–4639–008
Linux®
Application Tuning Guide
O
OpenMP, 76environment variables, 79Guide OpenMP Compiler, 22
P
parallel executionAmdahl’s law, 80parallel fraction p, 82
parallel speedup, 81parallelization
automatic, 77using MPI, 75using OpenMP, 76
performanceAssure Thread Analyzer, 22Guide OpenMP Compiler, 22GuideView, 20VTune, 20
performance analysis, 13Performance Co-Pilot monitoring tools, 32
linkstat, 34Other Performance Co-Pilot monitoring tools, 34pmshub, 33shubstats, 33
performance gainstypes of, 13
performance problemssources, 14
pfmon tool, 15pmshub command, 33process placement, 97
MPI and OpenMP, 101set-up, 97using OpenMP, 100using pthreads, 98
profile.pl script, 15profiling
pfmon, 15
profile.pl, 15ps command, 37
R
resetting default system stack size, 107resetting file limit resources, 105resetting system limit resources, 104resident set size, 5runon command, 48
S
samppm command, 19sar command, 39scalable computing, 1SHMEM, 10shortening execution time, 80shubstats command, 33SMP definition, 1stack size
resetting, 107superlinear speedup, 82swap space, 5system
overview, 1system configuration, 13system limit resources
resetting, 104system limits
address space limit, 105core file siz, 105CPU time, 105data size, 105file locks, 105file size, 105locked-in-memory address space, 105number of logins, 105number of open files, 105
007–4639–008 113
Index
number of processes, 105priority of user process, 105resetting, 104resident set size, 105stack size, 105
system monitoring tools, 27command
hinv, 28topology, 28
system usage commands, 36iostat, 39ps, 37sar, 39top, 38uptime, 36vmstat, 38w, 37
T
taskset command, 45tools
Assure Thread Analyzer, 22Guide OpenMP Compiler, 22GuideView, 20pfmon, 15profile.pl, 15, 16VTune, 20
top command, 38topology command, 28tuning
cache performance, 70debugging tools
Electric Fence, 66idb, 23
dplace, 79Electric Fence, 66environment variables, 79false sharing, 78
heap corruption, 66managing memory, 72multiprocessor code, 72parallelization, 74profiling
GuideView, 20histx command, 16mpirun command, 16pfmon, 15profile.pl script, 15VTune analyzer, 20
single processor code, 65using compiler options, 69using dplace, 79using math functions, 68using runon, 79verifying correct results, 66
U
uname command, 14unflow arithmetic
effects of, 8uptime command, 36
V
virtual addressing, 5virtual memory, 5vmstat command, 38VTune performance analyzer, 20
W
w command, 37
114 007–4639–008