linking the minnesota mca-iii assessments to nwea … · linking the minnesota mca-iii assessments...
TRANSCRIPT

LinkingtheMinnesotaMCA-IIIAssessmentstoNWEAMAPTests
June,2016

Page2of23
Introduction
Northwest EvaluationAssociation™ (NWEA™) is committed to providing partnerswith usefultools to help make inferences from the Measures of Academic Progress® (MAP®) interimassessment scores. One important tool is the concordance table between MAP and statesummativeassessments.Concordance tableshavebeenused fordecades to relate scoresondifferent testsmeasuring similar but distinct constructs. These tables, typically derived fromstatisticallinkingprocedures,provideadirectlinkbetweenscoresondifferenttestsandservevarious purposes. Aside fromdescribing how a score on one test relates to performance onanothertest,theycanalsobeusedtoidentifybenchmarkscoresononetestcorrespondingtoperformancecategoriesonanothertest,ortomaintaincontinuityofscoresonatestafterthetest is redesigned or changed. Concordance tables are helpful for educators, parents,administrators,researchers,andpolicymakerstoevaluateandformulateacademicstandingandgrowth.
Recently, NWEA completed a concordance study to connect the scales of the MinnesotaComprehensiveAssessments-SeriesIII(MCA-III)readingandmathwiththoseoftheMAPReadingandMAPforMathematicsassessments.Inthisreport,wepresentthe3rdthrough8thgradecutscoresonMAPreadingandmathematicsscalesthatcorrespondtothebenchmarksontheMCA-IIIreadingandmathtests.Informationabouttheconsistencyrateofclassificationbasedontheestimated MAP cut scores is also provided, along with a series of tables that predict theprobabilityof receivingaLevel3 (i.e.,“Proficient”)orhigherperformancedesignationontheMCA-IIIassessments,basedontheobservedMAPscorestakenduringthesameschoolyear.Adetailed description of the data and analysis method used in this study is provided in theAppendix.
OverviewofAssessments
MCA-IIIincludesaseriesofachievementtestsalignedtotheMinnesotaK-12AcademicStandardsinEnglishLanguageArts(ELA)andmathforgrades3-8and10-11,andscienceforgrades5and8.MCA-IIItestsaredeliveredonline.Foreachgradeandsubject,therearethreecutscoresthatdistinguishbetweenperformancelevels:Level1:Doesnotmeetthestandards,Level2:Partiallymeetsthestandards,Level3:Meetsthestandards,andLevel4:Exceedsthestandards.TheLevel3 cut score demarks the minimum level of performance considered to be “Proficient” foraccountabilitypurposes.
MAPtestsareinterimassessmentsthatareadministeredintheformofacomputerizedadaptivetest(CAT).MAPtestsareconstructedtomeasurestudentachievementfromGradesKto12inmath,reading,languageusage,andscienceandalignedtotheMinnesotaStateStandards.Unlike

Page3of23
MCA-III,MAP assessments are vertically scaled across grades, a feature that supports directmeasurementofacademicgrowthandchange.MAPscoresarereportedonaRaschUnit(RIT)scalewitharangefrom100to350.EachsubjecthasitsownRITscale.
ToaidinterpretationofMAPscores,NWEAperiodicallyconductsnormingstudiesofstudentandschoolperformanceonMAP.Forexample,the2015RITScalenormingStudy(Thum&Hauser,2015)employedmulti-levelgrowthmodelsonnearly500,000longitudinaltestscoresfromover100,000studentsthatwereweightedtocreatelarge,nationallyrepresentativenormsformath,reading,languageusage,andgeneralscience.
EstimatedMAPCutScoresAssociatedwithMCA-IIIReadinessLevels
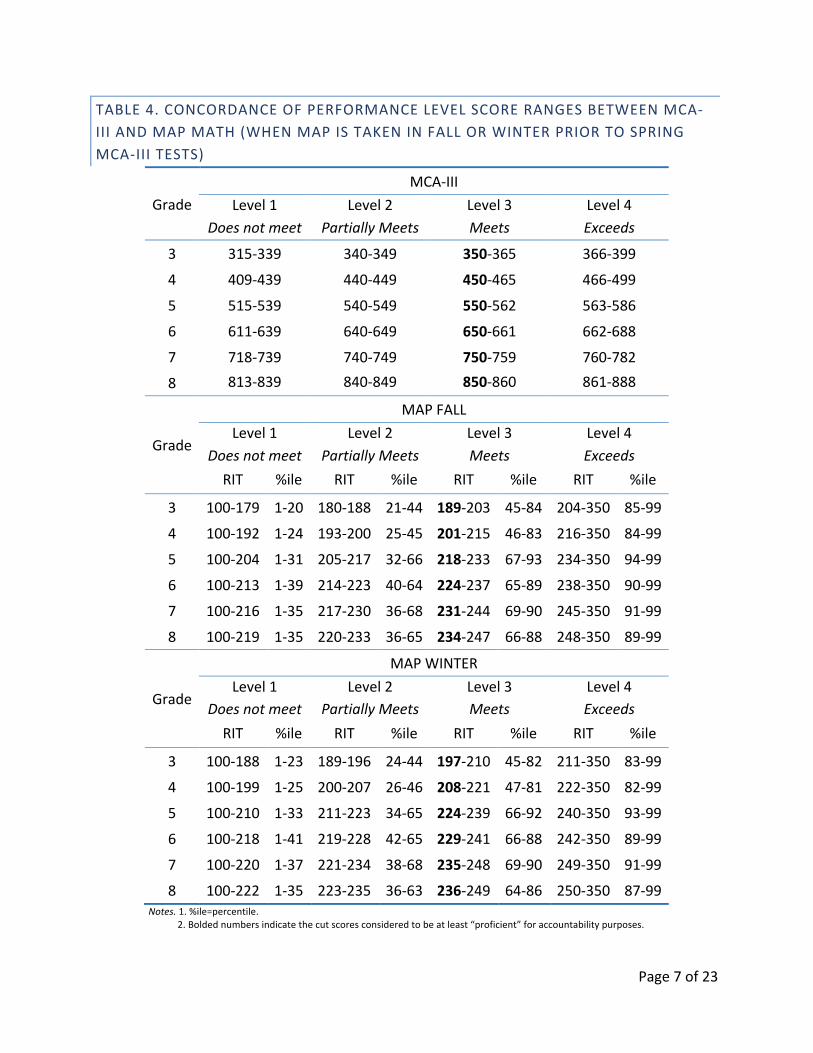
Tables1to4reporttheMCA-IIIscaledscoresassociatedwitheachofthefourperformancelevels,aswellastheestimatedscorerangeontheMAPtestsassociatedwitheachMCA-IIIperformancelevel.Specifically,Tables1and2applytoMAPscoresobtainedduringthespringtestingseasonforreadingandmath,respectively.Tables3and4applytoMAPteststakeninapriortestingseason(fallorwinter)forreadingandmath,respectively.Thetablesalsoreportthepercentilerank(basedontheNWEA2015MAPNorms)associatedwitheachestimatedMAPcutscore.TheMAPcutscorescanbeusedtopredictstudents’mostprobableMCA-IIIperformancelevel,basedontheirobservedMAPscores.Forexample,a5thgradestudentwhoobtainedaMAPmathscoreof240inthespringtestingseasonislikelytobeattheveryhighendofLevel3(Meets)ontheMCA-IIItakenduringthatsametestingseason(seeTable2).Similarly,a3rdgradestudentwhoobtainedaMAPreadingscoreof215inthefalltestingseasonislikelytobeatLevel4(Exceeds)ontheMCA-IIItakeninthespringof3rdgrade(seeTable3).

Page4of23
TABLE1.CONCORDANCEOFPERFORMANCELEVELSCORERANGESBETWEENMCA-
IIIANDMAPREADING(WHENMAPISTAKENINSPRING)
Grade
MCA-III
Level1Doesnotmeet
Level2PartiallyMeets
Level3Meets
Level4Exceeds
3 301-339 340-349 350-373 374-399
4 411-439 440-449 450-465 466-490
5 517-539 540-549 550-566 567-591
6 606-639 640-649 650-666 667-699
7 703-739 740-749 750-766 767-798
8 802-839 840-849 850-866 867-898
Grade
MAP
Level1Doesnotmeet
Level2PartiallyMeets
Level3Meets
Level4Exceeds
RIT %ile RIT %ile RIT %ile RIT %ile
3 100-194 1-39 195-200 40-54 201-216 55-88 217-350 89-99
4 100-200 1-35 201-209 36-59 210-222 60-86 223-350 87-99
5 100-201 1-24 202-212 25-51 213-228 52-87 229-350 88-99
6 100-209 1-33 210-216 34-52 217-228 53-80 229-350 81-99
7 100-215 1-43 216-223 44-63 224-236 64-88 237-350 89-99
8 100-219 1-48 220-226 49-65 227-238 66-87 239-350 88-99Notes.1.%ile=percentile.2.Boldednumbersindicatethecutscoresconsideredtobeatleast“proficient”foraccountabilitypurposes.

Page5of23
TABLE2.CONCORDANCEOFPERFORMANCELEVELSCORERANGESBETWEENMCA-
IIIANDMAPMATH(WHENMAPISTAKENINSPRING)
Grade
MCA-III
Level1Doesnotmeet
Level2PartiallyMeets
Level3Meets
Level4Exceeds
3 315-339 340-349 350-365 366-399
4 409-439 440-449 450-465 466-499
5 515-539 540-549 550-562 563-586
6 611-639 640-649 650-661 662-688
7 718-739 740-749 750-759 760-782
8 813-839 840-849 850-860 861-888
Grade
MAP
Level1Doesnotmeet
Level2PartiallyMeets
Level3Meets
Level4Exceeds
RIT %ile RIT %ile RIT %ile RIT %ile
3 100-193 1-23 194-201 24-44 202-215 45-80 216-350 81-99
4 100-204 1-27 205-212 28-47 213-226 48-80 227-350 81-99
5 100-214 1-33 215-227 34-64 228-243 65-91 244-350 92-99
6 100-221 1-40 222-231 41-64 232-244 65-87 245-350 88-99
7 100-222 1-36 223-236 37-67 237-250 68-89 251-350 90-99
8 100-224 1-36 225-237 37-63 238-251 64-85 252-350 86-99Notes.1.%ile=percentile.
2.Boldednumbersindicatethecutscoresconsideredtobeatleast“proficient”foraccountabilitypurposes.

Page6of23
TABLE3.CONCORDANCEOFPERFORMANCELEVELSCORERANGESBETWEENMCA-IIIANDMAPREADING(WHENMAPISTAKENINFALLORWINTERPRIORTOSPRINGMCA-IIITESTS)
GradeMCA-III
Level1Doesnotmeet
Level2PartiallyMeets
Level3Meets
Level4Exceeds
3 301-339 340-349 350-373 374-399
4 411-439 440-449 450-465 466-490
5 517-539 540-549 550-566 567-591
6 606-639 640-649 650-666 667-699
7 703-739 740-749 750-766 767-798
8 802-839 840-849 850-866 867-898
Grade
MAPFALLLevel1
DoesnotmeetLevel2
PartiallyMeetsLevel3Meets
Level4Exceeds
RIT %ile RIT %ile RIT %ile RIT %ile
3 100-183 1-38 184-190 39-55 191-209 56-90 210-350 91-99
4 100-191 1-33 192-202 34-60 203-217 61-89 218-350 90-99
5 100-193 1-21 194-206 22-52 207-225 53-90 226-350 91-99
6 100-203 1-30 204-211 31-51 212-225 52-83 226-350 84-99
7 100-211 1-42 212-220 43-65 221-234 66-90 235-350 91-99
8 100-216 1-48 217-224 49-67 225-236 68-88 237-350 89-99
Grade
MAPWINTERLevel1
DoesnotmeetLevel2
PartiallyMeetsLevel3Meets
Level4Exceeds
RIT %ile RIT %ile RIT %ile RIT %ile
3 100-191 1-39 192-197 40-54 198-214 55-89 215-350 90-99
4 100-197 1-34 198-207 35-60 208-221 61-88 222-350 89-99
5 100-198 1-21 199-210 22-51 211-227 52-88 228-350 89-99
6 100-207 1-32 208-215 33-53 216-227 54-81 228-350 82-99
7 100-214 1-43 215-222 44-64 223-235 65-89 236-350 90-99
8 100-218 1-48 219-225 49-66 226-237 67-88 238-350 89-99Notes.1.%ile=percentile.
2.Boldednumbersindicatethecutscoresconsideredtobeatleast“proficient”foraccountabilitypurposes.
Page7of23
TABLE4.CONCORDANCEOFPERFORMANCELEVELSCORERANGESBETWEENMCA-IIIANDMAPMATH(WHENMAPISTAKENINFALLORWINTERPRIORTOSPRINGMCA-IIITESTS)
GradeMCA-III
Level1Doesnotmeet
Level2PartiallyMeets
Level3Meets
Level4Exceeds
3 315-339 340-349 350-365 366-399
4 409-439 440-449 450-465 466-499
5 515-539 540-549 550-562 563-586
6 611-639 640-649 650-661 662-688
7 718-739 740-749 750-759 760-782
8 813-839 840-849 850-860 861-888
Grade
MAPFALLLevel1
DoesnotmeetLevel2
PartiallyMeetsLevel3Meets
Level4Exceeds
RIT %ile RIT %ile RIT %ile RIT %ile
3 100-179 1-20 180-188 21-44 189-203 45-84 204-350 85-99
4 100-192 1-24 193-200 25-45 201-215 46-83 216-350 84-99
5 100-204 1-31 205-217 32-66 218-233 67-93 234-350 94-99
6 100-213 1-39 214-223 40-64 224-237 65-89 238-350 90-99
7 100-216 1-35 217-230 36-68 231-244 69-90 245-350 91-99
8 100-219 1-35 220-233 36-65 234-247 66-88 248-350 89-99
Grade
MAPWINTERLevel1
DoesnotmeetLevel2
PartiallyMeetsLevel3Meets
Level4Exceeds
RIT %ile RIT %ile RIT %ile RIT %ile
3 100-188 1-23 189-196 24-44 197-210 45-82 211-350 83-99
4 100-199 1-25 200-207 26-46 208-221 47-81 222-350 82-99
5 100-210 1-33 211-223 34-65 224-239 66-92 240-350 93-99
6 100-218 1-41 219-228 42-65 229-241 66-88 242-350 89-99
7 100-220 1-37 221-234 38-68 235-248 69-90 249-350 91-99
8 100-222 1-35 223-235 36-63 236-249 64-86 250-350 87-99Notes.1.%ile=percentile.
2.Boldednumbersindicatethecutscoresconsideredtobeatleast“proficient”foraccountabilitypurposes.

Page8of23
ConsistencyRateofClassification
Consistencyrateofclassification(Pommerich,Hanson,Harris,&Sconing,2004),expressedintheformofaratebetween0and1,providesameanstomeasurethedeparturefromequity forconcordances(Hansonetal.,2001).ThisindexcanalsobeusedasanindicatorforthepredictivevalidityoftheMAPtests,i.e.,howaccuratelytheMAPscorescanpredictastudent’sproficiencystatus in theMCA-III test. For each pair of concordant scores, a classification is consideredconsistentiftheexamineeisclassifiedintothesameperformancecategoryregardlessofthetestusedformakingadecision.Consistencyrateprovidedinthisreportcanbecalculatedas,forthe“proficient”performancecategoryconcordantscores,thepercentageofexamineeswhoscoreatorabovebothconcordantscoresplusthepercentageofexamineeswhoscorebelowbothconcordantscoresoneachtest.HigherconsistencyrateindicatesstrongercongruencebetweenMCA-IIIandMAPcutscores.Theresults inTable5demonstratethatMAPreadingscorescanconsistentlyclassifystudents’proficiency(Level3orhigher)statusonMCA-IIIreadingtest84-86%ofthetimeandMAPmathscorescanconsistentlyclassifystudentsonMCA-IIImathtest86-90%ofthetime.ThosenumbersarehighsuggestingthatbothMAPreadingandmathtestsaregreatpredictorsofthestudents’proficiencystatusontheMCA-IIItests.
TABLE5.CONSISTENCYRATEOFCLASSIFICATIONFORMAPANDMCA-IIILEVEL3
EQUIPERCENTILECONCORDANCES
GradeReading Math
ConsistencyRate
False ConsistencyRate
FalsePositives Negatives Positives Negatives
3 0.86 0.08 0.06 0.90 0.06 0.044 0.85 0.07 0.08 0.90 0.06 0.045 0.86 0.06 0.08 0.88 0.06 0.066 0.86 0.08 0.06 0.89 0.05 0.067 0.84 0.08 0.08 0.88 0.06 0.068 0.85 0.07 0.08 0.86 0.07 0.07
ProficiencyProjection
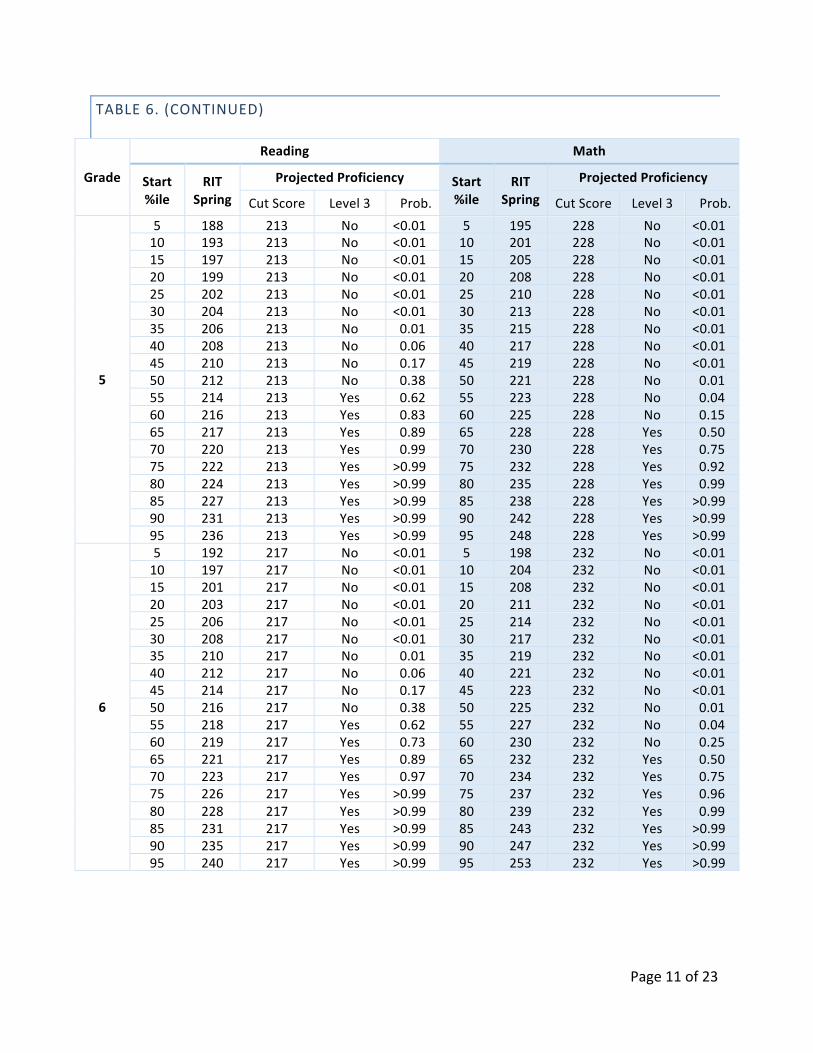
Proficiencyprojectiontellshowlikelyastudentisclassifiedas“proficient”onMCA-IIItestsbasedonhis/herobservedMAPscores.Theconditionalgrowthnormsprovidedinthe2015MAPNormswere used to calculate this information (Thum & Hauser, 2015). The results of proficiencyprojection and corresponding probability of achieving “proficient” on the MCA-III tests are

Page9of23
presentedinTables6to8.ThesetablesestimatetheprobabilityofscoringatLevel3oraboveonMCA-IIIinthespringandthepriorfallorwintertestingseason.Forexample,ifa3rdgradestudentobtainedaMAPreadingscoreof202inthefall,theprobabilityofobtainingaLevel3orhigherMCA-IIIscoreinthespringof3rdgradeis90%.Table6presentstheestimatedprobabilityofmeetingLevel3benchmarkwhenMAPistakeninthespring,whereasTables7and8presenttheestimatedprobabilityofmeetingLevel3benchmarkwhenMAPistakeninthefallorwinterpriortotakingtheMCA-IIItests.

Page10of23
TABLE6.PROFICIENCYPROJECTIONANDPROBABILITYFORPASSINGMCA-IIILEVEL3(MEETS)WHENMAPISTAKENINTHESPRING
Grade
Reading Math
Start%ile
RITSpring
ProjectedProficiency Start%ile
RITSpring
ProjectedProficiency
CutScore Level3 Prob. CutScore Level3 Prob.
3
5 174 201 No <0.01 5 181 202 No <0.0110 179 201 No <0.01 10 186 202 No <0.0115 183 201 No <0.01 15 189 202 No <0.0120 186 201 No <0.01 20 192 202 No <0.0125 188 201 No <0.01 25 194 202 No <0.0130 191 201 No <0.01 30 196 202 No 0.0235 193 201 No 0.01 35 198 202 No 0.0840 195 201 No 0.03 40 200 202 No 0.2545 197 201 No 0.11 45 202 202 Yes 0.5050 199 201 No 0.27 50 203 202 Yes 0.6355 201 201 Yes 0.50 55 205 202 Yes 0.8560 202 201 Yes 0.62 60 207 202 Yes 0.9665 204 201 Yes 0.83 65 209 202 Yes 0.9970 207 201 Yes 0.97 70 211 202 Yes >0.9975 209 201 Yes 0.99 75 213 202 Yes >0.9980 211 201 Yes >0.99 80 215 202 Yes >0.9985 214 201 Yes >0.99 85 218 202 Yes >0.9990 218 201 Yes >0.99 90 221 202 Yes >0.9995 223 201 Yes >0.99 95 226 202 Yes >0.99
4
5 181 210 No <0.01 5 189 213 No <0.0110 187 210 No <0.01 10 194 213 No <0.0115 190 210 No <0.01 15 198 213 No <0.0120 193 210 No <0.01 20 201 213 No <0.0125 196 210 No <0.01 25 203 213 No <0.0130 198 210 No <0.01 30 206 213 No 0.0135 200 210 No <0.01 35 208 213 No 0.0440 202 210 No 0.01 40 210 213 No 0.1545 204 210 No 0.03 45 212 213 No 0.3750 206 210 No 0.11 50 213 213 Yes 0.5055 208 210 No 0.27 55 215 213 Yes 0.7560 210 210 Yes 0.50 60 217 213 Yes 0.9265 212 210 Yes 0.73 65 219 213 Yes 0.9870 214 210 Yes 0.89 70 221 213 Yes >0.9975 216 210 Yes 0.97 75 224 213 Yes >0.9980 218 210 Yes 0.99 80 226 213 Yes >0.9985 221 210 Yes >0.99 85 229 213 Yes >0.9990 225 210 Yes >0.99 90 233 213 Yes >0.9995 230 210 Yes >0.99 95 238 213 Yes >0.99
Page11of23
TABLE6.(CONTINUED)
Grade
Reading Math
Start%ile
RITSpring
ProjectedProficiency Start%ile
RITSpring
ProjectedProficiency
CutScore Level3 Prob. CutScore Level3 Prob.
5
5 188 213 No <0.01 5 195 228 No <0.0110 193 213 No <0.01 10 201 228 No <0.0115 197 213 No <0.01 15 205 228 No <0.0120 199 213 No <0.01 20 208 228 No <0.0125 202 213 No <0.01 25 210 228 No <0.0130 204 213 No <0.01 30 213 228 No <0.0135 206 213 No 0.01 35 215 228 No <0.0140 208 213 No 0.06 40 217 228 No <0.0145 210 213 No 0.17 45 219 228 No <0.0150 212 213 No 0.38 50 221 228 No 0.0155 214 213 Yes 0.62 55 223 228 No 0.0460 216 213 Yes 0.83 60 225 228 No 0.1565 217 213 Yes 0.89 65 228 228 Yes 0.5070 220 213 Yes 0.99 70 230 228 Yes 0.7575 222 213 Yes >0.99 75 232 228 Yes 0.9280 224 213 Yes >0.99 80 235 228 Yes 0.9985 227 213 Yes >0.99 85 238 228 Yes >0.9990 231 213 Yes >0.99 90 242 228 Yes >0.9995 236 213 Yes >0.99 95 248 228 Yes >0.99
6
5 192 217 No <0.01 5 198 232 No <0.0110 197 217 No <0.01 10 204 232 No <0.0115 201 217 No <0.01 15 208 232 No <0.0120 203 217 No <0.01 20 211 232 No <0.0125 206 217 No <0.01 25 214 232 No <0.0130 208 217 No <0.01 30 217 232 No <0.0135 210 217 No 0.01 35 219 232 No <0.0140 212 217 No 0.06 40 221 232 No <0.0145 214 217 No 0.17 45 223 232 No <0.0150 216 217 No 0.38 50 225 232 No 0.0155 218 217 Yes 0.62 55 227 232 No 0.0460 219 217 Yes 0.73 60 230 232 No 0.2565 221 217 Yes 0.89 65 232 232 Yes 0.5070 223 217 Yes 0.97 70 234 232 Yes 0.7575 226 217 Yes >0.99 75 237 232 Yes 0.9680 228 217 Yes >0.99 80 239 232 Yes 0.9985 231 217 Yes >0.99 85 243 232 Yes >0.9990 235 217 Yes >0.99 90 247 232 Yes >0.9995 240 217 Yes >0.99 95 253 232 Yes >0.99

Page12of23
TABLE6.(CONTINUED)
Grade
Reading Math
Start%ile
RITSpring
ProjectedProficiency Start%ile
RITSpring
ProjectedProficiency
CutScore Level3 Prob. CutScore Level3 Prob.
7
5 193 224 No <0.01 5 199 237 No <0.0110 199 224 No <0.01 10 206 237 No <0.0115 202 224 No <0.01 15 210 237 No <0.0120 205 224 No <0.01 20 214 237 No <0.0125 208 224 No <0.01 25 217 237 No <0.0130 210 224 No <0.01 30 219 237 No <0.0135 212 224 No <0.01 35 222 237 No <0.0140 214 224 No <0.01 40 224 237 No <0.0145 216 224 No 0.01 45 226 237 No <0.0150 218 224 No 0.03 50 229 237 No <0.0155 220 224 No 0.11 55 231 237 No 0.0260 222 224 No 0.27 60 233 237 No 0.0865 224 224 Yes 0.50 65 235 237 No 0.2570 226 224 Yes 0.73 70 238 237 Yes 0.6375 228 224 Yes 0.89 75 241 237 Yes 0.9280 231 224 Yes 0.99 80 244 237 Yes 0.9985 234 224 Yes >0.99 85 247 237 Yes >0.9990 238 224 Yes >0.99 90 251 237 Yes >0.9995 243 224 Yes >0.99 95 258 237 Yes >0.99
8
5 194 227 No <0.01 5 199 238 No <0.0110 200 227 No <0.01 10 206 238 No <0.0115 204 227 No <0.01 15 211 238 No <0.0120 207 227 No <0.01 20 215 238 No <0.0125 209 227 No <0.01 25 218 238 No <0.0130 212 227 No <0.01 30 221 238 No <0.0135 214 227 No <0.01 35 224 238 No <0.0140 216 227 No <0.01 40 226 238 No <0.0145 218 227 No <0.01 45 229 238 No <0.0150 220 227 No 0.01 50 231 238 No 0.0155 222 227 No 0.06 55 233 238 No 0.0460 224 227 No 0.17 60 236 238 No 0.2565 226 227 No 0.38 65 238 238 Yes 0.5070 228 227 Yes 0.62 70 241 238 Yes 0.8575 231 227 Yes 0.89 75 244 238 Yes 0.9880 233 227 Yes 0.97 80 247 238 Yes >0.9985 236 227 Yes >0.99 85 251 238 Yes >0.9990 240 227 Yes >0.99 90 255 238 Yes >0.9995 246 227 Yes >0.99 95 262 238 Yes >0.99
Note.%ile=percentile

Page13of23
TABLE7.PROFICIENCYPROJECTIONANDPROBABILITYFORPASSINGMCA-IIIREADINGLEVEL3(MEETS)WHENMAPISTAKENINTHEFALLORWINTERPRIORTOSPRINGMCA-IIITESTS
GradeStart%ile
RITFall
ProjectedProficiency Start%ile
RITWinter
ProjectedProficiencyCutScore Level3 Prob. CutScore Level3 Prob.
3
5 162 201 No <0.01 5 171 201 No <0.0110 168 201 No <0.01 10 176 201 No <0.0115 172 201 No 0.01 15 180 201 No <0.0120 175 201 No 0.03 20 183 201 No <0.0125 178 201 No 0.06 25 185 201 No 0.0130 180 201 No 0.10 30 188 201 No 0.0435 182 201 No 0.13 35 190 201 No 0.0640 184 201 No 0.20 40 192 201 No 0.1345 186 201 No 0.29 45 194 201 No 0.2250 188 201 No 0.34 50 196 201 No 0.3555 190 201 No 0.44 55 198 201 Yes 0.5060 192 201 Yes 0.56 60 199 201 Yes 0.5865 194 201 Yes 0.61 65 201 201 Yes 0.7270 197 201 Yes 0.76 70 204 201 Yes 0.8775 199 201 Yes 0.84 75 206 201 Yes 0.9180 202 201 Yes 0.90 80 208 201 Yes 0.9685 205 201 Yes 0.95 85 211 201 Yes 0.9990 209 201 Yes 0.98 90 215 201 Yes >0.9995 214 201 Yes >0.99 95 221 201 Yes >0.99
4
5 173 210 No <0.01 5 179 210 No <0.0110 178 210 No <0.01 10 184 210 No <0.0115 182 210 No <0.01 15 188 210 No <0.0120 185 210 No 0.01 20 191 210 No <0.0125 188 210 No 0.03 25 194 210 No 0.0130 190 210 No 0.05 30 196 210 No 0.0235 192 210 No 0.09 35 198 210 No 0.0440 194 210 No 0.12 40 200 210 No 0.0845 196 210 No 0.18 45 202 210 No 0.1250 198 210 No 0.27 50 204 210 No 0.2255 200 210 No 0.33 55 205 210 No 0.2860 202 210 No 0.44 60 207 210 No 0.4265 204 210 Yes 0.56 65 209 210 Yes 0.5870 206 210 Yes 0.67 70 211 210 Yes 0.7275 209 210 Yes 0.77 75 214 210 Yes 0.8880 211 210 Yes 0.85 80 216 210 Yes 0.9485 214 210 Yes 0.91 85 219 210 Yes 0.9890 218 210 Yes 0.97 90 223 210 Yes >0.9995 224 210 Yes >0.99 95 228 210 Yes >0.99

Page14of23
TABLE7.(CONTINUED)
GradeStart%ile
RITFall
ProjectedProficiency Start%ile
RITWinter
ProjectedProficiencyCut-Score Level3 Prob. Cut-Score Level3 Prob.
5
5 181 213 No <0.01 5 186 213 No <0.0110 186 213 No <0.01 10 191 213 No <0.0115 190 213 No 0.01 15 195 213 No <0.0120 193 213 No 0.04 20 197 213 No 0.0125 195 213 No 0.07 25 200 213 No 0.0330 198 213 No 0.12 30 202 213 No 0.0435 200 213 No 0.19 35 204 213 No 0.0940 202 213 No 0.28 40 206 213 No 0.1745 204 213 No 0.33 45 208 213 No 0.2850 206 213 No 0.44 50 210 213 No 0.4255 208 213 Yes 0.56 55 212 213 Yes 0.5860 210 213 Yes 0.67 60 214 213 Yes 0.7265 212 213 Yes 0.72 65 215 213 Yes 0.7870 214 213 Yes 0.81 70 218 213 Yes 0.9175 216 213 Yes 0.88 75 220 213 Yes 0.9480 218 213 Yes 0.91 80 222 213 Yes 0.9785 221 213 Yes 0.96 85 225 213 Yes 0.9990 225 213 Yes 0.99 90 229 213 Yes >0.9995 231 213 Yes >0.99 95 234 213 Yes >0.99
6
5 186 217 No <0.01 5 190 217 No <0.0110 192 217 No <0.01 10 196 217 No <0.0115 196 217 No 0.02 15 199 217 No <0.0120 198 217 No 0.03 20 202 217 No 0.0125 201 217 No 0.07 25 204 217 No 0.0230 203 217 No 0.12 30 207 217 No 0.0635 205 217 No 0.19 35 209 217 No 0.1240 207 217 No 0.23 40 211 217 No 0.2245 209 217 No 0.33 45 212 217 No 0.2850 211 217 No 0.44 50 214 217 No 0.4255 213 217 Yes 0.56 55 216 217 Yes 0.5060 215 217 Yes 0.61 60 218 217 Yes 0.6565 217 217 Yes 0.72 65 220 217 Yes 0.7870 219 217 Yes 0.81 70 222 217 Yes 0.8875 221 217 Yes 0.84 75 224 217 Yes 0.9480 224 217 Yes 0.93 80 226 217 Yes 0.9785 226 217 Yes 0.96 85 229 217 Yes 0.9990 230 217 Yes 0.99 90 233 217 Yes >0.9995 236 217 Yes >0.99 95 238 217 Yes >0.99

Page15of23
TABLE7.(CONTINUED)
GradeStart%ile
RITFall
ProjectedProficiency Start%ile
RITWinter
ProjectedProficiencyCut-Score Level3 Prob. Cut-Score Level3 Prob.
7
5 189 224 No <0.01 5 192 224 No <0.0110 195 224 No <0.01 10 198 224 No <0.0115 199 224 No <0.01 15 201 224 No <0.0120 202 224 No 0.01 20 204 224 No <0.0125 204 224 No 0.01 25 207 224 No <0.0130 206 224 No 0.03 30 209 224 No 0.0135 209 224 No 0.05 35 211 224 No 0.0240 211 224 No 0.10 40 213 224 No 0.0345 213 224 No 0.15 45 215 224 No 0.0650 214 224 No 0.19 50 217 224 No 0.1255 216 224 No 0.23 55 219 224 No 0.2260 218 224 No 0.33 60 221 224 No 0.3565 220 224 No 0.44 65 223 224 Yes 0.5070 222 224 Yes 0.56 70 225 224 Yes 0.6575 225 224 Yes 0.67 75 227 224 Yes 0.7880 227 224 Yes 0.77 80 230 224 Yes 0.9185 230 224 Yes 0.88 85 232 224 Yes 0.9490 234 224 Yes 0.95 90 236 224 Yes 0.9995 240 224 Yes 0.99 95 242 224 Yes >0.99
8
5 191 227 No <0.01 5 194 227 No <0.0110 197 227 No <0.01 10 199 227 No <0.0115 201 227 No <0.01 15 203 227 No <0.0120 204 227 No 0.01 20 206 227 No <0.0125 207 227 No 0.02 25 209 227 No <0.0130 209 227 No 0.04 30 211 227 No <0.0135 211 227 No 0.06 35 213 227 No 0.0140 213 227 No 0.08 40 215 227 No 0.0245 215 227 No 0.13 45 217 227 No 0.0550 217 227 No 0.19 50 219 227 No 0.1055 219 227 No 0.26 55 221 227 No 0.1860 221 227 No 0.31 60 223 227 No 0.2965 223 227 No 0.40 65 225 227 No 0.4370 225 227 Yes 0.50 70 227 227 Yes 0.5775 228 227 Yes 0.60 75 229 227 Yes 0.7180 230 227 Yes 0.69 80 232 227 Yes 0.8285 234 227 Yes 0.84 85 235 227 Yes 0.9390 237 227 Yes 0.90 90 239 227 Yes 0.9995 243 227 Yes 0.98 95 244 227 Yes >0.99
Note.%ile=percentile

Page16of23
TABLE8.PROFICIENCYPROJECTIONANDPROBABILITYFORPASSINGMCA-IIIMATHLEVEL3(MEETS)WHENMAPISTAKENINTHEFALLORWINTERPRIORTOSPRINGMCA-IIITESTS
GradeStart%ile
RITFall
ProjectedProficiency Start%ile
RITWinter
ProjectedProficiencyCutScore Level3 Prob. CutScore Level3 Prob.
3
5 169 202 No <0.01 5 176 202 No <0.0110 174 202 No 0.01 10 181 202 No <0.0115 177 202 No 0.04 15 184 202 No 0.0120 179 202 No 0.08 20 187 202 No 0.0225 182 202 No 0.17 25 189 202 No 0.0530 184 202 No 0.22 30 191 202 No 0.1035 185 202 No 0.27 35 193 202 No 0.2040 187 202 No 0.38 40 195 202 No 0.3445 189 202 Yes 0.50 45 197 202 Yes 0.5050 190 202 Yes 0.56 50 198 202 Yes 0.5855 192 202 Yes 0.68 55 200 202 Yes 0.7460 194 202 Yes 0.78 60 202 202 Yes 0.8665 195 202 Yes 0.83 65 203 202 Yes 0.9070 197 202 Yes 0.89 70 205 202 Yes 0.9575 199 202 Yes 0.92 75 207 202 Yes 0.9880 201 202 Yes 0.96 80 209 202 Yes 0.9985 204 202 Yes 0.99 85 212 202 Yes >0.9990 207 202 Yes >0.99 90 215 202 Yes >0.9995 212 202 Yes >0.99 95 220 202 Yes >0.99
4
5 179 213 No <0.01 5 185 213 No <0.0110 184 213 No <0.01 10 190 213 No <0.0115 188 213 No 0.02 15 194 213 No <0.0120 190 213 No 0.04 20 197 213 No 0.0125 193 213 No 0.11 25 199 213 No 0.0330 195 213 No 0.17 30 201 213 No 0.0735 197 213 No 0.27 35 203 213 No 0.1440 198 213 No 0.32 40 205 213 No 0.2645 200 213 No 0.44 45 207 213 No 0.4250 202 213 Yes 0.56 50 209 213 Yes 0.5855 204 213 Yes 0.68 55 211 213 Yes 0.7460 205 213 Yes 0.68 60 212 213 Yes 0.8065 207 213 Yes 0.78 65 214 213 Yes 0.9070 209 213 Yes 0.86 70 216 213 Yes 0.9575 211 213 Yes 0.92 75 218 213 Yes 0.9880 214 213 Yes 0.97 80 221 213 Yes >0.9985 216 213 Yes 0.99 85 223 213 Yes >0.9990 220 213 Yes >0.99 90 227 213 Yes >0.9995 225 213 Yes >0.99 95 232 213 Yes >0.99

Page17of23
TABLE8.(CONTINUED)
GradeStart%ile
RITFall
ProjectedProficiency Start%ile
RITWinter
ProjectedProficiencyCut-Score Level3 Prob. Cut-Score Level3 Prob.
5
5 187 228 No <0.01 5 192 228 No <0.0110 193 228 No <0.01 10 198 228 No <0.0115 196 228 No <0.01 15 201 228 No <0.0120 199 228 No <0.01 20 204 228 No <0.0125 202 228 No 0.01 25 207 228 No <0.0130 204 228 No 0.02 30 209 228 No <0.0135 206 228 No 0.04 35 211 228 No <0.0140 208 228 No 0.07 40 213 228 No 0.0145 210 228 No 0.12 45 215 228 No 0.0350 211 228 No 0.15 50 217 228 No 0.0755 213 228 No 0.23 55 219 228 No 0.1560 215 228 No 0.33 60 221 228 No 0.2765 217 228 No 0.44 65 223 228 No 0.4270 219 228 Yes 0.56 70 225 228 Yes 0.5875 221 228 Yes 0.67 75 228 228 Yes 0.8080 224 228 Yes 0.81 80 230 228 Yes 0.8985 227 228 Yes 0.91 85 233 228 Yes 0.9790 230 228 Yes 0.96 90 237 228 Yes >0.9995 236 228 Yes >0.99 95 242 228 Yes >0.99
6
5 192 232 No <0.01 5 196 232 No <0.0110 198 232 No <0.01 10 202 232 No <0.0115 202 232 No <0.01 15 205 232 No <0.0120 205 232 No <0.01 20 209 232 No <0.0125 207 232 No 0.01 25 211 232 No <0.0130 209 232 No 0.01 30 214 232 No <0.0135 212 232 No 0.04 35 216 232 No <0.0140 214 232 No 0.07 40 218 232 No 0.0145 216 232 No 0.12 45 220 232 No 0.0350 218 232 No 0.19 50 222 232 No 0.0755 220 232 No 0.28 55 224 232 No 0.1560 222 232 No 0.38 60 226 232 No 0.2765 224 232 Yes 0.50 65 228 232 No 0.4270 226 232 Yes 0.62 70 230 232 Yes 0.5875 228 232 Yes 0.72 75 233 232 Yes 0.8080 231 232 Yes 0.85 80 236 232 Yes 0.9385 234 232 Yes 0.91 85 239 232 Yes 0.9890 238 232 Yes 0.97 90 243 232 Yes >0.9995 243 232 Yes >0.99 95 248 232 Yes >0.99

Page18of23
TABLE8.(CONTINUED)
GradeStart%ile
RITFall
ProjectedProficiency Start%ile
RITWinter
ProjectedProficiencyCut-Score Level3 Prob. Cut-Score Level3 Prob.
7
5 195 237 No <0.01 5 198 237 No <0.0110 201 237 No <0.01 10 204 237 No <0.0115 205 237 No <0.01 15 208 237 No <0.0120 209 237 No <0.01 20 212 237 No <0.0125 211 237 No <0.01 25 215 237 No <0.0130 214 237 No <0.01 30 217 237 No <0.0135 216 237 No 0.01 35 220 237 No <0.0140 218 237 No 0.02 40 222 237 No <0.0145 221 237 No 0.06 45 224 237 No 0.0150 223 237 No 0.11 50 226 237 No 0.0355 225 237 No 0.18 55 228 237 No 0.0760 227 237 No 0.27 60 230 237 No 0.1565 229 237 No 0.38 65 233 237 No 0.3470 231 237 Yes 0.50 70 235 237 Yes 0.5075 234 237 Yes 0.68 75 238 237 Yes 0.7480 237 237 Yes 0.82 80 240 237 Yes 0.8585 240 237 Yes 0.92 85 244 237 Yes 0.9790 244 237 Yes 0.98 90 248 237 Yes >0.9995 250 237 Yes >0.99 95 254 237 Yes >0.99
8
5 197 238 No <0.01 5 199 238 No <0.0110 203 238 No <0.01 10 206 238 No <0.0115 208 238 No <0.01 15 210 238 No <0.0120 211 238 No <0.01 20 214 238 No <0.0125 214 238 No 0.01 25 217 238 No <0.0130 217 238 No 0.02 30 220 238 No <0.0135 219 238 No 0.03 35 222 238 No <0.0140 222 238 No 0.08 40 225 238 No 0.0145 224 238 No 0.12 45 227 238 No 0.0450 226 238 No 0.18 50 229 238 No 0.0855 229 238 No 0.30 55 231 238 No 0.1660 231 238 No 0.40 60 234 238 No 0.3565 233 238 Yes 0.50 65 236 238 Yes 0.5070 236 238 Yes 0.60 70 239 238 Yes 0.7275 238 238 Yes 0.70 75 241 238 Yes 0.8480 241 238 Yes 0.82 80 245 238 Yes 0.9685 245 238 Yes 0.92 85 248 238 Yes 0.9990 249 238 Yes 0.98 90 253 238 Yes >0.9995 256 238 Yes >0.99 95 259 238 Yes >0.99
Note.%ile=percentile
Page19of23
SummaryandDiscussion
ThisstudyproducedasetofcutscoresonMAPreadingandmathtestsforGrades3to8thatcorrespondtoeachMCA-IIIperformancelevel.Byusingmatchedscoredatafromasampleofstudents from Minnesota, the study demonstrates that MAP scores can accurately predictwhetherastudentcouldbeproficientoraboveonthebasisofhis/herMAPscores.Thisstudyalso used the 2015 NWEA norming study results to project a student’s probability to meetproficiencybasedonthatstudent’spriorMAPscoresinfallandwinter.TheseresultswillhelpeducatorspredictstudentperformanceinMCA-IIItestsasearlyaspossibleandidentifythosestudentswhoareatriskoffailingtomeetrequiredstandardssothattheycanreceivenecessaryresourcesandassistancetomeettheirgoals.
Whileconcordancetablescanbehelpfulandinformative,theyhavegenerallimitations.First,theconcordance tablesprovide informationaboutscorecomparabilityondifferent tests,but thescorescannotbeassumedtobeinterchangeable.InthecaseforMCA-IIIandMAPtests,astheyarenotparallelincontent,scoresfromthesetwotestsshouldnotbedirectlycompared.Second,thesampledatausedinthisstudywerecollectedfrom30schooldistrictsinMinnesota,whichmaylimitthegeneralizabilityoftheresultstotesttakerswhodiffersignificantlyfromthissample.Finally,cautionsshouldalsobeexercisediftheconcordedscoresareusedforasubpopulation.NWEAwill continue to gather information aboutMCA-III performance fromother schools inMinnesotatoenhancethequalityandgeneralizabilityofthestudy.

Page20of23
References
DataRecognitionCorporation(2015).Technicalreportforthe2015Minnesotasystemofschoolassessment.MN:MapleGrove.
Hanson,B.A.,Harris,D.J.,Pommerich,M.,Sconing,J.A.,&Yi,Q.(2001).Suggestionsfortheevaluationanduseofconcordanceresults.(ACTResearchReportNo.2001-1).IowaCity,IA:ACT,Inc.
Kolen,M.J.,&Brennan,R.L.(2004).Testequating,scaling,andlinking.NewYork:Springer.
Pommerich,M.,Hanson,B.,Harris,D.,&Sconing,J.(2004).Issuesinconductinglinkagebetweendistincttests.AppliedPsychologicalMeasurement,28(4),247-273.
ThumY.M.,&Hauser,C.H.(2015).NWEA2015MAPNormsforStudentandSchoolAchievementStatusandGrowth.NWEAResearchReport.Portland,OR:NWEA.

Page21of23
Appendix
DataandAnalysis
Data
Data used in this study were collected from 30 school districts in Minnesota. The samplecontainedmatchedMCA-IIIandMAPreadingscoresfrom36,844studentsinGrades3to8andmatchedMCA-IIIandMAPmathscoresfrom35,665studentsinGrades3to8whocompletedbothMCA-IIIandMAPinthespringof2015.
Tounderstandthestatisticalcharacteristicsofthetestscores,descriptivestatisticsareprovidedinTableA1below.AsTableA1indicates,thecorrelationcoefficientsbetweenMAPandMCA-IIIreadingscoresrangefrom0.85to0.86,andthecorrelationcoefficientsbetweenMAPandMCA-III math scores range from 0.89 to 0.92. In general, all these correlations indicate a strongrelationshipbetweenMAPandMCA-IIItestscores.
TABLEA1.DESCRIPTIVESTATISTICSOFTHESAMPLEDATA
MCA-III MAPSubject Grade N r Mean SD Min Max Mean SD Min Max
Reading
3 6706 0.86 352.70 21.17 301 475 202.26 15.58 141 2424 6460 0.85 452.40 15.38 411 552 211.00 14.53 141 2505 6513 0.85 555.02 14.48 411 633 217.01 14.62 143 2586 5964 0.85 655.08 17.85 606 699 220.66 13.71 143 2617 5886 0.86 751.75 17.16 703 798 224.79 13.74 150 2758 5315 0.85 850.60 18.86 802 898 226.72 14.26 149 272
Math
3 6737 0.90 357.34 15.80 315 457 208.84 14.00 143 2694 6458 0.90 458.95 17.54 409 537 221.15 15.50 152 2815 6566 0.90 552.46 13.45 420 635 230.88 16.90 148 2926 5876 0.92 650.93 14.33 611 688 233.33 16.02 159 2887 5535 0.91 750.48 11.49 718 782 237.79 16.61 154 3118 4493 0.89 850.35 13.78 813 888 238.70 18.29 150 295

Page22of23
EquipercentileLinkingProcedure
The equipercentile procedure (e.g., Kolen & Brennan, 2004) was used to establish theconcordancerelationshipbetweenMCA-IIIandMAPscoresforgrades3to8inreadingandmath.Thisprocedurematchesscoresonthetwoscalesthathavethesamepercentilerank(i.e.,theproportionofscoresatorbeloweachscore).
Supposeweneedtoestablishtheconcordedscoresbetweentwotests.𝑥isascoreonTest𝑋(e.g.,MCA-III).ItsequipercentileequivalentscoreonTest𝑌(e.g.,MAP),𝑒& 𝑥 ,canbeobtainedthroughacumulative-distribution-basedlinkingfunctiondefinedinEquation(A1):
𝑒& 𝑥 = 𝐺*+[𝑃 𝑥 ] (A1)
where𝑒& 𝑥 istheequipercentileequivalentofscoresonMCA-IIIonthescaleofMAP,𝑃 𝑥 isthepercentilerankofagivenscoreonTest𝑋.𝐺*+istheinverseofthepercentilerankfunctionforscoresonTest𝑌which indicatesthescoresonTest𝑌correspondingtoagivenpercentile.Polynomial loglinear pre-smoothing was applied to reduce irregularities of the frequencydistributionsaswellasequipercentilelinkingcurve.
ConsistencyrateofClassification
Consistency rateof classificationaccuracy,expressed in the formofa ratebetween0and1,measures the extent to which MAP scores (and the estimated MAP cut scores) accuratelypredictedwhetherstudentsinthesamplewouldbeproficient(i.e.,Level3orhigher)onMCA-IIItests.
Tocalculateconsistencyrateofclassification,samplestudentsweredesignated“BelowMCA-IIIcut”or“AtoraboveMCA-IIIcut”basedontheiractualMCA-IIIscores.Similarly,theywerealsodesignatedas“BelowMAPcut”or“AtoraboveMAPcut”basedontheiractualMAPscores.A2-waycontingencytablewasthentabulated(seeTableA2),classifyingstudentsas”Proficient”onthe basis ofMCA-III cut score and concordantMAP cut score. Students classified in the truepositive(TP)categorywerethosepredictedtobeProficientbasedontheMAPcutscoresandwerealsoclassifiedasProficientbasedontheMCA-IIIcutscores.Studentsclassifiedinthetruenegative(TN)categorywerethosepredictedtobeNotProficientbasedontheMAPcutscoresandwerealsoclassifiedasNotProficientbasedontheMCA-IIIcutscores.Studentsclassifiedinthefalsepositive(FP)categorywerethosepredictedtobeProficientbasedontheMAPcutscoresbutwereclassifiedasNotProficientbasedontheMCA-IIIcutscores.Studentsclassifiedinthefalsenegative(FN)categorywerethosepredicatedtobeNotProficientbasedontheMAPcutscoresbutwereclassifiedasProficientbasedontheMCA-IIIcutscores.Theoverallconsistencyrateofclassificationwascomputedastheproportionofcorrectclassificationsamongtheentiresampleby(TP+TN)/(TP+TN+FP+FN).

Page23of23
TABLEA2.DEFINITIONOFCONSISTENCYRATEFORMCA-IIITOMAPCONCORDANCE
MCA-IIIScore
BelowMCA-IIIcut AtorAboveMCA-IIIcut
MAPScoreBelowMAPcut TrueNegapve FalseNegapve
AtorAboveMAPcut FalsePosipve TruePosipveNote.Shadedcellsaresummedtocomputetheconsistencyrate.
ProficiencyProjection
MAPconditionalgrowthnormsprovidestudent’sexpectedgainscoresacrosstestingseasons(Thum&Hauser,2015).Thisinformationisutilizedtopredictastudent’sperformanceontheMCA-IIIbasedonthatstudent’sMAPscoresinpriorseasons(e.g.fallandwinter).TheprobabilityofastudentachievingLevel3(Meets)onMCA-III,basedonhis/herfallorwinterMAPscoreisgiveninEquation(A2):
𝑃𝑟 𝐴𝑐ℎ𝑖𝑒𝑣𝑒𝑖𝑛𝑔𝐿𝑒𝑣𝑒𝑙3𝑖𝑛𝑠𝑝𝑟𝑖𝑛𝑔 𝑎𝑅𝐼𝑇𝑠𝑐𝑜𝑟𝑒𝑜𝑓𝑥) = Φ 𝑥 + 𝑔 − 𝑐
𝑆𝐷 (𝐴2)
where,Φisastandardizednormalcumulativedistribution,𝑥isthestudent’sRITscoreinfallorwinter,𝑔istheexpectedgrowthfromfallorwintertospringcorrespondingto𝑥,𝑐istheMAPcut-scoreforspring,and𝑆𝐷istheconditionalstandarddeviationofgrowthfromfallorwintertospring.
FortheprobabilityofastudentachievingLevel3ontheMCA-IIItests,basedonhis/herspringscore𝑠,itcanbecalculatedbyEquation(A3):
𝑃𝑟 𝐴𝑐ℎ𝑖𝑒𝑣𝑒𝑖𝑛𝑔𝐿𝑒𝑣𝑒𝑙3𝑖𝑛𝑠𝑝𝑟𝑖𝑛𝑔 𝑎𝑅𝐼𝑇𝑠𝑐𝑜𝑟𝑒𝑜𝑓𝑠𝑖𝑛𝑠𝑝𝑟𝑖𝑛𝑔) = Φ 𝑠 − 𝑐𝑆𝐸 (𝐴3)
whereSEisthestandarderrorofmeasurementforMAPreadingormathtest.
Foundedbyeducatorsnearly40yearsago,NorthwestEvaluationAssociation(NWEA)isaglobalnot-for-profiteducationalservicesorganizationknownforourflagshipinterimassessment,MeasuresofAcademicProgress(MAP).Morethan7,800partnersinU.S.schools,schooldistricts,educationagencies,andinternationalschoolstrustustoofferpre-kindergartenthroughgrade12assessmentsthataccuratelymeasurestudentgrowthandlearningneeds,professionaldevelopmentthatfosterseducators’abilitytoacceleratestudentlearning,andresearchthatsupportsassessmentvalidityanddatainterpretation.Tobetterinforminstructionandmaximizeeverylearner’sacademicgrowth,educatorscurrentlyuseNWEAassessmentswithnearlyeightmillionstudents.
©NorthwestEvaluationAssociation2016.MeasuresofAcademicProgress,MAP,andPartneringtohelpallkidslearnareregisteredtrademarksofNorthwestEvaluationAssociationintheU.S.andinothercountries.NorthwestEvaluationAssociationandNWEAaretrademarksofNorthwestEvaluationAssociationintheU.S.andinothercountries.Thenamesofothercompaniesandtheirproductsmentionedarethetrademarksoftheirrespectiveowners.