linking supply chain, patient safety and clinical outcomes · linking supply chain, patient safety...
TRANSCRIPT
Joe M. Pleasant
Premier’s Vision for High Performing Healthcare Organizations:
Linking Supply Chain, Patient Safety and Clinical Outcomes
Joe M. PleasantSr. VP and CIOPremier Inc.
Global GS1 Conference Hong KongOctober 7, 2009

• Over 2,200 hospitals, 63,000 non-acute sites
• $35 billion in annual group purchasing volume
• Safety, Diversity and Environmentally Preferred Purchasing programs
• Collect, analyze and share knowledge nationwide to improve the health of communities
• Nation’s largest clinical/operational/supply chain comparative databases��
����
���
����
��� � ��
�
�
�
�
�
���
�
� ��
�
�
������
��
�
��
���
�
����
��
��
����
� ��
��� �� � �
�
� ��
�����
��
���
���
�
��
��
���
��
�
�� �
�
�
�
�
����
��
��
�
�
��
���
�
�
���� ��
��
��� �
����������
�
�
�
������
� ���
�
������
�
���
��
��� �
�
��
�
��
�
�
�
�
�
��
�
�
�
��
� ��
����
�
�
���
�
������ ��
��� �� ��
� ������� � ��
�
� �
���
����
�
�� � ��
�
���
��
�
�
��
����
�
��
�
���
�
�
� ���
�
� �
�
�
�
���
��
���
�
�
�
��
��
���
��
�
�
���
�
���
�
��
����
��� � �
�
��
��
�
� ���
���
�� �
��
���
��
�
�
�
�� � ���
�
��
� � �� ��
�
�
��� �� ���
�
�
�
��
���
�� � ��
�
�
�
�
�
� � ��
�
� �
�
���
��
�� �
� ���
��� �
� �
� �����
� ����
�
�
�
�
�
��
�
�
�
�� ����
�
�
�
��
�
������
� � ���� ���
�
�
�
�
�
� �����
���
�
��� �
����
���
�
�
�
��
�
��
��
��
�
�
���
��� �
�� ��� ��
�
����
�
��� � �
�
� ��
���
�
���
��
�
� ��
�
�� �����
�
������ ��
��
�
�
��
�
��
��
���
�� ���
�
�
�
������� ���
�
�����������
�
��
�
��
�
���
������ ��
�
�
�
�
����
�
�� ��
���
��� �
�
���
���
��
�
�
�������
�
���
��� ��
�
���
��
��
���
���
��� ��� �
��
�
���
�� �
��
�
��
�����
��
��
�
���
���
��
��
�����
���
��
�
�� ��
� �
�
�
��
��
�� ��
�
�
�
�
�
�
�
��
�
��
��
�
�
�
���
� �
� ���
��
���
�
��� ���� � �
�
�
��
�
� �
� ���
��
��� ����
�
�
� �� ��
��
��� �
� �
� ������� � ���� �����
��
��
�
�
�
����
�
��
��
��
�
��
��
��
������
��
�
��� ��� �
��� ��� �
�� �� �
��
��� �� ���� ������ ��� �� � �� ���
� � �� ��� �� ���
� �����
� ��� � �
�
������
��
��� � � ��
�� ����
�� � � �� � �
�
���
� ��� ���
��
� �� � ���
��
��
���
�
�� �
��
��� ��
���
�
�
�
�
��
�
�� �� �
�
�
�
���� ���
��
��
�
���
���
� ������
� ������
��
�
��
���
�
� ��
�
����
�
� ��
�� �
��
�
� ��
�� ��
�
��
�
��
�
���
��� �
�
��
��� � �
��
� ��
���
����
� �� ��
����
���
�
�
�
��
�
��
�
���
��
��
� �
�
� ��
�
�
�
��
� � �
� �
���
� ��� �
�
��� �
�����
����� ������
���� �
�
��
���
�
���� ��� �
�
��
����
��
�
��
�
�� �
�
��
����
�
��
�
�
���� �
��
����
���
��� �
� �� ��
�
������
�
��
���
�����
�
��
�
�����
�
��
�
��������
��
�����
��
�����
�
�
��
�������
�
�
�
���
��
�
���
�� �
���
���
��
��� ����
� �
���
� �
�
���
�
��
���
��
� �����
�
���
�
�
���
�
�� �
� �
��
��
����
��� �� �
� ������
���� � �
���
��������������
������
��
���
�
��
��
���� �
�
��
��
�
��
�
��
� ����
��
� � ������ �����
��
�
��
���
�
�
��
��� �
� �����
�
� �
��
�
�����
��
����
�
�
�
��
����
�
�����
���
�
���
��� �� �
��
�
�� �
��
�
�
� � �� �
�
���
��
�
��
��
�� ���
�
� �
�
��
�� ��
� ����
�
��
�
��
�
�
��
�
� �� �
�
�
�
�
�
�� ��
��
� �
� �
�
��
�
�
�
�
�� �
�
��
�
�
�
�
�
���
���� � �
�
��
� ��
�
�� ��
���
�
�
�
�
����
�
�
��
�
�
�
���
��
��
�
�
�
�� �
�
�
�
��
�
����
�
� � �
���
�
���
���
�
������
���
������
�
��
�
�
��
�
�
�
�� ��
�� �
�
�� � ���
�
�
Premier: Uniting A Fragmented Healthcare System
chain comparative databases
• Organization of national hospital collaboratives to improve quality and safely reduce costs
���
�
�������
���
��
����� ��
�
����
����
���������
����
� ���������������
���
�� � ���
���
��� ��� ��
��� �� �
����
���
���
��
��
��� ��
�
��� �
�
���� � ��� �� ��� �� ��� � �� ��� ���� �� �� � �� �� � �
�
� �� ��� ���� ��� �� �� ��� �
�
�
���
��� ����
OwnersAffiliates
Purchasing PartnersSupply ChainImprovement
InformaticsQuality Measurement
& Benchmarking
InsuranceLiability, Benefits
& Risk Management
�
�
��
Premier Consulting SolutionsComprehensive, accelerated approach to improving financial, operational and clinical performance.

Premier:Recognition of Excellence
2006 Malcolm Baldrige National Quality Award recipient
3
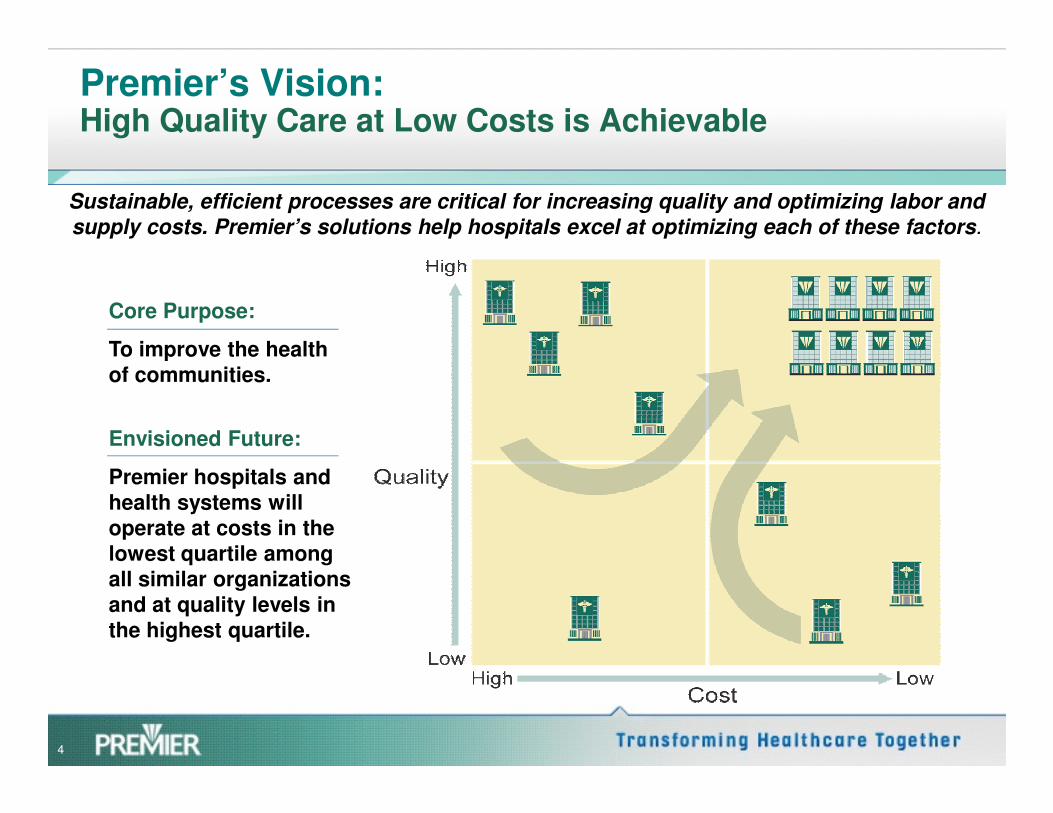
Premier’s Vision:High Quality Care at Low Costs is Achievable
Sustainable, efficient processes are critical for increasing quality and optimizing labor and
supply costs. Premier’s solutions help hospitals excel at optimizing each of these factors.
Core Purpose:
To improve the health of communities.
4
Envisioned Future:
Premier hospitals and health systems will operate at costs in the lowest quartile among all similar organizations and at quality levels in the highest quartile.

Topics
1. Quality and the bottom line
2. Quality as a driver of cost improvement
3. Lessons from the Premier Hospital Quality Incentive Demonstration (HQID) Quality Incentive Demonstration (HQID) Project
4. Linking Patient Safety, Cost of Care, Supply Chain and Clinical Outcomes
5. Supply Chain – An Important component of Cost of Care.
6. Where do we go from here?

Making the Business Case for Quality
• Quality and financial performance are inseparable
Improved access to capital
Increased market share
Improved Financial Margin
Reduced cost per case
Reduced liability• As healthcare leaders,
we are equally responsible for both
Improved outcomes for patients
Reduced liability
Findings
�Financial incentives did focus hospital executive
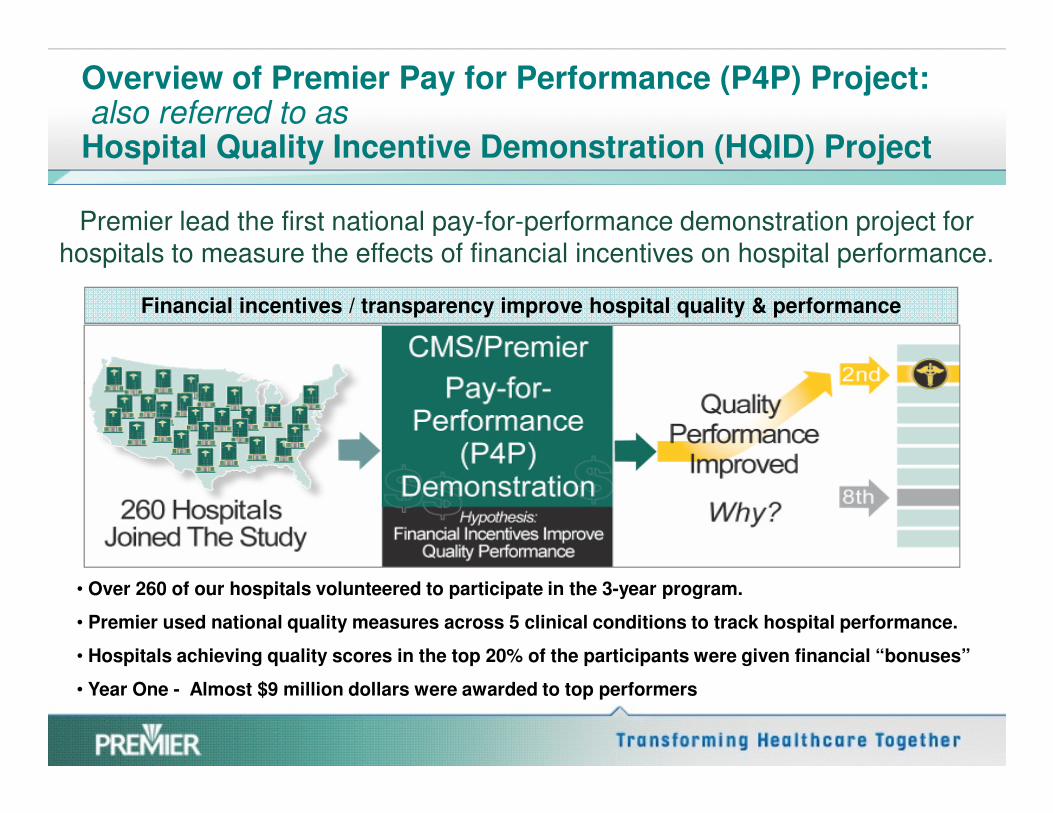
Overview of Premier Pay for Performance (P4P) Project:also referred to as Hospital Quality Incentive Demonstration (HQID) Project
Premier lead the first national pay-for-performance demonstration project for hospitals to measure the effects of financial incentives on hospital performance.
Financial incentives / transparency improve hospital quality & performance
�Financial incentives did focus hospital executive attention on measuring and improving quality.
�Hospitals performance has improved continuously over time.
• Over 260 of our hospitals volunteered to participate in the 3-year program.
• Premier used national quality measures across 5 clinical conditions to track hospital performance.
• Hospitals achieving quality scores in the top 20% of the participants were given financial “bonuses”
• Year One - Almost $9 million dollars were awarded to top performers

Overview of Premier Hospital Quality Incentive Demonstration (HQID) Project
Top performers identified in:
1. Acute Myocardial Infarction (AMI)
2. Congestive Heart Failure
Five Clinical Areas
3. Coronary Artery Bypass Graft (CABG)
4. Hip and Knee Replacement
5. Community Acquired Pneumonia

In Broader Comparisons, HQID Hospitals ExcelNational Leaders in Quality Performance
• HQID hospitals have higher quality than other hospitals.
• HQID average 6.8% higher quality performance.
SUMMARY
performance.
• Ave. HQID improvement = 11.3% compared to others at 10.2%.
• New England Journal of Medicine found P4P hospitals achieved quality scores 4.1% above others.

HQID - More patients are reliably receiving evidenced-based care
Evidence-based Care Improvements
Avg. improvement from 4Q03 to 3Q08 in all
clinical areas(20 quarters)
55.32%
Clinical Improvement
CMS/Premier HQID Project Participants Appropriate Care Score:
Trend of Quarterly Median (5th Decile) by Clinical Focus AreaOctober 1, 2003 - June 30, 2008 (Year 1, 2, 3, and 4 Final Data; Year 5 Preliminary)
70%
80%
90%
100%
Clinical Area
Improvement(percentage points)
AMI 24.7%
CABG 66.1%
Pneumonia 65.7%
Heart Failure 54.8%
Hip & Knee 65.3%
Ap
pro
pri
ate
Ca
re S
co
re
0%
10%
20%
30%
40%
50%
60%
70%
AMI CABG PN HF Hip and Knee SCIP
Clinical Focus Area4Q03 1Q04 2Q04 3Q04 4Q04 1Q05 2Q05 3Q05 4Q05 1Q06 2Q06 3Q06 4Q06 1Q07 2Q07 3Q07 4Q07
1Q08 2Q08 3Q08
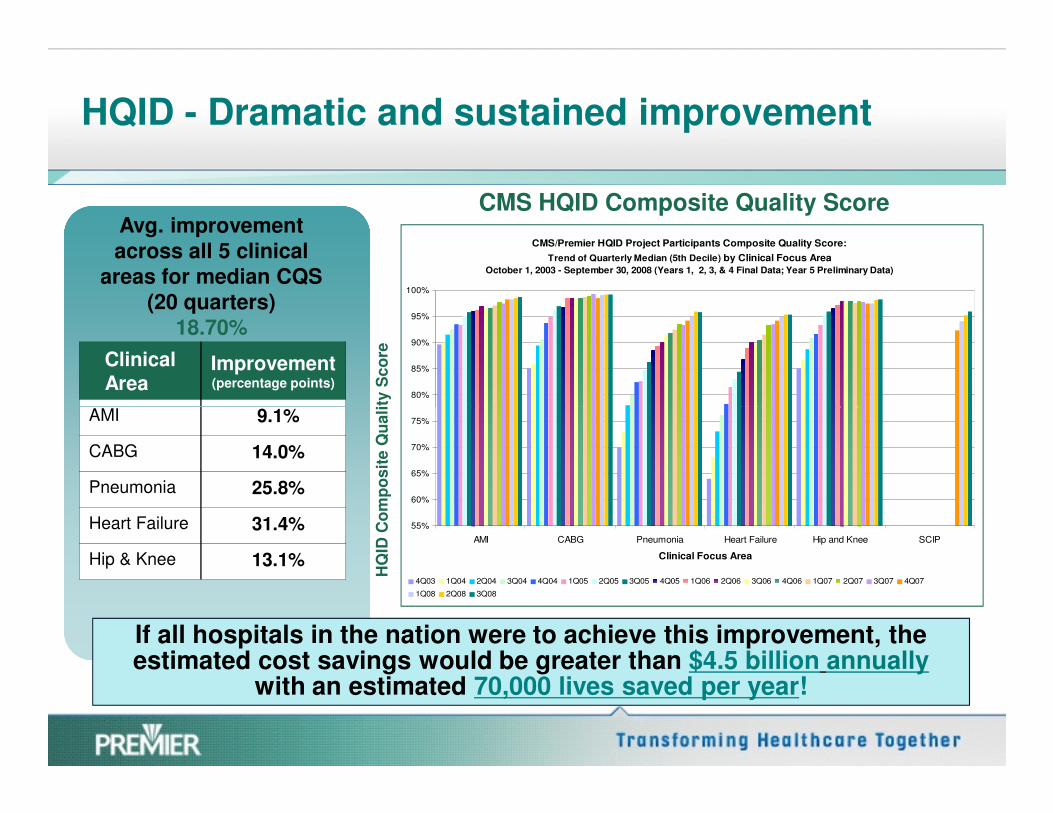
HQID - Dramatic and sustained improvement
HQ
ID C
om
po
sit
e Q
ua
lity
Sc
ore
Avg. improvement across all 5 clinical
areas for median CQS (20 quarters)
18.70%
Clinical Area
Improvement (percentage points)
AMI 9.1%
CMS HQID Composite Quality Score
CMS/Premier HQID Project Participants Composite Quality Score:
Trend of Quarterly Median (5th Decile) by Clinical Focus Area
October 1, 2003 - September 30, 2008 (Years 1, 2, 3, & 4 Final Data; Year 5 Preliminary Data)
80%
85%
90%
95%
100%
HQ
ID C
om
po
sit
e Q
ua
lity
Sc
ore
AMI 9.1%
CABG 14.0%
Pneumonia 25.8%
Heart Failure 31.4%
Hip & Knee 13.1%
55%
60%
65%
70%
75%
AMI CABG Pneumonia Heart Failure Hip and Knee SCIP
Clinical Focus Area
4Q03 1Q04 2Q04 3Q04 4Q04 1Q05 2Q05 3Q05 4Q05 1Q06 2Q06 3Q06 4Q06 1Q07 2Q07 3Q07 4Q07
1Q08 2Q08 3Q08
If all hospitals in the nation were to achieve this improvement, the estimated cost savings would be greater than $4.5 billion annually
with an estimated 70,000 lives saved per year!

HQID Example: Heart Bypass Reliable Care Improves Readmissions, Mortality, Cost and Length of Stay Outcomes
11.0%
6.2%
1.6%
0.0%
5.0%
10.0%
15.0%
Low - 0% -
49%
Medium -
50% - 74%
High - 75% -
100%
Mortality rate of heart bpass surgery patients (%)
Patient Process Measure
Mo
rtality
Rate
Data show lower mortality rates for heart bypass surgery patients receiving better
care
11.3%
6.5%
3.9%
0.0%
5.0%
10.0%
15.0%
Low - 0% -
49%
Medium -
50% - 74%
High - 75% -
100%
Heart bypass surgery patients with complications(%)
Patient Process Measure
Co
mp
licati
on
s
Data indicate fewer complications are associated with better care
Patient Process Measure Patient Process Measure
15.7%
12.4% 12.6%
0.0%
5.0%
10.0%
15.0%
20.0%
Low - 0% -
49%
Medium -
50% - 74%
High - 75% -
100%
Patient Process Measure
Pati
en
t R
ead
mis
sio
ns (
%)
Data indicate fewer readmissions are associated with better care
0
0
0
0
Low - 0% -
49%
Medium -
50% - 74%
High - 75% -
100%
Patient Process Measure
Av
era
ge L
OS
(d
ays)
Data show fewer hospital days associated with patients receiving better care
Average LOS for heart bypass surgery patientsReadmissions heart bypass surgery patients (%)
�UK North West “Advancing Quality” Program– England’s largest health authority using Premier/Medicare P4P
project as a model for improving patient care
�Groups from Hong Kong, Korea learning
International Pay for Performance (P4P) Exploration
13
�Groups from Hong Kong, Korea learning
from initiative
Lessons Learned from HQID
Next Steps & Questions to be Answered.1. There is a link between cost and quality.
2. Setting goals, measuring performance and transparently reporting results is an effective driver.
1. Could this model work in other areas?
2. Would it be effective and create improvements in the supply chain?
3. Improvements can be achieved rapidly.
4. Increasing interest from government and payers to incentivize quality using P4P model.
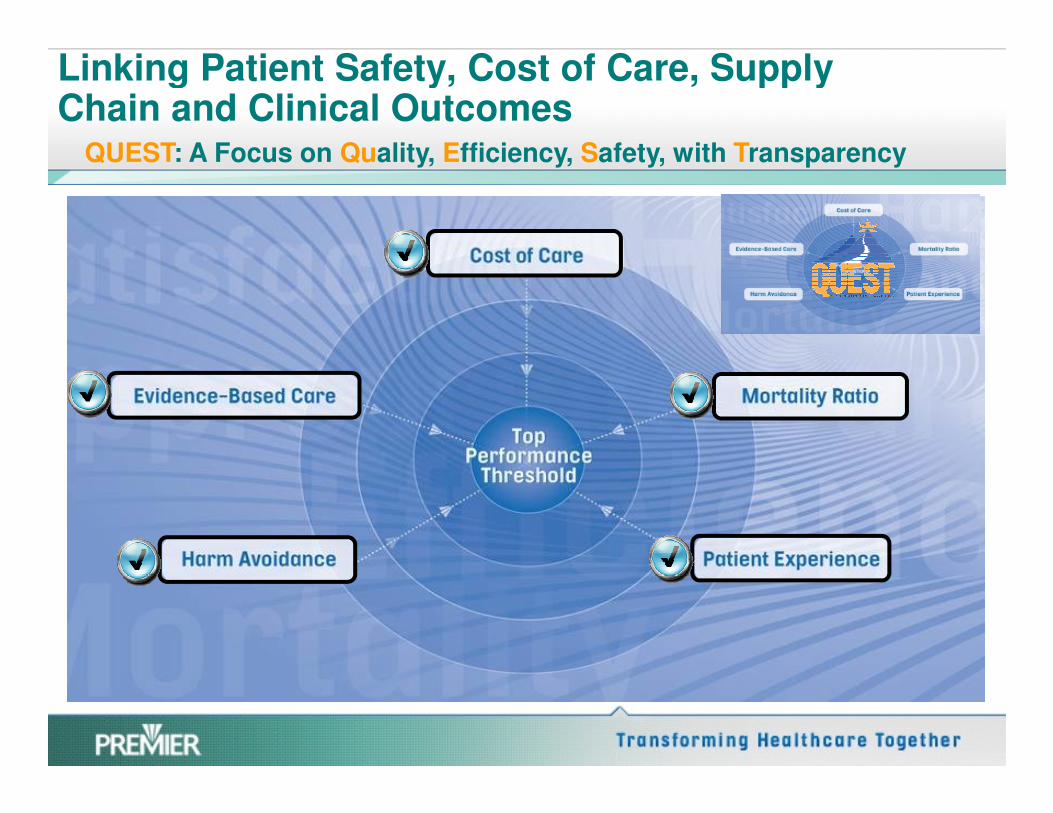
Linking Patient Safety, Cost of Care, Supply Chain and Clinical Outcomes
QUEST: A Focus on Quality, Efficiency, Safety, with Transparency
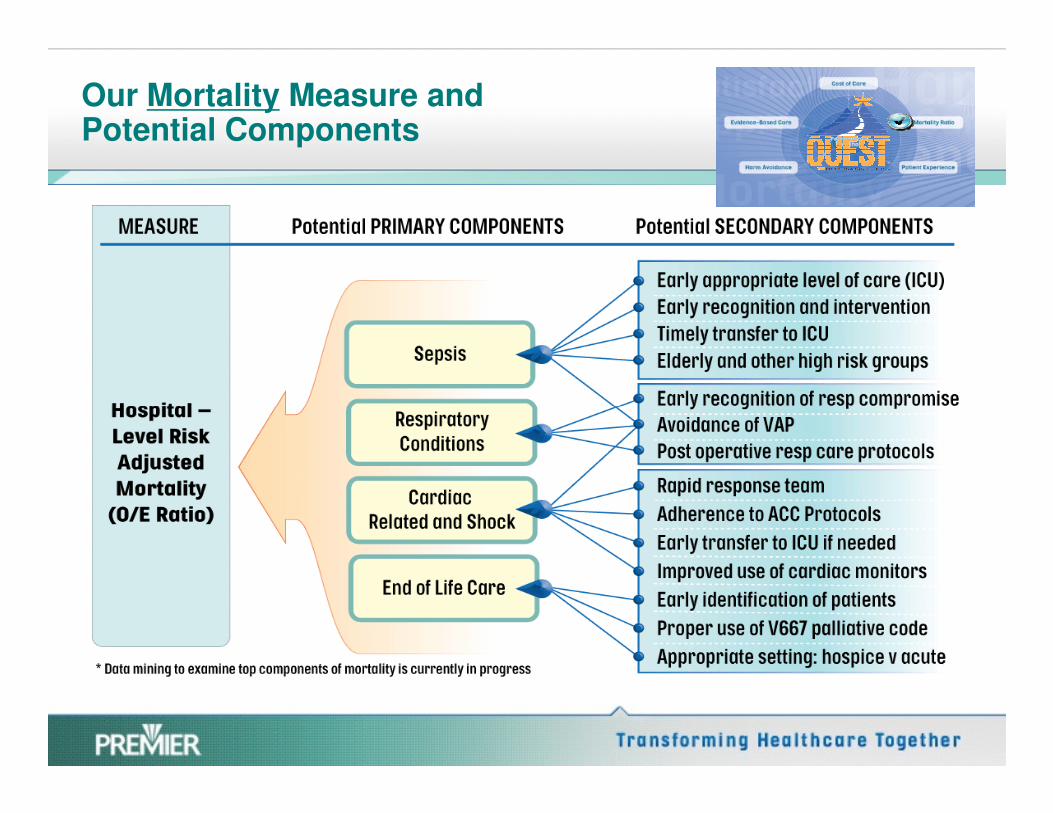
Our Mortality Measure and Potential Components
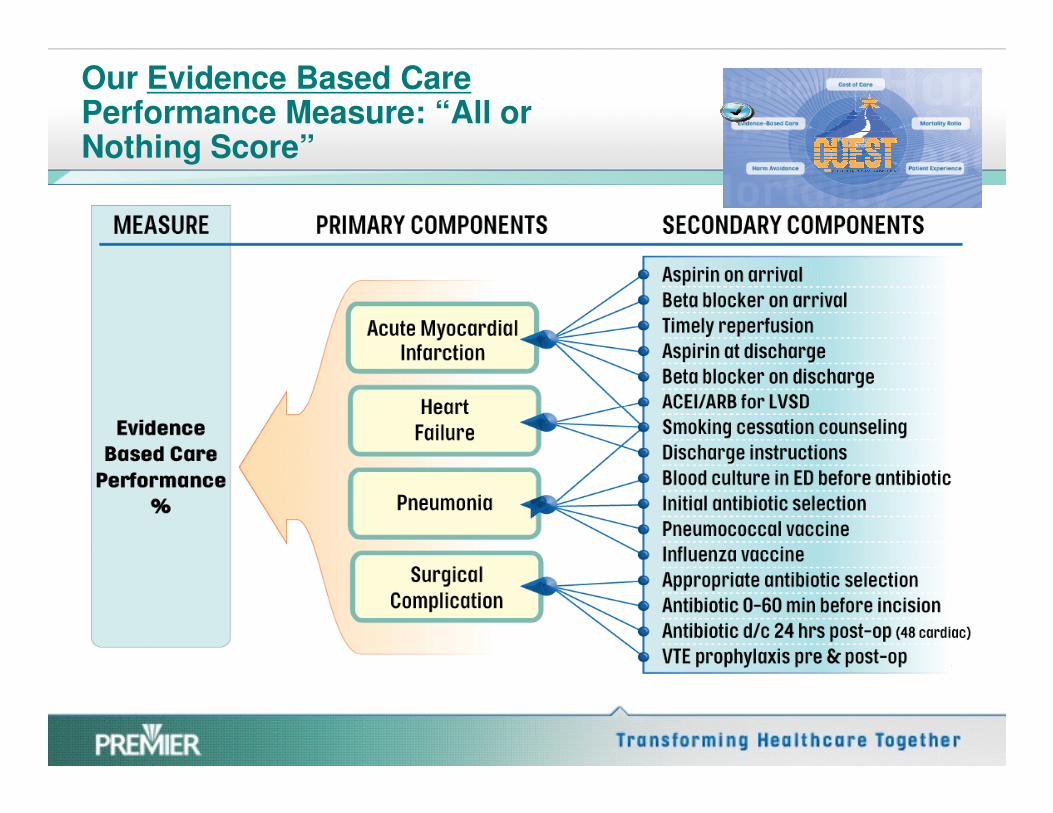
Our Evidence Based Care Performance Measure: “All or Nothing Score”

Our Efficiency Measure (Cost of Care) and Components

Our Harm Measure and Potential Components

Our Patient Experience Measure and Potential Components

QUEST participants show improvement through fourth quarter 2008
78%86%
71%4 0 %
6 0 %
8 0 %
10 0 %
Trends for Evidence Based Care
Among QUEST Participants
Updated 7-17-09
Trends for Mortality O/E Ratio
Among QUEST Participants
Updated 7-17-09
Trends for Cost of Care per Patient
Among QUEST Participants
Updated 7-17-09
$5,587
$5,930
59%
$5,70 0
$5,8 0 0
$5,9 0 0
$6 ,0 0 00.990.85
0 .6 0
0 .8 0
1.0 0
1.2 0
0.14 reduction in the avg. Observed to Expected
Mortality Ratio from baseline
$343 decrease in the avg. Cost of Care from
baseline
26%0 %
2 0 %
4 0 %
Baseline 1q08-4q08
EB C rate % at T P T
8.74 percentage point increase in avg. EBC rate
from baseline
(N-153) (N-157)(N-160) (N-157)
$5,58750%
$5,4 0 0
$5,50 0
$5,6 0 0
Baseline 1q08-4q08
C o st P C % at T P T
(N-158) (N-145)
25%
49%
0 .0 0
0 .2 0
0 .4 0
Baseline 1q08-4q08
M o rt O/ E rat io % at T P T

QUEST Cost of Care Trend vs. Rest of Premier
Deflated Cost Trend Comparison (4-quarter moving averages)
$6,600
$6,800
$7,000
Co
st
pe
r A
dju
ste
d C
as
e
$5,800
$6,000
$6,200
$6,400
$6,600
3rd 4th 1st 2nd 3rd 4th 1st 2nd 3rd
Co
st
pe
r A
dju
ste
d C
as
e
143 QUEST Hospitals
257 Non-QUEST Hospitals
2006 2007 2008

QUEST IMPACT:Extrapolation data
Dollars Saved Lives Saved Additional Patients Receiving All Evidence-Based Care
QUEST facilities show greater improvements than those facilities not in the project.
152,014
576,933
$400,000
$500,000
$600,000
$700,000
Do
llars
Saved
(in
$1000s)
950
24,818
20,000
25,000
30,000
Ad
dit
ion
al P
ts R
ec
eiv
ing
All C
are
3331
8,043
5,000
6,000
7,000
8,000
9,000
Liv
es
Sa
ve
d
If all hospitals not participating in QUEST could achieve these results, this would mean an additional 52,760 lives, $1.16 billion saved, and 27,771 additional patients receiving all
evidence-based care.
At Non-QUEST Rate QUEST Increment
$0
$100,000
$200,000
$300,000
Do
llars
Saved
(in
$1000s)
0
5,000
10,000
15,000
Ad
dit
ion
al P
ts R
ec
eiv
ing
All C
are
0
1,000
2,000
3,000
4,000
Liv
es
Sa
ve
d

.
Product
60% of all invoices generated have errors; each invoice error costs $40-$400 to reconcile.
Every day, the healthcare supply chain wastes 24-30% of supply admin time correcting reducible
data errors.
$2 to $5 billion are lost each year due to supply chain information inefficiencies.
PA
TIE
NT
Product and Flow
Supply Chain – An Important component of Cost of Care
24
Manufacturing Distributing Provider
PATIENT
Product
Cash and Information
Each erroneous transaction costs $60-$80 to correct.
Erroneous data increases supply costs 3-5 %.
Production DistributionConsumption
PA
TIE
NT
Information and Cash Flow
Manufacturer ProviderDistributor
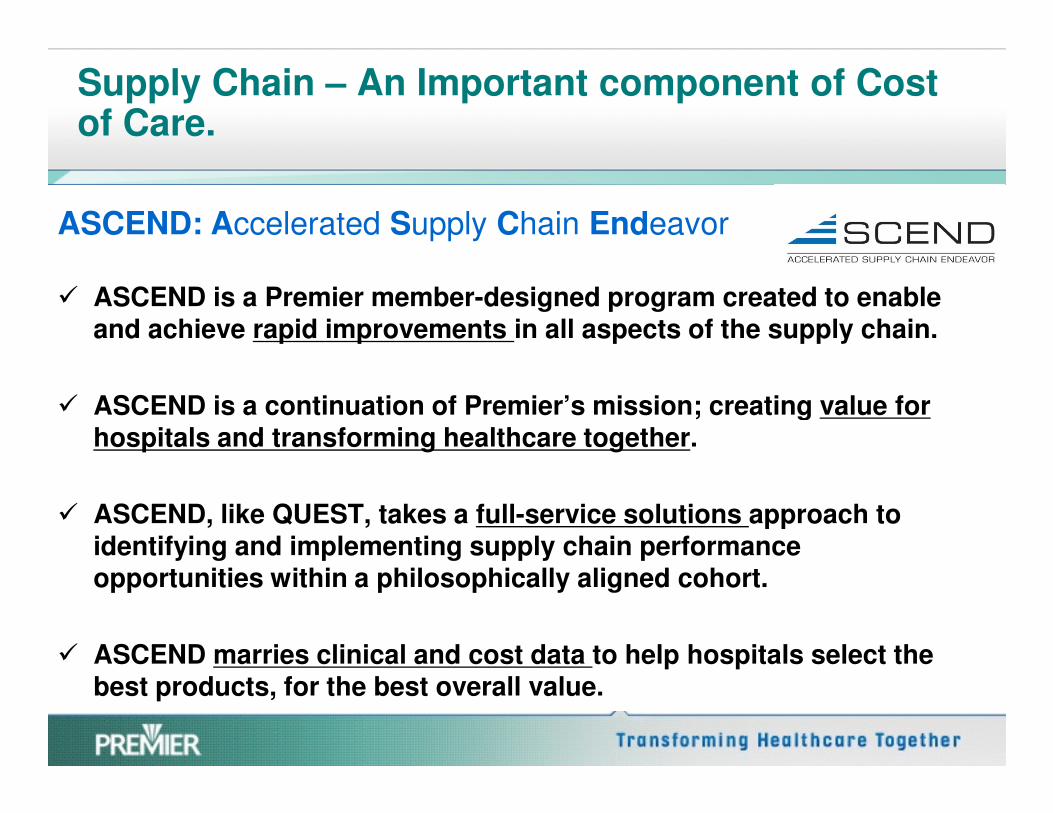
� ASCEND is a Premier member-designed program created to enable and achieve rapid improvements in all aspects of the supply chain.
� ASCEND is a continuation of Premier’s mission; creating value for
Supply Chain – An Important component of Cost of Care.
ASCEND: Accelerated Supply Chain Endeavor
� ASCEND is a continuation of Premier’s mission; creating value for hospitals and transforming healthcare together.
� ASCEND, like QUEST, takes a full-service solutions approach to identifying and implementing supply chain performance opportunities within a philosophically aligned cohort.
� ASCEND marries clinical and cost data to help hospitals select the best products, for the best overall value.
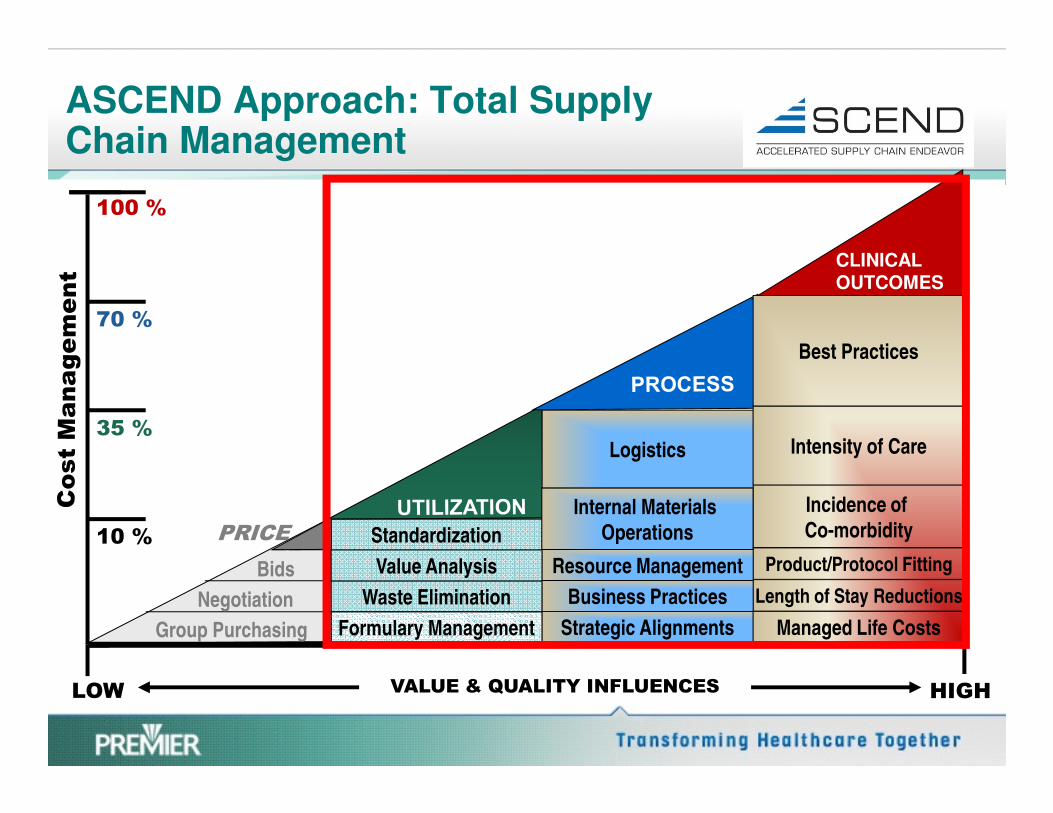
ASCEND Approach: Total Supply Chain Management
Best Practices
100 %
70 %
CLINICAL OUTCOMES
HIGH
Formulary Management
Waste Elimination
Value Analysis
Standardization
Strategic Alignments
Business Practices
Resource Management
Internal Materials
Operations
Logistics
Managed Life Costs
Length of Stay Reductions
Incidence of
Co-morbidity
Product/Protocol Fitting
Intensity of Care
Negotiation
Group Purchasing
LOW
35 %
10 % PRICE
Bids
VALUE & QUALITY INFLUENCES

ASCEND Approach: Total Supply Chain Management
Advanced: Demand Matching
• Broad based, non-salary cost management
• Outcomes-based, product utilization management
• Clinical participation in product selection and use
Intermediate: Efficiency and ImprovementReduction
15% Cost
ReductionIntermediate: Efficiency and Improvement
• Supplier/Product Standardization• Cost and Impact Reporting (DRG)• Supply Chain Business Process Improvement
Basic: Contracting
• Contract Participation and Optimization• Quality Monitoring and Control• Inventory Control and Information Systems
Reduction
9% Cost
Reduction
Reduction
2-6.5% Cost
Reduction

QUEST/ASCEND: Supplier Innovation Program
PURPOSE: To leverage the vast knowledge, research and development of the healthcare supplier community to proactively bring forward change concepts to the QUEST/ASCEND concepts to the QUEST/ASCEND cohort of hospitals.
The program is focused on those suppliers who passionately believe their processes will dramatically impact the QUEST/ASCEND goal to make substantial improvements in the value of health care.

Where do we go from here?
29

Where do we go from here?
Endorsement and adoption of standards allow
interoperability of key supply chain processes
between all portions of the Healthcare Supply
Chain.
30

Where do we go from here?
31

Conclusion
