linking protection and promotion in poor households
TRANSCRIPT
LINKING PROTECTION AND PROMOTION IN POOR
HOUSEHOLDS: SOCIAL PENSION SCHEME AND POVERTY
REDUCTION IN URBAN BANGLADESH
Do cash-based social assistance measures promote more investments towards
poverty exit?
A thesis submitted to the University of Manchester for the degree of
Doctor of Philosophy
In the Faculty of Humanities
2014
LUIGI RAGNO
SCHOOL OF ENVIRONMENT, EDUCATION AND DEVELOPMENT

2
Contents
1. LIST OF TABLES ............................................................................................................... 7
2. LIST OF FIGURES ............................................................................................................. 7
3. LIST OF BOXES ................................................................................................................. 8
4. LIST OF APPENDICES .................................................................................................... 8
5. LIST OF ABREVIATIONS .............................................................................................. 9
6. ABSTRACT ......................................................................................................................... 11
7. ABOUT THE AUTHOR ................................................................................................. 12
8. DEDICATION & ACKNOWLEDGEMENT ........................................................... 14
9. DECLARATION ............................................................................................................... 15
10. COPYRIGHT STATEMENT ......................................................................................... 16
CHAPTER 1: Background and Introduction ............................................................................. 17
1.1 Introduction..................................................................................................................... 17
1.2 Research aim and questions .......................................................................................... 18
1.3 Why focus on the Social Risk Management framework? ......................................... 20
1.4 This study’s contribution to knowledge ...................................................................... 24
1.5 Structure of the thesis .................................................................................................... 25
CHAPTER 2: Social Protection, Social Assistance and Poverty, with a Focus on
Bangladesh ........................................................................................................................................ 28
2.1 Introduction..................................................................................................................... 28
2.2 Understanding social protection and social assistance .............................................. 28
2.2.1 Social assistance and non-contributory pensions schemes .............................. 30
2.3 Risk, vulnerability and poverty in social protection ................................................... 32
2.4 Social protection, poverty entry and poverty exit ...................................................... 35
2.5 The socio-economic context of Bangladesh: an overview ....................................... 41
2.5.1 Bangladesh: a success story in poverty reduction? ............................................ 41
2.5.2 Social protection and poverty reduction in Bangladesh ................................... 43
2.5.3 The changing dynamics of social protection programmes in Bangladesh ..... 46
2.5.4 Public spending on social protection in Bangladesh: some recent evidence . 49

3
2.5.5 Non-contributory pension scheme in Bangladesh: the Old Age Allowance
(OAA) .................................................................................................................................. 55
2.5.6 The Municipality of Narayanganj and the OAA................................................ 58
2.6 Conclusions ..................................................................................................................... 60
CHAPTER 3. ‘Risk’ and Investment Behaviour: a Multidisciplinary Perspective ................ 62
3.1 Introduction..................................................................................................................... 62
3.2 Risk, social policy and social protection ...................................................................... 63
3.2.1 Risk and society ...................................................................................................... 63
3.2.2 Risk in social policy ................................................................................................ 64
3.2.3 The Social Risk Management (SRM) conceptual framework and poverty
reduction .................................................................................................................................. 65
3.3 Risk, social policy and social protection: a critique.................................................... 70
3.3.1 Critiques to the SRM ............................................................................................. 71
3.4 Investment behaviour and poverty exit: perception, acceptability and ‘factors’ ... 74
3.5 Research strategy, analytical framework and Grounded Theory ............................. 79
3.5.1 Analytical framework of the research .................................................................. 80
3.5.2 Understanding and eliciting investment behaviour ........................................... 80
3.5.3 Developing a model for understanding investment preference and behaviour:
The Grounded Theory Framework ........................................................................................ 84
3.5.4 The Grounded Theory framework and its critique ........................................... 89
3.6 Conclusions ..................................................................................................................... 91
CHAPTER 4. The Research Process ........................................................................................... 92
4.1 Introduction..................................................................................................................... 92
4.2 The research process at a glance .................................................................................. 93
4.3 Operationalizing Grounded Theory ............................................................................ 94
4.3.1 Phase One: Initiating the fieldwork (exploratory phase) .................................. 96
4.3.2 Phase Two: Piloting the interview guide in Rishipara ....................................... 98
4.3.3 Phase Three: Conducting in-depth interviews ................................................. 100

4
4.3.4 Phases Four & Five: Preliminary analysis, ‘double-back steps’ and the
opportunity structure ............................................................................................................... 105
4.3.5 Phase 6: Focus group discussions ...................................................................... 109
4.4 Phase 7: Final analysis with Nvivo ............................................................................ 110
4.5 Fieldwork challenges and ethics ................................................................................. 111
4.5.1 Fieldwork challenges ............................................................................................ 111
4.5.2 Ethics ..................................................................................................................... 112
4.6 Conclusions ................................................................................................................... 113
CHAPTER 5. Households’ Savings Preferences and Savings Behaviour: a role for the Old
Age Allowance? ............................................................................................................................. 114
5.1 Introduction...................................................................................................................115
5.2 Household’s savings preferences and savings behaviour ....................................... 115
5.3 Categories in the savings dimension .......................................................................... 118
5.3.1 From concepts to categories ............................................................................... 122
5.3.2 Categories and their properties .......................................................................... 124
5.3.3 Availability of additional financial resources: the household’s savings
threshold ................................................................................................................................. 125
5.3.4 Setting individual goals and motivation from within ...................................... 128
5.3.5 Collective goals and motivation from outside: Trust, fitting in and experience
................................................................................................................................. 129
5.3.6 Setting up the somiti – opportunities and design features ............................. 131
5.4 Understanding how categories interact: An explanatory model of the of
preferences and behaviour in savings .................................................................................... 133
5.5 OAA, savings behaviour and revealed savings choices........................................... 138
5.6 Conclusions ................................................................................................................... 141
CHAPTER 6. Households’ Investment Preferences and Behaviour in Education: a role for
the Old Age Allowance? ............................................................................................................... 143
6.1 Introduction................................................................................................................... 143
6.2 Household’s investment preferences and investment behaviour in education ... 143
6.3 Categories in the education dimension ...................................................................... 145

5
6.3.1 Financing education: The ‘family situation’ and its survival .......................... 145
6.3.2 External factors and financial resources ........................................................... 148
6.3.3 Student’s commitment and academic performance ........................................ 149
6.3.4 Age of education: Awareness, motivation and the minimum threshold effect .
................................................................................................................................. 153
6.4 Understanding how categories interact: an explanatory model of the investment
preferences and behaviour in education ................................................................................ 158
6.5 OAA, investment preference and behaviour in education: a liquidity effect? ..... 162
6.6 Conclusions ................................................................................................................... 164
CHAPTER 7. Households’ Investment Preferences and Behaviour in Health: a role for the
Old Age Allowance? ..................................................................................................................... 166
7.1 Introduction................................................................................................................... 166
7.2 Household’s investment preferences and investment behaviour in health .......... 166
7.3 Categories in the health dimension ............................................................................ 170
7.3.1 Survival lens .......................................................................................................... 171
7.3.2 Perception and knowledge on health ................................................................ 173
7.3.3 Financing health ................................................................................................... 176
7.4 Understanding how categories interact: An explanatory model of the investment
preferences and behaviour in health ...................................................................................... 178
7.5 OAA, investment preferences and behaviour in health .......................................... 182
7.6 Conclusions ................................................................................................................... 185
CHAPTER 8. Social Assistance and Investments: Revisiting the Social Risk Management
framework ...................................................................................................................................... 187
8.1 Introduction................................................................................................................... 187
8.2 Social assistance and investments: unpacking investment preferences and
investment behaviours ............................................................................................................. 188
8.2.1 From investment preferences to investment behaviours: a minimum
threshold and motivation hypothesis? .................................................................................. 191
8.3 Towards a behavioural SRM framework ................................................................... 193
8.4 A behavioural SRM framework? ................................................................................ 198
6
8.5 Implications for research: grounded theory, research in economics and testing the
models ........................................................................................................................................ 199
8.5.1 Grounded theory and research in economics .................................................. 199
8.5.2 The way forward: Expanding concepts and testing the theory ..................... 201
8.6 Social assistance interventions and beyond .............................................................. 202
8.7 Conclusions ................................................................................................................... 205
CHAPTER 9: Conclusion: the Research Journey and its Key Findings ............................... 207
9.1 Introduction................................................................................................................... 207
9.2 The research journey .................................................................................................... 207
9.3 Seven findings and seven contributions to knowledge and practice ..................... 212
9.4 Conclusions ................................................................................................................... 214
10. References .......................................................................................................................... 215
11. Appendices ........................................................................................................................ 228
7
LIST OF TABLES
Table 2.1: Social protection in Bangladesh: budgets and shares of different types of
programme (2008/09 to 2010/11) (in million USD) ................................................................. 49
Table 2.2: Selected social protection programmes in Bangladesh 2008-2011 ........................ 51
Table 2.3: Largest social protection programmes in Bangladesh (2010/11) .......................... 53
Table 2.4: OAA in Bangladesh 1997-2012 .................................................................................. 57
Table 2.5: Distribution of new OAA beneficiaries in Narayanganj, 2003/04-2010/11. ...... 59
Table 3.1: Structural characteristics common to all GT approaches. ...................................... 86
Table 4.1: Structural characteristics of GT and its operationalization in this research ......... 95
Table 4.2: Classification of slum areas ......................................................................................... 98
Table 4.3: Dimensions discussed during the interview process ............................................. 103
Table 4.4: the Interview process with individual households ................................................. 104
Table 4.5: Focus group discussions ............................................................................................ 110
LIST OF FIGURES
Figure 1.1: Safety nets: evidence and practice on protection and promotion ........................ 24
Figure 2.1: Decomposing vulnerability: the Risk Chain. ........................................................... 33
Figure 2.2: Social protection and poverty .................................................................................... 38
Figure 3.1 The Social Risk Management Framework: access to social protection
instruments, consumption smoothing, investment behaviour and poverty exit .................... 67
Figure 4.1: Seven phases of the research process ....................................................................... 93
Figure 4.2: The iterative ‘Back and Forth’ process of GT ........................................................ 96
Figure 4.3: the Process of Realization: from investment preferences to investment
behaviour ....................................................................................................................................... 108
Figure 5.1: From interview transcription to Nvivo internals .................................................. 120
Figure 5.2: From the excel database to the Nvivo’s case attributes ....................................... 120
Figure 5.3: Nodes in Nvivo ........................................................................................................ 121
Figure 5.4: Tree node structure in Nvivo .................................................................................. 122
Figure 5.5: Households’ attributes in Nvivo ............................................................................. 124
Figure 5.6: Savings preferences and savings behaviour ........................................................... 138
Figure 6.1: Investment preference in education and the role of the child’s commitment.. 152
Figure 6.2: Investment behaviour in education and the role of the child’s commitment... 153
Figure 6.3: Investment preferences and behaviour in education ........................................... 162

8
Figure 7.1: Investment preferences and behaviour in health .................................................. 182
Figure 8.2: Adapted analytical framework ................................................................................. 195
LIST OF BOXES
Box 2.1: Types of risk responses ................................................................................................... 35
Box 2.2 Meanings of poverty ....................................................................................................... 36
LIST OF APPENDICES
Appendix 1: Definitions of Social Protection by selected International Organizations ..... 229
Appendix 2: Rational Choice Theory, Expected Utility Hypothesis, Risk and Uncertainty
.......................................................................................................................................................... 230
Appendix 3: Alternative Conceptual Frameworks for Social Protection .............................. 231
Appendix 4: Map of Bangladesh ................................................................................................. 232
Appendix 5: Map of Narayanganj and poor settlements ......................................................... 233
Appendix 6: Interview Guidance Note and form .................................................................... 234
Appendix 7: Approval Letter from the Government of Bangladesh .................................... 247
Appendix 8: Nvivo Report – Node classifications summary report ..................................... 250
Appendix 9: Profile of four poor urban settlements in Narayanganj .................................... 254
9
LIST OF ABREVIATIONS
ADB Asian Development Bank
BLCH behavioural life-cycle hypothesis
BRAC (Formerly) Bangladesh Rural Advancement Committee
CAQDAS Computer Assisted Qualitative Data Analysis Software
CCT Conditional Cash Transfer
CDC Community Development Committee
CFUP-TUP Challenging the Frontiers of the Ultra poor- Targeting Ultra Poor
programme
CPRC Chronic Poverty Research Center
DFID Department for International Development (UK)
DHS Demographic Health Survey
EGPP Employment Guarantee Programme for the Poorest
EU European Union
FFW Food For Work
FGD Focus Group Discussions
FSSAP Female Secondary School Assistance Programme
GDP Gross Domestic Product
GOB Government of Bangladesh
GT Grounded Theory Framework/Approach
HIES Household Income and Expenditure survey
IDS Institute of Development Studies
IGVGD Income Generation Vulnerable Group development programme
ILO International Labour Organization
LCH Life-cycle hypothesis
LEAP Livelihood Empowerment Against Poverty
MDG Millennium Development Goals
MIT Massachusetts Institute of Technology
NGO Non Governmental Organization
NREGA National Rural Employment Guarantee Act (India)
ODI Overseas Development Institute
OVC Orphan and Vulnerable Children
PPRC Power and Participation Research Centre
PRSP Poverty Reduction Strategy Paper
REOPA Rural Employment Opportunities for Public Assets
10
RERMP Rural Employment & Road Maintenance Programme
SFYP Sixth Five Year Plan
SRM Social Risk Management
SSN Social Safety Net
TK Taka
TSP Transformative Social Protection Framework
UNDP United Nations Development Programme
UNFPA United Nations Population Fund
UPPR (&
LPUPAP)
Urban Partnership for Poverty Reduction (and Local Partnerships for Urban
Poverty Reduction Project)
VGD Vulnerable Group development Programme
VGF Vulnerable Group feeding Programme
VLE Vulnerability as Lack of Entitlement’
VLW Vulnerability as Uncertain Welfare
WFP World Food Program
WHO World Health Organization
11
ABSTRACT
Social Protection, and in particular social assistance, has emerged as a key area of
international development policy. Recognition of the important role of social protection
policies is aligned to a growing consensus on their role in reducing poverty and
vulnerability and in preventing people from falling into poverty and facilitating exit from
poverty. In the late 1990s, the World Bank (WB) developed the Social Risk Management
(SRM) framework as a new conceptual framework for analysing social protection in
developing countries. In the SRM, risk taking, the proactive management of risk at
household level, was argued to be essential in enabling poor households to invest and
grasp opportunities for economic development and poverty reduction.
This research examines and conceptualizes the why and the how of investment by
households in poverty. The research also examines the extent to which access to social
assistance interventions may play a positive or negative role in the process. The thesis
argues that the SRM oversimplifies and underestimates a variety of factors and processes
that play a role in the household’s investment behaviour in three dimensions of their life,
namely savings, education and health. In the research, household decision making is
conceptualised as a two stage process of ‘constructing’ investment preferences (what they
are willing to do), and of ‘realizing’ or ‘revealing’ household choices (what they actually do).
The empirical findings indicate that access to social assistance did not appear to have a role
in constructing investment preferences. However, it had limited role under certain
circumstances in favouring the realization of households’ investment preferences. The
research suggests that the SRM fails to encapsulate the complexity of household
investment decisions, crucial to exiting poverty. Building on some of the concepts emerged
in the research, I develop a ‘behavioural’ variation of the ‘risk taking /poverty exit’
component of the SRM in an attempt to improve the explanatory capacity of this
framework.
The research utilises the grounded theory framework (GT), adapted to a low income
country context, and investigates the role of social assistance in household behaviour
through an extensive field work in Bangladesh with urban households targeted by the Old
Age Allowance Scheme (OAA), one of the largest social assistance schemes in Bangladesh.

12
ABOUT THE AUTHOR
Luigi (Peter) Ragno is a development practitioner with 12 years of experience in social
development. He started his career as a volunteer during his undergraduate studies in
London, UK (BA in Development Studies, Spanish and International Relations, London
Guildhall University) and as staff of a local NGO during his postgraduate studies in
Sydney, Australia (MA in Applied Anthropology and Development Studies, Macquarie
University). After his studies, he continued his career as development practitioner with the
Red Cross in advisory roles in Colombia, Maldives and Bangladesh. During his stay in
Bangladesh from 2008, he started his PhD (2009) and continued working on research and
policy on social protection and poverty with bilateral organizations (GiZ; Swiss
Development Cooperation) and United Nations Agencies (IOM, FAO, UNDP). In 2013,
he joined UNICEF- Ghana where he heads the Social Protection Technical Assistance
Unit.
Recently, he has co-edited a book as well as authored and co-authored three chapters on
social protection in Bangladesh, drawing material from this PhD thesis. His recent
publications include the following:
RAHMAN, H. Z., HULME, H., MAITROT, M. & RAGNO, L. P. (eds.) 2014. Social
Protection in Bangladesh: Building Effective Social Safety Nets and Ladders out of Poverty, Dhaka,
Bangladesh: University Press Limited
HULME, D., MAITROT, M., RAGNO, L. P. & RAHMAN, H. Z. 2014. Consolidating
Nets and Promoting Ladders in Bangladesh: From Social Safety Net Programmes to a
National Social Protection System. In: RAHMAN, H. Z., HULME, D., MAITROT, M. &
RAGNO, L. P. (eds.) Social Protection in Bangladesh: Building Effective Social Safety Nets and
Ladders out of Poverty. Dhaka: UPL.
RAGNO, L. P. 2014. Social Protection, Poverty Exit and Household's Behaviour: A
Multidisciplinary Perspective. In: RAHMAN, H. Z., HULME, D., MAITROT, M. &
RAGNO, L. P. (eds.) Social Protection in Bangladesh: Building Effective Social Safety Nets and
Ladders out of Poverty. Dhaka: UPL.
RAHMAN, H. Z., HULME, D., MAITROT, M., RAGNO, L. P. & . 2014. Social
Protection in Bangladesh: The Road Ahead. In: RAHMAN, H. Z., HULME, D.,
MAITROT, M. & RAGNO, L. P. (eds.) Social Protection in Bangladesh: Building
Effective Social Safety Nets and Ladders out of Poverty. Dhaka: UPL.

13
RUKHEN, A. A., RAGNO, L., TAVARES GOODMAN, N., WALSHAM, M. &
WHEATON, A. 2012. Urban Poverty in Bangladesh: Results from a Socio-economic Survey in Six
Poor Urban Settlements in Narayanganj. GiZ, Dhaka, Bangladesh

14
DEDICATION & ACKNOWLEDGEMENT
Everything I have done, everything I do is an attempt to contribute to improving the lives
of those that have not been as lucky as me. Though they may never know, this thesis is
dedicated to them and goes with a commitment to continue working towards a more equal
world.
This thesis is the result of ‘patience’ and ‘encouragement’. Not my patience, of course,
since it is a bit scarce in my portfolio. This is about the patience of my supervisors at the
University of Manchester, Prof A. Barrientos and Prof D. Hulme, who have guided me
throughout this work and have been patiently waiting for my chapters, while I was juggling
between work, family and my research. The patience exercised by my family, most
especially my wife and children, as well as my interviewees, deserve a special
acknowledgment.
The encouragements and trust I have received from my supervisors have also been very
important throughout this PhD journey. On many occasions, I got worried whether this
journey will ever come to an end, and it was my wife who gave me the needed
encouragement during those moments.
Many people have made possible for me to be here writing this dedication. I will
particularly like to acknowledge the tremendous support of my Bangladeshi field assistants,
Hassan and Allaudin, as well as my Ghanaian friend, Abdul-Gafaru Abdulai, who spared
part of his busy schedules to edit and proof-read this thesis. I also need to acknowledge the
organizations I have worked with and their flexibility in allowing me to spend substantial
time in the UK and in Narayanganj to work on my research. Without this support, this
piece would have been impossible.
So I say many thanks to you all

15
DECLARATION
No portion of the work referred to in this thesis has been submitted in support of an
application for another degree or qualification for another degree or qualification of this or
any other university or other institute of learning.
Luigi Ragno
July 2014

16
COPYRIGHT STATEMENT
i. The author of this thesis (including any appendices and/or schedules to this thesis) owns
certain copyright or related rights in it (the “Copyright”) and s/he has given The University
of Manchester certain rights to use such Copyright, including for administrative purposes.
ii. Copies of this thesis, either in full or in extracts and whether in hard or electronic copy,
may be made only in accordance with the Copyright, Designs and Patents Act 1988 (as
amended) and regulations issued under it or, where appropriate, in accordance with
licensing agreements which the University has from time to time. This page must form part
of any such copies made.
iii. The ownership of certain Copyright, patents, designs, trade marks and other intellectual
property (the “Intellectual Property”) and any reproductions of copyright works in the
thesis, for example graphs and tables (“Reproductions”), which may be described in this
thesis, may not be owned by the author and may be owned by third parties. Such
Intellectual Property and Reproductions cannot and must not be made available for use
without the prior written permission of the owner(s) of the relevant Intellectual Property
and/or Reproductions.
iv. Further information on the conditions under which disclosure, publication and
commercialisation of this thesis, the Copyright and any Intellectual Property and/or
Reproductions described in it may take place is available in the University IP Policy (see
http://documents.manchester.ac.uk/DocuInfo.aspx?DocID=487), in any relevant Thesis
restriction declarations deposited in the University Library, The University Library’s
regulations (see http://www.manchester.ac.uk/library/aboutus/regulations) and in The
University’s policy on Presentation of Theses

17
CHAPTER 1. Background and Introduction
1.1 Introduction
Social Protection, and in particular social assistance, has emerged as a key area of
international development policy. International organisations and national governments
have developed social protection programmes - depicted as ladders (Kabeer, 2002; Kabeer,
2007), trampolines (Conway and Norton, 2002), ropes and springboards (World-Bank,
2001) –as part of their broader development policies and strategies. Increasingly,
academics and researchers in leading universities and in multilaterals like the World Bank
have also paid significant attention to the conceptual basis and empirical achievements of
social protection policies.
Despite the growing recognition of the significance of ‘social protection’ in current
development thinking, there is still no consensus on what is meant by ‘social protection’:
several authors and organizations use the term in reference to significantly different things.
It is widely accepted, however, that social protection policies in developing countries have a
strong focus on poverty and poverty reduction and are important strategies in addressing
households’ vulnerability (Arjona, Ladaique, and Pearson 2002 and 2003; Barrientos and
Hulme 2005; Barrientos, Hulme, and Shepherd 2005; Devereux 2002; Holmes, Farrington,
and Slater 2007; John Farrington 2004, 2007; Barrientos and Hulme 2008).
Recognition of the important role of social protection policies is aligned to their role in
reducing and preventing people from falling into poverty and vulnerability (Lustig, 2001).
There has also been growing consensus regarding the potentially progressive role of social
protection schemes in facilitating poor peoples’ ability to exit from poverty (Barrientos,
2011; Barrientos, 2012; Weber and Camerer, 2006)
This emerging consensus has been driven by a series of ‘conceptual frameworks, analytical
tools, empirical evidence, national policy processes, heavyweight agencies and big names’
(Devereux and Sabates-Wheeler, 2007: 1), all of which have contributed first in changing
perception on what was previously known as safety nets, and secondly revisited their
overall impact on growth and poverty reduction.
In the late 1990s, the World Bank developed a new conceptual framework for social
protection namely the Social Risk Management (SRM) Framework. This framework
emphasised the role of risk management measures in protecting livelihoods and promoting
risk taking as a key step in moving out of poverty (Holzmann and Jørgensen, 2000;
18
Holzmann and Kozel, 2007a). The SRM is rooted in fundamental hypotheses of
neoclassical economics, such as the expected utility and permanent income hypotheses
which hold that, consumption smoothens and promotes risk taking and investments.
The SRM is currently the most influential conceptual framework that has informed the
design of several country level social protection strategies (McKinnon, 2004; Devereux and
Sabates-Wheeler, 2007), including the new World Bank strategy on social protection and
labour 2012-2022 (World-Bank, 2012). This study, however, seeks to address the question
as to whether and to what extent this approach and its conceptualization of social
protection, investments and risk taking as a key exit route out of poverty, is congruent with
empirical findings on the ground.
1.2 Research aim and questions
The overall aim of this research is to contribute to developing a more effective conceptual
framework for understanding social protection policies in developing countries. It does so
by interrogating the SRM framework from a multidisciplinary perspective (rather than a
purely economics lens as much existent literature does), focusing mainly on the theoretical
assumptions that underline it.
The main research question addressed here is: to what extent is the SRM and its conceptualization
of social protection, investments and risk taking as a key exit route out of poverty, congruent with the
empirical findings? In addressing this question, the study focuses specifically on the analysis
of public policies that seek to address economic security in old age in urban Bangladesh.
To answer this question, I have adapted the Grounded Theory Framework (GT) to a low
income country context and investigated the role of social assistance in household
behaviour through extensive field work in Bangladesh with urban households targeted by
the Old Age Allowance Scheme (OAA)1, one of the largest social assistance schemes in
Bangladesh.
To answer the main question that underpins this study, I pose three interrelated sub-
questions:
1 In this study I use interchangeably the word OAA with pension and social pension.
19
1. What factors enable or constrain urban households in opting for more investments,
and in engaging in riskier and higher return choices in the savings, education and
health dimensions in Bangladesh?
2. In what ways and to what extent do social pension programs promote increased
investments in the education, savings and health dimensions?
3. To what extent does the SRM provide an effective analytical and conceptual
framework for understanding and predicting household’s investment behaviour and
poverty exit?
These sub-questions are addressed by, firstly, examining and conceptualizing the why and
the how urban households in Bangladesh invest in three critical drivers of poverty
reduction: savings, education and health. The choice of focusing on the education and
health dimensions of the household’s lives is based on the increasing recognition of the
critical role of human capital investments in poverty reduction (Adato and Bassett, 2009).
Impact evaluations and research consistently revealed that social protection triggers
additional investments in health and education (Adato and Bassett, 2009; Baird et al., 2014).
The factors and processes at play in the decision making process that lead households to
invest more in these dimensions is however rarely explained. This is also the case of the
third dimension being examined, savings. In addition, the selection of savings is informed
by the specific program that was examined, the OAA and by the specific context of where
the field work was implemented. In Narayanganj, a major government initiative to promote
savings in poor urban settlements was in fact launched and preliminary findings show the
importance of this initiative in savings behaviour.
It is important to point out that the selection of these three dimensions was not a priori and
was made only after the fieldwork: field data were collected on many dimensions including
employment, investments, and access to credit.
It is important to point out as well that here, I do not examine whether more investments
in these dimensions are a prelude to long lasting poverty reduction and poverty exit.
Rather, I focused on the processes that may lead households to invest more in these
dimensions which in turn may contribute to poverty exit.
To answer the first research sub-question, for each dimension (savings, education and
health), I first identified and then examined the ‘categories’ and their functioning in relation
to the households’ investment decisions. Categories, in the terminology of GT, can
explicate ideas, events and processes in the data (Charmaz, 2006: 91). Categories are
concepts which have a major explanatory value and incorporate other identified concepts

20
as properties of the category. Identifying the categories that enable or constrain
households’ higher return and riskier choices will contribute to defining a more
comprehensive conceptual framework for designing more context-specific and group-
specific social protection interventions (Taylor-Gooby et al., 2000, Taylor-Gooby and
Zinn, 2006). After examining each category, I moved forward in integrating them into a
‘single explanatory model’, by providing a simple, yet comprehensive understanding of how
these categories work in shaping household’ investments. The model conceptualizes what
the main categories are and how they relate to each other in the process that constructs
households’ preferences and behaviour.
The second sub-question, on the other hand, examines how social assistance functions in
this model. In order to have a more in-depth understanding of the role of the social
assistance in this process, I have used some of the techniques of GT and modified them to
serve this purpose. To drive the analysis further, I treat the concept of ‘social assistance’ as
a core category, placing social assistance as the central element in the model. By doing so, I
was able to identify important dynamics on how social assistance may influence
households’ investment behaviour. Alongside this, I have examined how social assistance
operates and to what extent it determined directly the households’ investment preferences
and behaviour, or if it acted together with other factors and under which conditions it
functioned.
The key concepts identified by answering the first and second research sub-questions,
provide the basis for answering the third research sub-question. By extracting the key
elements that emerged from the fieldwork, I examine how social assistance may determine
whether households will invest more and engage in higher risk/higher return activities to
exit poverty, which is what the SRM predicts. By doing so I am able to discuss the extent to
which the SRM may contribute to an understanding of urban poverty in Bangladesh that
can assist the designing public policy responses to poverty and vulnerability.
The next section briefly introduces and explains the importance of the SRM in social
protection (see also Chapter Three).
1.3 Why focus on the Social Risk Management framework?
The SRM pictures an alternative approach to traditional conceptualization of public
policies, encouraging, among other things, an enormous shift of responsibility for the
common good and wellbeing among the ‘welfare’ triad, from the state to the individuals
21
and market (Esping-Andersen, 1999; McKinnon, 2004).The centrality of the SRM in this
research project reflects the broad implications which this framework has; it also suggests
that such a latent paradigm change requires to be further researched upon in terms of its
suitability and usefulness in shaping public policy for poverty reduction.
‘Risk’ will be a very recurrent word in this research and will assume two different meanings
and conceptualizations from its behavioural and situational perspectives. The word ‘risk’ is
associated with individuals’ behaviours and to their decision making processes in an
‘uncertain environment’, where multiple alternative choices (options) are available. In
economics, risk is a mathematically quantifiable probability of returns from a choice: this
behavioural notion of risk suggests that individuals can be risk averse, risk seeking, and risk
neutral. This means that individuals, when taking a decision, try to select choices which
match the preferred level of risk taking. In the SRM, the behavioural notion of risk is
presented as ‘risk taking’ and is the central concept in linking social protection instruments
to poverty exit, the SRM ‘promotion’ component (De Neubourg and Weigand, 2000;
Holzmann and Jørgensen, 2000; Holzmann and Kozel, 2007b).
The word ‘risk’ in this study will also move beyond its behavioural meaning, and will be
associated to environmental and external events. The situational definition of risk is often
linked to a vast literature where risk is the probability of losses (e.g. depletion of assets)
caused by the interaction of an event (e.g. financial crisis) and individuals or societal
vulnerability to that event (e.g. weak financial institutions) and can reduce the achievement
of individual and societal welfare. This conceptualization of risk has become the key
organizing principle of social policy: by preventing, mitigating, and coping with risk, society
will be able achieve social welfare outcomes. In the SRM, the situational definition of risk
conceptually underpins the ‘protection’ component of the SRM: managing risks
(preventing, mitigating and coping) will reduce vulnerability and avoid or reduce losses.
In the SRM framework, risk taking refers to the proactive management of risk at household
level to ‘grasp opportunity for economic development and poverty reduction’ (Holzmann
and Jørgensen, 2000: 4). The management of risk with appropriate instruments can
promote equity, consumption smoothing, and reduce vulnerabilities in ways that provide
an ‘avenue out of poverty’ (ibid: 8). In positioning risk taking as the pathway for exiting
poverty, the SRM suggests the existence of a positive relationship between risks and
returns: if a choice is riskier (high risk), the returns from that choice will also be higher
(Mukherji et al., 2008: 243).

22
Although neoclassical economic theory suggests that risks and returns are positively
associated, a growing body of evidence suggests that risk attitudes and perceived ‘reference
points’ (targets) influence the risk-return association into a negative and curvilinear
relationship (Kahneman and Tversky, 2008; Fiegenbaum and Thomas, 1988). In the critical
analysis of the SRM, it has been identified however that high risk is used as a synonym of
high return choice. This study recognizes the conceptual confusion on the use of the terms
‘high risk’ and ‘high return’, however, to maintain consistency with the SRM conceptual
framework, in this study ‘high risk’ is used as a synonym of ‘high return’ choice and
investments. In the SRM, as stated earlier, risk taking and higher risk refers to higher levels
of investment triggered by the access to social protection measures. Using the terms
investment, investment preference and investment behaviour simplifies the concepts
attached to ‘riskiness’ and ‘degree of risk’ and avoids any misunderstanding in relation to,
for instance, riskier behaviour in health which may assume a negative connotation.
As noted earlier, the SRM is the most influential theoretical framework that informs the
design social protection policies in developing counties in the 21st century. Risk taking is at
the centre of the SRM Framework. In this framework, risk taking, the proactive
management of risk at household level, is seen as essential for enabling households to
‘grasp opportunity for economic development and poverty reduction’. The SRM suggests
that households living in poverty are ‘risk averse and as a result they are very reluctant to
engage in higher risk/higher return activities’. If households have access to risk
management (social protection) instruments, they are more likely to engage in riskier and
higher return choices, such as accumulating assets (Moser and Dani, 2008), therefore
improving their living conditions and enabling them to climb out of poverty. Indeed, for
Holzmann (2000: 23), ‘risk taking is productive and risk can be seen as a factor for
production with the same status as the better-known factor like capital and labor’ (ibid: 23).
He argued in more detail that the
threat of destitution and non-survival renders the poor very risk averse and as a
result makes them very reluctant to engage in higher risk/higher return activities.
As a consequence, the poor are not only not capable of seizing opportunities
which emerge in a globalizing world, but they are even more exposed to the
increased risks which the process is likely to entail. Without the opportunity of risk
taking and engagement in more profitable production, poverty is likely to be
perpetuated for them and their children (ibid: 9).
The underlying argument in this framework is that, if proper risk management measures
are in place, households living in poverty will adjust their ‘myopic behaviour’ (Banerjee
and Mullainathan, 2010: 3) which will then fit the linear predicted model, proactively
23
engaging in higher risk and higher return activities, through more investments. From this
perspective, therefore social protection measures should aim at supporting households in
managing their risk and reducing their vulnerability and at the same time support exit from
poverty by promoting behaviour towards risk taking and higher return choices.
In this context, development policy can be designed to overcome risk aversion by the poor.
The SRM suggests a linear process, whereby access to social protection schemes necessarily
triggers a change in the individual or household’s investment behaviour towards engaging
in greater investments in different dimensions of their lives, such as education, business
and so forth.
Even if the concept of risk taking is central to the promotion role of social protection
strategies within the World Bank’s SRM, the empirical evidence on its role is weak and has
been labelled as ‘inappropriate, over generalized and paradoxical’2 (McKinnon, 2004: 308).
During the launching (figure. 1.1) of a publication3 of the World Bank (Grosh, 2008),
Margareth Grosh highlighted that the strength of evidence on enabling the households’ to
invest more in higher return activities and in investments in their livelihoods’ is minimal (1 star in
the slide) and that further evidence is needed. This current gap in evidence is the main
reason behind this study. The importance of the SRM and the influence that this
conceptual framework has in the design of a growing number of interventions justify the
need of a better understanding of its theoretical foundations and predictive power.
2 Individuals are encouraged to take ‘additional risks’ which may cause catastrophic losses. 3 http://siteresources.worldbank.org/SAFETYNETSANDTRANSFERS/Resources/281945-1131468287118/1876750-1224712950559/For_Protection_and_Promotion_PPT.pdf

24
Figure 1.1: Safety nets: evidence and practice on protection and promotion (Source
World Bank,20083)
The term ‘promotion’ in this context refers to the poverty reduction and sustainable
poverty exit role of social protection strategies that goes beyond the traditional concept of
‘protecting’ households from falling into deeper poverty (Holmes, 2008; United Nations.
Economic and Social Commission for Asia and the Pacific, 2002; Grosh, 2008; World-
Bank, 1994a).
1.4 This study’s contribution to knowledge
A strong motivation for this research relates to the significant influence of the SRM
framework in shaping the design of national social protection strategies across a wide range
of countries (McKinnon, 2004; Devereux and Sabates-Wheeler, 2007) and the potential
implications of this for tens of millions of urban households. Conservative estimates
suggest that about one billion people are currently targeted by cash transfer schemes – an
important component of social protection interventions in the developing world
(Barrientos, 2013: 4).

25
By examining the SRM through a multidisciplinary, rather than purely economics lens, this
research contributes to exploring and interrogating the theoretical assumptions that
underline it. Here, I use a multidisciplinary lens to interrogate the SRM through a grounded
theory approach and I develop a ‘behavioural’ variation of the ‘risk taking /poverty exit’
component of the SRM framework in an attempt to improving its explanatory capacity.
This research provides a new framework for examining investment behaviour and
preferences, the ‘process of realization’, and how these may be shaped by social assistance
intervention. By doing so, this research contributes also to the discourse on poverty exit, by
suggesting that social assistance schemes do not ‘automatically’ trigger more investments
and that social assistance may play a role, under specific circumstances, in the realization of
the investment preference, but not in its construction. This research identified that other
factors such as experience, motivation, strength of goal, minimum threshold of education,
survival, have major role in shaping the investment preferences. An important element for
explaining when social assistance may play a role, under specific circumstances, in the
realization of the investment preference, is its contribution in smoothing consumption.
This study on the OAA shows that households are not able to smooth consumption and
are continually exposed to risks and shocks which undermine the availability of resources
for engaging in investments.
The use and operationalization of the GT in low income settings is an important
methodological contribution on how to do research and replicate this approach. The GT
also proved to be appropriate to do research on SRM and was instrumental in generating
inputs to the revision of theories that aim at explaining and predicting household
investment behaviour.
Finally, this research contributes to practice by identifying those implementation features,
such as the generosity of the transfer, the timing of the transfer, in social assistance
interventions matter on how resources will be used and invested.
1.5 Structure of the thesis
The thesis is divided into nine chapters.
After this introduction, Chapter Two reviews the role of social protection in poverty
reduction in line with the recent discourse on risk and vulnerability. This conceptual debate
leads to a discussion on social assistance schemes, including non-contributory social
pension schemes. The discussion is situated within the specific context of Bangladesh,
26
where social protection interventions have grown greatly since the 1980s. The chapter also
examines the OAA in Bangladesh and introduces the Narayanganj Municipality where field
work was conducted.
Chapter Three examines the SRM as a product of a ‘risk-centred’ paradigm shift in social
policy. It also examines its neoclassical foundation and critically reviews its ‘risk taking
(investments)’ component from the view of behavioural economics, sociology and
psychology. This multidisciplinary lens helped identifying the most suitable research
methodology to answer the research sub-questions, the GT. The final section of the
chapter offers a critique of the GT and explores its suitability for this study.
Chapter Four commences a set of four empirical chapters that discuss respectively the
research process, savings, education and health. Chapter Four explains on how the
methodology was operationalized and adapted in this research. It describes the seven
phases which encapsulate both data gathering and data analysis. The depth of details
presented in this chapter is needed to document the rigorous and transparent process that
leads to develop dimension specific models in the next three chapters.
Chapters Five, Six and Seven develop dimension specific models of household investment
behaviour, and provide detailed answers to the first two research sub-questions,
respectively on savings, education and health. More specifically, they explore (a) the key
factors that enable or constrain the targeted households in urban Bangladesh in opting for
more investments and engaging in riskier and higher return choices in relation to savings,
education and health; and (b) the extent to which basic social protection (social pensions)
promote behavioural change towards more investments in these same dimensions in urban
areas of Bangladesh. Here, the behaviour of households is conceptualised as a two stage-
process of ‘constructing’ investment preferences (what they are willing to do), and of
‘realizing’ or ‘revealing’ household choices (what they actually do). By making these
distinctions, I identify in each dimension an opportunity structure that filters the
investment preferences and determines the extent to which these preferences will be
realized as investment behaviour (dimension specific model).
Chapter Eight builds on the concepts that emerged in the field work and on the insights
from a multidisciplinary perspective to answer the third research question. Here, I integrate
important commonalities across the three dimension specific models to explore the
implications of the SRM framework for exiting poverty. Unpacking factors and processes
at play such as strong motivation, social norms, perceived survival needs, as well as trust
and commitment are important factors that need to be further researched, understood and

27
‘used’ to ensure the effectiveness of public policies. The findings in this chapter show that
access to social assistance did not appear to have had any significant role in constructing
investment preferences, but may have a role under certain circumstances in favouring the
‘realization’ of the household investment preferences. Based on these findings, I develop a
‘behavioural’ variation of the ‘risk taking /poverty exit’ component into the SRM
framework in ways that help improve the explanatory power of the standard SRM
approach. The chapter ends by highlighting important aspects of the GT that have
implications for research and the study of economics.
Chapter Nine concludes the thesis, synthesises the research journey and identifies the seven
findings and contribution to knowledge and practice of the thesis.
28
CHAPTER 2. Social Protection, Social Assistance and Poverty, with
a Focus on Bangladesh
2.1 Introduction
This chapter provides an overview of some of the key themes discussed in the thesis. It
starts by undertaking a review of the literature on social protection and its main typologies.
I focus particularly on exploring the inter-relationships between social assistance and social
pension on the one hand, and poverty and vulnerability on the other. The key concern here
is the extent to which social protection and social pensions can contribute to a reduction of
poverty and vulnerability. The chapter then turns attention to the country under study here,
Bangladesh – a country where the development and evolution of social protection has been
significant but remains relatively understudied. Finally, the chapter briefly introduces the
specific case study that is being explored here, namely the implementation of the OAA in
Narayanganj, a municipality of Bangladesh.
2.2 Understanding social protection and social assistance4
The term ‘social protection’ has often been used to refer to significantly different things by
academics, donor agencies, governments and NGOs. There is no consensus on what is
meant by social protection, such that authors and organizations have adopted different
conceptualizations. It is widely accepted, however, that social protection policies in
developing countries have a strong focus on poverty and poverty reduction and are
important strategies in addressing households’ vulnerability and stimulating economic
growth5 (Arjona, Ladaique, and Pearson, 2003; Barrientos and DeJong 2006; Barrientos
and Hulme 2005; Alderman and Yemtsov, 2012).
From the definitions of social protection presented in Appendix 1, there are some clear
basic common principles: social protection policies are initiatives of governments or private
actors (e.g. insurance providers and NGOs), which seeks to reduce poverty and address
households’ vulnerability and exposure to risks. These various definitions all highlight the
4 Section 2.1; 2.2; 2.3 and 2.4 are based on the book Chapter ‘Social protection, poverty exit and household’s behaviour: a multidisciplinary perspective’ in Social Protection in Bangladesh: Building Effective Social Safety Nets and Ladders out of Poverty, 2014 (Ed. H. Z. Rahman, D. Hulme, M. Maitrot and L.P. Ragno,), of which I am the sole author . 5 In developed countries, ‘the emphasis of social protection is on income maintenance and on protecting living standards for all’ (Barrientos 2011: 241).

29
role of vulnerability and risk; however do differ substantially when the ‘how’ and the
processes of delivery are looked at in detail. The World Bank and Asian Development
Bank’s (ADB) definitions of social protection emphasize the central role of the individuals
(or households) in managing risk and reducing vulnerability. In this conceptualization of
social protection, public actions have the task of providing support measures for the
individuals to manage risk. This perspective differs significantly from those definitions
provided by the Overseas Development Institute (ODI), Institute of Development Studies
(IDS) and International Labour Organization (ILO). In this latter perspective, there is a
greater role for public and private institutions rather than the poor themselves.
Despite these definitional differences, measures which fall under the broader umbrella of
social protection interventions have been grouped into five main typologies: labour
market; social insurance; social assistance; micro and area-based schemes; and child
protection (Baulch et al., 2008: 14-15):
Labour Market: this entails direct employment generation (microenterprise development and
public works); labour exchanges and other employment services; skills development and
training (only if targeted to vulnerable groups); labour legislation (including minimum age,
wage levels, health and safety).
Social Insurance (recipient-financed): Programs to cover the risks associated with unemployment,
sickness, maternity, disability, industrial injury, and old age (contributory schemes).
Social Assistance (social transfers or Social Safety Net) and Welfare (publicly-financed): Examples of
these include welfare and social services targeted at the disabled, poor elderly, the indigent,
those affected by disasters, and other vulnerable groups; cash/in-kind transfers (food
stamps, health cost exemptions, or subsidies); temporary subsidies for utilities and housing.
Micro and Area-Based Schemes: Among others, these include micro insurance/microfinance
schemes; agricultural insurance; disaster preparedness and management and social funds.
Child Protection: Child rights and advocacy/awareness; early child development activities;
educational assistance (school feeding, scholarships, fee waivers); health assistance (health
cost reduced fees/ subsidized medicines for vulnerable groups; Street-children/child
worker/orphan initiatives; family allowances.
This typology of social protection interventions may be valid for both developed and
developing countries, but the sequencing, scale and scope varies considerably between
countries. Barrientos (2013: 104-6) suggests, for example, that in developed countries,

30
social assistance schemes tend to play a residual role, often employed only after the failure
of other social protection interventions (e.g. insurances or labour marker regulations) fail to
provide sufficient protection for households. In developing countries instead, social
assistance has a more developmental role and acts as a substitute for other social protection
typologies which are often absent or only cover a small part of the population. Here, social
assistance is often the only protection instrument that households have. Social assistance in
developing countries is meant to contribute to poverty reduction in different ways: by
preventing people from falling into poverty (poverty entry); by supporting people and
households already living in poverty in their ‘graduation’ out of poverty (Poverty Exit)
through enhancing their productive capacities and greater access to basic social services
2.2.1 Social assistance and non-contributory pensions schemes
In developing countries, social assistance takes the shape of the provision of ‘direct transfer
in cash or in kind to individuals or households experiencing poverty or vulnerability, with
the aim of facilitating their permanent exit from poverty’ (Barrientos, 2013:3).
Social pensions are social assistance and welfare measures that deliver non-contributory
cash transfers to old people living in poverty. Social pension schemes are implemented in at
least 72 countries, although with substantially varied levels of public spending into such
schemes. For example, Bangladesh allocates only a mere 0.13 percent of its GDP to the
implementation of its social pension scheme (Begum and Wesumperuma, 2012: 194),
compared to 2.4 percent in Lesotho (Holzmann et al., 2009: 75).
In the last 40 years, the percentage of people above 60 years has increased drastically across
the globe, with some projections that by the 2050, around two billion people will be over
60 (HelpAge, 2009). It is also projected that most of the increase will be concentrated in
developing countries, and that by 2050, more than one billion older people will not have
regular cash income (Holzmann et al., 2009: 41). The support systems for the increasingly
growing number of elders has been drastically affected by industrialization and
urbanization which have caused and shaped new care dynamics, even in the more
traditionalist societies (World-Bank, 1994a). Globalization has affected the traditional
support mechanisms and informal arrangements (Holzmann and Jørgensen, 2000:4) within
households mostly for the ones living in poverty. In most resource scarce households, it is
often the active members and children that are prioritized in terms of individual care ( such
as access to food and health care) while the elderly are often rarely prioritized even in terms
of health needs, which increase with age (Aboderin, 2006; Lee, 2008).

31
In the case of the chronically poor, evidence exists that the ‘quality of care’ for an older
household member from younger ones is shaped by perceptions o the care the younger
ones received in earlier stage of their lives, affecting the household resource allocation
dynamics: not every member will have access to resources the same way (Van Sjaak Geest,
2002).
The challenges the older persons are facing increase significantly with age, as they are likely
to become sick and not to have access to labour market. Importantly, while older persons
have the prospect of earning much less from labour markets, it is this same category of
people whose expenditure on basic services, especially on health, are much likely to be
higher. This tends to create a poverty trap for elderly persons that are unlikely to be
effectively addressed without access to social pensions. Indeed, in countries as diverse as
India, Kenya and Vietnam, recent studies have pointed to a strong correlation between old
age on the one hand, and health risks and poverty on the other (Irudaya Rajan, 2008; Long
and Pfau, 2009; Kakwani et al., 2006). Kakwani and Subbarao (2005) found a strong
statistical correlation between old age and poverty in nine sub-Saharan African countries,
whereby households with old persons were more likely to find themselves below the
poverty line. Similar conclusions have been reached in studies examining countries in Latin
America, Asia and the Middle East (Holzmann et al., 2009: 42; Barrientos, 2000;
Barrientos, 2003; Barrientos et al., 2003; Barrientos and Lloyd-Sherlock, 2002).
Others have established a correlation between social pensions and poverty reduction. In
France, it is estimated that access to social pensions have significantly decreased the
likelihood of being poor (Holzmann et al., 2009). Investments in social pensions to reduce
poverty have been identified in Brazil and South Africa to have a direct impact on
households’ investments and growth, and on children well-being and entitlements, mostly
in households where older people were the guardians of children (Barrientos, 2004).
Regular income, not just for older persons, is a tool to materialize the right to social
security and to an adequate standard of living, recognised in the Universal Declaration of
Human rights (Gâomez Heredero et al., 2007). It is also a tool for upholding the elder’s
dignity by among others enhancing their potential in contributing to the wellbeing of
households as opposed to being passive members of society. Income transfers also have
the potential of facilitating access to basic services which are a key component of people’s
well- being, and for older persons. Social pensions are increasingly being considered as a
win-win policy option, given its impact on poverty as well as its cost effectiveness.
32
2.3 Risk, vulnerability and poverty in social protection
The terms vulnerability and risk have been recurrent words in the definitions of social
protection. It is therefore important to clarify them. Alwang (2001) defined the concept of
vulnerability as the probability of experiencing a loss in the future relative to some
benchmark of welfare. He notes further that:
a household can be said to be vulnerable to future loss of welfare and this
vulnerability is caused by uncertain events;
the degree of vulnerability depends on the characteristics of the risk and the
household’s ability to respond to the risk,
vulnerability depends on the time horizon, in that a household may be
vulnerable to risks over the next month, year, etc. and responses to risk take
place over time, and
That the poor and near-poor tend to be vulnerable because of their limited
access to assets (broadly defined) and limited abilities to respond to risk.
(Alwang et al., 2001: 1)
Vulnerability to poverty has, in the recent literature, been used as a new concept which has
redefined the discourse on poverty (Alwang et al., 2001; Devereux, 2007; Dhanani and
Islam, 2002; Guimarães, 2007; Heitzmann et al., 2002; Hoddinott and Quisumbing, 2003;
Morduch, 1994; Villagrán De León, 2006). Poverty has moved away from a static vision
and conceptualization towards more dynamic models. Vulnerability, in this context,
becomes a major factor not just in understanding current status but in understanding future
poverty, which can be defined as a welfare status below an acceptable benchmark level.
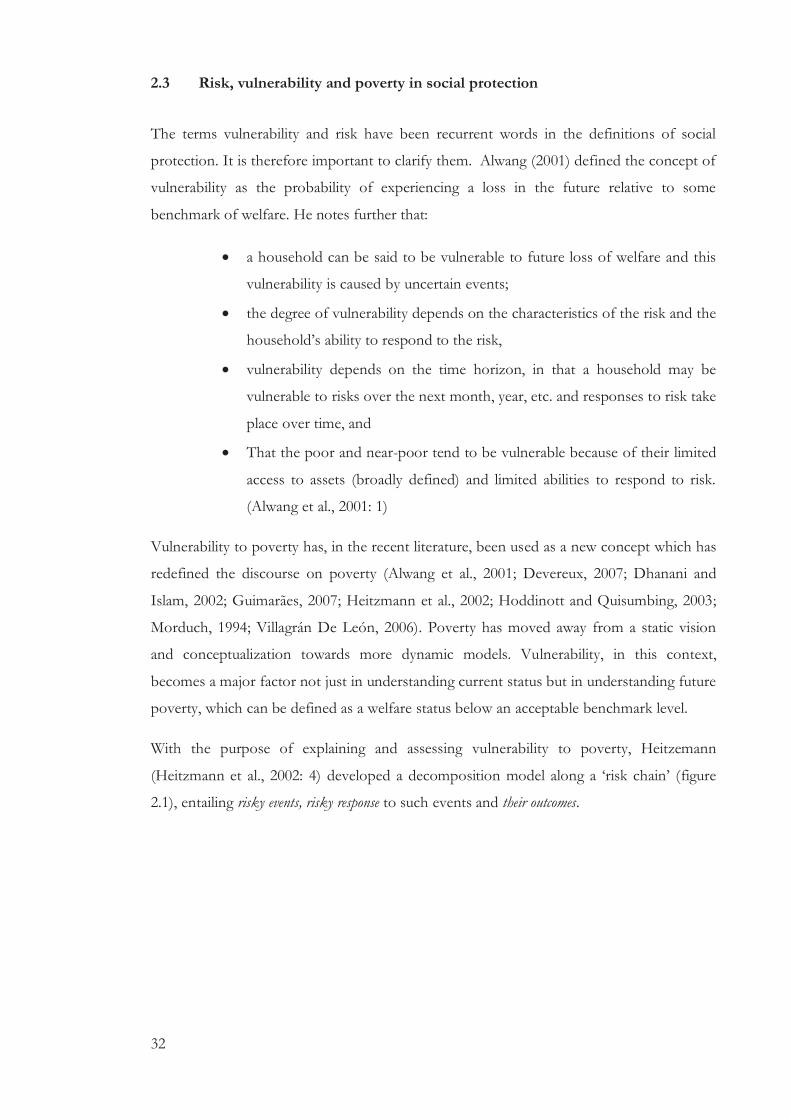
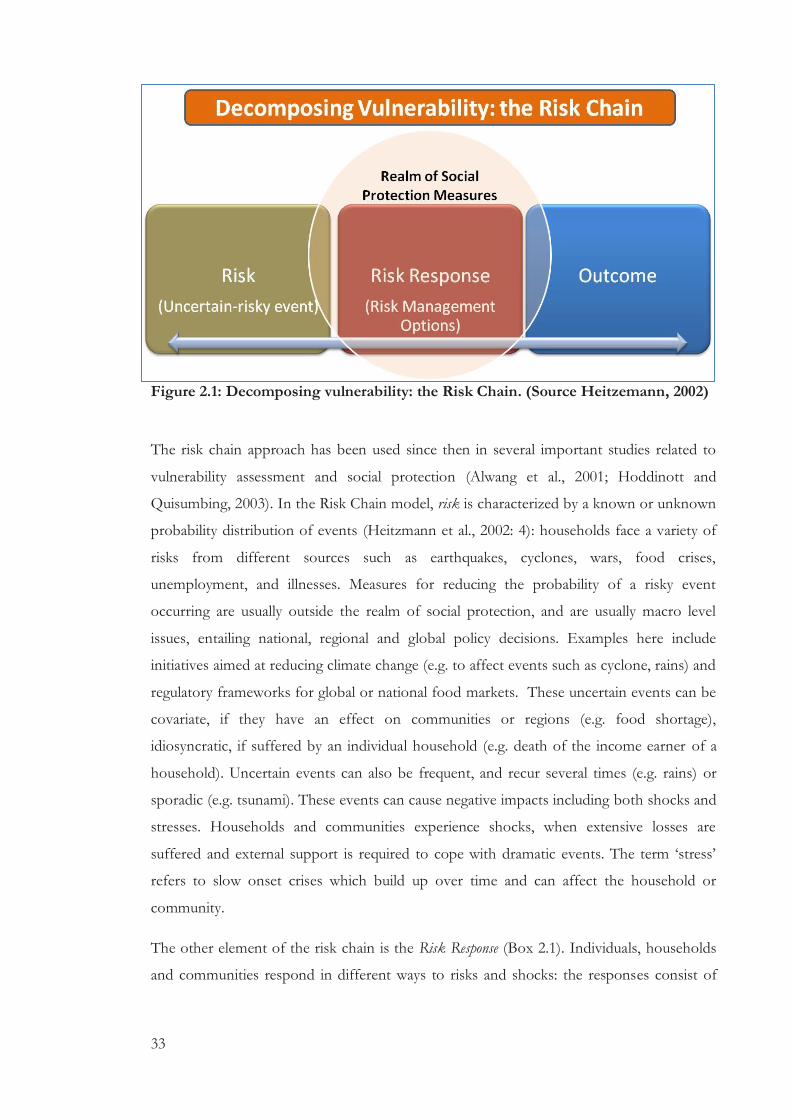
With the purpose of explaining and assessing vulnerability to poverty, Heitzemann
(Heitzmann et al., 2002: 4) developed a decomposition model along a ‘risk chain’ (figure
2.1), entailing risky events, risky response to such events and their outcomes.
33
Figure 2.1: Decomposing vulnerability: the Risk Chain. (Source Heitzemann, 2002)
The risk chain approach has been used since then in several important studies related to
vulnerability assessment and social protection (Alwang et al., 2001; Hoddinott and
Quisumbing, 2003). In the Risk Chain model, risk is characterized by a known or unknown
probability distribution of events (Heitzmann et al., 2002: 4): households face a variety of
risks from different sources such as earthquakes, cyclones, wars, food crises,
unemployment, and illnesses. Measures for reducing the probability of a risky event
occurring are usually outside the realm of social protection, and are usually macro level
issues, entailing national, regional and global policy decisions. Examples here include
initiatives aimed at reducing climate change (e.g. to affect events such as cyclone, rains) and
regulatory frameworks for global or national food markets. These uncertain events can be
covariate, if they have an effect on communities or regions (e.g. food shortage),
idiosyncratic, if suffered by an individual household (e.g. death of the income earner of a
household). Uncertain events can also be frequent, and recur several times (e.g. rains) or
sporadic (e.g. tsunami). These events can cause negative impacts including both shocks and
stresses. Households and communities experience shocks, when extensive losses are
suffered and external support is required to cope with dramatic events. The term ‘stress’
refers to slow onset crises which build up over time and can affect the household or
community.
The other element of the risk chain is the Risk Response (Box 2.1). Individuals, households
and communities respond in different ways to risks and shocks: the responses consist of
34
strategies aimed at managing or preventing risk occurrences before they happen (ex ante),
and to minimizing the potential impact of a shock should it occur.
The former strategies are commonly classified as risk reduction, and the latter as risk
mitigation strategies. Individuals do also respond after the risks materialize, after the shock
(ex post) with risk coping interventions to maintain and smooth consumption: these
responses can take the form of, for example, selling assets, reducing the number of meals
per day and sending school aged children to work.
The risk responses vary from households to households and are mediated by its
endogenous characteristics and other exogenous factors, such as number of active family
members, asset ownership, and social networks.
Another important distinction in the risk response is the formality or informality of the
strategy. ‘Households may rely on informal risk strategies such as (a) drawing on savings
and selling physical assets; (b) relying on reciprocal gift exchanges; or (c), diversifying into
alternative income-generating activities. Although these approaches can be highly effective
in the right circumstances, most recent studies show that informal insurance arrangements
are often weak’ (Morduch, 1999: 187) and might reinforce existing traps that lead to
suboptimal production decisions.
The Outcome dimension of the risk chain is the final result of the interaction between the
risk and the risk responses, and is quantified in relation to a socially accepted minimum
benchmark value6: ‘the household is said to be vulnerable from the risk or vulnerable to an
outcome. The magnitude, timing and history of risks and risk responses help determine the
outcome’ (Heitzmann et al., 2002: 5).
From the risk chain lens, vulnerability to poverty can be explained by the interaction of the
risky event, its strength, frequency and more in general from the risk’s characteristics and
the risk management options that may be available to households. The outcome of this
process of interaction defines the vulnerability to poverty, which means the likelihood of
households to become poor in the future (Holzmann and Jørgensen, 2000: 6) and as ‘the
probability or risk today of being in poverty or of falling into deeper poverty in the future’
(Coudouel et al., 2002: 54).
6 A socially accepted minimum value can be considered for instance the daily minimum calories intake or minimum daily consumption. In this research this benchmark represents a value below which households are classified as living in poverty.

35
Vulnerability to Poverty means therefore the susceptibility of households to fall under a
benchmark level of consumption or nutrition intake caused by the interaction of a risky
event and the risk management strategies that may be available to households. While risky
events are usually the result of external and unmanageable circumstances at micro level,
intervening and increasing the risk management options of the households can affect the
outcome and potential downward mobility of a household. As Alwang et al. (2001: 2) note,
‘households are vulnerable to suffering an undesirable outcome, and this vulnerability
comes from exposure to risk’.
Box 2.1: Types of risk responses
Risky event Floods (Covariate) Death of main Income
earner (Idiosyncratic)
Strategies Formal Informal Formal Informal
Ex
ante
Risk
reduction
Construction of
dams/
embankments
by government
Raising
plinth of
house/
migration
Health
insurance to
access health
facilities
Sending
children to
work
Risk
mitigation
Crop insurances Diversificati
on of
income
generation
sources
Life
insurance
Extended
family;
marriage
Ex
post Risk coping
Income or cash
transfers and
community wide
cash for work
interventions
Reduction of
food intake
Credit
support for
income
generating
activities;
subsidies
Selling
assets
Source: adapted from Holzmann (2000)
2.4 Social protection, poverty entry and poverty exit
This section on risk and vulnerability to poverty, introduces the discussion on the role of
social protection in addressing these issues. Box 2.2 provides some definitions and
concepts on poverty that will be useful in the next section.

36
Box 2.2 Meanings of poverty
Poverty Dynamics
Households can find themselves in poverty (below an acceptable benchmark) for short
or long period of time
Chronic Poverty Transitory poverty
Chronic poverty refers to ‘households
living below a benchmark level of welfare
for a long period of time, -many years, an
entire life, or even across generations’
(CPRC, 2008: 5)
Transitory (transient) poverty refers to
‘households which experience short term
mobility below benchmark level’ (CPRC,
2008: 133).
Poverty and Causes
Poverty can be caused by one event or a structural lack of access to assets, low
productivity
Stochastic Poverty Structural Poverty
Stochastic poverty refers to households
which fall below a benchmark level of
welfare because of the materialization of a
risk (e.g. death of income earner) and the
‘failure to find protection against stochastic
elements in the economic environment’
(Morduch, 1994: 221). Households over
time can experience temporary mobility
(transitory) below the benchmark level or
remain persistently below it (chronic).
Households live in poverty (transitory or
chronic) as a consequence of endogenous
low productivity,’ weak institutions and
bad policies, ....dysfunctional markets,
radical liberalization’ (Devereux, 2002:
673) as well as social exclusion and
discrimination (CPRC, 2008: 5)
Source: Author’s compilation
From the risk chain lens, social protection measures do not deal with the risky event (Risk)
per se but with the risk responses, the strategies individuals and households adopt to
reduce, mitigate and cope with risks through, for instance, pensions, or weather related
insurances (risk mitigation), or public works and cash for work programs in the aftermath
of a natural disaster (risk coping options).
A household, if exposed to a risk, for example an incoming cyclone, or if experiencing a
shock is obliged to respond and adopt strategies to deal with the potential and actual losses.
Some of these risk management strategies might be detrimental to the household’s
wellbeing and might push the household under a minimum socially acceptable benchmark
level of welfare (poverty).
The responses vary from households to households and are mediated by its endogenous
characteristics and other exogenous factors, such as number of active family members,
37
asset ownership, and social networks. Examples of households’ responses to risks and
shocks are very well documented and can lead to selling assets, taking children out of
school, reducing the quantity and quality of food intake and pushing children into child
labour. Morduch (1994: 221) equates this situation to ‘stochastic poverty’ – a situation
where households might fall into poverty because of the realization of a risk and the lack of
appropriate risk management options. Social protection and stochastic poverty are clearly
interlinked. Social protection measures do not deal with the risky event per se but with the
risk responses, the ex-ante and ex post strategies individuals and households adopt to
smooth consumption and avoid irreversible or temporary falls below an acceptable
benchmark. Examples here include pensions, or weather related insurances (risk
mitigation), or public works and cash for work programs in the aftermath of a natural
disaster (risk coping options). The lack of appropriate risk management options ‘may be
intrinsically detrimental to the poor, and, one could also consider a measure of lack of
access to consumption-smoothing mechanisms just as deprivations in health and nutrition
may be considered as part of an expanded poverty concept’ (Morduch, 1994: 224).
Figure 2.2 summarises these processes (Ragno, 2014). Assume that a household starts off
with a predefined level of welfare, above an acceptable minimum benchmark. The literature
on stochastic poverty suggests that the realization of a risk (shock), such as the death of an
income earner, can lead a household toward a downward trajectory (X) below a benchmark
(such as a consumption poverty line).
Such mobility may occur because of the household’s lack of appropriate risk management
instruments. From the new welfare level, the household can further fall below the
benchmark, as shown in the trajectory D, maintain the same level of welfare trajectory C or
improve, trajectory A and B. It is well accepted that social protection measures do have a
role in avoiding a trajectory X, or, in case the household finds itself already below a
benchmark, avoid trajectory D. The direct contribution of social protection is therefore
reducing poverty by ‘preventing entries’ (CPRC, 2008) by diminishing the number of
household falling into stochastic poverty.

38
Note for Figure 2.2: the figure offers a visual representation of the role of social protection in poverty entries
and poverty exits. Social protection can contribute to avoiding people falling into poverty, below a socially
accepted benchmark (trajectory X) or to fall deeper into poverty (trajectory D) for families that are already
poor (trajectory Y). Social protection may also play a role in supporting households to exit poverty, above a
socially accepted benchmark (trajectory A and B).
Instead, what role social protection instruments play in poverty exits trajectory A or B, in
supporting the household -coming from trajectory X or households which have been living
below a benchmark level for a long period of time as represented in trajectory Y- is very
controversial and conceptualized differently in the literature.
Devereux (2002), while presenting findings from three Southern Africa countries, suggests
that even if often unintended, social protection measures promote exit from poverty by
triggering ‘asset creation (by the project) and investment behaviour (by project beneficiaries
or participants)’ (Devereux, 2002: 662). Social protection, by addressing and managing
uninsured risks can support upward trajectories (A and B) by promoting more
entrepreneurial decisions (Binswanger, 1980; Binswanger and Rosenzweig, 1989), as well as
‘encouraging moderate risk taking behaviour by smoothing income stream against adverse
entrepreneurial outcomes’ (Devereux, 2002: 665; see also Morduch, 1995; Morduch, 1999;
Morduch, 2000).
There is evidence on how social protection measures may promote poverty exits, although
not very systematically discussed in the literature. Barrientos (2008; 2011) has attempted to
Figure 2.2: Social protection and poverty (source: the Author)
39
address this by developing a basic framework on how social protection, and in particular
social transfers may contribute to micro level growth and promote exits in households
living in poverty. Findings from evaluations and studies in several countries suggest that
social protection instruments can contribute to positive growth outcomes in relation to
accumulation and protection of assets, supply of labour, and several types of local economy
effects (Barrientos, 2012). I discuss these in some detail below.
Asset accumulation and protection. Gertler et al. (2006) provide evidence that beneficiaries of
the Oportunidades program in Mexico, apart from increasing consumption, have been able to
generate additional income by increasing their investments and participation in farm assets,
agricultural activities and micro-enterprises. Accumulation of human capital (e.g. education
and health) has also been documented in programs not directly targeting human capital
accumulation, such as social pension schemes in Brazil and South Africa. In addition,
evidence from Nicaragua’s Red de Proteccion Social (Maluccio, 2005) and Ethiopia’s
Productive Safety Net Program, suggest that beneficiaries of these programmes were better
capable to protect their assets. In Nicaragua, beneficiaries were able to protect their
productive asset and human capital better than the non-beneficiaries during a sudden drop
of coffee prices. Similarly in Ethiopia, households targeted by the Productive Safety Net
program were more likely to successfully protect their income generating activities in the
2008 food crisis (Sabates-Wheeler and Devereux, 2010).
Supply of Labour. The review of evidence of the effects of social protection on labour,
suggests that labour supply of children and elderly decreases and is compensated by
reallocation of labour supply among the working age members of the households
(Barrientos, 2012; Barrientos and Scott, 2008). Samson (2009), in his review of the linkages
between employment and social transfers, argues against the belief that the social transfer
tend to undermine prospects for labour supply. He discusses several studies which suggest
that social transfers may have positive impacts in labour supply by providing additional
resources for funding job search, by increasing labour market participation and by
contributing to building human capital, which is essential for long term employment
opportunities.
Local economy effects. Local economy impacts are instead well documented. For instance, cash
for work programs, while transferring cash to the workers, build community
infrastructures, like roads or embankments which have a direct impact on markets, by
facilitating the movements of goods, transportation services and so forth. Social transfers
particularly can also have a direct impact of increasing the demand for goods and services
40
such as food, productive assets, transportation and labour. Finally, evidence exists that even
the non-beneficiary households of areas where a program is being implemented, benefit by
an increased number of loans and gifts from the beneficiary households as well as by
‘demonstration effects’ in production techniques, schooling and health services utilization
(Barrientos and Sabatés-Wheeler, 2010; Barrientos, 2012; Barrientos, 2011).
Findings and evidence are widely available to demonstrate that social protection
instruments can contribute to positive growth outcomes. The key question here is: how
can social protection interventions contribute in triggering these productive outcomes?
What is the process that leads households to achieve such productive outcomes?
Social protection instruments provide additional and predictable liquidity as well as
insurance features to households; this contributes in lifting restrictions on the productive
capacity that households living in poverty face. By lifting these barriers and unlocking the
productive capacities of the households, social protection opens up new prospects and
opportunities: some examples of new prospects are the participation in savings scheme,
securing of credit, improving consumption, as well as improving households resource
allocations towards higher return investments in the short, medium and long term (e.g.
children’s education)(Barrientos, 2012).
However, it is important to highlight that the lifting of, for instance, liquidity barriers per se
does not guarantee the participation of households in savings scheme, to securing of credit,
and more in general, to higher return investments. The household in fact still needs to
choose and decide upon the seizing of these new prospects that social protection has made
available. Therefore the questions here are: will the beneficiary households grasp all the
opportunities brought by the access to social protection instruments? Will households
respond by seizing the new prospects and choosing to invest more (higher return and
riskier decisions) such as starting savings or taking productive loans?
The answers to these questions are key to this research and will be dealt with in Chapter
Three where I frame the SRM and its ‘risk taking’/investment component into a broader
paradigm shift in social policy and examine it through a multidisciplinary, rather than purely
economics lens.
41
2.5 The socio-economic context of Bangladesh: an overview7
This section discusses the socio-economic context of Bangladesh, focusing particularly on
the country’s poverty reduction records and the role of social protection in attaining such
outcomes. The section also introduces the specific case study that is being investigated in
this research, the OAA Programme, and the Municipality of Narayanganj, where the field
work for the study was undertaken.
2.5.1 Bangladesh: a success story in poverty reduction?
Bangladesh’s recent achievements stand in marked contrast to its negative external image
(Lewis 2011). While it remains widely perceived as a ‘basket case’ – wracked by floods and
cyclones, mired in poverty and hunger, corrupt and unstable – it has experienced more
than six percent economic growth per annum for 15 years. Extreme poverty (i.e. people
living below the lower poverty line) has declined from 41 percent to 17 percent from 1991
to 20108; life expectancy at birth is now almost 67 years; and, the country will achieve many
of the Millennium Development Goals. It is a moderate Islamic country which has
experienced three peaceful changes of government since its return to constitutional
democracy in 1990. Surprisingly, given the challenges women still face in Bangladesh, it is
one of the few low-income countries to make good progress in reducing maternal
mortality, and girls’ enrolment in high school now matches that of boys (GED, 2011). The
country does face enormous environmental, political, economic and social challenges but
given its starting point in 19719 her recent socio-economic performance is worth noting.
Bangladesh has been a success story in the fight against poverty (Rahman et al., 2014). This
mirrors the extensive and sometimes innovative efforts of the national government, donor
agencies and NGOs, as well as civil society, in addressing poverty and promoting pro-poor
growth. Notwithstanding these impressive changes the country has experienced, some
words of cautions on these figures are needed. As suggested by Mitlin (2005) ‘dependence
on money-metric methods that fail to take account of differences in price levels and
7 The following sections, from 2.5.1 to 2.5.4, are based on the book Chapter ‘Consolidating nets and promoting graduation ladders in Bangladesh: from social safety net programmes to a national social protection system’ in Social Protection in Bangladesh: Building Effective Social Safety Nets and Ladders out of Poverty (Ed. H. Z. Rahman D. Hulme, M. Maitrot, L.P. Ragno), which I co-authored with the editors. 8 Official data of the Bangladesh Bureau of Statistics, Household Income and Expenditure survey (HIES), 1991/2 and 2010 9 This was a period when Bangladesh was characterized by civil war and famine, pervasive poverty and deprivation, and total dependence on foreign aid, among others.

42
different degrees of commodification may be underestimating the scale, depth and duration
of urban poverty’ (Mitlin, 2005b: 14). Aggregate poverty data and mono-metric
measurements, based solely on consumption measurements, do not always present a full
picture of the reality: ‘the vulnerabilities of the urban poor are not only income related....
The nexus of spatial and economic disadvantage faced by the urban poor includes adverse
access to basic services and tenure security’ (Boonyabancha and Mitlin, 2012: 405)
As strongly pointed out in the existing literature on chronic poverty (CPRC, 2008; Mitlin,
2005b; Mitlin, 2005a; Mitlin et al., 2005), poverty trends do not often grasp the households’
poverty dynamics over time. Longitudinal dataset presented by the CPRC (2008: 141)
estimates that between 20 and 30 percent of households in Bangladesh are chronically
poor, economically and politically marginalized and deprived of their basic entitlements. In
addition, as Banks et al. suggest (2011) ‘official poverty lines are widely recognized as being
unrealistic’ for urban poverty and underestimate its ‘growing magnitude’ (:489).
Over the last few years, several studies have been published in an attempt to identify key
issues in understanding urban poverty and proposing policy initiatives for addressing it in
Bangladesh (Hossain, 2005; Hossain, 2008; Hussain et al., 1999; Pryer, 2003; Pryer, 2004;
Salway, 1998; Salway et al., 2003; Alam et al., 2011b). These studies tend to highlight the
multidimensional features of urban poverty in the country. Hossain (2005) suggests that
households living in poverty are characterized not just by their inability to accumulate asset
but also by lacking alternative choices in relation to coping strategies. The strategies often
adopted by the poor enable them remain on a survival line but not in improving their long
term security.
Households living in poverty are vulnerable mostly in relation to their assets, having
minimal access to political and social structures, to basic services and decent work
opportunities. Because of their low education and training skills, the urban poor is often
involved in the informal job market (notably as rickshaw pullers, street vendors) increasing
the risk of harassment (Hossain, 2005). Furthermore, it is estimated that in poor
households, around 20 percent of children (between the age of five and 14) are engaged in
labour (Hossain, 2005; Pryer, 2003).
43
Unsecure land is also suggested to be a major contributor to poverty: the permanent threat
of eviction as well as the mastaan10 induced violence creates an environment which favours
short-term strategies to long term security. Unsolved land tenure and ownership issues also
reinforce the already weak access to services such as sanitation and water, health and
education. Numerous urban poverty reduction programs have historically not prioritized
the provision of basic infrastructure in these poorer areas (Hossain, 2005)
Urban poverty in Bangladesh manifests itself in various ways, including insecure land
tenure, the prevalence of child labour in urban areas, informal, low-paid and mediated job
market, poor health (Akbar et al., 2007; Brooks et al., 2005; Hoque and Selwyn, 1996;
Izutsu et al., 2006; Mullick and Goodman, 2005; Papreen et al., 2000a,; Papreen et al.,
2000b; Rashid, 2006a; Rashid, 2006b; Rashid, 2007a; Rashid, 2007b; Salam et al., 2006;
Uzma and Underwood, 1999), high exposure to violence, lack of long term asset
accumulation options, poor access to basic services, invisibility and lack of structures to
channel people’s voices (Banks, 2008; Banks et al., 2011). Importantly, these factors cannot
be sufficiently understood or quantified via mono-metric poverty measurements.
2.5.2 Social protection and poverty reduction in Bangladesh
Explanations of ‘why’ Bangladesh is succeeding in tackling poverty centre on various
factors, with economic growth usually highlighted as crucial (ADB, 2004; Mujeri K, 2000).
Since 1990, Bangladesh has enjoyed relative macro-economic stability, attributed largely to
effective public policy. Bangladeshi entrepreneurs and foreign investors have created a
readymade garment industry in the country (Rock, 2001; Mottaleb and Sonobe, 2011) that
is now second only to China and massively expanded other exports (such as jute and
leather manufactures, shrimp and fish). Alongside this, some eight million Bangladeshi’s are
working overseas (especially in the Gulf) and remitted US$ 12.84 billion in the fiscal year
2011-1211, about 10 percent of the GDP (Alam et al., 2011a; Alam et al., 2011b; Raihan et
al., 2009).
Another major factor is the rapid decline of fertility rates across all socio-economic strata
throughout the 1980s and 1990s. The drastic slowdown in population growth, caused by
remarkable efforts and investments by successive governments in the provision and
expansion of basic social services such as education, health and immunization, water and
10 Self-appointed leaders who rule in poor urban settlement through violence and threat of violence they also are usually supported and linked with local and national political figures, official and police
11 Bangladesh Central Bank: http://www.bangladesh-bank.org/econdata/wageremitance.php?txtPeriod=1# (accessed on 26 October 2012)

44
sanitation, has contributed in easing the pressure on one of the most densely populated and
land-scarce countries in the world (World-Bank, 1994b; Kabeer, 2001). In addition, the
‘green revolution’ in agriculture, which included the introduction of new varieties of rice as
well as of irrigation and fertilizers, contributed significantly increasing food production for
its citizens (Hossain, 2003).
The decline of poverty in Bangladesh is also often attributed to the role of NGOs, ‘the
most sophisticated national development networks in the world’ (Devine, 2003: 229).
While the country’s much lauded NGOs and microfinance industry have to some extent
contributed to addressing poverty, the role of NGOs in Bangladesh is mostly recognized in
terms of their contribution to women’s empowerment and health, education through
private schools, immunization and disaster relief and management (Westergaard, 1994;
Holloway, 1998; Ahmad, 1999).
Relatively neglected amongst explanations of Bangladesh’s recent progress in reducing
poverty is the contribution of the country’s social protection programmes or social safety
nets (SSNs) as they are locally known. Social protection in Bangladesh has a long history,
and has been promoted and expanded by governments across the political spectrum. The
significance of social protection to combating poverty has been increasingly recognized in
the literature (Barrientos, 2011; Barrientos and Hulme, 2005). In Bangladesh the role that
social protection has played is however little understood and the country’s contribution to
international social protection innovations has not been sufficiently recognized and
documented (Baulch, 2011; Hossain, 2010; Ahmed et al., 2010; Krishna et al., 2012; Raza et
al., 2012).
There is no consensus on the number of social protection programmes in Bangladesh and
on the exact financial resources allocated. The Sixth Five Year Plan (SFYP) of the
Government of Bangladesh identified 82 programmes being delivered by around 20
different ministries, though others have suggested a much lower number of interventions
that can be classified as social protection schemes (Ahmed et al., 2006; Ahmed, 2006;
World-Bank, 2006).
Social protection programmes in Bangladesh promote human development – reducing
hunger, permitting access to basic health services for the vulnerable, getting girls and boys
into school, providing security to the aged and disabled – and they also contribute to
economic development through employment, skill training, encouraging micro-enterprise
and risk-taking, household level asset accumulation and local infrastructural development.
45
These programmes evolved out of the country’s early food and emergency relief schemes
of the 1970s. In the 1980s and 1990s, these were institutionalized into an effective disaster
management system to reduce the vulnerability of the millions of Bangladeshis regularly
displaced by floods and major cyclones. In more recent decades the objectives and scale of
social protection programmes have been extended through domestic and donor initiatives
that include old age pensions, female stipends for secondary school, cash for work, asset
transfer schemes and many others.
What is very significant about the Bangladeshi case is that given the vast nature of poverty
and low per capita income, the corresponding size of vulnerable population in Bangladesh
at risk of falling into or deeper into poverty is very large (Rayhan, 2010). Ahmed (2009)
estimates that half of surveyed non poor households affected by shocks in the period 1997-
2007 fell into poverty. The most frequently reported shocks for households are of an
idiosyncratic nature in the form of illness (medical expenses and /or forgone income),
dowry and wedding related expenses. Illness shocks accounted for 22 percent of reported
shocks with expenses related to illness perceived as more detrimental to household welfare
than income losses. Community wide covariate shocks, due to floods, cyclones and tidal
upsurge, have also been identified as a major cause of vulnerability in Bangladesh. Such
shocks often compel the vulnerable to cope with immediate needs, in the absence of any
other viable alternative, by selling household effects, productive assets, accumulating high
interest loans and removing children from school – all of which adversely affect their long-
term economic potential (Ahmed, 2009). In addition, seasonal poverty stemming from
seasonality in agriculture affects large areas in the north-west of Bangladesh which are
subjected to monga12 (Zaman, 2011; Ahamad et al., 2012). The repeated incidence of monga,
has been the cause of chronic poverty across north-west Bangladesh. An estimated five
million people live in the monga prone districts of Rangpur, Gaibandha, Kurigram,
Lalmonirhat and Nilphamari where agriculture is the mainstay of local economies.
Ahmed (2009) also highlights the hardship caused by other covariate shocks such as rapidly
rising price inflation of essentials. For example, during the period 2007-2008, the retail
price of rice in Bangladesh increased by around 39 percent in rural areas and 37 percent in
urban areas. This is noted to have been the results of supply shocks arising from floods,
cyclones and disruption of the import of food grain from external sources due to an
12 A near crisis form of deprivation for a large segment of the affected population during the lean agricultural season in October and November causing great hardship: see KHANDKER, S. R. 2012. Seasonality of income and poverty in Bangladesh. Journal of Development Economics, 97, 244-256.
46
upward international price spiral, among others. This price hike had a substantial welfare
impact since rice accounts for a significant proportion of household expenditure, especially
for poorer households.
While the above taxonomy of vulnerability and risks largely reflects the ground reality in
Bangladesh, there is also a distinctive transition that is changing risk profiles in the country.
This is being driven by the changing structure of the country's economy, whereby h a large
segment of the population has increasingly moved from rural to urban areas in search of
livelihood opportunities. This exposes migrants to various forms of transient and long-
term risks associated with globalization as well as emerging environmental challenges and
concerns (Banks et al., 2011; Rana, 2011; Hossain, 2008). These new risks will shape the
need for safety net programmes in Bangladesh in a fundamental way with growing demand
from an increasing number of new urban migrants needing social protection. Rapid
urbanization and the alarming increase in the number of slum13 dwellers poses new
challenges for the design of safety nets to deal with new types of vulnerability.
2.5.3 The changing dynamics of social protection programmes in Bangladesh
To a certain extent, this transition and changes in the poverty, vulnerability and risk profile
of people in Bangladesh, have been reflected in how social protection has evolved.
Historically, public social safety net efforts in Bangladesh have clustered around the twin
themes of food rations and post-disaster relief. The third cluster has been informal safety
nets at family and community levels aimed at addressing environmental, economic and
social shocks. Over time, however, safety nets have shifted from being a humanitarian issue
to becoming a mainstream developmental concern.
This process of change was driven by several factors, including the recognition across the
country’s political parties of the welfare responsibilities of a newly independent and
democratic state towards its citizens; the erosion of informal safety nets due to the
weakening of the extended family system; and, the increasing realization that safety nets are
crucial to a sustainable anti-poverty strategy and inclusive growth
13 As Boonyabancha and Mitlin (2012) suggest, the term ‘slum’ has often a negative connotation, nevertheless it is difficult to avoid using it. In this study, ‘slum’ refers to ‘settlements characterized by at least some of the following features: a lack of formal recognition on the part of local government of the settlement and its residents; the absence of secure tenure for residents; inadequacies in provision for infrastructure and services; overcrowded and sub-standard dwellings; and location on land less than suitable for occupation’ (Boonyabancha and Mitlin, 2012:405)
47
Bangladesh has witnessed a proliferation of safety net programmes, in part because the
introduction of many new social safety programmes by governments and development
partners is rarely accompanied by a corresponding closure of old programmes. The
historical focus of safety net concerns on food rations and post disaster relief underwent its
first major change in the wake of the 1974 famine. The concern to avoid such disastrous
outcomes unleashed new programmatic initiatives mainly by the state and development
partners. Food- for- work (FFW) programmes, which until then had been a small
component within the integrated rural development Comilla model, were vastly scaled-up
and focused on redressing seasonal poverty.
The funding for these programmes came almost entirely from aid donors. Many NGOs
were established and the Grameen micro-credit model was created and copied by hundreds
of organizations. The next turning point came towards the end of the 1980s when urban
and rural food rationing were phased out as its efficacy as an anti-poverty programme had
been increasingly questioned. The consecutive floods of 1987 and 1988, galvanised concern
to broaden the focus of FFW type programmes to issues of large-scale infrastructural
development beyond the narrow goal of redressing seasonal poverty. Two noteworthy
innovations which resulted were food-based programmes utilizing women's employment
towards aimed at enhancing the maintenance of existing infrastructure (especially roads and
drains) and forestry.
During the 1990s, several developments in social protection occurred and three entirely
new safety net innovations were initiated. First, conditional cash transfers (CCTs) focusing
on girl’s primary and secondary education were started in the early 1990s adding new goals
of human development and social empowerment to traditional safety net concerns.
Secondly, cash allowances programmes in the late 1990s were expanded to cover clients
traditionally served by family-based informal safety nets - the elderly, widows and
abandoned women. Thirdly, a post-disaster food security programme, the Vulnerable
Group Feeding Programme (VGF), was institutionalized and has since become a mainstay
of the country’s social protection portfolio.
The first decade of the twenty-first century (2000-2010) also saw an upsurge in the
introduction of social protection programmes in Bangladesh. Notably, this period
witnessed a paradigm shift from beyond the goal of enhancing basic security and protecting
households from falling into poverty to supporting poorer households’ exit out of income
poverty as well as developing their human capital. Various new programmes initiated
towards the attainment of this more ambitious goal included the Rural Employment
48
Opportunities for Public Assets (REOPA), Targeting the Ultra Poor (TUP), Vulnerable
Group Development for Ultra-Poor (VGD-UP), and the Rural Employment & Road
Maintenance Programme (RERMP).
Moreover, social protection interventions have increased their focus on geographical
poverty pockets at risk of hazardous events, notably in the monga region in the north-west
and north, and more recently the flood-prone coastal belts in the south. In addition, there
is now a major focus on employment generation. The Hundred Day Employment
Programme (HDEP) – copied from India launched in 2008 provides a noteworthy example
of this focus. Finally, there is now a widespread recognition by policymakers, development
partners and researchers that the country’s many safety net and graduation programmes
need to be rationalised as a National Social Protection Strategy, or perhaps as an initial step
in the establishment of a National Social Protection System in an emerging economy.
Creating such a strategy faces many challenges, however, in part because of the desire of
bureaucrats to hang on to programme budgets and the interest of government ministers in
having access to safety net programmes under their ministries in order to enhance their
access to patronage resources;
The multiplicity of stakeholders in social protection has permitted innovation but has left
the country with a fragmented implementation strategy lacking a strategic vision. The 2004
Poverty Reduction Strategy Paper (PRSP), as well as more recent budget documents,
attempted to create a rudimentary analytical structure by listing programmes under the two
categories of ‘social protection’ and ‘social empowerment’. The categories in these various
policy documents however incorporate a number of programmes whose inclusion poses
conceptual problems. For example, micro-credit programmes are included under social
empowerment but it is questionable whether it makes sense to list these within the safety
net portfolio. Things are also complicated by the fact that several ‘tax financed’
programmes are actually co-funded by development partners and implemented by NGOs.
The reminder of this chapter adopts a fourfold classification for safety nets14 used during
the 2010 budget speech by the Finance Minister15: i) allowances ii) employment generation
14 The sequence was however altered to reflect another emerging priority in the debate on social protection, graduation. Graduation refers to building ladders out of poverty within a programme design so that a safety net (protection) and an income generation/employment ladder (promotion) are combined.
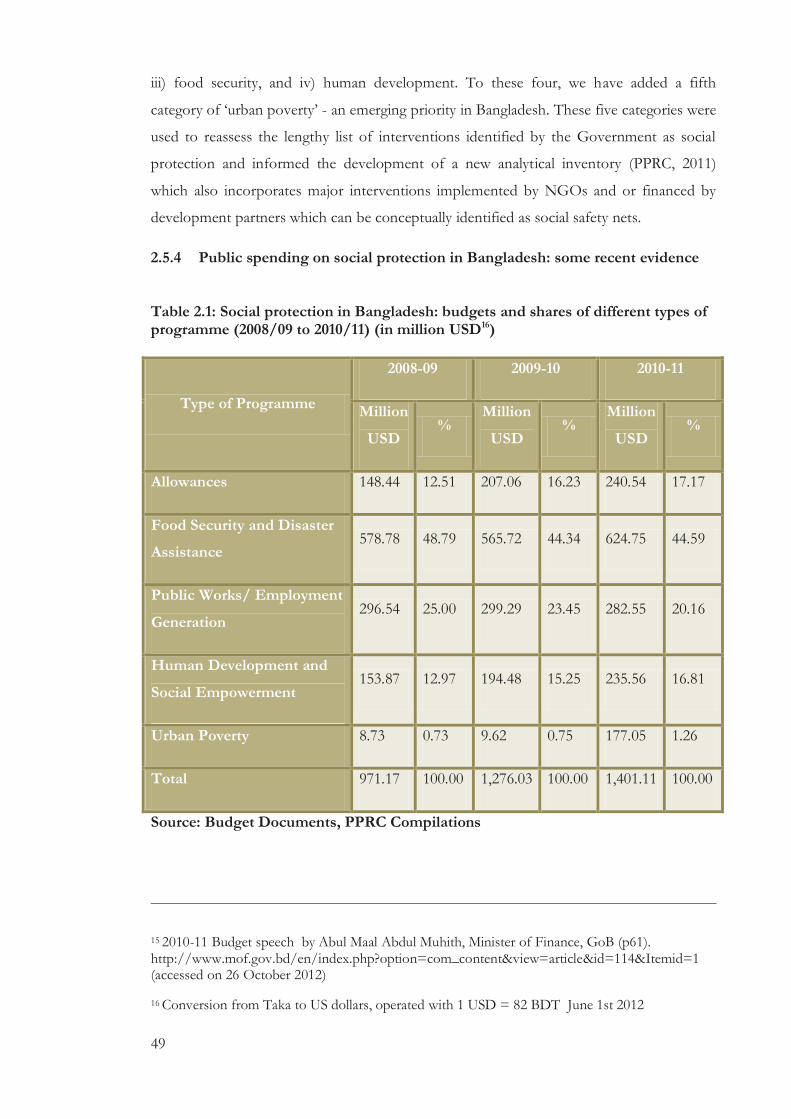
49
iii) food security, and iv) human development. To these four, we have added a fifth
category of ‘urban poverty’ - an emerging priority in Bangladesh. These five categories were
used to reassess the lengthy list of interventions identified by the Government as social
protection and informed the development of a new analytical inventory (PPRC, 2011)
which also incorporates major interventions implemented by NGOs and or financed by
development partners which can be conceptually identified as social safety nets.
2.5.4 Public spending on social protection in Bangladesh: some recent evidence
Table 2.1: Social protection in Bangladesh: budgets and shares of different types of programme (2008/09 to 2010/11) (in million USD16)
Type of Programme
2008-09 2009-10 2010-11
Million
USD %
Million
USD %
Million
USD %
Allowances 148.44 12.51 207.06 16.23 240.54 17.17
Food Security and Disaster
Assistance 578.78 48.79 565.72 44.34 624.75 44.59
Public Works/ Employment
Generation 296.54 25.00 299.29 23.45 282.55 20.16
Human Development and
Social Empowerment 153.87 12.97 194.48 15.25 235.56 16.81
Urban Poverty 8.73 0.73 9.62 0.75 177.05 1.26
Total 971.17 100.00 1,276.03 100.00 1,401.11 100.00
Source: Budget Documents, PPRC Compilations
15 2010-11 Budget speech by Abul Maal Abdul Muhith, Minister of Finance, GoB (p61). http://www.mof.gov.bd/en/index.php?option=com_content&view=article&id=114&Itemid=1 (accessed on 26 October 2012)
16 Conversion from Taka to US dollars, operated with 1 USD = 82 BDT June 1st 2012
50
This categorization provides important insights into the evolution of social protection
interventions. Though it continues to receive the highest share of resources, the relative
share of the food security and the disaster assistance component have declined from
around 49 percent in 2008-09 to 45 percent in 2010-11 (Table 2.1). In contrast, the Public
Works/Employment Generation component has declined both in absolute terms (from
296.543 million USD to 282.547 million USD) as well as in relative terms (from 25 percent
to 20 percent). Both ‘Allowance’ and ‘Human Development and Social Empowerment’
components show marked increases. Allowance allocations rose from 12.5 percent in 2008-
09 to 17 percent in 2010-11 while Human Development & Social Empowerment
allocations rose from around 13 percent to 17 percent over the same period. Allocations
for social protection in urban areas have risen but they remain miniscule17 (Table 2.2).
Within these five categories, the bulk of the financial allocation is concentrated to a limited
number of major programmes (28 programmes in 2008-2009, and 30 programmes during
2010-2011).
17 The Urban Partnerships for Poverty Reduction (UPPR) project implemented by UNDP/GOB
with DFID support is the major programme thrust on urban poverty. Built on the 2002-2007
UNDP-funded Local Partnerships for Urban Poverty Alleviation Project (LPUPAP), the 2008-2015
UPPR project is a multi-component project focused on physical infrastructure and services, socio-
economic development, capacity building and policy advocacy with a total budget of USD 120
million. After review of its primary programme orientation, we have decided not to include this
project in the inventory of safety net projects.

51
Table 2.2: Selected social protection programmes in Bangladesh 2008-2011
Types of Programme
2008-09 2009-10 2010-11
No.
Allocation
(Million
USD)
No.
Allocation
(Million USD)
No.
Allocation
(Million USD)
Allowances (A)
Major Programmes
6 139.106 6 193.376 6 221.841
Minor Programmes
7 9.33301 8 13.7552 8 18.7002
Total 13 148.439 14 207.132 14 240.541
Food Security and Disaster Assistance (B)
Major Programmes
10 561.139 11 549.333 11 613.350
Minor Programmes
4 17.6423 4 16.4207 4 11.3975
Total 14 578.781 15 565.754 15 624.747
Public Works/Employment Generation (C)
Major Programmes
5 295.372 6 297.891 6 278.854
Minor Programmes
1 1.20464 2 1.46610 4 3.72755
Total 6 296.577 8 299.357 10 282.582
Human Development & Social Empowerment (D)
Major Programmes
6 153.366 6 191.366 6 229.618
Minor Programmes
1 0.488550
4 3.17924 4 5.89313
Total 7 153.854 10 194.545 10 235.511
Urban Poverty (E)
Major Programmes
1 5.67939 1 6.35115 1 5.55725
Minor Programmes
1 3.05344 2 3.26718 2 12.1441
Total 2 8.73282 3 9.61832 3 17.7014
All (A+B+C+D+E)
Major Programmes
28 1,154.44
30 1,238.09 30 1,348.98
Minor Programmes
14 31.7166 20 37.7160 22 51.8559
Total 42 1,186.16
50 1,275.81 52 1,401
Source: Budget documents, PPRC Compilations
Note: Programmes with allocation in excess of Taka 50 crores (USD six million) in 2009-10 are defined as
major programmes and those below 50 crores as minor programmes.

52
Out of the 30 major programmes, which account for nearly 97 percent of total social
protection expenditure, five are NGO programmes drawing on donor resources18, while
seven are specifically female-focused programmes19. The top 10 programmes (Table 2.3),
accounting for more than 80 percent of total SSN allocations for 2010-11 are Old Age,
Insolvent Freedom Fighters, Vulnerable Groups Development, Employment Guarantee
Programme for the Poor and the Primary School Stipend. Below we describe key features
of the main programmes.
18 These include SOUHARDO, SHIREE, TUP, VGD-UP, CLP 19 These include Widow/Destitute Women Allowance programme, VGD, RERMP, REOPA, Secondary Stipend programme, VGD-UP, Maternal Health Voucher schemes

53
Table 2.3: Largest social protection programmes in Bangladesh (2010/11)
Programmes Type Allocation
(Million USD)
% of Total SP
Budget (1,401
million USD)
1 Vulnerable group feeding B 187.3 13.4%
2 Open Market sale B 145.2 10.4%
3 100 Days/Emp Gen for the poor C 122.0 8.7%
4 Food for work C 121.2 8.7%
5 Test Relief B 116.3 8.3%
6 Old Age allowance A 108.7 7.8%
7 Stipend for Primary Students D 91.5 6.5%
8 Secondary Education Stipend Project D 82.6 5.9%
9 Vulnerable Group development
(VGD) B 77.8 5.6%
10 Honorarium for freedom Fighters A 43.9 3.1%
Tot 1,096.5 78.3%
Source: Budget documents, PPRC Compilations
In the category of allowances and unconditional transfers, three specially designed
programmes targeting vulnerable women are in operation. The 'allowances for the widowed,
deserted, and destitute women' distributes Tk.300 (3.66 USD) per person per month to
about 920,000 selected women residing in rural areas. The Government spent 27.4809
million USD on this programme during 2009-2010, an amount that increased to 43.9695
million USD in 2010-2011. Some 80,000 women are targeted under the ‘Fund for
Rehabilitation of Acid Burnt Women and the Physically Handicapped’ who receive medical
treatment and training. The Maternal Health Voucher scheme is a new addition to the list
of SSNs in Bangladesh. Under this scheme, pregnant mothers get free anti-natal care, costs
associated with safe delivery, one post-natal care consultation within six weeks of delivery,

54
services for obstetric complications, transport costs to the clinic, Tk. 500 (6 USD) for
referral to a district hospital, gift items to the mother costing Tk. 500 and Tk. 2,000 (24
USD) in cash. With financial support from DFID, World Bank, UNFPA and WHO the
scheme is now supporting some100,000 mothers.
One of the largest and oldest in the SSN portfolio of Bangladesh is the Vulnerable Group
Development (VGD) Programme. The VGD was introduced in 1975 to help women
affected during the Liberation War of Bangladesh in the early 1970s with food aid from the
World Food Programme (WFP). It has continued ever since and has also produced various
off-shoot programmes such as the Income Generation for Vulnerable Group
Development Program (IGVGD)(Matin and Hulme, 2003). The programme aims at
developing the economic skills of women through training, savings and providing scope for
accessing micro credit. Another important goal of the programme is to build social
awareness on disaster management and nutrition through training in groups. The
beneficiaries get 30 kilograms of wheat per month and about 150 hours of training over a
period of 24 months.
The Employment Guarantee Programme (formerly the Hundred Days Employment
Programme) is a recent addition to the portfolio. Introduced by the Caretaker Government
in 2008-09 with an initial allocation of 113 million USD, the main objective of the
Programme was to benefit 2,000,000 hard core poor each of whom received a Tk. 100 daily
wage (USD 1.22) for a 100-day cycle. This was inspired by India’s National Rural
Employment Guarantee Act (NREGA) with a ‘cash for work’ model selecting ultra poor
beneficiaries by utilizing WFP’s poverty maps of the country. The incoming Government
of Bangladesh (elected 2009) has retained the programme in a modified form with
provision for 60 days employment in the winter slack season and 40 days employment in
the summer slack season. The programme has been renamed Employment Guarantee
Programme for the Poorest (EGPP) and is being implemented with assistance from the
World Bank. Total allocation for the programme during 2010-11 is 122 million USD. The
daily wage rate has also been revised upwards to Tk.120 (USD 1.46).
The Female Secondary School Assistance Programme (FSSAP) is a cash transfer
conditioned on school attendance. It aims to increase female secondary enrolment,
promote female participation in the job market and discourage early marriage. In 2009-10,
nearly three million students were enrolled under the programme and the number has
increased to 3.6 million in the year 2010-11. The stipend rules require every recipient to
attend a minimum of 75 percent of school days and be unmarried. The stipend starts when
55
the girl enrols in the sixth grade and continues until the end of tenth grade subject to the
meeting of conditions stipulated for the programme. It varies from Tk.300 per month (3.66
USD) to Tk.720 per month (8.79 USD) based on the grade of study.
Bangladesh’s renowned NGOs also run some major interventions. BRAC's ‘Challenging
the Frontiers of Poverty Reduction: Targeting the Ultra Poor (CFPR-TUP)’ programme
started as an experiment in 2002. By 2012, it had covered 272,000 households in the
poorest districts, spending around USD 32 million per annum. It focuses on economic
development through assets transfer (cows, goats, poultry projects and others) to very poor
women but also includes a monthly subsistence allowance designed to reduce vulnerability
and promote entrepreneurship by ensuring a portion of a household basic needs.
2.5.5 Non-contributory pension scheme in Bangladesh: the Old Age Allowance
(OAA)
Having undertaken a general overview of the social protection portfolio of Bangladesh, this
research focuses specifically on the programme that is of interest for the present research,
namely the OAA. The OAA is a social pension scheme that was set up in 1998 as part of
an established political planning process which started in 1985. Both the 1985-1990 and
1990-1995 five-year plans recognized the need for addressing the needs of the elderly
(Gorman and Khan, 2005: 2). However, only in the five year plan of 1995-2000 was the
OAA actually introduced (Begum and Wesumperuma, 2012).
The OAA is a cash transfer scheme, initially designed as a rural intervention initiative,
targeting the 10 poorest elderly living in rural wards, (the lowest administrative unit in
Bangladesh), including at least five elderly women. This initial provision of selecting a fixed
number of beneficiaries in each ward was replaced in 2002 by new system that considered
the population size of the ward.
Through its network of social welfare officers, the Ministry of Social Welfare is the leading
government agency in the implementation of the scheme. At ministerial level, a committee
chaired by the Minister of Finance oversees the implementation of the scheme, including
budget allocation to it. The social welfare officers on the field provide support in the

56
operation and implementation of the OAA and liaison among the local union and ward20
committees and the central government.
The OAA has been expanded to urban areas officially since 2007. Coverage of this
programme has expanded significantly over the years (Table 2.4); from only 0.4 million
beneficiaries in 1998, the OAA was extended to reach some 1.3 million individuals in 2005,
and to 2.45 million in 201221. This represents approximately 30 percent of the elderly
population of Bangladesh above 65 years22.
The scheme is a cash transfer to selected eligible elderly of 30023 taka in 2009-10 a month
from an initial 100 taka in 1997-98 (Table 2.4).
The transfer is disbursed quarterly and, until 2012, through the government owned Sonali
Bank which offers an extensive presence in the country in both rural and urban centres. In
2012, a new mode of transferring the allowance was launched. The collection of the
allowance on a specific day from a bank has been replaced by setting up individual bank
accounts. This new approach aimed at improving the efficiency and effectiveness of the
transfer as well as limiting prospects for fraud. During discussions with social welfare
officers in the capital Dhaka and Narayanganj, information on the number of beneficiaries
that didn’t collect the allowance was rarely reported by the bank providing the service. In
addition, the update process in cases of the death of any beneficiary was also faulty and the
changes were not timely reported.
20 The ward is the lowest administrative unit in Bangladesh: in rural areas, one ward usually incorporates a number of villages. In the administrative hierarchy, on top of the ward, there is the union (which incorporates several wards), upazila (which incorporates several unions) and district (which incorporate several upazilas). Bangladesh has a total of 64 districts. In urban centres, a ward is instead a ’neighbourhood’ and has a formal administrative set up incorporated in the municipality’s local government, as stipulated in the 2008 Pourashava (Municipality) Ordinance of the Government of Bangladesh. 21 http://www.dss.gov.bd/index.php?option=com_content&view=article&id=59:old-age-allowances&catid=39:social-cash-transfer&Itemid=71 (accessed on 12/01/2014) 22 Begum, 2012, p. 198, Table 8.5 23 Conversion from Taka to US dollars, operated with 1 USD = 82 BDT June 1st 2012

57
Table 2.4: OAA in Bangladesh 1997-2012
Fiscal
Year
Total
Number of
OAA
Beneficiaries
–cumulative
(million)24
Monthly
OAA
cash
grant
(Taka)25
Dhaka city
wholesale
nominal
rice price
(Taka) per
kilo (retail
price not
available)25
Estimated
Dhaka retail
nominal rice
price (Taka)
per kilo
(wholesale
price plus 2.5
taka)26
Kilograms of rice
that can be
purchased with
the OAA
allowance
(estimated retail
price)27
1997-98 0.4 100 n/a n/a n/a
1998-99 0.4 100 n/a n/a n/a
1999-00 0.41 100 n/a n/a n/a
2000-01 0.41 100 n/a n/a n/a
2001-02 0.41 100 n/a n/a n/a
2002-03 0.5 125 n/a n/a n/a
2003-04 1 150 13.4 15.9 9.4
2004-05 1.31 165 15 17.5 9.4
2005-06 1.5 180 15.9 18.4 9.8
2006-07 1.6 200 16.1 18.6 10.8
2007-08 1.7 220 25.7 28.2 7.8
2008-09 2 250 24.5 27 9.3
2009-10 2.25 300 22.8 25.3 11.9
2010-11 2.475 300 30.9 33.4 9
2011-12 2.475 300 30.6 33.1 9
Source: Food Planning Monitoring Unit; Department of Social Welfare
24 http://www.dss.gov.bd/index.php?option=com_content&view=article&id=59:old-age-allowances&catid=39:social-cash-transfer&Itemid=71 (accessed 12/01/14) 25 Prices provided by the Food Planning and Monitoring Unit (FPMU), Ministry of Food and Disaster Management in Bangladesh 26 Retail price estimated based on data available in the National Food Policy Capacity Strengthening Programme ‘a website: http://www.nfpcsp.org/agridrupal/content/prices-coarse-rice-dhaka (accessed 12/07/2014) 27 The average per capita rice consumption in Bangladesh is approximately 160kg (http://oryza.com/content/bangladesh-fy-2012-13-rice-imports-down-94-27700-tons; accessed 12/07/2014 )
58
The OAA targets the oldest and poorest households in a ward which are not recipients of
other benefits or other major support from other organizations.
The selection of beneficiaries is a bottom-up process in which local level committees (ward
level) suggest to union level committees and social welfare representatives, potential
targeted elderly. The eligibility and selection is based on a wide range of factors, including
age (above 62 years for women and 65 for men28); income levels (below 3000 taka a
month); lack of ownership of assets; as well as health conditions. Priority is usually given
to freedom (independence) fighters, refugees and landless people (Gorman and Khan,
2005: 3-6). The eligibility and selection is based on local committee’s personal knowledge:
such system does not guarantee transparency and accountability. However, recent evidence
suggests that the eligibility criteria is considered largely appropriate, with most beneficiaries
(96 percent) as well as non-beneficiaries (78 percent) considering the selection as generally
fair and appropriate (BRAC, 2008). Once selected and enrolled in the program, the
beneficiary will receive the benefits for life. In case of death of a beneficiary, the ward
committee will identify a new beneficiary in the same area or community.
2.5.6 The Municipality of Narayanganj and the OAA
Narayanganj is a district in central Bangladesh (Appendix 4), part of the Dhaka Division
and 25 km from the capital of the country. The main urban centre (pourashava) in the
district is the municipality of Narayanganj. The municipality is officially recognised as
‘special’ pourashava with ‘special autonomy’ and has an unusual independence from the
central government when compared to the rest of the country’s municipalities. In 2013,
Narayanganj obtained the status of City Corporation, similar to few major cities in
Bangladesh, such as Dhaka, port city of Chittagong and the city of Khulna in the south.
Narayanganj has almost doubled its inhabitants over ten years, from 200,000 in 1999 to an
estimated 400, 000 people in 2009. Narayanganj is a major centre of business and industry
in Bangladesh29, and has a similar level of urbanization and poverty when compared to
other major urban centres in the country. The expansion of the garment sector and
industrialisation have also attracted people from all over Bangladesh and favoured the
28 The cut off age at the start of the program was 57 years. The minimum age was raised to 60 years in 2003/04, and to 65 years in 2004/05. In 2010/11 the minimum age for women was revisited and set at 62 years (Begum, 2012). 29 The country’s jute trade and garment industry is especially concentrated in Narayanganj.
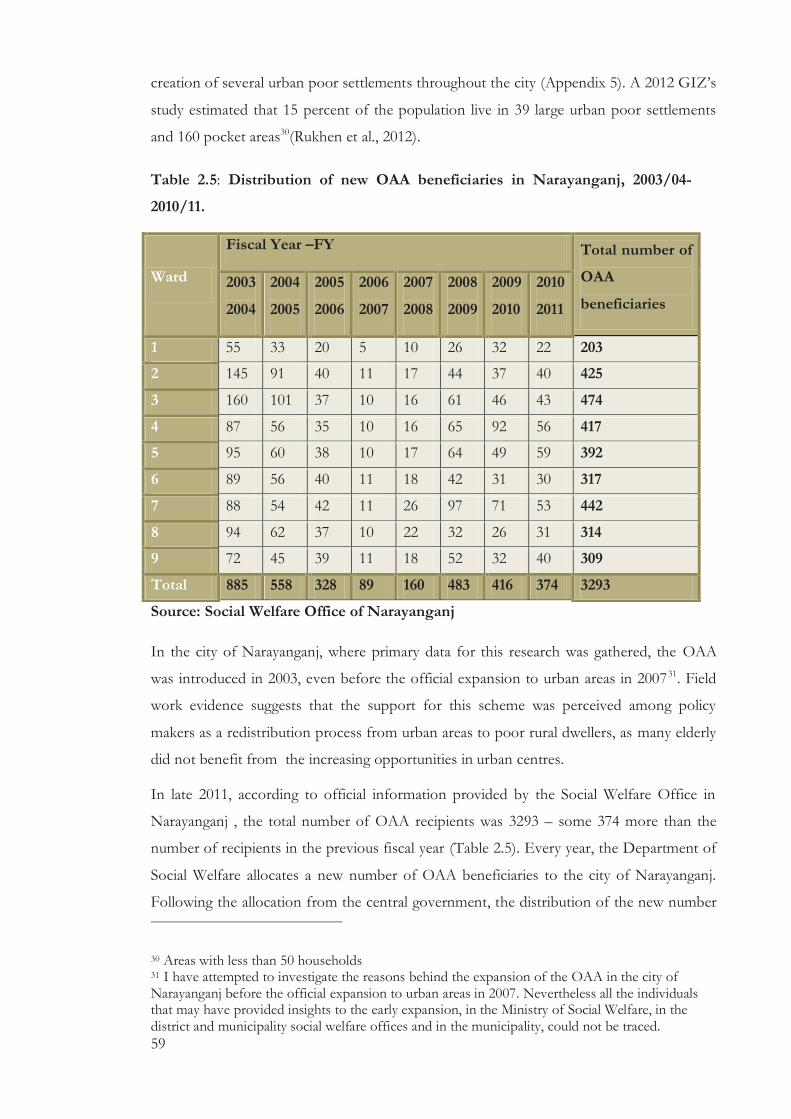
59
creation of several urban poor settlements throughout the city (Appendix 5). A 2012 GIZ’s
study estimated that 15 percent of the population live in 39 large urban poor settlements
and 160 pocket areas30(Rukhen et al., 2012).
Source: Social Welfare Office of Narayanganj
In the city of Narayanganj, where primary data for this research was gathered, the OAA
was introduced in 2003, even before the official expansion to urban areas in 200731. Field
work evidence suggests that the support for this scheme was perceived among policy
makers as a redistribution process from urban areas to poor rural dwellers, as many elderly
did not benefit from the increasing opportunities in urban centres.
In late 2011, according to official information provided by the Social Welfare Office in
Narayanganj , the total number of OAA recipients was 3293 – some 374 more than the
number of recipients in the previous fiscal year (Table 2.5). Every year, the Department of
Social Welfare allocates a new number of OAA beneficiaries to the city of Narayanganj.
Following the allocation from the central government, the distribution of the new number
30 Areas with less than 50 households 31 I have attempted to investigate the reasons behind the expansion of the OAA in the city of Narayanganj before the official expansion to urban areas in 2007. Nevertheless all the individuals that may have provided insights to the early expansion, in the Ministry of Social Welfare, in the district and municipality social welfare offices and in the municipality, could not be traced.
Table 2.5: Distribution of new OAA beneficiaries in Narayanganj, 2003/04-
2010/11.
Ward
Fiscal Year –FY Total number of
OAA
beneficiaries
2003
2004
2004
2005
2005
2006
2006
2007
2007
2008
2008
2009
2009
2010
2010
2011
1 55 33 20 5 10 26 32 22 203
2 145 91 40 11 17 44 37 40 425
3 160 101 37 10 16 61 46 43 474
4 87 56 35 10 16 65 92 56 417
5 95 60 38 10 17 64 49 59 392
6 89 56 40 11 18 42 31 30 317
7 88 54 42 11 26 97 71 53 442
8 94 62 37 10 22 32 26 31 314
9 72 45 39 11 18 52 32 40 309
Total 885 558 328 89 160 483 416 374 3293

60
of beneficiaries across the nine wards of Narayanganj is determined in a municipal
committee with municipal officials, elected ward commissioners and social welfare officers.
The allocation of new OAA beneficiaries is determined on the basis of population size and
poverty considerations of each ward, though, during discussions with key informants, the
influence and power of ward commissioners seem to have played an important role in the
process.
2.6 Conclusions
This chapter has undertaken a review of the literature on social protection and social
assistance, focusing particularly (though not exclusively) on their relationships with poverty,
vulnerability and risk.
It started by presenting the different typologies of interventions in social protection and
focusing on the role of social assistance and non-contributory social pensions. Although
evidence points to the usefulness of this typology for both developed and developing
country contexts, its sequencing, scale and scope varies considerably, playing a more
prominent role in the developing world. In developing countries, social assistance is often
the only protection instrument that households have and is often meant to contribute
directly to tackling poverty, both by preventing people from falling into poverty, and by
supporting people and households already living in poverty in their ‘graduation’ out of
poverty.
The discussion then turned on the interaction among social protection and the concepts of
poverty, vulnerability and risk. The Risk Chain model offered the starting point for the
discussion. While risky events, are usually the result of external and unmanageable
circumstances at micro level, intervening and increasing the risk management options of
the households can affect the outcome and potential downward mobility of a household.
From the risk chain lens, social protection measures do not deal with the risky event (Risk)
per se but with the risk responses, the strategies individuals and households adopt to
reduce, mitigate and cope with risks. These strategies may include pensions, weather related
insurances, or public works and cash for work programs in the aftermath of a natural
disaster (risk coping options).
Social protection measures are about responses, the ex-ante and ex post strategies
individuals and households adopt to smooth consumption and avoid irreversible or
61
temporary falls below an acceptable benchmark (poverty). While the role of social
protection in reducing poverty by preventing people from falling into poverty is well
accepted, the role of social protection instruments in poverty exits is very controversial and
conceptualized differently in the literature. Recent research suggest that social protection,
such as a cash transfer scheme may provide additional and predictable liquidity that
contributes in lifting restrictions on the productive capacity that households living in
poverty face. By lifting these barriers and unlocking the productive capacities of
households, social protection opens up new prospects and opportunities, such as
participation in savings scheme, securing of credit, improving consumption, as well as
improving households resource allocations towards higher return investments in the short,
medium and long term. This will be further examined in the next chapter.
The second part of this chapter provided a detailed socio-economic context of Bangladesh,
which is the focus of this study. The importance of social protection in Bangladesh is
explained by presenting a detailed account on its evolution and the mixed success in
poverty reduction. The chapter ends by presenting information gathered through an
extensive fieldwork in Bangladesh, on the urban area of Narayanganj and on the OAA.
62
CHAPTER 3. ‘Risk’ and Investment Behaviour: a Multidisciplinary
Perspective
3.1 Introduction
The discussion in Chapter Two suggests that social protection programmes have the
potential of enhancing the productive capacities of poorer households in ways that may
enable the poor to climb out of poverty. Social protection instruments provide additional
and predictable liquidity to households which may in turn contribute to stimulating the
productive capacities of households living in poverty. By lifting these barriers and
unlocking the productive capacities of the poor, social protection initiatives may open up
new prospects and opportunities for poverty exits.
However, as suggested in section 2.4, the removal of liquidity barriers that may be
associated with new social protection programmes does not necessarily guarantee the
ability or the willingness of households to take advantage of the prospects and
opportunities that might have arisen. Much therefore also depends on the ability and
willingness of households to make effective choices and decide upon when and how to
take advantage of the opportunities. This gives rise to two important questions: will the
beneficiary households grasp some or all the opportunities brought by their access to social
protection instruments? Will households respond by seizing the new prospects and
choosing to invest more (higher return and riskier decisions) such as starting savings and
taking loans?
This chapter explores the key proposition from the SRM framework that risk taking – the
proactive management of risk at household level – is essential in enabling households’
understanding and ability to grasp the various opportunities for economic development
and poverty reduction. If households living in poverty are risk averse – as suggested in the
SRM- and are therefore often reluctant to engage in increased investments, the poor’s
access to risk management (social protection) instruments in such households imply that
they are more likely to engage in riskier and higher return choices, such as accumulating
assets and thereby improving their living conditions and ‘exiting’ poverty (Moser and Dani,
2008).
The chapter begins by introducing the SRM as a product of a ‘risk-centred’ paradigm shift
in society and social policy and rooted in fundamental hypotheses of neoclassical
economics, such as the expected utility hypothesis. This is followed by introducing a

63
multidisciplinary perspective that builds on insights from behavioural economics, cognitive
psychology and cultural anthropology. This multidisciplinary approach enables a
reinterpretation of the poverty exit process that is proposed by the SRM approach. By
examining the SRM through a multidisciplinary (rather than purely economics) lens, I argue
that the SRM oversimplifies and underestimates a variety of factors and processes that play
a role in household investment behaviour. This multidisciplinary critique helps in framing
and identifying the most suitable research strategy and approach, the GT. The final section
offers a critique of the GT and explores its suitability for this study.
3.2 Risk, social policy and social protection32
The concept of risk, central to social protection, has increasingly become the driving force
in public policy and more generally, in society. This section attempts to portray the process
and discourse through which risk is currently perceived and is influencing social policy and
social protection. It will also present alternative interpretations of risk in terms of a ‘tactic’
to demolish traditional need based social policy and the rational for the welfare state. In
addition, this section introduces and critically debates several social protection conceptual
frameworks and examines the SRM’s risk taking component from the perspective of
traditional, behavioural and experimental economics, and other social sciences.
3.2.1 Risk and society
The revolutionary idea that defines the boundary between modern times and the
past is the mastery of risk: the notion that the future is more than a whim of gods
and that men and women are not passive before nature (Bernstein, 1996: 1).
The role of risk in modern society has been an important topic of discussion in social
theory in the 20th century. Among the most important contributions to the discourse
around the notion of risk is Beck’s influential book Risk Society: Towards a New Modernity
(Beck and Ritter, 1992). His analysis produced two important concepts which will be
briefly explained here; ‘risk society’ and ‘reflexive modernization’ as key to understanding
institutional changes and the development of societies more broadly.
32 Section 3.2; 3.3 and 3.4 are based on the book Chapter ‘Social protection, poverty exit and household’s behaviour: a multidisciplinary perspective’ in Social Protection in Bangladesh: Building Effective Social Safety Nets and Ladders out of Poverty, 2014 (Ed. H. Z. Rahman, D. Hulme, M. Maitrot and L.P. Ragno,), of which I am the sole author .
64
Wealth has been the primary output of industrial societies: but wealth and its production
have generated a series of hazards and risks which have now permeated society. The
various risks associated with environmental pollution, technological and chemical waste, as
well as the current global unemployment crises have become more difficult to predict and
consequently to control. Risks are also becoming ‘democratic’ (Beck and Ritter, 1992: 6):
environmental risks such as climate change and climate variability affect both the rich and
poor, even if to varying degrees.
Risks are the products of human actions rather than a divine phenomenon, as often
interpreted in traditional societies (Bernstein, 1996). The existence and proliferation of
risks is itself behind Beck’s notion of reflexive modernity: reflexive because it favours -
within the society perceived as a group of individual agents- ‘a questioning of the outcomes
of modernity in terms of their production of risks’ (Tulloch and Lupton, 2005: 3). Reflexive
in these terms means that individuals and society will question the existing structures and
institutions and force changes. In this process, individuals become active co-producers of
social processes (Tulloch and Lupton, 2005: 5; Beck and Ritter, 1992: 157).
Beck and Ritter’s discourse on risk society and reflexive modernization has been strongly
criticized for its failure to recognize the importance of factors that mediate between the
individual-societal rational questioning, and the processes of change that underpin it. Most
critics of this approach, among them Adam (Adam et al., 2000) and Lupton (Lupton, 1999;
Lupton et al., 1999) have suggested that risks are mediated by a variety of factors including
a person’s gender and socio-economic status, the role of the media, individual experiences,
culture and ethnicity – all of which contribute in shaping how individuals perceive and
respond to risk (Tulloch and Lupton, 2005; Taylor-Gooby and Zinn, 2006; Cohen, 1999).
3.2.2 Risk in social policy
‘In a society such as ours, oriented toward the future and saturated with
information, the theme of risk unites many otherwise disparate areas of politics:
welfare state reforms, engagement with world financial markets, responses to
technological change, ecological programs and geopolitical transformations’
(Giddens, 1998: 64).
In line with Beck’s discourse on the individualization of risk, in Giddens’s work (1998;
2000), social policy becomes a means to deliver welfare by promoting individuals and
society’s ‘navigation of risk’, of rearranging the balance between social security mechanisms
and risk taking. Risk assumes a positive and productive connotation and contributes in

65
creating a dynamic and entrepreneurial society. By using risk as the key organizing principle
in social policy, the static needs-based welfare state is replaced by a more dynamic and risk
taking system.
In Giddens’s discourse, governments and policy makers, primary actors in the delivery of
welfare through social policy in a need-based system, become active only in the ‘prevention
arena’, in reducing global risks (environmental risks, financial meltdown risks). The
individuals instead become increasingly responsible for managing residual risks: a good
example can be a health promotion campaign, where policy makers promote an enabling
environment, while the individuals decide in how to maintain good lifestyles by making
healthy choices. Social Policy is explained as the social management of risk (De Neubourg
and Weigand, 2000) where multiple actors, rather than addressing needs, focus on
preventing, mitigating and coping with contingencies which threaten the satisfaction of
people’s need. In this respect, the focus of social policy shifts to enabling individuals in
‘preventing contingencies from materializing, on mitigating the effect before they
materialize and on coping with the unfortunate moment when bad luck, shocks or
unfortunate events strike. ....the satisfaction of main needs and the management of risk is
not the sole responsibility of public authorities. Social welfare is produced by at least three
institutions symbolically summarized as the social welfare triangle of which markets,
families and public authorities form the corner points’ (De Neubourg and Weigand, 2000:
411-412).
Social Policy becomes no longer about addressing people’s needs (Alcock et al., 1998) and
structural inequalities (Dani and de Haan, 2008), but about prevention (Scott et al., 1992:
44), social order, and displacement-privatization of risk management (Hacker, 2004) to the
individual: ‘Preventive policy reflects two dominant concerns on the part of the state: ...to
the security of its subjects, but they also include the security of security, that is the
prevailing order and of the place of government and the state within it. This implies that
the state will seek to relieve the pressure upon it by displacing responsibility for prevention
from the primary to the secondary, that is from the institutional to the individual’ (Scott et
al., 1992: 49)
3.2.3 The Social Risk Management (SRM) conceptual framework and poverty
reduction
In line with this ‘risk-centred’ paradigm shift in social theory and social policy, the SRM
suggests that phenomena such as industrialization, decolonization, and urbanization have

66
created new risks and weakened informal social protection mechanisms. Globalization and
the strengthened inter-linkages among economies and production networks have also
limited the role of the state in addressing income variability, emerging inequalities,
marginalization and social exclusion (Holzmann and Jørgensen, 2000; Lawrence, 2007).
The SRM framework emphasizes the role of the individual in navigating risk, and integrates
public, market, and informal mechanisms in preventing, mitigating and coping with risks in
a complex environment. The new role of the individual and the market propose an
alternative to traditional models based exclusively on public finances to develop formal
social protection mechanisms.
The genesis of the SRM framework lays in the need of balancing public expenditures,
poverty reduction strategies and the potential benefits that some instruments have on
economic growth. Holzmann (2000: 3) highlights three fundamental elements of the SRM,
as summarised below:
-‘Social Protection as safety net and spring-board for the poor’ (World-Bank, 2001): Social protection
can offer the opportunity to ‘bounce out of poverty’ by ‘providing the poor with the
opportunity to adopt higher risk return activities’.
-Social protection is an investment which allows human capital formation; it will diminish social
exclusion as well as the recurrence of household’s negative coping strategies during shocks
and stresses.
-Managing risks at different stages with different and complementary instruments, and
enhancing risk management capacities of individuals are key processes in reducing
vulnerability and addressing poverty.
A key assumption in the SRM framework is that
‘..... all individuals, households and communities are vulnerable to multiple risks from
different sources, whether they are natural (such as earthquakes, flooding and illness) or
man-made (such as Unemployment, environmental degradation and war). These shocks hit
individuals, communities, and regions mostly in an unpredictable manner or cannot be
prevented, and therefore, they cause and deepen poverty. Poverty relates to vulnerability
since the poor are typically more exposed to risk while they have limited access to
appropriate risk management instruments. Hence the provision and selection of
appropriate SRM instruments becomes an important device in order to reduce vulnerability
and provide a means out of poverty’ (Holzmann and Jørgensen, 2000: 3).

67
In the SRM framework, poverty reduction is directly linked to risk taking and higher return
choices. If individuals have access to social protection instruments, they will take higher
return choices and exit poverty: engaging in riskier but also higher return activities and
hence gradually moving out of chronic poverty (Holzmann and Jørgensen, 2000: 1). The
existence and access to appropriate risk management instruments to protect people’s
welfare in case of shocks, can also reduce the risk averse behaviour of households living in
poverty and favour their engagement ‘in higher risk/higher return activities’, considered to
be the way out of poverty. Figure 3.1 visualizes the process.
Figure 3.1 The Social Risk Management Framework: access to social protection instruments, consumption smoothing, investment behaviour and poverty exit (source: the Author) In the SRM, consumption smoothing becomes the main output of risk management
measures and the origin of behavioural change towards riskier and higher returns choices
(Morduch, 1995; Binswanger, 1980; Binswanger and Rosenzweig, 1989; Siegel and Alwang,
1999).
The positive externality of economic development is strictly linked to risk taking and
poverty reduction: ‘A risk averse household will not take riskier and higher return choices,
68
and will not take advantage of the exiting opportunities, causing ‘poverty ... to be
perpetuated for them [households] and their children’ (Holzmann and Jørgensen, 2000: 9).
Holzmann (2000: 23) argues that SRM (and risk management instruments) encourages risk
taking, ‘the choice of more productive technologies … and introduction of incentives to
change individual behaviour’. This, in turn, reduces ‘inefficient informal risk sharing
mechanism and sub-optimal choice of production technology by the poor and near poor,
all which contribute to too low growth and perpetuation of poverty’. The practical
implications of the SRM are enormous and represent a paradigm shift from the traditional
approaches to social protection.
In terms of actors, market based arrangements (such as insurance, pensions, savings and
bonds) become the main instruments for the individual to manage risks: public schemes are
instead the backdrop of dysfunctional market-based instruments. Government should
therefore intervene in creating an enabling environment for markets to develop, for
financial institutions to be set up, as well as design and implement policies aimed at: 1)
preventing risks (e.g. via macroeconomic and monetary policies), and 2) enhancing wealth
redistribution (e.g. via progressive taxation policies). Government’s role is limited to
regulating and supervising the system and should avoid interfering unless market failures
are foreseen (Holzmann and Jørgensen, 2000).
The individual assumes the central role in the SRM. Individuals, including the poor, are
portrayed as rational managers who ‘manage’ a portfolio of risks by deciding and selecting
instruments that they perceive as having the potential of enhancing their risk management
capacities and thereby reducing their vulnerability to poverty. In this process, individuals
and households already living in poverty will engage in riskier and higher return activities
with the expectation that this will help them climb out of poverty. In the risk taking
component of the SRM, the fundamental assumption is that households living in poverty
do not behave linearly in maximizing their expected utility, as the threat of destitution and
non survival affects their rational behaviour.
In standard economic theory, rational actors make choices to maximize their expected
utility. Holzmann (2000: 7) suggests that the threat of destitution, income variability and
closeness to a ‘survival line’ influence the linear relation between choice and maximization
of expected utility, and causes the rational actor to act ‘irrationally’, outside the economic
axiom.
69
The expected utility (Appendix 2)33 is the standard hypothesis in neoclassical economic
theory34. It suggests that in the context of an economic decision, when agents are
confronted with several potential outcomes, they tend to choose the outcome with the
maximum potential utility. The choice selection is the result of a weighting process of the
mathematical probabilities of the possible outcomes which maximize the agent’s expected
utility. Considering that the shape of the expected utility function can be concave, convex
and linear, agents do not choose to maximize their expected utility at the same extent, since
the function shows an increasing, constant or decreasing marginal utility. These changes are
explained in the expected utility function by the degree of risk aversion which actors have:
actors can be risk averse (concave shape with decreasing marginal utility) if they prefer
more certain to riskier (with higher utility returns) outcomes; risk seeking (or prone with a
convex shape and increasing marginal utility) if they tend to choose for riskier outcomes
and risk neutral, linear shape of the function with constant marginal utility.
The degree of risk aversion is strictly interrelated to the threat of destitution, income
variability and closeness to a ‘survival line’. As Holzmann (2000; 9) notes, ‘[t]his threat of
destitution and non-survival renders the poor very risk averse and as a result makes them
very reluctant to engage in higher risk/higher return activities’.
This is supported by several studies mostly based on the analysis of field data from south
India (Binswanger, 1980; Binswanger and Rosenzweig; 1989, Morduch, 1995) which have
concluded that ‘households whose consumption levels are most vulnerable to income
shocks devote a greater share of land to safer, traditional varieties of rice and castor than to
riskier, high-yielding varieties’ (Morduch, 1995: 110). More broadly, Morduch suggests that
‘risk averse households show reluctance in adopting new technologies and taking advantage
of new economic opportunities’ (Morduch, 1995: 104).
In line with this discourse, orthodox economics suggests that access to social protection
instruments allows individuals and households to reduce their vulnerability to income
variability (Morduch, 1995), as well as reduce the threat of destitution and non-survival. It
increases the agent’s attitude and behaviour in taking riskier choices and engaging in more
investments. From this perspective, social protection instruments also help promote the
33 Appendix 2 describes the concepts of: rational choice; expected utility; and risk, uncertainty and risk aversion. 34 Several other Nonexpected-Utility hypothesis and theories have been developed (see CAMERER, C., LOEWENSTEIN, G. & RABIN, M. 2004. Advances in behavioral economics, New York Princeton, N.J., Russell Sage Foundation ; Princeton University Press., however the expected utility hypothesis remains central to the field of economics.
70
re-establishment of the positive linear relation between choices and marginal wealth utility
maximization. It does this by encouraging households to take advantage of the
opportunities created by the access to social protection instruments, such as securing credit
and investing in higher return strategies. This, in turn, will contribute in achieving
productive outcomes, stimulating micro level growth and helping poorer households in
exiting poverty.
The ‘risk taking’ and the poverty reduction component of the SRM can be understood as
the consequence of a reduction of individuals’ risk aversion, towards more neutral or even
proactive attitudes. Social protection/risk management instruments play a pivotal role in
re-establishing rational behaviour which will favour more dynamic and productive choice
towards exiting poverty.
3.3 Risk, social policy and social protection: a critique
‘Establishing risk as a central defining motif of late modernity offers a new
perspective for social theory:....minimizing risk rather than ensuring Justice.... This
new dynamic of risk creates an opportunity to rework the apparently foreclosed
debate about the viability of the welfare state’ (Culpitt, 1999: 4).
In his detailed account of the emergence of the concept of risk in social science research,
Culpitt (1999: 6) interprets the rise of risk as an attempt by the mainstream neoliberal
paradigm to attack the welfare state, and to lay the basis for ‘neoliberal individualism’.
Many observers have highlighted the usefulness of Foucault’s discourse on power as a
particularly helpful analytical framework for understanding the concept of risk (Culpitt,
1999; Taylor-Gooby and Zinn, 2006; Kemshall, 2002). In Foucault’s writings, ‘power’
assumes an active role in continuous development and movement that is not concentrated
‘in the State apparatus….but..on a much more minute and everyday level’ that he defines
‘micro-powers’ (Foucault and Gordon, 1980: 50-60). Power is not exercised through
‘imposing laws on men but ..[through]..disposing things; it is to say of employing tactics
rather than laws… a range of multiform tactics’ (Foucault, 1991: 95).
Governmentality, a term coined by Foucault himself, summarizes the tactics and practices
of the dominant ideologies to ‘construct realities through practice and sense making
encompassing the multitude of societal organizations and institutions producing social
reality’ (Taylor-Gooby and Zinn, 2006: 43). Taylor-Gooby and Zinn (2006) suggest that
the rise of the notion of risk is a devious attempt aiming at ‘installing appropriate values to

71
achieve particular outcomes’, where individuals are ‘empowered [guided] to manage their
bodies, souls, their way of life in order to attain such goals35’ (Taylor-Gooby and Zinn,
2006: 4-5).
The SRM framework and the central role that the concept of risk has, can also be
interpreted as the product of the risk rhetoric, as an attempt to assault the welfare state by
proposing a new model where ‘individuals become the primary site of risk management,
not the society’ or the state (Kemshall, 2002: 31).
3.3.1 Critiques to the SRM
By producing the SRM framework, the World Bank has contributed in stimulating a
conceptual debate on social protection and the genesis of several alternative
conceptualizations (Appendix 3) that seek to challenge the SRM on several grounds. Most
of the criticisms of the SRM centre around the concept of vulnerability and its impact on
chronic poverty; the limited recognition of the role of governments in the provision of
social protection mechanisms in this approach, and its risk taking component (Devereux
and Sabates-Wheeler, 2004).
Vulnerability. In the SRM, vulnerability to poverty denotes the likelihood of becoming poor
or falling deeper below a benchmark level of welfare: increasing the risk management
capacities of the households is therefore seen as having the potential of decreasing one’s
likelihood of becoming poor or poorer. Vulnerability is the likelihood of being harmed by
unforeseen events or as susceptibility to exogenous shocks (Holzmann and Jørgensen,
2000: 6). The likelihood of being affected by a shock depends on two important factors.
The first relates to the resilience to a shock, the capacity to deal with a shock. The second
relates to the severity of the impact. The poor are more exposed and susceptible to shocks
since they have fewer instruments for risk management and even a minor welfare shock
can lead to disastrous consequences. Therefore: ‘enhancing the risk management capacities
of the poor and non-poor reduces their vulnerability and increases their welfare and should
thereby contribute to a decline in transitory poverty and provide a way out of chronic
poverty’ (Holzmann and Jørgensen, 2000: 6).
In line with what Guimaraes’ (2007: 239) notion of ‘Vulnerability as Uncertain Welfare’
(VUW), the SRM’s conceptualization of vulnerability is linked to ‘residual welfare after
35 ‘Advanced Liberalism’: how to control free individuals ROSE, N. S., BARRY, A. & OSBORNE, T. 1996. Foucault and political reason : liberalism, neo-liberalism, and rationalities of government, Chicago, University of Chicago Press.

72
accounting for the risks that individuals face and their capacity to cope with them’. Being
susceptible to income variability below a consumption–poverty line, means that individual
or household is vulnerable. The one-dimensional measurement of welfare in consumption
terms and the interpretation of risk as an endogenous factor to the individual of the VUW,
contrast with the conceptualization of ‘Vulnerability as Lack of Entitlement’ (VLE), rooted
in the capabilities literature. In the latter, vulnerability is conceptualized and explained as
‘lack of material and immaterial conditions to endure shocks’. More formally, the
vulnerable are identified as those individuals that are not entitled to basic functioning when
an unpredictable event happens (Guimarães, 2007: 245). VLE brings together entitlements
and individuals’ endowments, the institutional and social environment constructing their
exposure and the ability to respond to shocks. In the VLE, risk is not as central as in the
SRM and VUW’s conceptualization of vulnerability. Risks are not used to measure
vulnerability as these are exogenous elements which arise on pre-existing conditions, as
well as individual and societal characteristics (Sabates-Wheeler and Waite, 2003).
Vulnerability is defined by the socioeconomic, environmental and physical systems and
structures, which increase people’s propensity to be negatively affected by hazards
(Birkmann and Ebrary, 2006: 16-39). Therefore, vulnerability is a pre-existing condition
(Guimarães, 2007: 239; Villagrán De León, 2006) which is defined , for instance, by the
geographical context as well as the structural weakness in terms of lack of access to basic
services or isolation (Edström, 2007).
The narrow conceptualization of vulnerability in the SRM as one-dimensional (income
/consumption variability), individualized and extracted from the social and institutional
context, limits its purpose in social protection initiatives and is the main critique to the
SRM Framework (Devereux and Sabates-Wheeler, 2004).
Chronic poverty. The narrow conceptualization of vulnerability has also opened spaces for
criticizing the SRM in terms of its usefulness for chronically poor households. Though the
SRM explicitly highlights its benefits for the chronic poor (Holzmann and Jørgensen, 2000:
1-6), Guenther (2007) and Devereux (2004) argue that the framework focuses on transitory
income shocks, on stochastic poverty, rather than on structural determinants of [chronic]
poverty (Barrientos et al., 2005). Adverse incorporation, spatial disadvantage, limited
citizenship, social discrimination have been identified in recent studies (CPRC, 2008) as the
main causes of chronic poverty rooted in structural factors and not just as determined by
risk and vulnerability (CPRC, 2008), as the SRM suggests.

73
Role of Government. The SRM approach has also been criticised for its limitation of the role
of the government to ‘implementing policy actions for risk prevention’ (Holzmann and
Jørgensen, 2000: 18). From this approach, the role of government is limited essentially to;
(i) ‘facilitating the set-up of market-based financial institutions, providing the
enabling legal environment, ensuring their regulation and supervision, and
helping facilitate the flow of information;
(ii) providing risk management instruments where the private sector fails (e.g.,
unemployment insurance) or individuals lack the information for self-
provisions (myopia);
(iii) providing social safety nets for risk coping; and
(iv) enacting income redistribution if market outcomes are considered unacceptable
from a societal welfare point of view’ (Holzmann and Jørgensen, 2000: 18)
The primary and central role of the government in social protection systems is thus side-
lined in the SRM approach (McKinnon, 2004: 307), which tend to place individuals and
markets at the centre of social protection. This limited role assigned to governments may
result in denying the possibility of social progress among the chronically poor (McKinnon,
2004: 300) as well as social and political changes such as antidiscrimination policies, public
services for the hard to reach, strategic urbanization and migration strategies (CPRC, 2008).
Risk Taking. The ‘inappropriateness and paradoxical’ nature of the risk taking component
of the SRM (McKinnon, 2004: 308-309), is the most important critique for the purposes of
the present study. McKinnon (2004) states that the action of ‘engaging in riskier but also
higher return activities’ is the result of a complex mix of factors and cannot be explained
simply as ‘correlate of economic wealth or ownership of asset’ and might not always
overlap with ‘the self interested entrepreneurial expectation of neoliberal thinkers’
(McKinnon, 2004: 308). This critique to the SRM approach is fundamental for unpacking
the variety of factors and processes that play a role in the household’s risk taking and
investment behaviour.
In the next section, by examining the SRM through a multidisciplinary, rather than a purely
economics, lens, the theoretical assumptions which underline it, as well as the linearity of
the process of accessing social protection instruments and engaging in more investments is
challenged.

74
3.4 Investment behaviour and poverty exit: perception, acceptability and
‘factors’
‘Risk judgements can never be neutral nor individualistic but rather are always shaped
through shared understandings and anxieties about phenomena’ (Tulloch and
Lupton, 2005: 7).
This section introduces a multidisciplinary perspective that challenges the neoclassical
economics’ assumptions embedded in the SRM approach. This perspective, which builds
on insights from behavioural economics, cognitive psychology and cultural anthropology,
reinterprets the poverty exit process of grasping new productive opportunities brought in
by social protection, as strictly dependent on a context-bounded household’s risk taking
and investment behaviour.
Investment behaviour is the response to the acceptability of a perceived risk: this implies
that decisions are taken and action made based upon a process that defines the tolerability
of risk as a consequence of being perceived as such (Yates, 1994).
Decision makers are rational actors as well as part of a social, political and psychological
construct which define their vision and perception of events as well as investments and
actions to be taken. In standard economics, there is a clear tendency to ‘tackle risk using a
rigorous conceptualization of rational actions’ placing ‘stringent requirements on people’s
capacity to process information and estimate probabilities’ (Taylor-Gooby and Zinn, 2006:
8), abstracted from social and cultural settings and influences.
Risk taking and investment behaviour, as a component of a household decision making,
can be fully understood only within a framework where the perception and acceptability of
risk and its linkages with context specific endogenous and exogenous factors play a role. As
Chicken and Posner (1998: 8) suggest, the acceptability of risk is determined by the
perception of risk which is itself defined by several endogenous and exogenous factors.
In the neoclassical economic theory, the basic assumption that self-interest and rationality
govern people’s choices has been criticized by what has become known as behavioural36
and experimental economics. Though behavioural and experimental economics are
36 Behavioural economics is a field in the economics discipline based on the notion that ‘increasing the realism of the psychological underpinnings of economic analysis will improve economics on its own terms generating theoretical insights, making better predictions of field phenomena, and suggesting better policy’ (Camerer et al., 2004: 7).
75
considered to be two separate sub-fields in the economics discipline37, the innovations,
insights, and use of observed empirical evidence brought in, have challenged fundamental
hypotheses and assumptions in economics. It is widely accepted that both behavioural and
psychological elements were present in Adam Smith’s less known ‘Theory of Moral
Sentiments’; but the sophistication and systematization brought in the second half of the
twentieth century has allowed conceptual changes. As well as neoclassical economists, the
goal of behavioural economists is the prediction of phenomena and economic decisions to
design better and more appropriate policies. However they highlight the need of having
more realistic assumptions which reflects the psychological underpinning of economic
models.
One of the key insights in the field of behavioural economics is the reinterpretation of risk
not as a purely mathematically quantifiable probability, but as a product of many factors.
To the mathematically quantifiable probability of risk, behavioural economists replace the
probability judgement (Camerer et al., 2004: 9), a mental process that includes perception,
emotions, experience and memory of previous events. In the probability judgement,
individuals ‘edit’ (Camerer et al., 2004: 127) the outcomes/prospects which are re-coded as
loss or gains in relation to a reference point. As well as the prospects, the available choices
go through a process of classification and are filtered by what Kahneman names the
‘framing effect’ and ‘context effect’ (Camerer et al., 2004: 12). These processes define
people’s preferences, behaviour and choice’s selection.
Behavioural economists suggest that the way a particular choice is framed and presented
influences the choice that is subsequently revealed. A common example made by Tversky
and Kahneman is the ‘Asian Disease’ (Tversky and Kahneman, 1981). In this example, a
group of people were asked to choose between two options, options one and two in the
first frame and three and four in the second frame. In the first frame of the problem, when
people were confronted by two choices of saving 200 lives for sure (option one) or 33
percent chances of saving all and 66 percent of saving none (option two), most people
selected option one over two. In the second frame, people were requested to choose
between (3) 400 people dying for sure or 66 percent chances of saving none and 33 percent
37 Behavioural economics is defined not on the bases of the research methods adopted, but on the incorporation of psychological concepts in economics. Experimental economics instead is defined by the use of laboratory and non laboratory field experiments as research methods and attempt to test existing economic models rather than producing new theories. Differently from behavioural economics which adopts which widely adopting research methods from the field of psychology (including experiments), experimental economists have developed new rigours methods suitable for analyzing economic phenomena (Camerer et al., 2004: 8).

76
of saving all (4). Considering that options one and three are the same (same effect), the
majority of people will choose four over three. The context of available choices also shapes
the preferences and behaviour. Contrary to the independence-cancellation axiom of the
expected utility hypothesis, choices are selected based on the alternative choices available.
Therefore, preferences are: ‘ill-defined, highly malleable and dependent on the context in
which they are elicited. Nevertheless, when required to make an economic decision—to
choose a brand of toothpaste, a car, a job, or how to invest— people do make some kind
of decision. Behavioural economists refer to the process by which people make choices
with ill-defined preferences as constructing preferences’ ( Camerer et al., 2004: 15; see also
Slovic, 1995; Payne et al., 1992).
In line with behavioural economists’ discourse, Yates presents the risk taking cycle in a six-
stage process (Yates, 1994: 328-329), with risk perception at its beginning. Important
contributions to this topic have been made by Slovic, Taylor-Gooby, Yates, and Chicken
(Chicken and Posner, 1998; Dake, 1991; Douglas, 1986; Douglas, 1992; Furedi, 1997;
Lupton, 1999; Tulloch and Lupton, 2005), mostly for their attempt to identify bridges and
common grounds among disciplines in understanding risk and behaviours. As Taylor-
Gooby and Zinn (2006: 55) suggest, ‘Issues of social identity and group membership are
bound up with risk taking and risk avoidance. Some people actively seek out some risks
which others just as strenuously avoid. It becomes clear that risk cannot be understood
simply in terms of rational judgement. Emotional factors supply the drive necessary to
make choices’.
The current debate has identified important factors, defined by Dake (1991) as ‘orienting
mechanisms’ that influence investment behaviours. Some of these factors have been
reported here, however these are not conclusive and stand-alone ‘slots’. These factors are
not explanatory variables; in other words the factors themselves are the construct of sets of
beliefs and other interrelated sub-factors.
Gender: several studies have suggested that the gender of the individual assessing risk,
influences the outcome, with the general observation that males usually underestimate risk
in comparison to women (Slovic, 2000: 396). Gender has to be understood not as simply
in terms of biological differences but also as the social construct which influences human
development. For instance, women who are less exposed to education and labour markets
would most likely lack the required knowledge to properly assess risk.
Worldviews (Dake, 1991): This concept can be understood as the ‘dispositions’, similar to
Tulloch’s cultural disposition (Tulloch and Lupton, 2005: 6), the general attitudes in the

77
‘world and social organizations’ (Slovic, 2000: XXXiii and 405), which influences
individuals in their perception and response to risk. Example of Dake’s dispositions are
egalitarianism, fatalism, hierarchy, religion and so forth (Slovic, 2000: 402). Religion is
increasingly seen as ‘an important resource which guides people’s attitudes, decisions and
behaviours’ together with social norms and a society’s moral codes (Devine and Deneulin,
2011: 61).
Emotions/experiences: All perceptions, such as visual images, are coloured with emotions: ‘we
do not see a house; we see a handsome house, or an ugly house’ (Slovic, 2000: 403).
Emotions and moods result from a situation an individual has experienced in the past and
create a bias in the risk assessment process (Yates, 1994: 203-207). For instance, having
been targeted by a thief in the past will influence an individual to perceive a higher risk of
being robbed again, even if the number of thefts has remained constant. In this case, the
individual who has experienced the theft will perceive risk differently than other individuals
who have not experienced, and respond (risk taking) differently and more conservatively.
Group risk perception: When a risk response is taken within a group, such as a household, the
individual perception is mediated to produce collectively a single action, which might entail
sub-actions (Yates, 1994: 164). Collective models of intra-households decision and
allocation tend to suggest that individuals, with different perceptions and preferences are
bounded by social and economical contracts which drive them to take collective decisions
(Haddad et al., 1997; Haddad et al., 1994; Rogers et al., 1990). Within the group, several
factors influence the role of the individual in the final decision; for example, ‘chronological
age’ (Taylor-Gooby and Zinn, 2006: 180), which refers to both the biological age and the
experience and wisdom of an old person, is an important variable which can strongly
influence the final choice, mostly in terms of risk aversion.
Inequality: Spatial inequalities, in terms of where an individual lives and the services to
which they have access, also shape the perception of risk (Tulloch and Lupton, 2005).
Knowledge and information: Knowledge is the ‘sum of what we know, both theoretically and in
practice’ (Chicken and Posner, 1998: 9); its distribution, as continuous process of
information flow is uneven and asymmetric. Knowledge is continuously filtered by media38
(Taylor-Gooby and Zinn, 2006: 59) and can act a as tool in shaping or influencing people’s
decisions and choices.
38 See also the Social Amplification Framework (Slovic 2000).

78
3.4.1 Investment preferences and investment behaviour
An important distinction needs to be made here between investment preferences and
investment behaviour. This distinction frames the subsequent chapters and is an important
contribution of this research. An example may help to frame this distinction. A household
might be keen to send its younger child to university after understanding the importance of
education and seeing their neighbour’s son’s job opportunities after obtaining a university
degree. But since there is no University close by and not enough financial resources to pay
tuition and other costs, the household may adjust their choices to the circumstances and
allow schooling up to year nine. In this example the investment behaviour of the
household (sending their children to school up to year nine) differs from the investment
preference understood in terms of willingness and intention to send their son to University.
In the terminology of this research, in this specific example, the household preferred to
invest more in education but this was not reflected in their investment behaviour, in what
they reveal. The choices that households are willing to make, not their actual choice, can be
conceptualized as their intention to act, or as preference towards a choice, as willingness to
act. The realization of their willingness to act or the realization of their intention or
preference, is instead the household’s behaviour, their revealed choice, their revealed
intention.
Once the investment preference is constructed, will this be translated and revealed into a
real action (investment behaviour)? For instance, once the household decides that it is
important to send their younger child to school up to year nine at least, will this decision
translate into sending the child to school up to year nine?
Neoclassical economics, as well as the literature presented in the multidisciplinary
perspective, falls short from elaborating on the process of how preferences and real actions
unfold. Both disciplines propose models that attempt to predict and explain the relation
between preference and real behaviour (Ajzen, 1991; Ajzen and Fishbein, 1977; Rabin,
1998; Sen, 1997), but the process that includes preference construction and their realization
into behaviour, into what an individual or a household will reveal, has not been fully
explored. This becomes of particular importance when, as suggested by Rabinovich
(Rabinovich and Webley, 2007) in his research on implementing savings intentions, such
predictions are based on high income countries and have been revealed not to be
appropriate and far from successfully predicting and explaining the preference-behaviour
nexus in other contexts (Sutton, 1998). This distinction between household’s investment
preference and investment behaviour is not recognized in the literature on social protection
79
and poverty exit and specifically in the SRM framework, which often assumes that
household investment preference and investment behaviour are identical.
This perspective suggests that preferences and behaviour towards investing more, may not
be explained solely by the reduction of income variability, smoothing income and
consumption (Morduch, 1995), and reduction of the threat of destitution and non-survival.
This multidisciplinary perspective disputes the notion that social protection, by addressing
and managing uninsured risks, encourages moderate risk taking behaviour and guarantees
more entrepreneurial investment decisions. Instead, this perspective suggests that the
preferences and behaviours of households in relation to grasping these new prospects that
social protection has contributed in opening (e.g. participation of households to savings
scheme, to securing of credit, and more in general to higher return investments), are
dependent and influenced by a complex interaction of factors endogenous and exogenous
to the households itself, rather than being the certain effect of reduced income variability
and consumption smoothing. In this view, the contribution of social protection
intervention in lifting barriers to the production capacities of the households is not
sufficient in generating productive outcomes and poverty exit.
Understanding and defining households investment preference and behaviour and the
factors that influence it, becomes an important aspect of designing social protection
interventions with ‘ladder’ outcomes. If policy makers fail to do so, social protection
strategies might not contribute in supporting households in exiting poverty.
3.5 Research strategy, analytical framework and Grounded Theory
This research examines and conceptualizes the why and the how of investment by
households in poverty. It explores investment decisions in three specific dimensions of the
household’s life, namely education, health and savings. The research also examines the
extent to which individuals’ access to social assistance interventions play a positive or
negative role in the process, to review critically the explanatory and predictive power of the
SRM.
This thesis adopts a deductive strategy to identify and test the appropriateness of the risk
taking and poverty exit component of the SRM framework, which suggests that individuals
and households targeted by social protection instruments will engage in more investments.
In parallel, the research strategy also follows an inductive- constructivist approach, which
involves, firstly, the identification of major mediating factors, endogenous and exogenous
80
to the household that explains the why and how of investment by households targeted by
social assistance programs; and secondly, a critically revision of the risk taking component
of the SRM framework.
3.5.1 Analytical framework of the research
The distinction between a theoretical or conceptual framework and an analytical framework
is often blurred (Stanley, 2012). Arguably, the SRM framework can serve both as an
analytical tool that helps us understand the processes leading to poverty exit, and as a
theory that makes causal claims about the poverty exit processes. The SRM approach
conceives of investments as an inherently linear process whereby individuals and
households’ access to social protection instruments enable them to change their behaviour
towards more investments in ways that help in the reduction of poverty, both transient and
chronic. As shown in the previous sections, however, this approach is problematic to the
extent that it does not recognise, let alone explore, the multiplicity of other factors that
shape the willingness and capacity of households to responding appropriately to various
forms of risks and opting for more investments that may be necessary for poverty
reduction.
To this extent, section 3.4 and 3.4.1 identify new elements that, added in the SRM’s linear
process of investments and poverty exit (Figure 3.1), provide a more comprehensive
analytical framework for understanding the impact of social protection on increased
investments for poverty exit: the investment preferences, the opportunity structure and
‘factors’. This more comprehensive analytical framework (see Figure 8.2) allows the
identification of changes in both household preferences and behaviour (if any) caused by
cash transfers (income and consumption smoothing) and by other factors that may be
endogenous or exogenous to the household.
The central themes of this research are examining the changes in the households’
investment behaviour and the existence of endogenous and exogenous factors that
facilitate or constrain this process. As mentioned previously, the focus on this research is
limited to the household’s investment behaviour in three dimensions of their life:
education, health and savings. But what is the most appropriate methodological approach
for exploring and understanding these issues? The following section briefly examines
different approaches and identifies the GT as the ‘best fit’.
3.5.2 Understanding and eliciting investment behaviour

81
As defined by Rosenberg and Daly (1993: 66), behaviour is ‘the output of a complex
dynamic system that is shaped and nurtured by past experiences, current condition and
heredity. ... like an elegant goulash that is the end product of a complex recipe, behaviour is
determined by the blending and processing of many ingredients’.
Before a detailed discussion of the key tools to be adopted and the major steps of the
research, it is important to emphasize again a small but fundamental distinction. What
households reveal to the world, behaviour and in this research investment behaviour, is the
‘output of a complex dynamic system’ (Rosenberg and Daly, 1993). Behaviour is the final
visible decision and choice’ and may not be what households are willing to choose. The
choices that a household intends or is willing to make, not their actual choice, can be
conceptualized as their intention to act, or as preference towards a choice, as willingness to
act. The realization of their willingness to act, of their intention or preference, is instead the
household’s behaviour, their revealed choice, their revealed intention.
This study has developed a systematic and applied method of investigation (Cooper et al.,
1987:5, Cozby, 2009: 130). In the context of the research the term ‘applied’ means that,
rather than attempting to answer fundamental questions about the behaviour of
individuals, it attempts to identify practical issues and practical solutions of socially
significant behaviours (Cooper et al., 1987: 5).
In behavioural science, the empirical approaches for eliciting behaviour and preferences are
broadly classified as experimental and non experimental. Experimental methods involve
direct manipulation and control of variables (Rosenthal and Rosnow, 1991: 71) whereby
the researcher manipulates the first variable of interest and observes the response (Cozby,
2009: 82). Experimental research has been applied to several disciplines from psychology to
economics, defining a paradigm shift and the birth of sub fields of experimental and
behavioural economics. Experimental economics for instance, attempts to examine basic
system which triggers and define economic choices and to identify which features of
naturally occurring economic contexts are likely to impact economic decisions and
outcomes (Weber and Camerer, 2006: 188). In the experimental approach to behavioural
research, the laboratory is seen as a ‘wind tunnel’ (Royal Swedish Academy, 2002: 9) where
researchers have the opportunity to investigate human behaviour creating a simplified
setting which mirrors the environments of economic interaction.
The field of experimental research relies on ‘experiments’ to test models and behaviours of
actors. In the context of the present study, researchers often resort to the sequential
lotteries and gambles between binary choices approach: participants choose hypothetical
82
options which can be riskier (in terms of probabilities) but with higher return prospects on
the one hand, or low risk choices with lower returns prospects on the other. In
experiments, monetary incentives are often used to simulate the creation of real world
environment and economic decision scenarios.
The external validity of laboratory experiments is under constant scrutiny and it is often the
entry point of major critics to this approach. The extent to which the findings and insights
of laboratory experiments can be generalized in real world situations –external validity of
the experiments- is currently being debated and has generated a new interest and research
on field -as opposed to laboratory- experiments (Harrison and List, 2004: 1013). Harrison
and List (2004) suggests that the environment where the experiment is taking place does
influence behaviour. Furthermore, the ‘context’ can act as catalyst for choices and problem
solving strategies which the participants to the experiments would not carry out naturally.
Seminal work on field experiments in economics has been produced by Binswanger in the
eighties (1980; 1989). His work in rural India represents an early attempt to understand
investment preferences of poor farmers in their own environment. The experimental
methods used sequential gambles (17 games) with hypothetical questions over the toss of
coins and monetary incentives which reflected real payoffs of farmers’ work. The approach
was also complemented by interviews with farmers on the model suggested by Dillon and
Scandizzo (1983), as a form of reliability test of the sequential games. The interviews
attempted to ‘appraise the farmer’s risk attitudes via their choices between hypothetical but
realistic farm alternatives involving risky versus sure outcomes’ (Dillon and Scandizzo,
1983 :p5)
While Binswanger highlights that sequential games with binary choices are an important
tool to elicit people’s attitudes, Warneryd (1996) in his comparison between investment
preferences elicited through experiments with sequential lottery games and real investment
portfolios of a group of actors, suggests that ‘hypothetical risky choices had little import
for explaining the riskiness of investment portfolio’ (Wärneryd, 1996: 54) . In his research
in The Netherlands, Warneryd (1996) investigated the investment preferences identified
through choosing alternative (binary) hypothetical risk choices and the real financial
portfolio39 of the respondents. Through a regression analysis, he compared the two dataset
(investment preferences and financial portfolios) and suggests that investment preferences
39 The VSB dataset used in his research incorporates information on savings, stocks, bonds and other financial investments that the respondent owned.

83
elicited through hypothetical questions with the binary lottery method do not reflect the
actual behaviour and past choices of the participants to the experiments40.
Experiments in behavioural research are a very common approach and can assume
different forms: an extensive and detailed literature that highlights its strengths and
limitations exist and are widely discussed in psychology (Cooper et al., 1987; Cozby, 2009;
Pierce et al., 2004; Smith, 2008; Sommer and Sommer, 2002; Willig, 2008).
Recently, within the field of experimental research, a new approach has gained interest and
is increasingly being used in eliciting and measuring investment preferences. This approach
entails adding a ‘risk module’ with hypothetical questions on, for instance, lottery choices
and investments, in socioeconomic household surveys used for randomized control trials
and panel surveys. Empirical evidence relating to the predictive power of these surveys,
which are often used in conjunction with laboratory and field experiments, remains mixed,
however (Dohmen et al., 2011; Ding et al., 2010; Bertrand and Mullainathan, 2001a;
Anderson and Mellor, 2009).
A part from the debate on the validity of eliciting individual investment preferences
surrounding experimental methods, in the context of this research, adopting similar
approaches might not be useful in examining ‘why’ households opt for more investments
and on the ‘what’ are the households specific and contextual factors which defines their
choices.
Instead, non-experimental research offers a more appropriate approach for answering these
research sub-questions. Non-experimental research uses direct observation of real life
events, in depth interviews to describe and recall behaviours over time as well as more
advanced psychological tests (Cozby, 2009: 81). In a broad sense, non-experimental
research describes behaviours and relationships, and ‘relates’ them to variables to develop
hypotheses about correlations as relational principles (Rosenthal and Rosnow, 1991: 10).
40 Warneryd however suggests that risk preferences elicited through hypothetical questions with the binary lottery method can explain instead some real choices of the participants in relation to real lotteries and gambling.
84
3.5.3 Developing a model for understanding investment preference and
behaviour: The Grounded Theory Framework
The essence of this research goes beyond ‘testing’ the risk taking and investment behaviour
component of the SRM. Rather, it seeks to deepen our understanding of the complex
processes and factors that influence households’ investments behaviour. Following Mark
and Shotlan’s (1987: 57-75) definition of qualitative research, this study is in both ‘Big Q’
and ‘little q’ categories. As mentioned earlier, the research has both a deductive (testing the
SRM hypothesis) and inductive (identifying factors and process which hinders or facilitate
people from selecting higher return choices) components. Big Q studies use qualitative
research to generate theories and hypothesis, are bottom up and constructed from field
data. Little q qualitative researches adopt instead ‘non numerical data techniques into
hypothetical-deductive strategy design......they start with a hypotheses and researcher
defined categories against which the qualitative data are then checked’ (Willig, 2008: 9).
This research combines both approaches.
The GT offers a process to develop through qualitative research techniques ‘grounded’
theories or models, which can be compared to the SRM’s explanatory and predictive
hypothesis on the poverty exit process. The research adapted the GT approach to a low
income country context, and investigates the role of social assistance in households’
behaviour through in-depth field work in Bangladesh with urban households targeted by
the OAA.
Generating a theory or an explanatory model of household’s behaviour through non
experimental approach helps in identifying the key factors that constrain or facilitate
investment by some families, as well as on the role of the pension and social assistance
interventions in this process, and act as an element of comparison with the explanatory
validity, as well as the analytical and policy implications of the SRM framework. In this
context, the GT represents a comprehensive approach that best addresses this research
need of developing an explanatory model of household’s investment behaviour. It is
among the most widely used approaches in qualitative research. Originally developed in
1967 by B.G. Glaser and A.L. Strauss, the GT approach has subsequently been interpreted
in different ways by different scholars. In this study, I follow the work of Glaser who wrote
that: ‘Grounded theory is based on the systematic generating of theory from data, that itself
is systematically obtained from social research. Thus the grounded theory method offers a
rigorous, orderly guide to theory development that at each stage is closely integrated with a
methodology of social research. Generating theory and doing social research are two parts
85
of the same process. How analysts enter the field to collect the data, his methods of
collection and codification of the data, his integrating of the categories, generating memos,
and constructing theory – the full continuum of both the process of generating theory and
of social research- are all guided by the emerging theory’ (Glaser, 1978: 2).
The GT is a rigorous and systematic methodological framework which embraces the
research process, from its conceptualization, to the data collection, analysis, and theory
development, grounded in the data. Its aim is to construct theories41 through an iterative
process in which the researcher interacts with the data in parallel with the analysis and
where both inform each other. This back and forth process, which Glaser refers to as
‘double-back steps’ (1978: 16), makes the field data collection more purposeful, and the
analysis more theoretical. Though different and in some cases conflicting GT approaches
exist and are widely discussed in the literature (Charmaz and Bryant, 2007; Glaser, 2001;
Glaser, 2003), Table 3.1 presents important structural characteristics common to all GT
approaches.
41 Charmaz (2007:125-126) discusses what theory in GT means. She describes theories as ‘positivists’ when they ‘seek causes, favour deterministic explanations, and emphasizes generality and universality’ or ‘Interpretative’, when they emphasize understanding rather than explanation of phenomena.

86
Table 3.1: Structural characteristics common to all GT approaches.
Iterative process
GT is a methodological framework which frames data gathering and
data analyses processes. These processes inform and influences
subsequent steps of data gathering (Theoretical Sampling) and data
analysis (Theory Generation).
Analytical
Coding and
concepts and
categories
identification
The micro analysis of data involves coding the text and discovering
first basic concepts, then higher level concepts (categories) as well as
relationship between them. This informs the theoretical sampling.
Sampling aimed
at theory
generation and
saturation
Sampling decisions are informed by the analysis of the data and the
early concepts that have emerged from the data, rather than from
pre-conceived hypothesis. In this process, the researcher attempts to
purposely select new samples to strengthen as well as contrast
(compare-contrast) the early concepts identified until ‘saturation’, a
stage in which no new concepts emerge from the data. This is an
inductive-deductive continuum which is fundamental to GT only if
‘the deductive is in the service of an inductive method; it is
subservient to it and ideas arrived deductively must be discarded
unless grounded’ (Glaser, 1978: 41).
Advancing
Theoretical
development:
theoretical
coding and
theoretical
sorting
Advancing in generating a grounded theory, means questioning
further and ‘sorting’ categories in an attempt to identify core
categories to develop more abstract theoretical coding, the building
blocks of a grounded theory.
Source: Adapted from Hutchison, 2012, p 284
This table introduces a number of key words which will be constantly used in this thesis
and are central -and contested42 in the GT literature: codes, concepts, and categories.
Coding and deciding how to code are the central elements in GT. Coding in qualitative
research refers to the process of categorizing data by introducing labels (codes) that
summarize and analyze each piece of information in the text. Coding allows researchers to
move beyond the concrete events in the data towards analytical interpretations. Codes
summarize meanings, actions, contexts, viewpoints, causes and effects, processes and so
42 The discussion on these words and their meaning used by Glaser, Strauss and other GT researchers, is extensively dealt in CHARMAZ, K. & BRYANT, A. 2007. The SAGE handbook of grounded theory, London, SAGE.
87
forth (Charmaz, 2006: 42-45). Coding data is the first step in developing a grounded theory.
Glaser (1978: 55) differentiates the existence of two types of codes, substantive and
theoretical codes. Substantive coding identifies important concepts and ideas emerging
from the text, helps to ‘conceptualize the empirical substance of the area of research’, as
well as allows a fracturing of the data into analytical units which will then be raised to a
conceptual level (Glaser, 1978: 55-56). Substantive codes are concepts that emerge from
the text, by literally interrogating it with such questions as: what is this data a study of?
What is happening in the data? What is the process discussed in the data? How is the
process related to the actor (interviewee)? Substantive coding can be open (or initial) and
focused (Glaser, 1978: 61). When the coding process starts the researcher attempts to
remain open and identify all concepts that arise from the text which is being analyzed. This
initial coding should not be influenced by preconceived concepts, knowledge and literature
rather, it should emerge from the data themselves (Glaser, 1978: 31; Glaser, 2005: 1-6;
Steinke et al., 2004: 153; Hutchison et al., 2010: 228).
The specific concepts that are being identified at this stage will inform the following
(theoretical) sampling for further data collection (e.g. new interviews). After the new data
are collected, the coding becomes more focused in an attempt to further explore concepts
identified earlier, nevertheless remaining open to new emerging ones. The ‘focused’ coding
is a fundamental step in which selected descriptive concepts are raised and transformed
into ‘conceptual categories’, which can explicate ideas, events and processes in the data
(Charmaz, 2006: 91). Categories are concepts which have a major explanatory value and
incorporate other identified concepts as properties of the category. In the categories,
concepts become ‘conditions under which the category arises, is maintained and changes’
(Charmaz, 2006: 92; Charmaz and Bryant, 2007: 278).
Theoretical coding ‘conceptualizes how substantive coding [concepts and categories] may relate
to each other as hypothesis to be integrated into a theory’ (Glaser, 1978: 55); theoretical
codes are, ‘like substantive codes, emergent: they weave the fractured story back together
again. Without substantive codes, they are empty abstractions’ (Glaser, 1978: 72).
The process of theoretical coding refers to the process of ‘sorting’ the conceptual
categories that emerge from data, by identifying how and if they are related to each other in
the theory. Strauss and Corbin (1987) and Glaser (1978) strongly differ in their work on
how this should happen. Strauss proposes the use of a ‘coding paradigm’ which frames the
relationship among conceptual categories in terms of conditions, interactions among
actors, strategies and tactics, and consequences. The value of this coding paradigm is its
88
clarity that makes the entire process of coding more manageable. Glaser (1978) argued
against Strauss' coding paradigm on the basis that it forces conceptual categories into a
static paradigm. He suggests that his 18 theoretical coding families provide a better
framework that assumes the existence of a broader range of theoretical options that links
up conceptual categories.
A ‘grounded’ theory integrates and theoretically sorts the conceptual categories that
emerged from data into a coherent abstraction with explanatory validity of the
phenomenon or process being studied (Glaser, 1978: 116-127). GT is about the process of
‘theorizing’, which starts with the field data gathering and, after a back and forth process
(data gathering and analysis) ends with the production of theories grounded in the data.
Theorizing means discovering, from the data, abstract concepts and how they relate to each
other, through an iterative process between field data gathering and analysis which ends
only when no new concepts emerge (saturation).
Figure 3.2 graphically represents the GT as a process to guide the researcher in comparing
and contrasting events, phenomena and processes to develop a grounded theory. From the
initial stages of coding to identify early concepts, to the development of core categories
that explain relationships among concepts, from the initial data gathering to a more
focused theoretical sampling, GT provides a series of tools and a rigorous framework for
researchers to use and operationalize.

89
3.5.4 The Grounded Theory framework and its critique
As with all analytical approaches, GT has been the subject of strong criticism. In addition
to the internal divisions between Glaser and Strauss, and the continuous attempt to adjust,
revisit and modify this framework, others have argued that it is not a valid method in social
research on two grounds. G. Thomas is one of the strongest critic of GT’s fundamental
elements, specifically on the notion (and process) of theorizing and theory, on the notion
of ‘grounded’ and of ‘discovery’ (Thomas, 1997; Thomas, 2002; Thomas and James, 2006).
First, the critique on theory generation in GT is based on the view that theory seems more
about ‘understanding’ based on an interpretation of events and an ‘overgeneralization’ of
everyday patterns, rather than a formal theory with explanatory power – which is what the
GT approach claims to achieve (Glaser, 2001: 89). Second, the interpretation of events
forms also the grounds of his critique on the notion of ‘grounded’ and ‘discovery’. Thomas
and James (2006: 781) ask ‘How are grounded theorists to quarantine themselves, as social
selves, from the data they are analysing and re-analysing to enable 'theory' to emerge? And
Figure 3.2: the Grounded Theory research process (source: the Author)
ackBa ck and forth process which ends with saturation and forth
process which ends with saturation
THE GT PROCESS
90
how can they transcend this and move outside it to stand on neutral 'ground?’.
Nevertheless, he suggests that any researcher can detach himself from his own background,
knowledge, prejudice and an a priori assumption which define the mental structure that
interprets empirical data. Therefore, the researcher, rather than discovering a grounded
theory hidden in the data and awaiting to be discovered, interprets and constructs ‘one
unique construction among a plethora of possible constructions’ (Thomas and James, 2006:
786).
In their review on how and when GT originated, they suggest that this method managed to
unite different epistemological positions in responding to the increasing pressure and
hegemony of ‘statistical methods and structural functionalism’ of the 1960s, over qualitative
enquiry (Thomas and James, 2006: 768). This contributed to its acceptance as a method for
qualitative research, despite the fact that using GT ‘involves a rejection of simple
understanding’ (Thomas and James, 2006: 790). Their arguments challenge the legitimacy
of GT and any form of its reinvention.
In this thesis, this critique is important in setting the scene of what the final product will
be. I do not claim to develop a formal theory, rather, a model that allows the understanding
and therefore, the explaining of a basic social process. In this research I often refer to ‘an
explanatory model’, rather than theory as such, to represent the fact that this is not ‘the’
model, rather one of many, and the result of my own interpretative discovery process. GT
in this research is a ‘family of methods’ (Charmaz, 2006), a flexible set of stages and
techniques, not a doctrine. It is used to support the understanding of households’
investment behaviour and contributes in addressing the research sub-questions.
Through applying the sequential steps of the GT, household decision making is
conceptualised as a two stage-process of ‘constructing’ investment preferences (what they
are willing to do), and of ‘realizing’ or ‘revealing’ household choices (what they actually do).
By carefully distinguishing the two stages, I have identified an opportunity structure that
filters the investment preferences and determines the extent to which these preferences will
be realized as investment behaviour. This approach opens a view to the several factors that
play a part in constructing and changing investment preferences as well those that favour
or constrain the actualization of such preferences. In constructing investment preferences,
some examples of these factors include: strong motivation, social norms, perceived survival
needs, as well as trust and commitment. The GT, properly adapted to conditions in low
income settings, provides a rich perspective on a significantly under-researched area of
development

91
3.6 Conclusions
The SRM argues that risk taking – the proactive management of risk at household level – is
essential in enabling households to grasp opportunities for economic development and
poverty reduction. It suggests that households living in poverty are risk averse and are therefore
often reluctant in engaging in higher risk/higher return activities. If households have access to risk
management (social protection) instruments, they are more likely to engage in riskier and
higher return choices, such as asset accumulation and are therefore more likely to exit
poverty and improve their socio-economic conditions. There is thus a linear process
involved here, whereby access to social protection triggers a change in individuals or
households’ investment behaviour towards engaging in greater investments in different
dimensions of their lives, such as education, business and others.
This chapter has challenged this perspective by arguing that the SRM oversimplifies and
underestimates a variety of factors and processes that play a role in the household’s
investment behaviour. Unpacking these factors and processes at play will improve the
explanatory and predictive power of the SRM in relation to poverty exit. After reviewing
different research approaches to analyze these processes, I suggest that a qualitative
research strategy and specifically the GT is the best fit to making sense of the complex and
very specific factors which influence households in low income settings. A further
discussion of how the GT is operationalized in this study is the focus the next chapter.
92
CHAPTER 4. The Research Process
4.1 Introduction
The previous chapter introduced GT as a rigorous and systematic process to generate
theory ‘grounded’ in the data. This process address the deductive, inductive and
constructivist strategy of this research. GT in this research is a ‘family of methods’
(Charmaz, 2006), a flexible set of stages and techniques, not a doctrine, that supports the
understanding of households’ investment behaviour and contributes in answering the
research sub-questions. This chapter describes in detail how the GT has been adapted and
operationalized to investigate to what extent the SRM and its conceptualization of risk
taking and investment behaviour is a key exit route out of poverty.
The depth of the details used in describing the research process serves two purposes. First,
a grounded theory, or in this case an exploratory model, should be evaluated on the final
output (model) and its contribution to knowledge, as well as on the rigour of the process
that has led to its emergence and generation. Secondly, the research process has benefited
by the use of a Computer Assisted Qualitative Data Analysis Software (CAQDAS), QSR
Nvivo. The use of CAQDAS is sometimes viewed with scepticism because of the risk of
‘whether CAQDAS changes the way analysis is conducted and to what extent it enhances
or detracts from the quality of qualitative research’ (Bringer et al., 2004: 248). Bringer
(2004; 2006) discusses this issue extensively and concludes that if CAQDAS is used as a
tool to aid the qualitative analysis within an already defined theoretical perspective – as
opposed to theoretical perspectives based on the capabilities of the software-, the software
offers a ‘revolutionary prospect demonstrating methodological congruence because of the
level of transparency ....that is rarely seen in manual methods’ (Bringer et al., 2004: 251-
252). The detailed description of the tools used to operationalize the analytical techniques
the GT all serve to maximize transparency of the process leading to generating explanatory
models.
The chapter starts with a brief overview of the research process which is then followed by
a detailed explanation of the seven phases that have operatioanlized the structural
characteristics of the GT. This chapter also discusses an important concept that frames the
next empirical chapters and also represents an important contribution of this research, ‘the
process of realization’, introduced in section 3.4 of the previous chapter. By applying the
GT during my field research, the household investment behaviour has emerged as a two
stage process of ‘constructing’ investment preferences (what they are willing to do), and of
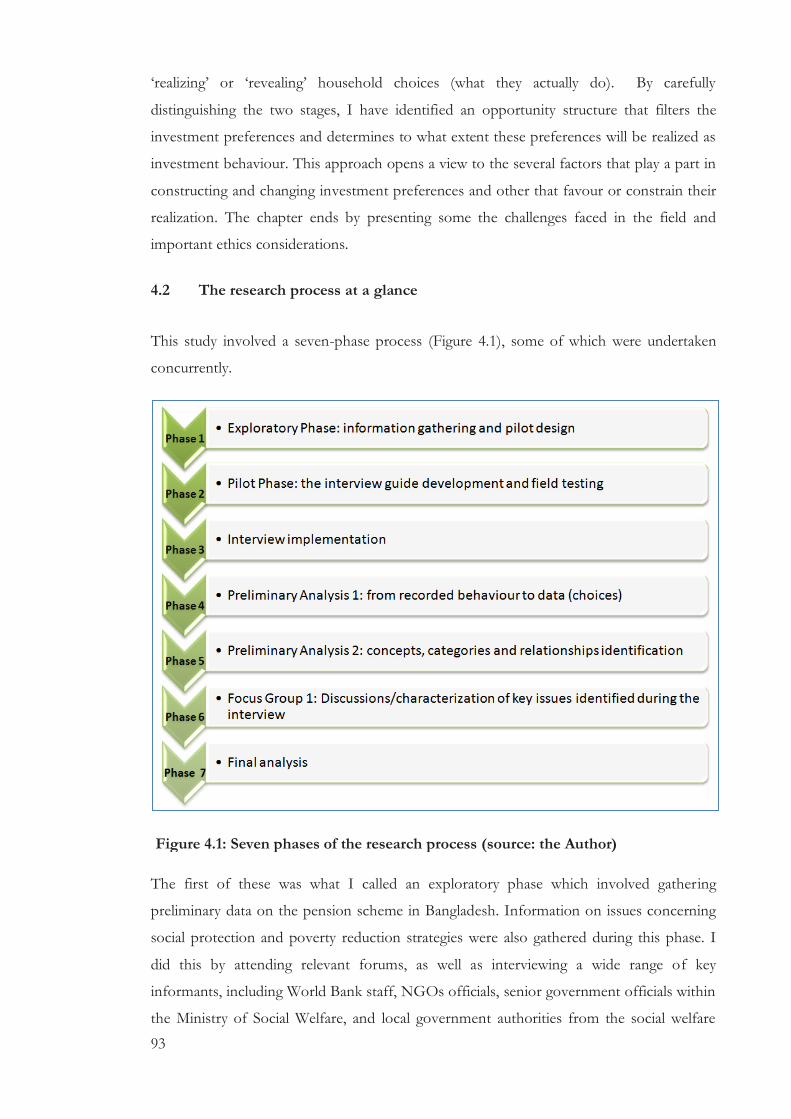
93
‘realizing’ or ‘revealing’ household choices (what they actually do). By carefully
distinguishing the two stages, I have identified an opportunity structure that filters the
investment preferences and determines to what extent these preferences will be realized as
investment behaviour. This approach opens a view to the several factors that play a part in
constructing and changing investment preferences and other that favour or constrain their
realization. The chapter ends by presenting some the challenges faced in the field and
important ethics considerations.
4.2 The research process at a glance
This study involved a seven-phase process (Figure 4.1), some of which were undertaken
concurrently.
The first of these was what I called an exploratory phase which involved gathering
preliminary data on the pension scheme in Bangladesh. Information on issues concerning
social protection and poverty reduction strategies were also gathered during this phase. I
did this by attending relevant forums, as well as interviewing a wide range of key
informants, including World Bank staff, NGOs officials, senior government officials within
the Ministry of Social Welfare, and local government authorities from the social welfare
Figure 4.1: Seven phases of the research process (source: the Author)
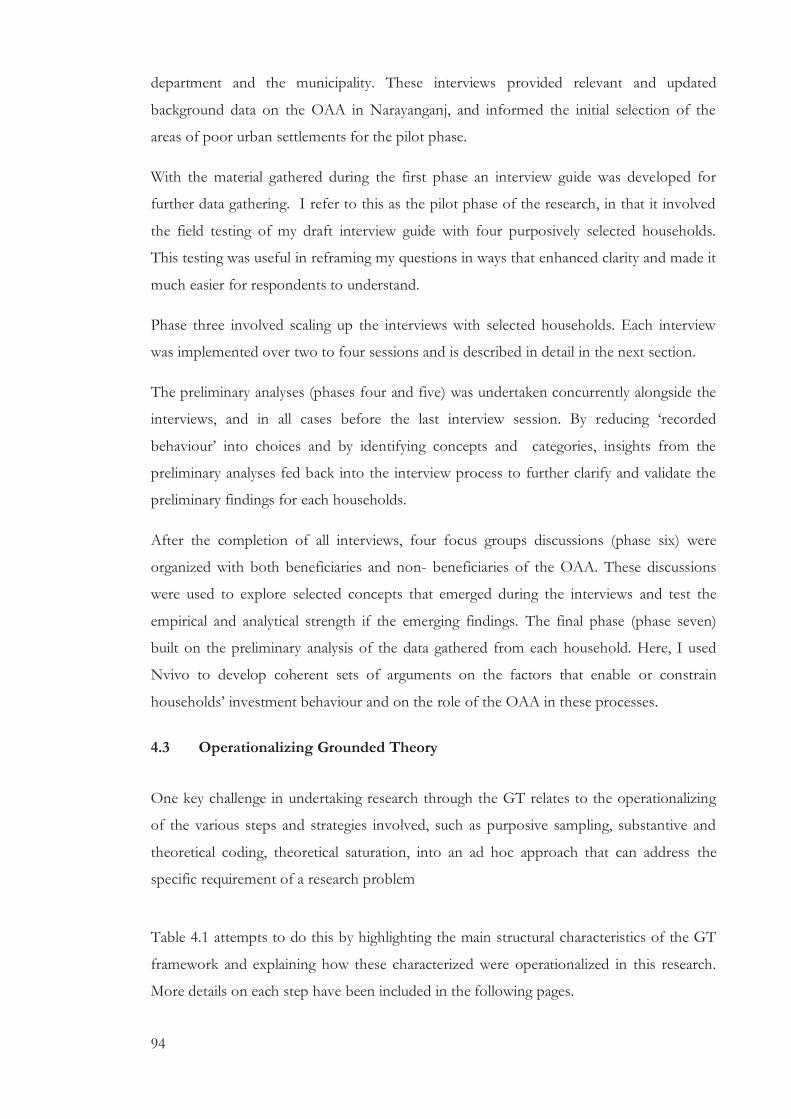
94
department and the municipality. These interviews provided relevant and updated
background data on the OAA in Narayanganj, and informed the initial selection of the
areas of poor urban settlements for the pilot phase.
With the material gathered during the first phase an interview guide was developed for
further data gathering. I refer to this as the pilot phase of the research, in that it involved
the field testing of my draft interview guide with four purposively selected households.
This testing was useful in reframing my questions in ways that enhanced clarity and made it
much easier for respondents to understand.
Phase three involved scaling up the interviews with selected households. Each interview
was implemented over two to four sessions and is described in detail in the next section.
The preliminary analyses (phases four and five) was undertaken concurrently alongside the
interviews, and in all cases before the last interview session. By reducing ‘recorded
behaviour’ into choices and by identifying concepts and categories, insights from the
preliminary analyses fed back into the interview process to further clarify and validate the
preliminary findings for each households.
After the completion of all interviews, four focus groups discussions (phase six) were
organized with both beneficiaries and non- beneficiaries of the OAA. These discussions
were used to explore selected concepts that emerged during the interviews and test the
empirical and analytical strength if the emerging findings. The final phase (phase seven)
built on the preliminary analysis of the data gathered from each household. Here, I used
Nvivo to develop coherent sets of arguments on the factors that enable or constrain
households’ investment behaviour and on the role of the OAA in these processes.
4.3 Operationalizing Grounded Theory
One key challenge in undertaking research through the GT relates to the operationalizing
of the various steps and strategies involved, such as purposive sampling, substantive and
theoretical coding, theoretical saturation, into an ad hoc approach that can address the
specific requirement of a research problem
Table 4.1 attempts to do this by highlighting the main structural characteristics of the GT
framework and explaining how these characterized were operationalized in this research.
More details on each step have been included in the following pages.

95
Table 4.1: Structural characteristics of GT and its operationalization in this research
Structural
characteristics
of GT
Application to this research
Iterative
process
In this research, each phase of the data collection process informed
the design and development of the following phase: the exploratory
phase informed the pilot phase; the preliminary analysis of the first
four households in the pilot area informed the approach to be
followed in the other areas as well as the selection of areas and
households; and so forth. In addition, the preliminary analysis of the
data gathered from each household which was undertaken alongside
the interview process, informed the last stages of the data collection
processes via a combination of further interviews and focus groups
discussions.
Sampling
aiming at
theory
generation and
saturation
Selection of areas and households was informed by the early
concepts identified in the preliminary analysis. For instance, when
the number of earning family members was identified as an
important concept for theory development, further sampling was
made to gather more insight on this issue. Similarly, the area
selection was informed by concepts identified during the interviews
Analytical
Coding and
concept
identification
Micro analysis of data, which involves coding the text of the
interviews to identify early concepts, started during the preliminary
analysis in the pilot phase. The preliminary analysis identified
important concepts, categories and relationship that were further
explored with selected households during the last interview session
and FGDs.
Advancing
Theoretical
development
In this research, the development of early models did not occur
during the field work. Instead, advancing theoretical development
took place during the final analysis with the support of the software
Nvivo.
Source: Author’s compilation
The iterative ‘back and forth’ process of GT in this research is visualized in Figure 4.2. The
light orange sections represent the field-level data gathering stages, while the light blue ones
represent the analysis/reflection stages, where data collected were analyzed with the
purpose of identifying initial concepts that would inform the following phase.
The process starts with the research problem and ends with the generation of an
explanatory model on the households’ investment behaviour in saving, education and
health.
96
Figure 4.2: The iterative ‘Back and Forth’ process of GT (Source: the Author)
Below, I explain in detail each phase of the process and the specific information gathered
during each of these phases. The discussion focuses particularly on the material gathered
during the households’ multiple session interviews, as this was the main data collection tool
for the study.
4.3.1 Phase One: Initiating the fieldwork (exploratory phase)
In the exploratory phase of the research, I collected information on the OAA in
Bangladesh and developed a profile of the Narayanganj municipality. I did this by

97
interviewing officials from the Ministry of Social Welfare, local government authorities,
community leaders, and development partners
These interviews proved very useful, in that they provided an opportunity for a) gathering
updated and field level background data on the OAA; b) initiating the sampling process
(areas and beneficiaries); and c) gaining access to selected areas and approaching gate
keepers.
Specific interviewees during this phase included the:
1. Social Welfare Narayanganj city corporation coordinator
2. Social Welfare Narayanganj district coordinator
3. Three Social welfare Field officers
4. Narayanganj City Corporation Slum development Officer
5. Narayanganj City Corporation Executive Officer
6. Ward six Commissioner
7. Urban Partnership for Poverty Reduction (UPPR) Narayanganj manager
8. UPPR Narayanganj Socioeconomist
9. Two UPPR Narayanganj field officers
10. UPPR International Project Manager
11. UPPR International Extreme Poverty Advisor
12. HelpAge (international) Country Director
13. HelpAge officer
14. (former) World Bank social protection economist
During the exploratory phase, I collaborated with the Social Welfare coordinator and
officers to collect information on the number and location of OAA beneficiaries in the
municipality43. Identifying the number of beneficiaries by ward (the lowest administrative
unit in the municipality) was the result of desk work done in Narayanganj by revising
official lists; the number of beneficiaries in poor areas was instead identified by discussing
43 The support of the local office of the Ministry of Social Welfare was a major facilitating factor in many of the activities carried out in the field. Their support was officially requested and granted after I submitted a formal request directly to the Director General of the Department of Social Services of the Government of Bangladesh. Their letter which ‘approved’ my research paved the way for close collaboration with the officials of the social welfare office, as well as with other local authorities such as ward commissioners and Municipality officials (Appendix 7).
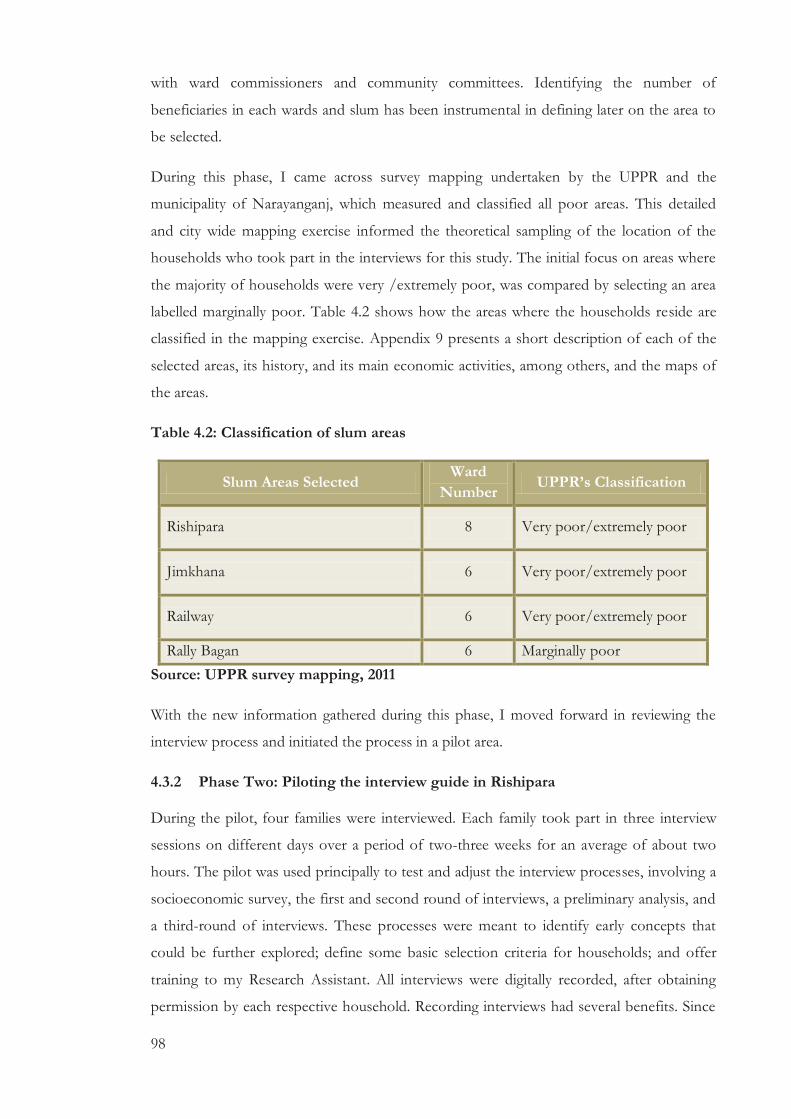
98
with ward commissioners and community committees. Identifying the number of
beneficiaries in each wards and slum has been instrumental in defining later on the area to
be selected.
During this phase, I came across survey mapping undertaken by the UPPR and the
municipality of Narayanganj, which measured and classified all poor areas. This detailed
and city wide mapping exercise informed the theoretical sampling of the location of the
households who took part in the interviews for this study. The initial focus on areas where
the majority of households were very /extremely poor, was compared by selecting an area
labelled marginally poor. Table 4.2 shows how the areas where the households reside are
classified in the mapping exercise. Appendix 9 presents a short description of each of the
selected areas, its history, and its main economic activities, among others, and the maps of
the areas.
Table 4.2: Classification of slum areas
Slum Areas Selected Ward
Number UPPR’s Classification
Rishipara 8 Very poor/extremely poor
Jimkhana 6 Very poor/extremely poor
Railway 6 Very poor/extremely poor
Rally Bagan 6 Marginally poor
Source: UPPR survey mapping, 2011
With the new information gathered during this phase, I moved forward in reviewing the
interview process and initiated the process in a pilot area.
4.3.2 Phase Two: Piloting the interview guide in Rishipara
During the pilot, four families were interviewed. Each family took part in three interview
sessions on different days over a period of two-three weeks for an average of about two
hours. The pilot was used principally to test and adjust the interview processes, involving a
socioeconomic survey, the first and second round of interviews, a preliminary analysis, and
a third-round of interviews. These processes were meant to identify early concepts that
could be further explored; define some basic selection criteria for households; and offer
training to my Research Assistant. All interviews were digitally recorded, after obtaining
permission by each respective household. Recording interviews had several benefits. Since
99
the interview was in the local language, the word to word translation and transcription
carried out by my research assistant minimized the possibilities of misinterpretation on his
side, and provided me with first-hand information needed for the preliminary analysis.
Also, by recording interviews, I was able to avoid requesting their signature on the consent
form, as their consent to take part to the process recorded at the start of the interview.
The pilot phase was also useful in defining two broad groups of households to be
interviewed. The first group (G1) was made of households that have been receiving the
cash transfer regularly from the start of the social pension scheme in the urban area of
Narayanganj in 2003. The households that are part of this group have received cash
transfer for more than four years (before July 2007) in a row. The second group (G2) was
of households that started benefiting from the program more recently, from July 2007.
The pilot phase also helped in validating my research instruments (especially the interview
process).Only very minor modifications were therefore made to my final interview guide
following the end of this phase of the data collection processes. However, the modality for
the identification and recruitment of households was considerably revised and adapted to
the context. The reason for this is that the approach piloted in this area, in which
households were invited to an information session, did not seem to be working: nobody in
fact attended the session. To address this issue, with the support of the ward commissioner
and some other community members, we implemented a ‘quick survey’ of the beneficiaries:
this survey included key data on when they started receiving the pensions and the number
(and age) of family members, among other things. The list was used to invite selected OAA
households with different profiles to take part to the interview process. The preparation of
the quick survey did not involve visiting each household as we were collecting information
by discussing with some community members. The data collected therefore did have some
validity issues, which were addressed during the first session of the interview process.
In line with the GT approach, the preliminary analysis of the households in the pilot phase
provided important insights for selecting the households for interviews. The selection
process was informed mainly by the size of households, number of earning members, their
income and location of their dwelling.
This phase also provided more practical guidance in scaling up the interviews, in relation to
household selection, translation and transcription, closing session of the interview process
and information dissemination within the communities to manage expectations. Some of
the learning and changes adopted in the successive phases included the following:

100
1. Vetting of Households: Before the final decision of including a household in the
interview process, an in-depth vetting needed to be organized, to make sure
minimum conditions existed for implementing the multi sessions interviews.
During the pilot, one family decided to drop out after the first round of interviews
because they did not have time, while in another case, health issues of the OAA
beneficiary, urged us to interrupt the interview process.
2. Adjustments to the household selection: quick survey rather that inviting
households to an information session.
3. Avoiding having simultaneous translation during the interviews (except for the last
session of the interview). The process of having several sessions compensated the
need for simultaneous translation.
4. Several households were very busy and it was difficult to sit and discuss at the
agreed time; in some cases we had to stop and resume the conversation few hours
after. On average, each interview lasted for about 30-40 minutes, with each
household allocated an average of two-and-half hours.
5. Time allocation for translation and transcription: Translating and transcribing,
required, for a 40 minutes interview, between four to five hours
6. Incentive to maintain interest in the process-Taking a photo of the household (and
mentioning that we will be giving it as gift only during interview two) is a good
incentive for the households to remaining and not dropping out of the research.
7. Managing expectations: Extensive preparatory work /networking with community
leaders/elites is important to make sure the research is not seen as
government/municipality assessment or new selection of new beneficiaries for of
the OAA scheme.
The pilot in Rishipara was important in informing a revision and adjustment in relation to
the questions asked, follow up to concepts and relationships identified, rather than the
process itself.
4.3.3 Phase Three: Conducting in-depth interviews
The main data gathering method for this research was in-depth qualitative interviews of 43
households (Appendix 6). In GT, qualitative interviews are often considered the most
appropriate tool for collecting data. Charmaz (2006:25) defines these types of interviews as
‘intensive’: ‘Intensive interviewing permits an in-depth exploration of a particular topic or
experience.......The in depth nature of an intensive interview fosters eliciting each
participant’s interpretation of his or her experience’.
101
In this research, as briefly mentioned early, each household interview was split into four
sessions. This approach was instrumental as I was able to analyze the initial discussion with
the households and returned with follow up questions to explore further their behaviour
and preliminary concepts that seemed to have influenced their choices. This ‘focused’
interviewing approach operationalizes the iterative nature of GT with individual
households and contributed in developing an in depth understanding of each household’s
investment behaviour. This multi-session household interview also had other practical
benefits. The different sessions were implemented over a period of up to two months.
During this period, we continuously visited the areas and where possible, informally
discussed or just visited the families even for few minutes. This had an impact on the
subsequent sessions, where we could clearly notice more openness towards us and our
questions. Also, the multi-session household interview provided an opportunity to
translate, transcribe and for me to analyze (preliminary analysis) the data gathered.
The purpose of the interviews was two-fold. First, by describing and recording households’
behaviours, the interviews provided the data needed to test (deductive component) the
predicted behaviour by the SRM - namely the claim that household with access to social
protection will opt for more investments. Through the interviews, I was able to identify the
households’ choices in relation to, for instance, education (hiring tutors; sending
sons/grandsons to schools for more years/buying more books etc.), before and after the
start of the pension scheme. Investments made before the start of the pension in relation
to specific dimensions of households’ behaviour (e.g. in relation to education; savings and
so forth), were considered as individual baselines44.
This approach builds on the retrospective methods, that is, collecting data through recalling
specific events and reasons that surrounded that particular choice (Krishna, 2004; Krishna,
2006; Krishna, 2010). For example, assuming a household did not hire any tutor for their
children or sent their children to school up to year five before the start of the pension. But
after the pension, the household hired a tutor to support the education of a grandson or
sent him to school up to year 10. In this case, the household opted for more investment in
education.
Second, the analysis of the recorded investment behaviour provided the basis for
identifying exogenous and endogenous factors that either enhanced or constrained
44 Individual baselines: accessing a loan of 3000taka can be interpreted as a family opting for more investment if the family has never accessed a loan before. It can also be interpreted as a family opting for less investment if the family has been accessing credits for the previous 10 years.

102
household’s interest and capacity from opting for more investments (the inductive
component). Continuing with the example above, during the interviews if we identified that
choices in relation to education had changed over time, we tried to explore it further by
asking questions like: why you did not hire a tutor for your children before, but more
recently you did it for your grandson? Has something changed?. Even if no change had
been identified between the past and present choices, we asked questions like: I see that
your choices in relation to education have been the same over time. Have you been trying
to do things differently more recently? If yes, can you talk to us about it?
In the interview, the concept of time was crucial. Past and present choices were relative to
the starting date of the pension. The approximate starting date of the transfer was
considered as the benchmark for comparing investments.
While in the initial discussions with each households we described the research, obtained
(digitally recorded) their consensus and collected some socioeconomic information on the
pension, the word ‘pension’ was banned in our subsequent interviews and used only if the
household mentioned it first. The records of the local office of the Ministry of Social
Welfare on the start of the pension for each households provided a way to crosscheck the
information collected in the initial discussions with the households, and informed the
design of the Past/Present Question: Earlier you mentioned schooling. Can you talk a bit more
about it? Let’s say four-five years ago? And later on: What about more recently?
The selection of ‘topics’ (household’s dimensions such as education, health, savings and so
on) discussed in the interview, was not the result of an a priori decision. Rather, it resulted
from an initial open question, during the first round of interviews, where the households
were asked to talk about their household’s life and history. Based on what they mentioned,
the topics were selected. For instance, if the households started discussing about the
employment status and health issues, employment and health became ‘topics’ of the
focused discussions, where their behaviour and factors that affected their investment
behaviour would be explored.
This research has developed explanatory models and advanced theoretical development for
three dimensions only, namely savings, education and health. The decision to focus on
these dimensions was made after the preliminary analysis of all interviews. This means that
information gathered from the field also included other important dimensions, including
employment, credit seeking and investments in productive activities. Prioritizing three out
of six dimensions was dictated by the extensive time required to developed explanatory
models and advanced theoretical development (Phase seven).

103
Table 4.3: Dimensions discussed during the interview process
Dimensions discussed during the
interviews
Number of households that discussed
each dimension
Education* 35
Employment 22
Health* 31
Savings* 13
Credit 15
Productive investments (e.g. shops) 16
*Dimensions selected for this research
Source: the Author
Education and health were the most common ‘topics’ spontaneously discussed during my
first round of interviews and appeared to be the most important concern of all the
households interviewed45. In addition, the low amount of the cash transfer of the OAA
and the same fact that the transfer targeted the elderly that are often seen as key actors in
the education of the youngsters and beneficiary of any health measure, suggested the need
to prioritize them for developing explanatory models and advanced theoretical
development.
By contrast, savings was not one of the common ‘topics’ discussed (Table 4.3). However,
during the preliminary analysis I identified how external incentives (e.g. savings –somiti-
committees) and other factors such as trust and conformity played a major role in
determine household investment behaviour. What the preliminary analysis identified
seemed an element of novelty in the literature and was raised to one of the three
dimensioned prioritized for the theoretical development with the support of Nvivo.
Table 4.4 gives an overview of the multi-sessions interview process
45 The role of education and health is critical in shaping broader human development indicators. For example, the importance of education goes well beyond merely being educated; it has implications for employment opportunities and therefore plays a critical role in shaping income poverty. Lack of sufficient education also means lack of political voice in the form of participation in political decision making. And as people get politically excluded, they may also become socio-economically excluded in the distribution of valuable public resources which can in turn entrap them into poverty.

104
Table 4.4: the Interview process with individual households
The Interview Process with Individual Households
Invitation to
participate
After the ‘rapid survey’ in each area, about 15-17 families were
selected. They were visited to identify if some basic conditions
needed to initiate the process existed, and, if appropriate, invited to
take part in the interview. On average, only 10 fulfilled the criteria
and/or accepted to take part in the interview
Socio-economic
survey
A two-page socioeconomic survey on the number/age of family
members, employment status, and expenditure was conducted.
Often this was applied in conjunction with interview one
Interview one
Interview one included questions to initiate the discussion and
identify ‘topics’ to be explored in detail in relation to past and
present behaviours and key factors that have influenced changes.
The time reference (past/present) was the starting date of the
pension. Questions on the pension where deliberately avoided to
reduce its influence on the answers.
Interview two Interview two was a continuation of Interview one. In some cases,
interview one and two were held in the same session.
Preliminary analysis – reflections over the household’s behaviour over time, - concept and
relationship identification – new lines of enquiry developed
Interview three
After the preliminary analysis of the interview process up to
interview two, additional questions/issues to be clarified were posed
to the family. During interview three, as a thank you gift for their
patience, an A4 size picture of their family was delivered. In some
cases, if interview one and two did not require any further
information or explanation (theoretical saturation), interview three
was not implemented (eight households out of 43) and the
households were visited briefly to be thanked and delivered the
photograph.
Source: the Author
The interview process incorporated an important analytical stage, the preliminary analysis,
which informed the following interview sessions. The back and forth process, between the
field level data gathering and the analysis of the data that would inform the following step,
it is a key element in GT.

105
4.3.4 Phases Four & Five: Preliminary analysis, ‘double-back steps’ and the
opportunity structure
The preliminary analysis was meant to reflect on the data collected during the interview
sessions one and two, and to explore further important concepts during the interview three
and, later on, in focus groups discussions. The preliminary analysis examined the
investment behaviour, however, of individual households. It was not a comprehensive and
thorough investigation of all field interviews; this occurred during the final analysis. Each
preliminary analysis, though, helped shaping the preliminary analysis process of other
households by informing a more focused coding in search for more events or incidents to
compare and contrast early concepts emerged.
During the preliminary analysis, the text of the interview was ‘fractured’, ‘coded’
(substantive coding) and analyzed. The microanalysis was reflected in the *.doc files of the
transcribed interviews by using different formatting options (font colour; text highlight
colour; comments). The results of the preliminary analysis also informed the ‘theoretical
sampling’ of areas and households for the successive stages.
The preliminary analyses consisted of two stages of microanalysis of the text. The first
stage dealt with identifying households’ choices over time and preparing a simple table to
identify if additional information were needed to complete the comparisons. At this stage,
the recorded behaviour of the interview is ‘reduced’ into real choices, individual decisions
made by the households. As mentioned earlier, the recorded behaviour is not a datum per
se. A datum is the interpretation of the information. Choice or the real decisions taken are
the data that are interpreted and extrapolated by the recorded behaviour. Questions I have
used during this stage of the analysis were: What are the investment choices the household has taken
in relation to education (or health/savings) before the start of the pension? What investment choices have the
household taken in relation to say education after the start of the pension?
The second stage attempted to identify important factors that have influenced and had a
role in more recent choices the household took in relation to specific dimensions. For
example, on education, if during the interview and the preliminary analysis we identified
that the household had opted for hiring a private tutor –and this was not done previously
for other children, the preliminary analysis would attempt to identify the reasons behind
this change in investment behaviour. Doing so meant proceeding with a microanalysis of
the text by applying a series of questions which would drive the coding and
concepts/relationship identification. Typical questions that supported the microanalysis
106
included: Has the household behaved differently since the start of the pension? If changes occurred, how can
we classify these choices: have they opted for more or less investments? Why have the households changed (or
not) and opted for different investments after the start of pension? What are the key factors that have
facilitated/constrained these investments? What are the conditions under which these factors function?
By searching for the answers to these questions, I was able to record initial comments,
highlight concepts which would both develop into new question during interview three and
focus groups discussions (theoretical saturation), and into Nvivo ‘nodes’ and ‘nodes
structures’ during the final analysis46. This, in turn, contributed to discovering more
complex categories and relationships during the final analysis.
The preliminary analysis was instrumental in identifying an important process that framed
following data gathering steps and analysis. A clear distinction between investment
preference and investment behaviour and how these are linked and sequential emerged. It
has taken the form of simple statements such as: ‘I would have liked to or I wanted to.......
but I could only do....’. The distinction between household investment preference and
investment behaviour is central to this research. The analysis of the data portrays that what
is observed as an investment that a household reveals is the result of a two stage process –
what I define as the ‘process of realization’.
The first stage corresponds with the process of ‘constructing’ the investment preference of
the household, which, in the example above, refers to the ‘how and why’ the household is
now keen (prefer) to send their child to year 10. Here, I have identified the factors that
shape households’ defined preferences and how these factors interact.
The second stage refers to the ‘realization’, ‘revealing’ the household’s choice, sending their
child up to year 10, as a choice determined by a set of factors which filter the investment
preference of the household. These factors function at the behaviour level only and do not
shape the household’s investment preference.
I call the set of factors which can filter the investment preference of the household, the
opportunity structure. I borrow this term from the ‘empowerment framework’ rooted in
the social exclusion literature as well as Sen’s work on social arrangements and unfreedoms.
In the empowerment framework, the opportunity structure is made of rules and norms
which negotiate with the individual agency and lead to empowerment (Narayan-Parker et
46 Nvivo software was used at a later stage of the research. The coding implemented during the preliminary analysis in Microsoft Word, were later on transferred in Nvivo

107
al., 2007a). The opportunity structure is ‘the hidden and visible battlegrounds where poor
people strive to realize their aspirations. These battles take place both in the real world of
public, market, civic, and family life and in the more hidden or symbolic world of
competing values and norms that shape what people believe and do not believe and what
they perceive they can and cannot do’ (Narayan-Parker et al., 2007a: 13).
The empowerment framework suggests the existence of a continuum-causal pathway
between its two dimensions, the individual agency and opportunity structure that lead to an
outcome such as escaping from poverty. The individual agency can be explained as their
aspirations, their decisions, or as Narayan-Parker et al. state, as ‘people’s ability to act
individually or collectively to further their own interests. In this discussion, it is about men
and women having the means to envision and make choices that can lead to their escaping
poverty’ (Narayan-Parker et al., 2007a: 15). Agency is about formulating preferences
towards choices which can lead to the desired outcome if the opportunity structure
enhances peoples’ ability to translate their preferences into reality.
The economics and psychology literature tend to underestimate the interaction between
agency and opportunity structure. Much of this literature suggests that the individuals
internalize social structures and other factors of the opportunity structure and reassess and
change their preferences and aspirations accordingly. In contrast, sociologists and
anthropologists recognize that individual aspirations and preferences can be insignificant
unless an enabling opportunity structure exists (Narayan-Parker et al., 2007a, Narayan-
Parker et al., 2007b).
The usefulness of the concept of ‘opportunity structure’ requires some further
explanations. The opportunity structure is, in this research, a set of factors that filter the
preferences of the households and determine the extent to which their preferences are
realized. Similarly to the empowerment framework, the opportunity structure incorporates
issues of social exclusion and marginalization, external to the households. Nevertheless, in
this research, the concept of opportunity structure also incorporates factors that are
internal to the households, such as availability of financial resources. The opportunity
structure includes factors that only function at the behavioural level and which can both be
internal to the households (such as availability of financial resources) or external to it
(exclusion from political or economic processes). It incorporates factors that determine the
realization of a preference or intention, not its construction.
Based on the work in Narayanganj, I have developed a general model (Figure 4.3) for this
process of realization. This model was developed after a preliminary analysis of the data
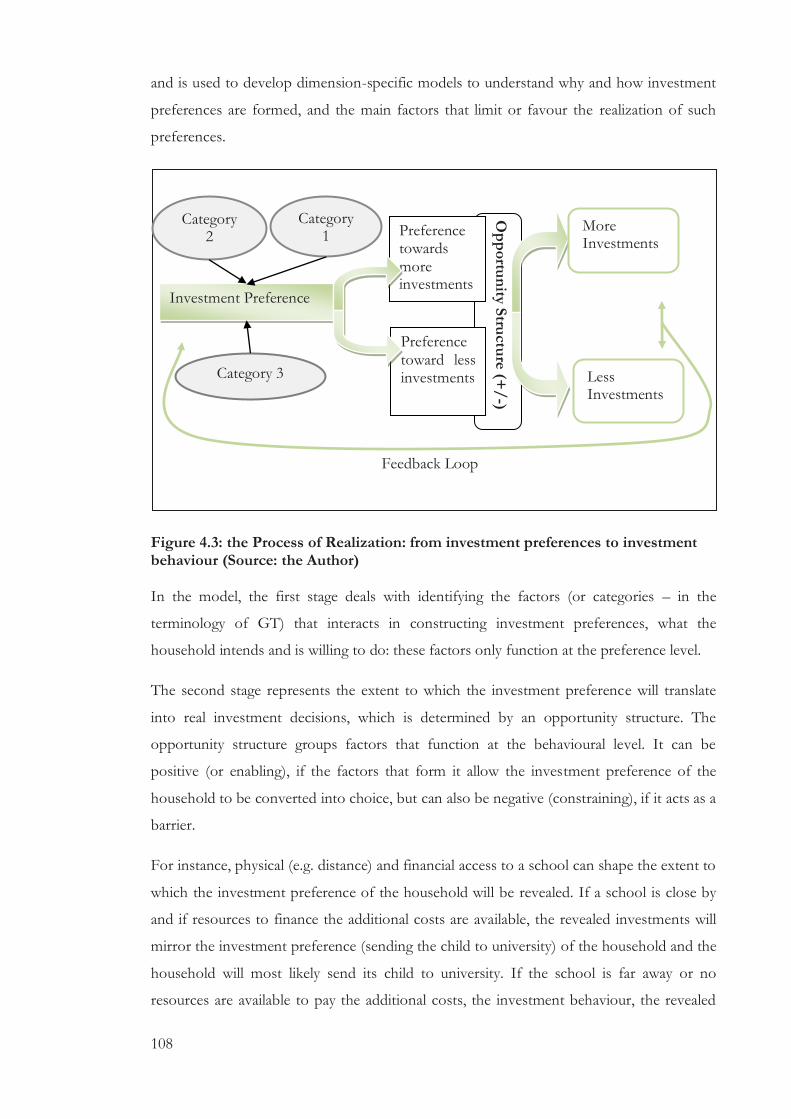
108
and is used to develop dimension-specific models to understand why and how investment
preferences are formed, and the main factors that limit or favour the realization of such
preferences.
Figure 4.3: the Process of Realization: from investment preferences to investment behaviour (Source: the Author) In the model, the first stage deals with identifying the factors (or categories – in the
terminology of GT) that interacts in constructing investment preferences, what the
household intends and is willing to do: these factors only function at the preference level.
The second stage represents the extent to which the investment preference will translate
into real investment decisions, which is determined by an opportunity structure. The
opportunity structure groups factors that function at the behavioural level. It can be
positive (or enabling), if the factors that form it allow the investment preference of the
household to be converted into choice, but can also be negative (constraining), if it acts as a
barrier.
For instance, physical (e.g. distance) and financial access to a school can shape the extent to
which the investment preference of the household will be revealed. If a school is close by
and if resources to finance the additional costs are available, the revealed investments will
mirror the investment preference (sending the child to university) of the household and the
household will most likely send its child to university. If the school is far away or no
resources are available to pay the additional costs, the investment behaviour, the revealed
Investment Preference
Category 2
Category 1
Category 3
Op
po
rtun
ity Stru
ctu
re (+
/-)
More Investments
Preference towards more investments
Less Investments
Preference toward less investments
Feedback Loop

109
choices (sending the child to school) is unlikely to mirror the investment preference
(willingness to send their child to school), especially in contexts where external support is
not available.
This is a dynamic model that links the two stages through a ‘feedback loop’47. This
feedback loop encapsulates the way a household learns from its own choices, which itself
also determines how preferences are constructed. In the dimensions examined in the next
three chapters, the feedback loop is represented by the concept of experience as a
determinant of a household’s investment preference in savings, education and health. For
instance in the saving dimension, negative experiences such as losing savings due to
misappropriation, lead to more cautions savings preferences. Instead, positive experiences
such as savings being returned at the end of a five years cycle with a good interest rate,
contribute to cement their preference towards saving more. In the education dimension,
the feedback loop is a process of learning and self-reflection from their own life experience
(of deprivations) and interpretation on how their lives could have changed. In the health
dimension, the feedback loop is the result of their own experience, as well of their families
and friends, which contributes in determining the preferences for prioritizing a health event
and strategies for addressing them.
The distinction between investment preference construction and its realization permeates
this research and the way the next empirical chapters are structured. The GT used in the
research has provided a framework for examining and explaining changes in households’
investment preferences as well as their revealed behaviour. It also guided the identification
of ‘conceptual categories’ -concepts which have a major explanatory value and can
explicate ideas, events and processes in the data (Charmaz, 2006: 91)- and the development
of a model with the explanatory power of the basic social process that is being discussed:
riskier households’ investment preferences and behaviour.
In some cases, categories can only explain revealed investment choices, in other only
investment preferences, but in some other are fundamental in understating and explaining
both, the revealed choice and the household preferences.
4.3.5 Phase 6: Focus group discussions
47 The ‘feedback loop’ is represented in fig. 4.3 by an arrow from the revealed investment choices back to the stage of the investment preference. As explained in the text, the feedback loop assumes different meanings in each of the dimensions examined. To maintain the simplicity of the specific model developed in Chapter Five, Six and Seven (Fig. 5.6; Fig 6.3 and Fig. 7.1), I have opted not to incorporate the ‘feedback loop’ arrow in the three figures.
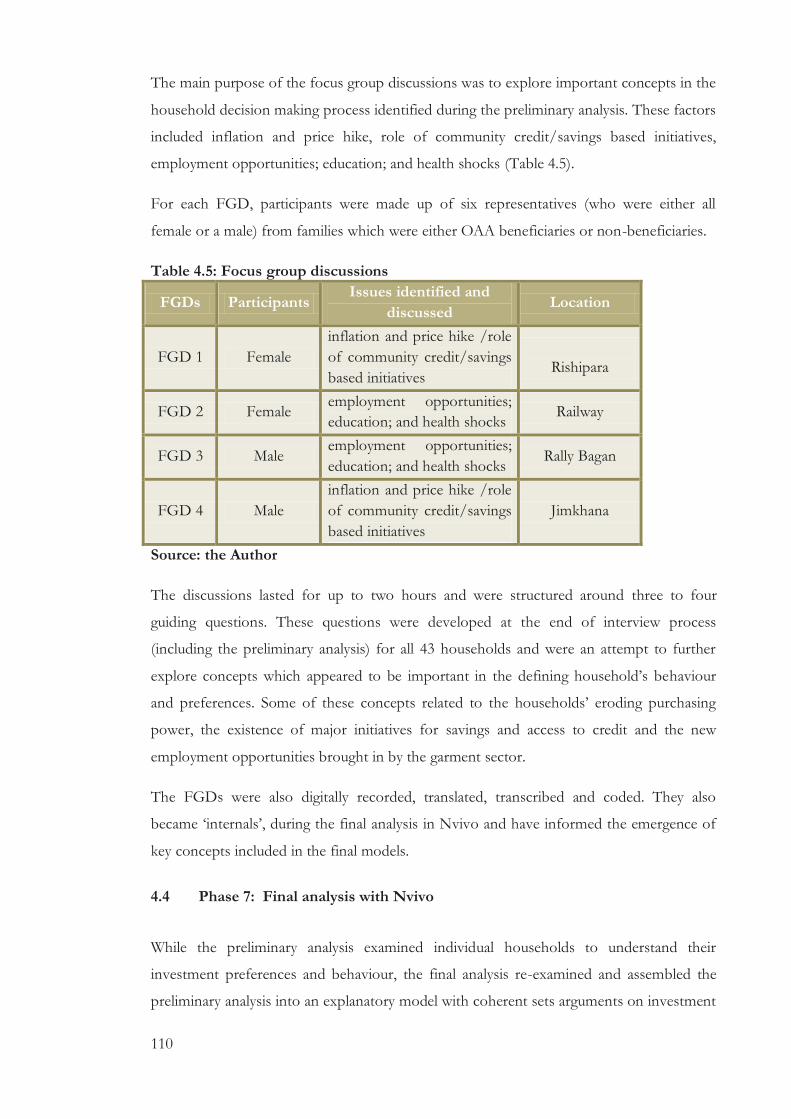
110
The main purpose of the focus group discussions was to explore important concepts in the
household decision making process identified during the preliminary analysis. These factors
included inflation and price hike, role of community credit/savings based initiatives,
employment opportunities; education; and health shocks (Table 4.5).
For each FGD, participants were made up of six representatives (who were either all
female or a male) from families which were either OAA beneficiaries or non-beneficiaries.
Table 4.5: Focus group discussions
FGDs Participants Issues identified and
discussed Location
FGD 1 Female
inflation and price hike /role
of community credit/savings
based initiatives
Rishipara
FGD 2 Female employment opportunities;
education; and health shocks Railway
FGD 3 Male employment opportunities;
education; and health shocks Rally Bagan
FGD 4 Male
inflation and price hike /role
of community credit/savings
based initiatives
Jimkhana
Source: the Author
The discussions lasted for up to two hours and were structured around three to four
guiding questions. These questions were developed at the end of interview process
(including the preliminary analysis) for all 43 households and were an attempt to further
explore concepts which appeared to be important in the defining household’s behaviour
and preferences. Some of these concepts related to the households’ eroding purchasing
power, the existence of major initiatives for savings and access to credit and the new
employment opportunities brought in by the garment sector.
The FGDs were also digitally recorded, translated, transcribed and coded. They also
became ‘internals’, during the final analysis in Nvivo and have informed the emergence of
key concepts included in the final models.
4.4 Phase 7: Final analysis with Nvivo
While the preliminary analysis examined individual households to understand their
investment preferences and behaviour, the final analysis re-examined and assembled the
preliminary analysis into an explanatory model with coherent sets arguments on investment
111
preferences and behaviour, on the enabling and constraining factors, and on the specific
role of the OAA.
To complete the microanalysis of the ‘finished’ interviews, which also included text from
interview 3, this research used Nvivo, a Computer Assisted Qualitative Data Analysis
Software (CAQDAS), to bring to the analytical process transparency and rigour as well as
to increase the effectiveness of the learning from the data. The Nvivo software package
includes tools that operationalize GT approaches and that contribute to advancing
theoretical development, from concepts specific to individual households to a more
abstract explanatory model. The analysis involved several steps such as importing data
(interview transcripts), transforming the socioeconomic information into attributes for each
interview/case, re-examining and re-coding the text through ‘virtual free nodes’ to help
identify concepts, relationships and categories and develop models.
These steps and how the different tools in Nvivo have been used, have been fully
integrated in Chapter Five to explain in detail how the final analysis and advancement in
the theoretical development with Nvivo (Phase 7) occurred. I decided to do so first, to
increase transparency and trust in the process (Bringer et al., 2004, Bringer et al., 2006,
Hutchison et al., 2010, Johnston, 2006), and secondly to demonstrate how the overall
approach to the research is innovative and appropriate for the phenomena being studied.
4.5 Fieldwork challenges and ethics
4.5.1 Fieldwork challenges
The fieldwork for the research took place in Bangladesh. Bangladesh has made
considerable progress in all development indicators and is on the way to becoming a
middle income country by 2021. Bangladesh is however still exposed to the risks of a
fragile democracy where the main political parties are still divided by a history of war,
killings and vengeance. During the fieldwork, this was felt on several occasions. While I
was based in a residential area of Dhaka, which marked a borderless division between the
political reality of Bangladesh and foreigners’ lives, during our regular journeys to
Narayanganj, around 35 kilometres from Dhaka, we were exposed to several risks,
including political turmoil.
Eight hartals, general strikes, were called during the 11 months fieldwork, for different
reasons and by different actors, including political parties and other economic groups. In all
these occasions, the travel and work in Narayanganj was suspended for the day of the event
112
as well as for the day before and after. During these days, myself and my assistant worked
on translating, transcribing and undertaking a preliminary analysis of the interviews. To
avoid any travel within Dhaka as well, a free synchronization software (Syncplicity) was
used to work with my assistant while sitting in different locations of the city. Also, as most
of the hartals were called during the working week (Sunday to Thursday), most of the work
in the field occurred during the weekend. This also had an added value, as most members
of the households, including the main income earners, were not usually working, at least on
Friday.
Travelling regularly between the city of Dhaka and Narayanganj, exposed us to another
major risk: road accidents. A part form the dense traffic which turned a journey which
would only take 45 minutes into a two to three hours one, Bangladesh is known for its
poor road safety48. We avoided using public transport and used a private car with a known
driver hired for the specific days of our work in Narayanganj. This also had some
important financial implications, however.
Finally, during the third month of the fieldwork, after a discussion on the working
conditions, myself and the research assistant mutually agreed to terminate our
collaboration. The recruitment and training of the new assistant impacted the scheduled
work as I had to train him on the research process (mostly interviews as well as on the
transcription and management of information) and introduce him to the communities. The
time lost during this transition was however soon regained. The new assistant in fact was a
very able translator and skilled in transcribing interviews. In addition, his commitment and
respectful way of dealing with the communities, speeded up his familiarization with all
stakeholders.
4.5.2 Ethics
The research was approved by the Ethics Committee of the University of Manchester. In
addition to making it fully known to all respondents that their participation was entirely
voluntary, ensuring the anonymity and confidentiality was a major priority throughout the
research. For instance, only one password protected excel document exists on the real
identity of the participants of the interview process for the households targeted by the
48 Statistics from the Road Safety Cell (RSC) of the Bangladesh Road Transport Authority (BRTA) show the annual fatality rate in road accident in Bangladesh is 85.6 per 10,000 vehicles which compares to rates of below three per 10,000 vehicles in most developed countries; http://www.crp-bangladesh.org/index.php?option=com_content&view=article&id=92&Itemid=107 (accessed 28 April 2012)

113
OAA. The document, which incorporates all the socioeconomic data of each household,
also includes a unique identification number and a fictitious name. The *.doc files with the
transcription of the interviews do not include any name, but just the ID numbers. It was
these same ID numbers that I also used during the recording of the interviews. Even the
Nvivo project does not include the real names of respondents, but rather fictitious ones.
This means that both the Nvivo project (which incorporates both interviews and the
record of the analysis) and the digital recording (in bangla) could be disclosed without
compromising the anonymity of the households interviewed.
All households as well as key informants took part in the research on a voluntary basis. The
recruitment of households tested in the pilot phase, was however adapted and redesigned.
As mentioned earlier, inviting households to an introduction session on the research and
approaching them two weeks later to explore their availability, did not succeed: nobody in
fact attended the introduction session. In discussion with the supervisory team, I
approached, after a quick survey and with the support of community members and social
welfare office, individual households, explained the research (providing as well a one page
research summary in bangla), and invited them to participate. Two weeks later, I visited
them again and discussed if they were willing and available to take part in the interviews,
underlining that they might exit the process at any moment in time.
4.6 Conclusions
This chapter has shown how the GT approach was adapted to investigate the role of one
of the largest social assistance schemes in Bangladesh, the Old Age Allowance Programme
(OAA), in shaping poor urban households’ investment behaviour. The GT was adapted
into a seven-phase data collection process, which operationalized its main structural
characteristics, such as purposive sampling, substantive and theoretical coding, continuous
questioning of data, comparison and contrast of the identified concepts, theoretical
saturation. Through applying the sequential steps of the GT, household investment
behaviour emerged as a two stages process of ‘constructing’ investment preferences (what
they are willing to do), and of ‘realizing’ or ‘revealing’ household choices (what they actually
do). By carefully distinguishing the two stages, I have identified an opportunity structure
that filters the investment preferences and determines to what extent these preferences will
be realized as investment behaviour. This approach provides deep insight into the several
factors that play a part in constructing and changing investment preferences and others that
favour or constrain their realization.
114
CHAPTER 5. Households’ Savings Preferences and Savings
Behaviour: a role for the Old Age Allowance?
5.1 Introduction
This chapter examines the investments in savings by poor households in Bangladesh, and
explores the potential role of social assistance interventions in shaping such investment
decisions. The main aim here is to answer the first two research sub-questions (section
1.2). More specifically, it seeks to identify the factors that enable or constrain urban
households in opting for more investments and in engaging in riskier and higher return
choices with a specific focus on savings. Chapters Six and Seven will explore similar issues,
focusing on the education and health dimensions.
In addition, this chapter integrates to the empirical findings on savings, the steps that were
taken to operationailze the GT in the qualitative software Nvivo. The section has been fully
integrated in the savings dimension and explains in detail how the final analysis and
advancement in the theoretical development with Nvivo (Phase 7) occurred. I have decided
to do so first, to increase transparency and trust in the process (Bringer et al., 2004, Bringer
et al., 2006, Hutchison et al., 2010, Johnston, 2006), and secondly to demonstrate how the
overall approach to the research is innovative and appropriate for the phenomena being
studied.
One important point needs to be made here. This research is about social assistance and
specifically about the OAA scheme in Bangladesh and to what extent it may shape
household’s investments. In line with the GT framework, I do not discuss exclusively the
specific pension scheme under investigation here (i.e. the OAA in Bangladesh). Rather, this
chapter deals with all possible factors that may shape household investments of which the
OAA is only a part. This is a central aspect of the GT approach, which attempts to
discover concepts that ‘emerge’ from the fieldwork, without imposing or suggesting lines
of enquiry.
In the analyses that follow, it will be seen that the pension is only part of the broader
category of additional financial resources that shape households’ savings practices. These
caveats notwithstanding, I have added a section at the end of each dimension that deals
with the pension specifically. Here I start questioning the model and go back to the row
data in Nvivo to understand how the pension functions in this model.

115
The chapter is arranged as follows. It starts with a brief introduction to the specific
dimension of savings and provides clarifications on the key terms that underpin the
analyses. This is followed by the description of each category and its functioning in
relation to the household’s investment preferences and behaviour. After examining each
category, I move forward in integrating them into a model which provides a simple, yet
comprehensive understanding of how these works in shaping household’ investments
behaviour. Rather than ‘theory’, in this research I often refer to ‘an explanatory model’, that
facilitates the understanding and therefore, the explanation of a basic social process.
5.2 Household’s savings preferences and savings behaviour
Savings, the act of deferring current consumption (Cordes, 1990: 273), is an essential
element in understanding how the economy works as it supplies the resources for
investments in future production. But do all households save? Savings practices have been
linked to the availability of financial resources, leading to claims that households living in
poverty do not save. The myth that the poor cannot save has however been increasingly
challenged. For instance, the seminal work from Collins et al. (2009) and Rutherford
(2000) in India, Bangladesh and South Africa, highlights the centrality of savings for
households living in poverty : ‘Far from living hand to mouth, consuming all income as
soon as it arrives, they keep savings at home; join savings clubs and savings-and-loan clubs;
transact with family, friends, neighbours, and employers; and, where doing so is feasible
and attractive, sign on with formal licensed providers’ (Collins et al., 2009: 184).
In Bangladesh, the proverb 'mushthi chaal' encapsulates what savings means for low income
households. Literally it means ‘handful of rice’ which women ‘save’ while cooking a meal to
address potential future food shortages. This tendency is at the base of many innovative
financial inclusion schemes initiated in Bangladesh by organizations such as the Grammen
Bank or BRAC (Rutherford, 2009).
Why individuals and families save, what are the determinants that influences the
household’s savings choices, are important questions that different disciplines have
answered differently and to some extent the next sections will attempt to provide insights
on this process. In economic theory, one of the earlier and most important contributions
to understanding the main determinants of savings, what drives individuals savings
decisions, has been Keynes’s psychological law. Keynes (1936) identified eight savings
motives (foresight, precaution, independence, enterprise, calculation, improvement, pride
and avarice) which were assumed to be stable over time and that therefore changes in
116
income alone explain savings and consumption. Keynes’ work has influenced the
development of other economic theories such as the absolute income hypothesis, the
relative income hypothesis and more importantly what it is still currently considered as a
backbone of modern economics, the Life-cycle Hypothesis (LCH). Modigliani’s seminal
work on the LCH (Modigliani, 1986) in the fifties and Friedman’s permanent income
hypothesis, propose a basic framework where self-interested and rational individuals take
resources allocation decisions on savings and consumption based on available current
income and long term (future) income, in an attempt to maintain a consistent standard of
living throughout their lifetime. In anticipation of decline of their future income after
retirement, individuals will tend to save more in the earlier age when income is higher, and
use their savings (dis-save) in their later years of their lives, when their income is less. The
basic assumption of the LHC is that the only motive for savings is to fund consumption,
the retirement motive (Ando and Modigliani, 1963). The empirical validity of the basic
hypothesis has been criticised by both economist and non-economists, suggesting that the
LCH cannot explain actual savings behaviours of individuals which, for instance, do save
after their retirement age and that motives, other than the retirement motives, interact to
shape the individual’s savings behaviour (Wärneryd, 1989: 526-7; Cordes, 1990: 275;
Binswanger, 2012; Binswanger and Carman, 2012).
Behavioural economists and cognitive psychologists have also since the 1970s started
investigating and proposing alternative formulations on models that incorporate
psychological insights in explaining savings behaviour (Wärneryd, 1999; Binswanger, 2010).
Katona’s work (Katona, 1975) is very important in this line of thought. Katona’s
proposition is simple: savings behaviour is determined by, on one hand, the ability to save,
which correspond to the actual availability of financial resources for savings and, on the
other hand, by the willingness to do so (Wärneryd, 1989: 532).
Katona’s work is also important for the development of what is known as the behavioural
life-cycle hypothesis (BLCH) by Shefrin and Thaler (1988), which incorporates three
behavioural features often overlooked in economic analysis: self-control; rules and mental
accounting and framing. Another important contribution to understanding savings
behaviours is the application of Maslow’s work (1943) on the hierarchy of needs, on
savings motives. Maslow’s hierarchical and sequential models has been used by Xiao (Xiao
and Anderson, 1997; Xiao and Noring, 1994) in suggesting that individuals and households
have a variety of financial needs that are pursued in sequential and hierarchical order. In his
work, he identified six groups of savings motives which interacts with socioeconomic
characteristics of the households and determines the sequencing and hierarchy of financial
117
needs. In low income households for instance, the day to day savings motives
corresponded to the deficit need, in higher income households the deficit need
encompassed other savings motives such as retirement and saving for children (Haron et
al., 2013).
The recent work from Starr (2009) also exposes an important limitation of much of the
research on savings behaviour. Using Veblen’s view on the economic behaviour of
individuals and households and cultural transmission of behaviour, Starr suggests that
savings behaviour is defined by conformity within the social group during the different
stages of anyone’s life cycle.
In line with the distinction between investment preferences and investment behaviour
(Chapter Four), this section explores the factors that shape household’s savings preferences
on the one hand, and of their revealed savings choices on the other. The households’
savings preferences and savings behaviour are derived by comparing their preferences and
behaviour in the past, before the start of the pension, and in recent times. After this
comparison, a more in depth discussion with household members helped me to identify
why certain changes occurred or not in both their savings preferences and savings
behaviour.
It is important to point out that households have consistently discussed not just about
savings in general, but mostly about their savings preference and choices in the context of
participating in local ‘Somiti (savings)’ committees, set up in Narayanganj since early 2000.
‘Somiti’ in these areas has become synonymous with savings, and has replaced all forms of
formal (banks or other private institutions that offer financial services to the poor, such as
BRAC or Prodipon) and informal savings mechanisms (such as piggy banks). The ‘somiti’
committees are initiatives of the Government of Bangladesh and other development
partners to address urban poverty in major centres in Bangladesh. The latest project, part
of this initiative, is the Urban Partnerships for Poverty Reduction (UPPR). Initiated in
2008, the project builds on the experiences of the earlier UNDP funded Local Partnerships
for Urban Poverty Reduction Project (LPUPAP) launched in 2000. These projects have
been implemented by UNDP staff and the local authorities of selected cities, and
supervised by a national project office in the Local Government Engineering Department,
and the Local Government Division of the Ministry of Local Government, Rural
Development and Cooperatives.
Initiating and operating community-run savings society (Somiti) is one of the pillars of
these urban poverty reduction initiatives. Setting up a somiti and acquiring members, is one

118
of the major activities of the Community Development Committee (CDC). Each member
of the committee is required to deposit 10 taka per week during the first year and 20 taka
per week during the second. This pattern continues till the last and fifth year, when the
amount increases to 50 taka per week. At the end of the 5-year cycle, the members receive
their savings plus interest and have the option to initiate a new cycle of savings. Group
leaders from the communities are responsible for collecting the weekly deposits whiles the
monies are kept in a bank account jointly opened in the names of core CDC leaders.
Members of the somiti have also access to credits at interest rates below the market rate
and could even have access to their savings in cases of emergency. The set-up of CDC and
somiti was a precondition to additional benefits for all communities involved.
Infrastructure improvements of drainage systems, toilet facilities as well as health
awareness, education and employment generating activities were some of those benefits.
Somitis have changed the way households save, and their importance in the community
and in their life is clear across all household’s dimensions in relation to, for instance, the
access to credit for investments or health emergencies.
5.3 Categories in the savings dimension
This section introduces and explains the process of ‘discovering’ categories, or factors, and
their role in shaping savings preferences and behaviour. As mentioned earlier, , here I also
offer a detailed step by step description of the process and tools used in Nvivo to support
the final analysis.
Early concepts and relationships between concepts have been identified throughout the
field work and the preliminary analysis. They informed the sampling of the households to
be interviewed, areas to be visited as well as the questions to be asked in the last sessions of
the interviews. In the final analysis, advanced analytical techniques have contributed to
moving from individual household level understanding to conceptual and theoretical
development, by identifying core concepts and raising them to the level of categories, by
identifying their dimensions such as contexts, processes and outcomes and how these relate
to each other in an explanatory model.
The analysis of the data consisted in a two-step process, a preliminary analysis and a final
analysis. The preliminary analysis (phase four and five) has been described in Chapter Four.
It involved working on the each transcribed interview and identifying individual choices
and factors that have affected each individual household. The preliminary analysis was
119
completed during the fieldwork, after interview two, and was used to construct interview
three as well as to identify key discussions topics for the FGDs.
While the preliminary analysis examined individual households in an attempt to understand
their investment preferences and behaviour, the final analysis instead re-examined and
assembled the preliminary analysis into an explanatory model with coherent sets of
arguments on investment preferences and behaviour and on its enabling and constraining
factors, and on the specific role of the OAA.
To complete the microanalysis of the ‘finished’ interviews, which included also text from
interview three, Nvivo49, a Computer Assisted Qualitative Data Analysis Software
(CAQDAS), was selected to bring to the analytical process transparency and rigour as well
as to increase the effectiveness of the learning from the data. The Nvivo software package
includes tools that operationalize GT approaches and that contribute to advancing
theoretical development, from concepts specific to individual households to a more
abstract explanatory model.
The analysis through Nvivo, involved several steps such as importing data (interview
transcripts), transforming the socioeconomic information into attributes for each
interview/case, re-examining and re-coding the text through ‘virtual free nodes’ to identify
concepts, relationships and categories and develop models.
The transfer of data in Nvivo involved the importing the *.doc files in which the interviews
were translated and transcribed in the Source / ‘Internals’ folder of Nvivo (Figure 5.1).
Before the actual transfer, all the *.doc files had been revised and adjusted to make sure all
the formatting used to code (e.g. highlighting) would be compatible with Nvivo. When the
transfer was completed, 43 internals (grouped in a folder ‘Interviews’) in the Source section
of the Nvivo Project were generated. Each of the 43 internals has been labelled with a
fictional female or male name and the real area of their residency (e.g. Ambiya Rally:
Ambya is a female name of a household located in Rallybagan).
49 In addition to Appendix 8 (Nvivo’s report ‘Node classification summary’) additional Nvivo’s reports on coding, attributes and nodes can be viewed and downloaded from this dropbox folder: http://tinyurl.com/Ragno-Phd-UoM2014

120
Figure 5.1: From interview transcription to Nvivo internals (source: the Author)
Nvivo also allows transferring socioeconomic data and linking it to each interview (Figure
5.2). During the fieldwork, socioeconomic data were stored in an excel file where each row
represented one of the 43 households interviewed, while each column represented
information such as number of family members, expenditures etc. To associate the
socioeconomic data to the 43 internals –interviews-, the latter were transformed in ‘Cases’
and then to each of the cases selected attributes –socioeconomic data- were added. In the
attributes, some of the socioeconomic data where transformed in ‘ranges’: for instance,
while the excel sheet includes for family X, the exact information on expenditure, such as
1350tk per capita, the attribute casebook in Nvivo, places family X in a range between
1000 and 1500tk.
Figure 5.2: From the excel database to the Nvivo’s case attributes (source: the Author)
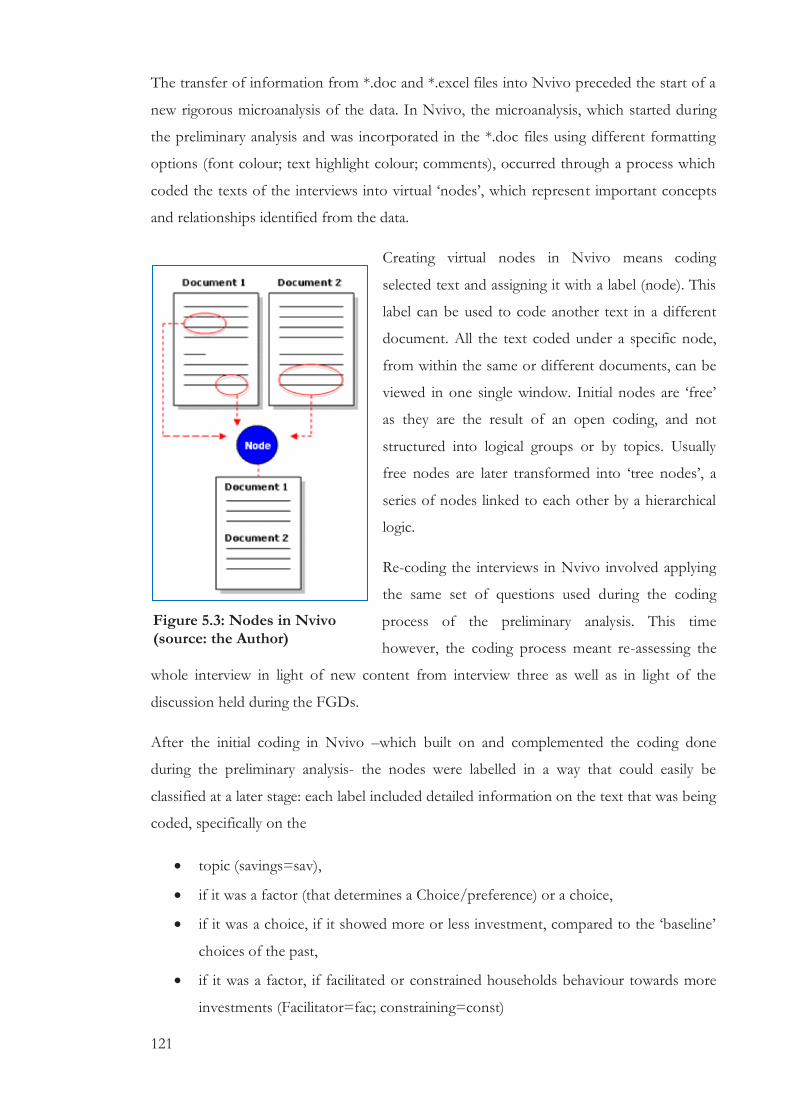
121
The transfer of information from *.doc and *.excel files into Nvivo preceded the start of a
new rigorous microanalysis of the data. In Nvivo, the microanalysis, which started during
the preliminary analysis and was incorporated in the *.doc files using different formatting
options (font colour; text highlight colour; comments), occurred through a process which
coded the texts of the interviews into virtual ‘nodes’, which represent important concepts
and relationships identified from the data.
Creating virtual nodes in Nvivo means coding
selected text and assigning it with a label (node). This
label can be used to code another text in a different
document. All the text coded under a specific node,
from within the same or different documents, can be
viewed in one single window. Initial nodes are ‘free’
as they are the result of an open coding, and not
structured into logical groups or by topics. Usually
free nodes are later transformed into ‘tree nodes’, a
series of nodes linked to each other by a hierarchical
logic.
Re-coding the interviews in Nvivo involved applying
the same set of questions used during the coding
process of the preliminary analysis. This time
however, the coding process meant re-assessing the
whole interview in light of new content from interview three as well as in light of the
discussion held during the FGDs.
After the initial coding in Nvivo –which built on and complemented the coding done
during the preliminary analysis- the nodes were labelled in a way that could easily be
classified at a later stage: each label included detailed information on the text that was being
coded, specifically on the
topic (savings=sav),
if it was a factor (that determines a Choice/preference) or a choice,
if it was a choice, if it showed more or less investment, compared to the ‘baseline’
choices of the past,
if it was a factor, if facilitated or constrained households behaviour towards more
investments (Facilitator=fac; constraining=const)
Figure 5.3: Nodes in Nvivo (source: the Author)

122
If it was a factor, the specific concept at stake (e.g. savings for son’s education)
The text was coded to follow this node structure, but I have also remained open to new
emerging concepts which would not fit into this structure.
The re-coding of all interviews and focus group discussions were the first step in advancing
theoretical development, which implies assembling the microanalysis of each household
towards the creation (discovery) of an explanatory model for the behaviours of households
targeted by the OAA in relation to their investment preferences and behaviour.
5.3.1 From concepts to categories
The re-coding process has generated a total of 453 nodes across the three dimensions.
Each node corresponds to specific concepts (factor) that influence the household
investment preference and behaviour.
All these nodes are ‘free’, which means that they are not linked in a hierarchy to a topic or
theme. The first step has been classifying all concepts in a tree structures which group
choices, facilitating and constraining factors by dimension as well as by their role in the
process, as presented in Figure 5.4.
Figure 5.4: Tree node structure in Nvivo (source: the Author)
In Nvivo, grouping concepts into a hierarchy is useful to initiate the process of moving
from specific events to higher concepts, what the GT approach refers to as ‘categories’.
Saving
Choice
Less (After)
More (After)
Before
Facilitating
Factor1
Factor 2
Factor 3
Constraing
Factor 1
Factor 2
Factor 3
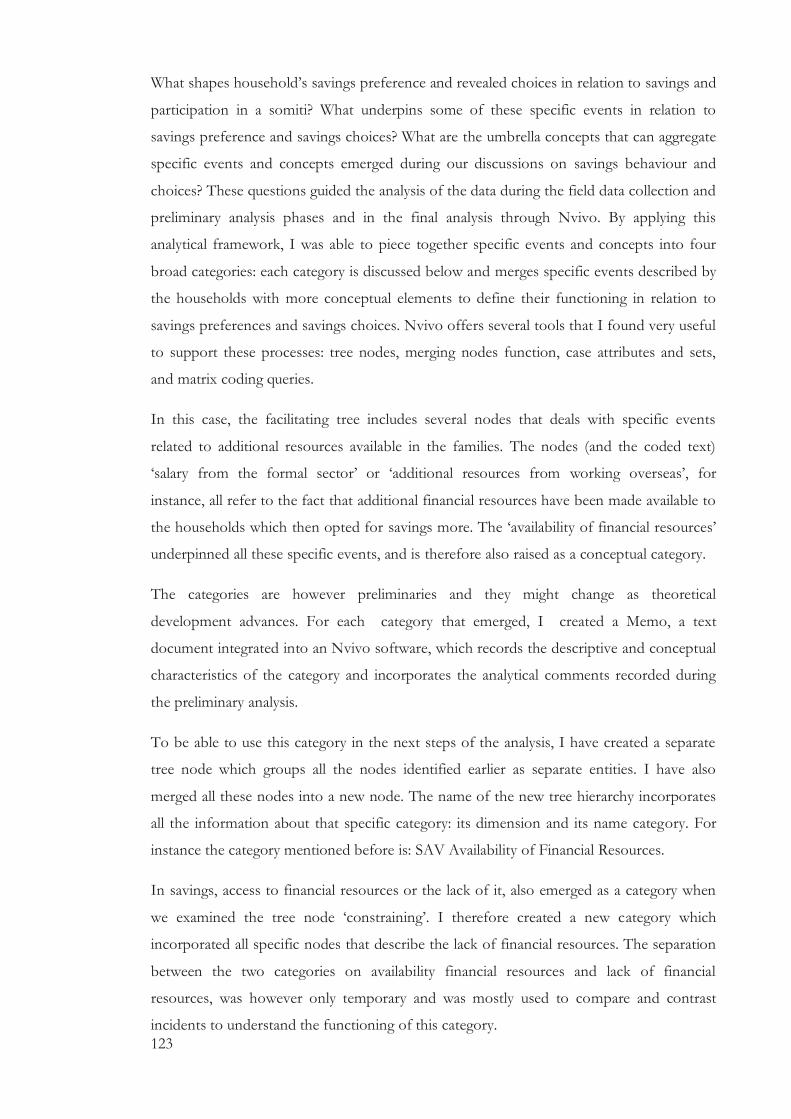
123
What shapes household’s savings preference and revealed choices in relation to savings and
participation in a somiti? What underpins some of these specific events in relation to
savings preference and savings choices? What are the umbrella concepts that can aggregate
specific events and concepts emerged during our discussions on savings behaviour and
choices? These questions guided the analysis of the data during the field data collection and
preliminary analysis phases and in the final analysis through Nvivo. By applying this
analytical framework, I was able to piece together specific events and concepts into four
broad categories: each category is discussed below and merges specific events described by
the households with more conceptual elements to define their functioning in relation to
savings preferences and savings choices. Nvivo offers several tools that I found very useful
to support these processes: tree nodes, merging nodes function, case attributes and sets,
and matrix coding queries.
In this case, the facilitating tree includes several nodes that deals with specific events
related to additional resources available in the families. The nodes (and the coded text)
‘salary from the formal sector’ or ‘additional resources from working overseas’, for
instance, all refer to the fact that additional financial resources have been made available to
the households which then opted for savings more. The ‘availability of financial resources’
underpinned all these specific events, and is therefore also raised as a conceptual category.
The categories are however preliminaries and they might change as theoretical
development advances. For each category that emerged, I created a Memo, a text
document integrated into an Nvivo software, which records the descriptive and conceptual
characteristics of the category and incorporates the analytical comments recorded during
the preliminary analysis.
To be able to use this category in the next steps of the analysis, I have created a separate
tree node which groups all the nodes identified earlier as separate entities. I have also
merged all these nodes into a new node. The name of the new tree hierarchy incorporates
all the information about that specific category: its dimension and its name category. For
instance the category mentioned before is: SAV Availability of Financial Resources.
In savings, access to financial resources or the lack of it, also emerged as a category when
we examined the tree node ‘constraining’. I therefore created a new category which
incorporated all specific nodes that describe the lack of financial resources. The separation
between the two categories on availability financial resources and lack of financial
resources, was however only temporary and was mostly used to compare and contrast
incidents to understand the functioning of this category.
124
5.3.2 Categories and their properties
What are the conditions and properties under which this category functions in relation to
the household preference and behaviour? Continuing with this example, additional
financial resources available to the households, appears to influence the household’s
behaviour in relation to savings. But additional resources do not necessarily allow the
household to opt for more savings. By comparing and contrasting the category on lack of
financial resources and the text coded at this node, I was able to understand how the
category ‘financial resource’ functions: for instance, additional resources available in the
households may contribute to more savings only if other immediate needs, such as
illnesses, are dealt with.
The comparison and contrast among concepts within categories is an attempt to better
understand their functioning. It can also generate additional questions which need to be
answered by going deeper in the data and
by using more advanced analytical
functions in Nvivo. For instance, is the
socioeconomic profile of the households in
some way linked to the way concepts relate
to each other in this specific category? In
other word, can the location of where they
live, or the number of earning members in
some way influence the way additional
financial resources impact the households’
behaviour? How important is the amount
of the new additional resources? While
some of these questions are generated by
comparing and contrasting these concepts,
others have emerged during the preliminary
analysis and informed the subsequent
sampling and questions.
During the preliminary analysis of one household, it was detected that, rather than the
amount of the additional resources entering the household, its relation with the overall
Figure 5.5: Households’ attributes in Nvivo (source: the Author)

125
household income seemed to influence to what extent households opted for more
investment in savings.
Nvivo allows linking quantitative data to cases (households’ interviews) and using them as
elements of comparisons to identify new or explain relationships. Using attributes in Nvivo
does not attempt to provide statistical predictions, rather, they are used to examine and
favour the emergence of additional properties of categories that can be further explored.
The type of socioeconomic information included as households’ attributes are listed in the
Figure 5.5. Nvivo also offers an option to create ‘sets’, groups of nodes or cases or
attributes to be used as analytical units in the analysis. For instance, I created four sets
which group households based on where they reside and used in analyzing if location may
have a role in opting for more savings. Here, the ‘Queries’ tool in Nvivo has provided a set
of easy to use options that can support answering the questions that arose during the
previous phases and helped the understanding of how a category functions and interacts
with other categories.
Starting form the next section, I have reported quotes from the households interviewed to
support concepts that have emerged during the research. These quotes are in italics and are
followed by the fictitious name of the respondent and the location: Parul (fictitious name)
Rail (Railway). I have decided not to include the dates of the interview since each
households has been visited multiple times. It is important to point out also that in some
cases, to facilitate the understanding of the quote, I have included the question that has
been asked in italic, underlined and preceded by the letter ‘Q’: Q. Who pays for private tutor?.
5.3.3 Availability of additional financial resources: the household’s savings
threshold
Intuitively, we might think that new or additional financial resources may lead households
towards more investments in their financial savings. However, the process of how the
additional financial resources determine savings choices is shaped by several circumstances
related to the age and size of the households, health needs and expenditures, among others.
While the source of these additional resources does not seem to have an impact on how
the resources are used in relation to savings, households appear to take savings decisions
based on their savings threshold. This means that if the net household income increases
and the household is above the ‘savings’ threshold, the additional financial resources may
translate into more savings, in terms of amount and participation in savings schemes. This

126
household’s savings ‘threshold’ determines the extent to which more savings are actually
realized.
For example, the earnings from four years of work in Kuwait of one family member,
additional income brought in by a households member entering the labour market, the
increased earnings coming from a change in employment as well as the fact that the head
of the household was able to work two jobs, have all contributed to initiate or maintain
their participation in savings schemes.
For the last four years, I have been saving 600 taka per month. This amount comes from one job
(carrying breakfast/lunch from a house to office). I started this job after quitting my previous job
where I was earning 300 taka. Now I don’t need to worry about my monthly deposit in the somiti
(Parul Rail).
I worked in two jobs simultaneously: the first one was riding rickshaw and the other one was
playing drums in festivals. I used to earn quite well doing this. I lived a good life and I was able to
save quite a lot of money (Shomir Rishi).
Financial resources that are not employment related (e.g. pension allowances), but which
constitute a considerable component of the overall household income can also enable a
household to reveal more savings. The experience of one interviewee underscores this
important point:
I sometimes in the past, I was not able to pay the deposit regularly or timely. So anytime I got
pension, I paid the instalments in advance. (Parul Rail).
The savings threshold is exposed to fluctuations: when the overall financial resources
available diminish, and the household goes below its minimum threshold, its savings
choices tend to change. This can result from several factors, including increased
households’ expenditure, or when a household member exits the labour market and begins
to depend on other members for survival.
I am not working any more, and so I am not able to save any money. The whole family survives
with my son’s income, so he cannot save any money. In the past, when I was working, I could earn
and save (Shomir Rishi).
The age structure of the household has a direct impact on the household’s threshold and
resources for savings. Elderly members who are no longer able to contribute, as well as
very large families with many children in school, may trigger a reallocation of resources

127
towards more immediate expenses.50 The following quotations from my field research
provide strong support for these observations:
We were not able to save few years back. Our family was huge, but it is smaller today and we are
now able to save. Before we were 13 members in our family, and all used to eat from the same pot.
I and my elder brother were the only one working, but he has now died. All my children were
school goers at that time (Srijany Rail).
Now I am not working. Now the demands of the family are increasing… I have to buy things
continuously while the prices of basic necessities continue to go up (Shomir Rishi).
We don’t have any savings now. I had some savings but everything I saved has been used for
medical treatments. As I already told you, suddenly I become sick when I was riding the rickshaw.
Then I managed to get a job in a garment factory. At that time I was able to save some money.
After working few years in the garment my health again deteriorated. So whatever I had saved so
far was gradually used for my health expenses and treatment. Every week I had to go to the doctor.
Every doctor visit costs 500 taka (Asma Jim).
The gender structure of a household also impacts the allocation of financial resources for
savings. The lack of regular, predictable income as well the absence of well paid jobs often
associated to working men, reduces the access to savings opportunities, but does not affect
their willingness to do so, their savings preference.
We always have the good practice that we want to change ourselves for the better. We are an all
female family. We don’t have any male member, a supporting hand, who earn for us so that we
could financially depend on him. Yes, we are ok now, we can cook our meal, but still we cannot
save a single penny for the ‘rainy day’, which help us when we are in problems (Khadija Jim).
Savings preference, the household’s willingness to save, does not seem to be influenced by
the lack or availability of additional financial resources and the savings threshold. Instead,
what the household reveals may change when the household income is not sufficient to
cover immediate needs. Reaching a household specific financial threshold may provide an
opportunity towards more savings, if changes in the age structure or the number of income
earners do not require a reallocation of the household resources towards daily basic
expenditures or recurring heath expenses, which, for instance, increases with elderly
members in the households.
50 Typical examples here can include the cost of medicines for chronic diseases, health emergencies, and education and towards the perceived price increase of staple food.

128
5.3.4 Setting individual goals and motivation from within
This section describes and conceptualizes how household savings preferences and
behaviour are determined by the goals that households set for themselves. The existence of
powerful ‘goals’ (motives) for which savings is directed to, contributes in shaping each
household’s savings preferences and choices. Notably, goals which are linked in some way
to close family members and tend to protect the children's education, marriage or more in
general, their future, shape the household’s preferences to save.
One day, after 40 years, I visited my village. There I discovered that my brother was still alive. He
told me that he was married, but very poor and in need of money. ... I started my maid job with a
salary of only 200 taka. Then I had to buy foods with that 200 taka. Meanwhile, I began saving
some money [to help my brother]. Sometimes I had to eat in other people’s houses; some other times
I simply did not eat (Parul Rail).
My children were in primary school and did not require a lot of money. The main objective behind
joining the somiti was to be able to withdraw credit instantly to meet their expenditures since now
my two children are studying in higher classes, which require additional resources than when they
were in primary grades (Aroti Rally).
We married off our two daughters without any money. We did not need any savings. But
nowadays you do, because the situation has changed. Without savings you cannot provide a good
dowry and you may not be able to marry your daughter. Now this is how it works and we have to
live with it (Tarek Jim).
Savings for the future well-being of the family, or for a meaningful purpose which is also
supported by traditions and customs (dowry), are major driving forces in shaping
households savings preferences. Similarly, maintaining the family united in the event of a
shock, including covering the costs of funerals, are strong motivational forces behind
households’ savings. As one interviewee explained:
I saved this money for my burial/funeral costs. I have no other people to pay, and the funeral will
cost more than five thousand taka. This daughter may contribute to the expenses, but I don’t want
them to fight over this after my death. (Marufa Rally).
The desire to support close family members implies that individuals are sometimes willing
to keep up savings plans, and sometimes drastically reducing their food intake in order to
save resources in the interest of other household members. The existence of clear, moral
and purposeful goals shape the way households approach savings. It can motivate

129
households to save and can even be as powerful to have an impact in the decision they
make in reallocating their resources from immediate needs towards more savings. A goal
needs however to be put into the context of the household and their life history.
Supporting a close relative (disabled brother) and his family and being willing to drastically
reduce food intake to do so, may not be as significant for another family with young
children and elderly member and, therefore, the same goal may not be as important as to
have an impact on savings behaviour and choice. A goal that motivates households to save
and induce particular savings decisions and its strength are dependent on by peculiar
experiences and characteristic of the households.
This category suggests that rather than the actual motive, such as bequest or precautionary
motives, the strength of the motive matters the most. The more powerful the motive is,
the more likely the household will be shaping its preference towards savings, even if no
additional resources are available and the savings threshold is not achieved.
5.3.5 Collective goals and motivation from outside: Trust, fitting in and
experience
The findings from this study also suggests that in addition to the inner motivation of a
household to save or save more (e.g. children’s future; helping a sick brother), their
perception of what the participation to particular savings schemes (somiti) can bring to
their lives also has the potential to shape households’ preferences and choices towards
savings.
Savings in somiti schemes was perceived by the households –and presented by the
municipality and government representatives- as a way to a more secured life; it reduces the
risk of being evicted in the future. Eviction is in fact a major element of concern among
families living in informal poor settlements and a major influential factor in shaping
households’ savings preferences and savings choices:
Several times many people and authorities wanted to evict us from Rishipara. In such
circumstances, when CDC (Community Development Committee) was set up, we were told that if
we would get involved in somiti, indirectly we’d get some ‘residence security’. Some told us, you
cannot make progress in the way you are living. Any time, you can be driven out from this place.
On the contrary, If all of the 600 families living here become united, and start such savings, your
strength would be enhanced, and at the same time you could make better financial decisions ’
(FGD women-Rishi Para).

130
Participating in savings schemes is thus presented here, at least in part, as a way of
strengthening unity among dwellers and avoiding the possibility of being evicted. Fear of
eviction was an important element in convincing households to participate in savings
schemes, However, participating in savings was also portrayed as way of obtaining other
meaningful benefits for the overall community, such as the implementation of construction
works aimed at improving sanitation and enhancing better access to water and education.
One female participant in a focus group discussion explained that:
We were told that upon our participation in somiti, many projects would be implemented .. such as
stipend or education support to the members’ children, improvement in sanitation, drainage and
water, and so on. Accordingly, we were convinced that we would be united so that others feel
confident to help and support us in our daily struggle in the slum (FGD women-Rishi Para).
This 'campaign’ to convince and motivate households living on insecure lands and in a very
difficult environment, also took advantage of key opinion makers in the community:
community leaders, municipality officials, and even the then Mayor of Narayanganj
(Madam Ivy) who is highly respected among poor communities due mainly to her efforts in
securing national and international aid for the development of the municipality.
Q. Anyway, your saved money is supposed to be reimbursed at the completion of five years, right?
Yes, we know that. But madam Ivy (the Mayor of Narayanganj) told us that if we continue up
to 10 years, our profit will be higher (Marufa Rally).
Our neighbours told us that if we had supported such initiative [somiti], our colony would benefit
from this. Officials from the Municipality encouraged us by saying that they would take care of
drainage and construct passages within the colony. Also the community leaders promised that they
would improve our sanitary facilities and would work according to the wish of people, provided we
all joined the somiti initiative. Well, finally they kept partially their words. Although they didn’t
improve this side of the colony, they made some improvements on the other side of the colony. They
fixed the entrance passages, extended the drainage system. Recently that said that if we start again
with the somiti, they will construct concrete fireplace for us. In exchange, we have to pay 90 taka.
So you understand how they all campaigned for the somiti (Puroby Rail).
The trust in key people that were encouraging and motivating participation is fundamental.
In addition to community leaders and city officials, neighbours become also promoters of
these schemes and added a new element: the need to ‘fit in’ and be seen as part of the
community. Thus, even in cases when the urban poor are unhappy with some aspects of
the operations of the somiti savings scheme, they still feel obliged to contribute to its

131
sustainability for other important reasons. One respondent highlighted how their
contributions sometimes get diverted for private gains, and insists however that this does
not constitute a strong basis for refusing to contribute to the scheme:
Sometimes, they (agents that collected the instalments) stole our money. We paid but they didn’t
record our payments. That’s why I have been discouraged to resume savings in the somiti.
Although I don’t have the will to do it, I may have to do it again because this is a community
initiative. If I want to live here, I have to contribute to our colony’s unity (Puroby Rail).
This statement implies that the desire to ‘fit in’ within the community and enhance the
unity of the community have been so powerful to the point that they overridden the impact
of negative experiences in the savings scheme. While the preference towards participating
(continuing or remaining) in the scheme was negatively affected, their choices were not.
Experience also emerges as a key factor in shaping savings preference. On one hand,
negative experiences such as losing savings due to misappropriation lead to more cautions
savings preferences. However, positive experiences such as the ones in relation to some of
the promises being fulfilled, savings being returned at the end of the five years cycle with a
good interest rate, seem to contribute to motivate further households to save more, to
cement their preference towards saving more.
Motivation assumes a central role in shaping savings preferences. This time, households
were ‘motivated’ externally by the new goals relating to community unity, better life and a
safer and more secured environment. While these goals will also bring benefits to the
household, they were the result of a ‘campaign’ coordinated by trusted external actors and
not goals set by households themselves.
Transforming savings from an individual/household activity, into a community process
which would bring (and in some cases brought) improvements to the long term security
and everyday life of each family, was a major element to motivate households to initiate
and remain in the somiti. ‘Fitting in’, in terms of conforming to what most of the
community is doing is also a strong element that highlights how households living in slums
are bounded by social and economical contracts which drive them to take decisions that
bring benefits to the community, even at a cost for their own family. In this case, if
additional resources are available for saving, households are keen to conform to what
others do (e.g. participating in somiti) even if they are not willing to do so because of past
negative experiences.
5.3.6 Setting up the somiti – opportunities and design features

132
The set up of the somiti offered an opportunity to households to channel their willingness
to save into a well established and safe scheme. Indeed, in responding to a question as to
why many households were not engaged in any savings scheme prior to the establishment
of the somiti, one respondent explained as follows:
In fact, there was not such opportunity. This was the first one for me. Before, we usually saved
money in piggy bank. We broke it into pieces whenever money was needed. So, it was a good
initiative by the municipality (Purobi Rail).
I had some savings and a house; I lost everything. [Beneficiary’s friend]. Yes, he did. He deposited
his savings with his relatives that he trusted, but they misappropriated the savings (Awlad Rally).
From piggy banks to savings with parents and friends, the somiti replaced the informality
and reduced the risks of losses with safer and more formal options, which would protect
their money.
The formal rules governing the somiti, however, maintained some of the key elements of
the informal strategies embedded in the Piggy banks savings approach. While a system of
weekly instalments was part of the design of the somiti, it allowed a high level of flexibility
and ease of access in case of emergency. For example, if a household was not able to save
for a particular reason for few weeks, they were given the option to contribute at a later
stage. This flexibility also extended to the amount of weekly instalment, which, by design,
increased every year:
I started the somiti with weekly instalments of 10 taka, but at the end of every year the amount of
instalment increased by 10 taka weekly. Unfortunately, we couldn’t pay when it became a 40
taka instalment. We just paid 30 taka. Those who continued and increased their savings have
received more money (at the end of the cycle). Since there was a chance to pay 30 taka just like the
previous cycle, we continued with 30 instead of 40. We were unable to pay the increased amount
(Purobi Rail).
In addition to the flexibility of the deposits, the option of accessing the savings in cases of
emergencies was essential.
Loan support from somiti or any other NGOs acted as a response to an emergency such as a
medical issue, wedding party and so on. Whenever we face such situation we rush to somiti. (FGD
male Jimkhana)
Another design feature that reinforced the trust that the households have in the somiti, was
the heavy involvement of community members in its daily management. This involved also

133
the collection of instalments which was done by people known to the household, rather
than external NGO officers.
The set-up of somiti was a clear opportunity given to households to start or formalize their
savings in a safe, formal but flexible scheme. It was a new option that they did not have
before. In addition, key design features of the somiti did have a major impact in increasing
the trust and motivating people to take part in somiti. While the set-up per se of the somiti
favoured more savings and contributed in channelling savings preferences into real savings
choices, some of its design features contribute to strengthening the trust of households in
the system and their willingness to save more in formal – government backed schemes.
5.4 Understanding how categories interact: An explanatory model of the of
preferences and behaviour in savings
A household’s savings preferences and savings choices are the result of the interaction of
complex sets of factors, internal and external to the household. The previous section has
discussed these factors (categories) individually. In doing so, the section answers the first
research sub-question on the factors that enable or constrain urban households in opting
for more investments, and in engaging in riskier and higher return choices in savings.
Identifying the relationships among categories (theoretical coding) is the last analytical step
in the development each dimension specific explanatory model. For each relationship
among categories, a new memo has been created as well. Sorting these memos, together
with the memos prepared for each category, is the first step in generating an explanatory
model for the phenomenon being studied.
Each model answers one basic question. What are the main factors that shape households
preferences and behaviour in relation to savings, and how are these factors - interrelated-?
Building this model requires sorting and integrating the categories identified in a coherent,
theoretical and grounded set of arguments that can answer this question. This is the final
stage of the GT process: the writing up stage. Charmaz (2006) describes the writing
process in GT as a ‘construct of compelling argument’ which integrates the memos that
have been created into an ‘analysis that theorize the realm of studied actions’ (:151).
Writing about the explanatory model means sorting and integrating in a compelling
argument the memos that have been written throughout the process: memos for each of
the categories (factors), for each relationship and on the role of the pension scheme.

134
The matrix coding query tool (one of the ‘Query’ tools in Nvivo) allowed to explore and
search for new concepts and categories. This tool allows to create cross-tables among
multiple items (sources, nodes, attributes, sets) in Nvivo and, a part from supporting a
better understanding of how categories functions within, was the main analytical tool that
contributed in discovering relationships among categories (theoretical coding).
The theoretical coding in GT is the process of exploring relationship among categories.
How does the category of ‘financial resources’ relate to another category identified, such as
the ‘Collective goals’? To what extent does one defines the other?
The revealed savings choices and decisions that households take are the result of a process
that starts with the household’s preference in savings, and ends with actual savings
decisions. At different stages, this process is influenced by factors which can shape either
households preferences, or their revealed choices or even both. What shapes household’s
savings preference is the existence of an intrinsic motive, a goal. This reinforces pre-
existing savings preferences, and in some cases, even translates into real savings choices.
The importance of motives in savings is well recognized in the literature on savings
(Keynes, 1936, Modigliani, 1986). What has emerged from the fieldwork is that rather than
the motive itself, the strength of the motives matters the most. The more powerful the
goal is, the more likely the savings preference will translate into real choices. If these
motives are supported by positive experiences (e.g. the fulfilment of infrastructural
development promises) they are more likely to translate into real choices.
Not all motives and goals are enough to influence both preferences and choices. Rather,
only the ones which have strong links with close family members and their future wellbeing
and are accompanied by a sense of moral duty and short term survival have the potential of
influencing actual savings choices. This differs from the underlying thinking of the
‘hierarchy of needs’ (Maslow and Murphy, 1954) and ‘deficit needs’ (Xiao and Anderson,
1997; Xiao and Noring, 1994) perspectives, where self-survival is placed at the bottom of
the savings’ pyramid motives. Here instead, the ‘deficit needs’ is not about self-survival
and meeting immediate needs, but rather about the survival of close family members and
for contributing to the future wellbeing of households. Interestingly, here the distinction
among the different types of motives on which some of the theories constructs their
hypothesis, was blurred.
Savings for retirement can also take the form of a bequest motive: for instance savings for
children education or savings to be able to provide an appropriate dowry can also be a way
to guarantee a certain degree of security after retirement, as well as act a precautionary
135
buffer for emergencies and shocks. Rather than the types of motives, the reasons way
household are saving, such as self-survival, the common ground in Xiao’s deficit needs is
their strength, the importance given by each household to a wide spectrum of motives such
as helping a brother or saving for the children education.
In addition to these powerful intrinsic motives that contribute in constructing preferences
and, if powerful enough, in shaping the revealed choice of the household, there are
broader collective goals that deal with long term community well-being (and indirectly with
individual wellbeing) as well as common residence security. These goals might not be
powerful enough to underpin substantial reallocation of resources towards saving. These
collective goals can shape preferences and the revealed behaviour under two conditions:
trust and conforming. Trust contributes to transforming collective goals into powerful
intrinsic goals set by trusted and well accepted external figures, and therefore may
contribute to the construction of the saving preference and even shape the revealed
behaviour, as explained earlier. If these goals become widely accepted in the community,
households tend to conform with what other people do. The underlying motive here is to
avoid decisions that they perceive as having the potential to harm collective efforts towards
collective goals. This observation resembles Starr’s (2009) perspective on lifestyle
conformity on the adoption by individuals of strategies widely accepted in the social
context.
Trust contributes to transforming collective goals into individual goals and may shape
household savings preference and even behaviour, if powerful enough. ‘Conforming’, in
contrast, does not shape savings preferences, but may only influence the revealed savings
choices of households and individuals For example, if a household has gone through
negative experiences with a savings scheme and are less willing than before to save, they
will anyway, to conform with what other community members do, initiate or maintain their
participation into savings schemes.
What the households instead reveals, the actual choice that the household make, is instead
determined by other factors. While only some individual household goals are as powerful
as to trigger resource reallocation towards savings, the revealed choices are determined by
an opportunity structure which filters the savings preference of the household. This
opportunity structure refers to three elements: the savings threshold; the easy access to
trustworthy savings schemes or strategies; and conforming to collective behaviour. If such
opportunity structure is ‘positive’, which means that at least one of the three elements is
available, the revealed savings choices will mirror the household savings preference.

136
Assuming that a household is more willing than before to save (savings preference),51 a
positive opportunity structure (e.g. as availability of more financial resources) will allow the
household to save more (savings choice).
On the other hand, if a household is less willing to save, because of previous negative
experiences (e.g. fraud), a positive opportunity structure will mirror its reluctance to save,
unless the factor of ‘conforming’ comes into play. In this case, to conform and fit in with
the behaviour of the wider community, the household will choose to conform and take
savings decisions similar to its neighbours (savings choices), while maintaining its
reluctance to save (savings preference).
If the opportunity structure is ‘negative’, which means that the financial resources have
diminished and the household is below the savings threshold, or that only informal and
unsafe savings options are available, the revealed savings choices will not mirror the
household savings preference. If a household sets new savings goal or is encouraged by
positive savings experiences and therefore is more willing than before to save (preference),
a negative opportunity structure will act as a barrier and reveal savings choices which do
not mirror the household’s savings preference. This is the case unless powerful goals exist:
such powerful goals can overcome a negative opportunity structure and trigger a
reallocation of resources from immediate needs towards savings.
An opportunity structure can also remain unchanged over time, which means that the
financial resources are constant and that no change occurs in terms of access to savings
schemes. Such incidents have however not been found among the household that have
been interviewed in this study.
The opportunity structure only functions at level of the revealed choices, and does not
shape households savings preferences: additional financial resources available or the access
to savings schemes does not trigger, on its own, more savings.
Figure 5.6 visualizes the process that leads to revealing savings choices. Savings preferences
are formed and shaped by households and community goals as well as positive or negative
experience. If there are clear savings motives (e.g. towards children education), as well as
positive experiences on savings, households are likely to have preferences towards more
savings. If the savings motives are powerful enough, the constructed preference may
51 This may result from several factors, including setting a new saving goal or because of the encouraging experience from seeing the benefits that participating to saving schemes brings,
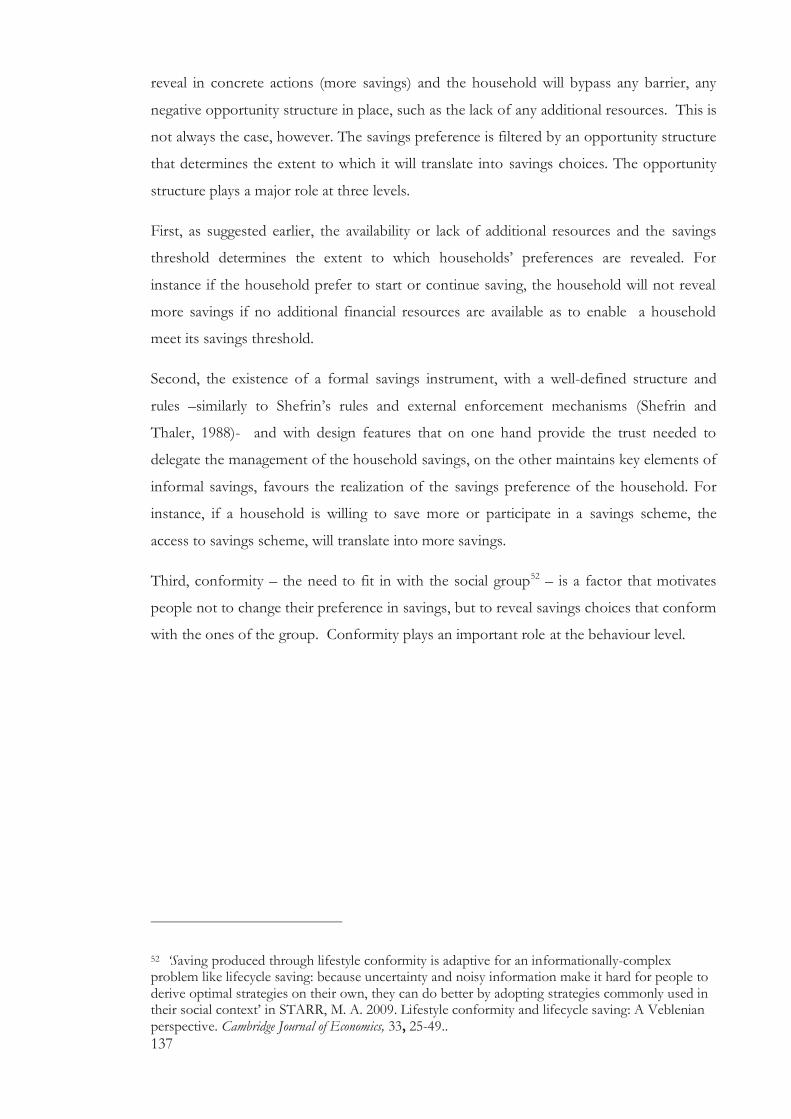
137
reveal in concrete actions (more savings) and the household will bypass any barrier, any
negative opportunity structure in place, such as the lack of any additional resources. This is
not always the case, however. The savings preference is filtered by an opportunity structure
that determines the extent to which it will translate into savings choices. The opportunity
structure plays a major role at three levels.
First, as suggested earlier, the availability or lack of additional resources and the savings
threshold determines the extent to which households’ preferences are revealed. For
instance if the household prefer to start or continue saving, the household will not reveal
more savings if no additional financial resources are available as to enable a household
meet its savings threshold.
Second, the existence of a formal savings instrument, with a well-defined structure and
rules –similarly to Shefrin’s rules and external enforcement mechanisms (Shefrin and
Thaler, 1988)- and with design features that on one hand provide the trust needed to
delegate the management of the household savings, on the other maintains key elements of
informal savings, favours the realization of the savings preference of the household. For
instance, if a household is willing to save more or participate in a savings scheme, the
access to savings scheme, will translate into more savings.
Third, conformity – the need to fit in with the social group52 – is a factor that motivates
people not to change their preference in savings, but to reveal savings choices that conform
with the ones of the group. Conformity plays an important role at the behaviour level.
52 ‘Saving produced through lifestyle conformity is adaptive for an informationally-complex problem like lifecycle saving: because uncertainty and noisy information make it hard for people to derive optimal strategies on their own, they can do better by adopting strategies commonly used in their social context’ in STARR, M. A. 2009. Lifestyle conformity and lifecycle saving: A Veblenian perspective. Cambridge Journal of Economics, 33, 25-49..
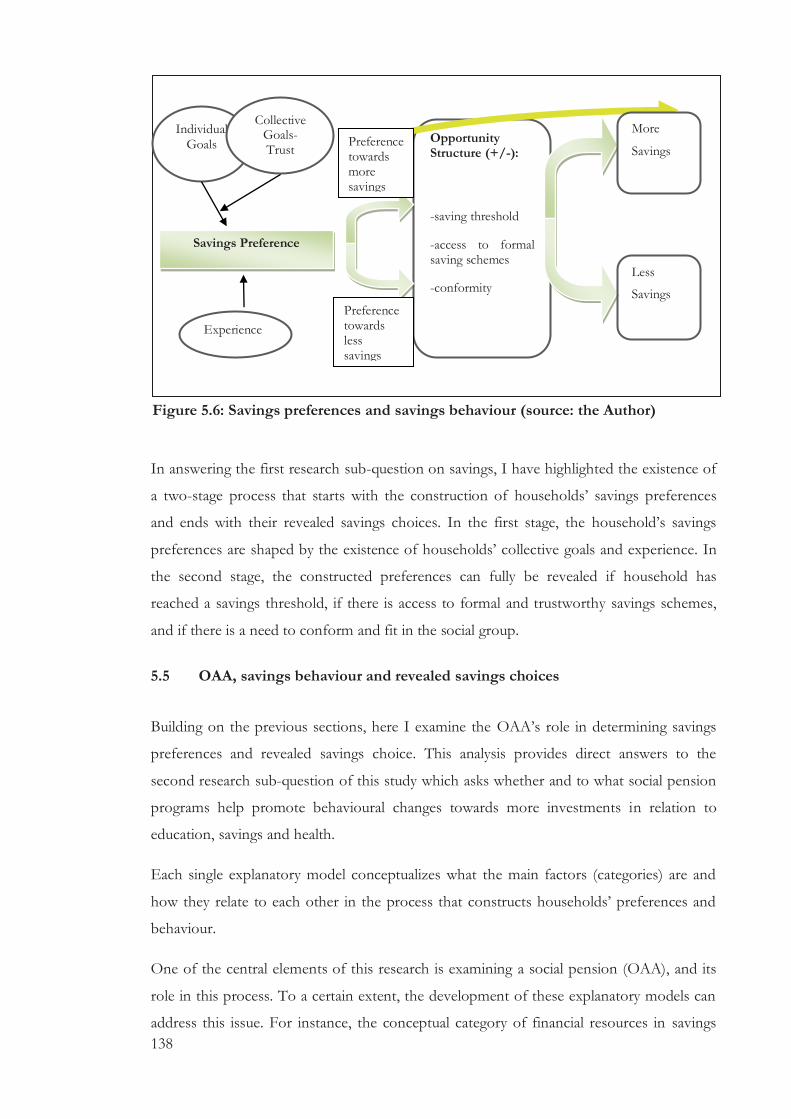
138
In answering the first research sub-question on savings, I have highlighted the existence of
a two-stage process that starts with the construction of households’ savings preferences
and ends with their revealed savings choices. In the first stage, the household’s savings
preferences are shaped by the existence of households’ collective goals and experience. In
the second stage, the constructed preferences can fully be revealed if household has
reached a savings threshold, if there is access to formal and trustworthy savings schemes,
and if there is a need to conform and fit in the social group.
5.5 OAA, savings behaviour and revealed savings choices
Building on the previous sections, here I examine the OAA’s role in determining savings
preferences and revealed savings choice. This analysis provides direct answers to the
second research sub-question of this study which asks whether and to what social pension
programs help promote behavioural changes towards more investments in relation to
education, savings and health.
Each single explanatory model conceptualizes what the main factors (categories) are and
how they relate to each other in the process that constructs households’ preferences and
behaviour.
One of the central elements of this research is examining a social pension (OAA), and its
role in this process. To a certain extent, the development of these explanatory models can
address this issue. For instance, the conceptual category of financial resources in savings
Savings Preference
Individual Goals
Collective Goals-Trust
Experience
Opportunity Structure (+/-):
-saving threshold
-access to formal saving schemes
-conformity
More
Savings
Less
Savings
Preference towards less savings
Preference towards more savings
Figure 5.6: Savings preferences and savings behaviour (source: the Author)

139
suggests that regular availability of additional resources and a savings threshold, if other
immediate needs are covered and the household has a preference towards savings,
contribute to more savings.
In order to have a more in depth understanding on the role of the pension in this process, I
have used some of the techniques of GT and modified them to serve this purpose. I
undertake two important steps to deepen this analysis. Firstly, I have artificially raised (as
opposed to emerged) the concept of ‘pension’, as a core category. By placing the category
‘pension’ as the central element in a model, I was able to identify important dynamics that
were not discussed in depth since this did not emerge as central elements in the analysis.
The Pension Category assembles all text coded under all nodes which had references to the
pension.
Secondly, I have examined how the pension operates and the extent to which it determined
households’ savings preferences and behaviour either on its own or together with other
factors. The coding matrix query was again used to filter the sources which had text coded
with pension and tabulate with any other facilitating factor in that specific dimension.
Later, the same sources were cross-tabulated with all socioeconomic attributes to identify
potential relationships that might have existed. In the preliminary analysis, some of these
relationships had been glimpsed in some households and informed the following
theoretical sampling stage. During the microanalysis of the interview, I identified several
types of choices made by the households in relation to specific dimensions. In the savings
dimensions, starting or maintaining the participation to somiti were the most common
ones. The third step has therefore been attempting to identify which of these choices, if
any, can be directly linked to the pension.
There is an important point to make, however. The approach used in the information
gathering process did not bring up the topic ‘pension’ (except for the collection of basic
data on their usage during the socioeconomic survey) unless the household did it first or
unless, after the preliminary analysis, it was believed to have influenced in some way
households’ behaviour. Households very rarely identified the pension as an important
factor in their choices, an issue I discuss further in Chapter Eight.
The previous section suggests that the additional financial resources available, including the
cash transferred as part of the OAA, and the savings threshold do not contribute in
shaping savings preferences. Other factors such as individual and community goals and
experience do shape household’s savings preference.
140
The cash transferred as part of the OAA, means additional financial resources available in
the households which can contribute to reach their savings threshold. Nevertheless, as
discussed earlier, the age structure of the family, the number of working household
members, the price increase of basic commodities as well as the often increasing medical
expenses, cause that the additional cash is absorbed and used for addressing unmet
immediate needs, such as food, medicines and cloths. The following quotations from the
field help illustrate these observations:
Nowadays, there is no special use of 900 taka (pension is transferred quarterly), because to buy a
lungi (a traditional dress for men) you need 500 taka (Anis Rally).
After having waited for half day in the queue at the bank to collect the pension, when I bring the
money back home, I give it to my son and he uses for the family expenditures; this money never
served any notable purpose. .....My desire was to keep and save this amount that my sons will be
able to utilize after. But I cannot (Bilkis Rally).
Sometimes I wish I should have saved the pension money and kept is separate from my family
income and expenditure. I could have done something greater, like buying golar jinish (gold
necklace) or kaaner jinish (gold earring). But I failed. I feel sad when I think about this. It was
certainly extra income which I could have accumulated (Halima Rail).
The cash transferred as part of the pension scheme does not shape the household’s savings
preference. Households intend to save the money for the pension for a ‘notable’ purpose,
but they could not, because immediate needs need to be addressed.
The field work showed that when there are not unmet immediate needs, and when a
household is able to meet its savings threshold, the pension (or at least a part of it)
contributes in creating a precautionary saving pot to be used in case of medical emergency
or health needs. Explaining how pension resources are utilized, one interviewee noted:
I have kept it saved in the house. Whenever there is shortage in the family, then I use it. We don’t
have other options. For example, if anyone gets sick then I use 100, 200 or 500 to seek medical
attention (Anis Rally).
141
The OAA does not necessarily contribute in lifting restrictions on the savings capacity that
households have. Other factors may cause that the additional resources are absorbed by
other more immediate expenditures to address unmet needs.53
If the cash transfer from the OAA contributes to a net increase of a household’s resources,
the household might reveal more savings for bequest or precautionary purposes. When this
happens, the regularity and predictability of the pension can be instrumental in fulfilling
obligation with the somiti and allows the household to deposit in advance several months
of instalments. Nevertheless the strength of the pre-existing goal and external rules defines
the extent to which the household will reveal more savings.
The OAA can facilitate a household’s capacity to reveal more savings choices, but does not
have a similar capacity in shaping household’s preference towards more savings. The
pension works as any other additional financial resources available in the household: it
becomes part of the household’s income which will first address what they consider as
deficit needs. In a household which is willing to save and meet certain goals, the
predictability and regularity of the pension can contribute in the realization of their savings
preference.
5.6 Conclusions
What shapes a household’s savings behaviour? This is an important question, given the
varied and sometimes divergent answers provided to it over the years across different
disciplines. The evidence in this chapter shows that all households want to save, no matter
what barriers they may be facing in translating these desires into actual realities. In line with
the distinction between savings preferences and savings behaviour, this chapter has shown
that a household’s savings preferences and its actual savings choices is shaped by different
factors.
The explanatory model suggests that savings preferences are formed by experience but
mostly by the existence of strong, clear, moral and purposeful individual or community
goals. Also, rather than the type of goal (such as bequest, retirement or precautionary) as
suggested in much of the current literature, it is the motive’s strength that matters. The
more powerful the motive is, the more likely households will be able to overcome various
barriers and translate their savings preferences into practice.
53 Such factors include changes in the age structure of the household and the needs associated with access to education and health care (medicine or education needs) and commodity price surge

142
The barriers are part of an opportunity structure that do not shape the household
preferences, but only determines the extent to which households’ preferences will translate
into savings choices. The opportunity structure includes three elements: a savings
threshold; the existence and access to formal, trusted and flexible savings instruments; and
the need to fit in with the local community.
As an element of the opportunity structure, the OAA can facilitate revealing more savings
choices, but does not per se shape the household’s preference towards more savings. The
pension works as any other additional financial resources available in the household and
may contribute to reaching a savings threshold. Nevertheless, in a household which is
willing to save and with clear and strong goals, which can span from precautionary savings
for emergency needs to savings for education, the predictability and regularity of the OAA
can contribute to the realization of their savings preference (e.g. regular contribution to the
somiti).
The findings from this model do not dispute that the availability of additional financial
resources is a key determinant of more savings choices. Instead, it shows that additional
financial resources can facilitate more savings choices only under certain conditions,
particularly when the net household reaches a savings threshold, but do not shape the
household savings preferences. More significantly, this model shows that more savings will
be revealed only if the household is willing to save more if clear and strong individual or
collective goals as well as positive savings experiences exist.
143
CHAPTER 6. Households’ Investment Preferences and Behaviour
in Education: a role for the Old Age Allowance?
6.1 Introduction
This chapter explores the investment preferences and behaviour of households with
regards to education. More specifically, it seeks to explore: (1) the factors that enable or
constrain poor urban households in Bangladesh in opting for more investments -and in
engaging in riskier and higher return choices in the education sector; and (2) the role of
social pension programs in stimulating behavioural changes towards more investments and
in engaging in riskier and higher return choices in relation to education.
The SRM suggests that households living in poverty are risk averse and as a result they are
very reluctant to engage in higher risk/higher return activities. However, if households
have access to the kind of risk management instruments offered by social protection
programmes, they are more likely to invest more to accumulate assets in ways that may
help improve their living conditions (Moser and Dani, 2008). In education, investing more
to accumulate assets results in, for instance, ensuring the children stay in school for more
years and hiring tutors.
The chapter is organized as follows. It starts with a brief background to the specific
educational investments that is of interest here. This is followed by a presentation of how
individual categories, such as access to financial resources may influence the realization of
investment preferences with regards to education. The final section deals with the specific
role of access to pension resources in the process.
6.2 Household’s investment preferences and investment behaviour in education
Education is critical for economic growth and poverty reduction (Mavrotas et al., 2007;
Gruescu, 2007; Greiner et al., 2005). Investments in education contribute to the
accumulation of human capital, which is essential for higher incomes and sustained
economic growth (Rosenzweig and Kochar, 2004). Education facilitates the creation of
particular skills that increase the level of productivity of workers in comparison with those
who do not posses such skills. As with any investment, education creates returns and
benefits in both the economic and social sphere by increasing peoples’ productivity and
skills with long term effects on economic growth. Extensive empirical evidence points to
the existence of a correlation between income distribution and educational variables:
144
increases in education reduce inequality and in particular, countries with higher educational
attainment have more equal income distribution (Gregorio and Lee, 1999). In Bolivia,
labour earning inequalities are noted to be heavily dependent on education, with a worker
with 5-7 years of education earning 147 percent more than a worker without education
while other variables (such as ethnicity, gender, experience, geographical location, formal
and informal sector) explain just a small portion of earning differentials (Fields, 1998).
Education helps to reduce poverty by increasing the productivity of the poor, by reducing
income inequalities, and by equipping people with the skills they need to participate fully in
the economy and in society. Interviewees in Narayanganj strongly supported this view. As
one interview noted:
Education is light; it removes darkness. An illiterate person is like a blind person (FGD Rail).
Throughout the field work, the belief from all households that education is very important
in their life and for the future generations was clear: education was the most commonly
discussed topic during the interviews (Table 4.3).
In Bangladesh, education is considered as a fundamental principle of state policy. Article 17
of the country’s constitution speaks of free and compulsory for all children from the age of
six to 18. Several successive governments have declared education as priority and
successfully managed to improve education indicators in terms of literacy rates and years of
schooling.
Education in Bangladesh remains however far from being free and accessible to all its
citizens (Fennell and Arnot, 2008, Rahman, 2002). My fieldwork evidence from
Narayanganj suggests that households face financial barriers which increase with the years
of schooling54. The costs are not however linked to official school or exam fees, but to the
informal costs associated with the need for private tutors, uniforms, books and stationeries.
The next sections discuss what shapes household’s investment preference and revealed
choices, what underpins some of these specific events in relation to education investment
preference and choices, and the umbrella concepts that can aggregate specific events and
concepts that emerged during the interviews. The methodology and process have
54 Primary Level (years one to five); Junior Level (years six to eight); Secondary Level (years nine to 10); Higher Secondary Level (years 11 and 12)

145
extensively been discussed in the methodological chapter, Chapter Four, and in the savings
chapter, Chapter Five.
6.3 Categories in the education dimension
What shapes household’s investment preference and revealed choices in relation to
education? What underpins some of these specific events? What are the umbrella concepts
that can aggregate specific events and concepts emerged during our discussions on
investment preferences and behaviour in education? These questions guided the analysis of
the data during the field data collection, preliminary analysis phase and in the final analysis
which benefited from the use of the software Nvivo (Chapter Five). By applying this
analytical framework, I was able to piece together specific events and concepts into broad
conceptual categories, and to explore the functioning of each category in relation to the
household education preference and behaviour. This section examines individual categories
that emerged from the data.
6.3.1 Financing education: The ‘family situation’ and its survival
Households allocate resources to education as part of a process that considers the
availability of financial resources for all household needs and expenditures. Similarly to
what was identified in the savings and health dimensions, the investment preference of the
household to educate, might not be revealed because of other family circumstances, such as
some more pressing survival needs, as with food and health needs, for example:
Though we are illiterate, we tried to provide education for our children. Our three sons know that.
But because of our family situation they had to quit school (Monir Jim).
After my accident, I kept my child in school. Days later, he understood that if he continued his
education, the family wouldn’t be fed. So he was compelled to drop out (Suraj Rally).
There are talented children in families who deserve to be nursed and demand higher education. But
many of these families shave serious financial constraints and have to choose between access to food
and sending their children to school. If they want to send their children to school, they cannot eat; if
they eat then they cannot send their children to school (FDG Rail).
We spent all the money on my mother’s illness. We had no money at that time to continue my
study. At that time, I was in class eight. So I quitted school (Khadija Jim).
When households are faced with the dilemma that any investment in education would put
the survival of the household or one of its members at risk, they are likely to allocate more

146
resources towards short-term survival needs in ways that undermine their ability to
translate their educational investment preferences into actual investments.
Health can act as the ‘cause’ of loss of income, which needs to be replaced by new sources.
In fact, the illness of one working household member and his/her resultant temporary
inability to earn income will oblige households to reduce their investments in education:
I had a desire for education. I was always on time in my class. I also had private support at
home. My father paid for this although his income was low. Not only me, but few others from the
community attended school. But ironically, when my father got ill and could no longer work, I
dropped out of school because of poverty (Gopal Rail).
When survival is not at stake, the household may be keen to reallocate resources from
needs such as food, towards investments in education, by for instance, altering their food
habits and compromising its quality:
In my family, I am educating my children with many challenges. Because of the need to save for
their education, we don’t eat big fishes; only small ones. We don’t think eating a small piece of
fish is a problem because it enables us to save towards the education of our children. People don’t
also check what your food habits are; rather they check your educational status which reflects in
your overall life style (FGD Rail).
Yesterday I bought my 5th grade son a book costing 250 taka. Although it was beyond my
capacity, I had to do it, and I did it because I want him to be educated. Going to buy him the
book, on the day we couldn’t buy fish for our daily food needs, we had to depend on dal and vaat
[lentil and rice]. We are illiterate, but we understand how education can make a difference in
people’s lives (FGD Rail)
Not all the financial resources allocated to food are necessarily linked to survival. When
this occurs, when basic and survival food needs are covered, a reallocation of resources
from food towards education may occur. The households will than reveal more
investments in education.
The family situation appears to be in a continuous transformation. At one point in time, for
instance, a household might have only one source of income. However, as the younger
children who used to go to school start earning, they start to contribute to the household
income. On the other hand, the death of a working member, the departure of a working
son or daughter (e.g. in cases of marriage) impacts the availability of financial resources to
be allocated to education. The discussions with the households were full of events which
147
changed its shape, structure and more importantly the household income: a new salary, a
better and more regular salary, the set-up of a small business or opportunity for female
work and multiple incomes, meant more investments in education. For example, asked
how they manage to take care of the educational needs of her children, respondents
explained:
Nowadays myself and my husband have jobs. To tell you the truth, my salary is 1500 tk while
my husband’s salary is about 3000tk. With this income, our expenditures including the education
costs of the children can be taken care of (Trisha Rail).
We have major financial constraints. With just one person working, we need to take care of five
people in our family. For that reason, my sons started working earlier and interrupted his study
(Monir Jim).
If survival needs are addressed, all positive changes in the household’s income may
translate into more investments in education. However, if only small changes occur in the
household’s income, the impact will be visible only for minor investments. When dealing
with education, households face major expenditures, such as the regular payment of fees,
and weekly or monthly payment of tutor fees. Minor investments in education, such as
purchasing a book, or stationery, are instead occasional and in some cases optional. As it
will be discussed in the OAA section, the pension may contribute to these minor
investments in education.
When the overall household income changes –either positively or negatively - their
investments in education may change, but their investment preferences, their attitude and
willingness to educate, remain constant. The investment preference in education, their
willingness to send their children to school, seems to remain constant over time or at least
not being affected by the availability of financial resources. What the household reveals
depends on the extent to which survival needs are addressed and the transformation and
changes that occur in the households.
While education is considered important for the future of the household, allocating
resources to education does not contribute to addressing immediate and survival needs,
such as food and health, which become a priority for the household. This leads to a
reduction of household’s ability to invest more in education. The investment behaviour in
education mirrors the continuous transformation that the households go through. When
the survival of the household is not at risk, redirecting resources from immediate needs
148
towards education becomes feasible and may allow a household to investment more in
education.
6.3.2 External factors and financial resources
This section discusses a number of exogenous factors that have direct implications for the
availability of financial resources in the households and therefore shape a household’s level
of investments in education.
A first important element that emerged from the discussions with the households is
availability, especially in relation to free schools. The increasing number of schools has
positively contributed to reveal more investments in education compared to previous
times. The establishment of private free schools by major NGOs have removed some of
the financial constrains that hitherto served as barriers to school enrolment. In addition,
since more children are being educated, the number of tutors available has increased and
their fees have reduced, contributing to more investments in education.
The access to philanthropic individuals such as those who offer tuition without fees also
seems to help determine the extent to which educational investment preferences are
revealed.
I was able to send my children to a private school. There were some tutors who didn’t charge money
for teaching my children and those who we had to pay used to take less amount of money compared
to market rates. For instance, if they took 500 taka from others, they were happy with 300 taka
from us. Also some of my father’s friends were very helpful. When my husband died, they taught
my children without fees. It was very difficult to continue educating our children without private
help. (Hasem Rail).
He [the employer] is really a good person, he supports us because he knows well that my son is not
in a position to pay their tuition and other education costs (Ambiya Rally).
The access to people willing to support the education of less advantaged households,
coupled with a good academic performance by the child - provides the household with
additional resources needed to invest in education.
Access to informal support is not the only factor that, if available, would reveal more
investments in education. In Bangladesh, mostly in rural areas, the government and NGOs
have been supporting and promoting education through a variety of interventions. In some
communities within the Narayanganj municipality, World Vision International set up a
scheme to support selected households with education fees, books and school material in

149
the early 2000s. This access to a formal scheme to support households in sending their
children to school had a major impact in the households’ educational investments, as the
following quote illustrates:
We got some money from World Vision some time ago. ... My granddaughter received some
support with the fees, books, copies and exercise books from World Vision (Ambiya Rally).
Another ‘external’ factor that has an impact on the household income and the resources
available to education is the perceived price increase of basic commodities. The price
increase of staple food and other basic commodities, has forced household to reallocate
resources from investments in education to more survival needs.
The drastic increase in commodity prices exceeds the increase in income. Definitely, I would agree
that the income has increased compared to some years ago. But the costs of essentials have become
even much higher (Aroti Rally).
My daily salary increased from 38 to 70 taka. However, market prices at the same time hiked.
The government didn’t increase our pay. So stricken by the poverty, I could not allow my children
to continue studying (Gopal Rail).
In sum, external factors such as access to public schools and NGO-run free schools, access
to low cost tuition-free education have played a role in shaping the extent to which
households are able to actualize their educational preferences. External factors, similarly to
the previous category financing education, do not shape the investment preference in
education, which instead are shaped by other factors that will be described next.
6.3.3 Student’s commitment and academic performance
The previous categories dealt with how the availability of financial resources to be allocated
to non-survival needs, and the access to external factors that ultimately have an impact on
the availability of resources to finance education, determine to what extent investment
preferences in education are revealed, but not how these are constructed. This section
examines how the child’s commitment to education influences the investment preferences
and behaviour in education. If children show a very positive attitude and willingness to
study, the investment preference of the household in education will also increase, and they
will be more likely to reveal more investments, knowing that the investments and the
sacrifices that they are doing to continue financing education are less likely to be lost.
My daughter is very keen about higher education, and is committed to advance from ninth grade. I
will do my best to help her receive higher education even if I have to beg (Marufa Rally).

150
My son is bright. I will support him for as long as he wants to study. It does not matter what I
have to face, I will do that. I will try my best in my capacity, and leave the rest to the mercy of
Allah (Samina Rally).
A strong student commitment contributes in determining the investment preference in
education of the household as it contributes in strengthening the existing willingness to
educate that the household may have. It may also contribute in the realization of the
investment preference since the household will even attempt to deal with the financial
barriers which they face. The following conversation I had with an elderly household
member illustrates this point:
Q. why aren’t you interested to continue educating your child?
We don’t have the ability to continue. At higher grades we cannot afford his study costs, be it
tuition fees, books or private tuition charges.
Q. But your son said he is willing to go further with his study, what will you do then? ...... In that
case, we would support him. I myself would gather money for him. His mother would even convince
his maternal uncles or close relatives. If we cannot, then it will be up to the 5th class, as I have
already told you. He must go up to fifth grade. After that he’ll be left in his will (Rafiq Rally).
While a strong student commitment contributes in determining a households’ educational
investment preference, when a child does not exhibit a high interest or commitment in
studying, the investment preferences do not seem to be affected. Instead what the
household will reveal, their investment behaviour will be affected. In other words, the
households will reveal fewer investments in education, such as children dropping out from
schools, but the willingness to educate their children will remain intact:
Q. why didn’t your son continue his study after finishing the fifth class? He himself didn’t like to
go to school. I put all my effort to educate him for at least 10 years. Unfortunately, he failed in one
subject, and took the decision not to continue… So, it was not my will to send him to work; he
compelled me to do so (Marufa Rally).
Even when there are no financial barriers towards further education, a household’s actual
investments in education may still remain low if its school-going children do not show
strong interest and commitment to further schooling.
The child’s commitment to study may also affect educational investments indirectly in
different ways. First, a child’s commitment can motivate people outside of the household
to help advance the educational attainment of such a child:

151
We sent them to school. Their performance was good. I always tried to show their study progress to
my well-wishers. Then they felt happy and gave us more money. (Hashem Rail).
Secondly, it can reduce the amount of resources a household requires for educating its
school-going children by at least reducing expenditures on private tutors or even
contributing to the family income by the child himself tutoring children in lower grades:
You need a lot of money to educate your children. So when you opt for educating your children,
your family has to bear extra burden. Suppose you want to keep one or two private teachers for
them, you have to pay them well. Fortunately, she saves us from that since her performance in
school is good and she needs little support by way of hiring private tutors (Ambiya Rally).
The child’s commitment towards studies and the performance that might result from it, is
thus very important in shaping households’ investment preferences and behaviour towards
education.
A strong commitment and good performance in school contributes in changing positively
the investment preferences of the household as it contributes to strengthening the
willingness to educate that the household may have. Household may even reveal more
investments by exploring options to support the educational ambition of a child, even if
financial barriers towards the realization of such ambitions exist. Indirectly, a strong
commitment and good performance in school may even reduce the barrier that household
face in revealing more investments in education, both by motivating people outside of the
household to provide support for the child’s education, and by reducing the additional
resources required for obtaining the services of private tutors.
In contrast, when a child’s commitment and attitude is perceived to be low, household’s
investment preference in education will not change. The household will continue to have
the same level of interest towards the education of their children.

152
1 2
Investment Preference
STRONG Commitment
(and/or Performance)
WEAK Commitment
(and/or Performance)
Investment preference in education and the role of the child’s
commitment
Y
X
A
More investments
Less investments
B
Figure 6.1 graphically summarizes the relationship between child commitment and
investment preferences. A strong commitment of the child contributes in determining the
willingness of the household to invest more in education. A weak child commitment
instead, does not determine any change in the household’s investment preference.
Note to Figure 6.1. The X axis represents the commitment and/or performance of the child in education on
a scale from weak to strong. In the case of academic performance, from poor to very good academic
performance. The Y axis represents the level of the investment preferences (their willingness to invest) of the
household in education on a scale from low (preference to invest less in education) to high investments
(preference to invest more in education). Line A shows that as the commitment (or academic performance)
increases on the X axis (quadrant two), the investment preference in education increase as well: the
household will be willing to invest more in education if the child shows increased commitment and good
academic performance. Line B shows that as the commitment (or academic performance) decreases on the X
axis (quadrant one), the investment preference in education will remain constant. In other words, the
household will not be willing to dis-invest (reduce their investments) education even if the child’s
commitment and academic performance decrease.
The investment behaviour (i.e. the actual investments in education) is also shaped by the
child’s commitment. Figure 6.2 shows that the household may reduce its investments in
education (e.g. child dropping out of school) since the returns from this investment are
now considered to be low, even if the willingness, and financial resources required for
Figure 6.1: Investment preference in education and the role of the child’s commitment (source: the Author)

153
1 2
Investment Behaviour
STRONG Commitment
(and/or Performance)
WEAK Commitment
(and/or Performance)
Investment behaviour in education and the role of the child’s
commitment
Y
X
A
More investments
Less investments
B
actualizing such investments, exist. A strong child commitment may instead contribute to
additional investments in education.
Note to Figure 6.2. Similarly to Figure 6.1, the X axis represents the commitment and/or performance of the
child in education on a scale from weak to strong. In the case of academic performance, from poor to very
good academic performance. The Y axis represents the level of the investment behaviour (their actual
investments) of the household in education on a scale from low (less investments in education) to high
investments (more investments in education). Line A shows that as the commitment (or academic
performance) increases on the X axis (quadrant two), the actual investments in education increase as well: the
commitment and good academic performance contributes directly to more investments by the household in
education (e.g. well wishers to support schooling, savings from not hiring private tutors). Line B shows that
as the commitment (or academic performance) decreases on the X axis (quadrant one), the actual investments
in education will decrease as well: the household will dis-invest (reduce their investments) in education.
6.3.4 Age of education: Awareness, motivation and the minimum threshold effect
This section explores how and to what extent the awareness of the importance of
education, the motivation to achieve a specific threshold, determines the household’s
investment preference and behaviour. As noted earlier, most interviewees underscored the
primacy of education in shaping the livelihood dynamics of households, including
households’ investment preferences and actual behaviour:
Figure 6.2: Investment behaviour in education and the role of the child’s commitment (source: the Author)

154
There is no alternative to education. You have to educate your children. If they get educated, they
can have access to a decent job. I cannot do much in my life because I have not been educated in
school. Without education, we cannot get a good job outside [of the slum] (Abir Rally).
This quote summarizes how education is valued among the households who are
particularly conscious about the importance of education for the future of their children.
This recognition plays a significant role in motivating households to invest more in the
education of their children.
Most of the households living in the poor urban areas of Bangladesh have a life history full
of deprivation, poverty and exclusion. All families interviewed have expressed their desire
to have something different for the next generations, and continuously compared their
lives and experiences with what they would like for their children and grandchildren.
They [grand children] must be living in a better condition compared to me; they should not live in
poverty for life; we have nothing. If the government ousts us from this slum, we have no other place
to live (Halima Rail).
My grandma and my mother have never been educated. My aunt meets the costs of education for
our two sisters. She would like to give us what she never had [education] (Khadija Jim).
If I were educated, I could have had good job at good firms or could I have a good position. I missed
all of this (Samina Rally).
The potential role of education for enhancing employment opportunities was particularly
highlighted as a key reason why many of the respondents expressed interest in providing
education to their children in order to ensure that they do not live in the same vicious cycle
of poverty as their parents. Consider the following quotes from the field:
Without education, a person can hardly get a job. For example, you [referring to my research
assistant] can communicate with this foreigner [myself], because of your education (FGD Rail).
If my son gets only partially educated, he would have to bear the same fate as I do. He’ll not be
esteemed anywhere ... Instead with few more years of schooling and a good certificate, he would be
appointed at least in a good firm and able to have a decent life (Samina Rally).
Education is important. If you are educated at least you have a chance to get a good job. I didn't
get any education and so have been going through a lot of hardships to make a living (Lipi Jim).
People’s experiences and perception on how education favours employment opportunities,
is central to understanding the investment preferences in education, as it becomes a

155
minimum requirement to obtain a better job or at least the same decent job the family has
been doing for years.
Government wouldn’t recruit you for a job of sweeper unless you passed the 8th grade. Therefore,
we told our children that to get a good job in a good organization, you need to go to school.
Without your educational qualifications they would not hire you. That’s why we encouraged them
to study. More importantly, we feel happy if you go to school. We feel proud seeing my son’s passed
SSC or IA [Intermediate of Arts, stands for higher secondary] (Srijani Rail).
In addition to the missed or would-be-missed employment opportunities, the
embarrassment, level of honour and dignity experienced throughout their lives55 has deeply
shaped the investment preferences in education.
In this age, without education, usually there is no value/dignity in the society. If a person is
educated, he can speak well and can earn at least by offering tuition to others. In the past, there
was not such pressing need for education. We didn’t pay much attention to our children’s
education. Nowadays, if you don’t have education, you have no social dignity (Anis Rally).
We are learning from the surrounding environment, especially when a groom’s family inquires the
education level of a girl. Education for them is a social security. In addition, our neighbours are
sending their children to school, which more or less encourages us [to do the same] (Anis Rally).
Neighbours, or wedding opportunities as well as government and NGO’s projects and
support, all tend to present and ‘signal’ that education is a ‘conditio sine qua non’ for a decent
life. Interestingly, neighbours and the community in general create a ‘demonstration effect’
which spills over in other families and contribute to build the awareness behind the
motivation that determines the investment preference in education.
The attitude towards education is changed over time. ......Also, children are encouraged to go to
schools when they see other students (Purobi Rail).
The urban context itself exposes the households to experiences and perceptions on
education that motivate them further on the need of education and shape their investment
preferences. Asked how they got motivated to send their children to school, one
respondent highlighted the critical role of city life, explaining that:
55 Examples of such lost of dignity often cited by interviewees included their inability to sign their names or mediocre wedding offers for their daughters,

156
When we moved to the city, we started mixing with and more educated people and we have seen
children going to school. That dream and motivation [to send our children to school] grew in our
mind (Hashem Rail).
Motivation comes also from the signals of Government’s policies on education and the
perception that education is needed in Bangladesh to spur development:
Today education is emphasized everywhere. Government also helps education; family and relatives
support education; the neighbours also encourage for education. They tell that education raises
dignity and life (Srijani Rail).
You’ll see that in every household in Bangladesh children are reading. Education is a demand of
the country. If individually children get educated, the country would be highly developed. Even if we
are poor, education can make poor people smart (Gopal Rail).
The experience of deprivation, the perception on how education favours better
employment opportunities, marriages and dignity, combined with an environment which
‘teaches and compels us to think education’, all contribute to shaping households’ interest in
sending children to school. In turn, this awareness generates a strong motivation that
shapes the investment preference of the households in education.
There was no importance of education in the past compared to that of present. The situation was
not favourable. In our time, usually parents or society used to think- ‘what would education do for
female children. Their duties lie in sitting beside the fireplace and cooking. They’d rather manage
household chores’ (Srijani Rail).
Awareness on the importance of education is the engine behind the motivation that shapes
the investment preference of the household.
Still, households with similar awareness and experience, appears to have different degrees
of motivation which, in turn, influences the investment preferences and the likelihood of
the preference to be revealed in actual educational investments. In the data gathering and
analysis phase of this research, I discussed in depth the issue of motivation and have been
able to identify an important concept: the ‘minimum threshold effect’. Every household
has a certain degree of motivation which determines its investment preference and the
extent to which these will be revealed in terms of actual investments. For instance, some
households are willing and very determined to send their children at least up to year 5,
while others target year seven and so forth.
157
The minimum threshold seems to be a construct of the household perception on the
minimum requirements to obtain decent employment or good wedding proposals
(daughters). For instance, if the minimum education requirement for working as sweeper
for the municipality is eight years of education (or five years for being employed in a
garment factory), the household will be motivated and determined to send their children to
school, even if they are facing financial hardships, at least up to year eight ( or year five for
a garment factory)
Internally, the household sets a minimum threshold for education, based on the education
level of parents, of older children as well as of close relatives living outside the household,
in an attempt to improve their previous education achievements.
There is no suitable environment here in the slum for higher education. Higher grades are for those
who have higher incomes. Moreover, I am not ready to support them for higher education because
the country’s overall condition is not good: there is no guarantee of job after taking 15 years of
schooling. But we believe he will get job at garment factories if he has at least five years of
schooling (Rafiq Rally).
The minimum threshold effect suggests the existence of a point where there is a change in
the degree of motivation. Before reaching the threshold, the household will be very
strongly motivated and reveal more investments in education. After reaching the threshold,
the motivation to continue sending the children to school decreases, as well as the
investment preferences of the household which are now more likely to succumb to, for
instance, financial barriers that the household faces.
This discussion suggests that the investment preference and to some extent also investment
behaviour in education, are determined by a stronger motivation. This is the result from an
increased awareness on the role of education, due mainly to the household’s own life
experiences and a more conducive external environment that signals its importance for a
better future. This awareness is formed by the household’s recognition that investing in
education means a better future for future generations. This recognition comes from their
own as well as from other people' experiences and perceptions on how their lives would
have been better if they acquired a certain minimum level of education. This, together with
the living in an environment which was supporting and promoting schooling, with several
government and NGO initiatives, further reinforced the awareness and fuelled the
motivation that shapes their investment preferences.

158
While exploring the extent to which motivation shapes the investment preference of the
household, a threshold effect emerged: household seems to adapt their degree of
motivation to ‘minimum’ threshold of education, which itself, is determined by two factors.
The first is a construct of the perception of minimum formal and informal requirement to
be employed in a decent job or to obtain decent wedding proposals and basic dignity and
honour. The second factor is about the education level of the household, which includes
the head of the households as well as other members, and the strong determination to
improve upon the households living conditions.
The implications of the minimum education threshold are important for understanding the
extent to which the investment preferences are revealed since the degree of motivation,
which changes when the threshold is achieved, shapes the efforts of the household in
realizing its investment preferences.
6.4 Understanding how categories interact: an explanatory model of the
investment preferences and behaviour in education
Households’ investment preferences and behaviour in education are the result of the
interaction of complex sets of factors, internal and external to the households. The
previous section has discussed these factors (categories) that shape preferences and
behaviour as individual categories. Here, I explore their relationships in the process and, in
doing so, this section answers the first research sub-question regarding an understanding of
the factors that enable or constrain urban households in opting for more investments, and
in engaging in riskier and higher return choices in education.
As extensively described in Chapter Five, identifying the relationships among categories
(theoretical coding) is the last analytical step in the development each dimension specific
explanatory model. The model answers one basic question: what are the main factors that
shape households’ preferences and behaviour with respect to educational investments, and
how are these factors interrelated? What the household reveals in education is the result of
a process that start with the construction of the household’s investment preferences, and
ends with the actual investment decisions. At different stages, this process is influenced by
factors which can shape either households preferences, or their revealed choices or even
both.
What shapes household’s investment preference in education are the motivation and
awareness brought in by recognition that investing in education means a better future for

159
the younger generations and the household. This is the result of a process of learning from
their own life experience and interpretation on how their lives could have changed (e.g. in
terms of employment, poverty status and honour). This, together with a more conducive
environment reinforced the awareness and fuelled the motivation that shapes the
investment preference of the household. The motivation and efforts to educate change in
relation to a household specific minimum threshold. The threshold is represented by the
minimum number of years that each household believe is required for obtaining a decent
job or just to improve their status.
The household shows high level of efforts to reach this threshold, are less likely to
succumb to, for instance, financial barriers that the household faces, and are more likely to
reveal more investments. The motivation and the level of efforts instead decrease after
reaching this threshold so as the likelihood to reveal more investments. After reaching this
threshold, only the commitment and performance of the child can enhance the household’s
efforts and attempts to bypass the barriers they face.
Indeed, a positive relationship also emerged between the investment preference of the
household and the child commitment and performance: the more the child is committed
and performs well, the more the household will be willing to invest more and is likely to
reveal more investments in education. In the case of a weak child commitment which may
reveal into bad performance in school, the household’s investment preference will not be
affected but their revealed choices will. In other words, if the household is willing to send
his child to school because they believe that education is important for their future, a weak
commitment will not change that; nevertheless it will translate into fewer investments in
education. A weak commitment and low performance of the child is an element of the
opportunity structure and may alone obstruct the investment preferences from revealing
into actual investments.
What the households reveals, the actual choice that the household make, is determined by
three elements: the financial resources available to address survival needs; external factors
and weak child commitment. The latter, in addition to contributing in constructing
preference has a role in its realization as well.
This opportunity structure only functions at the level of the revealed choices, and does not
shape the households investment preferences: the availability of additional financial
resources does not on its own trigger more investments in education. The resources (or
their lack of thereof) to be allocated for financing education and the nature of the external

160
environment are important for understanding the realization of pre-existing investment
preference in education.
In line with Lipton’s concept of a survival algorithm (Lipton, 1968), and Maslow’s
hierarchy of needs (Maslow, 1943), the household allocates its resources addressing its
immediate needs in ways that helps guarantee its survival. Even if education is considered
to be important for the future of the household, household’s actual educational
investments may be constrained by concerns around addressing immediate and survival
needs such as access to food and health care.
When the survival of the household is not at stake, redirecting resources from immediate
need, such as food and health, towards education becomes feasible and the household may
reveal more investments in education. Thus, in a context where a household’s survival is at
risk, the household is unlikely to invest as much as it would have preferred to do, but its
preference in educational investments will remain unaltered by its limited financial
resources. In other words, whereas issues of immediate survival have adverse implications
for the actual level of a household’s educational investments, such survival concerns have
no similar bearing on the household’s level of willingness or preference towards
educational investments. However, as new opportunities arise, as with when a new member
of such households enters the job market or gain access to some external support, the
household may begin to reveal levels of investments that mirror its investment preferences.
The investment behaviour in education mirrors the continuous transformation that the
households go through. Any change in the family situation has an impact on the
households’ income, resource allocation and ultimately on the extent of the threat to their
survival. Such transformation relates to new incomes available – or the loss of incomes-,
such as better and regular salaries, price increase of basic commodities. Not all incomes –
or loss of incomes- may trigger a resource allocation towards more investments in
education. This issue will be discussed further in the next section on the OAA.
A weak child commitment and performance has also a role in the opportunity structure. In
fact the household may decide to stop investing in education if the child does not show
interest in studying. This however will not affect the investment preference in education
but only what they actually reveal. The analysis suggests that investment preferences in
education are shaped by the ‘age of education’, a chain of concepts that have increased the
household’s awareness and motivation on education. This motivation however varies and is
built around a household specific minimum threshold, above which the motivation and
efforts of the household in investment in education decreases. Here, above the minimum

161
threshold, the commitments of the child seem to play a role in motivating the household in
continuing investments in education.
The investment choices are determined by an opportunity structure which filters the
investments preferences of the household. If such opportunity structure becomes
‘positive’, which means that financial resources for non-survival needs are available or that
the household has access to external support, and the child commitment is not weak, the
investment choices in education will mirror the investment preferences. Assuming that a
household is willing to send their children to school to higher grades a positive opportunity
structure, such as more financial resources available, will allow the household to reveal
more investments in education.
If the opportunity structure is ‘negative’, which means that financial resources for non-
survival needs are not available or that the household has no access to positive externalities,
or the child’s commitment to education is weak, the investment choices in education will
not mirror the household investment preferences in education. If a household is willing to
send their children to school to higher grades, a negative opportunity structure will act as a
barrier to its the realization. Figure 6.3 visualizes the process.
Investment preferences in education are formed and shaped by the awareness and
motivation to reach a minimum threshold level, as well as by the strong commitment of the
child and his performance in school. The motivation to achieve a minimum threshold,
together with a strong child commitment, may even have a role in ensuring that the
investment preferences will reveal into concrete investment bypassing any barrier, any
negative opportunity structure in place, such as the lack of any additional resources.
This is not always the case. The investment preference in education is filtered by an
opportunity structure that determines the extent to which it will translate into real choices.
The opportunity structure plays a major role at three levels.
First, as suggested earlier, the availability or lack of additional resources to cover immediate
and survival needs determines the extent to which the household preference will be
revealed. Second, access (or the lack of it thereof) to external support such as philanthropic
individuals may favour (or constrain) the realization of the investment preference of the
household. Third, a weak child commitment plays a role in deterring households to invest
in something that may not have good returns.

162
In answering the first research sub-question on education, I have highlighted the existence
of a two stage process that starts with the construction of the household’s investment
preference in education and ends with revealed choices. In the first stage, the household’s
preference is shaped by motivation to achieve a minimum threshold of education (a
product of the ‘age of education’ and personal experiences) by the commitment of the
child. In the second stage, the constructed preferences can be fully revealed if the
household has addressed its survival and immediate needs; if it has access to external
support; and if a school-going child has a strong commitment towards schooling.
6.5 OAA, investment preference and behaviour in education: a liquidity effect?
Following the analytical process detailed in Chapter Five, and building on the previous
sections, I have examined the OAA’s role in determining investment preferences and
revealed choices in education. The access to social protection instrument, such as the
OAA, would, as suggested by the SRM, enable the household to smooth consumption and
engage in higher risk/higher return investments, The discussion of households’ educational
preferences and revealed choices in this chapter does not seem to support this assumption.
The previous section suggests that the additional financial resources available, including the
cash transferred as part of the OAA, do not contribute to shaping households’ investment
preferences in education. Focusing on the investment behaviour in education, the OAA
Investment Preference in Education
Age of Education
Minimum Threshold
Strong Child Commitment
Opportunity Structure (+/-): -Financial resources: Survival -access to external factors -weak child commitment
More investments in education
Less investments in education
Preference towards less investments
Preference towards more investments
Figure 6.3: Investment preferences and behaviour in education (source: the Author)

163
does not seem to contribute in smoothing consumption56. Households are exposed to a
variety of transformations and the small cash transfers associated with the OAA are rarely
sufficient to function as a consumption smoothing instrument. In small households with a
very low income, however the OAA may have a visible impact on smoothing household
consumption.
While small but regular OAA cash grants did not have any major impact in smoothing
consumption, new substantial cash entering the household, such as new income from
formal employment, did. This implies that the size of the grant matters and that the
regularity of the transfer does not, on its own, result in smoothing consumption. The cash
transferred as part of the OAA may support the household in revealing more investments,
but only in relation to ‘smaller’ and ad hoc purchases or expenditures.
The previous section suggests that a resource re-allocation towards education may occur
only when survival needs are met. This occurs only when major transformations in the
household income take place, such as a new household member entering the labour
market, where the amount of the new financial resources available is considerable. When
this occurs the household may reveal more investments in education, and mirror the
investment preferences of the household, since the household is now able to cope with the
education costs such as tutors, school fees and uniforms, among others. On the basis of
the interviews conducted for this study, the OAA does not seem to have a specific usage
for major education expenses, but is rather often a contribution to the wider household
income and expenditure.
Nevertheless, the OAA is in some way linked to more investments in education, as some
beneficiaries use their pension resources for purchasing items aimed at enhancing the
education of their children. While some noted to have utilized their pensions (or at least
part of it) for the payment of exam fees, others reported having frequently utilized their
pension resources for purchasing books for their children. This however seems to occur
only when the timing of the transfer coincides with an ‘educational’ event
That money [OAA] was actually used for my two children’s schools. Coincidentally, the money
was received at the time my daughter needed to buy books plus other study materials, so that the
cash was used to buy them (Ambiya Rally).
56 All concepts and events dealing with OAA and education dimension have been grouped in the category of financing education. These events dealt with the allocation of some of the cash received under the scheme to revealed education choices that the household made.

164
The contribution is unavoidable. For example, using the last allowance money, we met a pressing
need to pay the exam fee for SSC (Aroti Rally).
These minor and ad hoc expenditures, such as the payment for books and school bags or
for covering exam fees, are obviously important for the education of the child and may
indicate that the OAA can directly contribute to the household in revealing more
investments in education. This is especially so in contexts where school-going children
were hitherto not receiving any family support with respect to the above school inputs due
to lack of the kind of resources that have now been made available by the new cash
transfers associated with to pension schemes.
Two issues emerge here. First, the revealed investments which can be directly linked to the
OAA deals with minor expenditures, a book or a school bag, rather than major
expenditures such as payment of tutor or selection of school,. Second, these expenditures
seemed to be linked to a ‘timed liquidity effect’: if when the period of payment of the OAA
coincided with a ‘pressing’ educational need, the OAA contributed to revealing more
educational investment, at least in relation to relatively minor educational inputs. However,
once the OAA grant reaches the household ‘pot’, any direct effect on education
investments is hardly traceable.
The OAA does not shape household investment preferences in education. Instead it may
contribute to reveal more investments in education. On its own, I identified incidents
which suggest that the OAA, which does not seem to have a role in smoothing
consumption because of the small grant size, may contribute to, under certain
circumstanced, more investments in education. These investments may be considered
minor and ad hoc when compared to other major and regular types of investments in
education. This suggests that the size of the transfer and that the ‘timing’ of the transfer
coinciding with timing of the education expenditures, are important variables in
understanding the extent to which the OAA can contribute to enhancing households’
capacity to revealing more investments in education.
6.6 Conclusions
What determines the investment behaviour in education of the households targeted by the
OAA? This chapter has examined and conceptualized the why and the how of investment
in education by households in poverty and the role of access to social assistance
interventions in this process. In line with the distinction between investment preference
165
and actual investment behaviour, the findings in this chapter shows that households’
investments in education are the result of a process of realization.
In this process, different factors play an important role in constructing the household’s
investment preferences in education and in allowing the preferences to be realized, in terms
of actual educational investments. The explanatory model suggests that investment
preferences in education are formed by the household awareness of the role of education in
improving people’s earnings, on the household’s motivation to reach a minimum threshold
of education, and on the positive attitude of the school going child. However, whether and
to what extent these investment preferences in education are actualized depends on a
variety of other factors, including the availability of financial resources that exceed the
household’s requirements in terms of addressing some immediate and survival needs.
From the analysis of the data, it also emerged that the role of OAA in the household’s
investment behaviour in education is limited to financing ‘minor’ education investments,
such as purchasing books or stationery. This may occur only under some circumstances
though: if survival needs have been addressed and if the timing of the transfer coincided
with ‘pressing’ minor educational investment needs. The limited amount of the cash
transferred under this scheme seems to be the major cause behind this, since I have
identified that major income transfers, such as a new household member entering the
labour market, may instead have an impact on smoothing household’s consumption.

166
CHAPTER 7. Households’ Investment Preferences and Behaviour
in Health: a role for the Old Age Allowance?
7.1 Introduction
The previous two chapters have examined in detail the key factors that shape the
investment preferences and investment behaviour of the households in the dimension of
savings and education, with a special focus to the role of the social pension scheme. This
chapter follows the same analytical framework to examine households’ investments in
health, and explores the potential role of social assistance interventions in shaping such
investment decisions. In line with the previous chapters, I start by presenting important
linkages between health, poverty and behaviour in the literature that define what I can
expect to identify during the analysis of the fieldwork data. Afterwards, I present key
‘discovered’ categories (factors) that can define the household’s investment preferences,
investment behaviour or both. This is followed by a section that integrates the categories
and introduces an explanatory model of household’ investment preferences and behaviour
in health. The chapter ends with an in depth analysis of the social pension scheme and an
exploration of the extent to which it fits in the model and can contribute to defining
households’ investment preferences and behaviour in health.
7.2 Household’s investment preferences and investment behaviour in health
There is widespread evidence that a healthy population is a necessary condition for
stimulating sustained economic growth. In his seminal work over the years, Fogel et al.
(2011) showed that the increased food and calories available, and the consequent better
nourished workforce has increased the labour productivity and has, over the course of 200
years (1780-1980), contributed to 30 percent of Britain’s economic growth. While Fogel
viewed a healthy population as synonymous with a well-nourished workforce, others have
identified factors that mediate the link between health and economic growth. One such
important mediating factor identified in the literature is life expectancy (Barro, 2013;
Bloom et al., 2010). In a cross country comparison, for instance, Barro (2013) estimates
that a 10 percent increase in life expectancy could contribute to increasing economic
growth by about 0.4 percent.
Similarly to the linkages between health and economic growth, a strong relationship
between poverty and health has been established in the literature. The empirical evidence is

167
clear, for example, that poor health outcomes such as high mortality and morbidity often
tend to be more prevalent in developing countries and specifically among poor households.
Also, ill health as well as the costs associated with it, can have a detrimental impact on
household’s income and may contribute to people falling deeper, or remaining into poverty
(Dupas, 2011).
While on one hand, some evidence suggests that informal coping mechanisms (e.g. relaying
on a social support network, accessing credit and selling assets) are often adequate to
address small changes in health, such as minor illnesses, these might not be sufficient in
supporting households in dealing with major catastrophic health changes, or health shocks.
For instance, Gertler and Gruber (2001) found that poor households in Indonesia are more
likely to be able to cope with recurrent minor health changes, but are unable to adequately
manage through informal coping mechanism, major health household shocks that limit
their physical functioning. A major health shock can in fact have economic costs in terms
of the reallocation of the household’s expenditure toward medical costs such as medicines
or specialist doctors and hospital treatment, but at the same time a loss of income due to
the exiting of the ill household member from the labour market (Lustig, 2001).
Two ‘stylized facts’ (Dupas, 2011: 426), exist on health and poverty. First, poor households
in developing countries have out-of-pockets-health expenditures proportionally much
higher than in developed countries (Cunningham, 2009; Shen and McFeeters, 2006). Even
more, they are more likely to face catastrophic health expenditures, when the expenditures
exceeds 40 percent of the household income, compared to developed countries (Xu et al.,
2003). The second stylized fact is that poor households in developing countries tend to
invest less in preventive and more in remedial health care, even if, in developing countries,
the returns to investments in preventive health are extremely high. Jones et al. (2003)
estimate that if households invest sufficiently in preventive health care, this could
contribute to a reduction of under-five mortality by 63 percent.
Across sub-Saharan Africa, the incidence of malaria, vaccine preventable diseases and
mortality can be drastically reduced by investments in treated mosquito nets and
immunizations. The costs associated to purchasing (and treating) mosquito nets are much
lower than the cost associated with treating malaria and its impact on children educational
attainment (Lucas, 2010). Similarly, Banerjee et al (2010) estimate that globally, low
households’ investments in vaccines for their children, results in the death of between two
and three million people from immunization-preventable disease.
168
The low investments in preventive health products or care, shows an inconsistency with
the neoclassical model of economic behaviour in rationally assessing the costs and benefits
of investment in preventive health. This inconsistency will also be part of the discussion in
this chapter which will attempt to identify the key factors that influence household
investment preferences and behaviour and how these interact in my explanatory model.
Recent national surveys in Bangladesh such as the Demographic health survey (DHS 2011)
and Household income and expenditure survey (HIES 2010) have shown improvements in
key health indicators, such as the reduction of under-five mortality (44 per 1000 live births
with a MDG target of 48) and maternal mortality ratio (194 per 100,000 live birth with a
decline close to the MDG indicator of three percent per year) in line with Millennium
Development Goals four and five. These surveys also identify that the distribution of such
improvements is unequal across the income quintiles. A recent study suggests that
households in the richest quintile allocate more financial resources on health compared to
poorest quintile, but that the ‘risk of financial catastrophe was higher in the poorest
households indicating that the burden of financial catastrophe falls disproportionately on
the poor’ (Rahman et al., 2013: 5). Unequal health outcomes and unequal risk of
catastrophic out of pocket health expenditures are important issues that need to be dealt
with in order to improve the well-being of the poor and poorest.
Even if the public health system is subsidized by Government, the risk of having high
health expenditures and catastrophic out of pocket expenditures for the poorest quintiles is
high. The limited capacity to allocate resources to health needs, the lack of or the limited
access to formal and informal insurances mechanisms as well as the existence of a public
health system that is far from being free, are key issues in understanding how health is
interlinked with poverty in Bangladesh (Rahman et al., 2013: 9).
The brief discussion on the relationships between health and economic growth on the one
hand, and health and poverty on the other, points to a very intuitive relationship.
Investments in health are an important factor and would bring positive returns to
households and a nation as a whole. Here, an important distinction needs to be made.
Investment decisions in health can deal with preventive and remedial health, which
respectively deal with decisions that attempt to avoid falling sick, such as purchasing
mosquito nets, and to address a health shock, such as a stroke. However, in this study, the
discussion with the households tended to focus on remedial health only. The focus on
remedial health only of all households interviewed, is per se an important finding as it
169
reveals that households have virtually no understanding of health benefits they could derive
from preventive health services.
Defining what health means and why it is important for the households interviewed is far
from being an easy task. Several households discussed health mostly in relation to child
delivery, buying medicines, visiting doctors, as well as accidents (health shocks). Using
these issues as a starting point, the discussions held during the interviews focused on how
households have managed and are managing their health by examining the choices they
have revealed and why.
As extensively discussed in the previous chapters, this research has adapted the
terminology of the SRM framework to explore what I defined as the degree of risk in
relation to household’s preferences and behaviour in several dimensions of their lives. In
Chapter Three I have also presented an important distinction that this research makes:
preferences and behaviour need to be examined as two sides of the same coin with
different characteristics, properties and relevance. In the health dimension, investment in
health refers to household’s preferences and behaviour that would lead to better and
healthier life, with long term positive impact on the individual and household wellbeing.
For instance, a preference and behaviour towards more investments in health would
therefore be willingness to (preference) and the actual (behaviour) visiting regularly doctors
to monitor a diagnosed chronic disease, or willingness to (preference) and the actual
(behaviour) purchasing of all medicines and performing all test prescribed by a doctor, or
willingness to (preference) and the actual (behaviour) delivering babies in appropriate
health facilities. As in all the dimensions (savings, education and health) discussed in this
research, the household’s investment preference and investment behaviour is derived by
comparing the household’s preferences and behaviour in the past, before the start of the
pension, and in recent times. After this comparison a more in-depth discussion helped in
identifying why changes have or have not occurred in both their investment preferences
and investment behaviour.
A total of 31 households have initiated ‘unsolicited’ conversations on health. This is the
second most common topic discussed by the households interviewed, just behind the
education dimension. The literature presented in Chapters Two and Three, specifically in
relation to social protection, poverty exits and risk taking, suggests that an explanatory
model of household’s investment preferences and behaviour which this research aims to
develop, would validate or refute two opposite perspectives.
170
On the one hand, we presented the literature on SRM and neoclassical economics which
suggests that access to social protection instruments has a positive influence on individuals
and households’ behaviour in engaging in more investments. Specifically, to the dimension
and issues discussed in this chapter, this view implies that households with access to the
OAA will invest more in health when compared to the period before the start of the
pension. Households will, for instance, purchase all the prescribed medicines, visiting y
doctors more regularly, and delivering babies in hospitals among others. In other words, we
would expect to find that the OAA would have triggered, directly or indirectly, a change in
preferences and revealed choices in health care. On the other hand, the multidisciplinary
perspective that suggests that households’ behaviour in relation to grasping these new
prospects that social protection has contributed in opening, are influenced by a complex
interaction of factors endogenous and exogenous to the households itself, rather than
being the effect of reduced income variability and consumption smoothing. This view
implies that reduced income variability and consumption smoothing, brought in by the
access to the pension can be one of many important factors that shapes the household’s
investments preference and behaviour. Specifically to the health dimension, we would
therefore expect that the explanatory model will identify and explain whether and how
these factors actually shape the household’s investment preferences and behaviour in
health.
7.3 Categories in the health dimension
What shapes household’s investment preference and revealed choices in health? What
underpins some of these specific events? What are the umbrella concepts that can
aggregate specific events and concepts emerged during our discussions on investment
preferences and behaviour in health? These questions guided the analysis of the data during
the field data collection, preliminary analysis phase and in the final analysis. The process of
‘discovering’ categories, or factors was guided by examining specific events and concepts
identified during the discussions with the households. I did this by asking questions such
as: What underpins some of these specific events in relation to health preferences and
behaviour? What are the overarching concepts (categories) that can aggregate specific
events and concepts that emerged during our discussions on health preferences and
behaviour? By applying this analytical framework, I was able to piece together specific
events and concepts into broad conceptual categories, and to explore the functioning of
each category in relation to the household health preference and behaviour.

171
7.3.1 Survival lens
This category assembles events and concepts that emerged from the discussion with
households on how they interpret any health event that occurs in their life. All events
related to health are filtered or analysed through a survival lens that shapes both their
investment preferences and investment behaviour. Health events which may be as small as
a cold or ache as well as major events such as broken bones, life threatening injuries
resulting from major accidents or long term conditions, are all assessed in terms of their
survival output: does the event threaten the survival of the individual or the household?
Threat to the survival of the individual refers to events that can cause the death of any
household member. Threat to the survival of the household refers to events that will not
cause death but can affect the functioning of the households, such as events that can affect
the main income earner leading to some of income loss for the family.
When survival is at stake, the household will be willing to invest more, by for instance
paying for major treatments or visiting renowned and well-equipped hospitals in the
national capital. In contrast, when health events are not perceived to be a threat to survival,
the household will be less willing to reveal more investment. Several of my interviewees
underscored this point, expressing it in different ways:
Our first priority is to save a life. Only after this do we start thinking of how to pay the money
back. If you are in an urgent need, you have to do anything in your power to convince someone to
give you money to meet your health needs. The difficulty in repaying the loan is not an immediate
concern in such circumstances (Anis Rally).
We cannot buy all medicines. The cost of medical care has increased and is a bit higher at present.
But if survival is at stake, we have to buy medicine even if we have to borrow money instantly
(Purobi Rail).
One issue that was brought up and discussed very often as a threat to survival was child
birth. Households interpret and perceive that child delivery in homes is often linked to
complications that endanger the lives of newly-born babies and their mothers. While the
issue of perception will be discussed in the next category, here survival also shaped the
households’ preference in giving birth in a hospital:
People face many other health challenges. That’s why today, people prefer visiting health centres.
For instance, in case of deliveries of babies in the house if the patient or the baby dies, who would
take the responsibility? But if a pregnant woman stays and delivers in a hospital, all the
172
instruments including doctors and medicine are available for solving health or delivery complications
(Srijani Rail).
Similar investment preferences and behaviour are also noticeable where ill health has
adverse implications for the income of the family. For instance, in a two member
household, where both member are elderly and jointly manage a small business, even if the
a health condition is not life threatening and might not require immediate access to health
care, the degenerating condition of one member may have an impact on the business itself,
the only source of income:
We do not pay a lot of money to doctors. But we use a lot of money to buy medicine. We cannot
skip it even if the price of the medicine has increased two or threefold. As long as I survive I have
to go to the doctor. My husband’s problem is not that severe and he has never found himself in a
situation that requires us to see a doctor frequently. But we still prefer visiting doctors, including
high profile doctors. Our health spending increases day by day and a major portion of whatever we
earn often go into medical treatments (Tarek Jim).
Survival motivates and shapes the investment preferences and behaviour of the
households. No matter what barriers exist, if survival is at stake the household will reveal
more investments in health. The higher is the threat to survival, the higher is the
motivation to invest more in health.
Not all health events are a threat to survival. When this happens, when the health event is
perceived not to be life threatening, the household is willing to address the event as part of
normal expenditure, tailoring it to the resources available and their own preferences, which
filters the revealed investment behaviour.
We almost never go to see a doctor. But I always continue to buy medicines. If I stop the medicine,
my stomach pain will start again. Also my husband has some kind of skin disease. It spreads
during the winter but it is not a major problem. We have always used a government hospital for
treatment. I know that health in old age is an incurable problem. So why spend more money to
visit more expensive and renowned doctors? (Monir Jim).
Q. did you take all the medicines the doctors suggested years back? I buy the amount of medicine
as far as I can afford. I don’t go to specialists because of their higher service charges. Earlier, my
income was extremely low. Now it’s better. So I have been able to save some money. If I go to a
good physician I have to pay 600-700 taka which is a big amount and beyond my ability. That
would end up all my monthly income (Parul Rail).
173
Households’ preferences in health are about surviving and maintaining a basic functioning
to continue working and to guarantee an income stream. The more the health event is seen
as a threat to the survival and basic functioning of the individual and households, the more
the household will be willing to invest more in health.
The threat to survival shapes the investment behaviour when dealing with health issues.
Irrespective of the barriers that households may be facing, it appears evident that they will
still be oriented towards more health-related investments in order to guarantee the survival
of an individual member of the household. When a health event that threatens the survival
of the individual or of the households occurs, households will reveal choices that show
higher investments in health. However, if the health event is not seen as a threat to the
individual or household’s survival, their health investment behaviour, what they will reveal,
will most likely be filtered by the availability of income, as well as their perceptions and
knowledge about the ill health. I discuss this further in the next section.
7.3.2 Perception and knowledge on health
What is perceived to be a threat to the survival of the individual and of the household,
requires choices that protect their basic functioning. Perception therefore plays a major role
in defining what a threat is and therefore a particular health event is classified as life-
threatening or not. Based on the way the health event is classified, the household will
prefer and reveal choices that will show higher investments or choices that are filtered by
other factors, such as the availability of income.
In health care, perception becomes fundamental in understanding how preferences and
behaviour for higher investments in health is formed and revealed. Perception is interlinked
and often defined with the notion of knowledge – what a household’s knows on specific
issues. The ‘sources’ of knowledge are many: it can be via a neighbour or a friend, an
information campaign by NGOs etc. During the fieldwork, the role of perception and
knowledge were widely discussed in relation to health issues, as it relates to the issue of
child birth in particular.
The households interviewed seemed to have formed an opinion that delivering babies in
hospital is much safer than doing so in their own homes:
Now babies are not being delivered easily. They’re taken to hospital, and need to be injected
medicines. Also babies die and mothers fall ill. So clinics are thought to be safe (Purobi Rail).
174
During our time, there were no such things like frequently going to hospitals, visiting doctors.
People themselves didn’t feel such need to do so. But today, there are lots of diseases and health
complexities around. People do have these evils because they eat poisonous foods, they breathe
polluted air and so on. 15-20 years back, women used to give birth normally. Dai matari
[traditionally skilled midwives] living within the colony handled all births (Awlad Rally).
The perception of household that delivery of babies in the house is dangerous and can lead
to major complications for the new born is the direct result of the increased literacy of the
community. People have become more educated and knowledgeable about the dangers
associated with out-of-hospital child births: As one respondent explained, until quite
recently,
People were ignorant, illiterate and unaware of the health issues. Our parents were able to send us
to school, but that was not common and we could only read the Quran and some other relevant
materials. But today, even the beggars on the street take their children to school. This was not seen
in the past. …. The fact is that the difference between the people of our time and the people now is
like an ocean (Ambiya Rally).
Before people did not know the risks [of delivering babies at home] involved. They didn’t have
education, which is now available for every household; children from all houses are going to schools
now (Purobi Rail).
Clinics in the urban centres are perceived to be safer and easily accessible, when compared
to rural contexts and to home delivery which are often performed by unskilled midwives.
The limited faith in local midwives in terms of effectively managing potential emergencies
associated with child birth at homes is also an important factor that determines households’
preference for child delivery in hospitals. Thus, even when traditional birth attendants are
available, concerns for safety and survival still derive many households to opt for child
delivery in hospital facilities. as several respondents noted. This point is illustrated by the
following claims from my interviewees, all of whom expressed their preferences for child
delivery in hospitals on safety grounds:
I noticed a mistake done by the local midwife.. ...Because of this, I know a baby died in the
vicinity. So we have never gone to the non-professional midwives since then. In fact, my three
grandchildren were born with the support of hospital nurse (Halima Rail).
My sister’s baby died during the delivery because of the non-efficient hands of the midwife at home.
They couldn’t save the baby, which was born dead through the operation after the midwife had
failed. The midwife herself killed the baby (Hasina Rally).

175
The perception and belief of the urban midwife as unskilled and a threat to the survival of
the child and the mother has also been fuelled by experiences lived by neighbours or family
members.
The actions taken by the government, when coincide with other sources of knowledge like
neighbours or schools, also seem to contribute to build the perception about clinics to be
safer compared to home delivery.
In this situation the government says, it is better to go to the hospital for the delivery of babies.
Government now forbids conducting delivery in homes (Purobi Rail).
Perception on the safety of clinics compared to delivery at home, is important in explaining
why households now prefer and reveal behaviour that shows higher investments in health.
In addition to shaping the preferences of a household in classifying the health event on a
survival scale, perception and knowledge also play an important role in prioritizing choices
that households need to make in case of ill health. This applies mostly for health events
which are not classified as a threat to survival where the household will need to choose
among different strategies, such us taking medicines, undergoing tests or visiting doctors or
a combination of those. While choices among these options are mainly dependent on the
availability of financial resources (see next section), households can still manoeuvre among
several options that they are available and choose based on what is perceived to be the
most efficient and effective. For instance, households can decide to allocate their limited
resources to buying some medicines rather than visiting a doctor, or visiting a private
doctor rather than undergoing tests.
The household’s investment preferences in health are shaped by how a given health event
is perceived. This perception defines the way the household constructs the riskiness of the
delivery, and is itself defined by the fact that people know more, are more educated and
more able to assess the what is safer, for instance, than a delivery with an untrained
midwife. The role of the government seems also to have an impact on the knowledge that
households have by signalling, similarly to what described in the education dimension, the
appropriate action to follow, implying that hospitals delivery is safer. Here, the event of
giving birth is interlinked with the fact that the household perceive it as threat to the
survival of the baby and the mother. These two categories therefore interact and are two
sides of the same coin: perceived threat to survival defines how the household classify the
health event and contribute in shaping their preference and behaviour to invest more or
less.

176
Perception and knowledge works at the level of the preference, by shaping the way
households perceive the health event in relation to survival, as well as at the level of the
household’s behaviour, by shaping the adoption of strategies that are considered most
efficient and effective.
7.3.3 Financing health
When survival is not perceived to be at stake, households classify the health event
differently and reveal behaviour which is dependent on an opportunity structure, where the
availability of financial resources plays a major role.
When financial resources are limited and when survival is not at stake, the household sees
health care as any other expenditure and might end up prioritizing other expenditures.
Similar to the analysis done in the chapters on education and savings, the household will
reveal more investments in health care if additional resources become available in the
family. Several factors – including multiple incomes and a lower dependency ratio, changes
in the type and degree of regularity of employment (which would for instance favour access
to credit), support from the richer members of the extended family as well as external
events such as price hike of commodities (including medicines), and support from the
employers – all define the extent the which the households will reveal higher investments
in health. The OAA has also had some major implications for health, and will be discussed
later in this chapter.
Nevertheless, the decision on how much household resources are allocated to health
expenditures is shaped significantly by how the household classify the health event in
relation to survival. While the delivery of babies is perceived and classified as a threat to the
survival of the baby and mother in ways that limit households’ options in terms of
investment preferences, other relatively minor health conditions (e.g. sicknesses such as
skin rashes) are not classified as life-threatening and therefore the households may choose
how to address these health events in a variety of ways, based on the resources available.
Visiting doctors or visiting well renowned private doctors, purchasing medicines and
performing tests are among the strategies that households can adopt in response to such
relatively minor health conditions based on availability of resources. The way these
strategies are adopted is also dependent, in addition to how the health event is classified
and perceived and the consequent willingness to allocate resources, on their own
experiences and beliefs. For instance some households may consider starting the process
by seeing a doctor in a public health clinic, which will then prescribe some tests and some

177
medicines; some may choose to resort to self-medications, whiles others may prefer to visit
a well renowned private doctor from the outset:
Sometimes, we were having the test within the hospital; other times in clinics outside the hospital.
However, private hospitals charges were always higher. Whatever you do, it is always about money.
When I had money I did the tests, and when there was no money, I usually ignored doctor’s
prescription (Purobi Rail).
I say ‘damn’ tests! They use up huge money, why should I go? But I take the medicines the doctors
prescribe. Q. But why not the tests? How can I do? I always have money problem. Doctors always
request for tests and we took them when we had money and didn’t when we had no money, that’s
it. What we regularly did and still do is to take the prescribed medications (Hashem Rail).
The doctor told me to continue the prescribed pills for the rest of my life. Recently the price of those
pills increased. The doctor told me not to skip taking my pills even for a single day. But I need
100 taka medication per day. Where can I get money to spend a hundred taka on medicine every
day? (Purobi Rail).
While all these strategies and combination of strategies are needed to cope with the limited
resources available, if the households has access to additional resources such as additional
salary or a well-paid employment and supporting family members, the households will
reveal higher investments in health. In reference to her daughter’s support, one respondent
noted:
She is just a housewife but her husband has a good salary working as a driver in a good
organisation. Whenever I need money she comes up, together with other relatives, with help without
asking anything from me in return. and the money from my pension is also helpful, and I spend
the whole pension on my health (Aslam Rishi).
In a resource-constrained household, the allocation of resources to health expenditures for
the elderly may also be influenced by a combination of other factors such as the presence
of school going children, a strong motivation towards educating younger children, as well
as the desire to avoid being perceived as a burden for the family. Therefore, investments in
education may be preferred to health expenditures.
I did not use any medicine and I did not visit eany doctor in the last few years. Because it requires
a log of money, I don’t want to create any trouble for my son. He is the son that runs the tea shop
and has more important family commitments because his own children are studying at higher levels
(Lipi Jim).
178
The availability of financial resources influences the extent to which the household reveal
more investment in health but it does not seem to have implications on their investment
preference. When health choices are not linked to survival, they will be subject to the
availability of resources that will inform the extent to which more investments will be
realized. Other factors are also important here, however, including the household’s own
perception on the different strategies available to them such as visiting good doctors and
buying all the medicines that have been prescribed.
7.4 Understanding how categories interact: An explanatory model of the
investment preferences and behaviour in health
To fully comprehend the way the categories discussed earlier interact, it is important to
underscore again that, in the discussion with households, health is understood as ill health,
health event, sickness or accident rather than well-being and good health, and any action is
directed towards addressing a health event and its consequences (remedial), rather that
attempting to maintain and protect good health (preventive).
As in previous chapters, the investment preferences and behaviour of the household is the
result of the interaction of complex sets of factors, internal and external to the households.
The previous section identified and explained the functioning of individual categories,
survival, perception and knowledge, and health financing. These categories are clearly
interlinked. This section, moves away from the analysis of the categories as standalone
blocks to an exploration of their relationships. The interest is to present a model for the
health dimension which can explain and predict the investment preferences and behaviour
of the households. As my discussion so far suggests, households investment preferences
(their willingness to act in a certain way) and their investment behaviour (what the
households do, what is revealed) do not necessarily mirror each other. In other words, if a
household is willing to visit a doctor, it will not necessarily go to see a doctor. Nevertheless
households’ preferences and behaviours are sequential and part of the process which is
influenced by factors that can shape households preferences, their revealed behaviour or
even both.
In addition to these observations, this section also confirms Dupa’s (2011) point that
health and well-being in developing countries are always oriented towards remedial rather
than preventive health care. As we have seen, although respondents for this study initiated
discussions on health, they never mentioned any form of or strategy towards preventive
health care. I have also identified some evidence on Dupas’s (2011) other stylized fact, the
179
high out of pocket expenditures for poor households. The way households actively search
for additional resources to cope with health expenditures and the way household budget is
affected by the costs of medicines, suggests that health expenditures are an important
component of the household’s overall expenditures. This is also aggravated by the
additional ill health that is often associated with old age.
Investment preferences and the revealed behaviour in health both depend on how the
household classify a health event in relation to the concept of survival. Survival refers to
both saving the life of a household member as well as to saving the household from its
financial collapse. The more the health event is perceived to pose a threat to the survival
of the household or one of its members, the more the household will be willing to invest.
The perceived threat to survival will motivate household to search and identify resources
that will ensure that their preferences get translated into concrete actions. When survival is
at stake, the investment preference and revealed behaviour will overlap and any financial
barrier will be bypassed.
The process that households undergo to define and locate the health event on a ‘survival
scale’, is a process of ‘editing’ and ‘classifying’ the event itself (Camerer et al., 2004: 127).
The way household classify the event is based on their own knowledge which is itself the
agglomerate of different sources such as rumours, their own or other family members’
experiences as well as their access to education. The individual and collective knowledge
that households have on a specific health events defines how it is perceived and classified
in the survival scale which in turn shapes the household’s investment preference: if the
health event is classified as a concrete risk to survival of the household’s member or of the
household’s itself, the household will be willing to invest more and will reveal also higher
investments, regardless of the financial barriers it may be facing.
If a health event is not perceived and classified as a threat to the survival of the household’s
member or to the household itself, household may reveal lower investments (e.g.
purchasing only some, and not all prescribed drugs). While their investment preference
might remain constant, the availability of financial resources and their perception and
knowledge will define if the household will reveal higher investments. In this case, the
investment behaviour of the household will not necessarily mirror its preferences if
financial barriers are in place. The financial barriers in place and the accessibility of
strategies to overcome those will define the extent to which the revealed behaviour will
mirror the household’s investment preference. Strategies to overcome financial barriers

180
can be the search for support from friends, family or even the employer, as well the access
to credit.
Similar to what I defined as a minimum threshold in the education dimension, households
seem to also define a threshold in health which is defined by what they perceive or know to
be a threat to the survival of the individual or household. The willingness to invest more is
shaped by this minimum survival threshold to guarantee a basic functioning which
determines the extent to which their preferences will be revealed into actual investments.
For instance, it will shape the extent of their willingness to use more resources to ensure
the survival of a baby and his mother during child birth, and the actual use of additional
resources to pay for a delivery in the hospital.
The way a health event is perceived on survival scale is the only element that shapes
household’s investment preferences in health. In turn, this also defines the extent to which
the households’ preferences will reveal into real choices.
A health event does not always place the individual or household’s survival at stake. In this
case, the opportunity structure comes into play. This opportunity structure can create a
barrier or favour the realization of investment preferences of a household when survival is
not at stake. The opportunity structure can act to constrain or favour the translation of the
investment preferences in health into actual investments, and is defined by the availability
of financial resources and perception and knowledge of the efficiency and effectiveness of
the options that households have. The opportunity structure only functions at the level of
the revealed behaviour, and does not define the investment preferences of the household:
financial resources available or the efficiency and effectiveness of the options that
households have do not trigger preferences towards more investments in health.
If the opportunity structure is ‘positive’, which means that financial resources are available,
the investment behaviour of the household will mirror the household investment
preferences. For instance, if the household is willing to buy medicine or doing tests for
what is perceived as a no life threatening condition, if money or access to money is easily
available, the household will purchase all prescribed medicines or undergo all prescribed
tests.
However, if this opportunity structure is ‘negative’, which means that financial resources
required are not available or easy to access, the household may reveal choices that do not
mirror their investment preferences. If, for instance, the household is willing to buy
medicine or doing tests for what is perceived a no life threatening condition, if money or

181
access to money is not easily available, the household will not purchase all prescribed
medicines or undergo all prescribed tests. Rather, the household will define and prioritize
what medicine to buy and what test to undergo based on the resources available and their
own perception and knowledge. A household may define purchasing only half of the
prescribed medicines and only few prescribed test, based on what they perceive as the best
way for addressing the health event. Perception and knowledge shapes the prioritization of
the choices the household takes and is the results of their own experiences, of their families
and friends.
Figure 7.1 visualizes the process from constructing investment preferences to revealing
choices in health. The investment preferences in health are formed and shaped by how the
health event is classified (perceived) on a survival scale. If the health event is classified as a
threat to the survival of the individual member or the household, the household is likely to
have preferences towards higher investment in health. In this case, guaranteeing survival
becomes the element that motivates households to bypass any barrier, any negative
opportunity structure and to search for and identify resources that will ensure that their
preference will be revealed in concrete actions.
This is not the case when the health event is not perceived to be linked to survival. Here,
household’s investment preference will be dependent upon the way the health event is
classified on a survival scale: the less the health event is perceived to potentially threaten
the survival of the individual and of the household, the less the household will be willing to
invest.
Nevertheless, when the health event is not perceived to be threatening the survival, the
opportunity structure plays a major role at two levels. First, the availability of financial
resources defines the extent to which the household’s preference will be revealed. If
financial resources are available for health, the household will reveal actions that mirror
their investment preference. For instance, if the household is willing to see a doctor and
undergo all the necessary test, the household will pay for doctor consultation and tests if
financial resources are available.
Second, if financial resources are not available or are not enough to cover the costs, the
household will go through a process of prioritization and selection of what they believe are
the most efficient and cost effective strategies. Their prioritization and selection of
strategies will be shaped by their experiences and knowledge and might lead to consulting a
pharmacist and buying medicines, or visiting a doctor and ignoring to undergo some of
their prescribed tests.
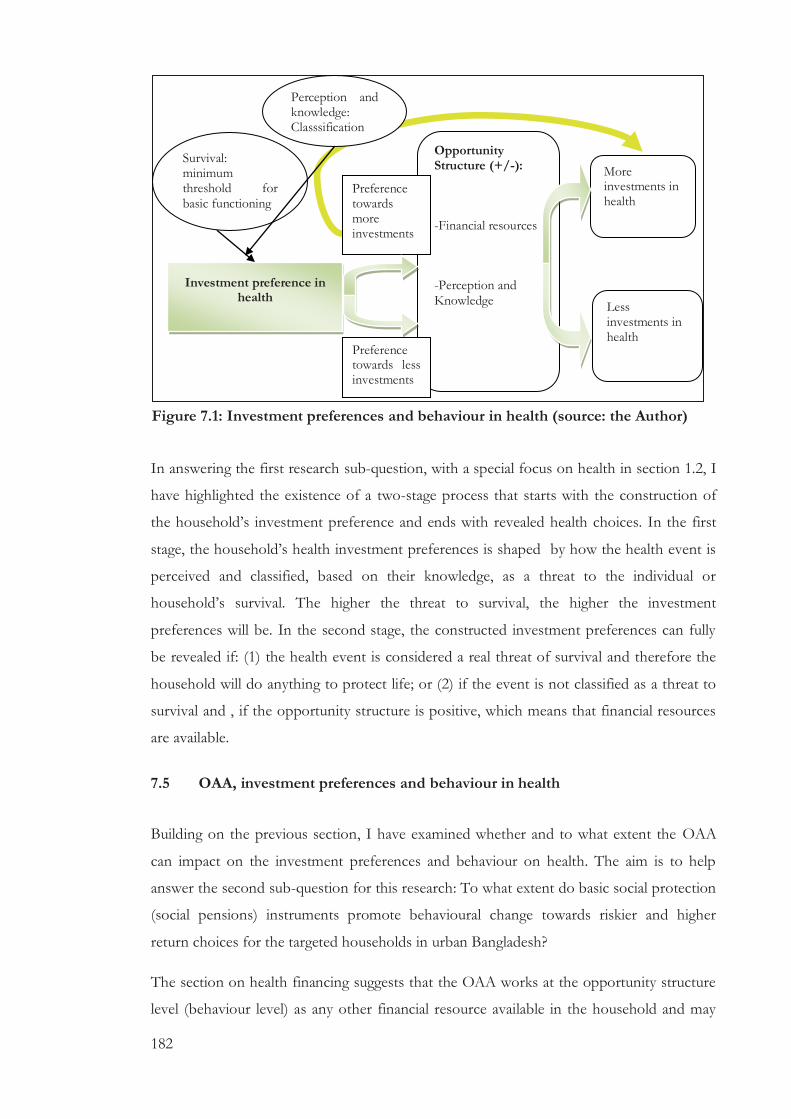
182
In answering the first research sub-question, with a special focus on health in section 1.2, I
have highlighted the existence of a two-stage process that starts with the construction of
the household’s investment preference and ends with revealed health choices. In the first
stage, the household’s health investment preferences is shaped by how the health event is
perceived and classified, based on their knowledge, as a threat to the individual or
household’s survival. The higher the threat to survival, the higher the investment
preferences will be. In the second stage, the constructed investment preferences can fully
be revealed if: (1) the health event is considered a real threat of survival and therefore the
household will do anything to protect life; or (2) if the event is not classified as a threat to
survival and , if the opportunity structure is positive, which means that financial resources
are available.
7.5 OAA, investment preferences and behaviour in health
Building on the previous section, I have examined whether and to what extent the OAA
can impact on the investment preferences and behaviour on health. The aim is to help
answer the second sub-question for this research: To what extent do basic social protection
(social pensions) instruments promote behavioural change towards riskier and higher
return choices for the targeted households in urban Bangladesh?
The section on health financing suggests that the OAA works at the opportunity structure
level (behaviour level) as any other financial resource available in the household and may
Investment preference in health
Survival: minimum threshold for basic functioning
Perception and knowledge: Classsification
Opportunity Structure (+/-): -Financial resources -Perception and Knowledge
More investments in health
Less investments in health Preference
towards less investments
Preference towards more investments
Figure 7.1: Investment preferences and behaviour in health (source: the Author)
183
contribute in revealing investments in health. There is an important fact however that
needs to be mentioned here. While health was discussed evenly across the slums that were
part of this study, the households that discussed the role of the pension in health were
concentrated in two areas only, Jimkhana and Rishipara. An extensive analysis of the
qualitative data with the quantitative information incorporated in Nvivo and linked to each
household did not show any important similarities among households. Nevertheless, the
analysis of the two slum areas shows that these are overall poorer compared to Rally Bagan
and Railway, in terms of income/expenditures indicators collected during this fieldwork
and in line with two recent studies on urban poverty in Narayanganj (UPPR, 2011; Rukhen
et al., 2012). In addition to the expenditure indicators, in both these areas, households are
more likely to have cases of diarrhoea, less access to health facilities and latrines. Both
Jimkhana and Rishi Para are relatively new settlements which may have an impact on the
availability of basic facilities and on the incidence of more health events. The additional
health needs for the whole households compared to other areas, may contribute in
explaining why only households living in these areas have mentioned that they utilize the
pension grant for health purposes. Health is a major concern for households living in the
study areas and has become an important issue, often linked to survival that requires and
consumes the resources available in the family.
When the pension was identified as a key element in contributing to more investments in
health, I identified that the full amount is used or is expected to be used. While the type of
health investments varied among visiting doctors, or buying regular medicines or saving for
health emergencies, in all cases, the pension was allocated fully to health.
Before we started with the pension, we always had problems raising money for my mother’s
medicine. Nowadays, we don’t think about it at all. Whatever she gets as pension she uses it for
her health and few times drink tea with it. So she now takes care of her own health needs (Asma
Jim).
It [the OAA] is helping me a lot. At least, I can now buy medicine with old age pension money.
Without it, I might have died by now. I am unable to check my health from good physician with
this 300 taka per month, but I can at least buy medicine (Shomir Rishi).
However, saving the cash from the OAA is very difficult since all household had health
expenditures that had to be taken care of. Even if saving was preferred, the OAA was
sometimes used to some health expenditure by the end of the month. The fact that all
households continuously bear health costs and therefore reveal more investments in health
can be explained by the presence of at least an elderly person in the family and by the

184
increased need for health care in old age. This fact is also explained by the ‘survival’
category that explains how households classify a given health event on a survival scale and
allocate resources based on the way they perceive the event. In old age many health events
that would not usually be considered as a threat to survival, are instead a threat and are
therefore dealt with accordingly by the household.
The OAA contributes to a variety of health expenditures but is rarely enough to cover all
health costs. As any new resource available to the households, the OAA triggers a minor
reallocation of the resources in the household budget where the health costs for the elderly
as well as for some other family members become a prerogative of the pensioner.
I spend the whole pension for myself because my son … takes care of the whole family and I
cannot ask for money from him. I have gastric problem, so I need medicine for that and other age-
related illnesses (Shomir Rishi).
Last month I spent my pension plus 100 taka for a total of 400 taka for my daughter’s medical
treatment; she got bitten by a dog (Fahima Jim).
In the past, we bore all the cost for her health. Now she spends almost all her money on health,
and very little for good food. There are times she requires extra money from us to cover the cost of
medicine. The pension cannot cover all costs, that‘s when we help her (Parboti Rishi).
I am living the last days of my life. Pension money is so little. It is not even able to cover my
health cost. I cannot even buy an inhaler with it (Benu Jim).
The reallocation of resources is also accompanied by a shift of the responsibility on dealing
with health issues primarily on the pensioner. When more investments in health are needed
for the pensioner, which is very often the case, the primary resource of funding is the
OAA. In addition, if the pension is not being used by the pensioner, other family members
may benefit for health related expenditures, strengthening a sense of reciprocity within the
household. It is however accepted that the OAA is often not enough to cover all health
expenses of the pensioner and this triggers the involvement of the household.
We use the pension mostly for her health and buying medicine. Her health costs cannot be covered
with this 300 or 900 taka in three months. About three days ago he bought medicine for 250
taka and we also have to go to the pharmacy to buy more medicine in the next two days (Khajida
Jim).
When the OAA is not enough and can only cover partial health needs, the process of
contributing to the pensioner’s health expense seem to follow this path: either the

185
household can ‘top up’ the remaining amount needed to purchase, for instance, medicines;
or the household will take charge of one type of expenditure (e.g. some types of medicines)
while the pensioner will deal with other regular but minor health expenditures that can be
covered fully by the pension:.
He mostly buys eye drop with the pension. We bear all his other medical cost. He can afford to buy
only the eye drops because since his medicine cost more than 300tk per month (Monir Jim).
All concepts and events dealing with OAA and health must be framed within a context
where health events are classified on a survival scale, where only events that are classified as
a threat to the survival are dealt with. Also, the OAA works at the level of behaviour and
choices rather than at the level of investment preferences. The cash transfer of the OAA,
when used for health expenditures, can rarely fully cover all health needs of the pensioner
and requires additional contribution from the household. Like any additional financial
resources, the OAA favours a resource and a responsibility reallocation in the household
and health related expenditures remain a prerogative of the pensioner, thus contributing to
viewing the pensioner not as a burden on the household’s resources, rather as a
contributor.
By examining the pension and its contribution to revealing higher investments in health,
the role of the OAA can be framed within the category of health financing. The pension
provides additional financial resources that are used for financing the needs of elderly
persons in most cases. This means that the pension does not seem to play any in shaping
households’ investment preferences in relation to health. Rather, it acts at the behavioural
and opportunity structure level by facilitating the realization of households’ investment
preferences.
7.6 Conclusions
Empirical studies have shown that many poor households in developing countries do not
always reveal higher investment in health, even if they have access to additional resources
that may enable them to do so. What explains this situation? Many have argued that
relieving credit constraints on households holds the promise to enable them to translate
their health-related preferences into realities (Tarozzi et al. 2011; Devoto et al. 2011).
However, others suggest that the credit constraint alone does not necessarily explain low
investments in health (Dupas, 2011).
186
This chapter has examined two important issues in relation to this debate. First, I have
explored the main factors that define the extent to which a household will reveal higher
investment in health. Here, I have presented a case that suggests that revealing higher
investments in health is the result of a two-stage process that starts with the construction
of the household’s investment preference and ends with revealed health choices. In the
first stage, the household’s health investment preference is shaped by how a given health
situation is perceived and classified in relation to the extent to which it represents a threat
to the individual or household’s survival. The higher the threat to survival, the more the
household is willing to invest in health. In the second stage, the constructed investment
preferences can be fully revealed if either the health event is considered a real threat of
survival and therefore the household will do anything to protect life and its basic
functioning, or, if the event is not classified as a threat to survival, if the opportunity
structure is positive, which means that financial resources are available. Second, I have
examined if and to what extent the OAA scheme can contribute to revealing higher
investments in health. I have identified that its role can be framed within the category of
health financing. The pension provides additional financial resources that are used for
financing the health needs of its beneficiaries. The pension does not shape the willingness
of the households to invest in health, rather, it acts at the behaviour and opportunity
structure level by favouring the realization of existing investment preferences.

187
CHAPTER 8. Social Assistance and Investments: Revisiting the
Social Risk Management framework
8.1 Introduction
This research set out to contribute to developing a more comprehensive and effective
conceptual framework for understanding social protection policies in developing countries.
It sought to do this by interrogating the explanatory capacity of the social risk management
framework (SRM) in deepening our understanding of the relationship between the
investment opportunities offered to the poor by social protection instruments and
prospects for poverty exit. More specifically, and through a detailed analysis of the Old
Age Allowance (OAA) program in Bangladesh, my main interest was to explore the
question of whether and how social assistance may trigger or contribute to higher levels
investments (higher risk/higher return activities) in three dimensions of households’
livelihoods: savings, education and health. Thus, I asked:
What factors enable or constrain urban households in opting for more investments,
and in engaging in riskier and higher return choices in the education, savings and
health dimensions in Bangladesh?
In what ways and to what extent do social pension programs promote increased
investments in the education, savings and health dimensions?
To what extent does the SRM provide an effective analytical and conceptual
framework for understanding and predicting household’s investment behaviour and
poverty exit?
The previous three empirical chapters have examined in detail the processes and ways in
which poor urban households in Bangladesh decide their investments in savings (Chapter
5), education (Chapter 6) and health (Chapter 7).
The aims of this present chapter are threefold. First, it seeks to integrate the dimension
specific models and concepts identified in Chapters Five, Six and Seven, to explain how
social assistance may trigger more investments, and the conditions under which this occurs.
This is followed by a discussion of key concepts that have major implications for
understanding the processes of how and why households may or may not engage in higher
levels of investments (section 8.2). Second, the chapter examines how the key concepts
identified in these three empirical Chapters helps us understand the effectiveness of the
SRM as an analytical and conceptual framework for examining and explaining urban

188
poverty (section 8.3). This forms the basis for the third aim of the chapter, which is to
revisit the ‘promotion (risk taking)’ component of the SRM and incorporating ‘behavioural’
elements to improve the SRM’s claims (section 8.4).
The chapter ends by presenting implications for research in relation to utilizing qualitative
techniques in economic research, testing the validity of models/theories, and GT and by
discussing the practical implications of the findings for social assistance interventions and
beyond.
8.2 Social assistance and investments: unpacking investment preferences and
investment behaviours
This section brings together the empirical findings from Chapters Five, Six and Seven in
order to unpack the linkages between social assistance and investments. The section
suggests that social assistance may have a role in lifting restrictions to revealing investment
preferences, but not in the construction on the investment preferences, which, as I will
present later, is an important driver towards more investments. Also, it suggests that social
assistance may act to enable households to engage in more investments if it contributes to
smoothing consumption.
The SRM proposes that households living in poverty with access to the kind of risk
management instruments provided by social protection programmes will engage in riskier
and higher return choices. This means investing more in ways that improve their income
and income prospects and assist them in exiting poverty. The existence and access to
appropriate risk management instruments to protect people’s welfare in case of shocks,
can also reduce the risk averse behaviour of households living in poverty and favour their
engagement ‘in higher risk/higher return activities’, considered to be the way out of
poverty. As stated earlier, in the SRM, risk taking and higher risk refers to more
investments triggered by a change in the individual or household’s investment behaviour
(Holzmann and Jørgensen, 2000: 3). From this approach, consumption smoothing is seen
as the main output of having access to risk management measures and the origin of
behavioural change towards riskier and higher returns choices (Morduch, 1995;
Binswanger, 1980; Binswanger and Rosenzweig, 1989; Siegel and Alwang, 1999). A risk
averse household will not take riskier and higher return choices, and will not take advantage
of existing opportunities, causing ‘poverty ...to be perpetuated for them [households] and
their children’ (Holzmann and Jørgensen, 2000: 9).

189
Social protection instruments provide additional and predictable liquidity which contributes
to lifting restrictions on the productive capacity faced by households living in poverty. By
lifting these barriers and unlocking the productive capacities of the households, social
protection opens up new prospects and opportunities: some examples of new prospects are
participation in savings schemes, securing of credit, improving consumption, as well as
improving households resource allocations towards higher return investments in the short,
medium and long term (e.g. children’s education) (Barrientos, 2012).
As discussed in Chapter Three, the field work for this study has helped in framing the
household’s investments as the end point of a process that I refer to as the ‘process of
realization’, which starts with the household’s intention to act – their investment
preferences. Chapter Three also suggests that both neoclassical economics, as well as the
literature presented in the multidisciplinary perspective, do not elaborate on the process of
how preferences and real actions relate. The distinction between the household’s
investment preference and investment behaviour is not recognized in the literature on
social protection and poverty exit which often assumes an overlap between revealed
behaviour, choices and decisions with households’ preferences.
The distinction and process that link household investment preference and investment
behaviour is an important contribution of this research. What is observed as a choice that
a household reveals, is the result of a two-stage process, which I call the ‘process of
realization’. The first stage corresponds to the process of ‘constructing’ the investment
preference of the household, which refers to the ‘how and why’ the household is keen
(prefers) to invest more. The second stage refers to the ‘realization’ which entails ‘revealing’
the household’s investment as a determined by a set of factors which filter the investment
preference of the household. These factors function at the behavioural level only and do
not shape the household’s investment preference. In this two stage ‘process of realization’,
the concept of the opportunity structure (Narayan-Parker et al., 2007a and 2007b) is
central. The opportunity structure filters the preferences of the households and determines
the extent to which their preferences are translated into actual choices we observe on the
ground.
The analysis in the previous chapters suggests that being part of a social assistance scheme
where additional financial resources are transferred may enable households in revealing
more investment in the three dimensions, under certain conditions. Nevertheless, cash
transferred under a social assistance scheme may contribute to the realization of the
investment preference but not to their construction. This means that cash transfer does not
190
trigger a change in preferences towards more investments (riskier and higher return
activities); rather it enables households to realize their pre-existing preferences. Preferences
are formed by a more complex interaction of factors, some of which will be discussed in
the next section. The empirical chapters (Chapters Five, Six and Seven) show that the cash
transferred as part of the OAA triggers a resource reallocation within the household.
Moreover, when such transfers contribute to a net increase of the resources available, it
may further enable households to reveal more investments in one of the three dimensions
studied here.
The generosity (amount of the grant) of the cash transfer does matter in the process. The
low amount of cash transferred by the OAA may therefore fade out in the realties and
challenges that the households face on a daily basis. The categories of financial resources,
present in all the dimensions examined, suggest that if the household’s income increases
considerably, due for instance to a new household member joining the labour market
which may signify also a change in its age structure, -a child finishing school and starting
working-, the additional cash can contribute to the realization of a household’s investment
preferences. The issue of the generosity of cash transferred to poor households is
important when considering the context in which households live, such as minimal
protection from any health shock or unemployment, hidden fees and the costs of a ‘free’
education system: the household’s income is exposed to fluctuation that cannot be
smoothed only by the cash transferred of, for instance, the OAA. While these may appear
to be exceptional circumstances, health shocks or price increases are extremely common
for the households interviewed.
If the cash transferred is not completely absorbed in immediate expenditures, the regularity
and predictability of social assistance may play a role in revealing greater investments. This
was however only seen in the savings dimension where households also had access to, and
were part of a community savings scheme – the somiti. Here, the regularity of the cash
transfer, and the fact that the cash is disbursed in bulk every three months, is instrumental
in fulfilling obligation with the somiti and to deposit in advance several months of
instalments.
The amount of the transfer also defines the type of investments the household reveals
within specific dimensions. In relation to education, for instance, the cash of the OAA
provides only liquidity for ‘minor’ investments, such as a book or basic stationeries, rather
than major expenditures such as school or tutor fees, except when the timing of the
transfer coincides with pressing needs: the OAA contributed to enabling households reveal
191
more investments when its disbursement coincided at the time child required or requested
to purchase or pay for a particular expenditures.
For a household to engage in higher risk/higher return activities and reveal more
investments, the first step is the construction of an investment preference. This investment
preference is then filtered by an opportunity structure that can either facilitate or constrain
the realization into an observable investment of the constructed preference. The cash
transferred in a social assistance grant is an important element of the opportunity structure.
It may facilitate the realization of investments preferences into real investments when it
contributes to a net increase of the resources available, when the household’s income is not
exposed to fluctuations, and when the timing of the transfer coincide with certain critical
demands or requirements of household members.
The cash transfer does not, though, determine the investment preference of a household.
Investment preferences are constructed by the interaction of a complex set of factors that
determine the extent of the household willingness to investing more or engaging in higher
risk/higher return activities.
8.2.1 From investment preferences to investment behaviours: a minimum
threshold and motivation hypothesis?
If access to a social protection or a cash transfer scheme does not necessarily contribute to
shaping households’ preferences towards more investments, then what precisely informs a
household’s willingness to engaging in higher risk/higher return activities? This section
builds on the key concepts that emerged in the empirical chapters and forms the basis for
the theoretical discussion on the SRM and practical implications for cash transfer schemes
of the next sections.
Chapters Five, Six and Seven have identified how households construct their investment
preferences and how these are translated into observable investment behaviours. Although
each dimension has identified and proposed different dimension-specific models that
explain the preference construction and the process of realization, an important
commonality nevertheless exists. In all the dimensions, setting a goal, the strength of the
goal itself, as well as the motivation and the efforts that are generated to achieving a goal,
have major implications for constructing investment preferences and shaping investment
behaviour. Also, the analysis suggests that each household has multiple goals which are
differentiated by their ‘strength’. There is a household-specific hierarchy of goals where

192
some are more powerful than others: for instance, ensuring that a child reaches at least five
years of education may be more powerful than the goal of reaching nine years of education.
The following paragraphs briefly highlight the key elements of the various dimension-
specific models in relation to savings, education, and health.
Savings: In savings, the powerful goal is specific to the household itself, geared for
instance, towards savings for children education or for helping a long forgotten member of
the household. This powerful goal determines the savings preference, as well as the
motivation and efforts to save and the realization of the preference even in the context of
resource constraints.
Education: In the education dimension, the analysis suggests that each household has a
certain degree of motivation which shapes the investment preference and their efforts in
realizing it. For instance, some households are willing and very determined to have their
child at least completing year five, while other at least completing year seven and so forth.
After exploring this process further, I suggested the existence of a ‘minimum threshold
effect’, where each household sets a minimum number of school years to be achieved
(goal) which determines the motivation that follows and the subsequent efforts made in
realizing such preferences. The minimum threshold is shaped by the perception of
minimum formal and informal requirement to be employed in a decent job or for obtaining
decent wedding proposals and basic dignity and honour based on the education level of the
household, and by a strong determination to do better than what was done in the past. In
education, the minimum threshold is a target, shaped by the complex interaction of several
factors that determines the motivation and the efforts made towards the translation of
households’ educational investments preferences into more concrete observable
investment behaviour.
Health: In the health dimension, households set a powerful goal which is what they
perceive as a threat to the survival of individuals or the household. The willingness to
invest more is shaped by this survival goal whose achievement guarantees basic functioning
for the individual and the household. It determines the motivation and effort to achieve
this goal and the extent to which preferences will be revealed as choices. For instance, it
will determine the degree of their willingness to investing more resources towards the
survival of a newly-born baby and his mother during delivery, and the actual use of
additional resources to pay for a delivery in the hospital.
A minimum threshold (years of education) or a powerful goal (survival in health and
household specific in savings) is itself the construct of the combination of a series of
193
factors: experience, lifestyle conformity, trust and so on. It determines the extent of the
household’s willingness to invest more (investment preference) and the motivation and the
household’s effort in achieving its minimum threshold and goal. The motivation and
efforts are higher before achieving the minimum threshold or a powerful goal, but begins
to diminish soon thereafter. High motivation and effort increases the likelihood of the
realization of the investment preference into investment behaviour. For instance, a
household with a minimum threshold of education of five years will reveal more
investments before achieving this threshold even in the presence of financial and other
constraints. The household will do almost anything possible to achieve it. After reaching
the minimum threshold, since households may have additional goals which are not as
powerful, such as schooling up to year nine, the degree of motivation decreases so as the
likelihood to realize a the new investment preference into behaviour.
In sum, this section has brought together the analysis of the previous three chapters and
proposes a better way for understanding the processes that lead households in engaging in
higher risk/higher return activities. What is revealed (higher risk/higher return activities) is
the result of a process that starts with the construction of investment preference filtered by
an opportunity structure that determines the extent to which the investment preferences
will be realized. Overall, this analysis shows that social assistance may have a role in lifting
restrictions to revealing investment preferences only where it contributes to smoothing
consumption. Social assistance does not play a role in shaping households’ investment
preferences. Investment preferences are instead shaped by a goal, the strength of the goal
itself, the motivation and the efforts that are generated to achieve a goal. This in turn, has
major implications for shaping individuals and households’ investment behaviour.
8.3 Towards a behavioural SRM framework
This section addresses the third research sub-question, dealing with the SRM framework
and its effectiveness as an analytical and conceptual framework for examining and
explaining urban poverty in Bangladesh. As an analytical framework, the SRM, if combined
with the literature on risk acceptability, perception, risk taking and preference construction,
has proven to be effective in understanding the extent to which social assistance may
trigger more investments and the conditions under which this may occur. As a conceptual
framework, it oversimplifies the processes that lead households to engaging in higher levels
of investments.
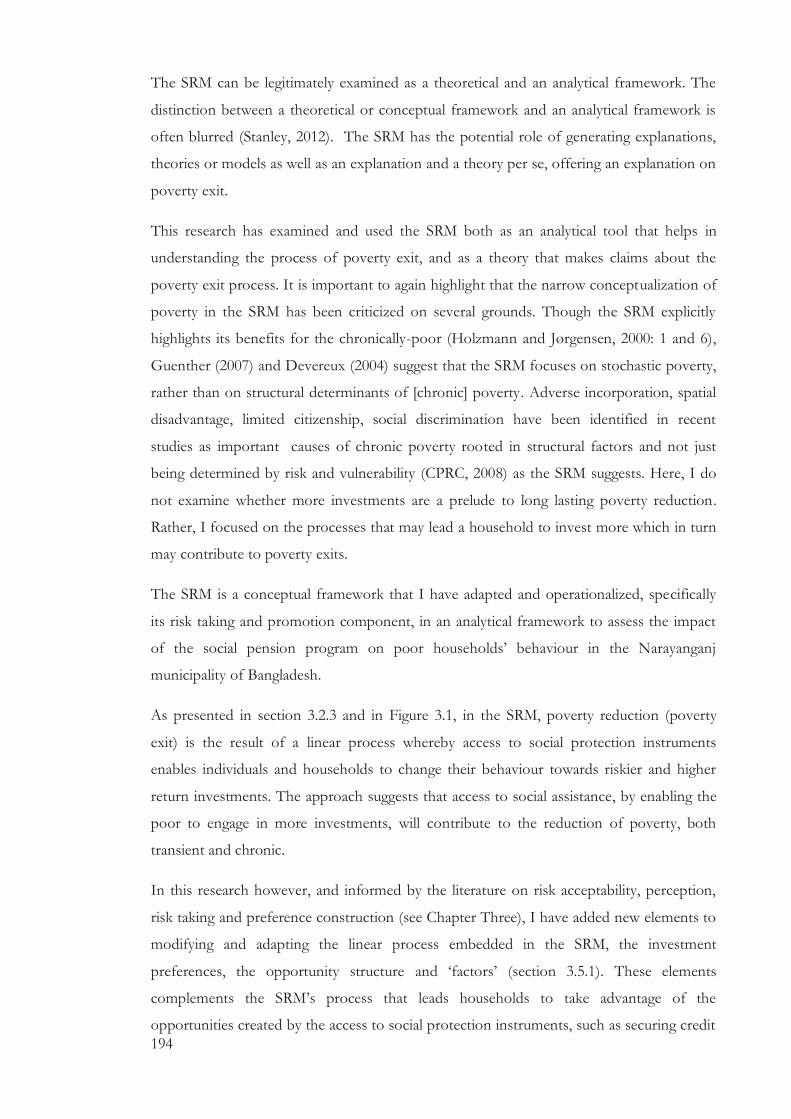
194
The SRM can be legitimately examined as a theoretical and an analytical framework. The
distinction between a theoretical or conceptual framework and an analytical framework is
often blurred (Stanley, 2012). The SRM has the potential role of generating explanations,
theories or models as well as an explanation and a theory per se, offering an explanation on
poverty exit.
This research has examined and used the SRM both as an analytical tool that helps in
understanding the process of poverty exit, and as a theory that makes claims about the
poverty exit process. It is important to again highlight that the narrow conceptualization of
poverty in the SRM has been criticized on several grounds. Though the SRM explicitly
highlights its benefits for the chronically-poor (Holzmann and Jørgensen, 2000: 1 and 6),
Guenther (2007) and Devereux (2004) suggest that the SRM focuses on stochastic poverty,
rather than on structural determinants of [chronic] poverty. Adverse incorporation, spatial
disadvantage, limited citizenship, social discrimination have been identified in recent
studies as important causes of chronic poverty rooted in structural factors and not just
being determined by risk and vulnerability (CPRC, 2008) as the SRM suggests. Here, I do
not examine whether more investments are a prelude to long lasting poverty reduction.
Rather, I focused on the processes that may lead a household to invest more which in turn
may contribute to poverty exits.
The SRM is a conceptual framework that I have adapted and operationalized, specifically
its risk taking and promotion component, in an analytical framework to assess the impact
of the social pension program on poor households’ behaviour in the Narayanganj
municipality of Bangladesh.
As presented in section 3.2.3 and in Figure 3.1, in the SRM, poverty reduction (poverty
exit) is the result of a linear process whereby access to social protection instruments
enables individuals and households to change their behaviour towards riskier and higher
return investments. The approach suggests that access to social assistance, by enabling the
poor to engage in more investments, will contribute to the reduction of poverty, both
transient and chronic.
In this research however, and informed by the literature on risk acceptability, perception,
risk taking and preference construction (see Chapter Three), I have added new elements to
modifying and adapting the linear process embedded in the SRM, the investment
preferences, the opportunity structure and ‘factors’ (section 3.5.1). These elements
complements the SRM’s process that leads households to take advantage of the
opportunities created by the access to social protection instruments, such as securing credit
195
and investing in higher return strategies. As Figure 8.2 shows, this analytical framework
considers the investment preferences and their construction as the result of the interaction
of several factors (or categories, in the terminology of GT). This framework also considers
the role of an opportunity structure, a set of factors that filter the preferences of the
households and determine the extent to which their preferences are realized (see section
4.3.4).
Figure 8.1: Adapted analytical framework (source: the Author)
With these new elements, I have captured and examined other factors that play a role in the
process of exiting poverty. First, I was able to identify a more complex process that may
lead households to reveal more investments. This process includes the construction of the
investment preference and their realization, as a choice determined by a set of factors
which filter the investment preference of the household (the opportunity structure). The
adapted analytical framework has allowed the identification of factors at work in the
construction of preference and in the opportunity structure. Second, the adapted analytical
framework has allowed the identification of several factors (categories) that contribute in
constructing household’s preference towards more investments and a list of factors that
can enable or constraint households in realizing their investment preference. Thirdly, and
specifically for the social assistance scheme examined, I was able to identify the conditions
under which social assistance may contribute to households engaging in higher risk/higher
return activities. Social assistance does not necessarily trigger higher level of investments, as
suggested in the SRM’s linear model.
As a theoretical framework in explaining how people may be able to exit poverty, the
SRM’s explanatory and predicting validity is weak on several grounds. SRM, as a
framework rooted in neoclassical economic theory, suggests that access to social protection
196
instruments allows individuals and households to reduce income variability, to smooth
income and consumption (Morduch, 1995), as well as reduce the threat of destitution. This,
it is claimed, in turn influences positively the degree of risk aversion. It increases the agent’s
attitude and behaviour to take riskier choices, engaging in ‘higher risk/higher return
activities’ (Holzmann and Jørgensen, 2000: 9). It promotes the re-establishment of the
positive linear relation between choices and marginal wealth utility maximization,
encouraging households to take advantage of the opportunities created by the access to
social protection instruments, such as securing credit and investing in higher return
strategies. Together, it is argued, this will contribute to achieving productive outcomes,
micro level growth and exiting poverty.
The three explanatory models that have been presented in the Chapters Five, Six and Seven
suggest a different explanation to the one offered by the SRM, as it relates in particular to
the relationship between consumption smoothing and investment behaviour. First, the
findings suggest that not all social protection interventions can reduce income variability,
smooth income and consumption. Households receiving the cash grant of the social
pension scheme are exposed to major income and consumption volatility that cannot be
smoothed by a small transfer like the OAA. Inflation, health shocks, members exiting the
labour market are some of the major causes for income and consumption fluctuations.
Social protection interventions are diverse and implicitly suggesting that the access to any
social protection instrument will necessarily contribute in smoothing consumption
oversimplifies a much more complex process. This research examined a particular social
assistance scheme, the OAA in Bangladesh, with a set amount of cash transferred every
three months, targeting poor households with elderly members. The design aspects of the
OAA, with a very little amount of cash transferred to the elderly member define the extent
to which households can smooth their consumption. A different program, for instance
with a larger transfer targeting a working age member, or with conditions attached, or a
health insurance scheme that protects households from catastrophic out of pocket
expenditures, might smooth consumption. Many types of social protection interventions
exist. Even within the subgroup of social assistance schemes there are major differences
among programs, in terms of, for instance, targeting population, type and level of benefits,
and implementation arrangements. All these differences are important in determining the
degree to which social assistance scheme may contribute in smoothing consumption or
how the resources are allocated within the household.
Second, the link between social assistance and increased levels of investments is blurred.
Social protection can contribute, under certain circumstances, to open up opportunities for
197
engaging in ‘higher risk/higher return investments. The decision to take advantage of
particular opportunities however is not triggered by the access to social protection per se,
but is the result of pre-existing investment preferences that interact with factors that
determine the realization of a preference (the opportunity structure). This research suggests
that the revealed behaviour is the result of a process that includes the construction of the
investment preference and its realization. It is not just about smoothing consumption, it is
rather about pre-existing households’ preference, their willingness to invest more in
education or savings for instance, and elements that can support the realization of such
preferences such as availability of additional financial resources.
By suggesting that investment decisions are only dependent on consumption (and income)
smoothing, the standard SRM approach fails to acknowledge the many advances in the
field of economics (and behavioural economics), such as the role of, for instance,
emotions, perceptions and societal beliefs in the decision making process (see Chapter
Three). Moreover, the standard SRM approach seems to overvalue the role of individual
agency in engaging in ‘higher risk/higher return activities’. The three explanatory models
suggest that the existence of a favourable context (the opportunity structure), which is
external to the individual, contributes to the realization of the investment preference. For
instance, if the household is willing to save more, the existence and access of a trustworthy
savings scheme will favour the realization of the household’s preference to save. These are
factors which are often outside the control of the individual, ones which are not recognised
in the standard SRM approach. While the oversimplification and generalization of the SRM
is useful in highlighting one of the potential impacts of social assistance, its explanatory and
predicting validity can be questioned on these grounds.
This has major implications for social protection policies and for understanding their
impacts. There are a considerable number of rigorous studies and impact evaluations that
show that households with access to social protection increase their levels of investments
in different dimensions (Alderman and Yemtsov, 2012; Yoong et al., 2012; Gertler et al.,
2012, Baird et al., 2014; Barrientos, 2013). The SRM suggests that this is the result of the
access to social protection instruments that reduce income variability, smooth income and
reduces the degree of risk aversion, therefore changing the household’s attitude and
behaviour to invest more, to take riskier choices, and to engage in higher risk/higher return
activities. Although these claims may appear appropriate in explaining the evidence from
many studies and evaluations, they nevertheless over simplify the processes at stake and
thereby leave some important questions unanswered. For example, why do some
198
households invest more than others in education or health, or why some household do not
engage in savings while others do?
Policies based on the SRM that expect that social assistance alone can promote more
investments, fail to acknowledge the multiplicity of factors that determine the investment
behaviour of households. The findings of this research suggest that it is not the sole
responsibility of the individual to take advantage of the new opportunities that social
protection has contributed in opening. Therefore, the failure of the individual to invest
more and take advantage of the new opportunities should not be interpreted as a failure of
the household in taking steps towards poverty exit. Rather, much also depends on factors
that are exogenous both to the individuals and the households concerned.
8.4 A behavioural SRM framework?
The SRM is not an effective conceptual framework for explaining urban poverty, since it
oversimplifies the processes that lead households to engage in more investments. Building
on some of the concepts presented earlier, I have developed a ‘behavioural’ variation of the
‘risk taking’ /poverty exit component of the SRM framework for social protection. The
purpose of doing so is to use the findings of this research to directly contribute to
improving the explanatory power and claims about risk taking and investment in the SRM.
This behavioural alternative to the component of the SRM elements is influenced by the
literature discussed in Chapter Three but most importantly by the concepts that emerged in
the explanatory models developed through the GT. It is however important to say that
considering that this research only discussed and analyzed three dimensions, namely
education, health and savings, this behavioural alternative may not fully integrate the
processes and conceptual elements that would emerge by examining other dimensions.
The next paragraphs integrate the contribution of this research in order to enhance the
explanatory power of the SRM approach. These are: the diversity of design and impacts of
social protection interventions, the pre-existing investment preferences of each household,
the existence of a conducive environment for investing more, and the SRM’s
conceptualization of poverty. Below (in italics) I have developed a ‘behavioural’ variation of
the risk taking /poverty exit component of the SRM for social protection.
Households may have access to a variety of social protection interventions. These interventions are different
in terms of what they aim and in terms of their design features. Moreover, social protection interventions can
contribute to smoothing consumption only if the most common shocks that households are exposed to can be
199
appropriately managed (e.g. health shocks through health insurance or free/subsidized access to health
facilities or price shocks through subsidized food or price control mechanisms).
If household are able to smooth as well as protect their consumption from shocks, and if a social protection
intervention also contributes to a net increase of the household income by for instance supporting the
household with regular but appropriately ‘sized’ cash transfer, the household may reveal more investment
and engage in higher risk/higher return activities.
The extent of the household’s engagement in higher risk/higher return activities is dependent on a number of
factors. This includes their pre-existing preferences, their willingness to invest more that itself is a construct of
several factors such as previous experience as well as individual goals and motivation. The existence of an
opportunity structure that favour investments in engaging in higher risk/higher return activities is also
important here.
Investing more and engaging in higher risk/higher return activities, does not alone lead to exiting poverty.
Rather, it may promote micro level growth. This can further contribute to the reduction of transient and
chronic poverty in contexts where such investments are in conjunction with structural transformation such as
empowerment, rights and representation, broader pro-poor economic growth strategies.
The research presents a different and more complex process to the one proposed in the
SRM. Based on some of the concepts that emerged in this chapter and in the analysis in the
Chapters Five, Six and Seven, I have proposed a ‘behavioural’ variation of the risk taking
/poverty exit component of the SRM framework for social protection, where preferences
and how these are constructed play a determining factor on the household’s investment
behaviour.
8.5 Implications for research: grounded theory, research in economics and
testing the models
This study has two broad implications for research. First it identifies a need to learn across
different disciplines and specifically to adopt and adapt qualitative research techniques to
improve the explanatory and predictive power of economic models like the SRM. Secondly,
it opens up a space for further research on key concepts emerged in the research that are
important in understanding how preferences are formed.
8.5.1 Grounded theory and research in economics
200
This research adopted several qualitative instruments and analytical steps within the
framework of the GT. The results of doing so have contributed to identifying new
elements that can help explain divergences from the linear model conceptualized in the
SRM as well as other economic hypothesis on which it is based. Using qualitative research
to examine economic problems is not completely new. In the sixties and seventies, the
economist Lancaster started asking questions like ‘Is there still scope for qualitative
economics? Or can no predictions be made that are not based on knowledge of
quantitative values?’(Lancaster, 1962: 99).
The answers he provided have been criticized by many. Nevertheless, one of Lancaster’s
main critics, Gorman, suggests that ‘the value of whose work [Lancaster] lies in the
questions he asks rather than the answers he gives’ (Gorman, 1964: 65). These questions
have been taken up by only a few researchers and academics. The MIT economist Piore is
one of the few that has fully engaged and adopted qualitative techniques in his own work
from the seventies onwards (Piore, 1979; Piore, 2006). His case studies and in-depth
interviews have contributed to the revision of several labour economics and labour
migration theories (Piore, 1979). Piore stresses that a common mistake made by qualitative
researchers in the field of economics relates to the tendency of treating the material
collected as evidence. The cannons of the empirical methodology of economics, will never
qualify such material as evidence; ‘rather, by treating interview material as inputs into the
revision of theory, they become essentially equivalent to the products of the laboratory
experiments conducted within the emergent subfield of behaviour economics’ (Piore, 2006:
22). Rather than evidence, they become elements that can help revising and improving the
explanatory power of existing theories (Starr, 2012: 8-16).
This research has done so. By using qualitative techniques, I have proposed a revision of
the SRM by incorporating new elements that can improve its explanatory and predicting
power.
This research also offers an additional contribution. The qualitative techniques in this
research were framed in the GT, an end-to-end approach that encompasses the data
gathering and data analysis process (see Chapters Three and Four). It is a rigorous yet
flexible step by step framework for research. Being a systematic approach with clear rules
on ways to collect, process and analyze data (with or without the support of Nvivo) the GT
achieves high levels of rigour, similar to quantitative research techniques. It therefore holds
some promise to offering a systematic methodology for qualitative research that
economists may find useful to complement their analysis.

201
8.5.2 The way forward: Expanding concepts and testing the theory
Will the models developed in this thesis stand the test of time? Glaser (1992) suggests that
researchers adopting the GT should focus on developing a theory ‘grounded’ in the data,
not in testing its validity. This is what this research has done: I have developed three
‘grounded’ models, on savings, health and education that can explain and predict
household’s behaviour in three dimensions of their lives and used them to enhance the
explanatory capacity of the SRM.
Testing the validity of the models I have developed in Chapters Five, Six and Seven is
however imperative, since it may further strengthen them, expand concepts, or refute some
of all of their predicaments. Testing these models implies examining the concepts that have
emerged, such as the financial threshold for savings, the design features of savings
schemes, the minimum threshold of education, the strength of goals and motivation, the
commitment of children towards education, and the prioritization of health investments
that threaten the household’s survival. Some of these concepts have been extensively
discussed in the literature, such as motivation (Frey, 1997; Frey, 2001), while others, like
the minimum threshold of education, are new elements emerging from this study: these
would require further research. Testing these concepts needs to rely on merging traditional
way of doing quantitative research and more innovative and mixed methods approaches to
elicit preferences. A variety of disciplines may contribute to define the best way forward.
The research would need to combine and consider several issues that may arise, mostly in
relation to debate on the tools or mix of tools that best fit in supporting the scope of the
testing.
For instance, consideration should be given to the predictive power of surveys that, while it
has been criticised by a large experimental literature that supports economists' scepticism of
subjective questions (Bertrand and Mullainathan, 2001b), it has also been identified to
contribute to a better understanding of households and individuals’ attitudes and
preferences (Gloede et al., 2011). Experiments may also have a role: the way forward may
be exploring how experiments and survey may contribute to the debate (Anderson and
Mellor, 2009) and the degree to which these methods produce similar estimates. This has
already been discussed in recent studies. Ding et al. (2010) and Dohmen et al. (2011)
suggest that correlations between survey measures and experimental measures are a move
in the right direction, and that field experiments (e.g. paid lottery) confirms the behavioural
validity of the survey. Using techniques and tools from psychology and adapting

202
psychological questionnaire and experiments should also be explored using both real and
hypothetical questions and scenarios.
Testing the validity of the ‘minimum threshold in education’, and its complex and multiple
elements at play, is a good example. To recap, the minimum threshold effect suggests the
existence of a point where there is a change in the degree of motivation for investing in
education (e.g. sending children to school). Before reaching the threshold, the household
will be very strongly motivated and prioritize more investments in education. After
reaching the threshold, however, the motivation to continue sending children to school
reduces. The minimum threshold is a construct of the perception of minimum formal and
informal requirement to be employed in a decent job or to obtain decent wedding
proposals and basic dignity and honour. It is also about the education level of the
household, which includes the head of the households as well as other members, and the
strong determination to improve upon the households living conditions. Here, the
elements at play in the minimum threshold fall traditionally into the realm of different
disciplines and different tools, such as the education level of household members, types of
employment on one hand, and perceptions of dignity and honour on the other. A testing
approach that uses a mix of tools from different disciplines should be developed and
tested.
8.6 Social assistance interventions and beyond
This research has identified a series of elements that can contribute or constrain the
effectiveness of social assistance interventions in relation to the realization of the
household preferences towards more investments. While this research focused on one
specific nationwide program in Bangladesh, the OAA, most of the factors that have been
identified have implications for a wider range of interventions that go beyond social
pension and social assistance schemes.
Many elements identified in this research have practical implications for designing and
implementing social assistance schemes. The generosity (size) of the grant, motivation and
trust, protection from shocks, for instance, are all elements that can transform the way a
program is perceived and as such, determine households’ behaviour. Integrating these
elements in the design of social assistance schemes is, however, challenging. It requires
implementing complementary sensitization programmes, savings or insurance schemes that
often follow outside the competence of agencies implementing cash transfer schemes.
203
The cash grant is a key feature of contemporary social assistance interventions. This
research has shown however that cash transferred to the households under a social
assistance scheme can only contribute to some extent to smoothing consumption, and
households engaging in more investments. Cash may create opportunities and can
contribute to the realization of existing preferences if certain conditions exist, as explained
earlier in the chapter. Social assistance schemes need to carefully consider the quantum of
the resources transferred vis-a-vis family size or other household characteristics as well as
external changes in commodity prices. This research found that the cash transfer often gets
‘diluted’ in the household income and did not serve any ‘notable’ purpose. Several cash
transfer schemes that target households, increase the grant amount based on the number of
programme ‘eligible’ members in the households, such as more than one school age
children (Oportunidades in Mexico), or more than one disabled, one elderly or an OVC
child (LEAP in Ghana). Nevertheless, this research suggests that the number of non-
eligible household members and the total income of the household matters and define the
extent to which the pension may act to favour more investments. A more approximate way
to define an appropriate size of the grant for different households of any social assistance
interventions may be considering the number of all household members not just the
eligible members.
In addition, cash transfer schemes require a mechanism to continuously monitor the real
value of the cash and adjust it accordingly to ensure the purchasing power (smoothing
purchasing power) is not eroded by inflation or sudden price surges. This is particularly
relevant in countries where inflation is high, where household are exposed to sudden price
increase of basic commodities and in the process of major structural reforms (e.g. fuel
subsidies removal).
Among the households interviewed, price shocks go hand in hand with health shocks. As
discussed in the Chapter Seven, catastrophic health expenditures are a major issue that can
push households deeper into poverty. Cash transfer schemes cannot address this on their
own. This research identifies that unless complementary services are in place and
accessible, households will most likely remain at risks of financial catastrophes. Examples
of relevant complementary services include subsidized-public health insurance that may
enhance access to quality health care.
Household’s motivation was identified to be an important element throughout the process
of realization in all the dimensions explored in this study. Setting a goal, the strength of the
goal itself, the motivation and the efforts that are generated to achieve a goal, have major
204
implications for constructing investment preferences and determining investment
behaviour. Setting goals is a process that is internal to the household in some cases even to
a specific household member (e.g. child’s commitment). Goals can also be shaped by
factors external to the households. Motivation works at community, household and
individual member levels. A key component of a cash transfer scheme should be
sensitization that targets in parallel individuals, households and communities to promote
goal setting. In education, this translates into sensitizing households on the impacts of high
school education and its transformative role in order to ensure the minimum threshold
level is raised. In savings, it should focus on supporting the household in defining an
important household specific target and understating as well as providing tools on how to
achieve these (savings for education; savings for a investing in a new business). In health,
this would require sensitization and education on preventive health and nutrition, as well as
on ways to better identify and classify the threat to survival of a health event.
This research also showed an element that may play an important role at community level:
trust. In the savings dimension, I found that households follow the guidance of people and
institutions they trust; neighbours, close family members, community leaders and municipal
officials. This has an obvious implication in terms of sensitization and awareness creation
strategies, which are more likely to succeed if the channels are trustworthy individuals and
institutions. In savings, the trust in the somiti was one of the key factors that increased
their acceptance among the households. In the health dimensions, the mistrust against what
households perceived to be untrained midwives may have hindered the utilization of their
services. This also has implications for cash transfer schemes that may rely on trustworthy
individuals and institutions to intervene at different stages of the implementation of social
assistance programmes.
The cash transferred under a social assistance scheme can create new opportunities, but
alone it will not ensure that people will take advantage and grasp them. Other factors play
an important role in this process. As suggested earlier in the chapter, this implies that
parallel and complementary initiatives that, for instance, sensitize the importance of
education or preventive health care are needed to enable households take advantage of the
opportunities brought in by social assistance schemes.
Also, as suggested by the literature presented in Chapter Three, exiting poverty, is not only
about individuals or households engaging in higher level of investments. Recognizing the
impact that social assistance scheme may have in how a state functions is important.
Nevertheless, social assistance schemes need to be part of a broader shift in policies that
205
addresses adverse incorporation, spatial disadvantage, limited citizenship, and social
discrimination which are key the structural underpinnings of chronic poverty (CPRC,
2008). Structural factors may hinder the process through adverse incorporation and
discrimination, for instance. The expectation that a cash transfer scheme may, in the short
term, bypass such barriers and provide an avenue out of poverty is unlikely. A cash transfer
scheme can however in the long term have an impact on structural unequal power relations
and a more pro-poor focus of public policies by favouring a reallocation of resources from
universal regressive interventions (e.g. fuel subsidies) to targeted interventions, by
protecting and upholding the right of individual to complain and expect support from the
State.
8.7 Conclusions
Does the SRM framework provide sufficient basis for a good understanding of the
relationship between social assistance and poverty exit? This chapter started by examining
the dimension specific models and concepts identified in the previous chapters to explain
how and under which conditions social assistance may trigger more investments in ways
that contribute to poverty reduction. I have argued that social assistance may only in some
circumstances determine whether households will invest more and engage in higher
risk/higher return activities. The investments that households reveal are the result of a
process that is much more complex than simply having access to social assistance. It starts
with the construction of an investment preference which is then filtered by an opportunity
structure that determines the extent to which a household’s investment preference will be
translated (or not) into more investments. Rather than the access to social assistance and
the cash transfers per se, setting a goal, the strength of the goal itself, the motivation and
the efforts that are generated to achieve a goal, have major implications for constructing
investment preferences and in shaping the actual investment behaviour of individuals and
households.
The chapter also discussed how the key concepts identified in the previous chapters can be
framed to address the third research sub-question dealing with the SRM framework and its
effectiveness as analytical and conceptual framework. While the SRM may to some extent
offer a useful analytical framework for understanding poverty, its theoretical validity is
somehow questionable. This formed the basis for revisiting the ‘promotion (risk taking)’
component of the SRM. To improve the adequacy of the SRM, and based on some of the
concepts that emerged in the analysis of the three empirical chapters (Chapters Five, Six
206
and Seven), I have proposed a ‘behavioural’ variation of the risk taking /poverty exit
component of the SRM framework for social protection, where preferences, and how these
are constructed, play important roles in shaping households’ investment behaviour.
The chapter ends by suggesting that many elements identified in this research have
important implications for both research and practice in terms of designing and
implementing social assistance schemes. In relation to research, this study identifies a need
to learn across different disciplines and specifically to adopt and adapt qualitative research
techniques to complement and support research in economics. It also opens up a
discussion on innovative ways to test, validate and disprove theories and conceptual
frameworks as well as its elements to improve their explanatory power.
In designing and implementing social assistance schemes, the generosity of the grant,
motivation and trust, protection from shocks are all elements that can transform the way a
program is perceived and as such, determine households’ behaviour. Integrating these
elements in the design of social assistance schemes is, however, challenging. It requires
implementing complementary sensitization programmes, savings or insurance schemes of
interventions that are often outside the competence of the agencies implementing cash
transfer schemes.
207
Chapter 9. Conclusion: the Research Journey and its Key Findings
9.1 Introduction
This research aimed at developing a more effective conceptual framework for
understanding social protection policies in developing countries, with a focus on poverty
exit. It has done so by examining the SRM framework from a multidisciplinary perspective
and particularly looking at the theoretical assumptions that underpin it. These theoretical
assumptions are interrogated mainly through an analysis of one of the largest social pension
schemes in Bangladesh, the Old Age Allowance Programme (OAA).
This concluding chapter aims to summarize the main arguments of the study, and then
highlight the seven key findings that emerged from the analysis. The contributions of the
study both to theory and policy are also highlighted here.
9.2 The research journey
Social protection, and in particular social assistance, has emerged as a key area of
international development policy in recent years. International organisations and country
governments have developed strategies that include social protection as a key component
of effective development policy. Recognition of the important role of social protection
policies is aligned to a growing consensus on their role in reducing poverty and
vulnerability and in preventing people from falling into poverty and facilitating exit from
poverty.
Chapter Two has undertaken a detailed review of the literature on social protection and
social assistance, focusing on their relationships with poverty, vulnerability and risk.
Although evidence points to the usefulness of this typology for both developed and
developing country contexts, its sequencing, scale and scope varies considerably, playing a
more prominent role in the developing world. In developing countries, social assistance is
often the main protection instrument that households have and is often meant to
contribute directly to tackling poverty, both by preventing people from falling into poverty,
and by supporting people and households already living in poverty in their exiting out of
poverty. Chapter Two also introduced two important elements of this research: the
expansion and scale of social protection in Bangladesh and social protection as risk
management. Here, the Risk Chain model offered the starting point for the discussion.
Social protection measures deal with the strategies and responses individuals and
208
households adopt to reduce, mitigate and cope with risks. These strategies aim at
smoothing consumption and avoiding irreversible or temporary falls below an acceptable
benchmark, the poverty line. Chapter Two also suggested that while the role of social
protection in reducing poverty by preventing people falling into poverty is well accepted,
the role social protection instruments in poverty exits is controversial and conceptualized
in different ways in the literature.
These concepts are expanded and critically examined in Chapter Three, which reviews and
expands the discussion on poverty exit by examining the SRM and framing it as part of a
‘risk-centred’ paradigm shift in society and social policy. The SRM emphasises the role of
risk management measures in protecting livelihoods and promoting risk taking and higher
level of investments as a key action to move out of poverty. The SRM is embedded in a
conceptualization of risk and risk prevention rooted in fundamental hypotheses of
neoclassical economics, such as the expected utility and permanent income hypothesis. Risk
taking, the proactive management of risk at household level, was argued to be essential in
enabling these households to ‘grasp opportunity for economic development and poverty
reduction’. The SRM suggests that households living in poverty are risk averse and as a result
they are very reluctant to engage in higher risk/higher return activities. If households have access to
risk management (social protection) instruments, they are more likely to engage in
investments which would lead to, for instance, accumulating assets (Moser and Dani,
2008), therefore improving their living conditions. The SRM suggests a linear process,
where the access to social protection triggers a change in the individual or household’s
investment behaviour towards engaging in greater investments in different dimensions of
their lives, such as education, business and so forth. Chapter Three also provided a critical
review of these concepts by examining the SRM through a multidisciplinary, rather than a
purely economics, lens. The chapter argued that the SRM oversimplifies and
underestimates a variety of factors and processes that play a role in the household’s
investment behaviour and that unpacking these factors and processes at play is needed to
improve the explanatory and predictive power of the SRM in relation to poverty exit. To
do so, in Chapters Three and Four and to some extent in Chapter Five, after reviewing
different research approaches to unpack these processes, I argued for and adapted a
qualitative research strategy, specifically the GT as the best fit to making sense of the
complex and specific factors which influence households in three dimensions of their life:
education, health and savings. Through applying the sequential steps of the GT and taking
advantage of the qualitative software Nvivo for the final analysis, household investment
behaviour emerged as a two stages process of ‘constructing’ investment preferences (what

209
they are willing to do), and of ‘realizing ’ or ‘revealing’ household choices (what they
actually do). By carefully distinguishing the two stages, I have identified an opportunity
structure that filters the investment preferences and determines to what extent these
preferences will be realized as investment behaviour. This approach provided insights into
the several factors that play a part in constructing and changing investment preferences and
others that favour or constrain their realization, which I have examined in Chapters Five,
Six and Seven, respectively on savings, education and health.
What factors shape the household’s investment behaviour in savings, education and health?
And to what extent do social pension schemes play a role in this process? Chapters Five,
Six and Seven show that all households construct their preferences to invest based on
factors that exogenous to their access to social assistance schemes. Social assistance in the
form of cash transfer may play a role in realizing these preferences only under certain
circumstances. In line with the distinction between investment preferences and investment
behaviour in the empirical chapters of this study (see Chapters Five, Six and Seven), the
GT helped me to develop a dimension specific explanatory models that illustrates the
process that leads household to opt for more investments and the factors that shape
household’s preference’s or household behaviour, or both.
In savings, the research showed that savings preferences are formed mostly by the
existence of strong, clear, moral and purposeful individual or community goals. Also, rather
than the type of goal (such as bequest, retirement or precautionary) as suggested in much
of current of the literature, it is the motive’s strength that matters. The more powerful the
motive is, the more likely households will be able to overcome various barriers and
translate their savings preferences into reality. Here the barriers are part of an opportunity
structure that does not shape the household preferences, but only determines the extent to
which households’ preferences will translate into savings choices. The opportunity
structure includes three elements: a savings financial threshold; the existence and access to
formal, trusted and flexible savings instruments; and the need to fit in with the wider
society.
In education the research suggested that investment preferences are shaped by the
awareness on the role of education in improving people’s lives, by the household’s
motivation to reach a minimum threshold of education, and by the attitude or commitment
of school going children towards education. However, whether and to what extent these
investment preferences in education are actualized depend on a variety of other factors,
210
including the availability of financial resources that exceed the household’s requirements in
terms of addressing some immediate and survival needs.
Like the savings and education dimensions, the research argued that revealing higher
investments in health is the result of a two-stage process that starts with the construction
of the household’s investment preference and ends with revealed health choices. In the
first stage, the household’s health investment preference is shaped by how a given health
situation is perceived and classified in relation to the extent to which it represents a threat
to the individual or household’s survival. The higher the threat to the survival, the more the
household is willing to invest in health. In the second stage, the constructed investment
preferences can be fully revealed if either the health event is considered a real threat of
survival and therefore the household will do anything to protect life and its basic
functioning, or, if the event is not classified as a threat to survival and that financial
resources are available to finance different types of strategies.
The empirical evidence indicated that access to social assistance did not have a role in
constructing investment preferences. However, it had limited role under certain
circumstances in favouring the realization of the household investment preferences. This
can be explained by the specific features of the OAA program, notably its specific targeting
of elderly people only, and the rather low amount of cash transfer involved.
As an element of the opportunity structure, the OAA can facilitate revealing more savings,
but does not in itself shape the household’s preference towards more savings. The pension
works as any other additional financial resources available in the household and may
contribute to reach a savings financial threshold. Nevertheless, in a household which is
willing to save for different motives, which can span from precautionary savings for
emergency needs to savings for education, the predictability and regularity of the pension
can contribute to the realization of their savings preference (e.g. regular contribution to the
somiti).
In the education dimension, it emerged that the role of OAA in the household’s
investment behaviour in education is limited to revealing ‘minor’ educational investments,
such as purchasing books or stationeries. This may occur only under some circumstances
though: if survival needs have been addressed and if the timing of the transfer coincided
with ‘pressing’ educational needs. The limited amount of the cash transferred under this
scheme seems to be the major cause behind this, since I have identified that major income
transfers, such as a new household member entering the labour market, may instead have
an impact on smoothing household’s consumption.

211
In health, the pension provides additional financial resources that are used for financing the
health needs of its beneficiaries. The pension does not shape the willingness of the
households to invest in health; rather, it acts at the behavioural and opportunity structure
level by favouring the realization of existing investment preferences in some cases.
In light of these findings, Chapter Eight argued that the SRM fails to encapsulate the
complexity of household investment decisions, crucial to exiting poverty. Social assistance
may only in some circumstances determine whether households will invest more and
engage in higher risk/higher return activities. The investments that households reveal are
the result of a process that is much more complex than simply having access to social
assistance. It starts with the construction of an investment preference which is then filtered
by an opportunity structure that determines the extent of a household’s investment
preference will be translated (or not) into more investments. While the SRM may to some
extent offer a useful analytical framework for understanding poverty, its theoretical and
explanatory validity is challenged.
Building on some of the concepts that emerged in the research, I developed a ‘behavioural’
variation of the ‘risk taking /poverty exit’ component of the SRM framework in an attempt
at improving its explanatory capacity. This behavioural alternative to the ‘poverty exit’
component of the SRM elements is influenced by the literature discussed in Chapter Three
but most importantly on concepts that emerged in the explanatory models developed
through the GT, such as the diversity of design and impacts of social protection
interventions, the pre-existing investment preferences of each household, the existence of a
conducive environment for investing more, and the SRM’s conceptualization of poverty.
This study has important implications for both research and practice in terms of designing
and implementing social assistance schemes. In relation to research, this study identified a
need to learn across different disciplines and specifically to adopt and adapt qualitative
research techniques to complement and support research in economics. It also opened up a
discussion on innovative ways to test and validate the explanatory power of theories and
conceptual frameworks. In designing and implementing social assistance schemes, the
generosity of the grant, motivation and trust, protection from shocks are all elements that
can transform the way a program is perceived and as such, determine households’
behaviour. Integrating these elements in the design of social assistance schemes is,
however, challenging. It requires implementing complementary sensitization programmes,
savings or insurance schemes of interventions that often follow outside the competence of
agencies implementing cash transfer schemes.
212
9.3 Seven findings and seven contributions to knowledge and practice
A strong motivation for undertaking this research relates to the increasingly influential
nature of the SRM in shaping both theory and practice with respect to the role of social
protection in poverty reduction. This section summarizes the main findings and
contributions of the research in these areas.
Protection and promotion for poor households: Can the SRM Framework explain it all?
This is the first and most important issue at the centre of this research. To to what extent is
the SRM and its conceptualization of social protection, investments and risk taking as a key exit route out
of poverty, congruent with the empirical findings? This research argued that the social assistance
may support the realization of investments but does not directly influence the preferences
of the households to invest more. Access and participation to social assistance schemes
does not ‘automatically’ trigger more investments. This finding has implications for
conceptualizing poverty exit: which is not the sole responsibility if the individual
households that expected that, by having access to social assistance, will invest more. This
has major implication for policy making since clearly suggest that social assistance will not
alone help households to exit poverty.
Social assistance, consumption smoothing and investments: Access and participation to
social assistance schemes does not ‘automatically’ trigger more investments. This happens
for two reasons. First, the diversity of design features social assistance determines to what
extent social assistance may contribute to consumption smoothing. The extensive
fieldwork on the OAA suggested that social assistance rarely contribute to consumption
smoothing, due to specific design features of the interventions. Households are not able to
smooth consumption and are continually exposed to risks and shocks which undermine the
availability of resources for engaging in investments. Second, as it will be explained next,
social assistance does not shapes the investment preferences of the household but can only
act as an enabling factor to realize such investments.
Generosity of cash transfer, family size and timing: improving the design of social
assistance interventions. The design features of social assistance and their implementation
matter. This research suggests that, by looking a particular program, the OAA, the
generosity cash grant needs to be determined based on the family size, since, resources are
often shared with the whole household. The larger the household is, the more likely the
grant will be diluted in the household pot, rather than contributing in revealing specific
investments. The timing of the transfer coinciding with, for instance, important educational
213
milestones, seems to be an important element in revealing investments and should be
considered during the design and implementation of social assistance schemes.
Understanding the ‘process of realization’: why does it matter? This research identified and
examined what I defined as the process of realization. The process of realization is a basic
framework that links the investment preference (what the household is willing to invest)
and the investment behaviour (what the household will reveal). This process highlighted
the importance that household preference, suggesting that households tend to realize pre-
existing preferences which are not shaped by social assistance or availability of financial
resources. What the household reveal is instead a realization of pre-existing preferences, if
some enabling factors (opportunity structure) are in place
What determines the investment preferences and their realization? This research examined
the main concepts that determine and shape the household investment preferences and
their realization into real investments. Each dimension studied, identified key concepts
such as experience, motivation, strength of goal, minimum threshold of education, survival,
among others, to have major role in shaping the investment preferences and, in some cases,
even the realization into actual investments. Some of these concepts, such as the minimum
threshold of education and the strength of goals, are new and represent an important
contribution to debates on preference construction.
Operationalizing the GT in low income settings: GT has proved to be invaluable in
identifying and examining the process of realization and the factors that influence
household’s investment. The operationalization of the structural characteristics of GT in a
seven stages process is both an important methodological contribution on how to do
research in low income settings and also a guide on applying and adapting the GT to
specific contexts. The level of details of Chapters Three, Four and Five on both the
operationalization of the GT during the fieldwork and in the final analysis through the
qualitative software Nvivo, give transparency to the research process and an important
guide for adopting this approach to related studies in other country contexts.
GT and research in economic theory: a match made in heaven? The GT and qualitative
research techniques adopted have proved to be appropriate to do research on SRM and on
the economic hypothesis that underpin it. They were instrumental in providing inputs to
the revision of theories that aim at explaining and predicting household investment
behaviour. GT offers an approach which can complement more traditional quantitative
methodologies so do research in economics.

214
9.4 Conclusions
This thesis has argued that the social pension scheme, the OAA in Bangladesh, has a
limited role in promoting higher levels of investments in savings, education and health in
the households targeted by the program. The in-depth field work in four poor urban
settlements in the Narayanganj city of Bangladesh shows that other factors play a major
role in shaping the investment preferences and investment behaviour of the households
interviewed. The GT has proved to be a valuable approach to conceptualizing and
theorizing these findings into explanatory models that help deepen our understanding of
households’ investment behaviour.
Nevertheless, it is important to recognise that this argument is based on in-depth
interviews with 43 households in urban Bangladesh and further research is needed to
examine if and to what extent the arguments is valid in other contexts. ‘Contexts’ refers to
geographical locations as well as to types social assistance interventions that may have a
more important role in promoting or favouring higher levels of investments.
Also, this thesis examined three dimensions of the households’ life. Data, however, were
collected for other dimensions including access to credit, employment and productive
investments. The analysis of these dimensions may contribute to identifying new concepts
that have not been identified in savings, education and health and may also recognize a
more prominent role for the OAA in the households’ investments.
Word Count 76,400 (excluding References and Appendices)

215
References
ABODERIN, I. 2006. Intergenerational support and old age in Africa, New Brunswick, N.J., Transaction.
ADAM, B., BECK, U. & LOON, J. V. 2000. The risk society and beyond : critical issues for social theory, London, Sage.
ADATO, M. & BASSETT, L. 2009. Social protection to support vulnerable children and families: the potential of cash transfers to protect education, health and nutrition. AIDS Care, 21, 60-75.
ADB 2004. Economic growth and poverty reduction in Bangladesh, Dhaka, Co-published by Asian Development Bank, Bangladesh Resident Mission and Embassy of Japan in Bangladesh.
AHAMAD, M. G., KHONDKER, R. K., AHMED, Z. U. & TANIN, F. 2012. Seasonal food insecurity in Bangladesh: evidences from northern areas. Mitigation and Adaptation Strategies for Global Change, 1-12.
AHMAD, M. & COMMUNITY DEVELOPMENT LIBRARY (DHAKA BANGLADESH) 1999. Bottom up : NGO sector in Bangladesh, Dhaka, Community Development Library.
AHMED, A. U., QUISUINBING, A. R., NASREEN, M., HODDINOTT, J. F. & BRYAN, E. 2010. Comparing food and cash transfers to the ultra poor in Bangladesh. Research Report of the International Food Policy Research Institute, 1-248.
AHMED, S. M., PETZOLD, M., KABIR, Z. N. & TOMSON, G. 2006. Targeted intervention for the ultra poor in rural Bangladesh: Does it make any difference in their health-seeking behaviour? Social Science & Medicine, 63, 2899-2911.
AHMED, S. S. Year. Delivery Mechanisms of Cash Transfer Programs to the Poor in Bangladesh. In: SERIES, S. S. N. P., ed. Third International Conference on Conditional Cash Transfers, 2006 Istanbul, Turkey. World Bank.
AHMED, S. S. 2009. Are the Poor Protected? Vulnerability and the Role of Safety Nets. In: NARAYAN, A. & ZAMAN, H. (eds.) Breaking down poverty in Bangladesh. Dhaka: The University Press Limited.
AJZEN, I. 1991. The theory of planned behavior. Organizational Behavior and Human Decision Processes, 50, 179-211.
AJZEN, I. & FISHBEIN, M. 1977. Attitude-behavior relations: A theoretical analysis and review of empirical research. Psychological Bulletin, 84, 888-918.
AKBAR, H. M. D., MINNERY, J. R., HOREN, B. V. & SMITH, P. 2007. Community water supply for the urban poor in developing countries: the case of Dhaka, Bangladesh. Habitat international, 31, 24-35.
ALAM, F., SIWAR, C., TALIB, B. & ISLAM, R. 2011a. The analysis of international migration towards economic growth. American Journal of Applied Sciences, 8, 782-788.
ALAM, F., SIWAR, C., TALIIB, B. & ISLAM, R. 2011b. Impacts on international migration and remittances growth. American Journal of Environmental Sciences, 7, 20-25.
ALCOCK, P., ERSKINE, A., MAY, M. & SOCIAL POLICY ASSOCIATION (GREAT BRITAIN) 1998. The student's companion to social policy, Oxford, Blackwell.
ALDERMAN, H. & YEMTSOV, R. 2012. Productive role of safety nets : background paper for the World Bank 2012-2022 social protection and labor strategy. Social Protection Discussion Papers 67609
The World Bank. ALWANG, J., SIEGEL, P. B. & JØRGENSEN, S. L. 2001. Vulnerability: A View From
Different Disciplines. Social Protection Discussion Paper No. 0115. The World Bank. ANDERSON, L. R. & MELLOR, J. M. 2009. Are risk preferences stable? Comparing an
experimental measure with a validated survey-based measure. Journal Risk Uncertain, 137–160.

216
ANDO, A. & MODIGLIANI, F. 1963. The "Life Cycle" Hypothesis of Saving: Aggregate Implications and Tests. The American Economic Review, 53, 55-84.
AOO, K., BUTTERS, S., LAMHAUGE, N., NAPIER-MOORE, R. & ONO, Y. 2007. Whose (Transformative) Reality Counts? A Critical Review of the Transformative Social Protection Framework. IDS Bulletin, 38, 29-31.
BAIRD, S., FERREIRA, F. H. G., ÖZLER, B. & WOOLCOCK, M. 2014. Conditional, unconditional and everything in between: a systematic review of the effects of cash transfer programmes on schooling outcomes. Journal of Development Effectiveness.
BANERJEE, A. & MULLAINATHAN, S. 2010. The Shape Of Temptation: Implications For The Economic Lives Of The Poor. National Bureau Of Economic Research, Working Paper 15973.
BANERJEE, A. V., DUFLO, E., GLENNERSTER, R. & KOTHARI, D. 2010. Improving immunisation coverage in rural India: clustered randomised controlled evaluation of immunisation campaigns with and without incentives. BMJ (Clinical research ed.), 340.
BANKS, N. 2008. A tale of two wards: political participation and the urban poor in Dhaka city. ENVIRONMENT AND URBANIZATION, 20, 361-376.
BANKS, N., ROY, M. & HULME, D. 2011. Neglecting the urban poor in bangladesh: Research, policy and action in the context of climate change. ENVIRONMENT AND URBANIZATION, 23, 487-502.
BARRIENTOS, A. 2000. Work, retirement and vulnerability of older persons in Latin America: What are the lessons for pension design? Journal of International Development, 12, 495-506.
BARRIENTOS, A. 2003. Pensions and Development in the South. Geneva Papers on Risk and Insurance: Issues and Practice, 28, 696-711.
BARRIENTOS, A. 2004. Cash Transfers For Older People Reduce Poverty And Inequality. Draft Background Paper for WDR 2006: Equity and Development.
BARRIENTOS, A. 2011. Social protection and poverty. International Journal of Social Welfare, 20, 240-249.
BARRIENTOS, A. 2012. Social Transfers and Growth: What do we know? What do we need to find out? World Development, 40, 11-20.
BARRIENTOS, A. 2013. Social assistance in developing countries, Cambridge University Press. BARRIENTOS, A., GORMAN, M. & HESLOP, A. 2003. Old age poverty in developing
countries: Contributions and dependence in later life. World Development, 31, 555-570.
BARRIENTOS, A. & HULME, D. 2005. Chronic Poverty and Social Protection: Introduction. European Journal of Development Research, 17, 1-7.
BARRIENTOS, A., HULME, D. & SHEPHERD, A. 2005. Can Social Protection Tackle Chronic Poverty? European Journal of Development Research, 17, 8-23.
BARRIENTOS, A. & LLOYD-SHERLOCK, P. 2002. Older and poorer? Ageing and poverty in the South. Journal of International Development, 14, 1129-1131.
BARRIENTOS, A. & SABATÉS-WHEELER, R. 2010. Strategic complementarities and social transfers: how do PROGRESA payments impact nonbeneficiaries? Applied Economics, 43, 3175-3185.
BARRIENTOS, A. & SCOTT, J. 2008. Social Transfers and Growth: A Review. Brooks World Poverty Institute, University of Manchester Working Paper 52.
BARRO, R. J. 2013. Health and economic growth. Annals of Economics and Finance, 14, 305-342.
BAULCH, B. 2011. The medium-term impact of the primary education stipend in rural Bangladesh. Journal of Development Effectiveness, 3, 243-262.
BECK, U. & RITTER, M. 1992. Risk society : towards a new modernity, London, Sage. BEGUM, S. & WESUMPERUMA, D. 2012. Old Age Allowance Programme in
Bangladesh: Challenges

217
and Lessons. In: HANDAYANI, S. W. & BABAJANIAN, B. (eds.) Social Protection for Older Persons: Social Pension in Asia. Manila: Asian Development Bank.
BERNSTEIN, P. L. 1996. Against the gods : the remarkable story of risk, New York ; Chichester, Wiley.
BERTRAND, M. & MULLAINATHAN, S. 2001a. Do People Mean What They Say? Implications for Subjective Survey Data. The American Economic Review, 91, 67-72.
BERTRAND, M. & MULLAINATHAN, S. 2001b. Economics and social behavior: Do people mean what they say? Implications for subjective survey data. American Economic Review, 91, 67-72.
BINSWANGER, H. P. 1980. Attitudes toward Risk: Experimental Measurement In Rural India. American Agricultural Economics Association.
BINSWANGER, H. P. & ROSENZWEIG, M. R. 1989. Wealth, Weather Risk And The Composition And Profitability Of Agricultural Investments. ECONOMIC DEVELOPMENT CENTER, Department of Economics, Minneapolis, Department of Agricultural and Applied Economics, St. Paul, UNIVERSITY OF MINNESOTA.
BINSWANGER, J. 2010. Understanding the heterogeneity of savings and asset allocation: A behavioral-economics perspective. Journal of Economic Behavior and Organization, 76, 296-317.
BINSWANGER, J. 2012. Life cycle saving: Insights from the perspective of bounded rationality. European Economic Review, 56, 605-623.
BINSWANGER, J. & CARMAN, K. G. 2012. How real people make long-term decisions: The case of retirement preparation. Journal of Economic Behavior and Organization, 81, 39-60.
BIRKMANN, J. R. & EBRARY, I. 2006. Measuring vulnerability to natural hazards : towards disaster resilient societies, Tokyo, United Nations University Press.
BLOOM, D. E., CANNING, D. & FINK, G. 2010. Implications of population ageing for economic growth. Oxford Review of Economic Policy, 26, 583-612.
BOONYABANCHA, S. & MITLIN, D. 2012. Urban poverty reduction: Learning by doing in Asia. ENVIRONMENT AND URBANIZATION, 24, 403-421.
BRAC 2008. Small Scale Old Age and Widow Allowance for the Poor in Rural Bangladesh: An Evaluation. Research and Evaluation Division, BRAC, Research Monograph Series No. 36.
BRINGER, J. D., JOHNSTON, L. H. & BRACKENRIDGE, C. H. 2004. Maximizing Transparency in a Doctoral Thesis1: The Complexities of Writing About the Use of QSR*NVIVO Within a Grounded Theory Study. Qualitative Research, 4, 247-265.
BRINGER, J. D., JOHNSTON, L. H. & BRACKENRIDGE, C. H. 2006. Using Computer-Assisted Qualitative Data Analysis Software to Develop a Grounded Theory Project. Field Methods, 18, 245-266.
BROOKS, W. A., HOSSAIN, A., GOSWAMI, D., SHARMEEN, A. T., NAHAR, K., ALAM, K., AHMED, N., NAHEED, A., NAIR, G. B., LUBY, S. & BREIMAN, R. F. 2005. Bacteremic Typhoid Fever in Children in an Urban Slum, Bangladesh. Emerging Infectious Diseases, 11, 326-329.
CAMERER, C., LOEWENSTEIN, G. & RABIN, M. 2004. Advances in behavioral economics, New York Princeton, N.J., Russell Sage Foundation ; Princeton University Press.
CARTER, M., R. & BARRETT, C. 2007a. Asset Thresholds and Social Protection: A 'Think-Piece'. IDS Bulletin, 38, 34-38.
CARTER, M., R. & BARRETT, C. 2007b. Asset Thresholds and Social Protection: A Reply to Dercon. IDS Bulletin, 38, 43-44.
CHARMAZ, K. 2006. Constructing Grounded Theory: A Practical Guide Through Qualitative Analysis, SAGE.
CHARMAZ, K. & BRYANT, A. 2007. The SAGE handbook of grounded theory, London, SAGE.
CHICKEN, J. C. & POSNER, T. 1998. The philosophy of risk, London, Thomas Telford.
218
COHEN, M. J. & ANGLO-GERMAN FOUNDATION FOR THE STUDY OF INDUSTRIAL, S. 1999. Risk in the modern age : social theory, science, and environmental decision-making, New York, St. Martin's Press.
COLLINS, D. 2009. Portfolios of the poor how the world's poor live on. Princeton, N.J. ; Oxford: Princeton University Press.
CONWAY, T. & NORTON, A. 2002. Nets, Ropes, Ladders and Trampolines: The Place of Social Protection within Current Debates on Poverty Reduction. Development Policy Review, 20, 533-540.
COOPER, J. O., HERON, T. E. & HEWARD, W. L. 1987. Applied behavior analysis, Columbus (Ohio) ; London, Merrill Publishing.
CORDES, J. J. 1990. Socio-economic perspectives on household saving behavior. The Journal of Behavioral Economics, 19, 273-284.
COUDOUEL, A., HENTSCHEL, J. & WODON, Q. 2002. Poverty Measurement and Analysis, Poverty Reduction, Strategy Sourcebook (PRSP), Washington, DC, The World Bank.
COZBY, P. C. 2009. Methods in behavioral research, Boston, McGraw-Hill Higher Education. CPRC 2008. Chronic Poverty Report 2008-2009: Escaping Poverty Traps, Chronic Poverty
Research Centre. CULPITT, I. 1999. Social policy and risk, London ; Thousand Oaks, Calif., Sage Publications. CUNNINGHAM, P. J. 2009. Chronic burdens: the persistently high out-of-pocket health
care expenses faced by many Americans with chronic conditions. Issue brief (Commonwealth Fund), 63, 1-14.
DAKE, K. 1991. Orienting dispositions in the perception of risk: An analysis of contemporary worldviews and cultural biases. Journal of Cross-Cultural Psychology, 22, 61-82.
DANI, A. A. & HAAN, A. D. 2008. Inclusive states : social policy and structural inequalities, Washington, D.C., World Bank.
DE NEUBOURG, C. & WEIGAND, C. 2000. Social Policy as Social Risk Management. Innovation: The European Journal of Social Sciences, 13, 401-412.
DEVEREUX, S. 2002. Can Social Safety Nets Reduce Chronic Poverty? Development Policy Review, 20, 657-675.
DEVEREUX, S. & SABATES-WHEELER, R. 2004. Transformative social protection. IDS Working Paper 232-October 2004.
DEVEREUX, S. & SABATES-WHEELER, R. 2007. Editorial Introduction: Debating Social Protection. IDS Bulletin, 38, 1-7.
DEVEREUX, S. & UNIVERSITY OF SUSSEX. INSTITUTE OF DEVELOPMENT STUDIES. 2007. Vulnerability and social protection in Malawi, Brighton, Institute of Development Studies, University of Sussex.
DEVINE, J. 2003. The Paradox of Sustainability: Reflections on NGOs in Bangladesh. Annals of the American Academy of Political and Social Science, 590, 227-242.
DEVINE, J. & DENEULIN, S. 2011. Negotiating religion in everyday life: A critical exploration of the relationship between religion, choices and behaviour. Culture and Religion, 12, 59-76.
DHANANI, S. & ISLAM, I. 2002. Poverty, Vulnerability and Social Protection in a Period of Crisis: The Case of Indonesia. World Development, 30, 1211.
DILLON, J. L. & SCANDIZZO, P. L. 1983. Risk Attitudes of Subsistence Farmers in Northeast Brazil: A Sampling Approach. Development Research Center, World Bank, Discussion paper 17
DING, X., HARTOG, J. & SUN, Y. 2010. Can We Measure Individual Risk Attitudes in a Survey? The Institute for the Study of Labor (IZA) Discussion Paper.
DOHMEN, T., FALK, A., HUFFMAN, D., SUNDE, U., SCHUPP, J. & WAGNER, G. G. 2011. Individual risk attitudes: Measurement, determinants, and behavioral consequences. Journal of the European Economic Association, 9, 522-550.

219
DOUGLAS, M. 1986. Risk acceptability according to the social sciences, London, Routledge & Kegan Paul.
DOUGLAS, M. 1992. Risk and blame : essays in cultural theory, London, Routledge. DUPAS, P. 2011. Health behavior in developing countries. Annual Review of Economics, 3,
425-449. EDSTRÖM, J. 2007. Rethinking 'Vulnerability' and Social Protection for Children Affected
by AIDS. IDS Bulletin, 38, 101-105. ESPING-ANDERSEN, G. 1999. Social Risks and Welfare States. Social Foundations of
Postindustrial Economies, 1, 32-47. FENNELL, S. & ARNOT, M. 2008. Gender education and equality in a global context : conceptual
frameworks and policy perspectives, London, Routledge. FIEGENBAUM, A. & THOMAS, H. 1988. Attitudes toward Risk and the Risk-Return
Paradox: Prospect Theory Explanations. The Academy of Management Journal, 31, 85-106.
FOGEL, R. W., GROTTE, N. & NATIONAL BUREAU OF ECONOMIC RESEARCH. 2011. An Overview of The Changing Body Health, Nutrition, and Human Development in the Western World Since 1700. NBER working paper series no. w16938. Cambridge, Mass.: National Bureau of Economic Research.
FOUCAULT, M. 1991. Governmentality. In: BURCHELL, G., GORDON, C. & MILLER, P. M. (eds.) The Foucault effect : studies in governmentality: with two lectures by and an interview with Michel Foucault. London: Harvester Wheatsheaf.
FOUCAULT, M. & GORDON, C. 1980. Power/knowledge : selected interviews and other writings, 1972-1977, Brighton, Harvester Press.
FREY, B. S. 1997. Not just for the money : an economic theory of personal motivation, Cheltenham, Edward Elgar.
FREY, B. S. 2001. Inspiring economics : human motivation in political economy, Cheltenham, Edward Elgar.
FUREDI, F. 1997. Culture of fear : risk-taking and the morality of low expectation, London, Cassell.
GÂOMEZ HEREDERO, A., EUROPEAN COURT OF HUMAN RIGHTS. & COUNCIL OF EUROPE. 2007. Social security as a human right : the protection afforded by the European Convention on Human Rights, Strasbourg, Council of Europe Pub.
GED 2011. The Millenium Development Goals -Progress Report for Bangladesh. Dhaka: General Economic Division (GED) of the Planning Commission, Government of Bangladesh.
GERTLER, P., MARTINEZ, S. & RUBIO-CODINA, M. 2006. Investing Cash Transfers to Raise Long-Term Living Standards. World Bank Policy Research Working Paper 3994, August 2006.
GERTLER, P. J., MARTINEZ, S. W. & RUBIO-CODINA, M. 2012. Investing Cash Transfers to Raise Long-Term Living Standards. American Economic Journal: Applied Economics, 4, 164-92.
GIDDENS, A. 1998. The third way : the renewal of social democracy, Malden, Mass. ; Cambridge, Polity Press.
GIDDENS, A. 2000. The third way and its critics, Cambridge, Polity Press. GLASER, B. G. 1978. Theoretical sensitivity: advances in the methodology of grounded theory, Mill
Valley, Calif, The Sociology Press. GLASER, B. G. 1992. Basics of grounded theory analysis. Basics of Grounded Theory Analysis. GLASER, B. G. 2001. The grounded theory perspective; 1, Conceptualization contrasted with
description, Mill Valley, Calif, Sociology Press. GLASER, B. G. 2003. The grounded theory perspective; 2, Description's remodeling of grounded theory
methodology, Mill Valley, Calif, Sociology Press. GLASER, B. G. 2005. Grounded theory perspective; 3, Theoretical coding, Mill Valley, Calif,
Sociology Press.
220
GLOEDE, O., MENKHOFF, L. & WAIBEL, H. 2011. Risk attitude and risk behavior: Comparing Thailand and Vietnam. Department of Economics, Leibniz Universit¨at Hannover,.
GORMAN, M. & KHAN, A. H. 2005. The Government’s Old Allowance as a social pension for the rural poor and vulnerable older people in Bangladesh. Resource Integration Centre, Dhaka April 2005.
GORMAN, W. M. 1964. More Scope for Qualitative Economics. The Review of Economic Studies, 31, 65-68.
GREINER, A., SEMMLER, W. & GONG, G. 2005. The forces of economic growth : a time series perspective, Princeton, NJ Oxford, Princeton University Press.
GROSH, M. E. 2008. For protection and promotion : the design and implementation of effective safety nets, Washington, D.C., World Bank.
GRUESCU, S. 2007. Population ageing and economic growth : education policy and family policy in a model of endogenous growth, New York, Springer.
GUIMARÃES, R. J. R. 2007. Searching for the vulnerable: A review of the concepts and assessments of vulnerability related to poverty. European Journal of Development Research, 19, 234-250.
HACKER, J. S. 2004. Privatizing risk without privatizing the welfare state: The hidden politics of social policy retrenchment in the United States. American Political Science Review, 98, 243-260.
HADDAD, L. J., HODDINOTT, J., ALDERMAN, H. & INTERNATIONAL FOOD POLICY RESEARCH, I. 1997. Intrahousehold resource allocation in developing countries : models, methods, and policy, Baltimore; London, Johns Hopkins University Press.
HADDAD, L. J., HODDINOTT, J., ALDERMAN, H., WORLD BANK. POLICY RESEARCH DEPT, P. & HUMAN RESOURCES, D. 1994. Intrahousehold resource allocation : an overview, Washington, D.C., World Bank Policy Research Department Poverty and Human Resources Division.
HARON, S. A., SHARPE, D. L., ABDEL-GHANY, M. & MASUD, J. 2013. Moving Up the Savings Hierarchy: Examining Savings Motives of Older Malay Muslim. Journal of Family and Economic Issues, 34, 314-328.
HARRISON, G. W. & LIST, J. A. 2004. Field Experiments. Journal of Economic Literature, 42, 1009-1055.
HEITZMANN, K., CANAGARAJAH, R. S. & SIEGEL, P. B. 2002. Guidelines for Assessing the Sources of Risk and Vulnerability. Social Protection Discussion Paper No. 0218. The World Bank.
HELPAGE 2009. Global ageing statistics. http://www.helpage.org/Researchandpolicy/Stateoftheworldsolderpeople/Globalstatistics.
HODDINOTT, J. & QUISUMBING, A. 2003. Data Sources for Microeconometric Risk and Vulnerability Assessments. Social Protection Discussion Paper No. 0323. The World Bank.
HOLLOWAY, R. & INTERMEDIATE TECHNOLOGY DEVELOPMENT GROUP. 1998. Supporting citizens' initiatives : Bangladesh's NGO's and society, London, Intermediate Technology.
HOLZMANN, R. & JØRGENSEN, S. 2000. Social Risk Management: A new conceptual framework for Social Protection, and beyond. Social Protection Discussion Paper No. 0006. The World Bank.
HOLZMANN, R. & KOZEL, V. 2007a. The Role of Social Risk Management in Development: A World Bank View. IDS Bulletin, 38, 8-13.
HOLZMANN, R. & KOZEL, V. 2007b. The role of social risk management in development: a World Bank view - reply to comments. IDS bulletin, 38, 20(3).
HOLZMANN, R., ROBALINO, D. A., TAKAYAMA, N. & WORLD BANK. 2009. Closing the coverage gap : role of social pensions and other retirement income transfers, Washington, DC, World Bank.
221
HOQUE, A. & SELWYN, B. J. 1996. Birth practice patterns in urban slums of Dhaka, Bangladesh. Women & Health, 24, 41.
HOSSAIN, M. 2003. Rice research, technological progress, and impacts on the poor : the Bangladesh case : summary report, Washington, D.C., Environment and Production Technology Division, International Food Policy Research Institute.
HOSSAIN, N. 2010. School exclusion as social exclusion: The practices and effects of a conditional cash transfer programme for the poor in Bangladesh. Journal of Development Studies, 46, 1264-1282.
HOSSAIN, S. 2005. Poverty, household strategies and coping with urban life: examining 'livelihood framework' in Dhaka City, Bangladesh. Bangladesh e-journal of sociology, 2.
HOSSAIN, S. 2008. Rapid Urban Growth and Poverty in Dhaka City. Bangladesh e-Journal of Sociology., 5.
HUSSAIN, A., ALI, S. M. K. & KVÃ¥LE, G. 1999. Determinants of mortality among children in the urban slums of Dhaka city, Bangladesh. Tropical Medicine & International Health, 4, 758.
HUTCHISON, A. J., JOHNSTON, L. H. & BRECKON, J. D. 2010. Using QSR-NVivo to facilitate the development of a grounded theory project: An account of a worked example. International Journal of Social Research Methodology, 13, 283-302.
IRUDAYA RAJAN, S. 2008. Social security for the elderly : experiences from South Asia, London, Routledge.
IZUTSU, T., TSUTSUMI, A., ISLAM, A. M., KATO, S., WAKAI, S. & KURITA, H. 2006. Mental health, quality of life, and nutritional status of adolescents in Dhaka, Bangladesh: Comparison between an urban slum and a non-slum area. Social Science & Medicine, 63, 1477-1488.
JOHNSTON, L. 2006. Software and method: Reflections on teaching and using QSR NVivo in doctoral research. International Journal of Social Research Methodology, 9, 379-391.
JONES, G., STEKETEE, R. W., BLACK, R. E., BHUTTA, Z. A. & MORRIS, S. S. 2003. How many child deaths can we prevent this year? Lancet, 362, 65-71.
KABEER, N. 2001. Ideas, Economics and 'the Sociology of Supply': Explanations for Fertility Decline in Bangladesh. The Journal of Development Studies, 38, 29-70.
KABEER, N. 2002. Safety Nets and Opportunity Ladders: Addressing Vulnerability and Enhancing Productivity in South Asia. Development Policy Review, 20, 589-614.
KABEER, N. 2007. A 'Vision' Thing? Debate and Difference within the OECD-DAC Poverty Network Approaches to Social Protection. IDS Bulletin, 38, 51-53.
KAHNEMAN, D. & TVERSKY, A. 2008. Choices, values, and frames, Cambridge, Cambridge University Press.
KAKWANI, N., SON, H. H. & HINZ, R. 2006. Poverty, Old- Age and Social Pension in Kenya. Working Paper 24. International Poverty Centre–United Nations Development Programme.
KAKWANI, N. & SUBBARAO, K. 2005. Aging and Poverty in Africa and the Role of Social Pensions. Social Protection Discussion Paper No. 0521. The World Bank.
KATONA, G. 1975. Psychological economics, New York ; Oxford, Elsevier. KEMSHALL, H. 2002. Risk, social policy and welfare, Buckingham, Open University Press. KEYNES, J. M. 1936. The general theory of employment, interest and money, London, Macmillan. KHANDKER, S. R. 2012. Seasonality of income and poverty in Bangladesh. Journal of
Development Economics, 97, 244-256. KNIGHT, F. H. B. 1971. Risk, uncertainty and profit, Chicago ; London, University of
Chicago Press. KRISHNA, A. 2004. Escaping poverty and becoming poor: Who gains, who loses, and
why? World Development, 32, 121-136. KRISHNA, A. 2006. Pathways out of and into poverty in 36 villages of Andhra Pradesh,
India. World Development, 34, 271-288.

222
KRISHNA, A. 2010. Who became poor, who escaped poverty, and why? Developing and using a retrospective methodology in five countries. Journal of Policy Analysis and Management, 29, 351-372.
KRISHNA, A., POGHOSYAN, M. & DAS, N. 2012. How Much Can Asset Transfers Help the Poorest? Evaluating the Results of BRAC's Ultra-Poor Programme (2002-2008). Journal of Development Studies, 48, 254-267.
LANCASTER, K. 1962. The Scope of Qualitative Economics. The Review of Economic Studies, 29, 99-123.
LAWRENCE, H. 2007. Comment on 'the role of social risk management in development: a World Bank view'. IDS bulletin, 38, 14(3).
LEE, H. G. 2008. Ageing in Southeast and East Asia : family, social protection and policy challenges, Singapore, Institute of Southeast Asian Studies.
LIPTON, M. 1968. The theory of the optimising peasant. Journal of Development Studies, 4, 327 - 351.
LONG, G. T. & PFAU, W. D. 2009. Ageing, poverty and the role of a social pension in Vietnam. Development and Change, 40, 333-60.
LUCAS, A. M. 2010. Malaria Eradication and Educational Attainment: Evidence from Paraguay and Sri Lanka. American Economic Journal: Applied Economics, 2, 46-71.
LUPTON, D. 1999. Risk and sociocultural theory : new directions and perspectives, Cambridge, Cambridge University Press.
LUPTON, D., HAMILTON, P. & NETLIBRARY, I. 1999. Risk, London, Routledge. LUSTIG, N. 2001. Shielding the poor : social protection in the developing world, Washington, D.C.,
Brookings Institution Press. MALUCCIO, J. A. 2005. Coping with the “Coffee Crisis” in Central America: The Role of
the Nicaraguan Red de Protección Social. International Food Policy Research Institute, FCND Discussion Paper 188
MARK, M. M. & SHOTLAND, R. L. 1987. Multiple methods in program evaluation, San Francisco, Jossey-Bass.
MASLOW, A. H. 1943. A theory of human motivation. Psychological Review, 50, 370-396. MASLOW, A. H. & MURPHY, G. 1954. Motivation and Personality., New York, Harper &
Bros. MATIN, I. & HULME, D. 2003. Programs for the Poorest: Learning from the IGVGD
Program in Bangladesh. World Development, 31, 647. MAVROTAS, G., SHORROCKS, A. F., NETLIBRARY INC. & WORLD INSTITUTE
FOR DEVELOPMENT ECONOMICS RESEARCH. 2007. Advancing development core themes in global economics. Studies in development economics and policy. Basingstoke [England] ; New York: Palgrave Macmillan in association with the United Nations University World Institute for Development Economics Research.
MCKINNON, R. 2004. Social risk management and the World Bank: resetting the 'standards' for social security? Journal of Risk Research, 7, 297-314.
MITLIN, D. 2005a. Editor's introduction: chronic poverty in urban areas. ENVIRONMENT AND URBANIZATION, 17, 3(8).
MITLIN, D. 2005b. Understanding chronic poverty in urban areas. International Planning Studies, 10, 3(17).
MITLIN, D., SEN, B., SABRY, S., KEDIR, A. M., IYENDA, G., CONTICINI, A., HENRY-LEE, A., SWARDT, C. D., PUOANE, T., CHOPRA, M., TOIT, A. D., HAMMAL, F., MOCK, J., WARD, K. D., FOUAD, M. F., BEECH, B. M., MAZIAK, W. & HASAN, A. 2005. Chronic poverty. Environment and urbanization, 17, 1-216.
MODIGLIANI, F. 1986. Life cycle, individual thrift, and the wealth of nations. SCIENCE, 234, 704-712.

223
MORDUCH, J. 1994. Poverty and vulnerability. The American Economic Review ( Nashville ), 84, 221 (5 pages).
MORDUCH, J. 1995. Income Smoothing and Consumption Smoothing. The Journal of Economic Perspectives, 9, 103-114.
MORDUCH, J. 1999. Between the State and the Market: Can Informal Insurance Patch the Safety Net? . The World Bank Research Observer, 14.
MORDUCH, J. 2000. The microfinance schism. World Development, 28, 617-629. MOSER, C. O. N. & DANI, A. A. 2008. Assets, livelihoods, and social policy, Washington, DC,
World Bank. MOTTALEB, K. A. & SONOBE, T. 2011. An inquiry into the rapid growth of the
garment industry in Bangladesh. Economic Development and Cultural Change, 60, 67-89. MUJERI K, M. K. 2000. Poverty trends and growth performance: Some issues in
Bangladesh. Pakistan Development Review, 39, 1171-1191. MUKHERJI, A., DESAI, A. & WRIGHT, P. 2008. A Contingent Relationship Between
Risk and Return: Toward A Behavioral Model of Decision Making. Journal of Behavioral and Applied Management, 9, 240.
MULLICK, M. S. I. & GOODMAN, R. 2005. The prevalence of psychiatric disorders among 5–10 year olds in rural, urban and slum areas in Bangladesh. Social Psychiatry & Psychiatric Epidemiology, 40, 663-671.
MYTHEN, G., WALKLATE, S. & EBRARY, I. 2006. Beyond the risk society : critical reflections on risk and human security, Maidenhead, Open University Press.
NARAYAN-PARKER, D., PETESCH, P. L., PRITCHETT, L. & WORLD, B. 2007a. Moving out of poverty V.1, Washington, D.C., Basingstoke : World Bank ; Palgrave Macmillan.
NARAYAN-PARKER, D., PETESCH, P. L. & WORLD, B. 2007b. Moving out of poverty V.2, Washington, D.C., Copublication of Palgrave Macmillan and the World Bank.
PAPREEN, N., SHARMA, A., SABIN, K., BEGUM, L., AHSAN, S. K. & BAQUI, A. H. 2000a. Living with Infertility: Experiences Among Urban Slum Populations in Bangladesh. Reproductive Health Matters, 8, 33.
PAPREEN, N., SHARMA, A., SABIN, K., BEGUM, L., AHSAN, S. K. & BAQUI, A. H. 2000b. Living with infertility: experiences from urban slum populations in Bangladesh. Reproductive health matters, 8, 33-44.
PAYNE, J. W., BETTMAN, J. R. & JOHNSON, E. J. 1992. Behavioral decision research: A constructive processing perspective. Annual Review of Psychology, 43.
PIERCE, W. D., CHENEY, C. D. & NETLIBRARY, I. 2004. Behavior analysis and learning, Mahwah, N.J. ; London, Lawrence Erlbaum.
PINDYCK, R. S. & RUBINFELD, D. L. 2009. Microeconomics, New Jersy, Pearson Prentice Hall.
PIORE, M. J. 1979. Qualitative Research Techniques in Economics. Administrative Science Quarterly, 24, 560-69.
PIORE, M. J. 2006. Qualitative research: does it fit in economics? Eur. Manag. Rev., 3, 17-23.
PPRC 2011. Social Safety Nets in Bangladesh: Review of Issues and Analytical Inventory. Volume 1. Dhaka.
PRYER, J. 2003. Poverty and vulnerability in Dhaka slums : the urban livelihood study Poverty and vulnerability in Dhaka slums, Aldershot, Hampshire, England ; Burlington, VT,
Ashgate. PRYER, J. A. 2004. Poverty and vulnerability in Dhaka slums: the urban livelihoods study.
Development policy review, 22, 122-123. RABIN, M. 1998. Psychology and Economics. Journal of Economic Literature, 36, 11-46. RABINOVICH, A. & WEBLEY, P. 2007. Filling the gap between planning and doing:
Psychological factors involved in the successful implementation of saving intention. Journal of Economic Psychology, 28, 444-461.
224
RAGNO, L. P. 2014. Social Protection, Poverty Exit and Household's Behaviour: A Multidisciplinary Perspective. In: RAHMAN, H. Z., HULME, D., MAITROT, M. & RAGNO, L. P. (eds.) Social Protection in Bangladesh: Building Effective Social Safety Nets and Ladders out of Poverty. Dhaka: UPL.
RAHMAN, A. 2002. Education for development : lessons from East Asia for Bangladesh, Singapore, Institute of Southeast Asian Studies.
RAHMAN, H. Z., HULME, H., MAITROT, M. & RAGNO, L. P. (eds.) 2014. Social Protection in Bangladesh: Building Effective Social Safety Nets and Ladders out of Poverty, Dhaka, Bangladesh: University Press Limited
RAHMAN, M. M., GILMOUR, S., SAITO, E., SULTANA, P. & SHIBUYA, K. 2013. Health-Related Financial Catastrophe, Inequality and Chronic Illness in Bangladesh. PLoS ONE, 8, e56873.
RAIHAN, S., KHONDKER, B. H., SUGIYARTO, G. & JHA, S. 2009. Remittances and household welfare: A case study of Bangladesh.
RANA, M. M. P. 2011. Urbanization and sustainability: Challenges and strategies for sustainable urban development in Bangladesh. Environment, Development and Sustainability, 13, 237-256.
RASHID, S. F. 2006a. Emerging Changes in Reproductive Behaviour among Married Adolescent Girls in an Urban Slum in Dhaka, Bangladesh. Reproductive health matters, 14, 151-159.
RASHID, S. F. 2006b. Small Powers, Little Choice: Contextualising Reproductive and Sexual Rights in Slums in Bangladesh. IDS Bulletin, 37, 69-76.
RASHID, S. F. 2007a. Accessing Married Adolescent Women: The Realities of Ethnographic Research in an Urban Slum Environment in Dhaka, Bangladesh. Field Methods, 19, 369-383.
RASHID, S. F. 2007b. Kal Dristi, Stolen Babies and 'Blocked Uteruses': Poverty and Infertility Anxieties among Married Adolescent Women Living in a Slum in Dhaka, Bangladesh. Anthropology & Medicine, 14, 153-166.
RAYHAN, M. I. 2010. Assessing poverty, risk and vulnerability: A study on flooded households in rural Bangladesh. Journal of Flood Risk Management, 3, 18-24.
RAZA, W. A., DAS, N. C. & MISHA, F. A. 2012. Can ultra-poverty be sustainably improved? Evidence from BRAC in Bangladesh. Journal of Development Effectiveness, 4, 257-276.
REBECCA HOLMES, J. F., TAIFUR RAHMAN AND RACHEL SLATER 2008. Extreme poverty in Bangladesh: Protecting and promoting rural livelihoods. ODI Briefing Paper, 15.
ROCK, M. 2001. Globalisation and Bangladesh: The case of export-oriented garment manufacture. South Asia, 24, 201-225.
ROGERS, B. L., SCHLOSSMAN, N. P. & WORKSHOP ON METHODS OF MEASURING INTRA-HOUSEHOLD RESOURCE, A. 1990. Intrahousehold resource allocation : issues and methods for development policy and planning, Tokyo, United Nations University.
ROSE, N. S., BARRY, A. & OSBORNE, T. 1996. Foucault and political reason : liberalism, neo-liberalism, and rationalities of government, Chicago, University of Chicago Press.
ROSENBERG, K. M. & DALY, H. B. 1993. Foundations of behavioral research : a basic question approach, Fort Worth, Tex. ; London, Harcourt Brace Jovanovich College Publishers.
ROSENTHAL, R. & ROSNOW, R. L. 1991. Essentials of behavioral research : methods and data analysis, New York ; London, McGraw-Hill.
ROSENZWEIG, M. & KOCHAR, A. 2004. New research on education in developing economies, Amsterdam, Elsevier.
225
ROYAL SWEDISH ACADEMY 2002. Foundations of Behavioral and Experimental Economics: Daniel Kahneman and Vernon Smith. Advanced information on the Prize in Economic Sciences.
RUKHEN, A. A., RAGNO, L., TAVARES GOODMAN, N., WALSHAM, M. & WHEATON, A. 2012. Urban Poverty in Bangladesh: Results from a Socioe-economic Survey in Six Poor Urban Settlements in Narayanganj. GiZ, Dhaka, Bangladesh
RUTHERFORD, S. 2000. RUTHERFORD, S. 2009. The pledge : ASA, peasant politics, and microfinance in the development of
Bangladesh, New York ; Oxford, Oxford University Press. SABATES-WHEELER, R. & DEVEREUX, S. 2007a. Social Protection for
Transformation. IDS Bulletin, 38, 23-28. SABATES-WHEELER, R. & DEVEREUX, S. 2007b. A universal social minimum: a
recipe for social justice or 'apple pie in the sky'? IDS bulletin, 38, 61(3). SABATES-WHEELER, R. & DEVEREUX, S. 2010. Cash transfers and high food prices:
Explaining outcomes on Ethiopia's Productive Safety Net Programme. Food Policy, 35, 274-285.
SABATES-WHEELER, R. & WAITE, M. 2003. Migration and Social Protection: A Concept Paper. Development Research Centre on Migration, Globalisation and Poverty -IDS, T2.
SALAM, A., ALIM, A. & NOGUCHI, T. 2006. Spousal Abuse Against Women and Its Consequences on Reproductive Health: A Study in the Urban Slums in Bangladesh. Maternal & Child Health Journal, 10, 83-94.
SALWAY, S. 1998. Livelihoods and health among the urban poor of Dhaka: descriptive findings from the urban livelihoods study, Dhaka, Institute for Development Policy Analysis and Advocacy, Proshioka.
SALWAY, S., RAHMAN, S. & JESMIN, S. 2003. A profile of women's work participation among the urban poor of Dhaka. World development, 31, 881-901.
SAMSON, M. 2009. Social Cash Transfers and Employment A note on empirical linkages in developing countries. In: OECD (ed.) Promoting Pro-Poor Growth: Employment. Paris: Organisation For Economic Co-Operation And Development.
SCOTT, S., HEALTH, SOCIETY & BRITISH SOCIOLOGICAL ASSOCIATION, C. 1992. Private risks and public dangers, Aldershot, England, Brookfield USA : Avebury ; Ashgate Pub. Co.
SEN, A. 1997. Maximization and the act of choice. Econometrica, 65, 745-779. SHEFRIN, H. M. & THALER, R. H. 1988. THE BEHAVIORAL LIFE-CYCLE
HYPOTHESIS. Economic Inquiry, 26, 609-643. SHEN, Y. C. & MCFEETERS, J. 2006. Out-of-pocket health spending between low- and
higher-income populations: Who is at risk of having high expenses and high burdens? Medical Care, 44, 200-209.
SIEGEL, P. B. & ALWANG, J. 1999. An Asset-Based Approach to Social Risk Management: A Conceptual Framework. Social Protection Discussion Paper Series, No 9926.
SLOVIC, P. 1995. The construction of preferences. American Psychologist, 50. SLOVIC, P. 2000. The perception of risk, London, Earthscan Pub. SMITH, J. A. 2008. Qualitative psychology : a practical guide to research methods, Los Angeles ;
London, Sage. SOMMER, B. B. & SOMMER, R. 2002. A practical guide to behavioral research : tools and
techniques, New York ; Oxford, Oxford University Press. STANLEY, L. 2012. The Difference Between an Analytical Framework and a Theoretical
Claim: A Reply to Martin Carstensen. Political Studies, 60, 474-482. STARR, M. A. 2009. Lifestyle conformity and lifecycle saving: A Veblenian perspective.
Cambridge Journal of Economics, 33, 25-49.
226
STARR, M. A. 2012. Qualitative and mixed-methods research in economics: Surprising growth, promising future. Journal of Economic Surveys.
STEINKE, I., KARDOFF, E. V. & FLICK, U. 2004. A companion to qualitative research, London, SAGE.
SUTTON, S. 1998. Predicting and Explaining Intentions and Behavior: How Well Are We Doing? Journal of Applied Social Psychology, 28, 1317-1338.
TAYLOR-GOOBY, P., ECONOMIC, SOCIAL RESEARCH COUNCIL. ECONOMIC, B. & BEHAVIOUR 2000. Risk, trust and welfare, Basingstoke, Macmillan.
TAYLOR-GOOBY, P. & ZINN, J. 2006. Risk in social science, Oxford ; New York, Oxford University Press.
THOMAS, G. 1997. What's the Use of Theory? Harvard Educational Review, 67, 75-105. THOMAS, G. 2002. Theory's Spell: On Qualitative Inquiry and Educational Research.
British Educational Research Journal, 28, 419-434. THOMAS, G. & JAMES, D. 2006. Reinventing Grounded Theory: Some Questions about
Theory, Ground and Discovery. British Educational Research Journal, 32, 767-795. THOMSON, K. 2007a. A universal social minimum - half-baked 'apple pie in the sky'? A
reply to Sabates-Wheeler and Devereux. IDS bulletin, 38, 64(2). THOMSON, K. 2007b. A universal social minimum as a foundation for citizenship. IDS
bulletin, 38, 56(5). TULLOCH, J. & LUPTON, D. 2005. Risk and everyday life, London, Sage. TVERSKY, A. & KAHNEMAN, D. 1981. THE FRAMING OF DECISIONS AND
THE PSYCHOLOGY OF CHOICE. SCIENCE, 211, 453-458. UNITED NATIONS. ECONOMIC AND SOCIAL COMMISSION FOR ASIA AND
THE PACIFIC. 2002. Reducing poverty and promoting social protection, New York, United Nations.
UPPR 2011. Poor Settlements in Narayanganj. http://www.google.com.gh/url?sa=t&rct=j&q=&esrc=s&source=web&cd=5&cad=rja&uact=8&ved=0CDcQFjAE&url=http%3A%2F%2Fwww.upprbd.org%2Fdownload.aspx%3Fname%3D19-ATTPUB-02122013043438.pdf&ei=EKiZU_qQCbCV7Ab35oHYCw&usg=AFQjCNH2JQAp9KKhnSjm7A8jTzZ6AY7x7Q&bvm=bv.68911936,d.ZGU.
UZMA, A. & UNDERWOOD, P. 1999. Postpartum health in a Dhaka slum. Social Science & Medicine, 48, 313.
VAN SJAAK GEEST, D. E. R. 2002. Respect and reciprocity: Care of elderly people in rural Ghana. Journal of Cross-Cultural Gerontology, 17, 3-31.
VILLAGRÁN DE LEÓN, J. C. 2006. Vulnerability: A Conceptual and Methodological Review. United Nations University –Institute of Environment and Human Security-Source Series, 4.
VOIPIO, T. 2007. Social Protection for Poverty Reduction: The OECD/DAC/POVNET View. IDS Bulletin, 38, 45-50.
WÄRNERYD, K.-E. 1996. Risk attitudes and risky behavior. Journal of Economic Psychology, 17, 749-770.
WÄRNERYD, K. E. 1989. On the psychology of saving: An essay on economic behavior. Journal of Economic Psychology, 10, 515-541.
WÄRNERYD, K. E. 1999. The psychology of saving : a study on economic psychology, Northampton, Mass., E. Elgar.
WEBER, R. A. & CAMERER, C. F. 2006. "Behavioral experiments" in economics. Experimental Economics, 9, 187-192.
WESTERGAARD, K. & CENTRET FOR UDVIKLINGSFORSKNING (DENMARK) 1994. People's empowerment in Bangladesh : NGO strategies, Copenhagen, Centre for Development Research.
WILLIG, C. 2008. Introducing qualitative research in psychology : adventures in theory and method, Maidenhead, McGraw Hill Open University Press.
227
WORLD-BANK 1994a. Averting the old age crisis : policies to protect the old and promote growth, Oxford, published for the World Bank Oxford University Press.
WORLD-BANK 1994b. The determinants of reproductive change in Bangladesh: Success in a challenging environment, The World Bank.
WORLD-BANK 2001. Social protection sector strategy : from safety net to springboard, Washington, DC, World Bank.
WORLD-BANK 2006. Social Safety Nets in Bangladesh: An Assessment. Bangladesh Development Series – Paper No. 9, The World Bank Office, Dhaka.
WORLD-BANK 2012. Social Protection & Labor Strategy 2012-2022: Resilience, Equity and Opportunity. http://web.worldbank.org/WBSITE/EXTERNAL/TOPICS/EXTSOCIALPROTECTION/0,,contentMDK:23043115~pagePK:210058~piPK:210062~theSitePK:282637,00.html.
XIAO, J. J. & ANDERSON, J. G. 1997. Hierarchical financial needs reflected by household financial asset shares. Journal of Family and Economic Issues, 18, 333-355.
XIAO, J. J. & NORING, F. E. 1994. Perceived saving motives and hierarchical financial needs. Journal of Financial Counseling and Planning, 5, 25-45.
XU, K., EVANS, D. B., KAWABATA, K., ZERAMDINI, R., KLAVUS, J. & MURRAY, C. J. L. 2003. Household catastrophic health expenditure: A multicountry analysis. Lancet, 362, 111-117.
YATES, J. F. 1994. Risk-taking behaviour, Wiley Series in Human Performance & Cognition. YOONG, J., RABINOVICH, L. & DIEPEVEEN, S. 2012. The impact of economic
resource transfers to women versus men: a systematic review. Technical report. London: E: EPPI-Centre, Social Science Research Unit, Institute of Education, University of London.
ZAMAN, M. A. 2011. Current issues on climate change and poverty in Bangladesh. Regional Development Dialogue, 32, 1-17.

228
Appendices
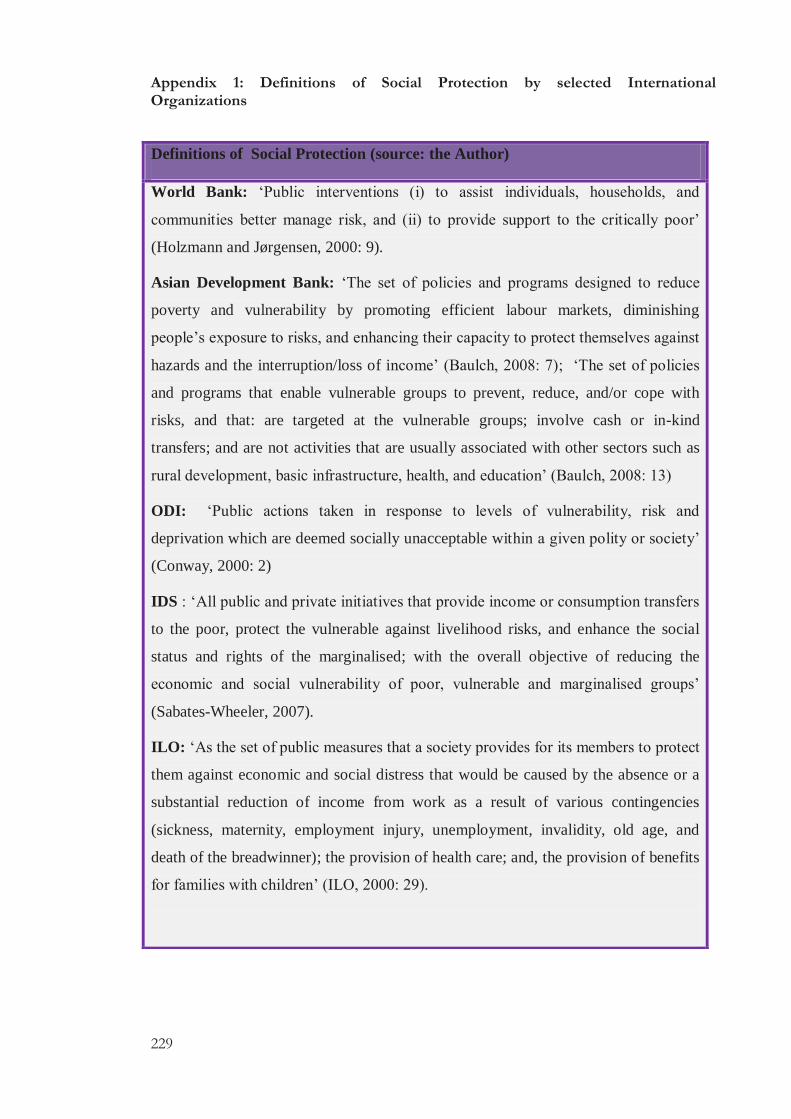
229
Appendix 1: Definitions of Social Protection by selected International Organizations
Definitions of Social Protection (source: the Author)
World Bank: ‘Public interventions (i) to assist individuals, households, and
communities better manage risk, and (ii) to provide support to the critically poor’
(Holzmann and Jørgensen, 2000: 9).
Asian Development Bank: ‘The set of policies and programs designed to reduce
poverty and vulnerability by promoting efficient labour markets, diminishing
people’s exposure to risks, and enhancing their capacity to protect themselves against
hazards and the interruption/loss of income’ (Baulch, 2008: 7); ‘The set of policies
and programs that enable vulnerable groups to prevent, reduce, and/or cope with
risks, and that: are targeted at the vulnerable groups; involve cash or in-kind
transfers; and are not activities that are usually associated with other sectors such as
rural development, basic infrastructure, health, and education’ (Baulch, 2008: 13)
ODI: ‘Public actions taken in response to levels of vulnerability, risk and
deprivation which are deemed socially unacceptable within a given polity or society’
(Conway, 2000: 2)
IDS : ‘All public and private initiatives that provide income or consumption transfers
to the poor, protect the vulnerable against livelihood risks, and enhance the social
status and rights of the marginalised; with the overall objective of reducing the
economic and social vulnerability of poor, vulnerable and marginalised groups’
(Sabates-Wheeler, 2007).
ILO: ‘As the set of public measures that a society provides for its members to protect
them against economic and social distress that would be caused by the absence or a
substantial reduction of income from work as a result of various contingencies
(sickness, maternity, employment injury, unemployment, invalidity, old age, and
death of the breadwinner); the provision of health care; and, the provision of benefits
for families with children’ (ILO, 2000: 29).
230
Appendix 2: Rational Choice Theory, Expected Utility Hypothesis, Risk and Uncertainty
Rational Choice Theory, Expected Utility Hypothesis, Risk and Uncertainty
Rational Choice Theory
The Rational Choice theory is central in economics. It provides a conceptual model
on the economic actor’s (and societies) behaviour. In this theory, individuals make
rational choices among different alternative options, in an attempt to maximize their
expected utility -see below (Pindyck and Rubinfeld, 2009).
Expected Utility Hypothesis
In the Expected Utility Theory, in uncertain circumstances where multiple and
alternative options are available and different choice can be selected, the rational
agent acts to maximize its expected utility. Utility, in this theorem, does not
represented only economic returns from a choice, but includes the overall
satisfaction from that choice, such as economic as well as moral and existential
returns (Pindyck and Rubinfeld, 2009)
Risk, Uncertainty and Theory of Risk Aversion
In economics, Risk is a mathematical quantifiable probability of returns from an
action/choice. It is therefore quantifiable because sufficient information allows the
design of a mathematical formula (Knight, 1971)
Uncertainty is a situation in which the lack of information makes a mathematical
calculation impossible. As Keynes explains: ‘The sense in which I am using the
term is that in which the prospect of a European war is uncertain, or the price of
copper and the rate of interest twenty years hence...About these matters there is no
scientific basis on which to form any calculable probability whatever’ (cited in
Mythen et al., 2006: 195)
The Theory of Risk Aversion suggests that in uncertain situation where multiple
choices with different returns are available, rational actors have different risk
attitudes in their maximization of utility: risk averse ( when the actor avoids any
risky choice), risk neutral and risk seeking (Pindyck and Rubinfeld, 2009).

231
Appendix 3: Alternative Conceptual Frameworks for Social Protection
Alternative Conceptual Frameworks for Social Protection (source: the
Author)
Transformative Social Protection Framework (TSP)
Developed in the Institute of Development Studies (Sussex) by S. Devereux
and R. Sabates-Wheeler, Rachel, the TSP highlights how structural
inequalities are the roots of social and economic vulnerabilities and that
social protection has a role in supporting individuals to claim their rights
(Aoo et al., 2007; Devereux and Sabates-Wheeler, 2004; Sabates-Wheeler and
Devereux, 2007a).
Asset Threshold Framework
This framework suggests that asset poverty and exclusion generate poverty
traps and which can be positively addressed by social protection instruments
only if individuals/households are above a determined asset threshold
(Micawber Threshold) (Carter and Barrett, 2007a; Carter and Barrett, 2007b)
POVNET –OECD/DAC- Framework
In the POVNET’s Framework, an attempt is made to merge the SRM’s
market based and residualist approach and the right based position of people
centred policies (Kabeer, 2007; Voipio, 2007).
Universal Social Minimum Framework
Based on Sen’s ‘development as freedom’ and social justice theories, this
framework strongly proposes minimum standards for decent and dignified
life as precursor to a more equal society (Sabates-Wheeler and Devereux,
2007b; Thomson, 2007b; Thomson, 2007a).
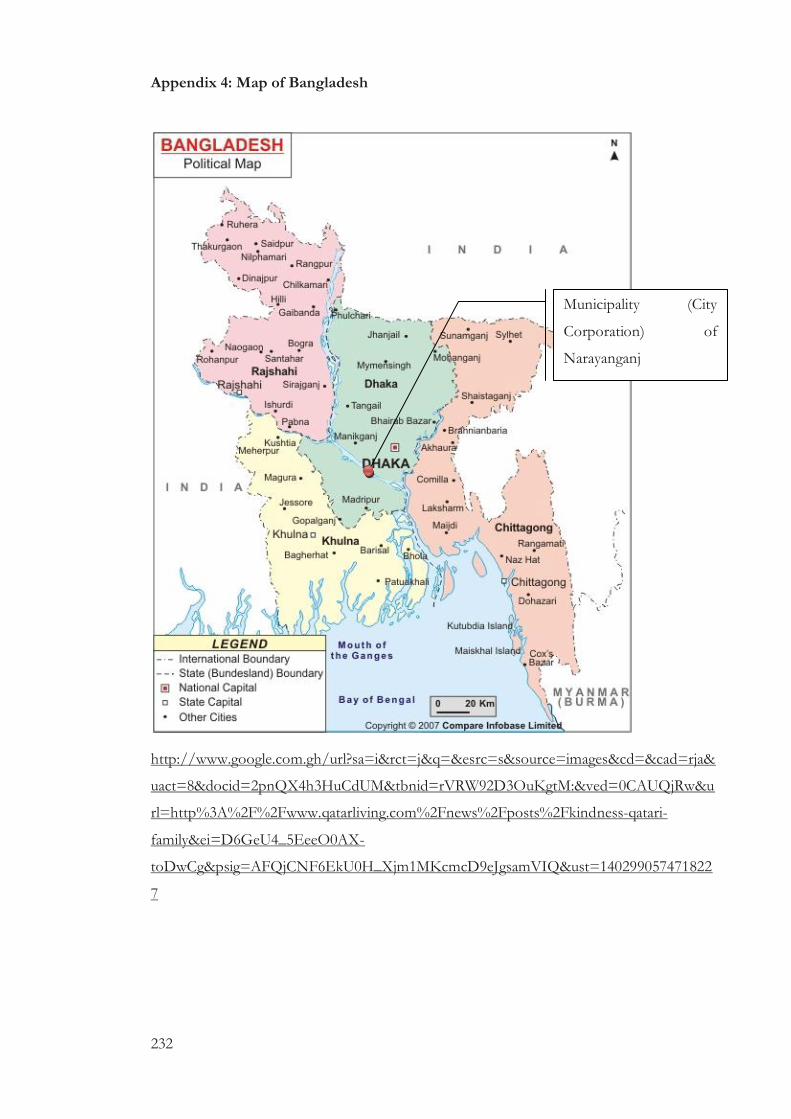
232
Appendix 4: Map of Bangladesh
http://www.google.com.gh/url?sa=i&rct=j&q=&esrc=s&source=images&cd=&cad=rja&
uact=8&docid=2pnQX4h3HuCdUM&tbnid=rVRW92D3OuKgtM:&ved=0CAUQjRw&u
rl=http%3A%2F%2Fwww.qatarliving.com%2Fnews%2Fposts%2Fkindness-qatari-
family&ei=D6GeU4_5EeeO0AX-
toDwCg&psig=AFQjCNF6EkU0H_Xjm1MKcmcD9eJgsamVIQ&ust=140299057471822
7
Municipality (City
Corporation) of
Narayanganj
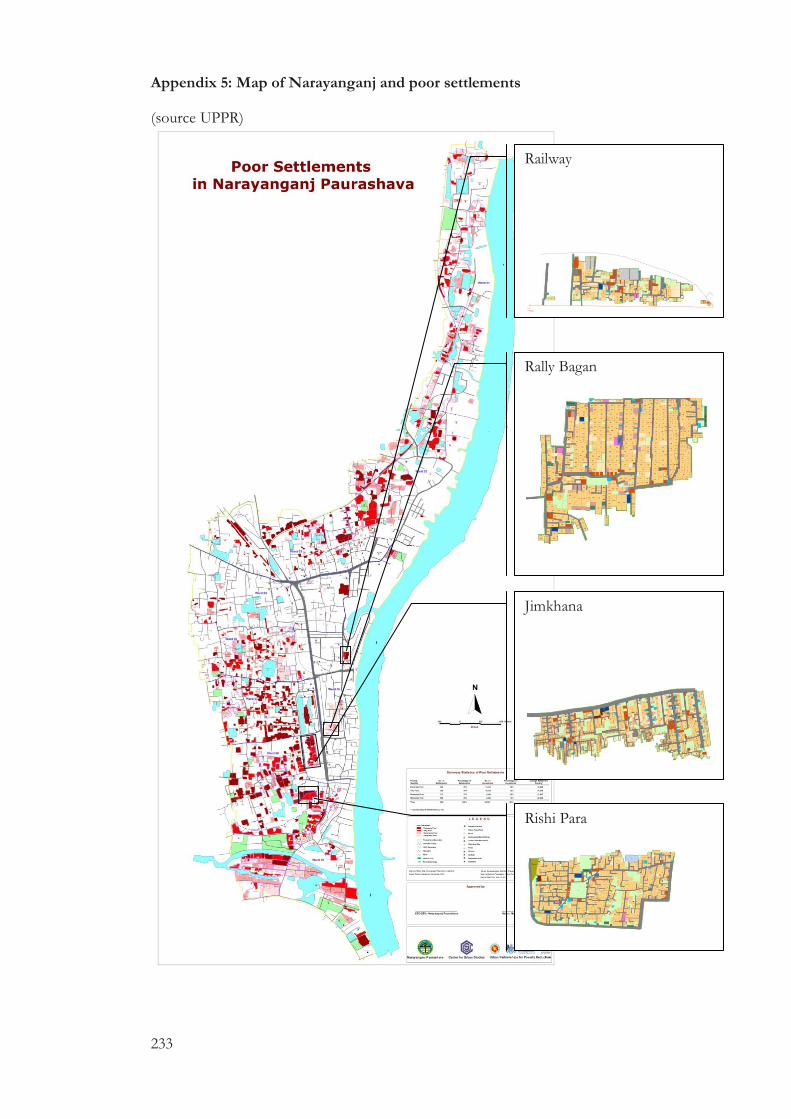
233
Appendix 5: Map of Narayanganj and poor settlements
(source UPPR)
Railway
Jimkhana
Rishi Para
Rally Bagan
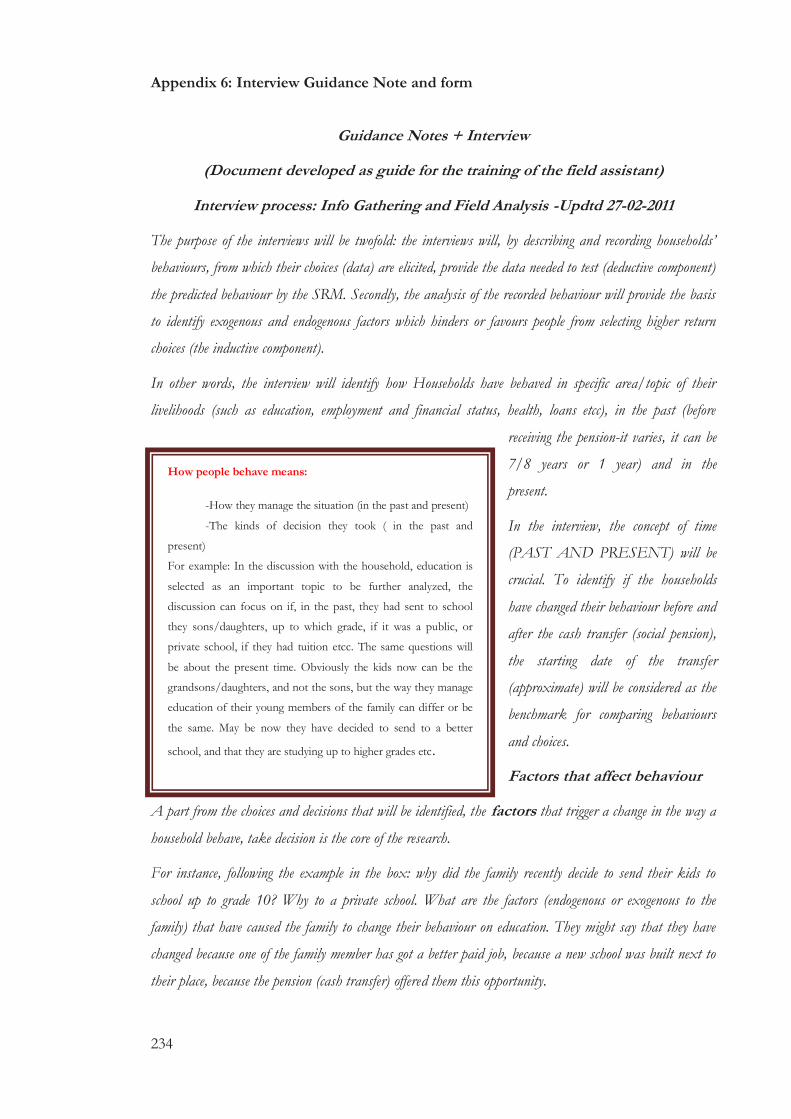
234
Appendix 6: Interview Guidance Note and form
Guidance Notes + Interview
(Document developed as guide for the training of the field assistant)
Interview process: Info Gathering and Field Analysis -Updtd 27-02-2011
The purpose of the interviews will be twofold: the interviews will, by describing and recording households’
behaviours, from which their choices (data) are elicited, provide the data needed to test (deductive component)
the predicted behaviour by the SRM. Secondly, the analysis of the recorded behaviour will provide the basis
to identify exogenous and endogenous factors which hinders or favours people from selecting higher return
choices (the inductive component).
In other words, the interview will identify how Households have behaved in specific area/topic of their
livelihoods (such as education, employment and financial status, health, loans etcc), in the past (before
receiving the pension-it varies, it can be
7/8 years or 1 year) and in the
present.
In the interview, the concept of time
(PAST AND PRESENT) will be
crucial. To identify if the households
have changed their behaviour before and
after the cash transfer (social pension),
the starting date of the transfer
(approximate) will be considered as the
benchmark for comparing behaviours
and choices.
Factors that affect behaviour
A part from the choices and decisions that will be identified, the factors that trigger a change in the way a
household behave, take decision is the core of the research.
For instance, following the example in the box: why did the family recently decide to send their kids to
school up to grade 10? Why to a private school. What are the factors (endogenous or exogenous to the
family) that have caused the family to change their behaviour on education. They might say that they have
changed because one of the family member has got a better paid job, because a new school was built next to
their place, because the pension (cash transfer) offered them this opportunity.
How people behave means:
-How they manage the situation (in the past and present)
-The kinds of decision they took ( in the past and
present)
For example: In the discussion with the household, education is
selected as an important topic to be further analyzed, the
discussion can focus on if, in the past, they had sent to school
they sons/daughters, up to which grade, if it was a public, or
private school, if they had tuition etcc. The same questions will
be about the present time. Obviously the kids now can be the
grandsons/daughters, and not the sons, but the way they manage
education of their young members of the family can differ or be
the same. May be now they have decided to send to a better
school, and that they are studying up to higher grades etc.

235
To construct the households’ behaviour and choices, 3-4 visits will be required. Considering that 50 minutes
will be the limit for each interview, it is expected that 3-4 visits will be organized in each household.
The initial step will be Pre-Interview to gather basic information, introduce the HH to the research
and so on, If possible the socioeconomic profile of the HH should also be completed.
Interview 1 and 2 will be the core of the information: households’ behaviour will be recorded in several
aspects of their lives. Interview 1 and 2 have been split to avoid having a very long discussion with the
family.
After the pre-interview ( with the socioeconomic data) and the information gathered in the interview 1 and
2, a preliminary analysis will be done. This preliminary analysis will identify additional questions,
points for clarification and preliminary conclusions that will be discussed in the interview 3. In the
preliminary analysis the recorded behaviour (from. Interview 1 and Interview 2) will be ‘reduced’ into real
choices, individual decisions made by the households. As mentioned earlier, the recorded behaviour is not per
se a datum. A datum is the interpretation of the information. Choice, real decision taken, will be the data
that will be interpreted and extrapolated by the recorded behaviour (for example the decision to send the
kids to school up to grade 5 only; or the decision to take a loan of 10,000tk for investing in a tea shop).
This Analysis (4. Preliminary Analysis of The info) will provide the material to be further discussed and
validated in interview 3.
The final interview (5. INTERVIEW 3) will not be limited to gather further information but will also
act as a validation of preliminary analysis and .
The info gathered in the field will be analyzed (Final Analysis)
and a set of categories and correlations will be identified. It is
expected that during this preliminary analysis of data, several
questions and the need of further information will come up. The
focus group will offer the space for further collect data and
complement the preliminary analysis with new insights.
This guidance note needs to be filled for each Household that is being interviewed. All the transcripts of the
interview need to be copied in this form. The name of the file will be the CODE number of the family and
include the last finalized step.

236
Pre-Interview:
Date
Time: from __:__ to __:__
Code
Purpose of the Pre-interview (Please Tick if completed)
□Establish initial contact with the selected Households; Location: point on the map (the map can be the
slum-if they live in a slum which has been mapped- or the whole Narayanganj)
□Explain in research project and highlight the fact that we are not linked with the OAA ( see consent
form). The consent form will not be signed or recorded in this instance as families will require about 10 days
to decide.
□Plan for the next Interview
□Gather basic socioeconomic data.
Socioeconomic Profile
Copy this info in the Excel Datasheet !!!!!
Who is taking part to the interview process (No names) Ideally 3-including the older person and keeping
the same for the whole period?
1)
2)
3)
4)
If the head of the household is female, then which of the following is applicable?
[1] = Married and living with family; [2] = Widow; [3] = Divorced; [4] = Abandoned by
husband; [5] = Husband disabled; [6] = Others ____________________ (Specify)
Religion:
[1] = Muslim; [2] = Hindu; [3] = Christian; [4] = Buddhist; [5] = Other ------------- (Specify)
How long have they been living in the area? (Number of years)
Record Oral Consent
(read aloud the Consent
Form)

237
How many people eat from the same cooking pot?
How many member per age group?
Below 14:______
Between 15 and 64:___________
Above 65:__________________
Total HH member:_________
How many are working (generate income)? :________
What is the main source of your household income –who? In words and No
[_]_________________________
and secondary source of your household income -who? In words and No
[_]___________________________
and other source of your household income -who? In words and No
[_]___________________________
[1] = Day Labor; [2] = Rickshaw /Van Puller; [3] = Construction Labor; [4] =
Servant/Maid; [5] = Garments Worker; [6] =Petty Business; [7] = Business owner using hired
labor; [8] = Self employed in business/service provision; [9] = Regular salaried employment in
Government, NGO or other institutions ; [10] = Regular salaried employment in some fixed business
establishment (shop, factory, hotel, etc.) or in transport sector (bus, truck, etc.) ; [11] = Allowances(old ,
divorce, child, education ect.) [12] = Foreign Remittance;
[13]=Domestic Remittance; [14] = Not applicable; [15]
Others ______________________________ (Specify
For how long the main income earner been employed in this primary source - activity/job?
How many years of education has the Head of family?
What is the Monthly Income?
Primary secondary other pension

238
What is your HH MONTHLY expenditure(INCLUDING PENSION)? Calculate with them an
approximate value:
House rent
Food
School
Health
Electricity/water
Toilet
Festival
Loans
(Microcredit)
Invitation
Recreation
Other
Total : __________
Pension expenditure: How do they use the pension?
For the whole HH or only for the old person? [1] = all HH; [2] = only beneficiary; [3] =
mostly beneficiary and sometimes HH
4] = mostly hh and sometimes benefic
Expenditure (tot 300 tkk)
House rent
Food
School
Health
Electricity/water
Toilet
Festival
Loans
(Microcredit)
Invitation
Recreation
Saving
Other
Type of ownership of the house
[1] = Owner; [2] = Rented; [3] = Rent free; [4] = Others _______________ (Specify)
How many rooms does your house hold have?
What is the main construction material of the walls of your main house?
1] = Brick; [2] = C.I. Sheet/wood; [3] = Mud wall; [4] Bamboo; [5] = Straw/jute stick/leaves; [6]
= Thatched/polythene; [7] = Others _______________ (Specify)
Next Interview scheduled on the ____/____/_____ at ___:__
Copy this info in the Word
Form and Excel Datasheet
!!!!!

239
1. Interview 1 and Interview 2: recording behaviour discussion -
Schedule next interview-
Purpose of the Interview 1-2 (Please Tick if completed)
□Identify at least 4 areas of people’s livelihoods that will be discussed in
detail
□Discuss for each area how people have behaved over time and if
changed accurred
□If changes occurred in relation to how people behaved, identify why this
changes have occurred (constraining and facilitating factors).
□ TRANSCRIBE the discussion.
Part 2: Households Behaviour
This section will be built around an open discussion with pilot households (3-4). It is
foreseen that the discussion will last 2 sessions. It is foreseen that that the discussion
will address their behaviour on several issues (such as human capital; investments;
geographical location). However no strict framework will be prepared.
The discussion will attempt to record behaviours ( for each broad category) in time: 3-5
years ago up until today.
Starting Question:
Can you talk about your (household) life?
xxx
From the answer, 4 areas will be identified that will be explored in detail
List TOPICS for example education, health loan......)
A
B
Date
Time: from __:__ to
__:__
Name of Recording File
_________/___________
Code
When Finished, typewrite the
conversation in the Family’s form. !!!

240
C
B
Other
Part 3: detailed discussion of the HH behaviour on topic A/B/C/D
TOPIC
Can we talk about A? Can you tell us more about A let’s say 4-5 years ago? What
did you do?-PAST
Maximum Time 7 minutes
XXXX
What about more recently? Can you talk to us about A in relation to more recent
times? PRESENT+ questions to follow up half answered responses.
Maximum Time 7 minutes
XXX
Do you identify any change in relation to A, 5 years ago and more recent times? If
yes, why do you think this happened? Why do you think your behaviour has
changed? What are the enabling and constrain factors?
Maximum Time 10 minutes
XXX

241
Enabling factors
XXX
Constrain factors
XXX
TOPIC
Can we talk about A? Can you tell us more about A let’s say 4-5 years ago? What
did you do?-PAST
Maximum Time 7 minutes
XX
What about more recently? Can you talk to us about A in relation to more recent
times? PRESENT+ questions to follow up half answered responses.
Maximum Time 7 minutes
XXX
Do you identify any change in relation to A, 5 years ago and more recent times? If
yes, why do you think this happened? Why do you think your behaviour has
changed? What are the enabling and constrain factors?
Maximum Time 10 minutes
XXX
Enabling factors
XXXX
Constrain factors
XXX

242
TOPIC
Can we talk about A? Can you tell us more about A let’s say 4-5 years ago? What
did you do?-PAST
Maximum Time 7 minutes
XXXX
What about more recently? Can you talk to us about A in relation to more recent
times? PRESENT+ questions to follow up half answered responses.
Maximum Time 7 minutes
XXX
Do you identify any change in relation to A, 5 years ago and more recent times? If
yes, why do you think this happened? Why do you think your behaviour has
changed? What are the enabling and constrain factors?
Maximum Time 10 minutes
XXX
Enabling factors
XXX
Constrain factors
XXX
TOPIC
Can we talk about A? Can you tell us more about A let’s say 4-5 years ago? What
did you do?-PAST

243
Maximum Time 7 minutes
XXXX
What about more recently? Can you talk to us about A in relation to more recent
times? PRESENT+ questions to follow up half answered responses.
Maximum Time 7 minutes
XXX
Do you identify any change in relation to A, 5 years ago and more recent times? If
yes, why do you think this happened? Why do you think your behaviour has
changed? What are the enabling and constrain factors?
Maximum Time 10 minutes
XXX
Enabling factors
XXXX
Constrain factors
XXX
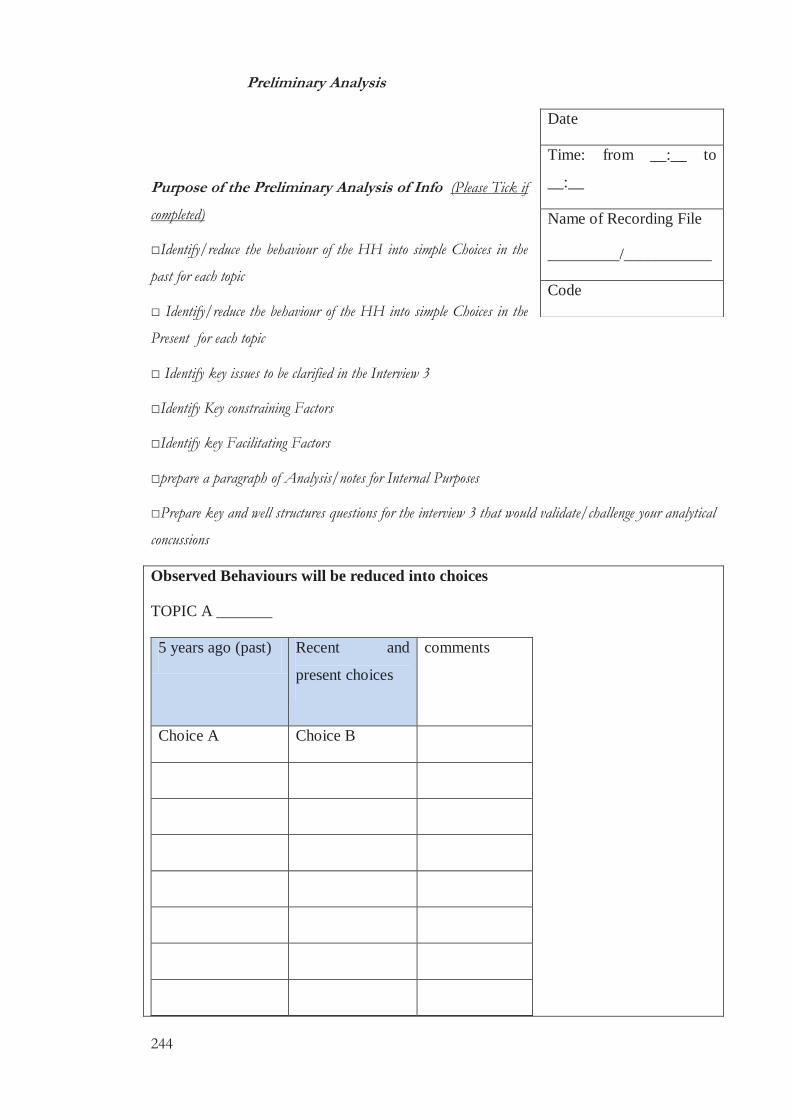
244
Preliminary Analysis
Purpose of the Preliminary Analysis of Info (Please Tick if
completed)
□Identify/reduce the behaviour of the HH into simple Choices in the
past for each topic
□ Identify/reduce the behaviour of the HH into simple Choices in the
Present for each topic
□ Identify key issues to be clarified in the Interview 3
□Identify Key constraining Factors
□Identify key Facilitating Factors
□prepare a paragraph of Analysis/notes for Internal Purposes
□Prepare key and well structures questions for the interview 3 that would validate/challenge your analytical
concussions
Observed Behaviours will be reduced into choices
TOPIC A _______
5 years ago (past) Recent and
present choices
comments
Choice A Choice B
Date
Time: from __:__ to
__:__
Name of Recording File
_________/___________
Code

245
Additional analytical conclusions from the Interview 1 and 2 and comparison between
Choices
-Key Facilitating factors
-Key Constrain Factors
-Other elements from the analysis
-Questions for the Interview 3: the questions here should be related to why Choice A
over B??? This in an attempt to identify factors that have influenced the decision
making process (can that be directly linked to the pension/ consumption smoothing???)
Split By TOPIC
Interview 3
Purpose of the Interview 3 (Please Tick if completed)
□ Ask the Questions identified in the Preliminary Analysis of Info
□Did the HH explained why they choose A over B? Are you satisfied
with their answers?
□Sum Up their a
□prepare a paragraph of Analysis/notes for Internal Purposes
□Prepare key and well structures questions for the interview 3 that would validate/challenge your analytical
concussions
Part 4: identify key issues, key questions and a preliminary analysis of information
A reference to the social pension scheme should be included here This step will support
Date
Time: from __:__ to
__:__
Name of Recording File
_________/___________
Other info
When Finished, typewrite the
conversation in the Family’s form. !!!
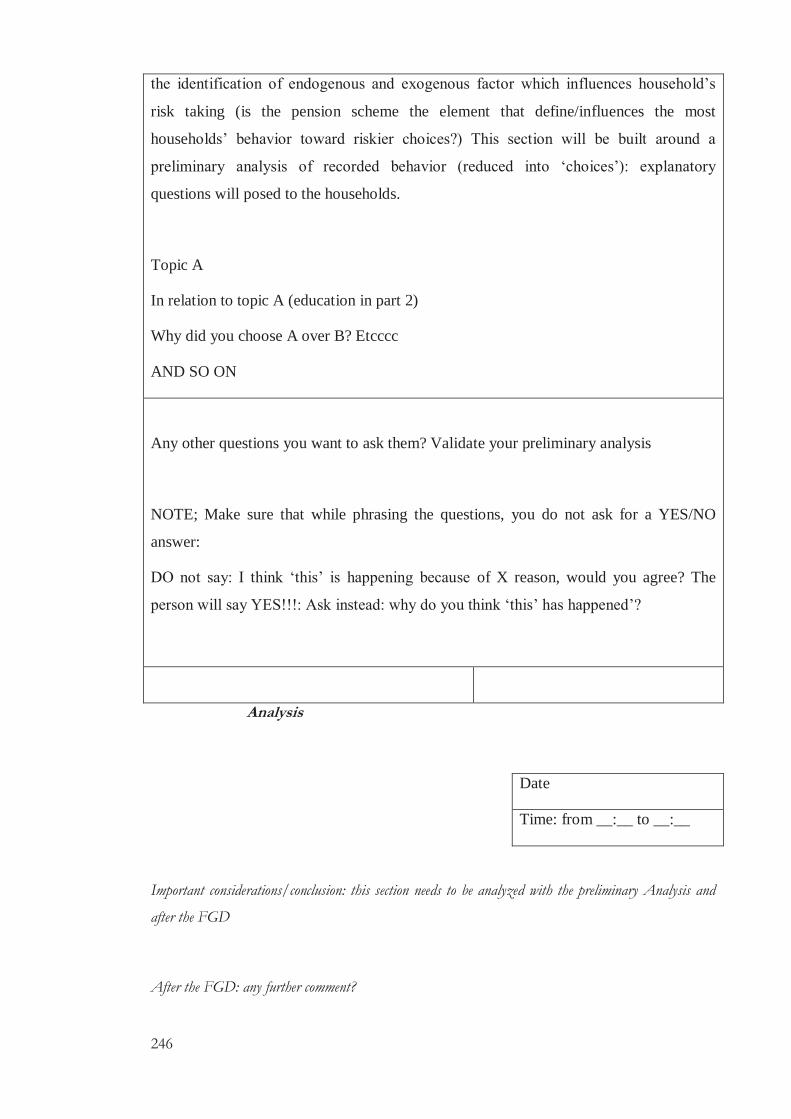
246
the identification of endogenous and exogenous factor which influences household’s
risk taking (is the pension scheme the element that define/influences the most
households’ behavior toward riskier choices?) This section will be built around a
preliminary analysis of recorded behavior (reduced into ‘choices’): explanatory
questions will posed to the households.
Topic A
In relation to topic A (education in part 2)
Why did you choose A over B? Etcccc
AND SO ON
Any other questions you want to ask them? Validate your preliminary analysis
NOTE; Make sure that while phrasing the questions, you do not ask for a YES/NO
answer:
DO not say: I think ‘this’ is happening because of X reason, would you agree? The
person will say YES!!!: Ask instead: why do you think ‘this’ has happened’?
Analysis
Date
Time: from __:__ to __:__
Important considerations/conclusion: this section needs to be analyzed with the preliminary Analysis and
after the FGD
After the FGD: any further comment?

247
Appendix 7: Approval Letter from the Government of Bangladesh (Bangla and
English)
BANGLA

248
Democratic People’s Republic of Bangladesh
Social Welfare Ministry
Activity 1 Branch
Bangladesh Secretariat
Old Age Pension Branch.2/2008-702 Date: 04-10-2010
Subject: Permission for research on old age pension scheme in Narayanganj district.
Source: Pension Cell
Date 19-9-2010
The research must be based on authentic information from official sources and should not
be used against any government policies. The research would be confined within how
pension scheme influence the life of pensioners, and the detailed findings have to be shared
with the concerned ministry. Considering the above, permission is granted to do this
research.
Illegible Sign
3/10/2010
(Nurul Kabir Siddiki)
Deputy Secretary (Program)
Phone: 7164851
Director General
Social Service Department
Dhaka.
Sign, Pension Cell 3rd part/ 44/2010
Date: 13/10/2010
ENGLISH

249
1. Deputy Director, Social Service Office, Narayanganj, requested to do necessary
step according to the letter.
2. L. Peter Rango, Doctor of Philosophy Candidate, Brooks World Poverty Institute,
University of Manchester, Oxford Road.
CC to:
1. Director General, Social Service Department.
(Md. Shahadat Hossain)
Director (Program)
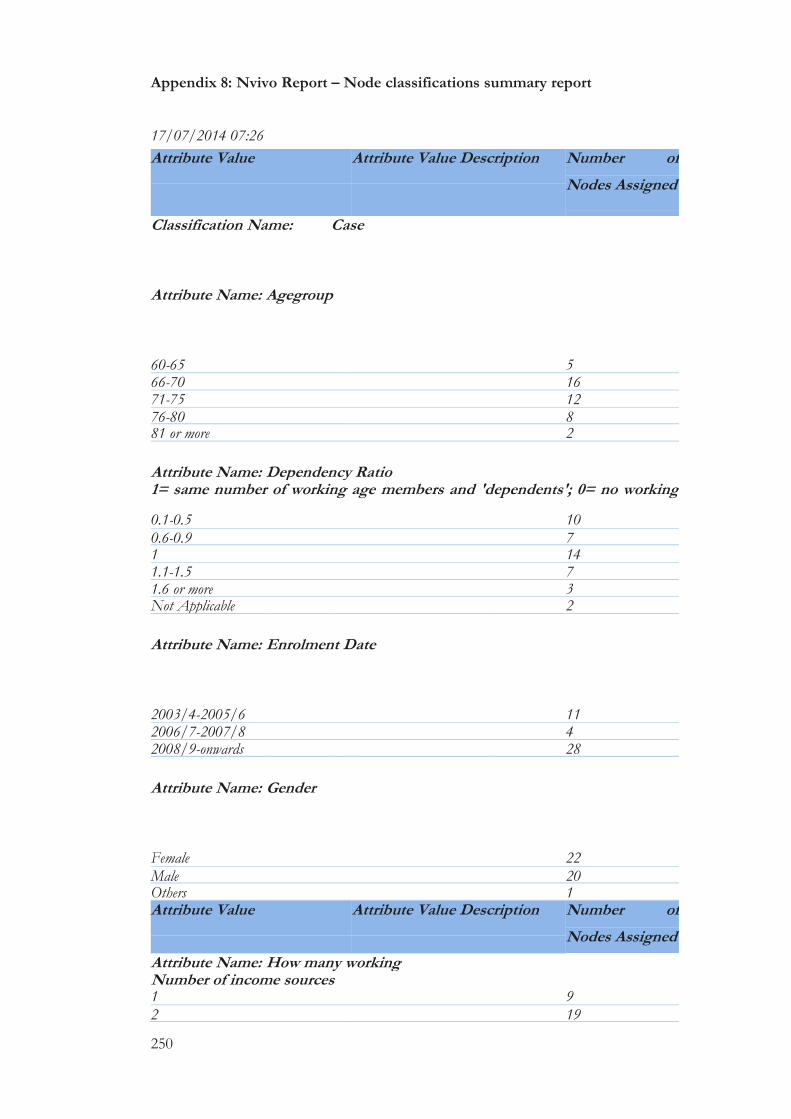
250
Appendix 8: Nvivo Report – Node classifications summary report
17/07/2014 07:26
Attribute Value Attribute Value Description Number of
Nodes Assigned
Classification Name: Case
Attribute Name: Agegroup
60-65 5 66-70 16 71-75 12 76-80 8 81 or more 2
Attribute Name: Dependency Ratio 1= same number of working age members and 'dependents'; 0= no working
age member 0.1-0.5 10 0.6-0.9 7 1 14 1.1-1.5 7 1.6 or more 3 Not Applicable 2
Attribute Name: Enrolment Date
2003/4-2005/6 11 2006/7-2007/8 4 2008/9-onwards 28
Attribute Name: Gender
Female 22 Male 20 Others 1 Attribute Value Attribute Value Description Number of
Nodes Assigned
Attribute Name: How many working Number of income sources 1 9 2 19

251
3 11 4 or more 4 Attribute Name: Monthly total Expenditure sum of income sources plus pension 10000-14499 16 15000 or more 4 1500-2499 1 2500-3499 1 3500-5499 4 5500-7499 6 600-999 2 7500-9999 9
Attribute Name: Monthly total Income sum of income sources plus pension 10000-14499 12 15000 or more 4 1500-2499 1 2500-3499 3 3500-5499 5 5500-7499 8 600-999 1 7500-9999 9
Attribute Name: N of children (less then 14)
0 8 1-2 27 3-5 8
Attribute Name: N of members above 65
0 1 1 33 Attribute Value Attribute Value Description Number of
Nodes Assigned
2 9
Attribute Name: N of working age members
0 2 1 4 2 8 3-4 23 5 or more 6
Attribute Name: Per Capita Expenditure
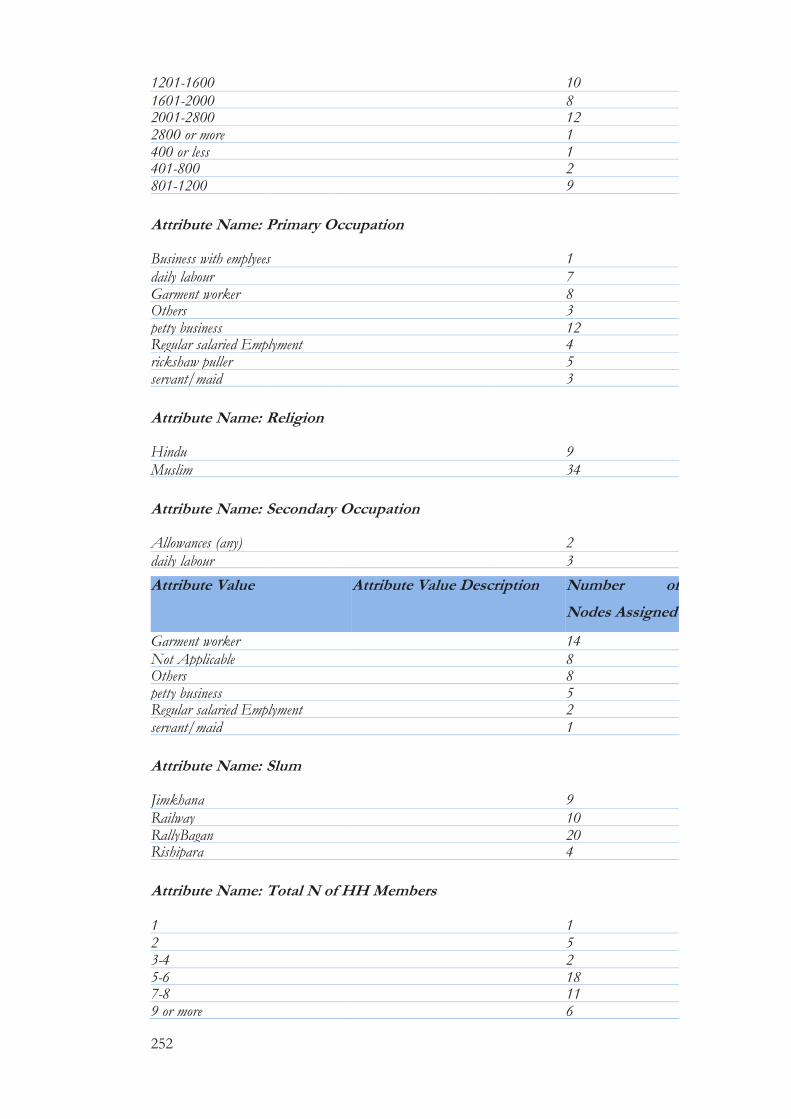
252
1201-1600 10 1601-2000 8 2001-2800 12 2800 or more 1 400 or less 1 401-800 2 801-1200
9
Attribute Name: Primary Occupation
Business with emplyees 1 daily labour 7 Garment worker 8 Others 3 petty business 12 Regular salaried Emplyment 4 rickshaw puller 5 servant/maid 3
Attribute Name: Religion
Hindu 9 Muslim 34
Attribute Name: Secondary Occupation
Allowances (any) 2 daily labour 3 Attribute Value Attribute Value Description Number of
Nodes Assigned
Garment worker 14 Not Applicable 8 Others 8 petty business 5 Regular salaried Emplyment 2 servant/maid 1
Attribute Name: Slum
Jimkhana 9 Railway 10 RallyBagan 20 Rishipara 4
Attribute Name: Total N of HH Members
1 1 2 5 3-4 2 5-6 18 7-8 11 9 or more 6
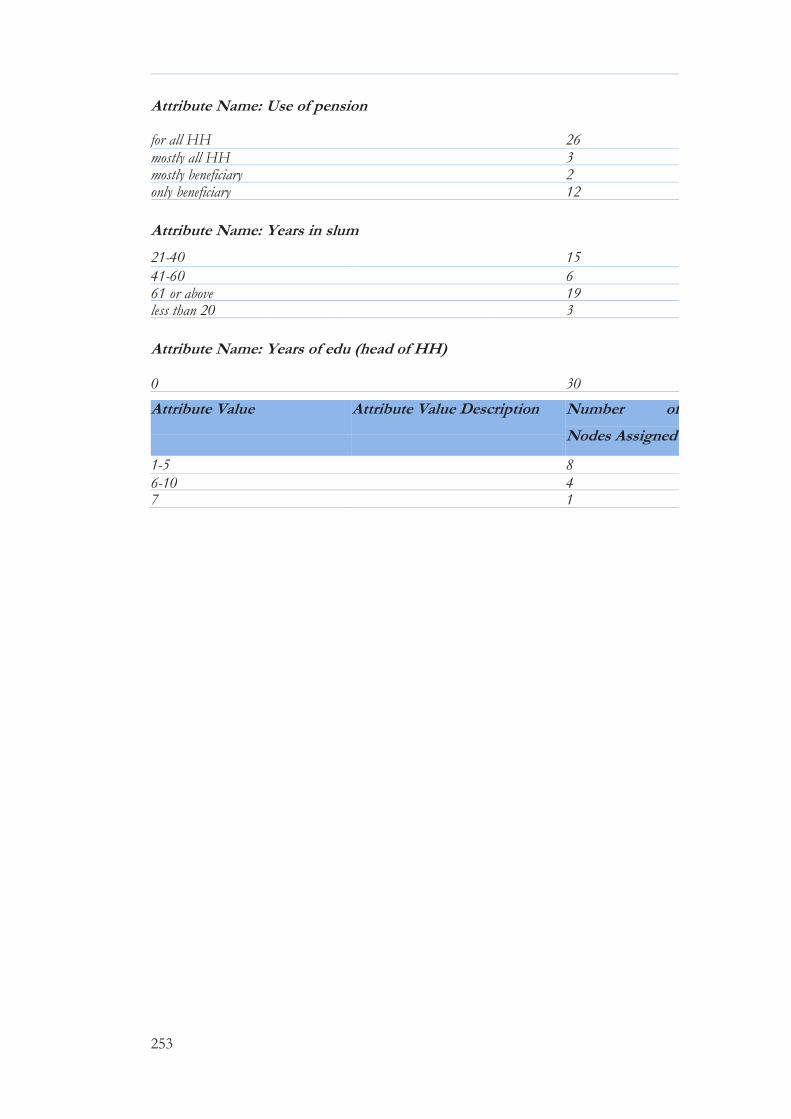
253
Attribute Name: Use of pension
for all HH 26 mostly all HH 3 mostly beneficiary 2 only beneficiary 12
Attribute Name: Years in slum
21-40 15
41-60 6 61 or above 19 less than 20 3
Attribute Name: Years of edu (head of HH)
0 30 Attribute Value Attribute Value Description Number of
Nodes Assigned
1-5 8 6-10 4 7 1

254
Appendix 9: Profile of four poor urban settlements in Narayanganj
Profile: Rishipara
The term Rishipara originated from ‘Rishi’ and ‘Para’. Residents mentioned that Rishi is a
‘drifter’ Hindu saints while Para means small area or township. Rishipara, in fact, was a
place travellers and homeless people (rishis) used to gather. Rishis used to meet in the area
in the early twenty century, but the actual creation of this area was soon after the
independence of Bangladesh. This vast area was owned by a Hindu who fled during the
country’s Liberation War in 1971. Initially, the Rishipara was populated by the sweepers or
by the ‘low class’ Hindus who used to do ‘odd jobs’ in society.
In the expansion process of Rishipara, a local personality and an organization (Prodipan)
were primarily involved. The slum-dwellers remember them with due respect. The
individual who is known to have helped Rishipara was the owner of a company namely
Hira Pen Industries. After the independence, the businessman started to work to improve
the living conditions of the settlement. Even though Rishipara was close to the
municipality’s building of Narayanganj, the entire area was lacking basic services such as
safe water, sanitation and electricity, making this area not suitable for living. ‘Look at the
four-storied building; this was built exactly on a pond’ said Minara, an inhabitant who has lived
there for 20 years. ‘There was no sanitation facility or drinking water. People used to fetch water from
far away areas, such as the river and commissioner’s house.’, added the CDC cluster.
Prodipan, a well-known national NGO, was the pioneer in influencing the socio-economic
development of this area. During mid-1990s, the organisation began their operations in
Rishipara. Over time, they identified the urgent need of drinking water and led initiatives to
improve the water supply. Dwellers recall when Ali Ahmad Chuna, father of current
mayor Ivy , helped the settlement with a water pipeline connection. Prodipan then set up
four water lines free of charges and one meter that run water supply with charges. Prodipan
also constructed inner passages with bricks and repaired the existing access routes;
electricity was also brought to the areas. It was widely accepted that Prodipan helped to
transform the abandoned area and make it suitable for settling and living in. The best
contribution that Prodipan made was to encourage and motivate the households to pursue
unity :‘I recall, when they [Prodipan] first came here, we had no one that could discuss with the Prodipan
officers; now there are many educated children which are able to speak up’ said Ayesha Begum, a
permanent resident of the area. Prodipan motivated the community by saying that ‘If you
remain united, you’ll win. You have the right and authority to protest about your conditions. Raise your
voices together, and others will listen to you’.
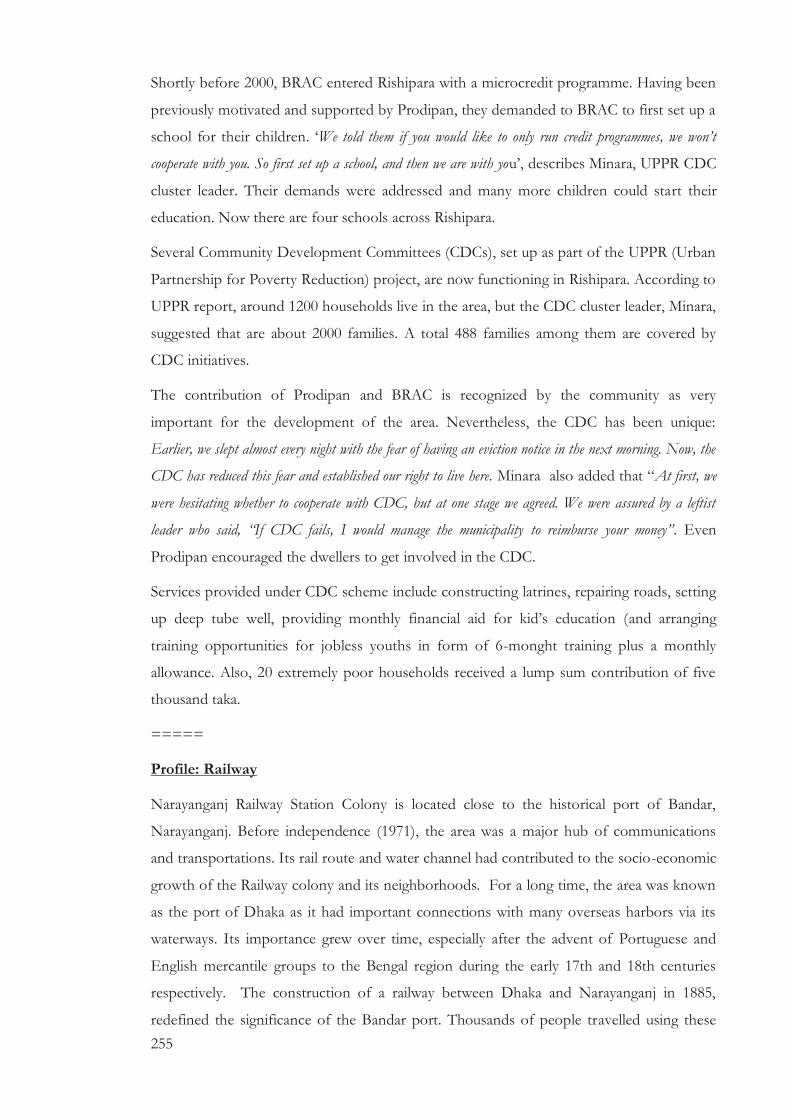
255
Shortly before 2000, BRAC entered Rishipara with a microcredit programme. Having been
previously motivated and supported by Prodipan, they demanded to BRAC to first set up a
school for their children. ‘We told them if you would like to only run credit programmes, we won’t
cooperate with you. So first set up a school, and then we are with you’, describes Minara, UPPR CDC
cluster leader. Their demands were addressed and many more children could start their
education. Now there are four schools across Rishipara.
Several Community Development Committees (CDCs), set up as part of the UPPR (Urban
Partnership for Poverty Reduction) project, are now functioning in Rishipara. According to
UPPR report, around 1200 households live in the area, but the CDC cluster leader, Minara,
suggested that are about 2000 families. A total 488 families among them are covered by
CDC initiatives.
The contribution of Prodipan and BRAC is recognized by the community as very
important for the development of the area. Nevertheless, the CDC has been unique:
Earlier, we slept almost every night with the fear of having an eviction notice in the next morning. Now, the
CDC has reduced this fear and established our right to live here. Minara also added that “At first, we
were hesitating whether to cooperate with CDC, but at one stage we agreed. We were assured by a leftist
leader who said, “If CDC fails, I would manage the municipality to reimburse your money”. Even
Prodipan encouraged the dwellers to get involved in the CDC.
Services provided under CDC scheme include constructing latrines, repairing roads, setting
up deep tube well, providing monthly financial aid for kid’s education (and arranging
training opportunities for jobless youths in form of 6-monght training plus a monthly
allowance. Also, 20 extremely poor households received a lump sum contribution of five
thousand taka.
=====
Profile: Railway
Narayanganj Railway Station Colony is located close to the historical port of Bandar,
Narayanganj. Before independence (1971), the area was a major hub of communications
and transportations. Its rail route and water channel had contributed to the socio-economic
growth of the Railway colony and its neighborhoods. For a long time, the area was known
as the port of Dhaka as it had important connections with many overseas harbors via its
waterways. Its importance grew over time, especially after the advent of Portuguese and
English mercantile groups to the Bengal region during the early 17th and 18th centuries
respectively. The construction of a railway between Dhaka and Narayanganj in 1885,
redefined the significance of the Bandar port. Thousands of people travelled using these
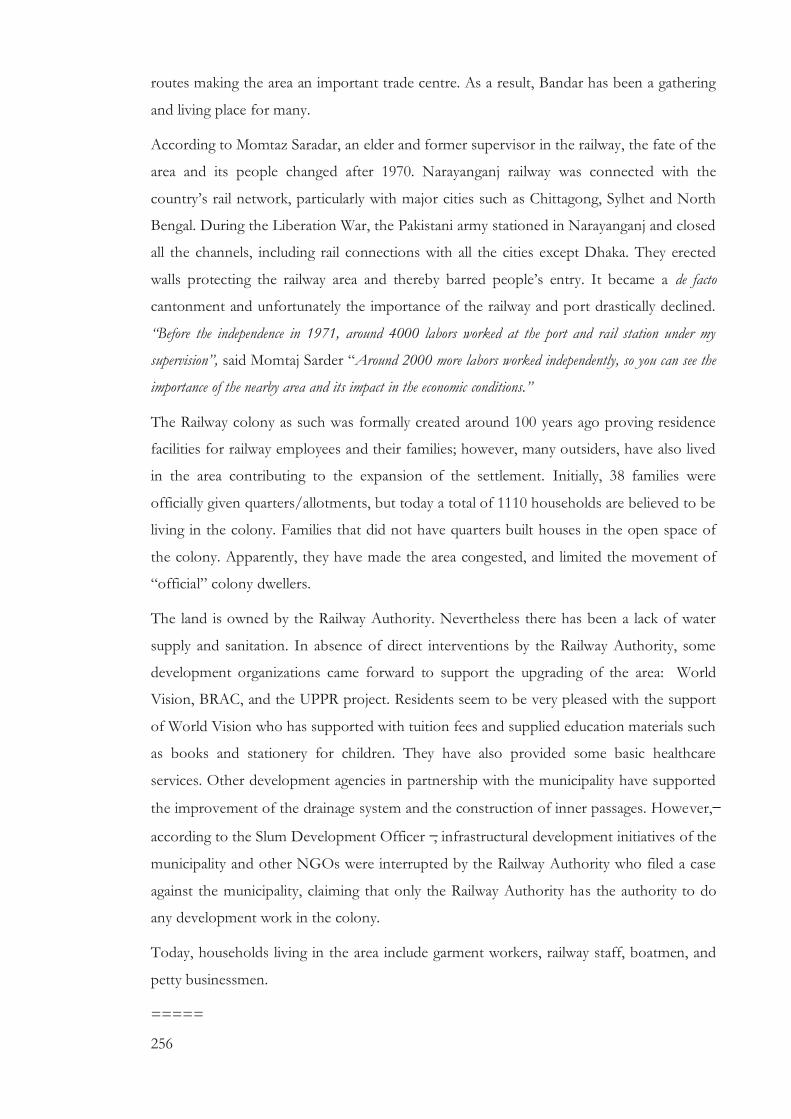
256
routes making the area an important trade centre. As a result, Bandar has been a gathering
and living place for many.
According to Momtaz Saradar, an elder and former supervisor in the railway, the fate of the
area and its people changed after 1970. Narayanganj railway was connected with the
country’s rail network, particularly with major cities such as Chittagong, Sylhet and North
Bengal. During the Liberation War, the Pakistani army stationed in Narayanganj and closed
all the channels, including rail connections with all the cities except Dhaka. They erected
walls protecting the railway area and thereby barred people’s entry. It became a de facto
cantonment and unfortunately the importance of the railway and port drastically declined.
“Before the independence in 1971, around 4000 labors worked at the port and rail station under my
supervision”, said Momtaj Sarder “Around 2000 more labors worked independently, so you can see the
importance of the nearby area and its impact in the economic conditions.”
The Railway colony as such was formally created around 100 years ago proving residence
facilities for railway employees and their families; however, many outsiders, have also lived
in the area contributing to the expansion of the settlement. Initially, 38 families were
officially given quarters/allotments, but today a total of 1110 households are believed to be
living in the colony. Families that did not have quarters built houses in the open space of
the colony. Apparently, they have made the area congested, and limited the movement of
“official” colony dwellers.
The land is owned by the Railway Authority. Nevertheless there has been a lack of water
supply and sanitation. In absence of direct interventions by the Railway Authority, some
development organizations came forward to support the upgrading of the area: World
Vision, BRAC, and the UPPR project. Residents seem to be very pleased with the support
of World Vision who has supported with tuition fees and supplied education materials such
as books and stationery for children. They have also provided some basic healthcare
services. Other development agencies in partnership with the municipality have supported
the improvement of the drainage system and the construction of inner passages. However,
according to the Slum Development Officer , infrastructural development initiatives of the
municipality and other NGOs were interrupted by the Railway Authority who filed a case
against the municipality, claiming that only the Railway Authority has the authority to do
any development work in the colony.
Today, households living in the area include garment workers, railway staff, boatmen, and
petty businessmen.
=====
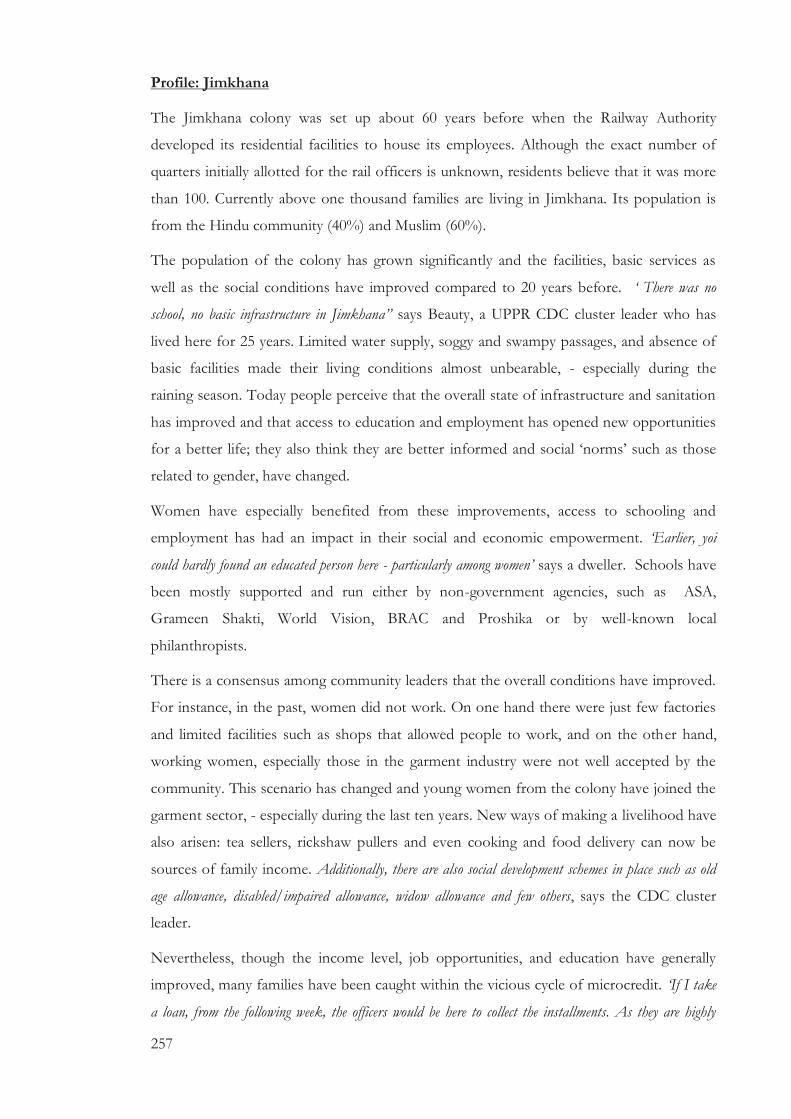
257
Profile: Jimkhana
The Jimkhana colony was set up about 60 years before when the Railway Authority
developed its residential facilities to house its employees. Although the exact number of
quarters initially allotted for the rail officers is unknown, residents believe that it was more
than 100. Currently above one thousand families are living in Jimkhana. Its population is
from the Hindu community (40%) and Muslim (60%).
The population of the colony has grown significantly and the facilities, basic services as
well as the social conditions have improved compared to 20 years before. ‘ There was no
school, no basic infrastructure in Jimkhana” says Beauty, a UPPR CDC cluster leader who has
lived here for 25 years. Limited water supply, soggy and swampy passages, and absence of
basic facilities made their living conditions almost unbearable, - especially during the
raining season. Today people perceive that the overall state of infrastructure and sanitation
has improved and that access to education and employment has opened new opportunities
for a better life; they also think they are better informed and social ‘norms’ such as those
related to gender, have changed.
Women have especially benefited from these improvements, access to schooling and
employment has had an impact in their social and economic empowerment. ‘Earlier, yoi
could hardly found an educated person here - particularly among women’ says a dweller. Schools have
been mostly supported and run either by non-government agencies, such as ASA,
Grameen Shakti, World Vision, BRAC and Proshika or by well-known local
philanthropists.
There is a consensus among community leaders that the overall conditions have improved.
For instance, in the past, women did not work. On one hand there were just few factories
and limited facilities such as shops that allowed people to work, and on the other hand,
working women, especially those in the garment industry were not well accepted by the
community. This scenario has changed and young women from the colony have joined the
garment sector, - especially during the last ten years. New ways of making a livelihood have
also arisen: tea sellers, rickshaw pullers and even cooking and food delivery can now be
sources of family income. Additionally, there are also social development schemes in place such as old
age allowance, disabled/impaired allowance, widow allowance and few others, says the CDC cluster
leader.
Nevertheless, though the income level, job opportunities, and education have generally
improved, many families have been caught within the vicious cycle of microcredit. ‘If I take
a loan, from the following week, the officers would be here to collect the installments. As they are highly
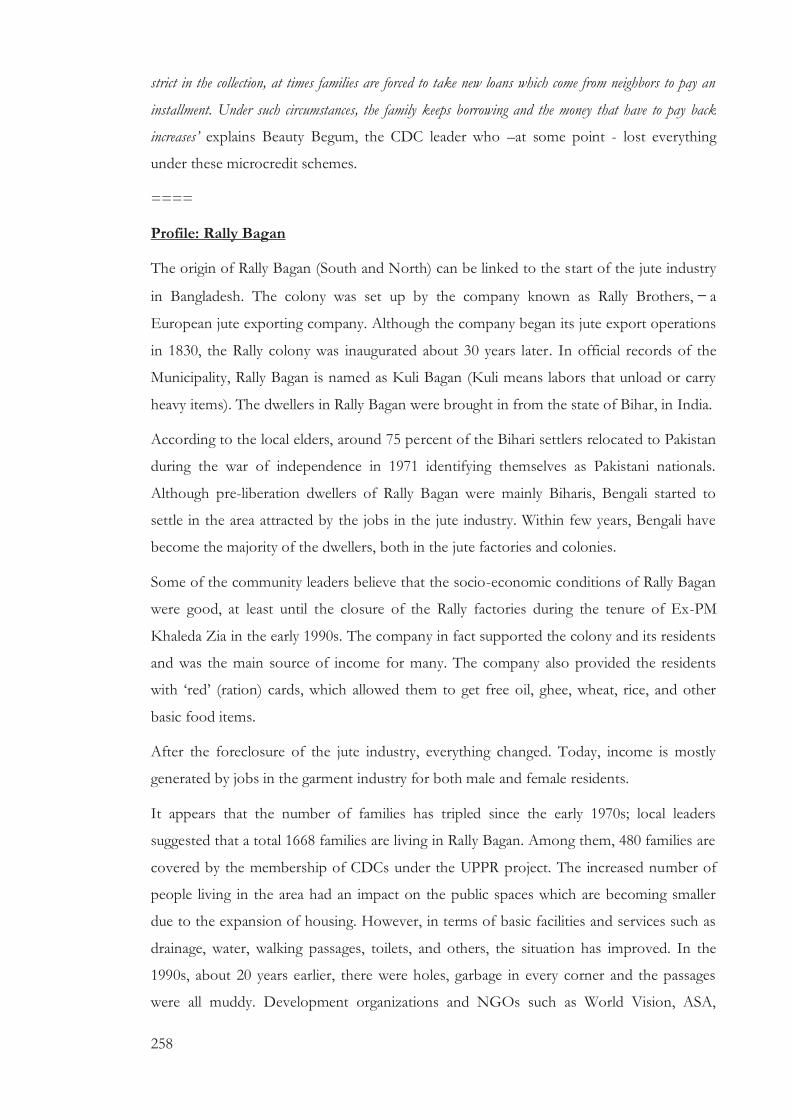
258
strict in the collection, at times families are forced to take new loans which come from neighbors to pay an
installment. Under such circumstances, the family keeps borrowing and the money that have to pay back
increases’ explains Beauty Begum, the CDC leader who –at some point - lost everything
under these microcredit schemes.
====
Profile: Rally Bagan
The origin of Rally Bagan (South and North) can be linked to the start of the jute industry
in Bangladesh. The colony was set up by the company known as Rally Brothers, a
European jute exporting company. Although the company began its jute export operations
in 1830, the Rally colony was inaugurated about 30 years later. In official records of the
Municipality, Rally Bagan is named as Kuli Bagan (Kuli means labors that unload or carry
heavy items). The dwellers in Rally Bagan were brought in from the state of Bihar, in India.
According to the local elders, around 75 percent of the Bihari settlers relocated to Pakistan
during the war of independence in 1971 identifying themselves as Pakistani nationals.
Although pre-liberation dwellers of Rally Bagan were mainly Biharis, Bengali started to
settle in the area attracted by the jobs in the jute industry. Within few years, Bengali have
become the majority of the dwellers, both in the jute factories and colonies.
Some of the community leaders believe that the socio-economic conditions of Rally Bagan
were good, at least until the closure of the Rally factories during the tenure of Ex-PM
Khaleda Zia in the early 1990s. The company in fact supported the colony and its residents
and was the main source of income for many. The company also provided the residents
with ‘red’ (ration) cards, which allowed them to get free oil, ghee, wheat, rice, and other
basic food items.
After the foreclosure of the jute industry, everything changed. Today, income is mostly
generated by jobs in the garment industry for both male and female residents.
It appears that the number of families has tripled since the early 1970s; local leaders
suggested that a total 1668 families are living in Rally Bagan. Among them, 480 families are
covered by the membership of CDCs under the UPPR project. The increased number of
people living in the area had an impact on the public spaces which are becoming smaller
due to the expansion of housing. However, in terms of basic facilities and services such as
drainage, water, walking passages, toilets, and others, the situation has improved. In the
1990s, about 20 years earlier, there were holes, garbage in every corner and the passages
were all muddy. Development organizations and NGOs such as World Vision, ASA,
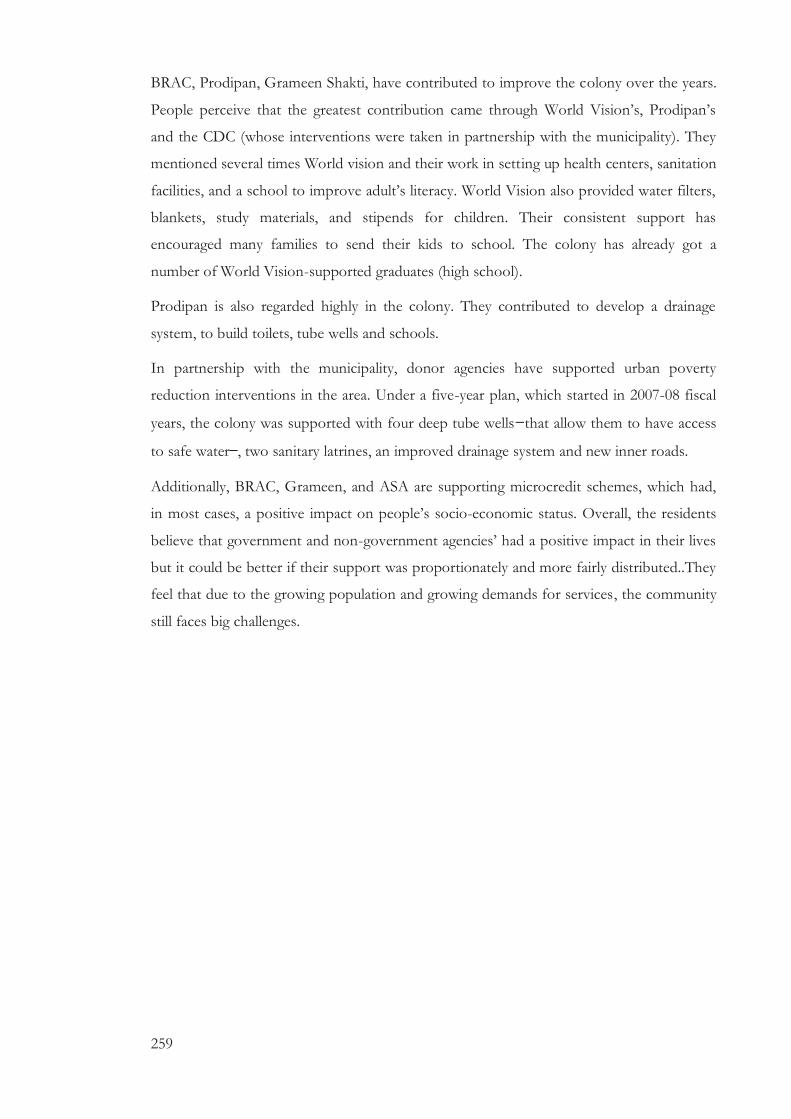
259
BRAC, Prodipan, Grameen Shakti, have contributed to improve the colony over the years.
People perceive that the greatest contribution came through World Vision’s, Prodipan’s
and the CDC (whose interventions were taken in partnership with the municipality). They
mentioned several times World vision and their work in setting up health centers, sanitation
facilities, and a school to improve adult’s literacy. World Vision also provided water filters,
blankets, study materials, and stipends for children. Their consistent support has
encouraged many families to send their kids to school. The colony has already got a
number of World Vision-supported graduates (high school).
Prodipan is also regarded highly in the colony. They contributed to develop a drainage
system, to build toilets, tube wells and schools.
In partnership with the municipality, donor agencies have supported urban poverty
reduction interventions in the area. Under a five-year plan, which started in 2007-08 fiscal
years, the colony was supported with four deep tube wells that allow them to have access
to safe water , two sanitary latrines, an improved drainage system and new inner roads.
Additionally, BRAC, Grameen, and ASA are supporting microcredit schemes, which had,
in most cases, a positive impact on people’s socio-economic status. Overall, the residents
believe that government and non-government agencies’ had a positive impact in their lives
but it could be better if their support was proportionately and more fairly distributed..They
feel that due to the growing population and growing demands for services, the community
still faces big challenges.