linking land use and transportation schoharie county ... · linking land use and transportation...
TRANSCRIPT

NYSDOT Statewide Planning Bureau
Linking Land Use and Transportation
Schoharie County Planning
11 March, 2013

NYSDOT Statewide Planning Bureau
Steve Munson
NYSDOT, Statewide Planning
Albany
(518) 457-8306
Mark Grainer
NYSDOT, Statewide Planning
Syracuse
(315) 428-4612
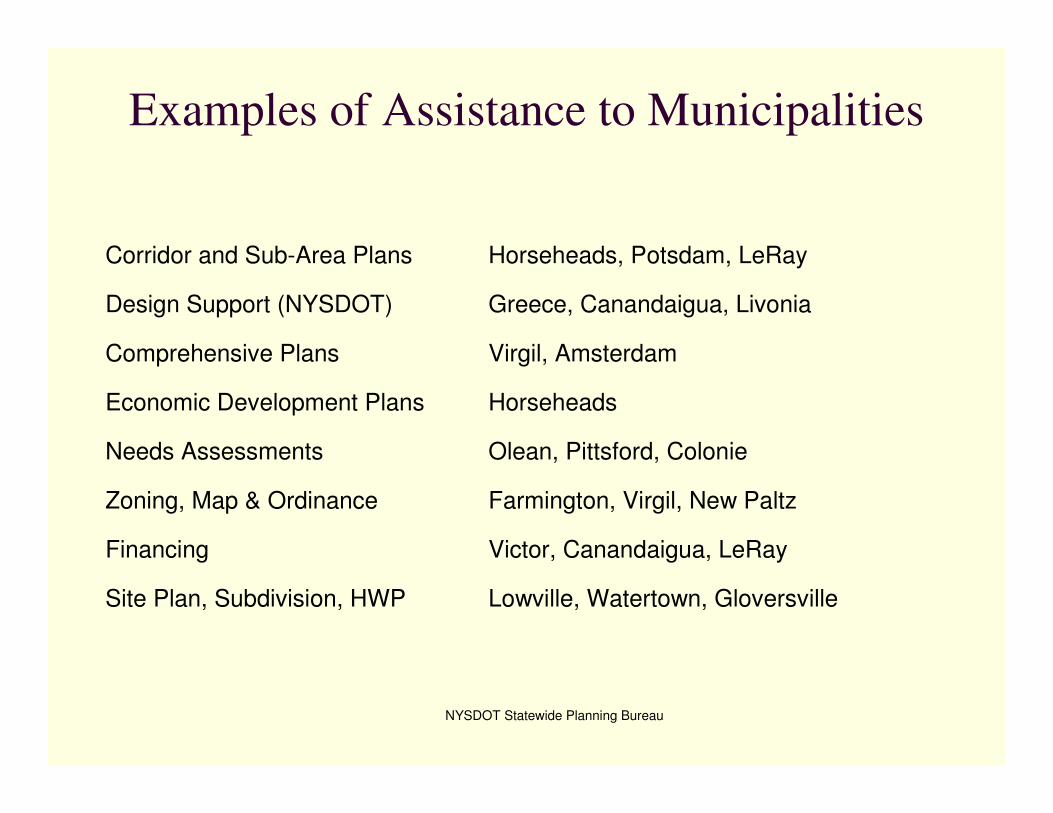
Examples of Assistance to Municipalities
NYSDOT Statewide Planning Bureau
Corridor and Sub-Area Plans Horseheads, Potsdam, LeRay
Design Support (NYSDOT) Greece, Canandaigua, Livonia
Comprehensive Plans Virgil, Amsterdam
Economic Development Plans Horseheads
Needs Assessments Olean, Pittsford, Colonie
Zoning, Map & Ordinance Farmington, Virgil, New Paltz
Financing Victor, Canandaigua, LeRay
Site Plan, Subdivision, HWP Lowville, Watertown, Gloversville
NYSDOT Statewide Planning Bureau
Content
Pressures for Change
Example of the relationship between growth
and transportation
Do’s and Don’ts
and why they’re important
Examples from Other Communities
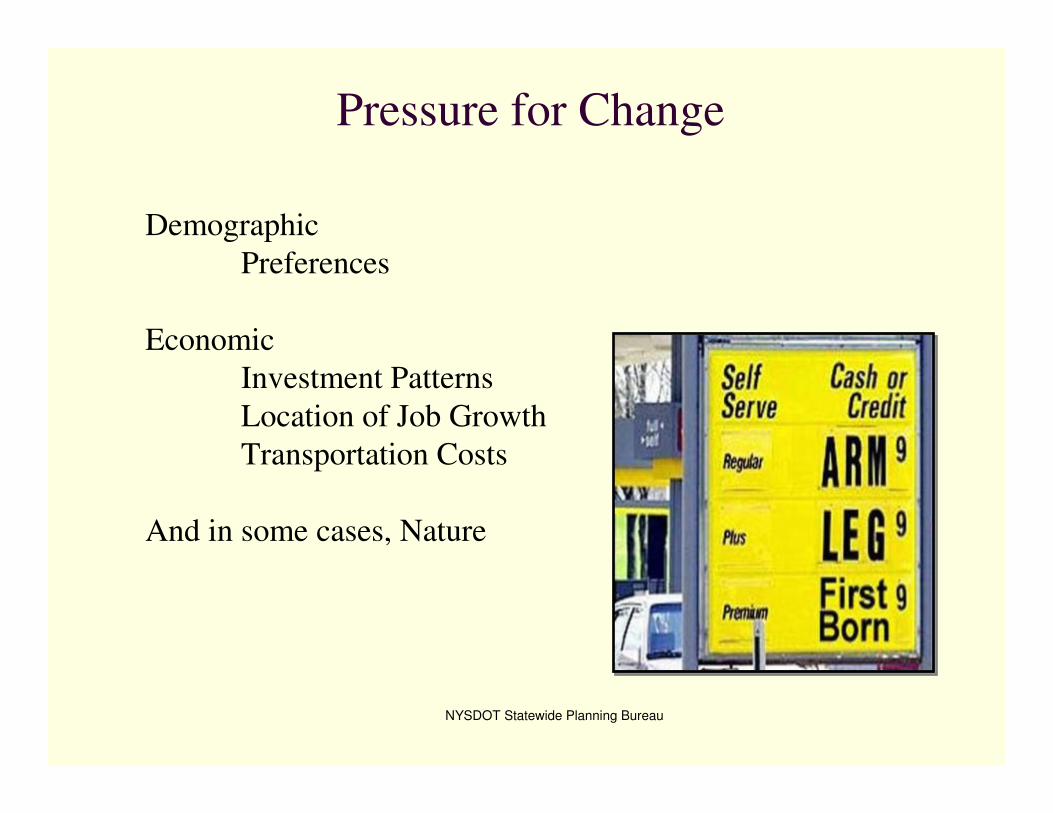
Pressure for Change
NYSDOT Statewide Planning Bureau
Demographic
Preferences
Economic
Investment Patterns
Location of Job Growth
Transportation Costs
And in some cases, Nature

NYSDOT Statewide Planning Bureau
Renewed Focus on Central Places
Legislative and Public Investment Initiatives
Smart Growth
Complete Streets
Sustainable Development
Transit Oriented Development

Residential Trends
� Residential land uses
� Between 2003 and 2025 the supply of large-lot single family homes will exceed demand by roughly 20 million units.
� The demand for multi-family and small-lot homes will increase by 35-million units.
The Future of the Urban Strip: Downhill, E.T. McMahon, 2/4/11, Urban Land Institute

Commercial Trends
� 50 percent of the buildings that will exist in 2040 have not yet been build.
� By some estimates there is over 1-billion sq. ft. of vacant retail space and as many as 400 big box stores which have to be repurposed or demolished.
Arthur C. Nelson, Leadership in a New Era, Journal of the American Planning Association, Vol. 72, No. 4, Autumn, 2006

What kind of communities will thrive?

NYSDOT Statewide Planning Bureau
Growth Generates Traffic
Typical Peak Hour Trip Generation Rates
Land Use Rate (per) Unit
Single Family Residential 1.01 Occupied unitApartment 0.62 Occupied unit
Industrial Park 0.91 1000 square feetManufacturing 0.75 1000 square feetWarehousing 0.74 1000 square feet
General Office 2.68 1000 square feetMedical and Dental 4.08 1000 square feet
Specialty Retail 4.93 1000 square feetShopping Center 6.44 1000 square feetSupermarket 10.34 1000 square feetSit Down Restaurant 16.26 1000 square feetFast Foodway w/ Drive Thru 36.53 1000 square feetDrive-Thru Bank 43.63 1000 square feetGas Station w/ Convenience 53.73 1000 square feet
Source: “Trip Generation”, Institute of Transportation Engineers, 5th Edition

NYSDOT Statewide Planning Bureau
NAME 1990 2000 NAME 1990 2000
Adirondack Plaza 3,456 9,904 Eckard's Drugs 8,200 11,200
Kiss the Cook 1,620 2,660 Classic Car Wash 2,400
Mormile 1,168 2,608 Pizza Hut 2,842
Amst. Savings Bank 4,400 Amst. Family Prac. 10,950
Windmill Diner 4,296 10,270 Ponderosa 5,437
84 Lumber 28,620 28,620 John Ray Rentals 2,560 2,560
Bloomfields 1,000 Country Feed Store 2,670 7,390
Kem Plaza 15,696 Super K-Mart 178,209
Mobil/Subway 1,575 2,775 Sanford Farms 100,850
Key Bank 3,420 3,420 Spec Retail 7,488
Polar Plaza 16,233 16,233 Taco Bell 2,039
Dexter 3,840 3,840 Wal-Mart 116,197
Alpin Haus 68,900 74,120 Village Square 52,294
McDonalds 4,018 5,518 Wendy's 2,928
Terry Financial 1,120 Advanced Auto 6,889
Eckard's Drugs 8,200 11,200 Total (square feet) 526,298 541,281
Growth on a Commercial Corridor

NYSDOT Statewide Planning Bureau
With Growth Traffic Volumes Increase

NYSDOT Statewide Planning Bureau
Conflicts …. become continuous

NYSDOT Statewide Planning Bureau
Conflicts, Driveways & Accidents

Driveways, Speed and Travel Time
Capacity per Lane, No Driveways
or Intersection
Capacity per Lane, with
Intersections
Capacity per Lane, with Intersections and Driveways
@ 1,500 vehicles per hour
at Level of Service D
@ 1,250 vehicles per hour
at Level of Service D
@ 900 vehicles per hourat Level of Service D

NYSDOT’s Role
� Highway Work Permit
� Corridor Planning
� Turn Lanes
� Signals & Signal Mgmt.
� Roundabouts
� Through Lanes
� Medians
� Pedestrian & Bike Facilities
� Speed Limits
� Context Sensitive & Supportive
� We don’t undertake projects to resolve the impacts of cumulative development until the problems are severe
� The intensity and pattern of development limits our options and increases their cost
� Our solutions involve significant trade-offs

Financial Pressure
� System Preservation
� Disaster Recovery
� Safety
� Projects linked to economic development
� System Efficient
� Transit
� Bike and Pedestrian
� Connectivity
� Complete Streets
… the fact is, if the system is going
to serve growth municipalities will have to minimize the problems

Municipal Role
� Comprehensive, Area, Economic, Infrastructure Plans
� Zoning Map & Regulations
� Site Plan & Subdivision Approval
� SEQRA and GEIS Actions
� (Local) System planning and expansion
� Municipalities have the dominant role in minimizing the adverseimpacts of development
� Municipalities have the dominant role in determining whether growth meets their overall objectives

NYSDOT Statewide Planning Bureau
IF you’re going to give yourself the best
chance to grow;
IF you’re going to make the most of that
growth; and
IF you’re going to minimize the problems
associated with growth …..

It’s not even mostly about transportation!
� Open space preservation
� Recreation
� Historic preservation
� Schools
� Property values
� Local finance and taxes
� Family and personal costs
� Economic development
� Social values
� Special needs
� Environmental
But most of your actions will be linked to transportation!

Vision of How You Want to Look

Vision of How You Want to Function

NYSDOT Statewide Planning Bureau
Recognize & Protect Greater Value of a Road

NYSDOT Statewide Planning Bureau
Recognize & Protect Greater Value of a Road

Resolve the Problems of Competition
and Over-zoning
Forge Partnerships ………..

Understand Your Market
Zone for Reuse and Redevelopment
NYSDOT Statewide Planning Bureau

Implications of Too Much
Commercial Zoning and Development
� Abandonment or devaluation of
existing business
� Lower property values
� Transfers wealth to developers
� Reduced assessment on abandoned and
devalued businesses
� Increased tax stress on other properties
� Reduced ability to redevelop, devaluation of other
businesses

Connectivity & System Rationalization

Provide Connectivity
For Cars, Bikes and Pedestrians
NYSDOT Statewide Planning Bureau

Look for Opportunities to Establish Connectivity
NYSDOT Statewide Planning Bureau

Look for Opportunities to Establish Connectivity
NYSDOT Statewide Planning Bureau

Rationalize
Municipal Highway Costs
NYSDOT Statewide Planning Bureau
Road Expenditures, 2010
$ / Mile
County $ 40,980
City 40,092$
Town $ 17,813
Village 34,541$
Municipal Road

Disconnectivity Costs
NYSDOT Statewide Planning Bureau
Property Value $16,800,000
Property Taxes Paid $84,000
Road, O & M & Repair -$12,900
subtotal $71,100
Road, Annualized Cost to Rebuild -$29,500
Property Taxes after Road Costs $41,600

NYSDOT Statewide Planning Bureau
Manage for Public Benefits

NYSDOT Statewide Planning Bureau
Signal Capture
� Benefits occur dominantly if not exclusively
to the property it serves
� Generally no over-riding technical justification
� Reduces, if not eliminates the potential for
system rationalization
� Reduces the ability to develop abutting
properties and hence their value
� Contributes to irrational commercial sprawl

NYSDOT Statewide Planning Bureau
Avoid the Permissible Mistakes

Provide for Safety, Sight Distance
NYSDOT Statewide Planning Bureau

Cases
NYSDOT Statewide Planning Bureau
Town and Village of Livonia
Town of Virgil

Town and Village of Livonia
NYSDOT Statewide Planning Bureau

�Redevelop the Village as
the communities’
economic and social core
� Preserve open space,
farmland and outdoor
recreation opportunities
� Provide mixed uses,
density and connectivity
to encourage bike and
pedestrian use and
interaction between
individuals
Livonia: Objectives

NYSDOT Statewide Planning Bureau
Livonia: Objective Driven
Rezoning Plus
(1) Retail & commercial
down-zoning except at
new village center
(2) Industrial + at multi-
modal location providing
best access to Rt. 390
(3) Residential, ¼-½ acre
in Village, 5 acres outside
with significant incentives
for clustering
(4) Access management
standards to establish road
grid

Livonia: Be Prepared
Used the NYSDOT Project: 1)
Street and landscaping, parking, 2)
replace water mains, 3) extend to
improvements at school, 4) support
for financial plan for proposed road

Virgil
NYSDOT Statewide Planning Bureau

Virgil: What do you want to protect, enhance or
achieve that’s worth the pain of rezoning?
Preserve open space,
farmland, critical
resources, and
outdoor recreation
opportunities.
Caveats - maintain property
values and the ability to sell
property.
Environmental Amenities

NYSDOT Statewide Planning Bureau
Virgil: What do you want to protect, enhance or
achieve that’s worth the pain of rezoning?
Enhance tourism, local business opportunities,
agriculture, and “environmentally-based” businesses.
Preserve the external-external linkage to employment
and spending outside the Town.
Caveats - avoid strip
development and big
boxes, minimize aesthetic impacts
Economic Opportunity & Growth

Virgil: Zoning Strategy
1-3 small, high density residential zones, 5-acre zoning everywhere else (with significant development incentives for clustering, land preservation and investment in public infrastructure and benefits).
1 small commercial zone co-located preferably with dense residential cluster and Greek PeakPUD

Virgil: Strategy
High Density Zoning With Incentives
� Provides the simplest and least expensive way to preserve open-space and direct development away from critical and sensitive resources
�Reduces Town costs in providing public infrastructure and amenities as well as preserving open space
�Limits growth and reduces build-out

Virgil: Share the Wealth
Current Home OwnersIncreases short and long term value
New Home BuyersLarge lot buyers = a wash“Small” lot buyers = increases cost 3-5%
Land SellersMore landowners can benefit from property salesIncreases property values in the mid- to long-term
Property SpeculatorsIncreases the risk premium and front end costs
DevelopersIncreases front end costs, eventually a wash

Be Prepared!
� Have a vision of how you want to look and function
� Zone to preserve the higher value of a road
� Zone to the right places and scale
� Zone in light of market and development needs
� Provide connectivity for all users
� Limit unnecessary & unproductive costs
� Manage for public benefits
� Avoid the permissible mistakes
� Focus on safety for all users
� Share the wealth
� Use zoning strategically

Thanks. Questions?

Sharon Springs, Union Street link to Walmart?