linking incomes to outcomes did you really get what they said you got? michael pine, m.d., m.b.a....
TRANSCRIPT

Linking Incomes to Linking Incomes to OutcomesOutcomes
Did You Really Get Did You Really Get What They Said You Got?What They Said You Got?
Michael Pine, M.D., M.B.A.
Michael Pine and Associates, Inc.(773) 643-1700

© 2009 Michael Pine and Associates, Inc.
OverviewOverview
Creating a Value-Driven Health Care Market
Affordable Data We Can Believe In
Comparative Performance of Alternative Data Sets
From Information to Understanding to Action
Accountability in a Value-Driven Market

Creating a Value-DrivenCreating a Value-DrivenHealth Care MarketHealth Care Market

© 2009 Michael Pine and Associates, Inc.
Creating a Value-Driven Health Care MarketCreating a Value-Driven Health Care MarketManaging Seven Essential RsManaging Seven Essential Rs
REWARDSREWARDS
contract
RESPONSIBILITIESRESPONSIBILITIES
STATICSTATICSTRUCTURESSTRUCTURES
DYNAMICDYNAMICPROCESSESPROCESSES
contract
RESOURCES, RESOURCES, ROLESROLES
& & RELATIONSHIPSRELATIONSHIPSRESULTSRESULTS
Hospital 21
Hospital 20
Hospital 19
Hospital 18
Hospital 17
Hospital 16
Hospital 15
Hospital 14
Hospital 13
Hospital 12
Hospital 11
Hospital 10
Hospital 9
Hospital 8
Hospital 7
Hospital 6
Hospital 5
Hospital 4
Hospital 3
Hospital 2
Hospital 1
ADVERSE OUTCOMES IN PERCENT5% 10% 15% 20% 25% 30% 35% 40%
P > 0.05 P = 0.01 to 0.05 P = 0.001 to 0.01 Predicted Observed
RISKSRISKS

© 2009 Michael Pine and Associates, Inc.
Aligns Risks and Responsibilities
Links Results and Rewards
Balances Quality and Cost
Combines Individual Choice and Market Discipline
Provides Accurate, Relevant Information
Holds All Participants Accountable
Characteristics of a Value-Driven Characteristics of a Value-Driven MarketMarket

© 2009 Michael Pine and Associates, Inc.
Assign
Responsibility
Defines
Roles
Convey
Authority
Invites
AccountabilityAccountability
Requires
Accountability and Performance Accountability and Performance MeasuresMeasures
Measures

© 2009 Michael Pine and Associates, Inc.
DecisionsDecisions
DataDataProvide
Information
Produces
Understanding
Supports
Invite
EvaluationEvaluation
Requires
Risk-Risk-AdjustmentAdjustment
Mutes Mutes ExtraneousExtraneousInfluencesInfluences
Guide
Actions
Linking Data, Decisions, and Linking Data, Decisions, and AccountabilityAccountability

© 2009 Michael Pine and Associates, Inc.
Risk-Adjustment and Performance Assessment
Mortality in CABG Surgery
Hospital 4
Hospital 2
Hospital 8
Hospital 9
Hospital 15
Hospital 16
Hospital 17
Hospital 11
Hospital 12
Hospital 3
Hospital 5
Hospital 14
Hospital 10
Hospital 1
Hospital 13
Hospital 18
Hospital 7
Hospital 6
0% 2% 4% 6% 8%MORTALITY IN PERCENT
P > 0.05 P = 0.01 to 0.05 P = 0.001 to 0.01 Predicted Observed

Affordable DataAffordable DataWe Can Believe InWe Can Believe In

© 2009 Michael Pine and Associates, Inc.
Data for Monitoring Clinical Data for Monitoring Clinical PerformancePerformance
Claims Data HCFA Mortality ReportsHealthGrades.com HCUP Inpatient Quality and Patient Safety
Indicators
Clinical DataAPACHE Pennsylvania Health Care Cost Containment
CouncilCleveland Health Quality ChoiceSpecialty Society Registries (e.g., STS, ACC)

© 2009 Michael Pine and Associates, Inc.
Claims Data Versus Clinical DataClaims Data Versus Clinical Data
Data Is the Foundation for:Public ReportingPerformance-Based ReimbursementQuality Improvement Initiatives
Must Balance the Need for:Accurate Measurement of Clinical
PerformanceEase and Cost of Data Collection

© 2009 Michael Pine and Associates, Inc.
Relative Ease of Data CollectionRelative Ease of Data Collection
Standard ClaimsStandard Claims
Numerical LaboratoryNumerical Laboratory
Vital SignsVital Signs
Other Clinical DataOther Clinical DataManual
Automated
Dat
a C
oll
ecti
on
Claims DataClaims Data
Clinical DataClinical Data

© 2009 Michael Pine and Associates, Inc.
Efficient Use of Clinical DataEfficient Use of Clinical Data
AlbuminMental Status
Hemoglobin FEV1
Cost to Cost to CollectCollect Hig
hLow
AnalytiAnalytic c
PowerPower
High
Low

© 2009 Michael Pine and Associates, Inc.
Enhancing Claims DataEnhancing Claims Data
Present-on-Admission CodingMayo ClinicNew York State’s SPARCS DatabaseCalifornia’s OSHPD DatabaseUB-04 CMS’s New Coding Requirements
Numerical Laboratory DataMichael Pine and Associates Agency for Healthcare Research and Quality
(AHRQ)
AHRQ’s New Hybrid Database Demonstrations

© 2009 Michael Pine and Associates, Inc.
Creating a Hybrid DatabaseCreating a Hybrid Database
Standard ClaimsStandard Claims
Numerical LaboratoryNumerical Laboratory
Vital SignsVital Signs
Other Clinical DataOther Clinical Data
Present-on-AdmissionPresent-on-Admission
Claims DataClaims Data
Clinical DataClinical Data
Hybrid DataHybrid Data

© 2009 Michael Pine and Associates, Inc.
Potential Benefits of a Hybrid Potential Benefits of a Hybrid DatabaseDatabase
Explicitly Distinguish BetweenComorbidities That Are Present on
AdmissionComplications That Occur During
Hospitalization
Provide Objective Clinical Data Validate the Subjective Assignment of
DiagnosesAid in Defining the Severity of Diagnosed
ConditionsAid in Delineating Underlying
Pathophysiology

Comparative Performance of Comparative Performance of Alternative Data SetsAlternative Data Sets

© 2009 Michael Pine and Associates, Inc.
Sources of Data for AnalysisSources of Data for Analysis
188 Pennsylvania Hospitals for Primary AnalysesClaims Data for Discharges from 7/00 to 6/03Corresponding AtlasTM Clinical Data
Abstracted from Medical RecordsHospital Day Recorded for Each Data Element
New York and California Claims DataIdentify Potentially Problematic Risk FactorsAssess Effect of Improperly Designated
Complications

© 2009 Michael Pine and Associates, Inc.
Inpatient Quality Indicators (Mortality)Inpatient Quality Indicators (Mortality)
Medical ConditionsAcute Myocardial InfarctionCerebrovascular AccidentCongestive Heart FailureGastrointestinal HemorrhagePneumonia
Surgical ProceduresAbdominal Aortic Aneurysm RepairCoronary Artery Bypass Graft SurgeryCraniotomy

© 2009 Michael Pine and Associates, Inc.
Patient Safety Indicators Patient Safety Indicators (Complications)(Complications)
Elective Surgical Procedures
ComplicationsPhysiologic / Metabolic AbnormalitiesPulmonary Embolus / Deep Vein ThrombosisSepsisRespiratory Failure

© 2009 Michael Pine and Associates, Inc.
Data Used in CLAIMS ModelsData Used in CLAIMS Models
Age and Sex
Principal Diagnosis
Secondary DiagnosesChronic ConditionsConditions Generally Present on Admission
Selected Surgical Procedures

© 2009 Michael Pine and Associates, Inc.
Data Used in POA and HYBRID ModelsData Used in POA and HYBRID Models
POA ModelsAll Data Used in CLAIMS ModelsAdditional Secondary Diagnoses
Frequently Hospital-AcquiredUsed When Clinical Data Establish Presence on
Admission
HYBRID ModelsAll Data Used in POA ModelsNumerical Laboratory Data
Routine Chemistry, Hematology, and Blood Gas Analyses
Available in Electronic Form from Most Hospitals

© 2009 Michael Pine and Associates, Inc.
Data Used in CLINICAL ModelsData Used in CLINICAL Models
All Data Used in HYBRID Models
Vital Signs
Laboratory Data Not in HYBRID Models e.g., bacteriological analyses, cardiac ejection
fraction
Key Clinical Findings from Medical Recordse.g., immunocompromised, lethargic
Composite Clinical Scores e.g., ASA Classification, Glasgow Coma Score

© 2009 Michael Pine and Associates, Inc.
Bias Due to Suboptimal DataBias Due to Suboptimal Data
+ 2 Std Dev
Good Average Poor
- 2 Std Dev
Measured Performance
+ 0.5 Std Dev
Problematic Problematic
- 0.5 Std Dev
Bias
OK

© 2009 Michael Pine and Associates, Inc.
Bias Due to Suboptimal Data Bias Due to Suboptimal Data (Mortality)(Mortality)
0%
10%
20%
30%
40%
50%
60%
70%
0.5 1.0 1.5 2.0Upper Threshold for Bias in Standard Deviations
Per
cen
t E
xcee
din
g U
pp
erT
hre
sho
ld
RAW CLAIMS POA HYBRID

© 2009 Michael Pine and Associates, Inc.
Bias Due to Suboptimal Data Bias Due to Suboptimal Data (Complications)(Complications)
0%
10%
20%
30%
40%
50%
60%
70%
0.5 1.0 1.5 2.0Upper Threshold for Bias in Standard Deviations
Per
cen
t E
xcee
din
g U
pp
erT
hre
sho
ld
RAW CLAIMS POA HYBRID

© 2009 Michael Pine and Associates, Inc.
Bias in Measurement of ComplicationsBias in Measurement of Complications
0%
10%
20%
30%
40%
50%
60%
70%
80%
90%
0.5 1.0 1.5 2.0Upper Threshold for Bias in Standard Deviations
Per
cen
t E
xcee
din
g U
pp
er T
hre
sho
ld
Observed vs Predicted Rates of True Complications
Bias Due to Failure to Risk-Adjust True Complication Rates
Bias Due to Misclassifying Comorbidities As Complications

© 2009 Michael Pine and Associates, Inc.
Numerical Laboratory DataNumerical Laboratory Data
22 Tests Enter At Least 1 Model
14 of These Tests Enter 4 or More Models• pH (11) • SGOT (7)
• Prothrombin Time (10)
• Platelet Count (7)
• Sodium (9) • Albumin (5)
• White Blood Count (9) • pCO2 (4)
• Blood Urea Nitrogen (8)
• Glucose (4)
• pO2 (8) • Creatinine (4)
• Potassium (7) • CPK-MB (4)

© 2009 Michael Pine and Associates, Inc.
Vital Signs, Other Lab Data, Composite Scores
All Vital Signs Enter 4 or More Models
Culture Results Enter 2 Models
Ejection Fraction Enters 2 Models
Both Composite Scores Enter 4 or More Models
•ASA Classification (6)•Glasgow Coma Score (4)
•Pulse (8) •Blood Pressure (6)
•Temperature (6) •Respirations (5)

© 2009 Michael Pine and Associates, Inc.
Abstracted Key Clinical FindingsAbstracted Key Clinical Findings
35 Clinical Findings Enter At Least 1 Model
Only 3 of These Enter More Than 2 ModelsComa (6)Severe Malnutrition (4)Immunosuppressed (4)
14 Have Corresponding ICD-9-CM Codese.g., coma, severe malnutrition
Coding Regulations Limit Utility of Claims Data

The Bottom LineThe Bottom Line
Claims Data Enhanced with Present-on-Admission Modifiers and
Numerical Lab Data Can SupportAccurate Performance Assessment

From Information to From Information to Understanding to ActionUnderstanding to Action

© 2009 Michael Pine and Associates, Inc.
Understanding
Motivation
Action
Information
Knowledge
Explanation
From Information to Understanding to Action

© 2009 Michael Pine and Associates, Inc.
Three Barriers to Effective Decision Three Barriers to Effective Decision MakingMaking
Inconsistent Reporting of Complications
Dissociation of Services and Clinical Benefits
Inability to Relate Outcomes to Processes of Care

© 2009 Michael Pine and Associates, Inc.
Coding Hospital-Acquired Coding Hospital-Acquired ComplicationsComplications
Potential Barriers to Accurate CodingExpertise and Teamwork Required for Accurate
CodingDifficulty Achieving Consistency in ReportingBenefits to Hospitals of Not Coding Complications
Consequences of Inconsistent CodingAffects Comparative Assessments of Clinical QualityAffects Reimbursement
Detection of Coding Errors Chart Reviews Are Inefficient and CostlyWell-Designed Screens Can Detect Problems
Efficiently
© 2009 Michael Pine and Associates, Inc.
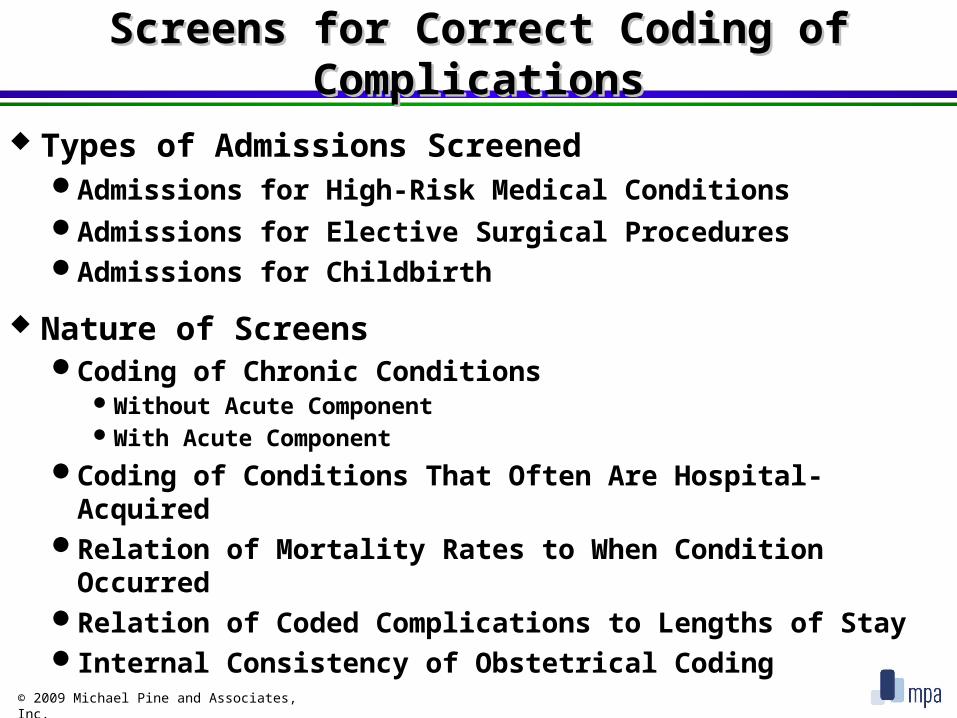
Screens for Correct Coding of Screens for Correct Coding of ComplicationsComplications
Types of Admissions ScreenedAdmissions for High-Risk Medical ConditionsAdmissions for Elective Surgical ProceduresAdmissions for Childbirth
Nature of ScreensCoding of Chronic Conditions
Without Acute ComponentWith Acute Component
Coding of Conditions That Often Are Hospital-Acquired
Relation of Mortality Rates to When Condition Occurred
Relation of Coded Complications to Lengths of StayInternal Consistency of Obstetrical Coding

© 2009 Michael Pine and Associates, Inc.
Risk-Adjusted Post-Operative Lengths of Stay
All Live Discharges
-10
0
10
20
30
40
50
60
1 31 61 91 121 151 181 211 241 271 301 331 361 391 421 451 481 511Sequence Identifier
O
BS L
OS m
inus
PR
ED
LO
S (d
ays)
Average 3 Std Dev Normal LOS Long LOS w Cpl Long LOS w/o Cpl

© 2009 Michael Pine and Associates, Inc.
Risk-Adjusted Post-Operative Lengths of Stay
Live Discharges without Reported Complications
-10
0
10
20
30
40
50
60
1 38 82 129 180 225 270 310 354 398 448 491Sequence Identifier
O
BS L
OS m
inus
PR
ED
LO
S (d
ays)
Average 3 Std Dev Normal LOS Long LOS w/o Cpl

© 2009 Michael Pine and Associates, Inc.
Distribution of Hospital POA Coding Distribution of Hospital POA Coding ScoresScores
ScoreHospitals
(#)Hospitals
(%)
>90% 65 39.4%
>80% to 90% 41 24.8%
>70% to 80% 26 15.8%
>60% to 70% 19 11.5%
60% or lower 14 8.5%
Total Scored 165 100%
>10% Unknown 22 n/a

© 2009 Michael Pine and Associates, Inc.
Linking Results and RewardsLinking Results and Rewards
Patient(Clinical
Risk)
Benefits
(Results)
HealthcareServices
Structure
Payment
(Reward)$
Costs(Results)
$
© 2009 Michael Pine and Associates, Inc.
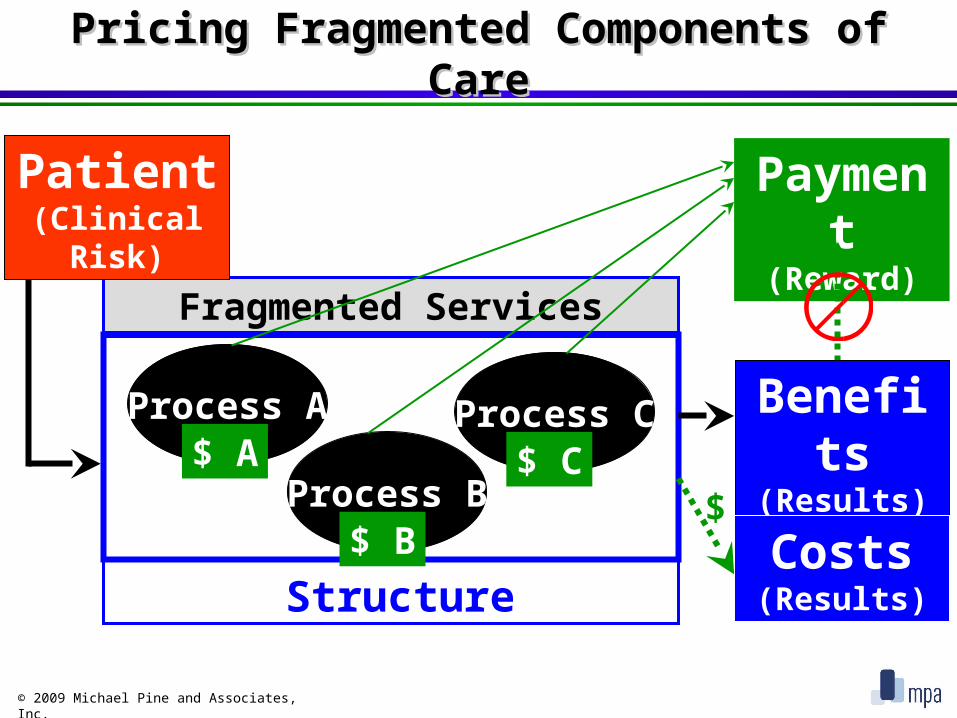
Pricing Fragmented Components of Pricing Fragmented Components of CareCare
Fragmented Services
Process A
Structure
Process B
Process C$ A
$ B
$ C
Payment
(Reward)
Patient(Clinical
Risk)
Benefits
(Results)
Costs(Results)
$

© 2009 Michael Pine and Associates, Inc.
Components of an Episode of CareComponents of an Episode of Care
Precipitating Event(Clinical Risk)
Care
Outcome(Benefit)

© 2009 Michael Pine and Associates, Inc.
Reimbursement for Episodes of CareReimbursement for Episodes of Care
Benefits
(Results)
HealthcareServices
Structure Costs(Results)
Payment
(Reward)
New Health Event
ClinicalRisk
Premium
(Reward)
Risk of Occurren
ce
$
$
$Episode of Care

© 2009 Michael Pine and Associates, Inc.
Services Associated with an Episode of Services Associated with an Episode of CareCare
Individualized Services
Required Services

© 2009 Michael Pine and Associates, Inc.
Alternative Practice Patterns
ServicesRendered
ServicesRendered
ServicesRendered
Optimum Care Inefficient Care
Ineffective Care Ineffective, Inefficient Care
ServicesRendered

© 2009 Michael Pine and Associates, Inc.
Costs of Alternative Practice PatternsCosts of Alternative Practice Patterns
Care of Associated
Adverse Outcomes
OptimumRoutine
Care
TOTAL
Cost
OptimumCost-Effectiveness
InefficientIneffective
Care
= Actual Cost
InefficientCare
Ineffective
Care

© 2009 Michael Pine and Associates, Inc.
Payment in a Value-Driven MarketPayment in a Value-Driven Market
Insurance for Risk of Occurrence:
Capitation By Beneficiary
Evidence-Based Care Required by Population:Fee-for Service By Encounter
Individualized Health Care Services:Global Fee By Episode of Care
Care of Potentially-Avoidable Complications:Warranty For Episode of Care

© 2009 Michael Pine and Associates, Inc.
Use Fair Empirically-Derived StandardsUse Fair Empirically-Derived StandardsTo Set Global Fees and WarrantiesTo Set Global Fees and Warranties
I would be agood boy if only
you loweredyour standards!
I would be agood boy if only
you loweredyour standards!

© 2009 Michael Pine and Associates, Inc.
Standardized Hospital Costs and Adverse Standardized Hospital Costs and Adverse OutcomesOutcomes
350 High Performing & 113 Suboptimally Performing 350 High Performing & 113 Suboptimally Performing HospitalsHospitals
0%
2%
4%
6%
8%
10%
12%
14%
16%
18%
$4 $8 $12 $16 $20 $24 $28
Total Hospital Cost (thousands $)
% A
dv
ers
e O
utc
om
e R
ate
Good Performance Problematic Performance Average Good Average Problematic
6.91%$13,259
3.99%$11,192

© 2009 Michael Pine and Associates, Inc.
Aligning Risks, Responsibilities, and Aligning Risks, Responsibilities, and RewardsRewards
In a Virtual PartnershipIn a Virtual Partnership
Payer Bears Risk of Occurrence
Managing Organization (e.g., Physician-in-Charge)Receives Standard Negotiated Payment Minus
WithholdOverruns in Total Cost of Episode Covered by WithholdTotal Savings Shared with Payers
Participating CaregiverReceives Standard Negotiated Payment Minus
WithholdAchievement of Intermediate Milestones Determines:
Return of WithholdPayment of Bonus
Consultant / Supplier Receives Standard Payment

© 2009 Michael Pine and Associates, Inc.
• Provider Selection•Network Formation•Reimbursement•Accountability•Strategic Planning•Marketing
External MonitoringMonitoring
Internal Internal MonitoringMonitoring
• Quality Control•Quality Improvement•Cost Management
Assesses Performance
Links Processes to Outcomes
External and Internal MonitoringExternal and Internal Monitoring

© 2009 Michael Pine and Associates, Inc.
Traditional Mortality and Morbidity Traditional Mortality and Morbidity ReviewReview
Analyses of Single Cases with Adverse Outcomes
Peer Review Aided by Medical Literature
Objectives VaryIdentify and Correct Substandard PracticeEducate ParticipantsImprove Processes of Care
Problems AboundRarely Affects Individual PracticeDivorced from Organizational Decision MakingLacks Scientific Credibility

© 2009 Michael Pine and Associates, Inc.
Fallacy of Generalizing from Single Fallacy of Generalizing from Single CasesCases
One Tree
Does Not a Forest Make

© 2009 Michael Pine and Associates, Inc.
Designing Robust Observation StudiesDesigning Robust Observation Studies
Strengths of Randomized Controlled Clinical TrialsRandomization Is Performed Prior to InterventionTreatment and Control Groups Are Similar
Overcoming Weaknesses of Observational StudiesTreatments Usually Are Not Randomly
AdministeredSelect Controls with Same Likelihood of
Treatment Propensity Analyses Match Important
Characteristics

© 2009 Michael Pine and Associates, Inc.
Relating Clinical Processes to Relating Clinical Processes to OutcomesOutcomes
Clinical Care Often Is Individualized
Risk Profiles Affect Outcomes and Routine CareComplications Often Are Related to Higher Initial RiskTreatment May Vary with Initial RiskDifferences in Risk Profiles Confound Comparisons
Matching by Predicted Outcome Reduces BiasMatch Cases with and without ComplicationsCompare Potentially Important Elements of CareDifferences Suggest Opportunities for ImprovementChart Abstraction Often Required to Assess Processes

© 2009 Michael Pine and Associates, Inc.
Identify Opportuniti
es to Improve
AlterProcess
es
A Cycle of Continuous Quality A Cycle of Continuous Quality ImprovementImprovement
Adverse Outcom
es
Analyze Process
es
Select Control
s
Plan for Improveme
nt
Matched Matched ControlsControlsReduce Reduce
Confounding Confounding BiasBias

© 2009 Michael Pine and Associates, Inc.
Accountability in a Value-Driven Accountability in a Value-Driven MarketMarket
Information about risks and results guides:purchasing decisions and reimbursementperformance improvement initiatives
Evaluation focuses on episodes of care, not on individual cost centers
Margin and market share accurately reflect:quality of careclinical efficiency

Yes We Can!