linkage between the vertical evolution of clouds and
TRANSCRIPT

Linkage Between the Vertical Evolution of Cloudsand Droplet Growth Modes as Seen FromFY‐4A AGRI and GPM DPRYilun Chen1,2 , Weibiao Li1,2 , Shumin Chen1,2 , Aoqi Zhang1,2 , and Yunfei Fu3
1School of Atmospheric Sciences, Sun Yat‐sen University, Zhuhai, China, 2Southern Marine Science andEngineering Guangdong Laboratory (Zhuhai), Zhuhai, China, 3School of Earth and Space Sciences,University of Science and Technology of China, Hefei, China
Abstract Based on matched scans from the FY‐4A satellite's Advanced Geostationary Radiation Imager(AGRI) and the NASA/JAXA Global Precipitation Measurement (GPM) Core Observatory's Dual‐frequencyPrecipitation Radar (DPR), the microphysical mechanisms of the derived vertical evolution of cloudeffective radius (Re) and its correspondence with precipitation droplet growth modes are revealed in thisstudy. The results show that there were two turning points in the Re vertical evolution, which divided the Re
profile into solid‐phase, mixed‐phase, and liquid‐phase zones from top to bottom. There were also twoturning points in the upper layer of DPR reflectivity, which showed good correspondence with Re turningpoints in both height and physical sense. The main droplet growth modes in the three zones arenucleation/glaciation, deposition, and riming, respectively. The linkage between Re vertical evolution anddroplet growth modes would be useful in real‐time monitoring of cloud microphysical processes.
1. Introduction
The vertical evolution of precipitating clouds indicates the processes of movement, transformation, andphase change of water vapor, cloud particles, and precipitation droplets and is key to revealing the physicalnature of these clouds and improving precipitation predictions (Houze et al., 2015; Rosenfeld, Andreae,et al., 2014). There are potentially numerous liquid cloud and supercooled water vapor particles withinclouds below temperatures of 0°C. This not only affects our accurate understanding of cloud microphysicsbut threatens flight safety, due to the possibility of aircraft icing (Caliskan & Hajiyev, 2013; Fu, 2014).
The limitations of ground‐based observations and model simulations mean that satellite observations havebeen exerting a continuously growing impact on researches of cloud vertical evolution (Geer et al., 2017).Since the 1990s, several satellites have been launched with instruments to detect the vertical structures ofcloud and precipitation. For instance, the Cloud Profiling Radar (CPR) onboard CloudSat can accuratelyretrieve the effective radius (Re) and water content of cloud particles within each vertical layer (Stephenset al., 2002), which has been widely used for studying the vertical structures of clouds (Stephens et al., 2008);the Cloud‐Aerosol LIDAR with Orthogonal Polarization (CALIOP) detects high‐resolution reflectivity pro-files of the cloud top and is applied in studying the cloud microphysics of cirrus clouds (Chen & Fu, 2018;Winker et al., 2009); and satellite precipitation radars, including the Tropical Rainfall Measuring Mission(TRMM) Precipitation Radar (PR) and the Global Precipitation Measurement (GPM) Dual‐frequencyPrecipitation Radar (DPR), provide three‐dimensional information about rain rate and droplet size distribu-tion (DSD) for precipitation studies (Awaka et al., 2009; Iguchi et al., 2012). However, despite the diversityand high detection accuracy of these active instruments, they all work on low Earth orbits with a narrowscanning swath and long revisit period, which mean they are limited in continuous monitoring and cannotmeet the needs of severe weather warning systems.
Compared with those active instruments, passive visible and infrared instruments are much more commonand are carried on various meteorological satellites. Using multiple near‐infrared channels and weightingfunctions, Platnick (2000) attempted to directly retrieve the vertical evolution of cloud parameters, but theapplication of this method is restricted by high requirements on cloud uniformity and channel sensitivity(King & Vaughan, 2012). Currently, using bispectral reflectance (BSR) to obtain the cloud‐top Re and estab-lishing the relationship between Re and cloud‐top temperature (or height) is the key method for indicating
©2020. American Geophysical Union.All Rights Reserved.
RESEARCH LETTER10.1029/2020GL088312
Key Points:• The derived vertical evolution of
clouds from FY‐4A shows greatcorrespondence with DPR verticalstructures of precipitation
• Synergistic application of passiveand active satellite sensors offers apanoramic view of the in‐cloudmicrophysical process
Supporting Information:• Supporting Information S1
Correspondence to:A. Zhang,[email protected]
Citation:Chen, Y., Li, W., Chen, S., Zhang, A., &Fu, Y. (2020). Linkage between thevertical evolution of clouds and dropletgrowth modes as seen from FY‐4AAGRI and GPM DPR. GeophysicalResearch Letters, 47, e2020GL088312.https://doi.org/10.1029/2020GL088312
Received 7 APR 2020Accepted 14 JUL 2020Accepted article online 19 JUL 2020
CHEN ET AL. 1 of 9

the vertical evolution of clouds (Ansmann et al., 2008; Campos Braga et al., 2017; Rosenfeld & Lensky, 1998;Zheng & Rosenfeld, 2015). This method relies on two core assumptions: (1) all cloud pixels in a certainregion have similar Re‐Temperature function (Re(T)), so that Re(T) of a single pixel is identical to compositeRe(T) within this region; (2) Re near the cloud top is similar to that inside the cloud at the same height.
The vertical evolution of clouds derived from passive satellite instruments has been used in a wide range ofmicrophysical studies. For instance, the shape of Re(T) was used to identify five microphysical zones of dif-ferent dominant cloud microprocesses (Rosenfeld & Woodley, 2003). Using matched observations from theTRMM Visible and Infrared Scanner (VIRS) and PR, the anthropogenic aerosols suppressing precipitationwere observed and attributed to greatly reduced Re (Rosenfeld et al., 2007). Re(T) was also applied in studyingthe impacts of aerosols on clouds' glaciation temperature and mixed‐phase precipitation, the vertical micro-physics of severe convective storms, and other studies about cloud‐aerosol‐precipitation properties (Rudichet al., 2002; Woodley et al., 2008).
These previous studies have laid a good foundation for studying cloudmicrostructures. However, the linkagebetween cloud particle microphysics and precipitation droplet growth is still unclear and worthy of furtherinvestigation. In addition, the application of instruments for measuring Re(T) on geostationary satellites isstill rare (Lensky & Rosenfeld, 2006), hampering efforts for continuous or real‐time monitoring of thevertical evolution of clouds. China's last‐generation FY‐2 series lacked near‐infrared channels around the2 μm wavelength, which resulted in huge uncertainty in the retrieved cloud parameters. Fortunately, thisshortcoming has been resolved in the latest FY‐4A geostationary satellite (Yang et al., 2017). Recently, wedeveloped a method for retrieving the vertical evolution of Re based on the FY‐4A AdvancedGeostationary Radiation Imager (AGRI) (Chen et al., 2020), although further validations are urgentlyneeded (for instance, whether this algorithm is suitable for snowfall clouds in winter).
In this manuscript, we focused on a disastrous rainfall‐blizzard event around Wuhan, in China's Hubeiprovince, in February 2020. Based on the matched detections from FY‐4A AGRI and GPM DPR, we couldrecognize the relationship between various cloud particle microphysics and precipitation droplet growthmodes, which can provide a scientific basis for real‐time monitoring of cloud and precipitation microphysicsusing geostationary observations.
2. Data and Methods
FY‐4A was launched in 2016 with a central longitude of 104.7°E (Yang et al., 2017). After severalcalibrations, it started operation in 2018, and data were released by FENGYUN Satellite Data Center(http://data.nsmc.org.cn). The AGRI onboard FY‐4A scans the Earth on 14 channels, among which thevisible channels (centered at 0.47, 0.65, and 0.825 μm) have a resolution of 1 km, the near‐infrared channels(centered at 1.375, 1.61, 2.225, and 3.75 μm) have a resolution of 2 km, and the resolution of the infraredbands is 4 km (centered at 3.75, 6.25, 7.1, 8.5, 10.8, 12.0, and 13.5 μm). AGRI can perform disk scans as fastas every 15 min, which is effective for tracking clouds. Currently, there are some official products based onAGRI observations, such as cloudmask and cloud‐top height (Min et al., 2017). In this study, we used Level 1AGRI data at the 0.65, 1.61, and 10.8 μm channels, and Geo data, including solar zenith, satellite zenith, andrelative azimuth. We also used a cloud‐top height official product with 4 km resolution.
Recently, we developed a retrieval algorithm of Re vertical evolution based on FY‐4A AGRI, which wasapplied in this study with slight modifications. First, a BSR lookup table was established using 0.65 and1.61 μm reflectance for retrieving cloud‐top Re; then the Re profile in a certain region was established by com-bining the Re and the cloud‐top height at each pixel. The retrieved cloud‐top Re has a correlation coefficientof over 0.9 with MODIS Re (Chen et al., 2020). After establishing the relationship between Re and cloud‐topheight, we calculated the 25th, 50th, and 75th percentiles of Re at each 0.25 km interval with a sample sizegreater than 150. Otherwise the percentiles would not be given, to eliminate errors caused by extreme values.
GPM DPR is the first spaceborne dual‐frequency precipitation radar to contain a Ku‐band radar (KuPR,13.6 GHz) and a Ka‐band radar (KaPR, 35.5 GHz). KuPR works in normal scan (NS) mode with 49 pixelsper track, which is similar to TRMM PR. KaPR has two scan modes including a matched scan (MS) modeon the central 25 pixels of NS track, and a high‐sensitivity scan (HS) mode on the outer 24 pixels of NS track(after 21 May 2018). Based on the different responses of Ku‐ and Ka‐band echoes to hydrometers, the GPM
10.1029/2020GL088312Geophysical Research Letters
CHEN ET AL. 2 of 9

precipitation processing system provides a dual‐frequency precipitation product, 2ADPR (Iguchiet al., 2012). In this study, the precipitation information mainly comes from 2ADPR on NS tracks(Ku‐band reflectivity, near‐surface rain rate, etc.) and MS tracks (DSD profiles) with a horizontal resolutionof 5 km and a vertical interval of 125 m.
3. Results
On 15 February 2020, a disastrous rainfall‐blizzard event brought by a cold front swept through Wuhan andthe surrounding area. The strong winds, rapid cooling, and road icing that accompanied this event causedextremely adverse effects for the contemporaneous epidemic control and material transportation in theregion (Sun et al., 2020).
GPM DPR happened to capture this event at 0744 UTC, when the cold front had moved southeasterly to thesoutheast of the study region (supporting information Figure S1). In the lower right of the study region (thedashed rectangle in Figure 1), near‐surface precipitation mainly appeared in its liquid phase, accounting foraround one third of the total precipitation pixels with a central rain rate of 5–10 mm/hr (Figures 1a and 1b).In the top left area of the study region, near‐surface precipitation appeared as snowfall, accounting for abouttwo‐thirds of the total pixels, with central intensity reaching 0.8 mm/hr (Figures 1a and 1b).
Figure 1c shows the 10.8 μmbrightness temperature, which indicates the temperature on an object's surface,at 0730 UTC on 15 February 2020 from FY‐4A. The study region was completely covered by clouds at thetime, with a brightness temperature of less than 263 K. In the rainfall region, the lowest brightness
Figure 1. Horizontal distributions of the rainfall‐blizzard event on 15 February 2020: GPM DPR (a) near‐surface rainrate and (b) near‐surface precipitation phase, (c) FY‐4A AGRI 10.8 μm brightness temperature, and (d) theretrieved Re. The dashed rectangle indicates our study region.
10.1029/2020GL088312Geophysical Research Letters
CHEN ET AL. 3 of 9
temperature was even less than 220 K, showing that the highest cloud top was there. The distributionfeatures of the brightness temperature indicate the existence of clouds at multiple heights, which ensuresthe representativeness of the retrieved Re vertical evolution. In addition, Figure 1d presents the retrievedRe using the BSR method. Re reached 30 μm in the top and bottom right of the study region, while it wasless than 12 μm in the bottom left and middle.
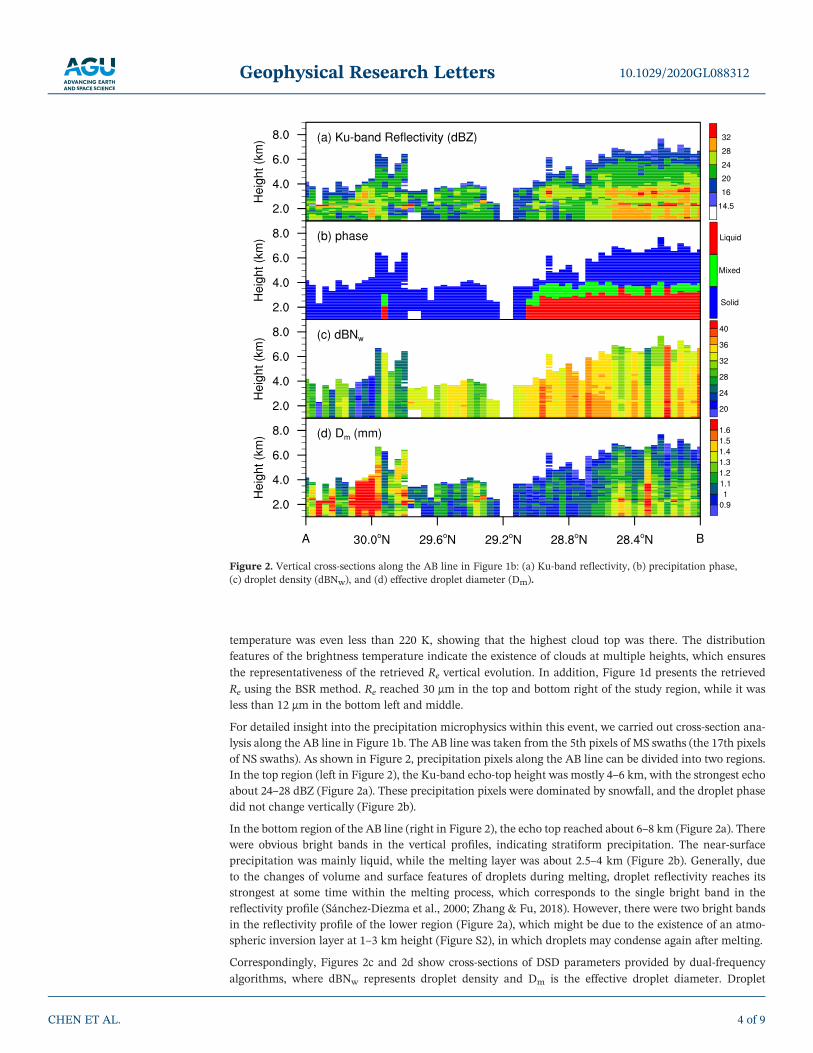
For detailed insight into the precipitation microphysics within this event, we carried out cross‐section ana-lysis along the AB line in Figure 1b. The AB line was taken from the 5th pixels of MS swaths (the 17th pixelsof NS swaths). As shown in Figure 2, precipitation pixels along the AB line can be divided into two regions.In the top region (left in Figure 2), the Ku‐band echo‐top height was mostly 4–6 km, with the strongest echoabout 24–28 dBZ (Figure 2a). These precipitation pixels were dominated by snowfall, and the droplet phasedid not change vertically (Figure 2b).
In the bottom region of the AB line (right in Figure 2), the echo top reached about 6–8 km (Figure 2a). Therewere obvious bright bands in the vertical profiles, indicating stratiform precipitation. The near‐surfaceprecipitation was mainly liquid, while the melting layer was about 2.5–4 km (Figure 2b). Generally, dueto the changes of volume and surface features of droplets during melting, droplet reflectivity reaches itsstrongest at some time within the melting process, which corresponds to the single bright band in thereflectivity profile (Sánchez‐Diezma et al., 2000; Zhang & Fu, 2018). However, there were two bright bandsin the reflectivity profile of the lower region (Figure 2a), which might be due to the existence of an atmo-spheric inversion layer at 1–3 km height (Figure S2), in which droplets may condense again after melting.
Correspondingly, Figures 2c and 2d show cross‐sections of DSD parameters provided by dual‐frequencyalgorithms, where dBNw represents droplet density and Dm is the effective droplet diameter. Droplet
Figure 2. Vertical cross‐sections along the AB line in Figure 1b: (a) Ku‐band reflectivity, (b) precipitation phase,(c) droplet density (dBNw), and (d) effective droplet diameter (Dm).
10.1029/2020GL088312Geophysical Research Letters
CHEN ET AL. 4 of 9

density of snowfall in the upper region was significantly lower than that of rainfall in the lower regionbecause of the colder and drier environment behind the cold front (Naud et al., 2015).
For the surface precipitation phase, we divided the radar observations into two categories, rainfall and snow-fall, and conducted contoured frequency by altitude diagrams (CFADs) of their Ku‐band reflectivity (Yuter& Houze, 1995). Each CFAD was normalized by its overall maximum at a horizontal interval of 1 dBZ and avertical interval of 0.25 km. Compared with normalization by level maximums (McMurdie et al., 2018), thismethod is more suitable for comparing results at different heights (Zagrodnik et al., 2019; Zhang et al., 2018).
The rainfall CFAD (Figure 3a) showed typical stratiform characteristics with five obvious turning points(marked as 0–4), which correspond to the boundaries of different microphysical processes. In stratiformprecipitations, the vertical air motion is generally small compared with fall velocities of precipitationdroplets (Houze, 1981). Precipitation droplets undergo various microphysical processes during droppingand eventually fall to the ground. The top zone from 0 to 1 corresponds to the deposition growth of icedroplets, which is the slowest microphysical growth mode. The microphysical process that occurs in thiszone is also called the Bergeron–Findeisen process, by which ice crystals form precipitation droplets andslowly grow by “grabbing” water vapor from water crystals (Bergeron, 1935; Korolev, 2007). In the layerbetween 1 and 2, ice droplets continue to grow by deposition, riming, and aggregation. The riming process,by which ice droplets directly collect cloud water which freezes on contact, significantly accelerates thegrowth rate of precipitation droplets (Rutledge & Hobbs, 1983). The zone from 2 to 4 is where the meltingprocess of precipitation droplets occurs. There was a clear bright band in this zone (Figure 3a), whichindicated the most prominent feature of stratiform precipitation (Mason, 1972).
The snowfall CFAD (Figure 3b) is similar to that for rainfall above the melting layer. There was no brightband in snowfall's CFAD, since ice droplets fall to the ground without melting. The deposition layer (points0–1) in snowfall's CFAD at 5–6.25 km is 2 km lower but equally as thick as that for rainfall at 7–8.25 km.When ice droplets fell below 5 km, the change of reflectivity accelerated, due to riming and aggregationprocesses. The reflectivity no longer increased with height below 3 km, indicating that precipitation dropletshad left the cloud.
The corresponding Re vertical evolution over the study region is shown in Figure 3c. Because cloud particlesdevelop from cloud base to top, Re increases with height, with the increase rate influenced by various cloudmicrophysics. Rosenfeld and Lensky (1998) divided Re vertical evolution into five distinct vertical zones fromcloud base to top, namely, diffusional growth zone, coalescence droplet zone, rainout zone, mixed‐phasezone, and glaciated zone. These zones do not all necessarily exist in a given cloud system, and sometimesthey may also overlap with each other (Rosenfeld & Lensky, 1998). In this case, there were three verticalcloud zones divided by two turning points (marked 0 and 1 in Figure 3c). The cloud particles in differentzones were of different size and phase properties, which showed impressive consistency within the precipi-tation partitions.
Figure 3. CFAD distributions of Ku‐band reflectivity for (a) rainfall pixels and (b) snowfall pixels and (c) the derived Re vertical evolution in the study region. Thelabels 0–4 indicate the turning points in the figures. The three lines in Figure 3c are, respectively, 25th, 50th, and 75th percentiles of Re at each 0.25 km interval.
10.1029/2020GL088312Geophysical Research Letters
CHEN ET AL. 5 of 9

The cloud zone below point 1 is the diffusional growth zone (Figure 3c) at the cloud base; the mean Re herewas about 10 μm, which hardly changed with height. Cloud particles in this zone are completely liquidincluding overcooled cloud water, which provides a favorable cloud environment for the riming growth ofprecipitation droplets (Wang & Ji, 2000).
The cloud zone between points 1 and 0 is the mixed‐phase zone (Figure 3c); Re changed rapidly with heightfrom 10 to 34 μm. The coexistence of cloud ice and cloud water in this zone is conducive to the formation ofprecipitation droplets, which corresponds to the Bergeron–Findeisen process and deposition growth ofprecipitation droplets (Bergeron, 1935). The cloud layer above point 0 is the glaciated zone, where hardlyany cloud water exists and which is inconducive to the formation or growth of precipitation droplets.
4. Discussion
The consistency of cloud zones with precipitation partitions could be additionally verified by the numericalheights of the turning points. Each turning point of the Re vertical evolution was exactly located between thecorresponding turning points in the CFADs of rainfall and snowfall. The height of point 0 was 6.25, 7.75, and8.25 km for snowfall's CFAD, Re vertical evolution, and rainfall's CFAD, respectively, and 5, 6.75, and 7 kmfor point 1.
Synergistic application of passive and active satellite sensors shows unique advantages in the research ofin‐cloud microphysical processes. Previous studies have pointed out that aerosol invigorates cold rain andsuppresses warm rain (e.g., Guo et al., 2018). Here, affected by air pollution aerosols, Re maintains ~10 μmup to 6.75 km, suppressing rain initiation (strong suppression of warm rain) below this height. The rapidincrease of Re between point 1 and point 0 makes the cloud water available for the formation of
Figure 4. Conceptual diagram of cloud and precipitation particles within this event.
10.1029/2020GL088312Geophysical Research Letters
CHEN ET AL. 6 of 9

mixed‐phase precipitation. The cloud particle size retrieved by the passive sensor is also critical. If Re is still10 μm at the homogeneous ice nucleation temperature, there will be no effective mechanism for precipita-tion formation process (Rosenfeld, Liu, et al., 2014). Figure 3c shows that the Re of this event reaches 34 μmbefore glaciation, which is undoubtedly beneficial to precipitation formation. If only the active sensor wasused, it would be a challenge to recognize the intermediary role of cloud microphysics in the aerosol‐cloud‐precipitation interaction.
In contrast, passive sensor can only measure information on the cloud surface (Chen et al., 2019). Even if thevertical evolution of Re can be obtained through appropriate assumptions, the structure at low level is stillunknown. After introducing the active sensor, in‐cloud microphysics below point 1 including riming, aggre-gation, melting, landfall, and possible evaporation can be clearly seen in Figures 3a and 3b. By combiningactive and passive sensors, a panoramic view of the microphysical processes was given simultaneously,including the vertical evolution of cloud particles from the bottom up and the formation and growth ofprecipitation droplet from the top down.
5. Conclusions
These results are summarized in the conceptual diagram in Figure 4. As the cold front passed through ourstudy region (Figure S1), the low‐level temperature changed drastically with the horizontal gradientexceeding 10°C/100 km. The Re vertical evolution and DPR profiles showed two comparable turning points(marked 0 and 1). Above point 0, the cloud microphysics is dominated by glaciation and nucleation. Cloudwater is completely frozen in this zone, which is inconducive for the formation of precipitation‐size droplets.The area between points 0 and 1 is the mixed zone with coexisting cloud ice and cloud water. Ice precipita-tion droplets begin to form and slowly grow here due to deposition (the Bergeron–Findeisen process). Belowpoint 1, cloud water dominates, and the zone provides a favorable environment for the riming growth ofprecipitation droplets. Re hardly changed with height, while radar echo increased rapidly with decreasingaltitude. Subsequent precipitation processes including melting and landfall are located at lower altitudesand often outside the clouds and therefore less related to cloud particles.
The development of China's new generation of geostationary satellites will provide observational basis forreal‐time weather monitoring and early warning systems (Yang et al., 2017). This study shows that thederived Re vertical evolution from geostationary observations can be used to identify the zones of differentcloud microphysics. Continuous spatial‐temporal observation of the vertical evolution of clouds may alsoprovide information for determining the existence and height of supercooled water in cloud (Figures S3–S5).
Data Availability Statement
The GPM 2ADPR precipitation data used in this study were collected from the Precipitation MeasurementMission website (https://pmm.nasa.gov). The ERA5 reanalysis data used in this study were collected fromthe ECMWFwebsite (https://apps.ecmwf.int/). The FY‐4A AGRI data used in this study were collected fromthe FENGYUN Satellite Data Center (http://data.nsmc.org.cn/).
ReferencesAnsmann, A., Tesche, M., Althausen, D., Müller, D., Seifert, P., Freudenthaler, V., et al. (2008). Influence of Saharan dust on cloud
glaciation in southern Morocco during the Saharan mineral dust experiment. Journal of Geophysical Research, 113, D04210. https://doi.org/10.1029/2007JD008785
Awaka, J., Iguchi, T., & Okamoto, K. (2009). TRMM PR standard algorithm 2A23 and its performance on bright band detection. Journal ofthe Meteorological Society of Japan, 87A, 31–52. https://doi.org/10.2151/jmsj.87A.31
Bergeron, T. (1935). On the physics of cloud and precipitation. In: Proceedings of the 5th assembly, U.G.G.I., Lisbon. Vol. 2. p. 156.Caliskan, F., & Hajiyev, C. (2013). A review of in‐flight detection and identification of aircraft icing and reconfigurable control. Progress in
Aerospace Sciences, 60, 12–34. https://doi.org/10.1016/j.paerosci.2012.11.001Campos Braga, R., Rosenfeld, D., Weigel, R., Jurkat, T., Andreae, M. O., Wendisch, M., et al. (2017). Further evidence for CCN aerosol
concentrations determining the height of warm rain and ice initiation in convective clouds over the Amazon basin. AtmosphericChemistry and Physics, 17(23), 14,433–14,456. https://doi.org/10.5194/acp-17-14433-2017
Chen, D., Guo, J., Yao, D., Lin, Y., Zhao, C., Min, M., et al. (2019). Mesoscale convective systems in the Asian monsoon region fromadvanced Himawari imager: Algorithms and preliminary results. Journal of Geophysical Research: Atmospheres, 124, 2210–2234.https://doi.org/10.1029/2018JD029707
Chen, Y., Chen, G., Cui, C., Zhang, A., Wan, R., Zhou, S., et al. (2020). Retrieval of the vertical evolution of the cloud effective radius fromthe Chinese FY‐4 (Feng Yun 4) next‐generation geostationary satellites. Atmospheric Chemistry and Physics, 20(2), 1131–1145.https://doi.org/10.5194/acp-20-1131-2020
10.1029/2020GL088312Geophysical Research Letters
CHEN ET AL. 7 of 9
AcknowledgmentsThis work was supported by the KeyResearch and Development Projects inGuangdong Province (grant number2019B111101002), the FundamentalResearch Funds for the GuangzhouScience and Technology Plan Project(grant number 20193010036), NationalNatural Science Foundation of China(grant numbers 41675043, 41775094,and 41405048), and the FundamentalResearch Funds for the CentralUniversities (grant numbers 18lgpy07,20lgpy19, and 20lgpy27).

Chen, Y., & Fu, Y. (2018). Tropical echo‐top height for precipitating clouds observed by multiple active instruments aboard satellites.Atmospheric Research, 199, 54–61. https://doi.org/10.1016/j.atmosres.2017.08.008
Fu, Y. (2014). Cloud parameters retrieved by the bispectral reflectance algorithm and associated applications. Journal of MeteorologicalResearch, 28(5), 965–982. https://doi.org/10.1007/s13351-014-3292-3
Geer, A. J., Baordo, F., Bormann, N., Chambon, P., English, S. J., Kazumori, M., et al. (2017). The growing impact of satellite observationssensitive to humidity, cloud and precipitation. Quarterly Journal of the Royal Meteorological Society, 143(709), 3189–3206. https://doi.org/10.1002/qj.3172
Guo, J., Liu, H., Li, Z., Rosenfeld, D., Jiang, M., Xu, W., et al. (2018). Aerosol‐induced changes in the vertical structure of precipitation: Aperspective of TRMM precipitation radar. Atmospheric Chemistry and Physics, 18(18), 13,329–13,343. https://doi.org/10.5194/acp-18-13329-2018
Houze, R. A. (1981). Structures of atmospheric precipitation systems: A global survey. Radio Science, 16(5), 671–689. https://doi.org/10.1029/RS016i005p00671
Houze, R. A., Rasmussen, K. L., Zuluaga, M. D., & Brodzik, S. R. (2015). The variable nature of convection in the tropics and subtropics: Alegacy of 16 years of the Tropical Rainfall Measuring Mission satellite. Reviews of Geophysics, 53, 994–1021. https://doi.org/10.1002/2015RG000488
Iguchi, T., Seto, S., Meneghini, R., Yoshida, N., Awaka, J., Kubota, T., et al. (2012). An overview of the precipitation retrieval algorithm forthe dual‐frequency precipitation radar (DPR) on the global precipitation measurement (GPM) mission's core satellite. Proceedings ofSPIE, 8528, 85281C. https://doi.org/10.1117/12.977352
King, N. J., & Vaughan, G. (2012). Using passive remote sensing to retrieve the vertical variation of cloud droplet size in marine strato-cumulus: An assessment of information content and the potential for improved retrievals from hyperspectral measurements. Journal ofGeophysical Research, 117, D15206. https://doi.org/10.1029/2012JD017896
Korolev, A. (2007). Limitations of the wegener‐bergeron‐findeisen mechanism in the evolution of mixed‐phase clouds. Journal of theAtmospheric Sciences, 64(9), 3372–3375. https://doi.org/10.1175/JAS4035.1
Lensky, I. M., & Rosenfeld, D. (2006). The time‐space exchangeability of satellite retrieved relations between cloud top temperature andparticle effective radius. Atmospheric Chemistry and Physics, 6(10), 2887–2894. https://doi.org/10.5194/acp-6-2887-2006
Mason, B. J. (1972). The Bakerian Lecture, 1971. The physics of the thunderstorm. Proceedings of the Royal Society of London. Series A:Mathematical and Physical Sciences, 327(1571), 433–466. https://doi.org/10.1098/rspa.1972.0056
McMurdie, L. A., Rowe, A. K., Houze, R. A., Brodzik, S. R., Zagrodnik, J. P., & Schuldt, T. M. (2018). Terrain‐enhanced precipitationprocesses above the melting layer: Results from OLYMPEX. Journal of Geophysical Research: Atmospheres, 123, 12,194–12,209.https://doi.org/10.1029/2018JD029161
Min, M., Wu, C., Li, C., Liu, H., Xu, N., Wu, X., et al. (2017). Developing the science product algorithm testbed for Chinese next‐generationgeostationary meteorological satellites: Fengyun‐4 series. Journal of Meteorological Research, 31(4), 708–719. https://doi.org/10.1007/s13351-017-6161-z
Naud, C. M., Posselt, D. J., & van den Heever, S. C. (2015). A CloudSat‐CALIPSO view of cloud and precipitation properties across coldfronts over the global oceans. Journal of Climate, 28(17), 6743–6762. https://doi.org/10.1175/JCLI-D-15-0052.1
Platnick, S. (2000). Vertical photon transport in cloud remote sensing problems. Journal of Geophysical Research, 105(D18), 22,919–22,935.https://doi.org/10.1029/2000JD900333
Rosenfeld, D., Andreae, M. O., Asmi, A., Chin, M., De Leeuw, G., Donovan, D. P., et al. (2014). Global observations of aerosol‐cloud‐precipitation‐climate interactions. Reviews of Geophysics, 52, 750–808. https://doi.org/10.1002/2013RG000441
Rosenfeld, D., Fromm, M., Trentmann, J., Luderer, G., Andreae, M. O., & Servranckx, R. (2007). The Chisholm firestorm: Observedmicrostructure, precipitation and lightning activity of a pyro‐cumulonimbus. Atmospheric Chemistry and Physics, 7(3), 645–659.https://doi.org/10.5194/acp-7-645-2007
Rosenfeld, D., & Lensky, I. M. (1998). Satellite‐based insights into precipitation formation processes in continental andmaritime convectiveclouds. Bulletin of the American Meteorological Society, 79(11), 2457–2476. https://doi.org/10.1175/1520-0477(1998)079<2457:SBIIPF>2.0.CO;2
Rosenfeld, D., Liu, G., Yu, X., Zhu, Y., Dai, J., Xu, X., & Yue, Z. (2014). High‐resolution (375 m) cloud microstructure as seen from theNPP/VIIRS satellite imager. Atmospheric Chemistry and Physics, 14(5), 2479–2496. https://doi.org/10.5194/acp-14-2479-2014
Rosenfeld, D., & Woodley, W. L. (2003). Closing the 50‐year circle: From cloud seeding to space and back to climate change throughprecipitation physics. In: Tao, WeiKuo, Adler, Robert (Eds.), Cloud systems, hurricanes, and the Tropical Rainfall Measuring Mission(TRMM) (pp). AMS, Boston. 234 p, pp. 59–80, meteorological monographs 51 (Chapter 6).
Rudich, Y., Khersonsky, O., & Rosenfeld, D. (2002). Treating clouds with a grain of salt. Geophysical Research Letters, 29(22), 2060.https://doi.org/10.1029/2002GL016055
Rutledge, S. A., & Hobbs, P. V. (1983). The mesoscale and microscale structure and organization of clouds and precipitation in midlatitudecyclones. VIII. A model for the ‘seeder‐feeder’ process in warm‐frontal rainbands. Journal of the Atmospheric Sciences, 40(5), 1185–1206.https://doi.org/10.1175/1520-0469(1983)040<1185:TMAMSA>2.0.CO;2
Sánchez‐Diezma, R., Zawadzki, I., & Sempere‐Torres, D. (2000). Identification of the bright band through the analysis of volumetric radardata. Journal of Geophysical Research, 105(D2), 2225–2236. https://doi.org/10.1029/1999JD900310
Stephens, G. L., Vane, D. G., Boain, R. J., Mace, G. G., Sassen, K., Wang, Z., et al. (2002). The cloudsat mission and the A‐Train: A newdimension of space‐based observations of clouds and precipitation. Bulletin of the American Meteorological Society, 83(12), 1771–1790.https://doi.org/10.1175/BAMS-83-12-1771
Stephens, G. L., Vane, D. G., Tanelli, S., Im, E., Durden, S., Rokey, M., et al. (2008). CloudSat mission: Performance and early science afterthe first year of operation. Journal of Geophysical Research, 113, D00A18. https://doi.org/10.1029/2008JD009982
Sun, Z., Thilakavathy, K., Kumar, S. S., He, G., & Liu, S. V. (2020). Potential factors influencing repeated SARS outbreaks in China.International Journal of Environmental Research and Public Health, 17(5), 1633. https://doi.org/10.3390/ijerph17051633
Wang, P. K., & Ji, W. (2000). Collision efficiencies of ice crystals at low‐intermediate Reynolds numbers colliding with supercooled clouddroplets: A numerical study. Journal of the Atmospheric Sciences, 57(8), 1001–1009. https://doi.org/10.1175/1520-0469(2000)057<1001:CEOICA>2.0.CO;2
Winker, D. M., Vaughan, M. A., Omar, A., Hu, Y., Powell, K. A., Liu, Z., et al. (2009). Overview of the CALIPSO mission and CALIOP dataprocessing algorithms. Journal of Atmospheric and Oceanic Technology, 26(11), 2310–2323. https://doi.org/10.1175/2009JTECHA1281.1
Woodley, W. L., Rosenfeld, D., Kelman, G., & Golden, J. H. (2008). Short‐term forecasting of severe convective storms using quantitativemulti‐spectral, satellite imagery: Results of the early alert project. In: 24th Conference on Severe Local Storms, 27–31 October 2008,Savannah, Georgia.
10.1029/2020GL088312Geophysical Research Letters
CHEN ET AL. 8 of 9

Yang, J., Zhang, Z., Wei, C., Lu, F., & Guo, Q. (2017). Introducing the new generation of Chinese geostation ary weat her satellites,Fengyun‐4. Bulletin of the American Meteorological Society, 98(8), 1637–1658. https://doi.org/10.1175/BAMS-D-16-0065.1
Yuter, S. E., & Houze, R. A. (1995). 3‐dimensional kinematic and microphysical evolution of Florida cumulonimbus. Part II:Frequency‐distributions of vertical velocity, reflectivity, and differential reflectivity. Monthly Weather Review, 123, 1941–1963.https://doi.org/10.1175/1520-0493(1995)123<1941:TDKAME>2.0.CO;2
Zagrodnik, J. P., McMurdie, L. A., Houze, R. A., & Tanelli, S. (2019). Vertical structure and microphysical characteristics of frontal systemspassing over a three‐dimensional coastal mountain range. Journal of the Atmospheric Sciences, 76(6), 1521–1546. https://doi.org/10.1175/JAS-D-18-0279.1
Zhang, A., & Fu, Y. (2018). Life cycle effects on the vertical structure of precipitation in East China measured by Himawari‐8 and GPMDPR. Monthly Weather Review, 146(7), 2183–2199. https://doi.org/10.1175/MWR-D-18-0085.1
Zhang, A., Fu, Y., Chen, Y., Liu, G., & Zhang, X. (2018). Impact of the surface wind flow on precipitation characteristics over the southernHimalayas: GPM observations. Atmospheric Research, 202, 10–22. https://doi.org/10.1016/j.atmosres.2017.11.001
Zheng, Y., & Rosenfeld, D. (2015). Linear relation between convective cloud base height and updrafts and application to satellite retrievals.Geophysical Research Letters, 42, 6485–6491. https://doi.org/10.1002/2015GL064809
10.1029/2020GL088312Geophysical Research Letters
CHEN ET AL. 9 of 9