link.springer.com · web viewsupporting material simulation of average energy expenditures and...
TRANSCRIPT

Supporting MaterialSIMULATION OF AVERAGE ENERGY EXPENDITURES
AND RELATED INHALATION RATESFOR THE U.S. POPULATION
Air Quality, Atmosphere and HealthDavid W. Layton
Community, Environment and PolicyMel and Enid Zuckerman College of Public Health
University of Arizona, AZ, USA
E-mail address: [email protected]
Contents
Page 2 Table S-1. Infant respiratory data for determining VQPage 5 Table S-2. Respiratory data for children and adolescentsPage 7 Table S-3 Adult respiratory data for characterizing the statistical distribution of VQPage 10 Table S-4. Data on resting metabolic rates for male and female childrenPage 12 Table S-5. Body weights and TDEE values for male children given in Torun (2005)Page 13 Table S-6. Body weights and TDEE values from additional DLW studies for male childrenPage 14 Table S-7. Summary of DLW studies for adult malesPage 15 Table S-8. Body weights and TDEE values for female children given in Torun (2005)Page 16 Table S-9. Body weights and TDEE values from additional DLW studies for female childrenPage 17 Table S-10. Summary of DLW studies for adult femalesPage 19 References
Acronyms
AM = arithmetic meanBTPS = body temperature and pressure, air saturated with waterBW = body weightDLW = doubly labeled waterGM = geometric meanGSD = geometric standard deviationrO2 = oxygen uptake raterVe = inhalation rateRMR = resting metabolic rateSD = standard deviationSTPD = standard temperature and pressure, dry airTDEE = total daily energy expenditureVQ = ventilatory equivalent for oxygen
1

Table S-1. Infant respiratory data for determining VQ.
rVe at BTPS rO2 at STPDSource Subject id. L/min L/min VQ(Cook et al. 1955) 48 0.600 0.0178 33.6(Cook et al. 1955) 51 0.498 0.0175 28.4(Cook et al. 1955) 56 0.825 0.0297 27.7(Cook et al. 1955) 58 0.418 0.0164 25.6(Cook et al. 1955) 60 0.751 0.0188 39.9(Cook et al. 1955) 61 0.835 0.0167 50.0(Cook et al. 1955) 62 0.465 0.0202 23.1(Cook et al. 1955) 63 0.486 0.0168 29.0(Cook et al. 1955) 65 0.562 0.0164 34.2(Cook et al. 1955) 66 0.578 0.0211 27.4(Cook et al. 1955) 68 0.590 0.0232 25.4(Cook et al. 1955) 69 0.383 0.0182 21.1(Cook et al. 1955) 71 0.463 0.0173 26.7(Cook et al. 1955) 76 0.676 0.0204 33.1(Cook et al. 1955) 80 0.435 0.0152 28.6(Cook et al. 1955) 83 0.543 0.0183 29.6(Cook et al. 1955) 84 0.480 0.0144 33.4(Cook et al. 1955) 86 0.444 0.0122 36.3(Stahlman and Meece 1957) 240177 0.63 0.0220 28.6(Stahlman and Meece 1957) 240316 0.50 0.0180 27.8(Stahlman and Meece 1957) 240316 0.44 0.0170 25.9(Stahlman and Meece 1957) 240408 0.39 0.0170 22.9(Stahlman and Meece 1957) 230465 0.69 0.0270 25.6(Stahlman and Meece 1957) 240696 0.53 0.0140 37.9(Stahlman and Meece 1957) 240960 0.48 0.0150 32.0(Stahlman and Meece 1957) 241058 0.53 0.0190 27.9(Stahlman and Meece 1957) 241221 0.28 0.0140 20.0(Stahlman and Meece 1957) 241259 0.36 0.0210 17.1(Stahlman and Meece 1957) 241356 0.28 0.0160 17.5(Stahlman and Meece 1957) 241362 0.63 0.0230 27.4(Stahlman and Meece 1957) 241469 0.64 0.0200 32.0(Stahlman and Meece 1957) 241614 0.38 0.0180 21.1(Stahlman and Meece 1957) 241681 0.45 0.0200 22.5(Stahlman and Meece 1957) 241758 0.55 0.0240 22.9(Stahlman and Meece 1957) 241877 0.52 0.0170 30.6(Stahlman and Meece 1957) 242026 0.49 0.0200 24.5(Stahlman and Meece 1957) 242068 0.58 0.0260 22.3(Stahlman and Meece 1957) 242510 0.72 0.0240 30.0(Stahlman and Meece 1957) 242570 0.57 0.0230 24.8(Stahlman and Meece 1957) 242574 0.58 0.0240 24.2(Stahlman and Meece 1957) 242676 0.76 0.0270 28.1(Stahlman and Meece 1957) 242811 0.47 0.0170 27.6(Stahlman and Meece 1957) 242861 0.64 0.0210 30.5(Stahlman and Meece 1957) 242971 0.44 0.0180 24.4(Stahlman and Meece 1957) 243519 0.28 0.0130 21.5(Stahlman and Meece 1957) 243651 0.42 0.0150 28.0(Stahlman and Meece 1957) 243771 0.51 0.0180 28.3(Stahlman and Meece 1957) 243933 0.44 0.0140 31.4
2

Table S-1., continued rVe at BTPS rO2 at STPDSource Subject id. L/min L/min VQ(Stahlman and Meece 1957) 244135 0.65 0.0200 32.5(Stahlman and Meece 1957) 244194 0.51 0.0170 30.0(Stahlman and Meece 1957) 244570 0.42 0.0170 24.7(Stahlman and Meece 1957) 244657 0.54 0.0190 28.4(Stahlman and Meece 1957) 244779 0.54 0.0200 27.0(Stahlman and Meece 1957) 244923 0.32 0.0120 26.7(Stahlman and Meece 1957) 245086 0.28 0.0140 20.0(Stahlman and Meece 1957) 247612 0.27 0.0050 54.0(Stahlman and Meece 1957) 247533 0.36 0.0130 27.7(Stahlman and Meece 1957) 247696 0.70 0.0160 43.8(Stahlman and Meece 1957) 247909 0.22 0.0070 31.4(Stahlman and Meece 1957) 248502 0.15 0.0040 37.5(Stahlman and Meece 1957) 221824 0.71 0.0130 54.6(Stahlman and Meece 1957) 248729 0.29 0.0080 36.3(Cross et al. 1957) 1 0.352 0.0215 16.4(Cross et al. 1957) 2 0.609 0.0279 21.8(Cross et al. 1957) 3 0.459 0.0257 17.8(Cross et al. 1957) 3 0.549 0.0240 22.9(Cross et al. 1957) 4 0.439 0.0218 20.1(Cross et al. 1957) 5 0.415 0.0214 19.4(Cross et al. 1957) 6 0.383 0.0207 18.5(Cross et al. 1957) 7 0.446 0.0211 21.1(Cross et al. 1957) 8 0.564 0.0207 27.2(Cross et al. 1957) 9 0.393 0.0219 17.9(Cross et al. 1957) 10 0.684 0.0203 33.7(Cross et al. 1957) 11 0.539 0.0216 25.0(Cross et al. 1957) 12 0.426 0.0207 20.5(Cross et al. 1957) 13 0.483 0.0213 22.7(Cross et al. 1957) 14 0.478 0.0193 24.7(Cross et al. 1957) 15 0.506 0.0238 21.3(Cross et al. 1957) 16 0.679 0.0244 27.9(Cross et al. 1957) 17 0.504 0.0190 26.5(Cross et al. 1957) 18 0.515 0.0233 22.1(Cross et al. 1957) 19 0.497 0.0214 23.2(Cross et al. 1957) 20 0.404 0.0207 19.5(Cross et al. 1957) 21 0.427 0.0220 19.4(Cross et al. 1957) 22 0.513 0.0257 19.9(Cross et al. 1957) 23 0.516 0.0205 25.1(Cross et al. 1957) 24 0.467 0.0224 20.8(Cross et al. 1957) 25 0.434 0.0238 18.2(Cross et al. 1957) 26 0.457 0.0249 18.4(Cross et al. 1957) 27 0.508 0.0188 27.0(Cross et al. 1957) 27 0.511 0.0234 21.8(Cross et al. 1957) 28 0.364 0.0157 23.2(Cross et al. 1957) 29 0.517 0.0244 21.2(Cross et al. 1957) 29 0.519 0.0243 21.3(Cross et al. 1957) 29 0.555 0.0244 22.8(Cross et al. 1957) 30 0.541 0.0227 22.2(Cross et al. 1957) 31 0.528 0.0234 21.6(Cross et al. 1957) 32 0.456 0.0227 20.1
3

Table S-1., completed r Ve at BTPS rO2 at STPDSource Subject id. L/min L/min VQ(Cross et al. 1957) 33 0.480 0.0205 20.5(Cross et al. 1957) 34 0.627 0.0246 27.7(Cross et al. 1957) 35 0.507 0.0226 24.7(Cross et al. 1957) 36 0.333 0.0200 13.6(Cross et al. 1957) 37 0.468 0.0280 20.7(Cross et al. 1957) 38 0.375 0.0232 18.8(Cross et al. 1957) 38 0.543 0.0269 19.4(Cross et al. 1957) 39 0.633 0.0300 27.3(Cross et al. 1957) 40 0.497 0.0246 18.5(Cross et al. 1957) 41 0.478 0.0239 15.9(Cross et al. 1957) 42 0.329 0.0170 13.4(Nelson et al. 1962) 1 0.422 0.0130 32.5(Nelson et al. 1962) 1 0.566 0.0175 32.3(Nelson et al. 1962) 1 0.524 0.0190 27.6(Nelson et al. 1962) 2 0.330 0.0153 21.6(Nelson et al. 1962) 3 0.463 0.0159 29.1(Nelson et al. 1962) 3 0.475 0.0172 27.6(Nelson et al. 1962) 4 0.298 0.0068 43.8(Nelson et al. 1962) 4 0.192 0.0061 31.5(Nelson et al. 1962) 5 0.365 0.0060 60.8(Nelson et al. 1962) 6 0.323 0.0094 34.4(Nelson et al. 1962) 6 0.269 0.0097 27.7(Nelson et al. 1962) 6 0.280 0.0088 31.8(Nelson et al. 1962) 7 0.154 0.0063 24.4(Nelson et al. 1962) 7 0.429 0.0107 40.1(Nelson et al. 1962) 8 0.371 0.0084 44.2(Nelson et al. 1962) 8 0.265 0.0067 39.6(Nelson et al. 1962) 8 0.213 0.0080 26.6(Nelson et al. 1962) 8 0.131 0.0063 20.8(Nelson et al. 1962) 8 0.233 0.0083 28.1(Nelson et al. 1962) 9 0.886 0.0320 27.7(Nelson et al. 1962) 10 0.750 0.0194 38.7(Nelson et al. 1962) 11 0.933 0.0250 37.3(Nelson et al. 1962) 12 0.753 0.0231 32.6(Nelson et al. 1962) 13 0.505 0.0147 34.4(Nelson et al. 1962) 14 1.078 0.0251 42.9(Nelson et al. 1962) 15 0.641 0.0168 38.2(Nelson et al., 1962) 16 0.837 0.0217 38.6(Nelson et al. 1962) 17 0.740 0.0187 39.6(Nelson et al. 1962) 18 0.395 0.0128 30.9(Nelson et al. 1962) 18 0.376 0.0151 24.9(Nelson et al. 1962) 19 0.416 0.0154 27.0(Nelson et al. 1962) 19 0.547 0.0156 35.1(Nelson et al. 1962) 20 0.378 0.0137 27.6(Nelson et al. 1962) 21 0.365 0.0119 30.7(Nelson et al. 1962) 22 0.660 0.0209 31.6(Nelson et al. 1962) 23 0.544 0.0144 37.8(Nelson et al. 1962) 24 0.621 0.0160 38.8(Nelson et al. 1962) 25 0.528 0.0157 33.6
4

Table S-2. Respiratory data for children and adolescents.
Age, y rO2, L/min rVe, L/min VQ, unitless
Oxygen uptake level/source n AM GM AM SD GM AM SD GMrO2 ≤ 1.5 L/min(Knuttgen 1967) 95 17 0.2 5.5 1.1 5.4 26.9 3.9 26.6(Knuttgen 1967) 95 17 0.3 7.5 1.9 7.3 27.3 6.2 26.6(Kawahara et al. 2011)a 27 7 0.3 0.51 0.12 0.49 30.7 6.32 30.0(Guimarães et al. 2001) 12 10 0.6 23.3 7.2 22.3 35.0 4.7 34.7(Potter et al. 1999) 24 13 0.8 20.7 26.1 2.2 26.0(Rutenfranz et al. 1981) 32 8 0.9 27.2 6.5 26.5 30.3 3.2 30.1(Borel et al. 2011) 11 9 0.9 28.6 7.5 27.7 31.8 3.3 31.6(Rutenfranz et al. 1981) 33 9 1.1 32.4 6.6 31.7 29.5 3.5 29.3(Rowland and Cunningham 1997) 9 9 1.1 34.9 10.0 33.5 32.3 5.1 31.9(Rutenfranz et al. 1981) 29 8 1.1 31.4 6.6 30.7 29.0 3.3 28.8(Rowland and Cunningham 1997) 11 9 1.1 34.2 5.0 33.8 31.5 5.1 31.0(Rutenfranz et al. 1981) 18 16 1.1 34.7 6.1 34.2 31.6 3.2 31.4(Rowland and Cunningham 1997) 9 10 1.1 36.6 12.5 34.6 30.9 2.5 30.8(Rutenfranz et al. 1981) 23 15 1.1 36.6 7.7 35.8 31.4 3.0 31.3(Rutenfranz et al. 1981) 24 12 1.2 36.2 7.6 35.4 30.8 4.4 30.5(Rutenfranz et al. 1981) 19 17 1.2 36.2 7.1 35.5 30.5 3.3 30.3(Rutenfranz et al. 1981) 34 10 1.2 36.9 7.2 36.2 30.4 3.5 30.2(Rutenfranz et al. 1981) 22 14 1.2 37.3 8.4 36.4 30.8 3.6 30.6(Rowland and Cunningham 1997) 9 11 1.2 40.2 17.6 36.8 30.7 3.9 30.4(Rowland and Cunningham 1997) 11 10 1.3 36.0 5.5 35.6 28.6 3.1 28.4(Armstrong et al. 1997) 76 11 1.3 30.8 5.8 30.2 24.2 2.6 24.1(Rowland and Cunningham 1997) 9 12 1.3 40.2 14.0 38.0 30.2 1.9 30.1(Rutenfranz et al. 1981) 29 9 1.3 35.6 10.7 34.1 27.1 3.9 26.8(Rutenfranz et al. 1981) 28 12 1.3 38.7 7.0 38.1 30.0 3.5 29.8(Rutenfranz et al. 1981) 31 10 1.3 36.9 7.6 36.1 28.0 3.2 27.8(Armstrong et al. 1997) 101 11 1.3 30.9 7.1 30.1 23.0 2.9 22.8(Rutenfranz et al. 1981) 24 13 1.3 42.9 7.7 42.2 32.0 4.5 31.7(Armstrong et al. 1997) 76 11 1.3 33.5 5.8 33.0 24.6 2.1 24.5(Rutenfranz et al. 1981) 34 11 1.4 39.1 6.2 38.6 29.0 3.2 28.8(Rowland and Cunningham 1997) 11 11 1.4 39.7 9.2 38.7 28.3 2.8 28.1(Rutenfranz et al. 1981) 18 16 1.4 43.6 8.3 42.8 31.1 3.6 30.9(Rowland and Green 1988) 18 11 1.4 28.3 3.2 28.1(Rowland and Cunningham 1997) 11 12 1.4 39.8 9.6 38.7 27.7 2.9 27.6(Rowland and Cunningham 1997) 9 13 1.4 43.4 16.2 40.7 29.1 2.3 29.0(Armstrong et al. 1997) 101 11 1.4 34.1 7.3 33.4 23.6 2.8 23.4(Armstrong et al. 1997) 76 11 1.5 39.2 7.2 38.5 26.5 2.6 26.4(Rutenfranz et al. 1981) 19 17 1.5 47.6 8.1 46.9 31.2 3.4 31.0(Rowland and Cunningham, 1997) 11 13 1.5 40.8 10.6 39.5 26.3 2.7 26.2(Rutenfranz et al. 1981) 24 12 1.5 47.8 10.5 46.7 31 4.1 30.7(Rutenfranz et al. 1981) 22 14 1.5 48.7 7.9 48.1 31.5 3.2 31.3(Rutenfranz et al. 1981) 29 11 1.5 43.6 7.5 43 28.1 3.3 27.9(Rutenfranz et al. 1981) 26 13 1.5 47.1 7.5 46.5 30.4 3.4 30.2(Armstrong et al., 1997) 101 11 1.5 39 8.7 38 24.8 2.9 24.6rO2 > 1.5 L/min(Rutenfranz et al. 1981) 23 15 1.6 47.9 6.8 47.4 30.5 2.6 30.4(Armstrong et al. 1997) 76 11 1.6 44.4 7.4 43.8 28.1 2.6 28.0(Rutenfranz et al. 1981) 24 13 1.6 54.2 10 53.3 33.7 4.1 33.5(Rutenfranz et al. 1981) 26 14 1.7 49.9 11.8 48.6 29.3 3.4 29.1(Armstrong et al. 1997) 101 11 1.7 44.3 9.7 43.2 26.1 3.2 25.9(Rutenfranz et al. 1981) 30 12 1.7 49.4 9.5 48.5 28.3 2.8 28.2(Rutenfranz et al. 1981) 28 12 1.7 52.5 9.2 51.7 30 3.3 29.8
5

Table S-2 completed Age, y rO2, L/min rVe, L/min VQ, unitless
Oxygen uptake level/source n AM GM AM SD GM AM SD GM(Rutenfranz et al. 1981) 32 13 1.7 53 9.6 52.2 28.9 3.4 28.7(Rutenfranz et al. 1981) 26 16 1.8 58.3 13.7 56.8 31.3 3.5 31.1(Rutenfranz et al. 1981) 27 13 1.8 59.4 9 58.7 32 3.8 31.8(Rutenfranz et al. 1981) 27 15 1.9 58.1 13.9 56.5 30.8 4.6 30.5(Rutenfranz et al. 1981) 34 12 1.9 45.2 6.8 44.7 27.6 2.2 27.5(Rutenfranz et al. 1981) 30 15 1.9 56.5 9.7 55.7 31.9 3.4 31.7(Rutenfranz et al. 1981) 26 17 1.9 53.6 11.1 52.5 28.1 4.5 27.7(Rutenfranz et al. 1981) 32 14 2.0 54.1 9.6 53.3 31.9 3 31.8(Rutenfranz et al. 1981) 29 13 2.0 55.8 11.4 54.7 27.4 3.5 27.2(Rutenfranz et al. 1981) 26 14 2.1 62.8 13 61.5 29.8 3.5 29.6(Rutenfranz et al. 1981) 27 14 2.2 65.1 13.2 63.8 29.6 3.3 29.4(Rutenfranz et al. 1981) 26 16 2.2 70.3 15.5 68.7 31.6 3.6 31.4(Rutenfranz et al. 1981) 27 15 2.2 71.8 15.1 70.3 31.5 3.9 31.3(Rutenfranz et al. 1981) 27 15 2.2 66.8 15.3 65.1 29.1 3 28.9(Rutenfranz et al. 1981) 26 17 2.3 68.1 12.6 67 28.7 2.8 28.6aResults are based on a pooled mean and standard deviation for all activity levels.
6

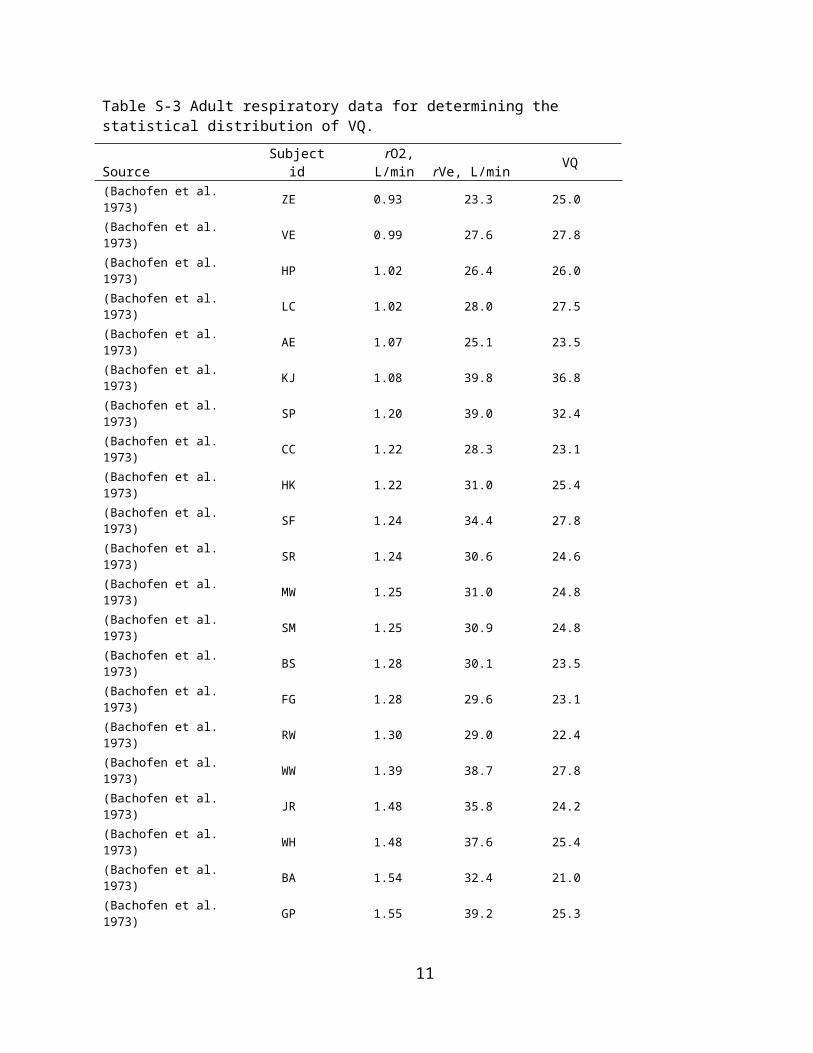
Table S-3 Adult respiratory data for determining the statistical distribution of VQ.
Source Subject id rO2, L/min rVe, L/min VQ
(Bachofen et al. 1973) ZE 0.93 23.3 25.0
(Bachofen et al. 1973) VE 0.99 27.6 27.8
(Bachofen et al. 1973) HP 1.02 26.4 26.0
(Bachofen et al. 1973) LC 1.02 28.0 27.5
(Bachofen et al. 1973) AE 1.07 25.1 23.5
(Bachofen et al. 1973) KJ 1.08 39.8 36.8
(Bachofen et al. 1973) SP 1.20 39.0 32.4
(Bachofen et al. 1973) CC 1.22 28.3 23.1
(Bachofen et al. 1973) HK 1.22 31.0 25.4
(Bachofen et al. 1973) SF 1.24 34.4 27.8
(Bachofen et al. 1973) SR 1.24 30.6 24.6
(Bachofen et al. 1973) MW 1.25 31.0 24.8
(Bachofen et al. 1973) SM 1.25 30.9 24.8
(Bachofen et al. 1973) BS 1.28 30.1 23.5
(Bachofen et al. 1973) FG 1.28 29.6 23.1
(Bachofen et al. 1973) RW 1.30 29.0 22.4
(Bachofen et al. 1973) WW 1.39 38.7 27.8
(Bachofen et al. 1973) JR 1.48 35.8 24.2
(Bachofen et al. 1973) WH 1.48 37.6 25.4
(Bachofen et al. 1973) BA 1.54 32.4 21.0
(Bachofen et al. 1973) GP 1.55 39.2 25.3
(Bachofen et al. 1973) NU 1.61 44.6 27.7
(Bachofen et al. 1973) GK 1.76 44.6 25.3
(Bachofen et al. 1973) SH 1.80 48.7 27.0
7

(Bachofen et al. 1973) BM 1.22 27.1 22.2
(Cohn et al. 1954) RS 1.59 39.1 24.6
(Cohn et al. 1954) RS 2.06 50.6 24.6
(Cohn et al. 1954) PMcC 0.83 21.3 25.7
(Cohn et al. 1954) PW 1.07 26.2 24.6
(Cohn et al. 1954) CS 1.34 33.9 25.3
(Cohn et al. 1954) RO 1.59 41.7 26.3
(Cohn et al. 1954) DH 1.55 34.9 22.6
(Cohn et al. 1954) MR 1.90 46.4 24.4
(Cohn et al. 1954) WR 0.85 27.4 32.4
(Cohn et al. 1954) WJ 1.43 37.4 26.1
(Cohn et al. 1954) CW 1.17 28.9 24.8
(Cohn et al. 1954) EG 0.82 21.9 26.6
(Cohn et al. 1954) BG 0.69 20.4 29.6
(Cohn et al. 1954) Eguy 0.67 19.0 28.6
(Cohn et al. 1954) EB 0.77 27.3 35.6
(Cohn et al. 1954) JC 0.65 18.3 28.0
(Cohn et al. 1954) JC 1.42 33.3 23.5
(Cohn et al. 1954) BA 1.86 46.2 24.8
(Cohn et al. 1954) FL 1.84 50.8 27.6
(Cohn et al. 1954) DC 1.26 24.8 19.6
(Cohn et al. 1954) DC 1.38 24.5 17.7
(Cohn et al. 1954) RLR 1.58 37.3 23.6
(Damato et al. 1966) 1 0.79 17.1 21.7
(Damato et al. 1966) 2 1.12 19.9 17.7
8

(Damato et al. 1966) 3 0.86 21.4 24.9
(Damato et al. 1966) 4 0.85 18.5 21.7
(Damato et al. 1966) 5 0.89 30.4 34.4
(Damato et al. 1966) 6 1.23 40.3 32.8
(Damato et al. 1966) 7 1.14 20.5 17.9
(Damato et al. 1966) 8 1.34 29.0 21.6
(Damato et al. 1966) 9 1.02 32.3 31.7
Table S-3 ContinuedSource Subject id rO2, L/min rVe, L/min VQ
(Damato et al. 1966) 10 0.90 23.8 26.6
(Damato et al. 1966) 11 1.01 29.1 28.7
(Damato et al. 1966) 12 0.82 21.6 26.4
(Damato et al. 1966) 13 1.10 24.9 22.7
(Damato et al. 1966) 14 0.86 28.4 33.0
(Damato et al. 1966) 15 0.87 21.0 24.2
(Damato et al. 1966) 16 0.90 25.5 28.4
(Damato et al. 1966) 17 0.82 28.1 34.2
(Damato et al. 1966) 18 1.02 23.9 23.4
(Damato et al. 1966) 19 0.83 18.7 22.6
(Damato et al. 1966) 20 0.96 27.2 28.4
(Damato et al. 1966) 21 0.87 20.9 23.9
(Damato et al. 1966) 24 1.00 23.5 23.5
(Damato et al. 1966) 2 1.98 38.0 19.2
(Damato et al. 1966) 5 1.52 33.2 21.8
(Damato et al. 1966) 6 1.87 56.3 30.1
(Damato et al. 1966) 7 1.97 37.3 18.9
9

(Damato et al. 1966) 9 1.68 42.3 25.2
(Damato et al. 1966) 10 1.63 44.6 27.3
(Damato et al. 1966) 11 1.86 52.1 28.0
(Damato et al. 1966) 12 1.55 45.2 29.2
(Damato et al. 1966) 13 1.56 39.6 25.5
(Damato et al. 1966) 14 1.37 37.0 27.1
(Damato et al. 1966) 15 1.63 45.7 28.0
(Damato et al. 1966) 16 1.58 51.8 32.9
(Damato et al. 1966) 17 0.94 32.3 34.2
(Damato et al. 1966) 19 1.62 36.7 22.7
(Damato et al. 1966) 20 1.65 44.4 26.8
(Damato et al. 1966) 21 1.61 42.7 26.5
(Damato et al. 1966) 24 1.76 37.6 21.4
(Filley et al. 1954) 80 0.11 2.3 20.9
(Filley et al. 1954) 96 0.17 4.8 27.6
(Filley et al. 1954) 82 0.21 5.6 27.2
(Filley et al. 1954) 84 0.22 5.2 23.8
(Filley et al. 1954) 2 0.25 8.8 35.2
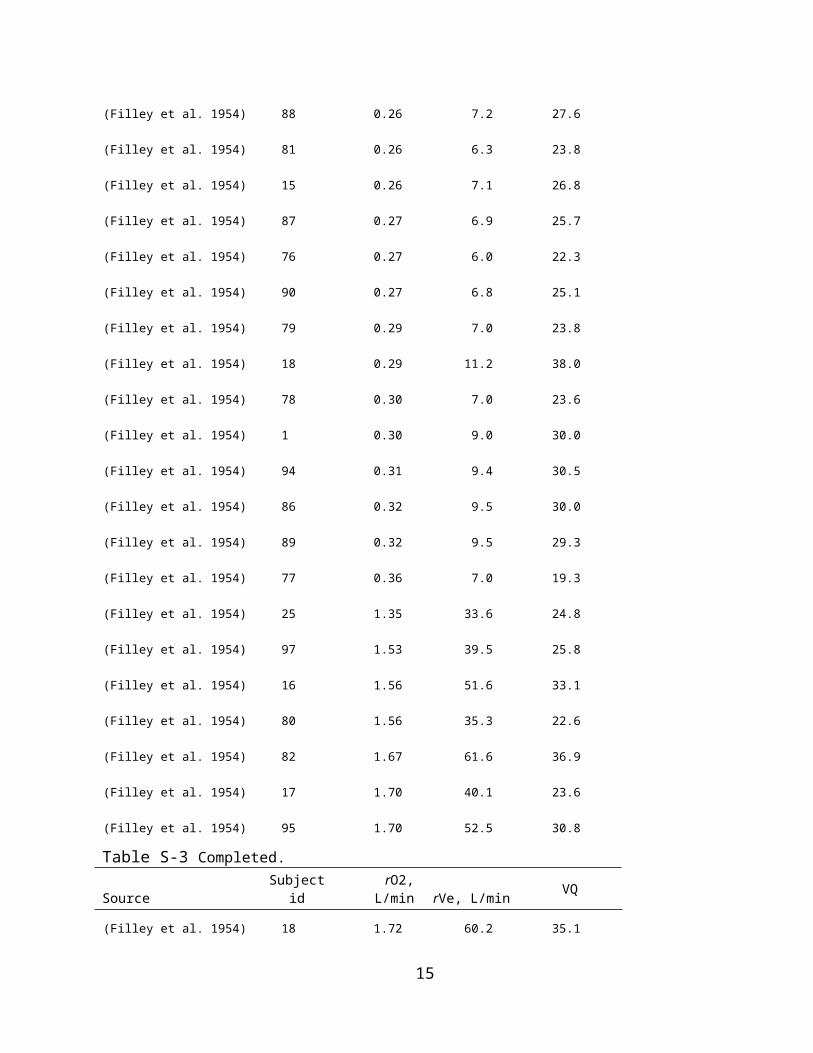
(Filley et al. 1954) 88 0.26 7.2 27.6
(Filley et al. 1954) 81 0.26 6.3 23.8
(Filley et al. 1954) 15 0.26 7.1 26.8
(Filley et al. 1954) 87 0.27 6.9 25.7
(Filley et al. 1954) 76 0.27 6.0 22.3
(Filley et al. 1954) 90 0.27 6.8 25.1
(Filley et al. 1954) 79 0.29 7.0 23.8
10
(Filley et al. 1954) 18 0.29 11.2 38.0
(Filley et al. 1954) 78 0.30 7.0 23.6
(Filley et al. 1954) 1 0.30 9.0 30.0
(Filley et al. 1954) 94 0.31 9.4 30.5
(Filley et al. 1954) 86 0.32 9.5 30.0
(Filley et al. 1954) 89 0.32 9.5 29.3
(Filley et al. 1954) 77 0.36 7.0 19.3
(Filley et al. 1954) 25 1.35 33.6 24.8
(Filley et al. 1954) 97 1.53 39.5 25.8
(Filley et al. 1954) 16 1.56 51.6 33.1
(Filley et al. 1954) 80 1.56 35.3 22.6
(Filley et al. 1954) 82 1.67 61.6 36.9
(Filley et al. 1954) 17 1.70 40.1 23.6
(Filley et al. 1954) 95 1.70 52.5 30.8
Table S-3 Completed.Source Subject id rO2, L/min rVe, L/min VQ
(Filley et al. 1954) 18 1.72 60.2 35.1
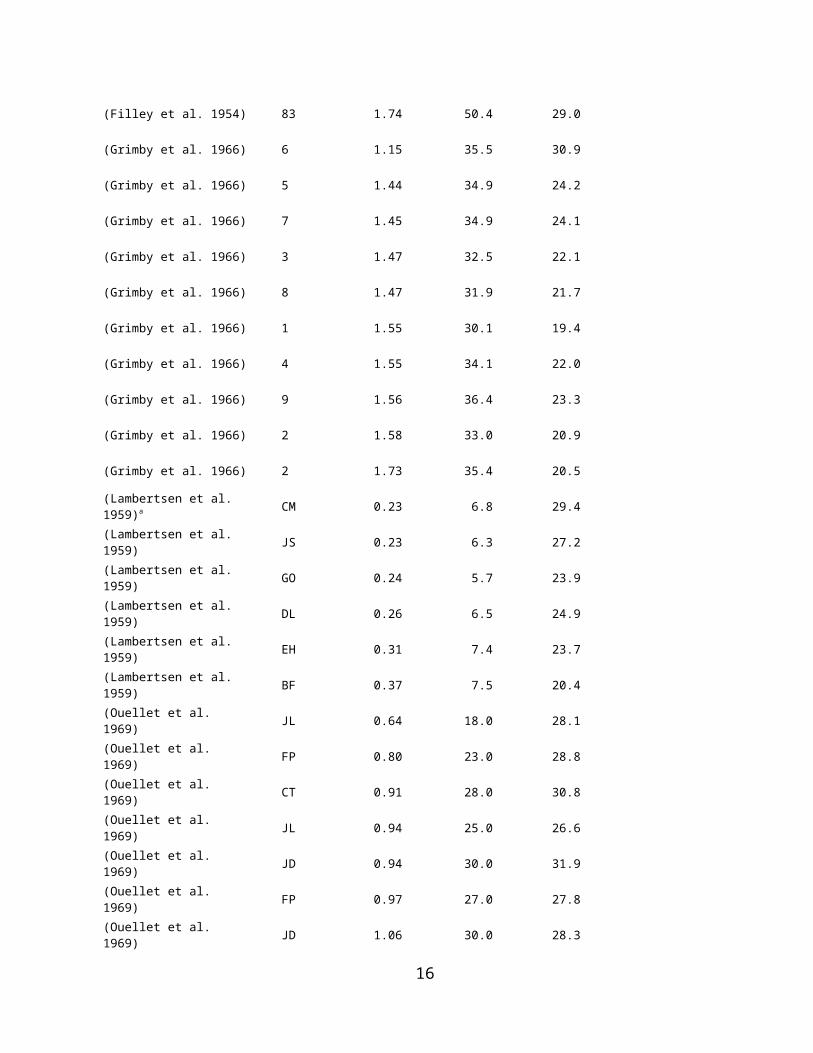
(Filley et al. 1954) 83 1.74 50.4 29.0
(Grimby et al. 1966) 6 1.15 35.5 30.9
(Grimby et al. 1966) 5 1.44 34.9 24.2
(Grimby et al. 1966) 7 1.45 34.9 24.1
(Grimby et al. 1966) 3 1.47 32.5 22.1
(Grimby et al. 1966) 8 1.47 31.9 21.7
(Grimby et al. 1966) 1 1.55 30.1 19.4
(Grimby et al. 1966) 4 1.55 34.1 22.0
(Grimby et al. 1966) 9 1.56 36.4 23.3
11

(Grimby et al. 1966) 2 1.58 33.0 20.9
(Grimby et al. 1966) 2 1.73 35.4 20.5
(Lambertsen et al. 1959)a CM 0.23 6.8 29.4
(Lambertsen et al. 1959) JS 0.23 6.3 27.2
(Lambertsen et al. 1959) GO 0.24 5.7 23.9
(Lambertsen et al. 1959) DL 0.26 6.5 24.9
(Lambertsen et al. 1959) EH 0.31 7.4 23.7
(Lambertsen et al. 1959) BF 0.37 7.5 20.4
(Ouellet et al. 1969) JL 0.64 18.0 28.1
(Ouellet et al. 1969) FP 0.80 23.0 28.8
(Ouellet et al. 1969) CT 0.91 28.0 30.8
(Ouellet et al. 1969) JL 0.94 25.0 26.6
(Ouellet et al. 1969) JD 0.94 30.0 31.9
(Ouellet et al. 1969) FP 0.97 27.0 27.8
(Ouellet et al. 1969) JD 1.06 30.0 28.3
(Ouellet et al. 1969) CT 1.16 31.0 26.7
(Ouellet et al. 1969) JL 1.17 30.0 25.6
(Ouellet et al. 1969) FP 1.35 34.0 25.2
(Ouellet et al. 1969) JD 1.47 38.0 25.9
(Ouellet et al. 1969) CT 1.56 54.0 34.6
(Tabakin et al. 1964) AB 0.86 16.7 19.4
(Tabakin et al. 1964) JL 0.98 23.8 24.3
(Tabakin et al. 1964) AB 1.02 18.1 17.8
(Tabakin et al. 1964) GW 1.07 30.5 28.5
(Tabakin et al. 1964) JL 1.36 29.6 21.9
12

(Tabakin et al. 1964) AB 1.44 25.4 17.6
(Tabakin et al. 1964) GW 1.45 34.6 23.8
(Torre-Bueno et al. 1985) LW 1.03 30.2 29.3
(Torre-Bueno et al. 1985) CBd 1.23 34.0 27.6
(Torre-Bueno et al. 1985) EO 1.23 29.0 23.6
(Torre-Bueno et al. 1985) MH 1.27 26.6 20.9
(Torre-Bueno et al. 1985) CM 1.28 30.1 23.5
(Torre-Bueno et al. 1985) MS 1.28 29.6 23.1
(Torre-Bueno et al. 1985) PW 1.31 32.0 24.4
(Torre-Bueno et al. 1985) PB 1.39 33.5 24.1
(Torre-Bueno et al. 1985) Cby 1.58 42.7 27.0
(Torre-Bueno et al. 1985) CBd 1.66 50.2 30.2
(Torre-Bueno et al. 1985) CM 1.74 43.1 24.8
(Torre-Bueno et al. 1985) LW 1.75 42.9 24.5
(Torre-Bueno et al. 1985) EO 1.83 46.9 25.6
aData for resting conditions were used for the Lambertsen et al. paper because the results for the graded exercise experiments indicated that the subjects were at or above the ventilatory anaerobic threshold.
13

Table S-4. Data on resting metabolic rates for groups of male and female children/adolescents derived from the IOM RMR database (Institute of Medicine 2005) and open literature sources.
Body weight, kg RMR, MJ/dGender/Source n Agea,y AM SD GM AM SD GM GSD
Males(Arvidsson et al. 2004) 17 15.8 64.1 9.0 63.5 6.90 0.60 6.87 1.09(Butte et al. 2007) 175 12.2 48.2 17.6 45.3 6.02 1.14 5.92 1.21ibid 250 11.8 75.5 28.0 70.8 7.41 1.57 7.25 1.23(De Lorenzo et al. 1999) 25 16.8 68.2 5.3 68.0 7.67 0.67 7.64 1.09(Derumeaux-Burel et al. 2004) 191 11.4 64.5 22.2 61.0 6.89 1.41 6.75 1.22ibid 62 13.0 72.7 22.1 69.6 8.04 1.63 7.88 1.22ibid 24 13.4 72.0 19.0 69.6 7.24 1.18 7.15 1.18(Ekelund et al. 2004) 15 9.7 33.0 5.0 32.6 5.20 0.50 5.18 1.10ibid 15 18.1 71.4 7.8 71.0 8.00 0.50 7.98 1.06(Ekelund et al. 2002) 8 18.1 113.2 9.1 112.8 9.10 0.60 9.08 1.07ibid 8 18.2 73.7 10.5 73.0 7.20 1.20 7.10 1.18(Firouzbakhsh et al. 1993) 92 10.6 39.4 15.4 36.7 5.54 1.24 5.41 1.25(Hofsteenge et al. 2010) 28 14.3 94.5 20.5 92.4 8.54 1.26 8.44 1.16ibid 23 13.8 87.1 19.3 85.0 8.18 1.20 8.10 1.16IOM 3 – 5 y 113 5.0 22.6 5.1 22.1 4.52 0.58 4.48 1.14IOM 6 – 8 y 34 6.5 26.0 5.3 25.4 4.67 0.50 4.64 1.11IOM 9 – 11 y 33 10.0 50.3 13.9 48.5 6.37 1.11 6.28 1.19IOM 12 – 18 y 16 14.8 55.3 9.8 54.5 7.05 0.88 7.00 1.13(Lazzer et al. 2006) 242 14.1 98.2 25.8 95.0 9.01 1.80 8.84 1.22ibid 19 13.7 86.1 19.2 84.1 8.54 1.40 8.43 1.18(Livingstone et al. 1992)b 6 7.5 25.4 6.6 24.6 4.67 1.17Ibid 5 9.3 30.2 9.4 28.8 4.72 1.14ibid 5 12.7 43.8 7.3 43.2 6.26 1.14ibid 3 15.4 50.7 6.4 50.3 6.69 1.06(Maffeis et al. 1993) 48 7.6 26.7 6.4 26.0 4.54 0.44 4.51 1.10ibid 14 8.3 38.7 8.2 37.9 4.87 0.37 4.86 1.08(McDuffie et al. 2004) 74 10.0 52.2 22.3 48.0 6.23 1.28 6.10 1.23ibid 117 9.8 50.3 19.6 46.9 6.30 1.18 6.19 1.20(Molnár et al. 1995) 116 13.1 44.5 11.6 43.1 5.60 0.97 5.52 1.19ibid 77 12.8 74.3 19.2 71.9 7.22 1.22 7.12 1.18ibid 31 12.9 44.7 12.4 43.1 5.60 1.10 5.50 1.21ibid 49 12.6 82.3 21.6 79.6 7.99 1.27 7.89 1.17
Total 1935Females(Arvidsson et al. 2004) 16 15.7 56.4 9.4 55.6 5.70 0.80 5.64 1.15(Bandini et al. 1995) 118 9.7 30.1 4.3 29.8 4.83 0.51 4.81 1.11ibid 55 10.6 37.0 5.9 36.5 5.37 0.57 5.34 1.11ibid 13 10.9 41.0 4.8 40.7 5.71 0.66 5.67 1.12(Butte et al. 2007) 201 12.3 45.1 15.1 42.8 5.18 0.78 5.12 1.16ibid 210 11.6 69.3 22.9 65.8 6.51 1.08 6.42 1.18(Derumeaux-Burel et al. 2004) 280 11.5 63.0 21.7 59.6 6.19 1.14 6.09 1.20ibid 149 12.7 70.4 23.5 66.8 6.78 1.40 6.64 1.23ibid 46 14.2 70.5 16.6 68.6 6.15 0.84 6.09 1.15(Ekelund et al. 2002) 10 17.3 102.4 24.1 99.7 7.70 1.40 7.58 1.20ibid 10 17.3 61.4 9.3 60.7 6.00 0.50 5.98 1.09(Ekelund et al. 2004) 11 9.6 37.0 5.7 36.6 5.10 0.40 5.08 1.08ibid 10 17.3 62.3 9.3 61.6 6.20 0.40 6.19 1.07
14
(Firouzbakhsh et al. 1993) 107 10.7 38.7 13.7 36.5 5.13 1.15 5.01 1.25(Hofsteenge et al. 2010) 27 15.1 93.2 14.6 92.1 7.80 1.04 7.74 1.14ibid 43 14.3 92.5 14.0 91.5 7.40 1.10 7.32 1.16IOM 4 – 6 y 74 5.1 22.5 4.8 22.0 4.16 0.47 4.13 1.12
Table S-4 completed.
Body weight, kg RMR, MJ/dGender/Source n Agea,y AM SD GM AM SD GM GSD
IOM 7 – 9 y 93 8.4 28.3 5.5 27.7 4.62 0.49 4.59 1.11IOM 10 – 12 y 71 11.1 48.5 12.8 46.9 5.73 0.86 5.67 1.16IOM 13 – 18 y 51 15.2 57.9 11.8 56.7 5.87 0.69 5.83 1.12(Lazzer et al. 2006) 332 14.8 89.3 17.7 87.6 7.53 1.20 7.44 1.17ibid 34 14.4 83.1 15.9 81.7 7.18 1.12 7.09 1.17(Livingstone et al. 1992)b 5 7.8 23.5 2.5 23.4 4.30 1.20Ibid 4 9.4 33.4 3.8 33.2 4.43 1.05ibid 5 12.5 45.1 4.7 44.9 5.82 1.12ibid 3 15.6 55.4 13.2 53.9 5.07 1.23(Maffeis et al. 1993) 49 7.8 27.2 7.0 26.3 4.24 0.44 4.21 1.11ibid 19 8.5 42.2 6.7 41.7 4.85 0.39 4.83 1.08(McDuffie et al. 2004) 138 9.5 45.4 17.7 42.3 5.49 1.26 5.35 1.25ibid 173 9.5 46.4 16.3 43.8 5.65 1.14 5.54 1.22(Molnár et al. 1995) 119 13.1 46.0 9.3 45.1 5.11 0.63 5.07 1.13ibid 59 13.2 75.8 18.7 73.6 6.67 1.11 6.58 1.18ibid 31 13.0 48.9 10.0 47.9 5.30 0.59 5.26 1.12ibid 30 13.4 86.0 22.2 83.3 7.30 1.58 7.14 1.24(Wong et al. 1996) 76 12.6 46.9 12.7 45.3 5.65 0.44 5.63 1.08ibid 42 13.5 59.9 18.7 57.2 5.43 0.45 5.41 1.09
Total 2714aMean age. bRMR statistics calculated directly from data given on individuals.
15
i
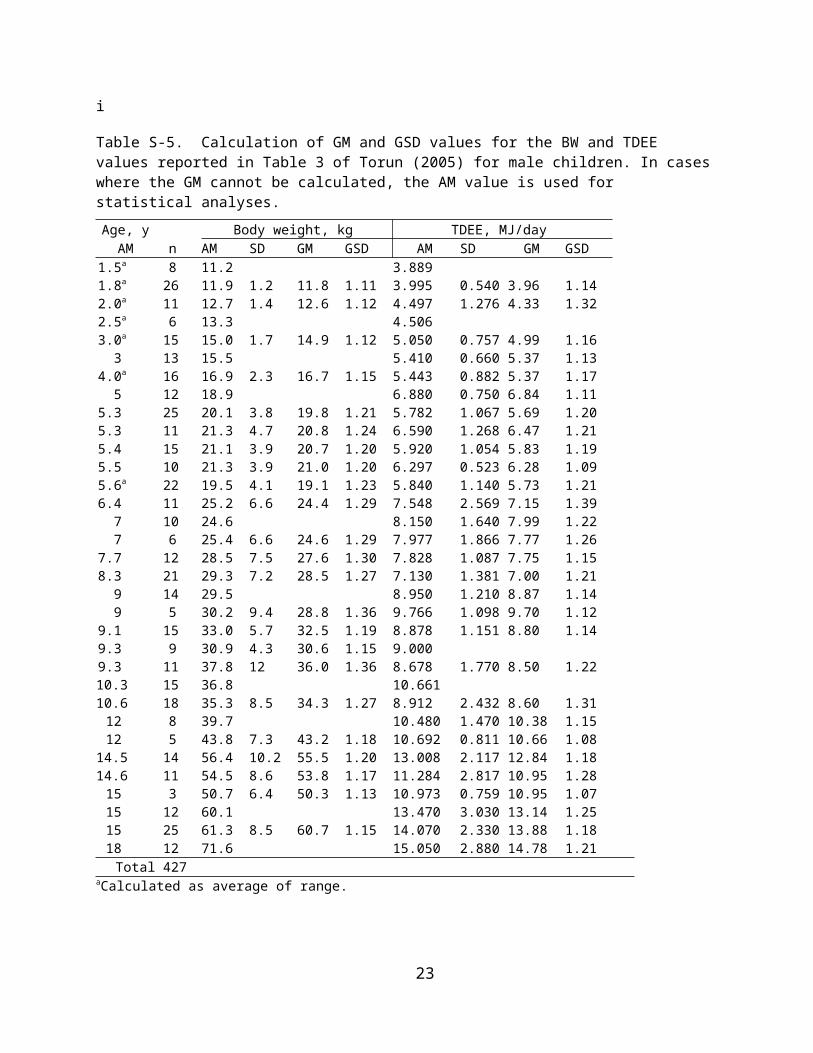
Table S-5. Calculation of GM and GSD values for the BW and TDEE values reported in Table 3 of Torun (2005) for male children. In cases where the GM cannot be calculated, the AM value is used for statistical analyses.
Age, y Body weight, kg TDEE, MJ/dayAM n AM SD GM GSD AM SD GM GSD1.5a 8 11.2 3.8891.8a 26 11.9 1.2 11.8 1.11 3.995 0.540 3.96 1.142.0a 11 12.7 1.4 12.6 1.12 4.497 1.276 4.33 1.322.5a 6 13.3 4.5063.0a 15 15.0 1.7 14.9 1.12 5.050 0.757 4.99 1.163 13 15.5 5.410 0.660 5.37 1.134.0a 16 16.9 2.3 16.7 1.15 5.443 0.882 5.37 1.175 12 18.9 6.880 0.750 6.84 1.115.3 25 20.1 3.8 19.8 1.21 5.782 1.067 5.69 1.205.3 11 21.3 4.7 20.8 1.24 6.590 1.268 6.47 1.215.4 15 21.1 3.9 20.7 1.20 5.920 1.054 5.83 1.195.5 10 21.3 3.9 21.0 1.20 6.297 0.523 6.28 1.095.6a 22 19.5 4.1 19.1 1.23 5.840 1.140 5.73 1.216.4 11 25.2 6.6 24.4 1.29 7.548 2.569 7.15 1.397 10 24.6 8.150 1.640 7.99 1.227 6 25.4 6.6 24.6 1.29 7.977 1.866 7.77 1.267.7 12 28.5 7.5 27.6 1.30 7.828 1.087 7.75 1.158.3 21 29.3 7.2 28.5 1.27 7.130 1.381 7.00 1.219 14 29.5 8.950 1.210 8.87 1.149 5 30.2 9.4 28.8 1.36 9.766 1.098 9.70 1.129.1 15 33.0 5.7 32.5 1.19 8.878 1.151 8.80 1.149.3 9 30.9 4.3 30.6 1.15 9.0009.3 11 37.8 12 36.0 1.36 8.678 1.770 8.50 1.22
10.3 15 36.8 10.66110.6 18 35.3 8.5 34.3 1.27 8.912 2.432 8.60 1.3112 8 39.7 10.480 1.470 10.38 1.1512 5 43.8 7.3 43.2 1.18 10.692 0.811 10.66 1.0814.5 14 56.4 10.2 55.5 1.20 13.008 2.117 12.84 1.1814.6 11 54.5 8.6 53.8 1.17 11.284 2.817 10.95 1.2815 3 50.7 6.4 50.3 1.13 10.973 0.759 10.95 1.0715 12 60.1 13.470 3.030 13.14 1.2515 25 61.3 8.5 60.7 1.15 14.070 2.330 13.88 1.1818 12 71.6 15.050 2.880 14.78 1.21
Total 427aCalculated as average of range.
16

Table S-6. Additional DLW studies for male children with GM and GSD conversions for body weight and TDEE.
Age, y Body weight, kg TDEE, MJ/daySource AM n AM SD GM GSD AM SD GM GSD(Reilly et al. 2004) 3.7 40 16.8 2.2 16.7 1.14 5.9 1.6 5.69 1.31(Jackson et al. 2009) 4.0 42 18.0 5.14 17.3 1.32 6.76 1.37 6.63 1.22(Lopez-Alarcon et al. 2004)
4.77 19.7 3.2 19.4 1.18 6.20 0.94 6.13 1.16
(Lopez-Alarcon et al. 2004)
5.310 20.0 3.0 19.8 1.16 6.07 1.2 5.95 1.22
(Reilly et al. 2004) 5.9 37 21.6 4.1 21.2 1.21 7.0 1.0 6.93 1.15(Rennie et al. 2005) 6.5 31 26.1 4.0 25.8 1.16 8.11 1.2 8.02 1.16(Rennie et al. 2005) 6.7 29 24.5 4.0 24.2 1.18 7.79 1.1 7.71 1.15(Dugas et al. 2008) 7.6 10 31.4 6.1 30.8 1.21 7.55 0.90 7.50 1.13(Ball et al. 2001) 7.8 52 27.6 6.3 26.9 1.25 7.87 1.14 7.79 1.16(Dugas et al. 2008) 8.0 16 32.1 7.3 31.3 1.25 7.92 1.50 7.78 1.21(Abbott and Davies 2004)
8.523 30.0 6.7 29.3 1.25 8.32 1.1 8.25 1.14
(Ekelund et al. 2004) 9.7 15 33.0 5.0 32.6 1.16 8.9 1.1 8.83 1.13(Bäcklund et al. 2009) 10.0 11 49.1 10.6 48.0 1.24 10.97 1.54 10.86 1.15(DeLany et al. 2006) 10.9 29 42.6 10.7 41.3 1.28 10.78 1.38 10.69 1.14(DeLany et al. 2006) 10.9 31 45.0 12.2 43.4 1.31 10.76 1.6 10.64 1.16(Perks et al. 2000) 12.5 23 45.1 14.1 43.0 1.36 10.09 1.99 9.90 1.22(DeLany et al. 2004) 12.8 61 55.3 10.9 54.3 1.22 11.09 1.64 10.97 1.16(Singh et al. 2009) 13.7 14 73.1 13.9 71.8 1.21 13.94 1.3 13.88 1.10(Arvidsson et al. 2004) 15.8 17 64.1 9.0 63.5 1.15 11.3 1.50 11.20 1.14(Ekelund et al. 2004) 18.1 15 71.4 7.8 71.0 1.12 14.4 2.3 14.22 1.17(Ekelund et al. 2002) 18.1 8 113.2 9.1 112.8 1.08 15.5 1.4 15.44 1.09(Ekelund et al. 2003) 18.1 16 93.2 24.1 90.2 1.29 14.6 1.7 14.50 1.12(Ekelund et al. 2002) 18.1 8 73.7 10.5 73.0 1.15 13.2 1.7 13.09 1.14
Total 545
17

Table S-7. Summary of DLW studies for adult males living in the U.S. from the compilation of Dugas et al. (2011)a as well as supplemental studies.
Age, y Body weight, kg TDEE, MJ/dayRef # in Dugas/Source n AM SE GM AM SE GM GSD88 41.0 4 84.6 3.6 84.3 13.46 0.33 13.44 1.0581 22.3 14 72.6 3.2 71.6 14.61 0.76 14.34 1.2167 22.0 17 68.3 2 67.8 11.69 0.64 11.40 1.2585 41.8 5 87.3 3.5 87.0 14.14 0.45 14.10 1.0720 42.0 30 83.6 3.7 81.2 12.01 0.42 11.80 1.2184 35.4 12 97.0 10 91.3 13.27 0.85 12.95 1.2587 49.5 8 82.4 2.5 82.1 12.90 0.41 12.85 1.0991 23.1 24 71.7 2.1 71.0 14.05 0.54 13.81 1.2114 56.3 9 88.5 4.8 87.4 12.04 0.61 11.90 1.1665 41.2 24 79.5 1.8 79.0 13.26 0.35 13.15 1.1471 22.7 22 97.5 2.2 97.0 14.36 0.60 14.09 1.2131 30.8 12 86.4 5.5 84.4 13.57 0.72 13.35 1.2089 37.0 64 88.0 2.4 86.0 12.49 0.25 12.33 1.1793 23.9 17 95.1 2.9 94.4 13.88 0.67 13.61 1.2280 47.0 44 83.2 1.9 82.3 12.69 0.21 12.61 1.1299 39.0 12 79.9 2.4 79.5 12.59 0.46 12.49 1.1317 53.9 259 88.0 1 86.6 12.14 0.14 11.94 1.2074 27.0 19 88.0 4.1 86.2 14.54 0.84 14.10 1.2879 52.0 54 103.7 1.6 103.0 13.23 0.32 13.03 1.1979 50.0 114 84.8 0.6 84.6 12.40 0.20 12.22 1.1979 49.0 94 72.6 0.7 72.3 10.86 0.19 10.71 1.1891 67.8 20 78.3 2.9 77.2 10.80 0.53 10.55 1.2486 74.1 14 83.6 2.1 83.2 12.42 0.44 12.31 1.1462 75.1 72 83.5 1.5 82.5 10.55 0.20 10.42 1.1762 74.8 72 81.6 1.7 80.4 9.72 0.21 9.56 1.2068 75.0 5 74.4 3.1 74.1 11.23 0.75 11.11 1.1674 69.0 29 90.0 2 89.4 12.43 0.36 12.28 1.17Supplemental studies(Choquette et al. 2009)
65.2 10 79.9 3.9 79.0 9.97 0.35 9.91 1.12
(Roberts et al. 1995) 22.7 17 71.6 2.8 70.7 14.48 0.65 14.24 1.20(Roberts et al. 1995) 68.0 18 78.7 3.2 77.6 11.26 0.54 11.03 1.22(Johannsen et al. 2008)
92.0 42 71.0 1.0 70.7 8.38 0.20 8.28 1.17
Total 87aTwo populations addressed in Dugas ref #77 were omitted because they were drawn from the same study population as ref # 62.
18

Table S-8. Calculation of GM and GSD values for the BW and TDEE values reported in Table 4 of Torun (2005) for female children. In cases where the GM cannot be calculated, the AM value is used for statistical analyses.
Age, y Body weight, kg TDEE, MJ/dayAM n AM SD GM GSD AM SD GM GSD1.5a 8 11.2 3.8891.8a 41 11.5 1.2 11.4 1.11 3.780 0.690 3.72 1.201.9a 12 13.0 1.9 12.9 1.16 4.443 0.887 4.36 1.222.5a 6 13.3 4.5063.0a 16 14.9 1.1 14.9 1.08 4.707 0.882 4.63 1.203.0 18 14.8 4.760 0.570 4.73 1.134.0a 11 17.1 1.9 17.0 1.12 5.288 0.996 5.20 1.215.6a 23 20.7 4.1 20.3 1.22 5.630 1.240 5.50 1.245.0 16 18.5 6.180 1.033 6.10 1.185.1 26 20.1 3.5 19.8 1.19 5.247 1.138 5.13 1.245.4 17 19.8 3.2 19.5 1.17 5.786 0.866 5.72 1.165.5 11 21.5 5.3 20.9 1.27 5.711 1.381 5.55 1.275.5 13 18.9 2.5 18.7 1.14 5.636 0.770 5.58 1.156.6 11 24.8 6.7 23.9 1.30 7.594 1.640 7.42 1.247.0 5 23.5 2.5 23.4 1.11 7.144 0.631 7.12 1.097.0 15 26.0 8.170 1.470 8.04 1.208.1 10 28.2 2.6 28.1 1.10 8.0588.2 12 28.5 3.5 28.3 1.13 6.586 0.912 6.52 1.158.5 29 27.2 3.6 27.0 1.14 7.138 1.159 7.05 1.188.5 43 28.0 4.6 27.6 1.18 7.376 1.280 7.27 1.198.5 25 29.6 4.6 29.2 1.17 7.519 1.310 7.41 1.199.0 4 33.4 3.8 33.2 1.12 8.135 0.760 8.10 1.109.0 15 29.1 7.569 1.270 7.46 1.189.1 11 37.0 5 36.7 1.14 8.255 0.828 8.21 1.119.5 11 38.0 11.4 36.4 1.34 6.728 1.188 6.63 1.19
10.3 15 28.9 8.27610.6 12 36.6 8.7 35.6 1.26 8.071 2.696 7.66 1.3812.0 5 45.1 4.7 44.9 1.11 9.888 1.062 9.83 1.1112.0 10 49.3 10.530 1.890 10.36 1.1913.2 9 43.3 8.9 42.4 1.23 9.711 1.176 9.64 1.1313.4 41 57.5 13.9 55.9 1.27 10.075 3.021 9.65 1.3413.6 40 53.2 10.6 52.2 1.22 11.791 3.017 11.42 1.2913.7 18 51.8 8.5 51.1 1.18 9.665 2.237 9.42 1.2614.3 12 55.7 9.4 54.9 1.18 9.979 1.866 9.81 1.2015.0 25 58.4 7.8 57.9 1.14 10.660 1.640 10.54 1.1715.0 3 55.4 13.2 53.9 1.26 9.573 2.816 9.18 1.3315.0 11 58.0 10.120 1.650 9.99 1.1818.0 11 62.4 11.090 1.870 10.94 1.18
Total 621aCalculated as average of range.
19

Table S-9. Additional DLW studies for female children with GM and GSD conversions for body weight and TDEE.
Age, y Body weight, kg TDEE, MJ/daySource AM n AM SD GM GSD AM SD GM GSD(Reilly et al., 2004) 3.7 38 16.4 3.6 16.0 1.24 5.50 1.30 5.35 1.26(Jackson et al., 2009) 4.1 47 17.7 5.0 17.0 1.32 5.85 1.50 5.67 1.29(Lopez-Alarcon et al., 2004) 4.4 5 21.3 6.4 20.4 1.34 5.96 0.75 5.91 1.13(Lopez-Alarcon et al., 2004) 4.8 7 20.7 5.1 20.1 1.27 5.66 1.40 5.49 1.28(Reilly et al., 2004) 5.7 35 20.1 3.3 19.8 1.18 6.00 0.90 5.93 1.16(Rennie et al., 2005) 6.7 21 22.4 3.1 22.2 1.15 6.44 0.68 6.40 1.11(Rennie et al., 2005) 6.7 19 25.0 3.7 24.7 1.16 7.14 0.81 7.09 1.12(Ball et al., 2001) 7.8 54 28.1 6.1 27.5 1.24 7.51 1.20 7.42 1.17(Dugas et al., 2008) 8.1 11 35.4 6.9 34.7 1.21 8.09 0.84 8.05 1.11(Dugas et al., 2008) 8.3 10 36.6 11.2 35.0 1.35 6.86 0.93 6.80 1.14(Abbott and Davies, 2004) 8.4 24 30.1 5.8 29.6 1.21 7.90 0.77 7.86 1.10(Ekelund et al., 2004) 9.6 11 37.0 5.7 36.6 1.17 8.20 0.80 8.16 1.10(Bandini et al. 2003) 9.9 26 33.7 4.7 33.4 1.15 8.13 1.14 8.05 1.15(DeLany et al., 2006) 10.6 25 39.4 11.3 37.9 1.32 9.68 1.47 9.57 1.16(DeLany et al., 2006) 10.7 28 37.9 9.1 36.9 1.27 9.13 1.03 9.07 1.12(Bäcklund et al., 2009) 10.7 11 52.7 10.1 51.8 1.21 10.60 1.03 10.55 1.10(Bandini et al. 2003) 11.9 26 44.9 7.2 44.3 1.17 9.34 1.33 9.25 1.15(DeLany et al., 2004) 12.6 53 49.1 10.9 47.9 1.25 9.19 1.67 9.04 1.20(Perks et al., 2000) 12.7 27 49.4 13.2 47.7 1.30 9.64 1.62 9.51 1.18(Singh et al., 2009) 13.4 20 85.8 14.1 84.7 1.18 11.86 1.41 11.78 1.13(Bandini et al. 2003) 14.8 21 57.9 6.8 57.5 1.12 10.27 1.54 10.16 1.16(Arvidsson et al. 2004) 15.7 16 56.4 9.4 55.6 1.18 9.1 1.4 8.99 1.17(Ekelund et al., 2003) 17.3 19 81.9 27.5 77.6 1.39 11.40 1.70 11.28 1.16(Ekelund et al., 2004) 17.3 10 62.3 9.3 61.6 1.16 10.40 0.80 10.37 1.08(Ekelund et al., 2002) 17.3 10 102.4 24.1 99.7 1.26 12.40 1.70 12.29 1.15(Ekelund et al., 2002) 17.3 10 61.4 9.3 60.7 1.16 10.40 0.80 10.37 1.08
Total 584
20
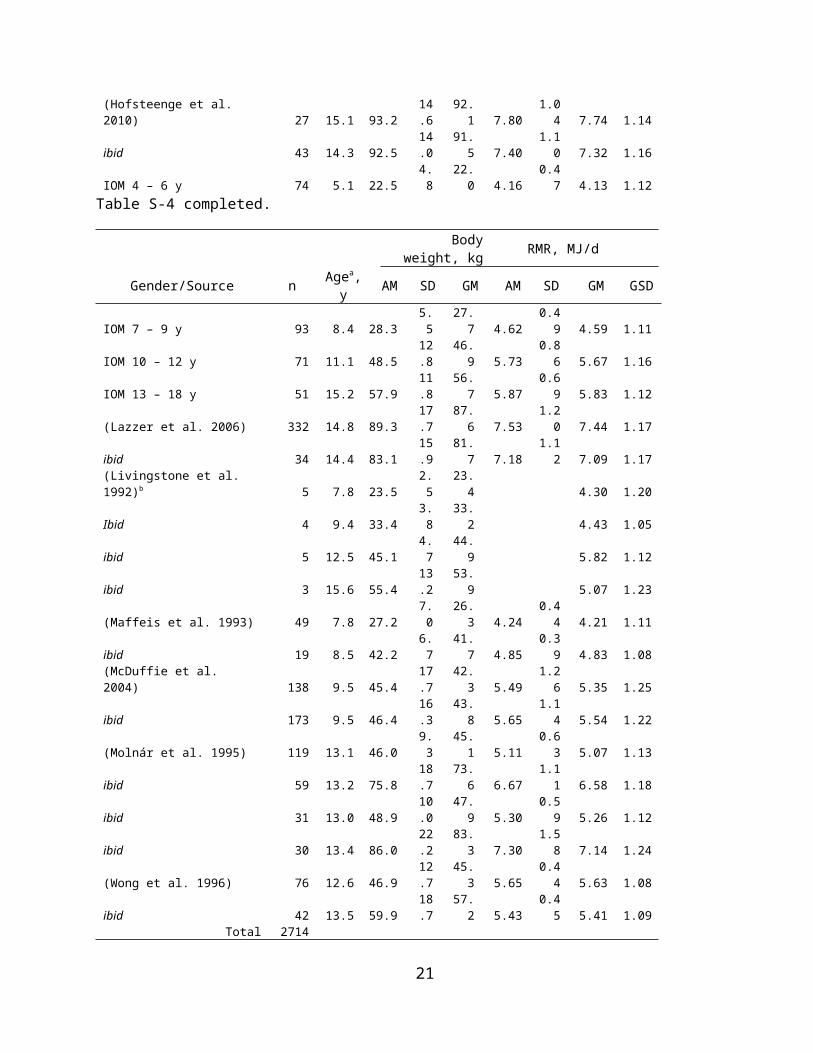
Table S-10. Summary of DLW studies for adult females living in the U.S. from the compilation of Dugas et al. (2011)a and supplemental studies. In cases where the GM cannot be calculated, the AM value is used for statistical analyses.
Age, y Body weight, kg TDEE, MJ/dayRef # in Dugas/Source n AM SE GM AM SE GM GSD12 34.6 172 83.5 1.6 81.0 10.16 0.14 10.00 1.2017 52.7 222 73.2 1.1 71.4 9.62 0.12 9.46 1.2031 31.8 22 81.6 4.8 78.7 11.15 0.48 10.93 1.2259 38.5 10 91.2 3.0 90.7 10.85 0.42 10.77 1.1359 39.6 10 65.7 1.5 65.5 10.54 0.55 10.40 1.1860 34.0 14 58.2 1.5 57.9 9.45 0.21 9.42 1.0960 39.5 18 83.7 2.0 83.3 11.31 0.44 11.16 1.1861 59.4 34 64.0 1.5 63.4 8.96 0.26 8.83 1.1861 60.3 26 63.8 1.7 63.2 9.49 0.23 9.42 1.1362 74.6 67 73.5 2.1 71.6 7.97 0.19 7.82 1.2162 74.8 77 67.2 1.6 65.8 7.89 0.14 7.80 1.1763 31.0 70 57.5 0.7 57.2 10.10 0.17 10.00 1.1563 31.0 33 80.8 1.8 80.1 11.52 0.28 11.41 1.1564 30.3 34 59.3 1.2 58.9 10.18 0.26 10.07 1.1664 30.8 17 49.9 0.9 49.8 9.82 0.28 9.75 1.1264 31.2 12 77.3 2.9 76.7 12.30 0.51 12.18 1.1566 36.2 12 106.7 0.2 106.7 12.79 0.50 12.67 1.1466 35.4 8 162.0 0.6 162.0 16.09 0.90 15.89 1.1766 40.1 10 134.3 0.3 134.3 14.69 0.50 14.61 1.1168 76.6 5 63.2 2.8 62.9 8.22 0.19 8.21 1.0569 49.1 80 69.9 1.2 69.1 8.86 0.19 8.70 1.2170 29.0 5 101.0 7.6 99.6 12.40 0.25 12.39 1.0570 31.0 9 60.0 2.2 59.6 8.34 0.56 8.18 1.2271 22.1 32 80.7 1.7 80.1 10.86 0.31 10.72 1.1772 33.9 71 63.9 0.7 63.6 8.39 0.15 8.30 1.1673 35.2 17 65.1 1.4 64.8 9.11 0.27 9.04 1.1373 35.6 18 63.3 1.6 62.9 8.24 0.34 8.12 1.1974 28.0 33 73.0 4.0 69.6 10.08 0.42 9.80 1.2774 69.0 29 78.0 3.0 76.4 9.34 0.31 9.19 1.1975 38.7 15 91.0 2.6 90.4 11.31 0.37 11.22 1.1375 39.8 14 93.5 2.3 93.1 10.26 0.40 10.15 1.1676 25.8 13 65.5 1.5 65.3 9.92 0.46 9.78 1.1878 49.7 136 76.0 1.4 74.3 9.65 0.16 9.47 1.2179 48.0 127 59.9 0.5 59.6 8.66 0.13 8.54 1.1879 49.0 56 89.0 1.5 88.3 10.26 0.24 10.11 1.1979 51.0 79 71.5 0.8 71.1 9.28 0.18 9.15 1.1980 48.0 47 74.2 2.6 72.1 10.30 0.28 10.13 1.2082 48.0 20 68.1 2.5 67.2 10.47 0.45 10.28 1.2183 25.2 10 54.8 1.3 54.6 9.82 0.55 9.67 1.1983 74.0 10 58.7 3.1 57.9 7.52 0.28 7.47 1.1284 31.3 9 106.2 10.9 101.5 11.67 0.61 11.53 1.1785 29.3 4 52.4 2.4 52.2 10.38 0.74 10.28 1.1586 73.5 13 69.8 2.6 69.2 9.43 0.25 9.39 1.1087 51.9 11 62.4 1.9 62.1 9.56 0.14 9.55 1.0590 22.2 24 72.4 0.4 72.4 10.08 0.27 9.99 1.1492 31.8 20 62.3 1.1 62.1 8.44 0.22 8.38 1.1292 31.9 14 59.9 1.5 59.6 8.33 0.38 8.21 1.1892 36.0 20 78.0 2.1 77.4 8.86 0.32 8.75 1.1792 36.5 21 78.7 1.2 78.5 9.35 0.36 9.21 1.1993 23.3 29 79.1 1.8 78.5 10.77 0.27 10.67 1.1494 22.8 8 56.6 2.4 56.2 11.10 0.90 10.82 1.25
21

Table S-10. completed.
Age, y Body weight, kg TDEE, MJ/dayRef # in Dugas/Source n AM SE GM AM SE GM GSD94 25.1 8 83.9 3.4 83.4 11.96 0.43 11.90 1.1195 37.9 14 78.0 2.2 77.6 8.74 0.42 8.60 1.2095 38.1 18 79.5 1.2 79.3 9.32 0.39 9.18 1.1996 33.0 12 59.6 1.2 59.5 9.46 0.25 9.42 1.1096 36.0 26 85.2 2.1 84.5 11.20 0.35 11.06 1.1797 30.2 35 70.5 3.6 67.5 11.06 0.36 10.86 1.2198 21.5 11 59.3 2.2 58.9 9.47 0.84 9.09 1.33100 59.9 65 74.0 2.0 72.3 10.71 0.36 10.34 1.31Supplemental studies(Vinken et al. 1999) 25.2 10 54.7 1.3 54.5 9.91 0.56 9.76 1.19(Blanton et al. 2006) 30.0 20 60.8 1.7 60.3 8.90 0.42 8.71 1.23(Tran et al. 2000) 30.2 35 70.5 3.6 67.5 11.06 0.35 10.87 1.21(Champagne et al. 2002) 33.4 10 63.3 1.1 63.2 9.69(Champagne et al. 2002) 36.4 10 61.3 0.8 61.2 9.01(Ma et al. 2009) 49.1 79 69.7 1.2 68.9 8.85 0.19 8.69 1.21(Karelis et al. 2010) 57.7 50 84.9 11.08 0.22 10.97 1.15(Karelis et al. 2010) 58.7 37 77.1 9.89 0.27 9.76 1.18(Choquette et al. 2009) 67.3 7 55.5 3.1 54.9 9.08 0.37 9.03 1.11(Vinken et al. 1999) 74.0 10 58.5 3.1 57.7 7.59 0.28 7.54 1.13(Johannsen et al. 2008) 92.0 49 60.0 2.0 58.4 6.80 0.13 6.74 1.15
Total 2373aFour study populations included in Dugas et al. (2011) were omitted from this database due to various reasons: two groups from Dugas ref # 77 were excluded because they were drawn from the same population as Dugas ref #62 and two studies (i.e., Dugas #89 and #98) were omitted because the associated PAL values calculated using the Livingston and Kohlstadt (2005) RMR formula were less than 1.35.
22
References
Abbott RA, Davies PSW (2004) Habitual physical activity and physical activity intensity: their relation to body composition in 5.0-10.5-y-old children. Eur J Clin Nutr 58:285-291
Armstrong N, Kirby BJ, McManus AM, Welsman JR (1997) Prepubescents' ventilatory responses to exercise with reference to sex and body size. Chest 112:1554-1560
Arvidsson D, Slinde F, Hulthen L (2004) Physical activity questionnaire for adolescents validated against doubly labelled water. Eur J Clin Nutr 59:376-383
Bachofen H, Hobi HJ, Scherrer M (1973) Alveolar-arterial N 2 gradients at rest and during exercise in healthy men of different ages. J Appl Physiol 34:137-142
Bäcklund C, Sundelin G, Larsson C (2009) Validity of an Armband Measuring Energy Expenditure in Overweight and Obese Children. Med Sci Sports Exerc 42:1154-1161
Ball EJ, O'Connor J, Abbott R, Steinbeck KS, Davies PSW, Wishart C, Gaskin KJ, Baur LA (2001) Total energy expenditure, body fatness, and physical activity in children aged 6-9 y. Am J Clin Nutr 74:524-528
Bandini L, Morelli J, Must A, Dietz W (1995) Accuracy of standardized equations for predicting metabolic rate in premenarcheal girls. Am J Clin Nutr 62:711-714
Bandini LG, Must A, Cyr H, Anderson SE, Spadano JL, Dietz WH (2003) Longitudinal changes in the accuracy of reported energy intake in girls 10-15 y of age. Am J Clin Nutr 78:480-484
Blanton CA, Moshfegh AJ, Baer DJ, Kretsch MJ (2006) The USDA Automated Multiple-Pass Method Accurately Estimates Group Total Energy and Nutrient Intake. J Nutr 136:2594-2599
Borel B, Leclair E, Thevenet D, Beghin L, Gottrand F, Fabre C (2011) Comparison of mechanical ventilatory constraints between continuous and intermittent exercises in healthy prepubescent children. Pediatr Pulmonol 46:785-794
Butte NF, Puyau MR, Vohra FA, Adolph AL, Mehta NR, Zakeri I (2007) Body Size, Body Composition, and Metabolic Profile Explain Higher Energy Expenditure in Overweight Children. J Nutr 137:2660-2667
Champagne CM, Bray GA, Kurtz AA, Monteiro JBR, Tucker E, Volaufova J, Delany JP (2002) Energy Intake and Energy Expenditure: A Controlled Study Comparing Dietitians and Non-dietitians. J Am Diet Assoc 102:1428-1432
Choquette S, Chuin A, Lalancette D-A, Brochu M, Dionne IJ (2009) Predicting Energy Expenditure in Elders with the Metabolic Cost of Activities. Med Sci Sports Exerc 41:1915-1920
Cohn JE, Carroll DG, Armstrong BW, Shepard R, Riley RL (1954) Maximal Diffusing Capacity of the Lung in Normal Male Subjects of Different Ages. J Appl Physiol 6:588-597
Cook CD, Cherry RB, O'Brien D, Karlberg P, Smith CA (1955) Studies of respiratory physiology in the newborn infant. I. Observations on normal premature and full-term infants. J Clin Invest 34:975-982
Cross KW, Tizard JPM, Trythall DAH (1957) The gaseous metabolism of the newborn infant. Act Paediatr 46:265-285
Damato AN, Galante JG, Smith WM (1966) Hemodynamic response to treadmill exercise in normal subjects. J Appl Physiol 21:959-966
De Lorenzo A, Bertini I, Puijia A, Testolin G, Testolin C (1999) Comparison between measured and predicted resting metabolic rate in moderately active adolescents. Acta Diabetol 36:141-145
DeLany JP, Bray GA, Harsha DW, Volaufova J (2004) Energy expenditure in African American and white boys and girls in a 2-y follow-up of the Baton Rouge Children's Study. Am J Clin Nutr 79:268-273
DeLany JP, Bray GA, Harsha DW, Volaufova J (2006) Energy expenditure and substrate oxidation predict changes in body fat in children. Am J Clin Nutr 84:862-870
Derumeaux-Burel H, Meyer M, Morin L, Boirie Y (2004) Prediction of resting energy expenditure in a large population of obese children. Am J Clin Nutr 80:1544-1550
23

Dugas LR, Ebersole K, Schoeller D, Yanovski JA, Barquera S, Rivera J, Durazo-Arzivu R, Luke A (2008) Very low levels of energy expenditure among pre-adolescent Mexican-American girls. Int J Pediatr Obes 3:123-126
Dugas LR, Harders R, Merrill S, Ebersole K, Shoham DA, Rush EC, Assah FK, Forrester T, Durazo-Arvizu RA, Luke A (2011) Energy expenditure in adults living in developing compared with industrialized countries: a meta-analysis of doubly labeled water studies. Am J Clin Nutr 93:427-441
Ekelund U, Aman J, Westerterp K (2003) Is the ArteACC Index a Valid Indicator of Free-Living Physical Activity in Adolescents? Obesity 11:793-801
Ekelund U, Aman J, Yngve A, Renman C, Westerterp K, Sjostrom M (2002) Physical activity but not energy expenditure is reduced in obese adolescents: a case-control study. Am J Clin Nutr 76:935-941
Ekelund U, Yngve A, Brage S, Westerterp K, Sjostrom M (2004) Body movement and physical activity energy expenditure in children and adolescents: how to adjust for differences in body size and age. Am J Clin Nutr 79:851-856
Filley GF, Gregoire F, Wright GW (1954) Alveolar and arterial oxygen tensions and the significance of the alveolar-arterial oxygen tension difference in normal men. J Clin Invest 33:517-529
Firouzbakhsh S, Mathis RK, Dorchester WL, Oseas RS, Groncy PK, Grant KE, Finklestein JZ (1993) Measured resting energy expenditure in children. J Pediatr Gastroenterol Nutr 16:136-142
Grimby G, Nilsson NJ, Saltin B (1966) Cardiac output during submaximal and maximal exercise in active middle-aged athletes. J Appl Physiol 21:1150-1156
Guimarães GV, Bellotti G, Mocelin AO, Camargo PR, Bocchi EA (2001) Cardiopulmonary Exercise Testing in Children With Heart Failure Secondary to Idiopathic Dilated Cardiomyopathy. Chest 120:816-824
Hofsteenge GH, Chinapaw MJ, Delemarre-van de Waal HA, Weijs PJ (2010) Validation of predictive equations for resting energy expenditure in obese adolescents. Am J Clin Nutr 91:1244-1254
Institute of Medicine (2005) Dietary Reference Intakes for Energy, Carbohydrate, Fiber, Fat, Fatty Acids, Cholesterol, Protein, And Amino Acids. National Academy Press, Washington, D.C.
Jackson DM, Djafarian K, Stewart J, Speakman JR (2009) Increased television viewing is associated with elevated body fatness but not with lower total energy expenditure in children. Am J Clin Nutr 89:1031-1036
Johannsen DL, DeLany JP, Frisard MI, Welsch MA, Rowley CK, Fang X, Jazwinski SM, Ravussin E, The Louisiana Healthy Aging Study (2008) Physical activity in aging: Comparison among young, aged, and nonagenarian individuals. J Appl Physiol 105:495-501
Karelis AD, Lavoie ME, Fontaine J, Messier V, Strychar I, Rabasa-Lhoret R, Doucet E (2010) Anthropometric, metabolic, dietary and psychosocial profiles of underreporters of energy intake: a doubly labeled water study among overweight/obese postmenopausal women--a Montreal Ottawa New Emerging Team study. Eur J Clin Nutr 64:68-74
Kawahara J, Tanaka S, Hikihara Y, Aoki Y, Yonemoto J (2011) Estimation of the respiratory ventilation rate of preschool children in daily life using accelerometers. J Air Waste Manage Assoc 61:46-54
Knuttgen HG (1967) Aerobic capacity of adolescents. J Appl Physiol 22:655-658Lambertsen CJ, Owen SG, Wendel H, Stroud MW, Lurie AA, Lochner W, Clark GF (1959) Respiratory and
cerebral circulatory control during exercise at. 21 and 2.0 atmospheres inspired pO2. J Appl Physiol 14:966-982
Lazzer S, Agosti F, De Col A, Sartorio A (2006) Development and cross-validation of prediction equations for estimating resting energy expenditure in severely obese Caucasian children and adolescents. The British journal of nutrition 96:973-979
Livingston EH, Kohlstadt I (2005) Simplified Resting Metabolic Rate-Predicting Formulas for Normal-Sized and Obese Individuals. Obesity 13:1255-1262
24

Livingstone M, Coward W, Prentice A, Davies P, Strain J, McKenna P, Mahoney C, White J, Stewart C, Kerr M (1992) Daily energy expenditure in free-living children: comparison of heart-rate monitoring with the doubly labeled water (2H2 (18) O) method. Am J Clin Nutr 56:343
Lopez-Alarcon M, Merrifield J, Fields DA, Hilario-Hailey T, Franklin FA, Shewchuk RM, Oster RA, Gower BA (2004) Ability of the Actiwatch Accelerometer to Predict Free-Living Energy Expenditure in Young Children. Obesity 12:1859-1865
Ma Y, Olendzki BC, Pagoto SL, Hurley TG, Magner RP, Ockene IS, Schneider KL, Merriam PA, Hébert JR (2009) Number of 24-Hour Diet Recalls Needed to Estimate Energy Intake. Ann Epidemiol 19:553-559
Maffeis C, Schutz Y, Micciolo R, Zoccante L, Pinelli L (1993) Resting metabolic rate in six-to ten-year-old obese and nonobese children. J Pediatr 122:556
McDuffie JR, Adler-Wailes DC, Elberg J, Steinberg EN, Fallon EM, Tershakovec AM, Arslanian SA, Delany JP, Bray GA, Yanovski JA (2004) Prediction equations for resting energy expenditure in overweight and normal-weight black and white children. Am J Clin Nutr 80:365-373
Molnár D, Jeges S, Erhardt E, Schutz Y (1995) Measured and predicted resting metabolic rate in obese and nonobese adolescents. J Pediatr 127:571-577
Nelson NM, Prod'hom LS, Cherry RB, Lipsitz PJ, Smith CA (1962) Pulmonary function in the newborn infant. I. Methods: ventilation and gaseous metabolism. Pediatrics 30:963-974
Ouellet Y, Poh SC, Becklake MR (1969) Circulatory factors limiting maximal aerobic exercise capacity. J Appl Physiol 27:874-880
Perks SM, Roemmich JN, Sandow-Pajewski M, Clark PA, Thomas E, Weltman A, Patrie J, Rogol AD (2000) Alterations in growth and body composition during puberty. IV. Energy intake estimated by the Youth-Adolescent Food-Frequency Questionnaire: validation by the doubly labeled water method. Am J Clin Nutr 72:1455-1460
Potter CR, Childs DJ, Houghton W, Armstrong N (1999) Breath-to-breath “noise” in the ventilatory and gas exchange responses of children to exercise. Eur J Appl Physiol Occup Physiol 80:118-124
Reilly J, Jackson D, Montgomery C, Kelly L, Slater C, Grant S, Paton J (2004) Total energy expenditure and physical activity in young Scottish children: mixed longitudinal study. The Lancet 363:211-212
Rennie KL, Livingstone MBE, Wells JC, McGloin A, Coward WA, Prentice AM, Jebb SA (2005) Association of physical activity with body-composition indexes in children aged 6-8 y at varied risk of obesity. Am J Clin Nutr 82:13-20
Roberts SB, Fuss P, Heyman MB, Young VR (1995) Influence of age on energy requirements. Am J Clin Nutr 62:1053S-1058S
Rowland TW, Cunningham LN (1997) Development of Ventilatory Responses to Exercise in Normal White Children. Chest 111:327-332
Rowland TW, Green GM (1988) Physiological responses to treadmill exercise in females: adult-child differences. Med Sci Sports Exerc 20:474-478
Rutenfranz J, Lange Andersen K, Seliger V, Klimmer F, Ilmarinen J, Ruppel M, Kylian H (1981) Excercise ventilation during the growth spurt period: Comparison between two European countries. European Journal of Pediatrics 136:135-142
Singh R, Martin BR, Hickey Y, Teegarden D, Campbell WW, Craig BA, Schoeller DA, Kerr DA, Weaver CM (2009) Comparison of self-reported and measured metabolizable energy intake with total energy expenditure in overweight teens. Am J Clin Nutr 89:1744-1750
Stahlman MT, Meece NJ (1957) Pulmonary ventilation and diffusion in the human newborn infant. J Clin Invest 36:1081-1091
Tabakin BS, Hanson JS, Merriam TW, Caldwell EJ (1964) Hemodynamic response of normal men to graded treadmill exercise. J Appl Physiol 19:457-464
25
Torre-Bueno JR, Wagner PD, Saltzman HA, Gale GE, Moon RE (1985) Diffusion limitation in normal humans during exercise at sea level and simulated altitude. J Appl Physiol 58:989-995
Torun B (2005) Energy requirements of children and adolescents. Public Health Nutr 8:968-993Tran KM, Johnson RK, Soultanakis RP, Matthews DE (2000) In-person vs Telephone-administered
Multiple-pass 24-hour Recalls in Women: Validation with Doubly Labeled Water. J Am Diet Assoc 100:777-783
Vinken AG, Bathalon GP, Sawaya AL, Dallal GE, Tucker KL, Roberts SB (1999) Equations for predicting the energy requirements of healthy adults aged 18–81 y. Am J Clin Nutr 69:920-926
Wong WW, Butte NF, Hergenroeder AC, Hill RB, Stuff JE, Smith EOB (1996) Are basal metabolic rate prediction equations appropriate for female children and adolescents? J Appl Physiol 81:2407-2414
26