linical echniques to ssess the isual and o p … of standardising the type of letter chart and...
TRANSCRIPT

CLINICAL TECHNIQUES TO ASSESS THE VISUAL AND OPTICAL PERFORMANCE
OF INTRAOCULAR LENSES: A REVIEW
Amit Navin Jinabhai,1,2,3 Graeme Young, 1,2 Lee Anthony Hall1,2 & James Stuart Wolffsohn 1,2
1Ophthalmic Research Group; School of Life and Health Sciences, Aston University, Birmingham, UK
2Visioncare Research Ltd.; Farnham, Surrey, UK 3Faculty of Life Sciences; The University of Manchester, Manchester, UK
ABSTRACT
A number of clinical techniques are available to assess the visual and optical performance of the eye. This report aims to review the advantages and limitations of techniques used in previous studies of patients implanted with intraocular lenses (IOLs), whose designs are ever increasing in optical complexity. Although useful, in-vitro measurements of IOL optical quality cannot account for the wide range of biological variation in ocular anatomy and corneal optics, which will impact on the visual outcome achieved. This further highlights the need for a standardised series of visual performance tests that can be applied to a wide range of IOL designs. The conclusions of this report intend to assist researchers in developing a comprehensive series of investigations to evaluate IOL performance. Repeatable and reproducible in-vivo assessments of visual and optical performance are desirable to further develop IOL concepts and designs, in the hope of improving current post-operative visual satisfaction.

Amit Navin Jinabhai, Graeme Young, Lee Anthony Hall et al. 2
1. INTRODUCTION A perplexing variety of techniques is available to assess the visual and
optical performance of the eye. This report aims to review the possible advantages and disadvantages of methods used in previous studies of patients implanted with intraocular lenses (IOLs), whose designs are increasing in optical complexity. Repeatable and reproducible in-vivo evaluations of visual and optical performance would prove useful in developing better IOL designs and concepts, to improve upon current levels of post-operative visual satisfaction. Although useful, in-vitro measurements of IOL optical quality cannot account for the wide range of biological variation in ocular anatomy (e.g. anterior chamber depth and axial length) and corneal optics, which will impact on the visual outcome achieved for each patient. This further highlights the need for a standardised series of clinical visual performance tests that can be applied to a wide range of different IOL types. The conclusions of this report intend to support the design of a comprehensive series of tests to evaluate IOL performance.
2. VISUAL ACUITY Most studies concerning IOL visual performance have used logMAR-
principle letter charts, such as the Bailey-Lovie, [1] Regan letter [2] or Early Treatment of Diabetic Retinopathy Study (ETDRS), charts. [3] Compared to Snellen acuity, LogMAR letter charts offer the advantages of:
• Simple numerical results facilitating statistical analyses, • An equal number of letters per line (reduces the risk of guessing
correctly), and • A regular logarithmic progression of letter size between lines (non-
truncated). In addition to high-contrast acuity letters, logMAR letter charts are also
available at lower levels of contrast. [4, 5] Key factors for measuring visual acuity (VA) include the
illuminance/luminance of the target letters and the physical distance of the chart from the patient. [6] To ensure measurements are consistent for multi-site collaborative studies, it is imperative that these factors are kept as similar
Clinical Techniques to Assess the Visual and Optical Performance ... 3
as possible at each site. Furthermore, other reports have demonstrated the importance of standardising the type of letter chart and scoring system used between sites to avoid measurement variations due to subtle differences amongst different logMAR chart designs. [7, 8] The instrument currently considered by the National Eye Institute (NEI) as the ‘gold standard’ for clinical acuity measurement is the ETDRS chart. [9, 10] The chart features Sloan optotypes designed to be comparable to Landolt’s broken rings in terms of recognition difficulty. [11] Sloan letters include the characters C, D, K, H, N, Z, R, S, V and O, designed using 5 x 5-sized non-serif optotypes. The ETDRS chart comprises 14 lines (ranging from +1.00 to -0.30 log units in size), each with 5 letters when used at a distance of 4 m.
The recommended letter chart luminance for VA measurements varies between different countries; e.g. in the United States the recommended luminance is 85 cd/m2, whereas in the United Kingdom, it is 120 cd/m2 and 300 cd/m2 in Germany. These differences between countries further highlight the importance of standardising measurement conditions between different investigational sites. Furthermore, if the letter chart luminance and room illumination levels become altered between repeated measurements of VA, for any given subject, such variations may cause alterations in the subject’s pupil diameter and, therefore, higher-order aberrations, perhaps impacting on the visual performance achieved.
An even wider variety of reading charts is available to record near visual performance. [12] These include the MNRead (Minnesota Near Reading) acuity chart (Lighthouse Low Vision Products, NY, US); the Jaeger reading chart (Western Ophthalmics Corp., WA, US); the Birkhauser reading charts (Scalae Typographicae Birkhaeuseri, Birkhauser Verlag, Basel, Switzerland); the logMAR Lighthouse Near Visual Acuity Test (Lighthouse International, NY, US); the logMAR ETDRS near visual acuity chart (Precision Vision, IL, US); the Rosenbaum Nearvision card (Western Ophthalmics Corp.) and the logMAR Holladay contrast acuity test (Stereo Optical, IL, US). The latter four instruments are designed with single, uppercase optotypes only, whereas other charts use words and sentences with a mixture of both uppercase and lowercase letters. In contrast, the Practical Near Acuity Chart (PNAC) (Aston, Birmingham, UK) and the Bailey-Lovie near chart (Sussex Vision International, Sussex, UK) use words and sentences containing lowercase letters only. Compared to the Bailey-Lovie near chart, the PNAC uses a fixed number of words per line (three) enabling quick measurements of near acuity, particularly for patients with visual impairment. [13] Unlike for distance VA measurements, word optotype targets allow a more realistic assessment of near

Amit Navin Jinabhai, Graeme Young, Lee Anthony Hall et al. 4
visual performance compared to single letters. [14] However, word optotypes tend to yield poorer visual acuities compared to letter optotypes, [12, 15] perhaps as a result of contour interactions. [16] As with distance VA, near chart designs should be based on a logarithmic progression scale. The Jaeger near vision charts have been found to show inconsistent letter sizes for the same point size, [17] and coupled with their non-standard acuity level separation, this makes them a poor choice for evaluating near vision, despite the dominance of this instruments uses in previous clinical studies. Table 1 summarises the range of vision charts available for measuring visual acuity and functional reading ability.
Near logMAR letter charts are also available at low-contrast levels, with some authors suggesting that both high-contrast and low-contrast visual acuities should be measured under both photopic and mesopic lighting conditions in order to fully evaluate the level of visual performance achieved with a given IOL. [18-20]
The use of computerised software and display screens to measure VA has grown in popularity; examples of devices typically used in clinical practice include the electronic Thomson Vision Chart (Thomson Software Solutions, Hertfordshire, UK), [21] the COMPlog system (Medisoft; Leeds, UK) [22] and the Thomson Vision Toolbox application for the Apple iPad/iPhone (Apple Inc. California, US). [23] These platforms offer several advantages, including saving space within the consulting room (several charts can be presented with one device), allowing more accurate control of letter chart luminance, rapid presentation of high- and low-contrast optotypes and rapid target optotype randomisation. Interactive devices such as the iPad/iPhone can be used to improve data recording accuracy and reduce testing times, as these devices allow subjects to tap on their threshold optotypes. The device’s computer can also be used to time the subject whilst reading and to analyse their data after completing the measurements.
Both Beck et al. [24] and Laidlaw et al. [22] have demonstrated equivalent repeatability between high-contrast VA measurements made with electronic ETDRS (e-ETDRS) and printed ETDRS charts in adults. [25] Similar findings have also been reported in children. [26] Likewise, Shah et al. [27] have shown comparable repeatability between VA measurements made with electronic and printed Kay’s picture cards in both adults and children. Compared to traditional printed charts, electronic charts offer the advantage of improved standardisation across multiple sites. [24, 26] Originally, electronic test charts were presented on cathode ray tube (CRT) display screens; however, these devices tended to be bulky and induced unwanted flicker.

Clinical Techniques to Assess the Visual and Optical Performance ... 5
Liquid crystal display (LCD) screens offer some advantages as they produce simultaneous high-contrast and high-luminance displays; are easily wall-mountable; are less susceptible to reflections from ambient lighting; use less energy and are aesthetically attractive. Some authors have reported a subjective preference of LCD over CRT screens for visual tasks; [28, 29] however, others have reported that LCD displays generate inferior low-contrast targets compared to CRT screens. [30-32] Some reports have also demonstrated slower visual search/recognition [33] and visually evoked potential (VEP) response times [30, 34] with LCD screens compared to with CRT screens; although increasing the contrast ratio and refresh rate may be helpful to overcome these issues. [28, 29] Overall, these contradictory findings suggest that more research is required to determine the influence of screen type on factors such as visual performance, visual fatigue and reaction time. [35]
Table 1. A summary of different vision charts available for measuring
visual acuity and functional reading ability
Test Description Outcome measure Snellen chart Regan charts Bailey-Lovie chart Early treatment diabetic retinopathy study (ETDRS) chart
Single, uppercase optotypes to measure logMAR visual acuity
High-contrast distance acuity (Regan, Bailey-Lovie and ETDRS charts are also available in low-contrast formats)
Jaeger reading chart Birkhauser reading chart
Words and sentences to measure near visual acuity (both with non-logarithmic progression)
High-contrast near acuity
Amit Navin Jinabhai, Graeme Young, Lee Anthony Hall et al. 6
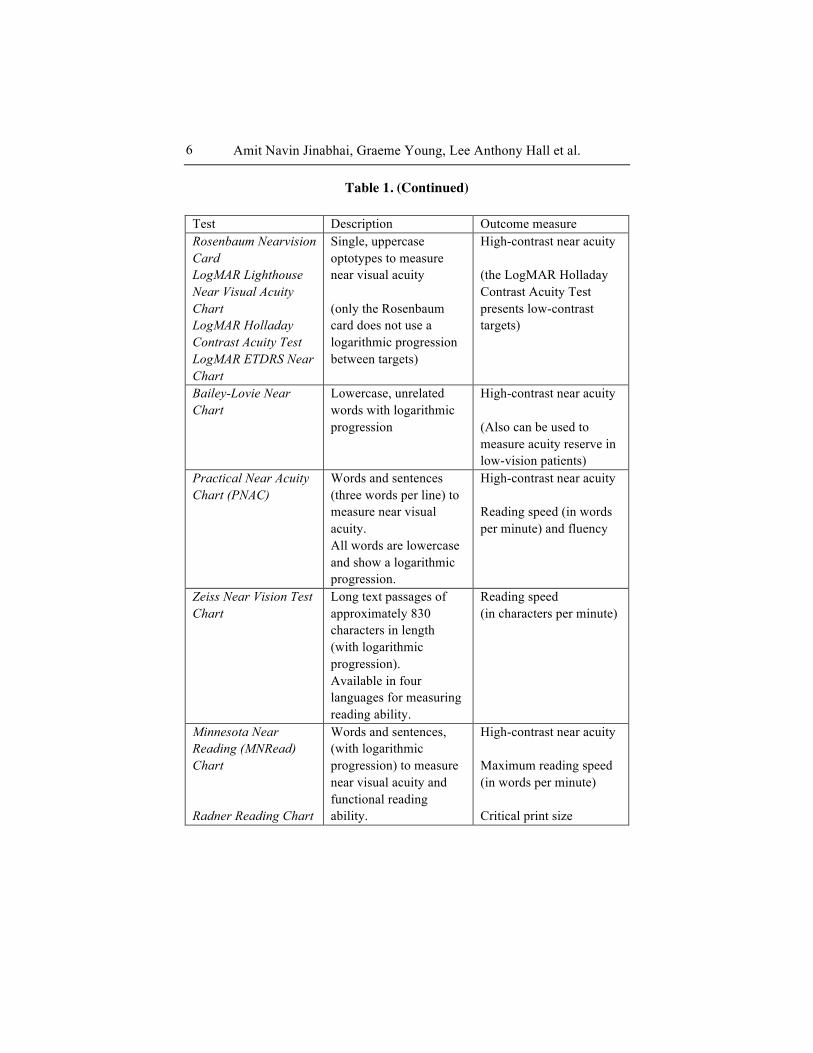
Table 1. (Continued)
Test Description Outcome measure Rosenbaum Nearvision Card LogMAR Lighthouse Near Visual Acuity Chart LogMAR Holladay Contrast Acuity Test LogMAR ETDRS Near Chart
Single, uppercase optotypes to measure near visual acuity (only the Rosenbaum card does not use a logarithmic progression between targets)
High-contrast near acuity (the LogMAR Holladay Contrast Acuity Test presents low-contrast targets)
Bailey-Lovie Near Chart
Lowercase, unrelated words with logarithmic progression
High-contrast near acuity (Also can be used to measure acuity reserve in low-vision patients)
Practical Near Acuity Chart (PNAC)
Words and sentences (three words per line) to measure near visual acuity. All words are lowercase and show a logarithmic progression.
High-contrast near acuity Reading speed (in words per minute) and fluency
Zeiss Near Vision Test Chart
Long text passages of approximately 830 characters in length (with logarithmic progression). Available in four languages for measuring reading ability.
Reading speed (in characters per minute)
Minnesota Near Reading (MNRead) Chart Radner Reading Chart
Words and sentences, (with logarithmic progression) to measure near visual acuity and functional reading ability.
High-contrast near acuity Maximum reading speed (in words per minute) Critical print size

Clinical Techniques to Assess the Visual and Optical Performance ... 7
3. CONTRAST SENSITIVITY Like VA, contrast sensitivity describes visual performance under a limited
set of conditions governed by factors such as the target’s luminance, the selected testing distance and the subject's pupil size. Oshika et al. [36] have also demonstrated that contrast sensitivity is significantly correlated with ocular coma aberrations, which tend to increase in magnitude with increasing pupil diameter. [37-39] Various methods of recording contrast sensitivity have been reported, as it is widely accepted that a measurement of VA alone does not fully represent the visual disability induced by cataract. [40] Classically, the Pelli-Robson chart was used in most early IOL studies. [41, 42] However, a major limitation of this instrument is that all the optotypes are of the same size (spatial frequency); hence this methodology only evaluates a small element of the complete human contrast sensitivity function. [36, 43] Other tests, such as the Functional Acuity Contrast Test (FACT) chart (Vision Sciences Research Corp.; Walnut Creek, CA, US) [44, 45] and the CSV-1000E (Vector Vision, Greenville; OH, US) [46-48] have been selected in more recent investigations. Both these tests are based on the original Vistech Contrast Test System (Vistech Consultants Inc.; OH, US). [49] The FACT chart uses a forced-choice method and presents sine-wave gratings of 5 spatial frequencies (from 1.5 to 18 cycles/degree) at 9 different levels of contrast (from 0.5 % to 25 % contrast). The patient is asked to report the last grating they can see for each horizontal row (spatial frequency) and its orientation, as either right, up or left. The last correct grating seen for each spatial frequency is then plotted on a contrast sensitivity curve using specialised software (Eye View Functional Analysis Software; Vision Sciences Research Corp.). In addition, the FACT chart can be used to measure contrast sensitivity at two different controlled luminance levels: mesopic (6 cd/m2) and photopic (85 cd/m2). The chart is currently available for use at both distance and near.
The CSV-1000E test also uses a forced-choice methodology. The instrument features a series of photocells to monitor and calibrate luminance to 85 cd/m2. At the testing distance of 2.5 metres, the chart displays sine-wave gratings at spatial frequencies of 3, 6, 12, and 18 cycles/degree, each on a separate row. Each row presents 17 circular patches (each 1.5 inches in diameter), the first presents a grating with high contrast for demonstration. The remaining patches are arranged into 8 columns along each row, decreasing in contrast from left to right. In each column, one grating is displayed in either the upper or lower patch, whereas the other patch is isoluminant (appears blank). Patients must identify which patch displays the grating (either top or

Amit Navin Jinabhai, Graeme Young, Lee Anthony Hall et al. 8
bottom of the column) whilst viewing across each row. Subjects are encouraged to guess if a grating is at least partially visible; however, if no gratings are seen the response should be ‘both blank’. The contrast level of the last correct response is recorded as the threshold value. As the potential to randomly guess the correct answer is high (one in two), measurements may become significantly distorted, perhaps overestimating visual performance. Nonetheless, the CSV-1000E device is designed with built-in glare sources (white LEDs) allowing contrast sensitivity measurement under glared conditions. [48] The Brightness Acuity Tester (BAT; model 1000, Marco Ophthalmic Inc. Jacksonville, FL, US) has also been used to create glare whilst measuring contrast sensitivity for patients implanted with multifocal IOLs. [50] However, this method tends to give inaccurate predictions of disability glare when using the device’s high-intensity setting. [51, 52] Figure 1 displays the characteristics of various methods of assessing contrast sensitivity and the different parts of the contrast sensitivity function they encompass.
Figure 1. The contrast sensitivity function (CSF) curve demonstrating areas of the CSF assessed by different test methods.
Forced-choice contrast sensitivity tests, using sine-wave gratings, show poor repeatability in young healthy subjects, as well as cataract and post-LASIK patients. [53-55] Other reports have demonstrated ‘ceiling’ effects in young subjects and post-LASIK eyes [54, 56] and ‘floor’ effects in patients

Clinical Techniques to Assess the Visual and Optical Performance ... 9
with cataract. [40, 56] This poor repeatability is likely due to the number of trials used; ideally, forced-choice tests should be performed with several repeated trials, as fewer trials typically show variable results. [57, 58] Additionally, forced-choice tests are prone to ‘guessing’ errors, e.g; with the FACT test, the subject has a one in three chance of correctly identifying the grating. Furthermore, forced-choice tests usually require longer testing times, [59] perhaps reducing the subject’s concentration levels.
Given the aforementioned limitations, a simpler and faster method of assessing contrast sensitivity over a range of different distances is desirable. To date, most reports evaluating contrast sensitivity for patients implanted with IOLs have compared measurements between eyes implanted with multifocal and monofocal IOLs, [60-63] or have analysed the differences in contrast sensitivity between eyes implanted with aspheric and spherical IOLs. [47, 64-66]
4. FUNCTIONAL READING ABILITY In addition to near VA, near visual performance may also be evaluated
through functional reading ability. Several reports have proposed that functional reading speed [67-69] and critical print size [70-73] should be used to evaluate visual performance for patients implanted with presbyopia-correcting IOLs. Particularly as it is widely accepted that patients with poorer near vision often require letters that are two (or more) times larger than their threshold acuity to achieve their maximum reading speed. [74]
Various metrics can be evaluated while assessing functional reading ability including:
1. Reading acuity (logMAR): the smallest print that can be read
accurately without making significant errors. This measure is similar to distance VA, except that reading acuity is based on structured sentences rather than individual letters.
2. Maximum Reading Speed or MRS (in either words or characters per minute): Reading speed is usually determined for each sentence on the chart as the number of words read correctly, divided by the time taken to read the sentence. Therefore, in theory, the MRS is the reading speed with print larger than the critical print size, so that the subject’s reading speed is not limited by the size of the print. Different approaches include averaging the supra-threshold reading speed

Amit Navin Jinabhai, Graeme Young, Lee Anthony Hall et al. 10
across multiple acuities [75, 76] and selecting the maximum reading speed achieved across supra-threshold acuities. [77]
3. Critical print size or CPS (logMAR): the smallest print at which the subject can read without a reduction in reading speed, hence, this is usually larger in size than the threshold reading VA. The CPS can be determined by observation of a plot of reading speed (ordinate) versus print size (abscissa). As the print size reduces, the reading speed falls outside of a defined confidence interval, or below a percentage of the supra-threshold reading speed. [76] The CPS can also be determined through mathematical curve fitting (exponential decay function). [78]
Whittaker and Lovie-Kitchin [79] suggested that a reading speed of at
least 80 words per minute (wpm) is required for comfortable recreational reading. However, it is expected that reading speed will be unique for each person and is likely to be dependent on the subject’s intellectual level, comprehension and motivation, [80] as well as other factors aside from visual clarity. Therefore, the complexity of the words and sentences used in the chart’s design are also likely to influence reading speed. To overcome these issues, it has been proposed that the ideal instrument should use unrelated words (although this may appear to lack realism for the patient) and sentences of approximately equal legibility and syntactic complexity to minimise variability between sentences of different acuities. [14, 73, 80] Similarly, to account for potential differences in crowding/contour interactions, it is desirable to have an equal number of characters, spaces and words on each test line. [81] Test charts typically used to evaluate functional reading for patients with presbyopia-correcting IOLs include the Minnesota low-vision reading test (MNRead) chart (Lighthouse International, NY, US), [80] and the Radner chart (Precision Vision; La Salle, IL, US). [73]
Although both the MNRead and Radner test charts have been shown to provide repeatable [74, 75] and reliable results, [82] there are some limitations. For example, both charts are designed to be used at a recommended working distance of 40 cm only, rather than at the subject’s own, habitual working distance. The charts also use short sentences with only a limited number of words on each line, therefore, any reading hesitation or timing error results in a large difference in the calculated reading speed.
Hahn et al. [83] developed an alternative reading chart, designed with longer texts of an equal length of 830 ± 2 characters (Zeiss Near Vision Test Chart; Cal Zeiss Meditec, Jena, Germany), which is available in four languages. Here, the number of characters is used to measure reading speed (in
Clinical Techniques to Assess the Visual and Optical Performance ... 11
characters per minute) rather than the number of words, since the length of words can vary considerably between different languages. The charts have previously been adopted for measuring reading speed, [84] but not yet in studies of patients implanted with IOLs.
In addition to the metrics and measurements described above, Hutz and co-workers [68] have proposed measuring reading acuity and reading speed under different illumination conditions to elucidate differences in visual performance between different presbyopia-correcting IOLs. Such a methodology can also be coupled with measurements using medium-contrast and low-contrast targets to obtain a broader knowledge of the visual performance likely to be achieved under a range of different viewing conditions.
5. ASSESSMENT OF ACCOMMODATION Accommodation is defined as a dioptric change in the eye’s power whilst
focussing on a near object, resulting in a myopic refractive shift. [85] In a young phakic eye, the accommodative optical change is attributable to an increase in the power of the crystalline lens due to alterations in lens surface curvatures. [86-88] For pseudophakic patients fitted with presbyopia-correcting IOLs, the mechanism used to provide useful vision over a range of different distances varies depending on the lens platform. Currently commercialised, accommodating IOLs are based on two fundamental principles. Firstly, using a single optic design which moves anteriorly secondary to ciliary muscle contraction; such as the BioComfold IOL (Morcher, Stuttgart, Germany), Tek-Clear IOL (Tekia Inc. Irvine, CA, US), Kellan Tetraflex KH-3500 IOL (Lenstec, St Petersburg, FL, US), the Crystalens AO IOL (Bausch & Lomb, Rochester, NY, US) and the 1CU IOL (HumanOptics AG, Erlangen, Germany). The alternative method features a dual-optic design (Synchrony IOL; Abbott Medical Optics, San Clara, US), with a mobile positive lens (positioned anteriorly) and a stationary negative lens (positioned posteriorly). As the ciliary body contracts, the two lenses move further apart, using spring-loaded haptics, causing an increase in magnification and accommodation.

Amit Navin Jinabhai, Graeme Young, Lee Anthony Hall et al. 12
5.1. Subjective Measurement of Accommodation
5.1.1. Defocus Curves Defocus curves are used to evaluate the subjective range of clear vision
achieved with presbyopia-correcting IOLs; a schematic example is shown in Figure 2. Although defocus curves can be measured with targets placed at a range of distances in front of the eye, [89-92] this method is time consuming; furthermore, it is difficult to control for target size and luminance. Instead, the patient is usually first corrected for distance vision; subsequently their VA is then measured whilst viewing a distance letter chart (typically at 6 m) with lenses of negative (increasing the accommodative demand) and positive power (which should reduce VA if the distance refraction is optimal, allowing more precise curve-fitting) placed in front of the eye. Some studies have used a near rather than a distance letter chart; however, this seems to lead to a distorted defocus curve appearance. [93-95]
A wide variety of lens power ranges have been proposed to derive defocus curves when evaluating visual performance achieved with presbyopia-correcting IOLs. These vary between +6.00 to -6.00 D for multifocal IOLs, [96, 97] to +0.50 to -3.00 D for accommodating IOLs. [98, 99] Virtually all studies use 0.50 D-steps, but the usefulness of this increment size has not been confirmed. Polynomial curve-fitting can then be used to generate a range of metrics from the defocus curve (e.g. the area under the curve), which may enable differentiation between different presbyopia-correcting IOLs. [100-102]
The defocus induced by negative lenses is typically overcome by the accommodative element of the presbyopia-correcting IOL, or the patient’s own accommodative ability if the patient under investigation is pre-presbyopic. Although defocus curves have been widely used to investigate the visual performance of presbyopia-correcting IOLs, several factors need to be considered while using this technique, such as monocular vs. binocular measurements, letter/lens randomisation, background illumination and target contrast. Measuring defocus curves binocularly, rather than monocularly, can better simulate most day-to-day visual tasks. Equally, binocular measurements are needed to assess ‘mix-and-match’ presbyopia-correcting options, such as monofocal IOLs fitted to achieve mono-vision, [103, 104] bifocal IOLs, [90, 105] multifocal IOLs [68, 106] or a combination of multifocal and monofocal IOLs. [107]
Gupta and co-workers [108] have demonstrated that it is important to consider randomisation of the defocus lenses, the test letters, or both, to

Clinical Techniques to Assess the Visual and Optical Performance ... 13
overcome learning effects in younger subjects. The effects of learning could result in an overestimation of visual performance at different distances.
Changes in pupil size can affect the results of defocus curve measurements through changes in higher-order aberrations, [37, 109] coupled with changes in exposure of the lens’ optics, which may impact on the VA achieved. [36, 110] To overcome this limitation, it may be advantageous to measure defocus curves under different lighting conditions and with different letter contrasts to fully appreciate visual performance under different viewing conditions. However, performing such a comprehensive battery of tests can prove to be time-consuming and both visually and physically demanding for the subject. Other important considerations include correcting the VA results to account for the magnifying effect of the test lens’ power and back vertex distance. [89, 100]
Defocus curves have been frequently used to demonstrate improvements in the focusing range provided by presbyopic IOLs compared to monofocal IOLs, [50, 97-99, 111-114] and to differentiate between different presbyopia-correcting technologies. [106, 115] However, the evaluation of the amplitude of accommodation from defocus curves differs substantially between even carefully conducted studies, depending on the criteria used to define ‘the range of clear vision’. [100] The direct comparison analysis method compares the VA achieved at each level of defocus, but is susceptible to type-1 errors, unless repeated-measures ANOVA or a Bonferroni correction is used.
Depth-of-focus metrics provide a general overview of the anticipated performance of an IOL. This is defined as the dioptric range over which subjects can sustain an absolute or relative level of VA. However, there is no general consensus for the correct threshold level of VA, and often the criteria used are not stated, preventing comparisons between studies. [100] A ‘relative’ criterion determines the cut-off point relative to the best-achieved VA. To date, relative acuity criteria have not been used in multifocal IOL studies, but have been used for assessment of accommodating IOLs. [113] A criterion of a +0.04 logMAR reduction in VA from the best-corrected distance acuity (to account for the variability of measurements made using a logMAR chart, which is relatively unaffected by age), [116] has been shown to give the most reliable results. [100] Alternatively, with ‘absolute’ acuity criteria, the limits of VA are independent of the best-corrected VA. A limit of +0.30 logMAR is the most common criterion used in multifocal IOL studies and matches the level of acuity defined as the driving standard across Europe. [117]
The two focal points created by the simultaneous bifocal and multifocal IOL designs result in a distinctive profile with two or more peaks of optimum

Amit Navin Jinabhai, Graeme Young, Lee Anthony Hall et al. 14
acuity, one at distance and the other at the blur level corresponding to the near addition powers. [92] Thus, defocus curves demonstrate the magnitude of the near addition powers (i.e. the separation in dioptres between the distance and near/intermediate peaks), as well as the quality of vision at distance, near and intermediate distances. [118] Whilst a reduction in acuity of +0.04 logMAR has been shown to be most appropriate for pre-presbyopes and accommodative restoration procedures, the defocus curve of a simultaneous vision bifocal or multifocal IOL can pass through the depth-of-focus criterion several times. Therefore, a new area metric has been developed and validated, [119] based on the area between a +0.30 logMAR absolute cut-off (or range-of-focus) and the defocus curve calculated for the upper and lower limits of distance (-0.50 and +0.50 D), intermediate (-2.00 and -0.50 D) and near vision (-4.00 and -2.00 D); Figure 2. This introduces a method of standardisation that will allow a comparison of different presbyopia-correcting strategies.
Figure 2. A schematic example of a ‘typical’ defocus curve from a presbyopia-correcting IOL demonstrating the absolute ‘range-of-focus’ and three ‘area-of-focus’ defocus curve metrics. The cut-off value of +0.30 logMAR is depicted by the horizontal dashed line. The black arrow depicts the ‘range-of-focus’ metric using this ‘absolute’ acuity criterion. The left-hand zone under the curve represents the ‘near’ area metric (between 25 and 50 cm); the central zone under the curve represents the ‘intermediate’ (INT) area metric (between 50 cm and 2 m), and the right-hand zone under the curve represents the ‘distance’ (DIST) area metric.

Clinical Techniques to Assess the Visual and Optical Performance ... 15
5.1.2. Near Point Measurement (RAF Rule) The RAF rule has long been used to measure accommodation for patients
implanted with accommodating IOLs. [99, 113, 120] However, this method is known to over-estimate the true amplitude of the response, due to the increasing target visual angle as it is brought closer towards the eyes and changes in external illuminance. [121, 122]
5.2. Objective Measurement of Accommodation Although subjective tests are useful to quantify patient satisfaction, these
methods cannot discriminate between true accommodation and pseudoaccommodation due to other factors such as a reduction in pupil size. Objective methods to assess dynamic accommodation include autorefraction, retinoscopy, aberrometry and imaging any movement of the implanted IOL optics.
5.2.1. Retinoscopy
This method allows the operator to visualise changes in dioptric power as the patient looks at targets positioned over a range of different distances. [98, 99, 120, 123] However, this manual procedure relies on the observer’s subjective interpretation of the light-reflex which may lead to a poor reproducibility of results between different practitioners. [124]
5.2.2. Autorefraction
Previous reports have measured changes in refractive power for patients implanted with accommodating IOLs using open-field autorefractors, [125] with the patient viewing static [113, 126-129] or dynamic accommodative targets. [126] However, pupillary constriction, either through senile miosis or through attempted accommodation, causes a hindrance for autorefractors. Minimum pupil diameters for autorefractor devices typically range between 2.3 mm (Shin-Nippon NVision-K5001/Grand Seiko WR-5100K and Grand Seiko Auto Ref/Keratometer WAM 5500) and 2.9 mm (Shin-Nippon SRW-5000/Grand Seiko WV-500). [125] Difficulties in capturing data through small pupils, coupled with bright Purkinje image reflections off the anterior IOL surface, or even potential posterior capsular opacification, may limit the usefulness of autorefractors in evaluating accommodation changes. [130] Nonetheless, Wolffsohn et al. [128] have demonstrated that the Shin-Nippon NVision-K5001/Grand Seiko WR-5100K device provides repeatable
Amit Navin Jinabhai, Graeme Young, Lee Anthony Hall et al. 16
measurements of accommodation, comparable to subjective refraction data. In comparing objective and subjective measurements, other reports have shown that subjective methods tend to overestimate accommodation compared to autorefraction data. [99, 131, 132] This was to be expected, as subjective measurements include the added benefit of an increased depth-of-field due to pupillary miosis.
The PowerRefractor device (PlusOptix, Nuremberg, Germany) has been used to evaluate accommodating IOLs. [98, 99, 126] This instrument can provide continuous objective measures of refraction and pupil size for both eyes simultaneously, using eccentric photorefraction, with the camera positioned at a distance of 1 m from the patient. [133] Refractive results are calculated based on the light intensity distribution within the pupil, which cannot be precisely predicted between subjects, therefore individual calibration needs to be performed for accurate results. [133] Similar to autorefractors, evaluations of accommodation made with the PowerRefractor are achieved by measuring refraction whilst the patient fixates on distance and near targets. [99]
5.2.3. Change in IOL Optic Axial Position or Shape
An evaluation of any change in anterior chamber depth (ACD) or IOL optic surface shape upon ciliary body contraction can also be used as an indicator of IOL accommodative ability. Various methods of biometric assessment have been employed including anterior segment optical coherence tomography (AS-OCT), [113, 129, 134] partial coherence interferometry, [135] ultrasound biomicroscopy, [136, 137] and Scheimpflug imaging (Zeiss IOL master; Carl Zeiss Meditec, Jena, Germany). [99, 120] Whilst these methods can accurately image an axial shift in the IOL optic, or a change of crystalline lens surface curvature, they do not provide a direct measurement of a change in the refractive power of the eye.
Some investigations have used 2% Pilocarpine eye-drops to stimulate the ciliary body to induce accommodation to allow accommodating IOL optic axial movement analysis. [99, 135, 136] An advantage of pharmacological, rather than stimulus-driven accommodation, is that it does not require patient compliance to focus on a near target. [135] However, the subsequent powerful ciliary body contraction is coupled with marked pupillary constriction, [138] which hinders the measurement of objective refraction changes. [139] Furthermore, pharmacological stimulation of accommodation is not representative of the normal physiologic accommodative response, [135, 140]

Clinical Techniques to Assess the Visual and Optical Performance ... 17
but may demonstrate the maximum potential accommodative ability of an accommodative IOL rather than its habitual performance.
5.2.4. Aberrometry
Similar to autorefractors, aberrometers can be used to measure objective changes in accommodation. An objective refraction is obtained by converting the second-order Zernike terms into the corresponding defocus and astigmatic components. [39] These devices have the advantage that as well as assessing central optical changes, the wavefront aberrations over the whole pupil aperture can also be quantified. Unfortunately, few are open-field, making them susceptible to instrument myopia, [141] but some use an internal Badal optical system to blur the subject to infinity. [142]
Most aberrometers operate over a narrow wavelength range (typically around 780-820 nm) and, therefore, require a correction to adjust measurements to equate to a wavelength of approximately 550 nm (the peak of the human spectral sensitivity curve). [143] Each set of captured wavefront errors are specific to a given pupil size only. Therefore, to facilitate comparisons between different subjects, measurements must be rescaled to the smallest pupil size common to all subjects. Alternatively, measurements can be recalculated into dioptric equivalents terms; however, this method requires separate data calculations. [144] As with autorefraction data, subjective tests tend to overestimate measurements of amplitude of accommodation compared to objective aberrometry. [132, 145, 146]
In summary, the evaluation of accommodating IOLs should include objective measures of both biometric and refractive changes, avoiding the instillation of Pilocarpine, to verify the existence of true pseudophakic accommodation. [130, 139] Subjective measures are also essential in regard to clinical outcomes, but these should not be interpreted in isolation. Most studies of accommodating IOLs have reported only subjective findings or have used Pilocarpine drops to stimulate accommodation to record objective changes in ACD. Currently, only a few studies have measured objective changes in refraction and IOL position. [113, 129] In general, there is a requirement for objective accommodation measurement techniques to be standardised to allow widespread use and acceptance. [130, 147, 148]
Amit Navin Jinabhai, Graeme Young, Lee Anthony Hall et al. 18
6. ESTIMATING OPTICAL QUALITY Higher-order aberration measurements have been frequently used to
explore the optical quality of eyes implanted IOLs. [66, 149, 150] The most commonly used optical quality metric is higher-order root-mean-square (RMS) wavefront error, however, RMS error does not provide any information regarding the magnitude or sign of individual aberration coefficient terms. [151] Modulation transfer function (MTF) has been used to explore the effectiveness of correcting spherical aberration using aspheric IOL designs, [149, 150, 152-156] but it cannot account for important factors affecting visual performance such as neural processing and patient adaptation. Arguably, the Strehl ratio metric may provide more useful information, as it evaluates performance compared to an ideal, diffraction-limited system. [150, 153, 154] Nonetheless, such image quality metrics are also specific to only one pupil size. In this regard, it can be useful to dilate the subject’s pupils before capturing wavefront aberrations, as this facilitates analysis over a range of pupil sizes. However, it may be argued that pupillary dilation creates a ‘non-habitual’ scenario, influencing the phakic subject’s ability to drive and/or read after measurements, particularly if a cycloplegic drug is used to achieve mydriasis. Carkeet et al. [157] reported small, yet significant, differences between higher-order aberration measurements following pupil dilation with cycloplegic and non-cycloplegic eye drops and changes in the location of the pupil centre occur following pupil dilation. [158] Other authors have reported that retinal image plane metrics correlate better with visual performance; [159, 160] however, these require separate data computation using additional software (GetMetrics; University of Houston, College of Optometry).
The Optical Quality Analysis System, or OQAS device, (VisioMetrics, Terrassa, Spain) uses the double-pass technique to evaluate intraocular light scatter and retinal image quality. Unlike the Hartmann-Shack technique, the OQAS device directly captures an image of the point source projected onto the retina, therefore, the captured images represent the point-spread function (PSF). Generation of a global PSF with the Hartmann-Shack technique requires computational reconstruction of the wave aberration leaving the eye, through complex evaluations of each individual spot image location captured at the wavefront sensor’s charge-coupled device (CCD) camera. Spot imaging errors (e.g. spot image ‘crossover’) at the sensor may cause inaccuracies resulting in an under- or overestimation of optical quality. [161] Additionally, analysis of the captured spot image locations does not fully describe important optical phenomena such as scatter.

Clinical Techniques to Assess the Visual and Optical Performance ... 19
The main visual metrics outputted by the OQAS device include, • Modulation transfer function (MTF) cut-off value – the highest spatial
frequency (in cycles per degree) at which the eye can image an object on the retina with a contrast of 1 %
• Objective scattering index (OSI) – an objective measure of intraocular scatter, comparing the amount of light falling outside the double-pass retinal intensity PSF and the amount of light at the centre of the PSF. Generally, the higher the OSI, the larger the magnitude of scatter [162]
• Two-dimensional (2-D) Strehl ratio – the ratio of the PSF’s central maximum achieved by the measured (aberrated) eye compared to the theoretical maximum achieved by an ‘ideal’, aberration-free optical system
• PSF width – the width of the PSF (in minutes of arc) can be measured along various points of the function, e.g. the ‘half-height’ metric is the width of the PSF at 50 % of the maximal height.
The repeatability of the these metrics have been found to be good by some
researchers, [163, 164] but poorer by others, [165] perhaps due to variations in the tear film [166-168] or in eyes with larger magnitudes of scatter, such as eyes with dense cataracts [162] and post-LASIK eyes. [164] Furthermore, the OQAS device uses near infrared light (approximately 780 nm), although this provides comfortable fixational viewing conditions during measurements, infrared light penetrates deeper into the retinal tissues causing larger magnitudes of scatter. [169]
The OQAS instrument’s entrance pupil is typically fixed at a diameter of approximately 2 mm, whereas the exit pupil diameter is adjustable (between 2 and 7 mm) facilitating the derivation and interpretation of non-rotationally-symmetric aberrations. [170-172] The PSF is classically obtained through phase-retrieval algorithms which combine two double-pass retinal images. [173] The first retinal image is captured using equivalent-sized entrance and exit pupil diameters (i.e. 2 mm) and the second captured when the entrance pupil is smaller in diameter than the exit pupil, resulting in a lower resolution PSF than when the pupil sizes were equivalent. This computational process can cause inaccuracies when evaluating optical quality with diffractive multifocal IOLs, especially as most lens designs feature their first diffractive step within the central 2 mm. Additionally, the double-pass technique assumes
Amit Navin Jinabhai, Graeme Young, Lee Anthony Hall et al. 20
that the incident light of the first pass is minimally affected by the eyes’ optics, which is not the case for those implanted with diffractive IOLs. [169]
When comparing MTFs measured with the double-pass method vs. the Hartmann-Shack technique (both with a wavelength of 780 nm), similar results were found in young, visually-normal subjects with low magnitudes of intraocular scatter, but the Hartmann-Shack method typically over-estimated retinal image quality in older patients with early lenticular opacities, post-LASIK patients and post-IOL implantation patients. [174] Moreover, the MTFs obtained with the double-pass method showed better correlation with VA compared to the MTFs measured using the Hartmann-Shack technique. A similar trend was also reported when comparing optical quality measured with the double-pass method and the laser ray-tracing (LRT) technique, both using a wavelength of 532 nm. [175]
7. IOL ROTATION, TILT AND DECENTRATION Accurate positioning and alignment of an IOL with respect to the visual
axis is critical to ensure optimal correction of refractive error and spherical aberration. Unwanted IOL tilt and decentration of multifocal, aspheric or toric IOLs has a significantly higher impact on visual function compared to spherical, monofocal IOLs. [176, 177] Possible sources of post-implantation positional errors include:
• Friction between the IOL haptics and the capsular bag, dependant on
the capsule and IOL size • Compression of the IOL haptics due to capsular bag shrinkage • Instability of the anterior chamber due to variations in post-operative
IOP and ocular trauma • Aspects of the IOL design, e.g. plate or loop style haptics, IOL and/or
haptic materials and the overall haptic diameter Other factors affecting IOL positional stability include the capsular bag
diameter, [178, 179] capsulorhexis size, anterior and posterior capsule apposition, [180] IOL design [181, 182] and IOL material. [183, 184] In addition, Shah et al. [185] found that eyes with longer axial lengths had higher magnitudes of toric IOL rotation than eyes with shorter axial lengths. This
Clinical Techniques to Assess the Visual and Optical Performance ... 21
agrees with Vass et al.’s [179] previous study, which showed a relationship between axial length and capsular bag diameter.
7.1. Rotation
Previous studies evaluating the rotational stability of toric IOLs have used
a slit-lamp eye-piece (with an integrated axis indicator graticule) [186, 187] or a slit-beam protractor. [181, 188, 189] Although useful, these slit-lamp-based techniques are dependent on the patient maintaining a stable, erect head position at each assessment visit, and are usually limited to estimating axis rotations to the nearest 5 degrees only.
Other studies have used digital slit-lamp images to investigate toric axis stability; [182, 190-192] however, no compensation for axis alterations, due to either head tilt and/or ocular rotation, were made. Recent techniques have employed image-analysis of digital photographs, using customised software, in an attempt to eliminate these errors. [185, 193-195] Such imaging techniques compare the position of the toric axis alignment markers with easily distinguishable ocular landmarks, such as episcleral blood vessels or iris features, on opposite sides of the pupil margins, to normalise for any eye rotation. Furthermore, image-overlaying analysis software can also be used to determine the magnitude of any potential IOL decentration by comparing the centre of the outlined IOL optic edge, the pupil margin and the limbal margin. [185, 193, 194]
7.2. Tilt and Decentration Several reports have described the use of Scheimpflug imaging to evaluate
IOL tilt and centration within the capsular bag using the EAS-1000 device (Nidek Inc., Gamagori, Japan) [196-200] and the Oculus Pentacam (Oculus, Wetzlar, Germany). [176, 201-203] Both instruments are designed so that the image and object planes are tilted with respect to each other to intersect at a point, allowing the entire object to be sharply focussed. [204] As light passes through the eye and through the tilt of the Scheimpflug camera, the unprocessed Scheimpflug image will be distorted due to refraction through the corneal surfaces. [87, 205, 206] Therefore, a correction factor must be applied before evaluating IOLs images; however, it is difficult to accurately account

Amit Navin Jinabhai, Graeme Young, Lee Anthony Hall et al. 22
for the effects of hydration and variations in refractive index within such ocular tissues. [202, 207]
The tilt angle of the IOL optical axis relative to the eye’s visual axis is estimated using specialised software which evaluates various points along both the anterior corneal and anterior IOL surfaces of corrected Scheimpflug images. Using this imaging technique, previous studies have demonstrated that IOL tilting induces unwanted 3rd-order coma. [177, 208] Nonetheless, the Scheimpflug imaging method to estimate IOL tilt and rotation does not include compensations for any potential tilting of the head or ocular cyclotorsion during image capture. In this regard, the observer has to ensure that the patient’s head is kept as erect and vertically aligned as is possible for each measurement/visit. [209]
Another technique used to assess IOL tilt and decentration includes evaluating Purkinje image reflections (P) off the ocular refracting surfaces. [201, 210-213] The radius of curvature of the different ocular components (acting as mirrors) can be estimated from the relative position of the reflected images of the light source. The first (P1: air-tear film-cornea) and second (P2: cornea-aqueous) Purkinje images are typically similar in size and usually overlap, due to the close proximity of the corneal surfaces. The aqueous-lens reflection (P3) is usually the largest in size (approximately twice P1) and finally the lens-vitreous reflection (P4) is usually slightly smaller than P1; however, it is inverted with respect to the other images. [201]
Purkinje image misalignment is due to a combination of global eye rotation, crystalline lens decentration and tilting of the crystalline lens. [211] Purkinje imaging allows evaluation of lens tilt and decentration without the need for image distortion corrections; however, multiple double LEDs of differing separation are required to prevent over-estimations of the posterior lens radius of curvature. [201, 213] Tabernero et al. [211] designed a custom-built Purkinjemeter using a semi-circular array of 9 infrared LEDs to illuminate the eye co-aligned with a telecentric camera objective lens and a CCD camera. The use of a semi-circular light source offers several advantages over a point source; e.g. the generated reflections show a non-symmetric geometry, allowing simple identification of each Purkinje image even when partially reduced in intensity by the pupil. Furthermore, multiple LEDs allow estimates of the radii of curvature as a function of radial distance and therefore, estimates of asphericity. In order to determine IOL centration, customised image-processing software is typically used to determine the location of each Purkinje image with respect to the centre of the entrance pupil (fitted to an ellipse).

Clinical Techniques to Assess the Visual and Optical Performance ... 23
In comparing Scheimpflug and Purkinje imaging in the same population, Rosales et al. [201] reported higher variability with the Purkinje image technique. Purkinje imaging can evaluate both lens surfaces, whereas Scheimpflug imaging is hindered by the iris, particularly with increased accommodation. Nonetheless, Scheimpflug imaging provides much more complete information on the biometry of the anterior chamber and lens geometry, beyond radius of curvature. On the other hand, the Purkinje imaging method is easier to set-up and to incorporate into existing optical systems incurring relatively low costs.
8. STEREOPSIS In addition to optical quality and visual performance, accurate co-
ordination of the two eyes is crucial for near vision manipulation tasks. Of the various near vision stereoacuity instruments available, the Wirt rings of the Titmus contour test (Stereo Optical Co. Inc.; Chicago, IL, US) appear to have been most frequently used to assess stereopsis in patients bilaterally-implanted with multifocal IOLs, [214-218] or monofocal IOLs. [216, 219] In contrast, Random Dot tests (e.g. the Lang tests I and II; Oculus, Wetzlar, Germany) have been used for evaluating monofocal and multifocal IOLs implanted unilaterally. [220, 221] Although useful in adult patients, stereoacuity measurements are invaluable in paediatric patients implanted with IOLs.
9. EVALUATION OF SCATTER (HALOES AND GLARE)
9.1. Forward Light Scatter (FLS) and Intraocular Straylight Inhomogeneities of the optical media, e.g. within the crystalline lens,
cause alterations in the trajectory of light rays passing through the eye. Scattered light deviated by less than 90 degrees is known as forward light scatter (FLS), which results in a veiling luminance becoming superimposed upon the retinal image, leading to a reduction in retinal image contrast and possible disability glare. [222] When assessing the optical quality of multifocal IOLs, it is important to differentiate between scatter and glare. Scatter is an optical phenomenon dependent on the intensity and wavelength of the incident light, and the optical and geometrical properties of the

Amit Navin Jinabhai, Graeme Young, Lee Anthony Hall et al. 24
scattering structure (e.g. refractive index, spatial distribution, size and shape). On the other hand, glare refers to a subjective perception, where there is excessive contrast loss or an inappropriate distribution of light disturbing the ability to distinguish detail. For normal eyes, FLS represents around 1 to 2 % of the incident light falling outside the ‘ideal’ position on the retina. [222] Scattering is usually attributed to the cornea, crystalline lens and fundus, [223] although the iris and the sclera may also contribute towards a small proportion of FLS, depending on the patient’s ethnicity. [224]
Objective measurements of FLS can be made using the van den Berg Straylight meter and the Oculus C-Quant (Oculus; Wetzlar, Germany) device. The C-Quant device is based on the van den Berg Straylight meter; however, unlike its predecessor, which uses the ‘direct comparison’ method, the C-Quant device uses the faster and more user-friendly forced-choice, ‘compensation comparison’ method. [225, 226] Coppens et al. [225] have demonstrated that the ‘compensation comparison’ method improves measurement repeatability and reliability. In support of this, other reports have suggested that the C-Quant device may be a suitable device for use in large scale clinical studies. [226, 227]
Theoretical predictions based on model eyes have suggested that diffractive multifocal IOLs induce more FLS than monofocal IOLs, [228] due to loss of light at higher diffractive orders. [229] In support of this, a number of studies have demonstrated that a small proportion of patients implanted with multifocal IOLs complain of photic phenomena, such as haloes and glare. [106, 230-233] However, increases in FLS (C-Quant) induced by multifocal IOLs do not appear to correlate with subjectively-reported glare symptoms, [230, 232, 233] perhaps indicating insensitivity of the C-Quant technique.
9.2. Halometry When viewing a distant target, haloes are formed as the out-of-focus
image from the near portion of a multifocal IOL typically shows a larger diameter than the sharper image focussed at the retina by the distance portion of the lens. Factors governing the size of the halo include the patient’s pupil diameter, the multifocal IOL’s near addition power, the distance power and the patient’s corneal power. [234] Halometry involves quantifying the size of the halo created by a bright central light along multiple meridians. The Glare & Halo computer program (Tomey; Nagoya, Japan) involves marking of the edge of the perceived halo, generating an area metric, which has been used to

Clinical Techniques to Assess the Visual and Optical Performance ... 25
compare the size of haloes experienced by patients implanted with multifocal versus monofocal IOLs. [234, 235] Pieh et al.’s [234] results showed that the Glare & Halo program demonstrated a high level of repeatability. However, the edge of a halo is often poorly defined, therefore complicating the subject’s identification task. Also, small head or eye (fixational) movements may also result in a shift in the spatial location of the perceived halo. Furthermore, the computational algorithm used to calculate the halo’s area is likely to assume that the halo has a circular ring shape; however, this assumption breaks down for eyes implanted with non-rotationally symmetric IOLs. An alternative approach, with high intra-session repeatability, has been introduced by Buckhurst et al. [236] Here a series of randomised letter targets are moved from a central LED towards the periphery along 8 different radial axes (in 45-degree steps), with the patient identifying when they are first seen. The target letters can be displayed at different sizes and levels of contrast. Buckhurst et al. [236] found that for patients implanted with non-rotationally symmetric multifocal IOLs, the perceived photic scotomas complemented the orientation of the IOL’s reading segment, whereas fully-diffractive IOLs induced uniform photic scotomas.
10. QUALITY OF LIFE (QOL) QUESTIONNAIRES Several questionnaires have been designed to investigate quality-of-life
(QOL) in patients with cataract. Although the majority of these instruments have not been specifically developed for pseudophakic patients, they have been used in a variety of IOL-implanted populations in an attempt to standardise patient reported visual outcomes, such as post-operative spectacle dependence, driving ability and the ability to perform various social activities. [237, 238] Table 2 summarises these instruments, their target audience, which traits they explore and their validation (where appropriate).
10.1. The Cataract Type Specification This instrument was first modified and validated by Javitt et al. [239] in a
comparative study of patients implanted bilaterally with multifocal IOLs versus patients implanted bilaterally with monofocal IOLs. Javitt et al. [240] found that the instrument’s internal consistency did not vary by method of administration (by self-administration at the site of care (pre-operative) and by

Amit Navin Jinabhai, Graeme Young, Lee Anthony Hall et al. 26
mail (post-operative)), race or gender, for patients undergoing first eye cataract surgery. The instrument investigates visual functioning across 5 scales: distance vision, near vision, daytime driving, night driving and glare-related symptoms. Gothwal et al.’s [241] study performed Rasch analysis [242] on data collected from patients awaiting cataract surgery. Gothwal et al.’s [241] results showed that only 2 of the 5 scales were valid and a revised version was developed consisting of 11 items.
10.2. The Near Activity Visual Questionnaire (NAVQ) Following a pilot study by Gupta et al., [243] Buckhurst and co-workers
[244] modified and validated a questionnaire designed to assess near visual function for patients implanted with presbyopic corrections, from spectacles and contact lenses, to multifocal IOLs. Following Rasch analysis, the original number of items was reduced from 19 to 10 (and the scale of responses from 6 to 4). The author’s results demonstrated that the instrument was internally consistent, valid and reliable in their subject population. Buckhurst et al. [244] also reported moderate correlations of NAVQ scores with both near VA and CPS scores, further highlighting the need for such questionnaires to contribute to the evaluation of the subjective perception of successful presbyopia correction.
10.3. The Quality of Vision (QoV) Questionnaire This instrument was developed and evaluated by McAlinden et al. [245]
The QoV questionnaire is a linear-scaled, 30-item instrument providing a QoV score in terms of symptom frequency, severity, and how bothersome the symptom is. The instrument appears to be suitable for measuring QoV in patients with all types of laser refractive correction, intraocular refractive surgery and eye diseases that cause QoV problems.
10.4. The Visual Function Index-14 (VF-14) QOL Questionnaire Originally designed by Steinberg et al., [246] this questionnaire has been
validated to assess functional impairment in cataract patients before and after monofocal IOL implantation. [247] Other authors have used this instrument to
Clinical Techniques to Assess the Visual and Optical Performance ... 27
evaluate visual outcomes in comparative studies of patients implanted with monofocal versus multifocal IOLs. [248, 249] Uusitalo et al. [250] proposed the exclusion of 7 items from the original questionnaire; this modified version, the VF-7 survey, has since been used to compare surgical outcomes for patients implanted with multifocal IOLs versus patients fitted with conventional monofocal IOLs. [251] Recently, Gothwal et al. [252] validated this 7-item questionnaire using Rasch analysis to assess its psychometric properties, and led to the development of an improved 8-item instrument.
10.5. The Catquest-9SF Instrument The Catquest-9SF test was initially developed and validated by Lundstrom
et al. [253] and consisted of 17 items across 4 subscales. The instrument has previously been used to measure changes in patient-reported visual function 6 months after cataract surgery compared to before surgery. [254] Furthermore, Lundstrom and Pesudovs [255] validated the psychometric properties of the instrument using data collected from 10,486 completed questionnaires (before and after cataract surgery) and found improved performance with a revised 9-item version, consisting of 7 functioning items and 2 global items.
10.6. Adapted National Eye Institute Visual Function Questionnaire-25 (NEI-VFQ-25)
Originally developed by Mangione et al., [256] the NEI-VFQ comprised
51 items to evaluate a broad spectrum of eye diseases. In a later study, Mangione et al. [257] compared a simpler, 25-item version of the test (the NEI-VFQ-25) against the original survey, and found comparable validity between instruments. Kohnen et al. [258] constructed a newer questionnaire by adapting sections from the near activities, distance activities and driving subscales of the original NEI-VFQ-25 test. Although Kohnen et al.’s [258] instrument has not yet been validated, it has been used to evaluate visual outcomes for patients implanted with multifocal IOLs. [106, 259]

Amit Navin Jinabhai, Graeme Young, Lee Anthony Hall et al. 28
10.7. The Visual Symptoms and Quality of Life (VSQ) Questionnaire
This instrument is available as a 14-item short form and a more detailed
26-item long form. The short form consists of 2 subscales for (1) symptoms and visual dysfunction, and (2) vision-specific QOL items. [260] Donovan et al.’s [260] validation study was performed on patients requiring ‘second’ eye cataract surgery randomised to either receive early (within six weeks) or routine surgery (7–12 months on a waiting list), with a follow-up visit approximately six months after surgery, to evaluate the effectiveness of second eye cataract surgery. The results showed that the internal consistency of both the visual symptoms/dysfunction and QOL items was high.
Aside from these validated instruments, the use of questionnaires
specifically exploring the appearance and prevalence of photic phenomena, such as haloes and glare, appear to be growing in popularity for studies of multifocal IOLs. Several authors have implemented their own questionnaires; [230, 231, 234, 235, 261-264] however, some reports do not fully disclose what questions were asked, [89, 230] or how the results were graded. [234] Although other studies have revealed the questions asked and the grading systems applied to the answers, [231, 235, 261, 263, 264] their results have not been scientifically validated. Furthermore, the proposed responses may not always use a continuous interval level. When attempting to quantify such data, scoring from ‘simple averaging’ or ‘summing of item responses’ (e.g., 0, 1, 2, and 3 for responses such as ‘not at all’, ‘a little’, ‘quite’, and ‘very’, respectively) assumes that the quantitative differences between each response option is equal, and that each question has equivalent value. Both these assumptions may be invalid rendering the questionnaire scores as non-linear. [265]
The US Department of Health and Human Services Food and Drug Administration (FDA) has published specific guidelines relating to the development of patient-reported outcome measures. [266] This document provides specific guidance on recording evidence relating to the development history of questionnaires to ensure instruments adequately measure their intended outcomes. It also provides advice relating to design factors including the number of items, item discrimination, scoring methods, response ranges and translation or cultural adaptability of the questionnaire.

Clinical Techniques to Assess the Visual and Optical Performance ... 29
Table 2. A summary of questionnaires used in cataract and IOL-implanted patients
Questionnaire Key references Study population Traits evaluated Validation
Cataract TyPE Specification
Javitt et al., 2003 [240] Gothwal et al., 2009 [241]
Patients with cataract
Vision: daytime, night driving & glare
Rasch analysis
The Quality of Vision (QoV) Questionnaire
McAlinden et al., 2010 [245]
All types of refractive correction & eye diseases that cause QoV problems
Photic phenomena: Glare, haloes, starbursts, distortion, diplopia, focussing & depth perception
Rasch analysis
The Visual Function Index-14 (VF-14) QOL Questionnaire
Uusitalo et al., 1999 [250] Gothwal et al., 2010 [252]
Patients with cataract
Vision: for cooking, near tasks, mobility-related aspects & TV
Rasch analysis
The Catquest-9SF Instrument
Lundstrom et al., 1997 [253] Lundstrom and Pesudovs, 2009 [255]
Cataract patients pre- and post-op
Reading tasks, watching TV, recognising faces
Rasch analysis
Adapted National Eye Institute Visual Function Questionnaire-25 (NEI-VFQ-25)
Kohnen et al., 2009 [258]
Used for a broad spectrum of eye disease e.g. glaucoma, ARMD
Vision (including colour and peripheral vision), driving, vision-specific expectations, vision-specific sole functioning.
Not yet validated
The Visual Symptoms and Quality of life (VSQ) Questionnaire
Donovan et al., 2003 [260]
Patients with cataract and patients awaiting 2nd eye cataract surgery
Difficulties in completing tasks e.g. driving, pouring liquids etc. How vision effects the patient's feelings about their present life and the future
Internal consistency (Cronbach’s alpha)
The Near Activity Visual Questionnaire
Buckhurst et al., 2012 [244] Gupta et al., 2007 [243]
Patients fitted with presbyopic corrections including spectacles, contact lenses and IOLs
Near vision tasks, spectacles dependency & glare
Rasch analysis

Amit Navin Jinabhai, Graeme Young, Lee Anthony Hall et al. 30
11. ANALYSING POSTERIOR CAPSULAR OPACIFICATION (PCO)
Posterior capsule opacification (PCO) is still the most common
complication of modern cataract surgery. Although its incidence has decreased slightly, because of improved surgical technique and new IOL designs, the reported incidence is still substantial and varies greatly, from 18.4 to 38.4 % up to 5 years after surgery. [267] A variety of systems have been used to analyse PCO, however, no single system has been endorsed as the ‘gold standard’. The oldest technique employed is based on clinical grading using slit-lamp biomicroscopy. Although extensively used, the subjective and qualitative nature of this technique is dependent on the experience of the examiner. Also, there is no universally-accepted subjective grading scale for PCO, with different authors suggesting the use of various grading categories. [268-270] Nonetheless, clinical grading has been shown to correlate well with some objective methods. [271] It is expected that image-analysis techniques, such as Scheimpflug and digital photographic imaging, will provide more reliable and accurate assessments of PCO.
11.1. Scheimpflug Imaging Both Hayashi at al. [272] and Lasa et al. [273] have used the EAS-1000
device (Nidek, Gamagori, Japan) equipped with area densitometry software to objectively measure the intensity of light scattering (considered to be equal to the opacification density). However, this Scheimpflug device only allows opacification density values to be evaluated within the central 3.0 mm of the posterior capsule. [272] To date, only Hayashi et al. [272] have reported correlations between opacification density values and VA for patients with PCO. As this device can only evaluate slit sections, there is scope for missing areas of PCO if they do not lie within the analysed meridian. Therefore, the restricted number of axes analysed limits comprehensive PCO evaluation with the EAS-1000 device. Grewal and colleagues [274] have used the Oculus Pentacam, a rotating Scheimpflug camera, to evaluate PCO, as this instrument captures images along multiple meridians. Currently, however, no studies have used the Pentacam to monitor PCO progression. [275]
Clinical Techniques to Assess the Visual and Optical Performance ... 31
11.2. Digital Photography As PCO essentially occurs along a single focal plane, retro-illuminated
digital photographic images can be used for PCO analysis. Wang and Woung [276] used a computerised algorithm to analyse the brightness of different points of retro-illuminated, digital images from eyes with PCO. The software compared each graded point against a threshold transparency value, and calculated the percentage level of transparency over each point. However, several sources of error can occur with this method, including variations in background intensity, and also from factors such as differences in pupillary dilatation, fundus pigmentation and head position. [277] Clinical factors specific to pseudophakic eyes, such as IOL centration, tilt and differences in refractive indices between different IOL materials can also lead to artefacts of variable illumination. [278]
Freidman and co-workers [279] addressed some of the concerns raised regarding objective digital photography, by introducing a camera system based on cross-polarised illumination to supress reflections from the corneal surfaces. Uneven illumination was accounted for using specialised image processing software (IPLaboratory; Signal Analytics, Vienna, VA). Although useful, a Maltese cross-shaped artefact is often seen during image capture, thereby obstructing the examiners view.
Tetz and Nimsgern [280] developed the Evaluation of Posterior Capsular Opacification (EPCO) method, based on retro-illumination photographs captured using a standard slit lamp camera. The software allows morphological measurement of PCO through densitometry assessments across a 2-dimensional plane. The PCO density across different areas of the image is interactively outlined by the observer (using the software drawing tools) and scored on a scale from 0 to 4. The individual PCO score is calculated by multiplying the opacification grade by the fraction of the capsular area involved behind the IOL optic. Although this method is relatively inexpensive, it is not fully objective and relies on observer operation and interpretation. Therefore, it was perhaps not surprising that Findl et al. [271] reported significant correlations between EPCO scores and subjective grading scores made at the slit-lamp.
Barman et al. [281] have proposed another PCO image analysis technique, known as the POCO system, which classifies different areas of the image as either ‘textured’ or ‘non-textured’ using a semi-objective method after removal of the corneal Purkinje image reflections. The software algorithm applies image contrast enhancement filters to enhance the texture of any areas

Amit Navin Jinabhai, Graeme Young, Lee Anthony Hall et al. 32
of opacity; images are then classified into areas of ‘opacity’ or ‘transparency’. A major disadvantage of this method is that the areas of the image encompassing the Purkinje image reflections are completely excluded from the overall image analysis; this may be of significance if the areas of PCO are located centrally, as they may originally have been masked by the corneal reflections. In addition, this technique requires a specialised image capture and analysis system to capture the source images, which incurs additional expense. A similar device, known as the POCOman system, has been introduced by Bender et al. [282] However, this method also requires some subjective input as the observer is required to grade the texture of the image. Therefore, this aspect of the technique may introduce inaccuracies, as the skill of grading texture is likely to be dependent on the observer’s clinical experience. [271]
To remove Purkinje reflections, Buehl et al. [283] have developed the Automated Quantification of After-Cataract (AQUA) imaging system. Here a series of retro-illumination images are captured whilst the patient fixates in slightly different directions, which essentially shifts the position of the Purkinje images. The resultant images are then fused together using sophisticated image analysis algorithms, based around 4 non-collinear points manually selected for image registration. [271] Although useful, this technique requires multiple images to be taken, increasing the time required for data collection.
Grewal and colleagues [274] used specialised medical imaging software (NIH ImageJ; National Institutes of Health, Bethesda, US) to analyse and compare Scheimpflug tomograms (Oculus Pentacam) versus data collected using the POCOman system, and found the results to be comparable.
In summary, objective methods of imaging PCO have evolved; however, a mixture of objective and subjective techniques is currently required to grade such opacities. Development of a fully objective grading system that captures IOL-capsular bag images along multiple meridians is desirable to monitor PCO progression and allow comparisons between studies.
CONCLUSION As the technology used to design and manufacture IOLs improves, the
need for long-term data relating to the performance of eyes implanted with IOLs also increases. A large proportion of IOL studies have assessed patients over time-spans ranging between 3 months [191] and 5 years, [284] with fewer studies extending beyond 2 years of follow-up. [285] Published reports beyond
Clinical Techniques to Assess the Visual and Optical Performance ... 33
10 years appear to be even sparser. [286] Development of a widely-accepted, comprehensive portfolio of assessments for evaluating IOL performance would be helpful in collecting long-term data from patients implanted with a variety of IOLs. Such long-term data would be useful for eyecare practitioners to better predict post-operative clinical outcomes and to manage patient expectations for those awaiting cataract surgery.
It is evident that several key measurements, including near VA, defocus curves and contrast sensitivity, require improved standardisation amongst the research community to allow better comparisons between studies. Aspects such as the target used; letter and lens sequence randomisation; the range of test lenses investigated and the number of spatial frequencies presented need to be considered. Recently, some researchers have attempted to combine a range of visual performance assessments into a single testing instrument, the Eyevispod system (PGB srl., Milano, Italy); to date, this device has only been used in one published study. [287]
Measurement of changes in accommodation (for eyes implanted with accommodative IOLs) should be conducted using both subjective and objective methods to determine whether increases in accommodation arise from actual changes in the IOL position, or due to changes in depth-of-field through pupillary constriction. It is also recommended that the evaluation of post-operative IOL centration and rotation uses a method which compares the IOL position to ‘fixed’ ocular landmarks, such as the episcleral blood vessels. Although a variety of QOL questionnaires have been used to assess the performance of IOLs, not all of these have yet been validated using methods such as Rasch analysis, [242] to ensure that each questionnaire item is measuring the desired characteristic.
In conclusion, this report reviews a variety of clinical assessment techniques typically used to evaluate the visual and optical performance of patients implanted with IOLs, highlighting their relative advantages and shortfalls. These findings should assist researchers in developing a comprehensive series of investigations designed to evaluate the performance of IOLs. Repeatable and reproducible in-vivo assessments of visual and optical performance are desirable to further develop IOL concepts and designs, in the hope of improving current post-operative visual satisfaction.

Amit Navin Jinabhai, Graeme Young, Lee Anthony Hall et al. 34
REFERENCES
[1] Bailey IL & Lovie JE. New Design Principles for Visual Acuity Letter Charts. Am J Optom Physiol Opt. 1976;53:740-5.
[2] Regan D, Silver R & Murray TJ. Visual Acuity and Contrast Sensitivity in Multiple Sclerosis-Hidden Visual Loss: An Auxiliary Diagnostic Test. Brain. 1977;100:563-79.
[3] Ferris FL, Kassoff A, Bresnick GH & Bailey I. New Visual Acuity Charts for Clinical Research. Am J Ophthalmol. 1982;94:91-6.
[4] Brown B & Lovie-Kitchin JE. High and Low Contrast Acuity and Clinical Contrast Sensitivity Tested in a Normal Population. Optom Vis Sci. 1989;66:467-73.
[5] Regan D & Neima D. Low-Contrast Letter Charts in Early Diabetic Retinopathy, Ocular Hypertension, Glaucoma, and Parkinson's Disease. Br J Ophthalmol. 1984;68:885-9.
[6] International Organization for Standardization. Ophthalmic Optics - Visual Acuity Testing - Standard Optotype and its Presentation. ISO 8596. 1994.
[7] Hazel CA & Elliott DB. The Dependency of LogMAR Visual Acuity Measurements on Chart Design and Scoring Rule. Optom Vis Sci. 2002;79:788-92.
[8] Williams MA, Moutray TN & Jackson AJ. Uniformity of Visual Acuity Measures in Published Studies. Invest Ophthalmol Vis Sci. 2008;49:4321-7.
[9] Shah N, Laidlaw DA, Brown G & Robson C. Effect of Letter Separation on Computerised Visual Acuity Measurements: Comparison with the Gold Standard Early Treatment Diabetic Retinopathy Study (ETDRS) Chart. Ophthalmic Physiol Opt. 2010;30:200-3.
[10] Rosser DA, Murdoch IE, Fitzke FW & Laidlaw DA. Improving on ETDRS Acuities: Design and Results for a Computerised Thresholding Device. Eye (Lond). 2003;17:701-6.
[11] Sloan LL. New Test Charts for the Measurement of Visual Acuity at Far and near Distances. Am J Ophthalmol. 1959;48:807-13.
[12] Gupta N, Wolffsohn JS & Naroo SA. Comparison of near Visual Acuity and Reading Metrics in Presbyopia Correction. J Cataract Refract Surg. 2009;35:1401-9.
[13] Wolffsohn JS & Cochrane AL. The Practical near Acuity Chart (PNAC) and Prediction of Visual Ability at Near. Ophthalmic Physiol Opt. 2000;20:90-7.

Clinical Techniques to Assess the Visual and Optical Performance ... 35
[14] Bailey IL & Lovie JE. The Design and Use of a New near-Vision Chart. Am J Optom Physiol Opt. 1980;57:378-87.
[15] Sheedy JE, Subbaram MV, Zimmerman AB & Hayes JR. Text Legibility and the Letter Superiority Effect. Hum Factors. 2005;47:797-815.
[16] Liu L & Arditi A. How Crowding Affects Letter Confusion. Optom Vis Sci. 2001;78:50-5.
[17] Kniestedt C & Stamper RL. Visual Acuity and its Measurement. Ophthalmol Clin North Am. 2003;16:155-70.
[18] Kasper T, Buhren J & Kohnen T. Visual Performance of Aspherical and Spherical Intraocular Lenses: Intraindividual Comparison of Visual Acuity, Contrast Sensitivity, and Higher-Order Aberrations. J Cataract Refract Surg. 2006;32:2022-9.
[19] Ricci F, Scuderi G, Missiroli F, Regine F & Cerulli A. Low Contrast Visual Acuity in Pseudophakic Patients Implanted with an Anterior Surface Modified Prolate Intraocular Lens. Acta Ophthalmol Scand. 2004;82:718-22.
[20] Johansson B, Sundelin S, Wikberg-Matsson A, Unsbo P & Behndig A. Visual and Optical Performance of the Akreos Adapt Advanced Optics and Tecnis Z9000 Intraocular Lenses: Swedish Multicenter Study. J Cataract Refract Surg. 2007;33:1565-72.
[21] Thomson D. VA Testing in Optometric Practice. Optom Today. 2005;May:22-4.
[22] Laidlaw DA, Tailor V, Shah N, Atamian S & Harcourt C. Validation of a Computerised LogMAR Visual Acuity Measurement System (Complog): Comparison with ETDRS and the Electronic ETDRS Testing Algorithm in Adults and Amblyopic Children. Br J Ophthalmol. 2008;92:241-4.
[23] Thomson D. Near Vision Assessment in the 21st Century. The Optician. 2009;November:22-3.
[24] Beck RW, Moke PS, Turpin AH, et al. A Computerized Method of Visual Acuity Testing: Adaptation of the Early Treatment of Diabetic Retinopathy Study Testing Protocol. Am J Ophthalmol. 2003;135:194-205.
[25] Bland JM & Altman DG. Statistical Methods for Assessing Agreement between Two Methods of Clinical Measurement. Int J Nursing Studies. 2010;47:931-6.

Amit Navin Jinabhai, Graeme Young, Lee Anthony Hall et al. 36
[26] Cotter SA, Chu RH, Chandler DL, et al. Reliability of the Electronic Early Treatment Diabetic Retinopathy Study Testing Protocol in Children 7 to <13 Years Old. Am J Ophthalmol. 2003;136:655-61.
[27] Shah N, Laidlaw DA, Rashid S & Hysi P. Validation of Printed and Computerised Crowded Kay Picture LogMAR Tests against Gold Standard ETDRS Acuity Test Chart Measurements in Adult and Amblyopic Paediatric Subjects. Eye (Lond). 2012;26:593-600.
[28] Chen MT & Lin CC. Comparison of TFT-LCD and CRT on Visual Recognition and Subjective Preference. Int J Indust Ergonomics. 2004;34:167–74.
[29] Menozzi M, Lang F, Napflin U, Zeller C & Krueger H. CRT Versus LCD: Effects of Refrash Rate, Display Technology and Background Luminance in Visual Performance. Displays. 2001;22:79-85.
[30] Husain AM, Hayes S, Young M & Shah D. Visual Evoked Potentials with CRT and LCD Monitors: When Newer Is Not Better. Neurology. 2009;72:162-4.
[31] Thayaparan K, Crossland MD & Rubin GS. Clinical Assessment of Two New Contrast Sensitivity Charts. Br J Ophthalmol. 2007;91:749-52.
[32] Strasburger H, Wustenberg T & Jancke L. Calibrated LCD/TFT Stimulus Presentation for Visual Psychophysics in fMRI. J Neurosci Methods. 2002;121:103-10.
[33] Hollands JG, Parker HA, McFadden S & Boothby R. LCD Versus CRT Displays: A Comparison of Visual Search Performance for Colored Symbols. Hum Factors. 2002;44:210-21.
[34] Nagy BV, Gemesi S, Heller D, et al. Comparison of Pattern VEP Results Acquired Using CRT and TFT Stimulators in the Clinical Practice. Doc Ophthalmol. 2011;122:157-62.
[35] Lin YH, Chen CY, Lu SY & Lin YC. Visual Fatigue During VDT Work: Effects of Time-Based and Environment-Based Conditions. Displays. 2008;29:487-92.
[36] Oshika T, Okamoto C, Samejima T, Tokunaga T & Miyata K. Contrast Sensitivity Function and Ocular Higher-Order Wavefront Aberrations in Normal Human Eyes. Ophthalmology. 2006;113:1807-12.
[37] Liang J & Williams DR. Aberrations and Retinal Image Quality of the Normal Human Eye. J Opt Soc Am A Opt Image Sci Vis. 1997;14:2873-83.
Clinical Techniques to Assess the Visual and Optical Performance ... 37
[38] Thibos LN, Bradley A & Hong X. A Statistical Model of the Aberration Structure of Normal, Well-Corrected Eyes. Ophthalmic Physiol Opt. 2002;22:427-33.
[39] Thibos LN, Hong X, Bradley A & Cheng X. Statistical Variation of Aberration Structure and Image Quality in a Normal Population of Healthy Eyes. J Opt Soc Am A Opt Image Sci Vis. 2002;19:2329-48.
[40] Pesudovs K & Coster DJ. Assessment of Visual Function in Cataract Patients with a Mean Visual Acuity of 6/9. Aust N Z J Ophthalmol. 1996;24:5-9.
[41] Williamson TH, Strong NP, Sparrow J, Aggarwal RK & Harrad R. Contrast Sensitivity and Glare in Cataract Using the Pelli-Robson Chart. Br J Ophthalmol. 1992;76:719-22.
[42] Ravalico G, Baccara F & Rinaldi G. Contrast Sensitivity in Multifocal Intraocular Lenses. J Cataract Refract Surg. 1993;19:22-5.
[43] Campbell FW & Robson JG. Application of Fourier Analysis to the Visibility of Gratings. J Physiol. 1968;197:551-66.
[44] Packer M, Fine IH, Hoffman RS & Piers PA. Improved Functional Vision with a Modified Prolate Intraocular Lens. J Cataract Refract Surg. 2004;30:986-92.
[45] Bellucci R, Scialdone A, Buratto L, et al. Visual Acuity and Contrast Sensitivity Comparison between Tecnis and AcrySof SA60AT Intraocular Lenses: A Multicenter Randomized Study. J Cataract Refract Surg. 2005;31:712-7.
[46] Munoz G, Albarran-Diego C, Montes-Mico R, Rodriguez-Galietero A & Alio JL. Spherical Aberration and Contrast Sensitivity after Cataract Surgery with the Tecnis Z9000 Intraocular Lens. J Cataract Refract Surg. 2006;32:1320-7.
[47] Pandita D, Raj SM, Vasavada VA, Kazi NS & Vasavada AR. Contrast Sensitivity and Glare Disability after Implantation of AcrySof IQ Natural Aspherical Intraocular Lens: Prospective Randomized Masked Clinical Trial. J Cataract Refract Surg. 2007;33:603-10.
[48] Schmitz S, Dick HB, Krummenauer F, Schwenn O & Krist R. Contrast Sensitivity and Glare Disability by Halogen Light after Monofocal and Multifocal Lens Implantation. Br J Ophthalmol. 2000;84:1109-12.
[49] Ginsburg AP. A New Contrast Sensitivity Vision Test Chart. Am J Optom Physiol Opt. 1984;61:403-7.
[50] Steinert RF. Visual Outcomes with Multifocal Intraocular Lenses. Curr Opin Ophthalmol. 2000;11:12-21.

Amit Navin Jinabhai, Graeme Young, Lee Anthony Hall et al. 38
[51] Neumann AC, McCarty GR, Locke J & Cobb B. Glare Disability Devices for Cataractous Eyes: A Consumer's Guide. J Cataract Refract Surg. 1988;14:212-6.
[52] Prager TC, Urso RG, Holladay JT & Stewart RH. Glare Testing in Cataract Patients: Instrument Evaluation and Identification of Sources of Methodological Error. J Cataract Refract Surg. 1989;15:149-57.
[53] Reeves BC, Wood JM & Hill AR. Vistech Vcts 6500 Charts within- and between-Session Reliability. Optom Vis Sci. 1991;68:728-37.
[54] Pesudovs K, Hazel CA, Doran RM & Elliott DB. The Usefulness of Vistech and FACT Contrast Sensitivity Charts for Cataract and Refractive Surgery Outcomes Research. Br J Ophthalmol. 2004;88:11-6.
[55] Elliott DB & Bullimore MA. Assessing the Reliability, Discriminative Ability, and Validity of Disability Glare Tests. Invest Ophthalmol Vis Sci. 1993;34:108-19.
[56] Hong YT, Kim SW, Kim EK & Kim TI. Contrast Sensitivity Measurement with 2 Contrast Sensitivity Tests in Normal Eyes and Eyes with Cataract. J Cataract Refract Surg. 2010;36:547-52.
[57] McKee SP, Klein SA & Teller DY. Statistical Properties of Forced-Choice Psychometric Functions: Implications of Probit Analysis. Percept Psychophys. 1985;37:286-98.
[58] King-Smith PE, Grigsby SS, Vingrys AJ, Benes SC & Supowit A. Efficient and Unbiased Modifications of the Quest Threshold Method: Theory, Simulations, Experimental Evaluation and Practical Implementation. Vision Res. 1994;34:885-912.
[59] Kelly DH. Visual Contrast Sensitivity. Optica Acta. 1977;24:107-29. [60] Montes-Mico R & Alio JL. Distance and Near Contrast Sensitivity
Function after Multifocal Intraocular Lens Implantation. J Cataract Refract Surg. 2003;29:703-11.
[61] Kamlesh, Dadeya S & Kaushik S. Contrast Sensitivity and Depth of Focus with Aspheric Multifocal Versus Conventional Monofocal Intraocular Lens. Can J Ophthalmol. 2001;36:197-201.
[62] Montes-Mico R, Espana E, Bueno I, Charman WN & Menezo JL. Visual Performance with Multifocal Intraocular Lenses: Mesopic Contrast Sensitivity under Distance and near Conditions. Ophthalmology. 2004;111:85-96.
[63] Vingolo EM, Grenga P, Iacobelli L & Grenga R. Visual Acuity and Contrast Sensitivity: AcrySof ReSTOR Apodized Diffractive Versus

Clinical Techniques to Assess the Visual and Optical Performance ... 39
AcrySof SA60AT Monofocal Intraocular Lenses. J Cataract Refract Surg. 2007;33:1244-7.
[64] Awwad ST, Warmerdam D, Bowman RW, et al. Contrast Sensitivity and Higher Order Aberrations in Eyes Implanted with AcrySof IQ SN60WF and AcrySof SN60AT Intraocular Lenses. J Refract Surg. 2008;24:619-25.
[65] Caporossi A, Martone G, Casprini F & Rapisarda L. Prospective Randomized Study of Clinical Performance of 3 Aspheric and 2 Spherical Intraocular Lenses in 250 Eyes. J Refract Surg. 2007;23:639-48.
[66] Tzelikis PF, Akaishi L, Trindade FC & Boteon JE. Spherical Aberration and Contrast Sensitivity in Eyes Implanted with Aspheric and Spherical Intraocular Lenses: A Comparative Study. Am J Ophthalmol. 2008;145:827-33.
[67] Hutz WW, Eckhardt HB, Rohrig B & Grolmus R. Intermediate Vision and Reading Speed with Array, Tecnis, and ReSTOR Intraocular Lenses. J Refract Surg. 2008;24:251-6.
[68] Hutz WW, Eckhardt HB, Rohrig B & Grolmus R. Reading Ability with 3 Multifocal Intraocular Lens Models. J Cataract Refract Surg. 2006;32:2015-21.
[69] Brown D, Dougherty P, Gills JP, et al. Functional Reading Acuity and Performance: Comparison of 2 Accommodating Intraocular Lenses. J Cataract Refract Surg. 2009;35:1711-4.
[70] Ito M & Shimizu K. Reading Ability with Pseudophakic Monovision and with Refractive Multifocal Intraocular Lenses: Comparative Study. J Cataract Refract Surg. 2009;35:1501-4.
[71] Souza CE, Gerente VM, Chalita MR, et al. Visual Acuity, Contrast Sensitivity, Reading Speed, and Wavefront Analysis: Pseudophakic Eye with Multifocal IOL (ReSTOR) Versus Fellow Phakic Eye in Non-Presbyopic Patients. J Refract Surg. 2006;22:303-5.
[72] Souza CE, Muccioli C, Soriano ES, et al. Visual Performance of AcrySof ReSTOR Apodized Diffractive IOL: A Prospective Comparative Trial. Am J Ophthalmol. 2006;141:827-32.
[73] Radner W, Obermayer W, Richter-Mueksch S, et al. The Validity and Reliability of Short German Sentences for Measuring Reading Speed. Graefes Arch Clin Exp Ophthalmol. 2002;240:461-7.
[74] Subramanian A & Pardhan S. The Repeatability of MNRead Acuity Charts and Variability at Different Test Distances. Optom Vis Sci. 2006;83:572-6.

Amit Navin Jinabhai, Graeme Young, Lee Anthony Hall et al. 40
[75] Patel PJ, Chen FK, Da Cruz L, Rubin GS & Tufail A. Test-Retest Variability of Reading Performance Metrics Using MNRead in Patients with Age-Related Macular Degeneration. Invest Ophthalmol Vis Sci. 2011;52:3854-9.
[76] Virgili G, Pierrottet C, Parmeggiani F, et al. Reading Performance in Patients with Retinitis Pigmentosa: A Study Using the MNRead Charts. Invest Ophthalmol Vis Sci. 2004;45:3418-24.
[77] Finger RP, Charbel Issa P, Fimmers R, et al. Reading Performance Is Reduced by Parafoveal Scotomas in Patients with Macular Telangiectasia Type 2. Invest Ophthalmol Vis Sci. 2009;50:1366-70.
[78] Cheung SH, Kallie CS, Legge GE & Cheong AM. Nonlinear Mixed-Effects Modeling of MNRead Data. Invest Ophthalmol Vis Sci. 2008;49:828-35.
[79] Whittaker SG & Lovie-Kitchin J. Visual Requirements for Reading. Optom Vis Sci. 1993;70:54-65.
[80] Mansfield JS, Legge GE & Bane MC. A New Reading-Acuity Chart for Low and Normal Vision. Opt Soc Am Techn Digest. 1993;3:232-5.
[81] Pelli DG, Tillman KA, Freeman J, et al. Crowding and Eccentricity Determine Reading Rate. J Vis. 2007;7:20.1-36.
[82] Stifter E, Konig F, Lang T, et al. Reliability of a Standardized Reading Chart System: Variance Component Analysis, Test-Retest and Inter-Chart Reliability. Graefes Arch Clin Exp Ophthalmol. 2004;242:31-9.
[83] Hahn GA, Penka D, Gehrlich C, et al. New Standardised Texts for Assessing Reading Performance in Four European Languages. Br J Ophthalmol. 2006;90:480-4.
[84] Wolffsohn JS, Bhogal G & Shah S. Effect of Uncorrected Astigmatism on Vision. J Cataract Refract Surg. 2011;37:454-60.
[85] Duane A. Normal Values of the Accommodation at All Ages. J Am Med Assoc. 1912;LIX:1010-3.
[86] Koretz JF, Cook CA & Kaufman PL. Accommodation and Presbyopia in the Human Eye. Changes in the Anterior Segment and Crystalline Lens with Focus. Invest Ophthalmol Vis Sci. 1997;38:569-78.
[87] Dubbelman M, van der Heijde GL & Weeber HA. The Thickness of the Aging Human Lens Obtained from Corrected Scheimpflug Images. Optom Vis Sci. 2001;78:411-6.
[88] Dubbelman M, Van der Heijde GL, Weeber HA & Vrensen GF. Changes in the Internal Structure of the Human Crystalline Lens with Age and Accommodation. Vision Res. 2003;43:2363-75.

Clinical Techniques to Assess the Visual and Optical Performance ... 41
[89] Pieh S, Kellner C, Hanselmayer G, et al. Comparison of Visual Acuities at Different Distances and Defocus Curves. J Cataract Refract Surg. 2002;28:1964-7.
[90] Schmidinger G, Geitzenauer W, Hahsle B, et al. Depth of Focus in Eyes with Diffractive Bifocal and Refractive Multifocal Intraocular Lenses. J Cataract Refract Surg. 2006;32:1650-6.
[91] Hayashi K, Manabe S & Hayashi H. Visual Acuity from Far to Near and Contrast Sensitivity in Eyes with a Diffractive Multifocal Intraocular Lens with a Low Addition Power. J Cataract Refract Surg. 2009;35:2070-6.
[92] Maxwell WA, Cionni RJ, Lehmann RP & Modi SS. Functional Outcomes after Bilateral Implantation of Apodized Diffractive Aspheric Acrylic Intraocular Lenses with a +3.0 or +4.0 Diopter Addition Power: Randomized Multicenter Clinical Study. J Cataract Refract Surg. 2009;35:2054-61.
[93] Alio JL, Pinero DP, Plaza-Puche AB & Chan MJ. Visual Outcomes and Optical Performance of a Monofocal Intraocular Lens and a New-Generation Multifocal Intraocular Lens. J Cataract Refract Surg. 2011;37:241-50.
[94] Alio JL, Plaza-Puche AB, Javaloy J & Ayala MJ. Comparison of the Visual and Intraocular Optical Performance of a Refractive Multifocal IOL with Rotational Asymmetry and an Apodized Diffractive Multifocal IOL. J Refract Surg. 2012;28:100-5.
[95] Alio JL, Plaza-Puche AB, Javaloy J, et al. Comparison of a New Refractive Multifocal Intraocular Lens with an Inferior Segmental near Add and a Diffractive Multifocal Intraocular Lens. Ophthalmology. 2012;119:555-63.
[96] Post CT, Jr. Comparison of Depth of Focus and Low-Contrast Acuities for Monofocal Versus Multifocal Intraocular Lens Patients at 1 Year. Ophthalmology. 1992;99:1658-63; discussion 63-4.
[97] Steinert RF, Post CT, Jr., Brint SF, et al. A Prospective, Randomized, Double-Masked Comparison of a Zonal-Progressive Multifocal Intraocular Lens and a Monofocal Intraocular Lens. Ophthalmology. 1992;99:853-60; discussion 60-1.
[98] Langenbucher A, Huber S, Nguyen NX, et al. Measurement of Accommodation after Implantation of an Accommodating Posterior Chamber Intraocular Lens. J Cataract Refract Surg. 2003;29:677-85.
[99] Langenbucher A, Seitz B, Huber S, Nguyen NX & Kuchle M. Theoretical and Measured Pseudophakic Accommodation after

Amit Navin Jinabhai, Graeme Young, Lee Anthony Hall et al. 42
Implantation of a New Accommodative Posterior Chamber Intraocular Lens. Arch Ophthalmol. 2003;121:1722-7.
[100] Gupta N, Wolffsohn JS & Naroo SA. Optimizing Measurement of Subjective Amplitude of Accommodation with Defocus Curves. J Cataract Refract Surg. 2008;34:1329-38.
[101] Trager MJ, Vagefi RM & McLeod SD. A Mathematical Model for Estimating Degree of Accommodation by Defocus Curves. Invest Ophthalmol Vis Sci. 2005;46:B691 (E-Abstract 717).
[102] Buckhurst PJ, Wolffsohn JS, Naroo SA, et al. Multifocal Intraocular Lens Differentiation Using Defocus Curves. Invest Ophthalmol Vis Sci. 2012;53:3920-6.
[103] Finkelman YM, Ng JQ & Barrett GD. Patient Satisfaction and Visual Function after Pseudophakic Monovision. J Cataract Refract Surg. 2009;35:998-1002.
[104] Ito M, Shimizu K, Amano R & Handa T. Assessment of Visual Performance in Pseudophakic Monovision. J Cataract Refract Surg. 2009;35:710-4.
[105] Richter-Mueksch S, Weghaupt H, Skorpik C, Velikay-Parel M & Radner W. Reading Performance with a Refractive Multifocal and a Diffractive Bifocal Intraocular Lens. J Cataract Refract Surg. 2002;28:1957-63.
[106] Santhiago MR, Wilson SE, Netto MV, et al. Visual Performance of an Apodized Diffractive Multifocal Intraocular Lens with +3.00-D Addition: 1-Year Follow-Up. J Refract Surg. 2011;27:899-906.
[107] Iida Y, Shimizu K & Ito M. Pseudophakic Monovision Using Monofocal and Multifocal Intraocular Lenses: Hybrid Monovision. J Cataract Refract Surg. 2011;37:2001-5.
[108] Gupta N, Naroo SA & Wolffsohn JS. Is Randomisation Necessary for Measuring Defocus Curves in Pre-Presbyopes? Cont Lens Anterior Eye. 2007;30:119-24.
[109] Wang Y, Zhao K, Jin Y, Niu Y & Zuo T. Changes of Higher Order Aberration with Various Pupil Sizes in the Myopic Eye. J Refract Surg. 2003;19:S270-4.
[110] Applegate RA, Marsack JD, Ramos R & Sarver EJ. Interaction between Aberrations to Improve or Reduce Visual Performance. J Cataract Refract Surg. 2003;29:1487-95.
[111] Steinert RF, Aker BL, Trentacost DJ, Smith PJ & Tarantino N. A Prospective Comparative Study of the AMO Array Zonal-Progressive
Clinical Techniques to Assess the Visual and Optical Performance ... 43
Multifocal Silicone Intraocular Lens and a Monofocal Intraocular Lens. Ophthalmology. 1999;106:1243-55.
[112] Legeais JM, Werner L, Abenhaim A & Renard G. Pseudoaccommodation: Biocomfold Versus a Foldable Silicone Intraocular Lens. J Cataract Refract Surg. 1999;25:262-7.
[113] Cleary G, Spalton DJ & Marshall J. Pilot Study of New Focus-Shift Accommodating Intraocular Lens. J Cataract Refract Surg. 2010;36:762-70.
[114] Heatley CJ, Spalton DJ, Hancox J, Kumar A & Marshall J. Fellow Eye Comparison between the 1CU Accommodative Intraocular Lens and the AcrySof MA30 Monofocal Intraocular Lens. Am J Ophthalmol. 2005;140:207-13.
[115] Toto L, Falconio G, Vecchiarino L, et al. Visual Performance and Biocompatibility of 2 Multifocal Diffractive IOLs: Six-Month Comparative Study. J Cataract Refract Surg. 2007;33:1419-25.
[116] Raasch TW, Bailey IL & Bullimore MA. Repeatability of Visual Acuity Measurement. Optom Vis Sci. 1998;75:342-8.
[117] Coeckelbergh TR, Brouwer WH, Cornelissen FW, Van Wolffelaar P & Kooijman AC. The Effect of Visual Field Defects on Driving Performance: A Driving Simulator Study. Arch Ophthalmol. 2002;120:1509-16.
[118] Hansen TE, Corydon L, Krag S & Thim K. New Multifocal Intraocular Lens Design. J Cataract Refract Surg. 1990;16:38-41.
[119] Wolffsohn JS, Buckhurst PJ, Shah S, Naroo SA & Davies LN. Evaluation of Multifocal Intraocular Lens Defocus Curves. Invest Ophthalmol Vis Sci. 2011;52:(E-Abstract 4772).
[120] Kuchle M, Seitz B, Langenbucher A, et al. Comparison of 6-Month Results of Implantation of the 1CU Accommodative Intraocular Lens with Conventional Intraocular Lenses. Ophthalmology. 2004;111:318-24.
[121] Ostrin LA & Glasser A. Accommodation Measurements in a Prepresbyopic and Presbyopic Population. J Cataract Refract Surg. 2004;30:1435-44.
[122] Rosenfield M & Cohen AS. Repeatability of Clinical Measurements of the Amplitude of Accommodation. Ophthalmic Physiol Opt. 1996;16:247-9.
[123] Macsai MS, Padnick-Silver L & Fontes BM. Visual Outcomes after Accommodating Intraocular Lens Implantation. J Cataract Refract Surg. 2006;32:628-33.

Amit Navin Jinabhai, Graeme Young, Lee Anthony Hall et al. 44
[124] Rutstein RP, Fuhr PD & Swiatocha J. Comparing the Amplitude of Accommodation Determined Objectively and Subjectively. Optom Vis Sci. 1993;70:496-500.
[125] Sheppard AL, Bashir A, Wolffsohn JS & Davies LN. Accommodating Intraocular Lenses: A Review of Design Concepts, Usage and Assessment Methods. Clin Exp Optom. 2010;93:441-52.
[126] Wolffsohn JS, Hunt OA, Naroo S, et al. Objective Accommodative Amplitude and Dynamics with the 1CU Accommodative Intraocular Lens. Invest Ophthalmol Vis Sci. 2006;47:1230-5.
[127] Dogru M, Honda R, Omoto M, et al. Early Visual Results with the 1CU Accommodating Intraocular Lens. J Cataract Refract Surg. 2005;31:895-902.
[128] Wolffsohn JS, Davies LN, Naroo SA, et al. Evaluation of an Open-Field Autorefractor's Ability to Measure Refraction and Hence Potential to Assess Objective Accommodation in Pseudophakes. Br J Ophthalmol. 2011;95:498-501.
[129] Wolffsohn JS, Davies LN, Gupta N, et al. Mechanism of Action of the Tetraflex Accommodative Intraocular Lens. J Refract Surg. 2010;26:858-62.
[130] Dick HB. Accommodative Intraocular Lenses: Current Status. Curr Opin Ophthalmol. 2005;16:8-26.
[131] Wolffsohn JS, Naroo SA, Motwani NK, et al. Subjective and Objective Performance of the Lenstec KH-3500 "Accommodative" Intraocular Lens. Br J Ophthalmol. 2006;90:693-6.
[132] Win-Hall DM & Glasser A. Objective Accommodation Measurements in Pseudophakic Subjects Using an Autorefractor and an Aberrometer. J Cataract Refract Surg. 2009;35:282-90.
[133] Hunt OA, Wolffsohn JS & Gilmartin B. Evaluation of the Measurement of Refractive Error by the Powerrefractor: A Remote, Continuous and Binocular Measurement System of Oculomotor Function. Br J Ophthalmol. 2003;87:1504-8.
[134] Davies LN, Gibson GA, Sheppard AL & Wolffsohn JS. In Vivo Biometric Evaluation of Phakic and Pseudophakic Eyes During Accommodation with Optical Coherence Tomography. Invest Ophthalmol Vis Sci. 2008;49:(E-Abstract 3777).
[135] Kriechbaum K, Findl O, Koeppl C, Menapace R & Drexler W. Stimulus-Driven Versus Pilocarpine-Induced Biometric Changes in Pseudophakic Eyes. Ophthalmology. 2005;112:453-9.

Clinical Techniques to Assess the Visual and Optical Performance ... 45
[136] Alio JL, Ben-nun J, Rodriguez-Prats JL & Plaza AB. Visual and Accommodative Outcomes 1 Year after Implantation of an Accommodating Intraocular Lens Based on a New Concept. J Cataract Refract Surg. 2009;35:1671-8.
[137] Marchini G, Mora P, Pedrotti E, et al. Functional Assessment of Two Different Accommodative Intraocular Lenses Compared with a Monofocal Intraocular Lens. Ophthalmology. 2007;114:2038-43.
[138] Myers GA & Stark L. Topology of the Near Response Triad. Ophthalmic Physiol Opt. 1990;10:175-81.
[139] Glasser A. Restoration of Accommodation: Surgical Options for Correction of Presbyopia. Clin Exp Optom. 2008;91:279-95.
[140] Uthoff D, Holland D, Hepper D, et al. Laserinterferometric Measurements of Accommodative Changes in the Position of an Optic-Shift Intraocular Lens. J Refract Surg. 2009;25:416-20.
[141] Cervino A, Hosking SL, Rai GK, Naroo SA & Gilmartin B. Wavefront Analyzers Induce Instrument Myopia. J Refract Surg. 2006;22:795-803.
[142] Jinabhai A, Radhakrishnan H & O'Donnell C. Repeatability of Ocular Aberration Measurements in Patients with Keratoconus. Ophthalmic Physiol Opt. 2011;31:588-94.
[143] Charman WN. Wavefront Technology: Past, Present and Future. Cont Lens Anterior Eye. 2005;28:75-92.
[144] Radhakrishnan H, Jinabhai A & O’Donnell C. Dynamics of Ocular Aberrations in Keratoconus. Clin Exp Optom. 2010; 93 164-74
[145] Cleary G, Spalton DJ & Gala KB. A Randomized Intraindividual Comparison of the Accommodative Performance of the Bag-in-the-Lens Intraocular Lens in Presbyopic Eyes. Am J Ophthalmol. 2010;150:619-27e1.
[146] Hancox J, Spalton D, Heatley C, Jayaram H & Marshall J. Objective Measurement of Intraocular Lens Movement and Dioptric Change with a Focus Shift Accommodating Intraocular Lens. J Cataract Refract Surg. 2006;32:1098-103.
[147] Buznego C & Trattler WB. Presbyopia-Correcting Intraocular Lenses. Curr Opin Ophthalmol. 2009;20:13-8.
[148] Win-Hall DM & Glasser A. Objective Accommodation Measurements in Prepresbyopic Eyes Using an Autorefractor and an Aberrometer. J Cataract Refract Surg. 2008;34:774-84.
[149] Piers PA, Fernandez EJ, Manzanera S, Norrby S & Artal P. Adaptive Optics Simulation of Intraocular Lenses with Modified Spherical Aberration. Invest Ophthalmol Vis Sci. 2004;45:4601-10.
Amit Navin Jinabhai, Graeme Young, Lee Anthony Hall et al. 46
[150] Marcos S, Barbero S & Jimenez-Alfaro I. Optical Quality and Depth-of-Field of Eyes Implanted with Spherical and Aspheric Intraocular Lenses. J Refract Surg. 2005;21:223-35.
[151] Marsack JD, Thibos LN & Applegate RA. Metrics of Optical Quality Derived from Wave Aberrations Predict Visual Performance. J Vis. 2004;4:322-8.
[152] Nanavaty MA, Spalton DJ, Boyce J, Saha S & Marshall J. Wavefront Aberrations, Depth of Focus, and Contrast Sensitivity with Aspheric and Spherical Intraocular Lenses: Fellow-Eye Study. J Cataract Refract Surg. 2009;35:663-71.
[153] Artigas JM, Menezo JL, Peris C, Felipe A & Diaz-Llopis M. Image Quality with Multifocal Intraocular Lenses and the Effect of Pupil Size: Comparison of Refractive and Hybrid Refractive-Diffractive Designs. J Cataract Refract Surg. 2007;33:2111-7.
[154] Guirao A, Redondo M, Geraghty E, et al. Corneal Optical Aberrations and Retinal Image Quality in Patients in Whom Monofocal Intraocular Lenses Were Implanted. Arch Ophthalmol. 2002;120:1143-51.
[155] Altmann GE, Nichamin LD, Lane SS & Pepose JS. Optical Performance of 3 Intraocular Lens Designs in the Presence of Decentration. J Cataract Refract Surg. 2005;31:574-85.
[156] Rawer R, Stork W, Spraul CW & Lingenfelder C. Imaging Quality of Intraocular Lenses. J Cataract Refract Surg. 2005;31:1618-31.
[157] Carkeet A, Velaedan S, Tan YK, Lee DY & Tan DT. Higher Order Ocular Aberrations after Cycloplegic and Non-Cycloplegic Pupil Dilation. J Refract Surg. 2003;19:316-22.
[158] Yang Y, Thompson K & Burns SA. Pupil Location under Mesopic, Photopic, and Pharmacologically Dilated Conditions. Invest Ophthalmol Vis Sci. 2002;43:2508-12.
[159] Cheng X, Bradley A & Thibos LN. Predicting Subjective Judgment of Best Focus with Objective Image Quality Metrics. J Vis. 2004;4:310-21.
[160] Guirao A & Williams DR. A Method to Predict Refractive Errors from Wave Aberration Data. Optom Vis Sci. 2003;80:36-42.
[161] Thibos LN. Principles of Hartmann-Shack Aberrometry. J Refract Surg. 2000;16:s563-65.
[162] Artal P, Benito A, Perez GM, et al. An Objective Scatter Index Based on Double-Pass Retinal Images of a Point Source to Classify Cataracts. PLoS One. 2011;6:e168231-e7.

Clinical Techniques to Assess the Visual and Optical Performance ... 47
[163] Vilaseca M, Peris E, Pujol J, Borras R & Arjona M. Intra- and Intersession Repeatability of a Double-Pass Instrument. Optom Vis Sci. 2010;87:675-81.
[164] Saad A, Saab M & Gatinel D. Repeatability of Measurements with a Double-Pass System. J Cataract Refract Surg. 2010;36:28-33.
[165] Tomas J, Pinero DP & Alio JL. Intra-Observer Repeatability of Optical Quality Measures Provided by a Double-Pass System. Clin Exp Optom. 2012;95:60-5.
[166] Ferrer-Blasco T, Garcia-Lazaro S, Montes-Mico R, Cervino A & Gonzalez-Meijome JM. Dynamic Changes in the Air-Tear Film Interface Modulation Transfer Function. Graefes Arch Clin Exp Ophthalmol. 2010;248:127-32.
[167] Montes-Mico R, Alio JL, Munoz G & Charman WN. Temporal Changes in Optical Quality of Air-Tear Film Interface at Anterior Cornea after Blink. Invest Ophthalmol Vis Sci. 2004;45:1752-7.
[168] Montes-Mico R. Role of the Tear Film in the Optical Quality of the Human Eye. J Cataract Refract Surg. 2007;33:1631-5.
[169] Gatinel D. Double Pass-Technique Limitations for Evaluation of Optical Performance after Diffractive IOL Implantation. J Cataract Refract Surg. 2011;37:621-2; author reply 2.
[170] Artal P, Marcos S, Navarro R & Williams DR. Odd Aberrations and Double-Pass Measurements of Retinal Image Quality. J Opt Soc Am A Opt Image Sci Vis. 1995;12:195-201.
[171] Iglesias I, Berrio E & Artal P. Estimates of the Ocular Wave Aberration from Pairs of Double-Pass Retinal Images. J Opt Soc Am A Opt Image Sci Vis. 1998;15:2466-76.
[172] Artal P, Iglesias I, Lopez-Gil N & Green DG. Double-Pass Measurements of the Retinal-Image Quality with Unequal Entrance and Exit Pupil Sizes and the Reversibility of the Eye's Optical System. J Opt Soc Am A Opt Image Sci Vis. 1995;12:2358-66.
[173] Iglesias I, Lopez-Gil N & Artal P. Reconstruction of the Point-Spread Function of the Human Eye from Two Double-Pass Retinal Images by Phase-Retrieval Algorithms. J Opt Soc Am A Opt Image Sci Vis. 1998;15:326-39.
[174] Diaz-Douton F, Benito A, Pujol J, et al. Comparison of the Retinal Image Quality with a Hartmann-Shack Wavefront Sensor and a Double-Pass Instrument. Invest Ophthalmol Vis Sci. 2006;47:1710-6.

Amit Navin Jinabhai, Graeme Young, Lee Anthony Hall et al. 48
[175] Rodriguez P & Navarro R. Double-Pass Versus Aberrometric Modulation Transfer Function in Green Light. J Biomed Opt. 2007;12:044018.
[176] Cazal J, Lavin-Dapena C, Marin J & Verges C. Accommodative Intraocular Lens Tilting. Am J Ophthalmol. 2005;140:341-4.
[177] Taketani F, Matuura T, Yukawa E & Hara Y. Influence of Intraocular Lens Tilt and Decentration on Wavefront Aberrations. J Cataract Refract Surg. 2004;30:2158-62.
[178] Patel CK, Ormonde S, Rosen PH & Bron AJ. Postoperative Intraocular Lens Rotation: A Randomized Comparison of Plate and Loop Haptic Implants. Ophthalmology. 1999;106:2190-5; discussion 6.
[179] Vass C, Menapace R, Schmetterer K, et al. Prediction of Pseudophakic Capsular Bag Diameter Based on Biometric Variables. J Cataract Refract Surg. 1999;25:1376-81.
[180] Shimizu K, Misawa A & Suzuki Y. Toric Intraocular Lenses: Correcting Astigmatism While Controlling Axis Shift. J Cataract Refract Surg. 1994;20:523-6.
[181] Chang DF. Comparative Rotational Stability of Single-Piece Open-Loop Acrylic and Plate-Haptic Silicone Toric Intraocular Lenses. J Cataract Refract Surg. 2008;34:1842-7.
[182] Chua WH, Yuen LH, Chua J, Teh G & Hill WE. Matched Comparison of Rotational Stability of 1-Piece Acrylic and Plate-Haptic Silicone Toric Intraocular Lenses in Asian Eyes. J Cataract Refract Surg. 2012;38:620-4.
[183] Oshika T, Nagata T & Ishii Y. Adhesion of Lens Capsule to Intraocular Lenses of Polymethylmethacrylate, Silicone, and Acrylic Foldable Materials: An Experimental Study. Br J Ophthalmol. 1998;82:549-53.
[184] Gerten G, Michels A & Olmes A. [Toric Intraocular Lenses. Clinical Results and Rotational Stability]. Ophthalmologe. 2001;98:715-20.
[185] Shah GD, Praveen MR, Vasavada AR, et al. Rotational Stability of a Toric Intraocular Lens: Influence of Axial Length and Alignment in the Capsular Bag. J Cataract Refract Surg. 2012;38:54-9.
[186] Zuberbuhler B, Signer T, Gale R & Haefliger E. Rotational Stability of the AcrySof SA60TT Toric Intraocular Lenses: A Cohort Study. BMC Ophthalmology. 2008;8:1-5.
[187] Mendicute J, Irigoyen C, Ruiz M, et al. Toric Intraocular Lens Versus Opposite Clear Corneal Incisions to Correct Astigmatism in Eyes Having Cataract Surgery. J Cataract Refract Surg. 2009;35:451-8.

Clinical Techniques to Assess the Visual and Optical Performance ... 49
[188] De Silva DJ, Ramkissoon YD & Bloom PA. Evaluation of a Toric Intraocular Lens with a Z-Haptic. J Cataract Refract Surg. 2006;32:1492-8.
[189] Chang DF. Early Rotational Stability of the Longer STAAR Toric Intraocular Lens: Fifty Consecutive Cases. J Cataract Refract Surg. 2003;29:935-40.
[190] Jampaulo M, Olson MD & Miller KM. Long-Term STAAR Toric Intraocular Lens Rotational Stability. Am J Ophthalmol. 2008;146:550-3.
[191] Kim MH, Chung TY & Chung ES. Long-Term Efficacy and Rotational Stability of AcrySof Toric Intraocular Lens Implantation in Cataract Surgery. Korean J Ophthalmol. 2010;24:207-12.
[192] Koshy JJ, Nishi Y, Hirnschall N, et al. Rotational Stability of a Single-Piece Toric Acrylic Intraocular Lens. J Cataract Refract Surg. 2010;36:1665-70.
[193] Wolffsohn JS & Buckhurst PJ. Objective Analysis of Toric Intraocular Lens Rotation and Centration. J Cataract Refract Surg. 2010;36:778-82.
[194] Visser N, Berendschot TT, Bauer NJ, et al. Accuracy of Toric Intraocular Lens Implantation in Cataract and Refractive Surgery. J Cataract Refract Surg. 2011;37:1394-402.
[195] Weinand F, Jung A, Stein A, et al. Rotational Stability of a Single-Piece Hydrophobic Acrylic Intraocular Lens: New Method for High-Precision Rotation Control. J Cataract Refract Surg. 2007;33:800 - 3.
[196] Sasaki K, Sakamoto Y, Shibata T, Nakaizumi H & Emori Y. Measurement of Postoperative Intraocular Lens Tilting and Decentration Using Scheimpflug Images. J Cataract Refract Surg. 1989;15:454-7.
[197] Jung CK, Chung SK & Baek NH. Decentration and Tilt: Silicone Multifocal Versus Acrylic Soft Intraocular Lenses. J Cataract Refract Surg. 2000;26:582-5.
[198] Hayashi K, Hayashi H, Nakao F & Hayashi F. Comparison of Decentration and Tilt between One Piece and Three Piece Polymethyl Methacrylate Intraocular Lenses. Br J Ophthalmol. 1998;82:419-22.
[199] Hayashi K, Harada M, Hayashi H, Nakao F & Hayashi F. Decentration and Tilt of Polymethyl Methacrylate, Silicone, and Acrylic Soft Intraocular Lenses. Ophthalmology. 1997;104:793-8.
[200] Hayashi K, Hayashi H, Nakao F & Hayashi F. Intraocular Lens Tilt and Decentration, Anterior Chamber Depth, and Refractive Error after

Amit Navin Jinabhai, Graeme Young, Lee Anthony Hall et al. 50
Trans-Scleral Suture Fixation Surgery. Ophthalmology. 1999;106:878-82.
[201] Rosales P, Dubbelman M, Marcos S & van der Heijde R. Crystalline Lens Radii of Curvature from Purkinje and Scheimpflug Imaging. J Vis. 2006;6:1057-67.
[202] Rosales P & Marcos S. Pentacam Scheimpflug Quantitative Imaging of the Crystalline Lens and Intraocular Lens. J Refract Surg. 2009;25: 421-8.
[203] de Castro A, Rosales P & Marcos S. Tilt and Decentration of Intraocular Lenses In-Vivo from Purkinje and Scheimpflug Imaging. Validation Study. J Cataract Refract Surg. 2007;33:418-29.
[204] Drews RC. Depth of Field in Slit Lamp Photography. An Optical Solution Using the Scheimpflug Principle. Ophthalmologica. 1964;148:143-50.
[205] Wolffsohn JS & Davies LN. Advances in Ocular Imaging. Expert Rev Ophthalmol. 2007;2:755-67.
[206] Fink W. Refractive Correction Method for Digital Charge-Coupled Device-Recorded Scheimpflug Photographs by Means of Ray Tracing. J Biomed Opt. 2005;10:024003.
[207] Patel S, Alio JL & Perez-Santonja JJ. A Model to Explain the Difference Between Changes in Refraction and Central Ocular Surface Power after Laser in Situ Keratomileusis. J Refract Surg. 2000;16:330-5.
[208] Oshika T, Kawana K, Hiraoka T, Kaji Y & Kiuchi T. Ocular Higher-Order Wavefront Aberration Caused by Major Tilting of Intraocular Lens. Am J Ophthalmol. 2005;140:744-6.
[209] Viestenz A, Seitz B & Langenbucher A. Evaluating the Eye's Rotational Stability During Standard Photography. Effect on Determining the Axial Orientation of Toric Intraocular Lenses. J Cataract Refract Surg. 2005;31:557-61.
[210] Nishi Y, Hirnschall N, Crnej A, et al. Reproducibility of Intraocular Lens Decentration and Tilt Measurement Using a Clinical Purkinje Meter. J Cataract Refract Surg. 2010;36:1529-35.
[211] Tabernero J, Benito A, Nourrit V & Artal P. Instrument for Measuring the Misalignments of Ocular Surfaces. Opt Express. 2006;14:10945-56.
[212] Tabernero J, Piers P, Benito A, Redondo M & Artal P. Predicting the Optical Performance of Eyes Implanted with IOLs to Correct Spherical Aberration. Invest Ophthalmol Vis Sci. 2006;47:4651-8.

Clinical Techniques to Assess the Visual and Optical Performance ... 51
[213] Rosales P & Marcos S. Phakometry and Lens Tilt and Decentration Using a Custom-Developed Purkinje Imaging Apparatus: Validation and Measurements. J Opt Soc Am A Opt Image Sci Vis. 2006;23:509-20.
[214] Shoji N & Shimizu K. Binocular Function of the Patient with the Refractive Multifocal Intraocular Lens. J Cataract Refract Surg. 2002;28:1012-7.
[215] Ferrer-Blasco T, Madrid-Costa D, Garcia-Lazaro S, Cervino A & Montes-Mico R. Stereopsis in Bilaterally Multifocal Pseudophakic Patients. Graefes Arch Clin Exp Ophthalmol. 2011;249:245-51.
[216] Arens B, Freudenthaler N & Quentin CD. Binocular Function after Bilateral Implantation of Monofocal and Refractive Multifocal Intraocular Lenses. J Cataract Refract Surg. 1999;25:399-404.
[217] Jacobi FK, Kammann J, Jacobi KW, Grosskopf U & Walden K. Bilateral Implantation of Asymmetrical Diffractive Multifocal Intraocular Lenses. Arch Ophthalmol. 1999;117:17-23.
[218] Boberg-Ans J. Differences and Similarities in a Series of Cases with Bilateral Intraocular Lenses and Evaluation of the Results. Br J Ophthalmol. 1977;61:622-7.
[219] Hayashi K & Hayashi H. Stereopsis in Bilaterally Pseudophakic Patients. J Cataract Refract Surg. 2004;30:1466-70.
[220] Jacobi PC, Dietlein TS, Lueke C & Jacobi FK. Multifocal Intraocular Lens Implantation in Patients with Traumatic Cataract. Ophthalmology. 2003;110:531-8.
[221] Haring G, Gronemeyer A, Hedderich J & de Decker W. Stereoacuity and Aniseikonia after Unilateral and Bilateral Implantation of the Array Refractive Multifocal Intraocular Lens. J Cataract Refract Surg. 1999;25:1151-6.
[222] Nourrit V & Kelly JMF. Intraocular Scatter and Visual Performances. Optom Pract. 2009;10:117-28.
[223] Vos JJ. Disability Glare—a State of the Art Report. CIE Journal. 1984; 3:39-53.
[224] IJspeert JK, de Waard PW, van den Berg TJ & de Jong PT. The Intraocular Straylight Function in 129 Healthy Volunteers; Dependence on Angle, Age and Pigmentation. Vision Res. 1990;30:699-707.
[225] Coppens JE, Franssen L, van Rijn LJ & van den Berg TJ. Reliability of the Compensation Comparison Stray-Light Measurement Method. J Biomed Opt. 2006;11:0340271-9.

Amit Navin Jinabhai, Graeme Young, Lee Anthony Hall et al. 52
[226] Franssen L, Coppens JE & van den Berg TJ. Compensation Comparison Method for Assessment of Retinal Straylight. Invest Ophthalmol Vis Sci. 2006;47:768-76.
[227] Cervino A, Montes-Mico R & Hosking SL. Performance of the Compensation Comparison Method for Retinal Straylight Measurement: Effect of Patient's Age on Repeatability. Br J Ophthalmol. 2008;92:788-91.
[228] Holladay JT, Van Dijk H, Lang A, et al. Optical Performance of Multifocal Intraocular Lenses. J Cataract Refract Surg. 1990;16:413-22.
[229] Davison JA & Simpson MJ. History and Development of the Apodized Diffractive Intraocular Lens. J Cataract Refract Surg. 2006;32:849-58.
[230] Hofmann T, Zuberbuhler B, Cervino A, Montes-Mico R & Haefliger E. Retinal Straylight and Complaint Scores 18 Months after Implantation of the AcrySof Monofocal and ReSTOR Diffractive Intraocular Lenses. J Refract Surg. 2009;25:485-92.
[231] Visser N, Nuijts RM, de Vries NE & Bauer NJ. Visual Outcomes and Patient Satisfaction after Cataract Surgery with Toric Multifocal Intraocular Lens Implantation. J Cataract Refract Surg. 2011;37:2034-42.
[232] Cervino A, Hosking SL, Montes-Mico R & Alio JL. Retinal Straylight in Patients with Monofocal and Multifocal Intraocular Lenses. J Cataract Refract Surg. 2008;34:441-6.
[233] de Vries NE, Franssen L, Webers CA, et al. Intraocular Straylight after Implantation of the Multifocal AcrySof ReSTOR SA60D3 Diffractive Intraocular Lens. J Cataract Refract Surg. 2008;34:957-62.
[234] Pieh S, Lackner B, Hanselmayer G, et al. Halo Size under Distance and near Conditions in Refractive Multifocal Intraocular Lenses. Br J Ophthalmol. 2001;85:816-21.
[235] Dick HB, Krummenauer F, Schwenn O, Krist R & Pfeiffer N. Objective and Subjective Evaluation of Photic Phenomena after Monofocal and Multifocal Intraocular Lens Implantation. Ophthalmology. 1999;106:1878-86.
[236] Buckhurst PJ, Wolffsohn JS, Shah S, Naroo S & Davies LN. Evaluation of Dysphotopsia with Multifocal Intraocular Lenses. Invest Ophthalmol Vis Sci. 2011;52:(E-Abstract 6185).
[237] Lundstrom M & Pesudovs K. Questionnaires for Measuring Cataract Surgery Outcomes. J Cataract Refract Surg. 2011;37:945-59.

Clinical Techniques to Assess the Visual and Optical Performance ... 53
[238] McAlinden C, Gothwal VK, Khadka J, et al. A Head-to-Head Comparison of 16 Cataract Surgery Outcome Questionnaires. Ophthalmology. 2011;118:2374-81.
[239] Javitt JC, Wang F, Trentacost DJ, Rowe M & Tarantino N. Outcomes of Cataract Extraction with Multifocal Intraocular Lens Implantation: Functional Status and Quality of Life. Ophthalmology. 1997;104:589-99.
[240] Javitt JC, Jacobson G & Schiffman RM. Validity and Reliability of the Cataract Type Spec: An Instrument for Measuring Outcomes of Cataract Extraction. Am J Ophthalmol. 2003;136:285-90.
[241] Gothwal VK, Wright TA, Lamoureux EL & Pesudovs K. Using Rasch Analysis to Revisit the Validity of the Cataract Type Spec Instrument for Measuring Cataract Surgery Outcomes. J Cataract Refract Surg. 2009;35:1509-17.
[242] Rasch G. On General Laws and the Meaning of Measurement in Psychology. In: Neyman J, editor. Proceedings of the 4th Berkeley Symposium on Mathematical Statistics and Probability; 1961; Berkeley, California: University of California Press; 1961. p. 321-34.
[243] Gupta N, Wolffsohn JS, Naroo SA, et al. Development of a Near Activity Visual Questionnaire to Assess Accommodating Intraocular Lenses. Cont Lens Anterior Eye. 2007;30:134-43.
[244] Buckhurst PJ, Wolffsohn JS, Gupta N, et al. Development of a Questionnaire to Assess the Relative Subjective Benefits of Presbyopia Correction. J Cataract Refract Surg. 2012;38:74-9.
[245] McAlinden C, Pesudovs K & Moore JE. The Development of an Instrument to Measure Quality of Vision: The Quality of Vision (QoV) Questionnaire. Invest Ophthalmol Vis Sci. 2010;51:5537-45.
[246] Steinberg EP, Tielsch JM, Schein OD, et al. The VF-14. An Index of Functional Impairment in Patients with Cataract. Arch Ophthalmol. 1994;112:630-8.
[247] Alonso J, Espallargues M, Andersen TF, et al. International Applicability of the VF-14. An Index of Visual Function in Patients with Cataracts. Ophthalmology. 1997;104:799-807.
[248] Brydon KW, Tokarewicz AC & Nichols BD. AMO Array Multifocal Lens Versus Monofocal Correction in Cataract Surgery. J Cataract Refract Surg. 2000;26:96-100.
Amit Navin Jinabhai, Graeme Young, Lee Anthony Hall et al. 54
[249] Nijkamp MD, Dolders MG, de Brabander J, et al. Effectiveness of Multifocal Intraocular Lenses to Correct Presbyopia after Cataract Surgery: A Randomized Controlled Trial. Ophthalmology. 2004;111:1832-9.
[250] Uusitalo RJ, Brans T, Pessi T & Tarkkanen A. Evaluating Cataract Surgery Gains by Assessing Patients' Quality of Life Using the VF-7. J Cataract Refract Surg. 1999;25:989-94.
[251] Sen HN, Sarikkola AU, Uusitalo RJ & Laatikainen L. Quality of Vision after AMO Array Multifocal Intraocular Lens Implantation. J Cataract Refract Surg. 2004;30:2483-93.
[252] Gothwal VK, Wright TA, Lamoureux EL & Pesudovs K. Measuring Outcomes of Cataract Surgery Using the Visual Function Index-14. J Cataract Refract Surg. 2010;36:1181-8.
[253] Lundstrom M, Roos P, Jensen S & Fregell G. Catquest Questionnaire for Use in Cataract Surgery Care: Description, Validity, and Reliability. J Cataract Refract Surg. 1997;23:1226-36.
[254] Lundstrom M, Stenevi U, Thorburn W & Roos P. Catquest Questionnaire for Use in Cataract Surgery Care: Assessment of Surgical Outcomes. J Cataract Refract Surg. 1998;24:968-74.
[255] Lundstrom M & Pesudovs K. Catquest-9SF Patient Outcomes Questionnaire: Nine-Item Short-Form Rasch-Scaled Revision of the Catquest Questionnaire. J Cataract Refract Surg. 2009;35:504-13.
[256] Mangione CM, Lee PP, Pitts J, et al. Psychometric Properties of the National Eye Institute Visual Function Questionnaire (Nei-Vfq). Arch Ophthalmol. 1998;116:1496-504.
[257] Mangione CM, Lee PP, Gutierrez PR, et al. Development of the 25-Item National Eye Institute Visual Function Questionnaire. Arch Ophthalmol. 2001;119:1050-8.
[258] Kohnen T, Nuijts R, Levy P, Haefliger E & Alfonso JF. Visual Function after Bilateral Implantation of Apodized Diffractive Aspheric Multifocal Intraocular Lenses with a +3.0 D Addition. J Cataract Refract Surg. 2009;35:2062-9.
[259] Munoz G, Albarran-Diego C, Ferrer-Blasco T, Sakla HF & Garcia-Lazaro S. Visual Function after Bilateral Implantation of a New Zonal Refractive Aspheric Multifocal Intraocular Lens. J Cataract Refract Surg. 2011;37:2043-52.
[260] Donovan JL, Brookes ST, Laidlaw DA, et al. The Development and Validation of a Questionnaire to Assess Visual Symptoms/Dysfunction and Impact on Quality of Life in Cataract Patients: The Visual

Clinical Techniques to Assess the Visual and Optical Performance ... 55
Symptoms and Quality of Life (VSQ) Questionnaire. Ophthalmic Epidemiol. 2003;10:49-65.
[261] Chiam PJ, Chan JH, Aggarwal RK & Kasaby S. ReSTOR Intraocular Lens Implantation in Cataract Surgery: Quality of Vision. J Cataract Refract Surg. 2006;32:1459-63.
[262] Haring G, Dick HB, Krummenauer F, Weissmantel U & Kroncke W. Subjective Photic Phenomena with Refractive Multifocal and Monofocal Intraocular Lenses. Results of a Multicenter Questionnaire. J Cataract Refract Surg. 2001;27:245-9.
[263] Wallin TR, Hinckley M, Nilson C & Olson RJ. A Clinical Comparison of Single-Piece and Three-Piece Truncated Hydrophobic Acrylic Intraocular Lenses. Am J Ophthalmol. 2003;136:614-9.
[264] Tester R, Pace NL, Samore M & Olson RJ. Dysphotopsia in Phakic and Pseudophakic Patients: Incidence and Relation to Intraocular Lens Type(2). J Cataract Refract Surg. 2000;26:810-6.
[265] Massof RW. The Measurement of Vision Disability. Optom Vis Sci. 2002;79:516-52.
[266] Food & Drug Administration. Guidance for Industry; Patient-Reported Outcome Measures: Use in Medical Product Development to Support Labeling Claims Webpage 2009 [cited 11th June 2011]; Available from:http://www.fda.gov/downloads/Drugs/GuidanceCompliance RegulatoryInformation/Guidances/UCM193282.pdf
[267] Schaumberg DA, Dana MR, Christen WG & Glynn RJ. A Systematic Overview of the Incidence of Posterior Capsule Opacification. Ophthalmology. 1998;105:1213-21.
[268] Nagata T & Watanabe I. Optic Sharp Edge or Convexity: Comparison of Effects on Posterior Capsular Opacification. Jpn J Ophthalmol. 1996;40:397-403.
[269] Kruger AJ, Schauersberger J, Abela C, Schild G & Amon M. Two Year Results: Sharp Versus Rounded Optic Edges on Silicone Lenses. J Cataract Refract Surg. 2000;26:566-70.
[270] Sellman TR & Lindstrom RL. Effect of a Plano-Convex Posterior Chamber Lens on Capsular Opacification from Elschnig Pearl Formation. J Cataract Refract Surg. 1988;14:68-72.
[271] Findl O, Buehl W, Menapace R, et al. Comparison of 4 Methods for Quantifying Posterior Capsule Opacification. J Cataract Refract Surg. 2003;29:106-11.

Amit Navin Jinabhai, Graeme Young, Lee Anthony Hall et al. 56
[272] Hayashi K, Hayashi H, Nakao F & Hayashi F. In-Vivo Quantitative Measurement of Posterior Capsule Opacification after Extracapsular Cataract Surgery. Am J Ophthalmol. 1998;125:837-43.
[273] Lasa MS, Datiles MB, 3rd, Magno BV & Mahurkar A. Scheimpflug Photography and Postcataract Surgery Posterior Capsule Opacification. Ophthalmic Surg. 1995;26:110-3.
[274] Grewal D, Jain R, Brar GS & Grewal SP. Pentacam Tomograms: A Novel Method for Quantification of Posterior Capsule Opacification. Invest Ophthalmol Vis Sci. 2008;49:2004-8.
[275] Aslam TM, Dhillon B, Werghi N, Taguri A & Wadood A. Systems of Analysis of Posterior Capsule Opacification. Br J Ophthalmol. 2002;86:1181-6.
[276] Wang MC & Woung LC. Digital Retroilluminated Photography to Analyze Posterior Capsule Opacification in Eyes with Intraocular Lenses. J Cataract Refract Surg. 2000;26:56-61.
[277] Camparini M, Macaluso C, Reggiani L & Maraini G. Retroillumination Versus Reflected-Light Images in the Photographic Assessment of Posterior Capsule Opacification. Invest Ophthalmol Vis Sci. 2000;41:3074-9.
[278] Pande MV, Ursell PG, Spalton DJ, Heath G & Kundaiker S. High-Resolution Digital Retroillumination Imaging of the Posterior Lens Capsule after Cataract Surgery. J Cataract Refract Surg. 1997;23:1521-7.
[279] Friedman DS, Duncan DD, Munoz B, West SK & Schein OD. Digital Image Capture and Automated Analysis of Posterior Capsular Opacification. Invest Ophthalmol Vis Sci. 1999;40:1715-26.
[280] Tetz MR & Nimsgern C. Posterior Capsule Opacification. Part 2: Clinical Findings. J Cataract Refract Surg. 1999;25:1662-74.
[281] Barman SA, Hollick EJ, Boyce JF, et al. Quantification of Posterior Capsular Opacification in Digital Images after Cataract Surgery. Invest Ophthalmol Vis Sci. 2000;41:3882-92.
[282] Bender L, Spalton DJ, Uyanonvara B, et al. POCOman: New System for Quantifying Posterior Capsule Opacification. J Cataract Refract Surg. 2004;30:2058-63.
[283] Buehl W, Findl O, Menapace R, et al. Reproducibility of Standardized Retroillumination Photography for Quantification of Posterior Capsule Opacification. J Cataract Refract Surg. 2002;28:265-70.
[284] Sacu S, Menapace R, Findl O, et al. Long-Term Efficacy of Adding a Sharp Posterior Optic Edge to a Three-Piece Silicone Intraocular Lens

Clinical Techniques to Assess the Visual and Optical Performance ... 57
on Capsule Opacification: Five-Year Results of a Randomized Study. Am J Ophthalmol. 2005;139:696-703.
[285] Bohorquez V & Alarcon R. Long-Term Reading Performance in Patients with Bilateral Dual-Optic Accommodating Intraocular Lenses. J Cataract Refract Surg. 2010;36:1880-6.
[286] Tahzib NG, Nuijts RM, Wu WY & Budo CJ. Long-Term Study of Artisan Phakic Intraocular Lens Implantation for the Correction of Moderate to High Myopia: Ten-Year Follow-up Results. Ophthalmology. 2007;114:1133-42.
[287] Hauranieh N & Giardini P. A High-Tech New Device Eyevispod Helps to Evlauate Refractive Lens Surgery and Other Presbyopic Surgeries on near and Intermediate Vision Quality. Eur Ophthal Rev. 2011;5:46-9.