linguaskill linguaskill listening and reading | trial report | april 2016 trial results does prior...
TRANSCRIPT

Linguaskill
Linguaskill
Listening and reading
Trial reportApril 2016
Research teamJing XuTrevor Benjamin

2 Listening and Reading | Trial report | April 2016
Section
Linguaskill
Linguaskill
Contents
What is Linguaskill? . . . . . . . . . . . . . . . . . . . . . . . . . . . . . . . . . . . . . . . . . 3
The Linguaskill trial . . . . . . . . . . . . . . . . . . . . . . . . . . . . . . . . . . . . . . . . . . 3
Key findings of the Linguaskill trial . . . . . . . . . . . . . . . . . . . . . . 4
Trial results . . . . . . . . . . . . . . . . . . . . . . . . . . . . . . . . . . . . . . . . . . . . . . . . . . . . 5
Recommendations . . . . . . . . . . . . . . . . . . . . . . . . . . . . . . . . . . . . . . . . . 10
Actions taken . . . . . . . . . . . . . . . . . . . . . . . . . . . . . . . . . . . . . . . . . . . . . . . . . 11
Appendices . . . . . . . . . . . . . . . . . . . . . . . . . . . . . . . . . . . . . . . . . . . . . . . . . . 12

Listening and Reading | Trial report | April 2016 3Linguaskill
The Linguaskill trial
What is Linguaskill?
Linguaskill is a computer-based (CB), multi-level test that assesses English language proficiency. Test scores are reported at Levels A1–C2 of the Common European Framework of Reference (CEFR)1.
Linguaskill is designed for companies and employees, educational institutions and learners around the world who need to understand their own, or someone else’s level of English communication skills. The testing experience is designed to be quick, easy and cost effective, with robust results that you can trust.
The Linguaskill trialThe Linguaskill Listening and Reading tests were trialled from late February to 31 March 2016. A total of 248 English language learners participated in the trial.
Adaptive, multi-level English testing
The aims of the trial were to:
• investigate the precision and reliability of test scores
• investigate test fairness
• understand candidates’ test-taking experience
• evaluate how well the tests meet learners’ needs
• identify whether the design of the tests could be further improved.
The findings in this report are based on the following data:
• Trial tests: the questions attempted, test responses and test scores.
• Online survey: 77% of participants completed a survey, giving their overall impression and opinions about the tests.
1 The Common European Framework of Reference (CEFR) is a guideline developed by the Council of Europe (2001) that describes the achievements of learners of foreign languages at various proficiency levels. www.cambridgeenglish.org/cefr
Please see the Appendices (p12) for more details about the methodologies employed in this study, including participants, data collection and data analysis.
4 Listening and Reading | Trial report | April 2016
Section
Linguaskill
Key findings of the Linguaskill trial
Linguaskill test scores are reliable and precise.
The trial showed that:
Reliability: the reliability estimates for Listening, Reading and the overall test are .92, .94 and .96, respectively. A reliability coefficient over .90 is considered good.
Precision: the target level of precision was reached in roughly 90% of trial tests (91% in Listening tests and 88% in Reading tests).
• Prior experience of taking a computer-based test did not appear to affect participants’ test results. This implies that the test interface of Linguaskill is self-explanatory to candidates.
• A majority of the participants had a positive test-taking experience. Over 60% of them felt positive about taking the Linguaskill Listening and Reading tests. Approximately one third of the participants were neutral about the tests.
• Approximately 91% of the participants agreed that the Listening test instructions were clear.
• Participants were positive about the test interface and the use of images for visual aid, the interesting topics and relevance of test content to language used in daily life. They also valued self-assessment and language learning.
Listening and Reading | Trial report | April 2016 5Linguaskill
Trial results
Trial results
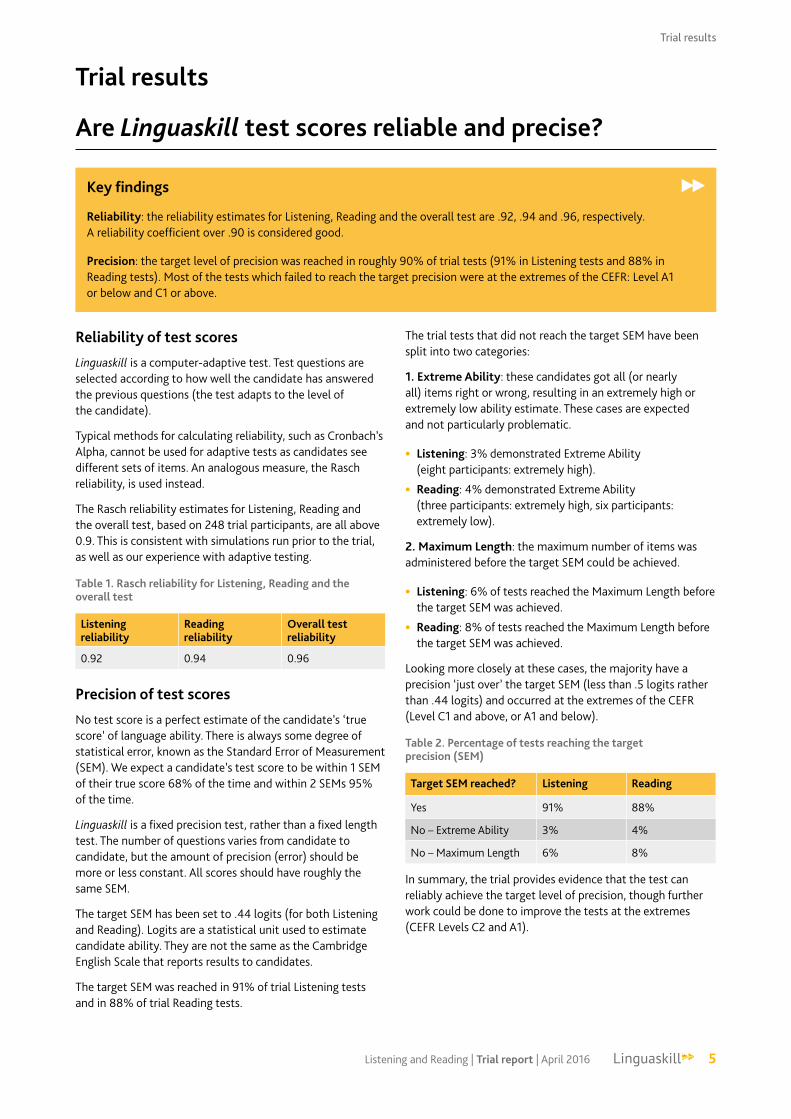
Are Linguaskill test scores reliable and precise?
Key findings
Reliability: the reliability estimates for Listening, Reading and the overall test are .92, .94 and .96, respectively. A reliability coefficient over .90 is considered good.
Precision: the target level of precision was reached in roughly 90% of trial tests (91% in Listening tests and 88% in Reading tests). Most of the tests which failed to reach the target precision were at the extremes of the CEFR: Level A1 or below and C1 or above.
Reliability of test scores
Linguaskill is a computer-adaptive test. Test questions are selected according to how well the candidate has answered the previous questions (the test adapts to the level of the candidate).
Typical methods for calculating reliability, such as Cronbach’s Alpha, cannot be used for adaptive tests as candidates see different sets of items. An analogous measure, the Rasch reliability, is used instead.
The Rasch reliability estimates for Listening, Reading and the overall test, based on 248 trial participants, are all above 0.9. This is consistent with simulations run prior to the trial, as well as our experience with adaptive testing.
Table 1. Rasch reliability for Listening, Reading and the overall test
Listening reliability
Reading reliability
Overall test reliability
0.92 0.94 0.96
Precision of test scores
No test score is a perfect estimate of the candidate’s ‘true score’ of language ability. There is always some degree of statistical error, known as the Standard Error of Measurement (SEM). We expect a candidate’s test score to be within 1 SEM of their true score 68% of the time and within 2 SEMs 95% of the time.
Linguaskill is a fixed precision test, rather than a fixed length test. The number of questions varies from candidate to candidate, but the amount of precision (error) should be more or less constant. All scores should have roughly the same SEM.
The target SEM has been set to .44 logits (for both Listening and Reading). Logits are a statistical unit used to estimate candidate ability. They are not the same as the Cambridge English Scale that reports results to candidates.
The target SEM was reached in 91% of trial Listening tests and in 88% of trial Reading tests.
The trial tests that did not reach the target SEM have been split into two categories:
1. Extreme Ability: these candidates got all (or nearly all) items right or wrong, resulting in an extremely high or extremely low ability estimate. These cases are expected and not particularly problematic.
• Listening: 3% demonstrated Extreme Ability (eight participants: extremely high).
• Reading: 4% demonstrated Extreme Ability (three participants: extremely high, six participants: extremely low).
2. Maximum Length: the maximum number of items was administered before the target SEM could be achieved.
• Listening: 6% of tests reached the Maximum Length before the target SEM was achieved.
• Reading: 8% of tests reached the Maximum Length before the target SEM was achieved.
Looking more closely at these cases, the majority have a precision ‘just over’ the target SEM (less than .5 logits rather than .44 logits) and occurred at the extremes of the CEFR (Level C1 and above, or A1 and below).
Table 2. Percentage of tests reaching the target precision (SEM)
Target SEM reached? Listening Reading
Yes 91% 88%
No – Extreme Ability 3% 4%
No – Maximum Length 6% 8%
In summary, the trial provides evidence that the test can reliably achieve the target level of precision, though further work could be done to improve the tests at the extremes (CEFR Levels C2 and A1).
6 Listening and Reading | Trial report | April 2016Linguaskill
Trial results
Does prior experience of taking computer-based tests affect test scores?
Key findings
Prior experience of taking a computer-based test did not appear to affect participants’ test results. This implies that the test interface of Linguaskill is self-explanatory to candidates.
An important validity consideration for a computer-based test is whether candidates’ level of computer proficiency (e.g. their experience of taking a language test on a computer) has an effect on their test performance. In the online survey, participants were asked if they had had any computer-based test experience before the Linguaskill trial.
Based on their survey answers, participants were divided into two groups – (1) those with experience and (2) those without experience. Then, the test scores of the two groups were compared. Table 3 and Figure 1 below show that the means and standard deviations of the two groups’ Listening and Reading test scores are quite similar.
The test scores of each group are not normally distributed (see Figure 2). Therefore, a Wilcoxon Signed Rank test was conducted to compare the central tendency of score distribution between the two groups.
The test indicated there is no significant difference in the Listening test scores (Z = .92, p > .05) or Reading test scores (Z = -.49, p > .05) between the two groups. Prior computer-based test experience does not appear to affect test results.
Table 3. Descriptive statistics of the two groups’ Listening and Reading test scores
Variable Group n Mean SD
Listening score
CB experience (No) 75 142.04 24.84
CB experience (Yes) 82 139.33 24.64
Reading score
CB experience (No) 75 205.00 27.97
CB experience (Yes) 82 204.00 27.45
200
100
120
140
160
180
No, never Yes, I hadCB experience
List
enin
g sc
ore
30%
0%
10%
20%No, never
Yes, I had
Listening score
Perc
ent
30%
0%100 150 200
10%
20%
100 150 200
NormalKernel
200
75
100
125
150
175
No, never Yes, I hadCB experience
Read
ing
scor
e
30%
0%
10%
20%
40%
30%
0%
10%
20%No, never
Yes, I had
Reading score
Perc
ent
100 20050 250150
100 150 25050 200
NormalKernel
Figure 1. Box plots of the two groups’ Listening and Reading test scores
Figure 2. Distribution of the two groups’ Listening and Reading test scores
Listening and Reading | Trial report | April 2016 7Linguaskill
Trial results
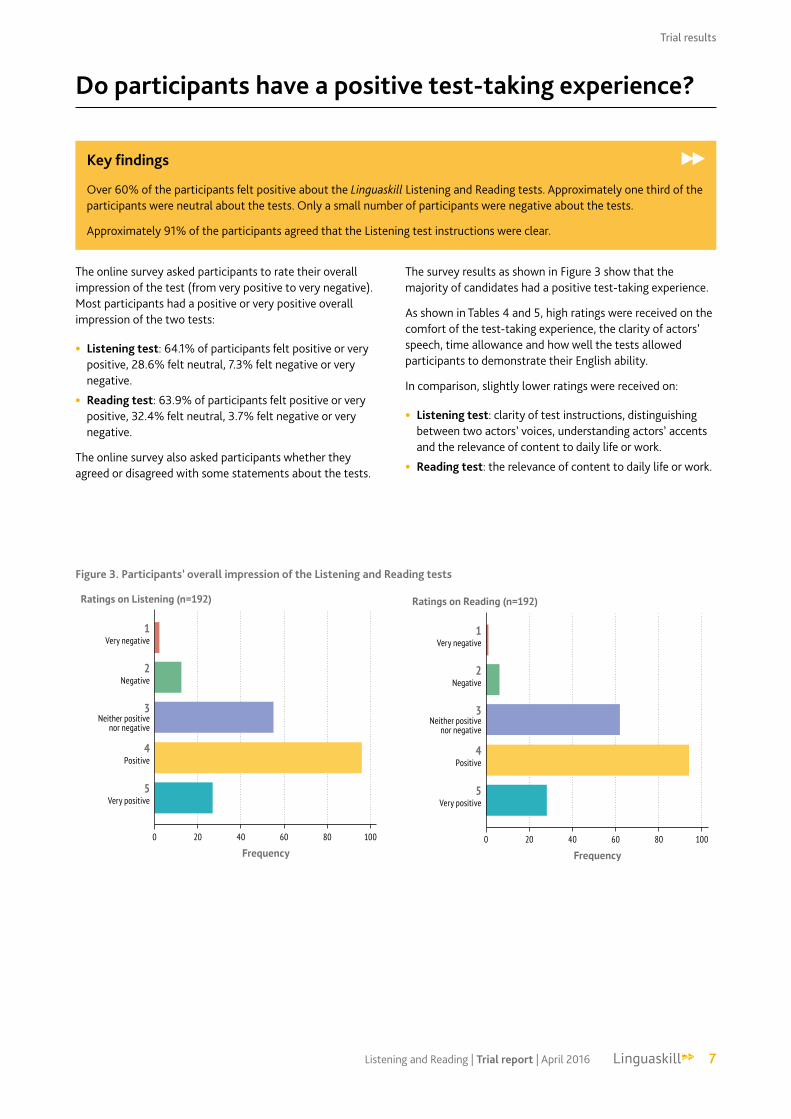
Do participants have a positive test-taking experience?
Key findings
Over 60% of the participants felt positive about the Linguaskill Listening and Reading tests. Approximately one third of the participants were neutral about the tests. Only a small number of participants were negative about the tests.
Approximately 91% of the participants agreed that the Listening test instructions were clear.
The online survey asked participants to rate their overall impression of the test (from very positive to very negative). Most participants had a positive or very positive overall impression of the two tests:
• Listening test: 64.1% of participants felt positive or very positive, 28.6% felt neutral, 7.3% felt negative or very negative.
• Reading test: 63.9% of participants felt positive or very positive, 32.4% felt neutral, 3.7% felt negative or very negative.
The online survey also asked participants whether they agreed or disagreed with some statements about the tests.
The survey results as shown in Figure 3 show that the majority of candidates had a positive test-taking experience.
As shown in Tables 4 and 5, high ratings were received on the comfort of the test-taking experience, the clarity of actors’ speech, time allowance and how well the tests allowed participants to demonstrate their English ability.
In comparison, slightly lower ratings were received on:
• Listening test: clarity of test instructions, distinguishing between two actors’ voices, understanding actors’ accents and the relevance of content to daily life or work.
• Reading test: the relevance of content to daily life or work.
1Very negative
2Negative
3Neither positive
nor negative
4Positive
5Very positive
Ratings on Listening (n=192)
Frequency0 20 40 60 80 100
1Very negative
2Negative
3Neither positive
nor negative
4Positive
5Very positive
Ratings on Reading (n=192)
Frequency0 20 40 60 80 100
Figure 3. Participants’ overall impression of the Listening and Reading tests

8 Listening and Reading | Trial report | April 2016Linguaskill
Trial results
Table 4. Participants’ attitudes towards statements about the Listening test
Statements about the Listening test Agr
ee o
r str
ongl
y ag
ree
(4 o
r 5)
Neu
tral
(3)
Dis
agre
e or
str
ongl
y di
sagr
ee (1
or 2
)
Num
ber o
f re
spon
ses
Mea
n
SD
I feel comfortable taking the test on a computer 81.3% 15.0% 3.7% 187 3.89 .66
The speech I heard in the test was loud and clear 77.5% 17.7% 4.8% 186 3.96 .78
I understood clearly what I had to do in the test 59.2% 32.1% 8.7% 184 3.70 .88
I had enough time to finish each task in the test 73.6% 19.8% 6.6% 182 3.94 .89
When there was more than one speaker, it was easy to recognise each of them
66.1% 30.1% 3.8% 186 3.84 .81
It was easy to understand speakers’ different accents 62.4% 30.1% 7.5% 186 3.66 .83
The listening tasks reflect how English is used in my daily life or work 66.4% 27.8% 5.8% 187 3.76 .86
I did my best in the Listening test 71.1% 20.9% 8.0% 187 3.86 .86
The test allowed me to show my English listening ability 75.3% 23.1% 1.6% 186 4.00 .75
Table 5. Participants’ attitudes towards statements about the Reading test
Statements about the Reading test Agr
ee o
r str
ongl
y ag
ree
(4 o
r 5)
Neu
tral
(3)
Dis
agre
e or
str
ongl
y di
sagr
ee (1
or 2
)
Num
ber o
f re
spon
ses
Mea
n
SD
I felt comfortable taking the test on a computer 83.9% 15.0% 1.1% 180 4.11 .68
I understood clearly what I had to do in the test 76.7% 22.2% 1.1% 180 4.01 .72
I had enough time to finish each task in the test 85.6% 13.3% 1.1% 180 4.13 .67
The texts I read reflect how English is used in my daily life or work 68.9% 27.8% 3.3% 180 3.87 .82
I did my best in the Reading test 78.7% 17.9% 3.4% 179 4.07 .79
The test allowed me to show my English reading ability 84.5% 14.4% 1.1% 180 4.12 .68

Listening and Reading | Trial report | April 2016 9Linguaskill
Trial results
What do participants think are the strengths and limitations of the tests?
Key findings
Participants were positive about the test interface and the use of images for visual aid, the interesting topics and relevance of test content to language used in daily life. They also valued self-assessment and language learning.
The online survey had three open-ended questions, which invited participants to express their opinions on the tests.
Responses were classified into categories and coded as either positive or negative2. These responses are shown in Tables 6 and 7.
Table 6. Participants’ positive comments about the Listening and Reading tests
Positive comments about the Listening test Positive comments about the Reading test
Interface • Well-organised test interface • The layout of the interface
• Visual aid from images
• Clear test instructions
• Experience of reading on the computer
Content • Interesting topics
• Variety of topics
• Relevance of the test contents to daily life
• Interesting topics
• Difficulty of tasks
• Short reading tasks
Learning • Opportunity for self-assessment, practice and language learning
• Opportunity for self-assessment, practice and language learning
Table 7. Participants’ negative comments about the Listening and Reading tests
Negative comments about the Listening test Negative comments about the Reading test
Interface • Lack of control or indication of when the audio begins
• Insufficient time for reading the questions
• Being unable to highlight texts and make notes
• The quality of images
• Hidden options
Content • High cognitive demand for reading the questions
• Difficulty of the listening tasks (speech rate, accents, topic, vocabulary, etc.)
• The length of the test
• Difficulty of vocabulary and acronyms
• Time pressure
Learning environment
• Noise in the test environment • Errors caused by poor internet connection
In addition, participants had mixed opinions on the Listening test about the audio quality, actors’ accents and speech rate, the chosen topics and affective factors (e.g. anxiety and time pressure).
2 Note: responses in poor grammar were paraphrased or corrected, repetitive opinions were aggregated and some responses were translated from Spanish.

10 Listening and Reading | Trial report | April 2016Linguaskill
Recommendations
The following recommendations arise from the findings in this report:
• Create more test items targeting CEFR Levels A1 and C2.
• Provide familiarisation opportunities (e.g. tutorials or practice tests) to reduce candidates’ anxiety.
• Give candidates more control or information on test progress in the Listening test.
• Avoid exposing low-level candidates to difficult tasks (e.g. strong accents, difficult vocabulary and unusual topics).
• Allow candidates to highlight texts on screen or take notes while reading.
• Use better quality images.
• Improve the test environment (noise, internet connection, etc.).
Recommendations

Listening and Reading | Trial report | April 2016 11Linguaskill
Actions taken
Based on these recommendations, we have carried out the following actions:
• We are developing more test items specifically targeting Levels A1 and C2.
• A digital tutorial and practice materials are planned for development, to familiarise candidates with the test format and interface.
• To give candidates more control on test progress in Listening, standardised rubrics have been developed to ensure that information on the length of pauses for reading questions is provided.
• Following the trial, there have been two item bank reviews, to identify and replace unsuitable test items (e.g., strong accents, difficult vocabulary and unusual topics).
• All tasks have been reviewed and pixelated images replaced with higher resolution versions.
• As test centres are recommended to adhere to our guidelines for test administration, we have put together a user guide to assist agents with test set-up and checking their internet connection.
Actions taken

12 Listening and Reading | Trial report | April 2016
Section
Linguaskill
Appendices
Data collection
The Linguaskill Listening and Reading tests are delivered through an online testing platform called Metrica.
The following data was collected through Metrica:
• participants’ test responses
• the questions that participants attempted
• participants’ test scores.
At the end of their tests, participants were invited to complete an online survey administered on Survey Monkey. The survey was completed by 192 participants (77.4%).
Appendices
12 Listening and Reading | Trial report | April 2016Linguaskill

Listening and Reading | Trial report | April 2016 13Linguaskill
Appendices
Participants
In total, 248 English language learners participated in the trial.
Participants
A: Gender Male: 38.0%
Female: 55.5%
Unknown: 6.5%
E: English language ability (CEFR level)
Listening
A1: Breakthrough 16.3%
A2: Waystage 40.0%
B1: Threshold 21.2%
B2: Vantage 13.9%
C1: Effective Operational Proficiency 3.7%
C2: Mastery 4.9%
Reading
Below A1 level 7.8%
A1: Breakthrough 19.2 %
A2: Waystage 31.4%
B1: Threshold 20.8%
B2: Vantage 11.8%
C1: Effective Operational Proficiency 4.9%
C2: Mastery 3.7%
B: Age 16 or below: 1.2%
17–24: 73.9%
25–39: 15.5%
40–59: 2.9%
60 or above: 0.8%
Unknown: 5.7%
C: First language Chinese: 2.9%
French: 0.4%
Hungarian: 0.4%
Italian: 35.1%
Japanese: 0.4%
Khmer: 0.4%
Malay: 5.7%
Spanish: 15.1%
Tamil: 0.4%
Thai: 34.7%
Other: 4.5%
D: Reason for taking the test
Company requirement: 6.9%
Further education: 6.9%
Job advancement: 10.2%
Migration: 0.8%
Personal development: 37.1%
School requirement: 29.3%
Other: 8.8%
F: Prior experience of computer-based tests
No prior experience of computer-based tests: 49.3%
Prior experience of computer-based tests: 50.7%
Most participants’ listening and reading proficiency was between A1 and B1 level on the CEFR scale.
A small number of participants demonstrated proficiency between C1 and C2 level on the CEFR scale (see Figure 6).

14 Listening and Reading | Trial report | April 2016Linguaskill
Appendices
Figure 4. Participants’ ages
Figure 5. Participants’ first languages
Figure 6. Participants’ listening and reading proficiency levels
0
40
98
52
34
912
Frequency
Below A1 A1 A2 B1 B2 C1 C20
Listening grade (n=245)
20
10
30
40
50
60
70
80
90
100
19
47
77
51
29
12 9
Frequency
Below A1 A1 A2 B1 B2 C1 C20
Reading grade (n=245)
20
10
30
40
50
60
70
80
90
100
Frequency
86 85
37
149 7
2 1 1 1 1 1Italian Thai Spanish Malay English Chinese Other French Hungarian Japanese Khmer Tamil
100
80
60
40
20
0
First language (n=245)
Frequency
0
50
100
150
200
Age groups (n=245)
3 7 2
181
38
16 or below 60 or above17–24 25–39 40–59

Listening and Reading | Trial report | April 2016 15Linguaskill
Data analysis
We estimated the precision and reliability of Linguaskill test scores using measures derived from Classical Testing Theory and Item Response Theory.
We investigated the effect of prior computer-based test experience (on test performance), participants’ overall impression of the tests and views on the strengths and limitations of the tests, using a combined survey and the trial candidates’ test results.
The Linguaskill trial took place from late February to 31 March 2016. Test data received after this cut-off date was not analysed.
It is assumed that the participants in this trial are a representative sample of the future Linguaskill candidate population.
References
Council of Europe (2001) Common European Framework of Reference for Languages: Learning, teaching, assessment, Cambridge: Cambridge University Press.
Appendices

Copyright © UCLES 2017 | CER/6099/7Y12
Contact us
All details are correct at the time of going to print in April 2016.
Cambridge Assessment English 1 Hills Road Cambridge CB1 2EU United Kingdom
cambridgeenglish.org/helpdesk
cambridgeenglish.org/linguaskill
/CambridgeEnglish
/CambridgeEnglishTV
/CambridgeEng