linear regression. essentials: regression (predictions based upon the known.) understand what the...
TRANSCRIPT

Linear Regression

Essentials: Regression(Predictions based upon the known.)
Understand what the regression process does - prediction.
Be able to state the steps we use leading up to the decision to conduct regression.
Be able to calculate the slope of a line and the y-intercept.
Be able to calculate a regression equation and apply it to the prediction of other values. Know that these are estimates, not necessarily the actual values that might occur.
Know what the Least Squares Property and Line of Best Fit. Residual – what’s that?
1 2 3 4
5
4
3
2
1
-1
-2
-3
-4
-5
-4 -3 -2 -1 x
y

1 2 3 4
5
4
3
2
1
-1
-2
-3
-4
-5
-4 -3 -2 -1 x
y
..
(-2, 2)
(-1, 4)
-x
-y

A Linear Equation in One Independent Variable
y = mx + b
y is the dependentvariable (also called the response
variable). Its value depends on thevalue of x.
m is the slope of the line.The slope indicates how much the y-value
increases (or decreases if the slope is negative)when the x-value increases by 1 unit. When m is
positive, the line will have an upward slope. Whenm is negative, the line will have a downward slope.
b is they-intercept (the point at which theline intersects the y-axis). It is the
value of y when x = 0.
x is theindependent variable
(also known as the predictorvariable.)

1 2 3 4
5
4
3
2
1
-1
-2
-3
-4
-5
-4 -3 -2 -1 x
y
...
..
.
y=mx+by=2x+1

RegressionDefinitions
Regression EquationGiven a collection of paired data, the regression equation
Regression Line (line of best fit or least-squares line)
The regression line is the graph of the regression equation
y = b0 + b1x^
algebraically describes the relationship between the two variables

Always Look at a Scatterplot First
You should be able to “see” a straight line being passed through the data points.

Regression Line Plotted on Scatterplot

The Regression Line is calculated to minimize the distance of the line from the observed values.
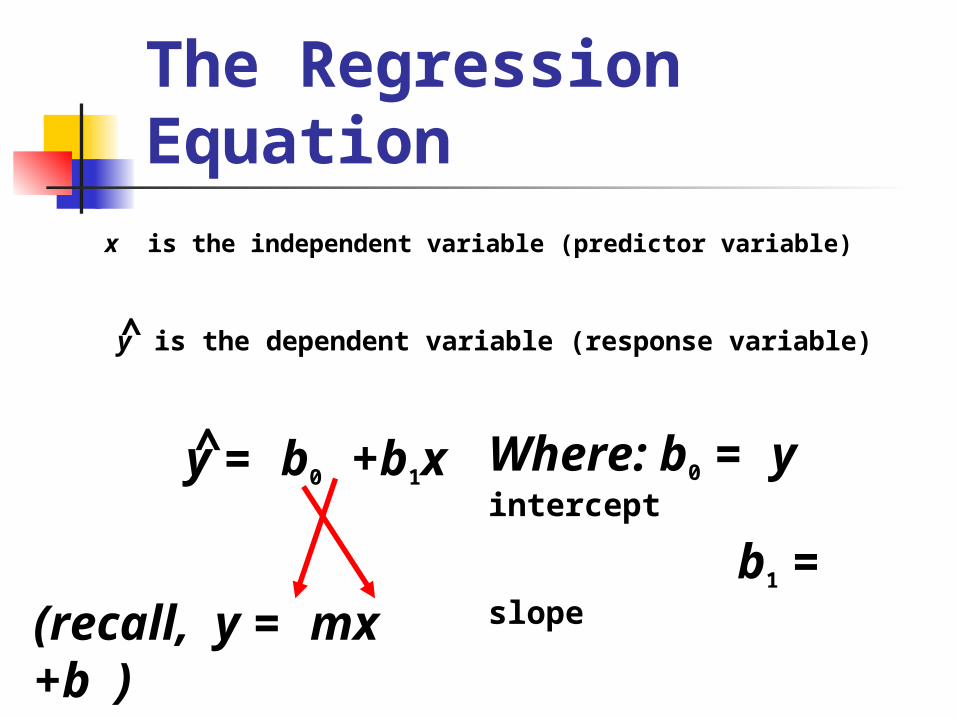
The Regression Equation
x is the independent variable (predictor variable)
y is the dependent variable (response variable)^
y = b0 +b1x ^
(recall, y = mx +b )
Where: b0 = y intercept
b1 = slope

Notation for Regression Equation
y-intercept of regression equation 0 b0
Slope of regression equation 1 b1
Equation of the regression line y = 0 + 1x y = b0 + b1x1
PopulationParameter
SampleStatistic
^
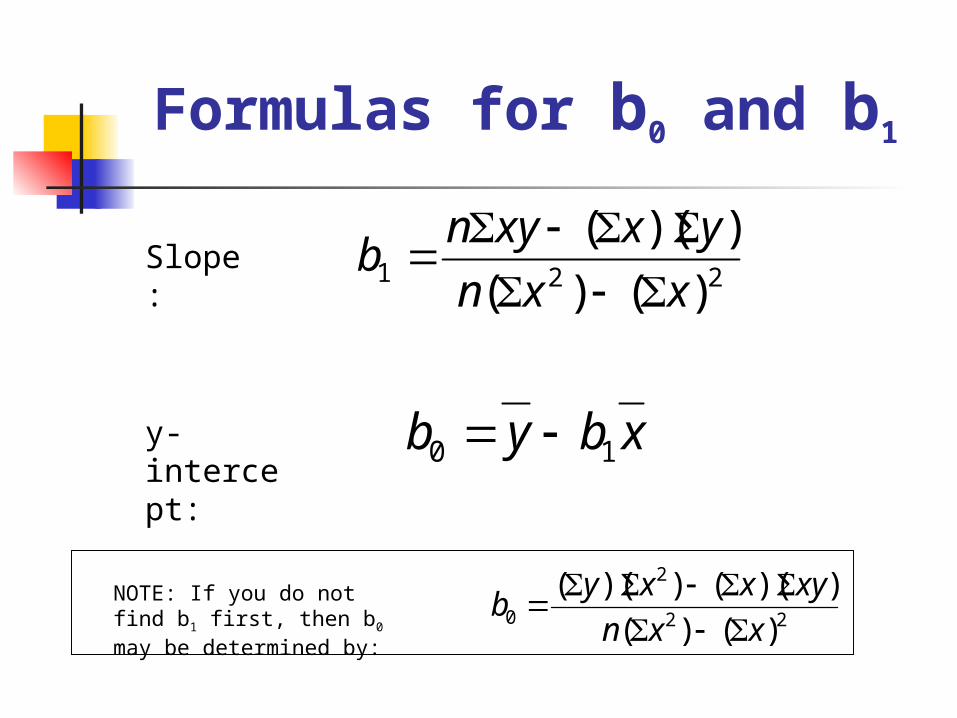
Formulas for b0 and b1
Slope:
y-intercept: xbyb 10
221 )()(
))((
xxn
yxxynb
22
2
0 )()(
))(())((
xxn
xyxxyb
NOTE: If you do not find b1 first, then b0 may be determined by:

The Regression Line
y = b0 +b1x
Fits the sample points best. Distances between this line and the sample
points are at a minimum.
^

When is it reasonable to do Regression
Start by asking the following: Does it make sense to look at the relationship between these two
variables? Does a scatter plot present a relationship (either positive or negative)? If yes to both, calculate r (the correlation).
Is the correlation statistically significant? Yes - go on to regression No – best estimate becomes the mean of the y variable
Conduct regression analysis (if yes above) Use the regression equation to calculate (estimate) a y-value given a
specific x-value.
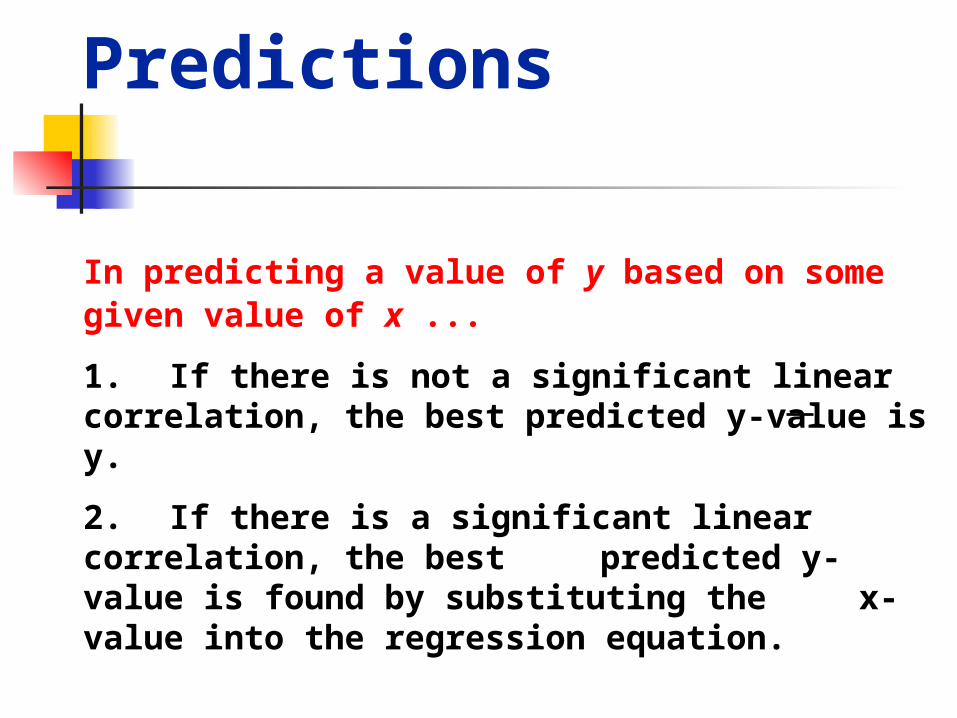
In predicting a value of y based on some given value of x ...
1. If there is not a significant linear correlation, the best predicted y-value is y.
2. If there is a significant linear correlation, the best predicted y-value is found by substituting the
x-value into the regression equation.
Predictions

Predicting the Value of a Variable
Use the regressionequation to makepredictions. Substitutethe given value in theregression equation.
Calculate the value of rand test the hypothesis
that = 0
Isthere a
significant linearcorrelation
?
Given any value of onevariable, the best predictedvalue of the other variableis its sample mean.
Yes
No
Start

If there is no significant linear correlation, don’t use the regression equation to make predictions.
When using the regression equation for predictions, stay within the scope of the available sample data.
A regression equation based on old data is not necessarily valid now.
Don’t make predictions about a population that is different from the population from which the sample data was drawn.
Guidelines for Using The Regression Equation

Definitions
Marginal Change the amount a variable changes when the other
variable changes by exactly one unit Outlier a point lying far away from the other data
points Influential Points points which strongly affect the graph of the
regression line

Definitions Residual
For a sample of paired (x,y) data, the difference (y - y) between an observed sample y-value and the value of y-hat, which is the value of y that is predicted by using the regression equation.
Least-Squares PropertyA straight line satisfies this property if the sum of the squares of the residuals is the smallest sum possible.
^
Residuals and the Least-Squares Property

Residuals and the Least-Squares Property
x 1 2 4 5y 4 24 8 32
y = 5 + 4x
02468
101214161820222426283032
1 2 3 4 5
•
•
•
x
yResidual = 7
Residual = -13Residual = -5
Residual = 11
^
•

Example : Orion Cars
Orion Cars: The age and price for a sample of 11 Orions are noted below. Calculate a correlation coefficient and , if appropriate, a regression equation for the relationship. Determine the value of cars that are 4.5 years and 10 years old.
Car Age (yrs.) Price ($100’s) 1 5 85 2 4 103 3 6 70 4 5 82 5 5 89 6 5 98 7 6 66 8 6 95 9 2 169 10 7 70 11 7 48

Example : Orion Cars

Example : Orion Cars

Example : Orion Cars
Statistics
11 11
12 12
5.27 88.64
5.00 85.00
1.421 31.159
2 48
7 169
Valid
Missing
N
Mean
Median
Std. Deviation
Minimum
Maximum
Orion Car AgeOrion Car
Price
Model Summary
.924a .853 .837 12.577
Model
1
R R SquareAdjustedR Square
Std. Error ofthe Estimate
Predictors: (Constant), Orion Car Agea.
Coefficientsa
195.468 15.240 12.826 .000
-20.261 2.800 -.924 -7.237 .000
(Constant)
Orion Car Age
Model
1
B Std. Error
UnstandardizedCoefficients
Beta
StandardizedCoefficients
t Sig.
Dependent Variable: Orion Car Pricea.
(Price in thousands)

Example : Orion Cars
(Price in thousands)

Example : Orion Cars
(Price in thousands)

(Price in thousands)
With influential point Without influential point