linear discriminant analysis based approach for automatic speech recognition …€¦ · ·...
TRANSCRIPT
Linear Discriminant Analysis Based Approachfor Automatic Speech Recognition of Urdu
Isolated Words
Hazrat Ali1, Nasir Ahmad2, Xianwei Zhou1, Muhammad Ali3, and Ali Asghar4
1 Department of Communication Engineering, School of Computer andCommunication Engineering, University of Science and Technology Beijing, 10083,
Beijing [email protected]
2 Department of Computer Systems Engineering, University of Engineering andTechnology Peshawar, 25120, Peshawar, Pakistan.
[email protected] Department of Electrical and Computer Engineering, North Dakota State
University, 58108-6050, North Dakota, [email protected]
4 Department of Computer Systems Engineering, Mehran University of Engineeringand Technology, Jamshoro, [email protected]
Abstract. Urdu is amongst the five largest languages of the world andenjoys extreme importance by sharing its vocabulary with several otherlanguages of the Indo-Pak. However, there has not been any significantresearch in the area of Automatic Speech Recognition of Urdu. Thispaper presents the statistical based classification technique to achievethe task of Automatic Speech Recognition of isolated words in Urdu.For each isolated word, 52 Mel Frequency Cepstral Coefficients havebeen extracted and based upon these coefficients; the classification hasbeen achieved using Linear Discriminant Analysis. As a prototype, thesystem has been trained with audio samples of seven speakers includingmale/female, native/non-native and speakers with different ages whilethe testing has been done using audio samples of three speakers. It wasdetermined that majority of words exhibit a percentage error of less than33 %. Words with 100 % error were declared to be bad words. The workreported in this paper may serve as a strong baseline for future researchwork on Urdu ASR, especially for continuous speech recognition of Urdu.
Keywords: Urdu Automatic Speech Recognition, Mel Frequency Cep-stral Coefficeints, Linear Discriminant Analysis, Isolated Words Recog-nition
1 Introduction
User friendly and natural interaction between man and machine has always beena complementary part of technological development. Speech is the most effec-tive medium of communication between human and same is envisaged to be

applicable for human-machine interaction. Therefore, Automatic Speech Recog-nition (ASR) has significantly grabbed the attention of researchers for the lastfive decades and has attained considerable success in noise-free environments.Successful ASR enables the computers to exhibit human-like behavior by under-standing the voice input to them. Such hearing systems having been developedin various languages such as English, French, Japanese, Chinese and Arabic [1–5], and have wide-spread application ranging from data entry to security andsurveillance. The research on ASR has enabled the communities with lower levelof literacy to interact with machines, and similarly facilitated the interaction ofblind and disabled people with the computers [6]. Despite the development ofASR systems in these languages, there has been no significant contribution toASR of Urdu language, which is one of the largest languages of the world. Wiqas[7] has summarized the research work conducted on the ASR of the languages ofthe Indo-Pak, including the research work on Urdu ASR. A continuous speechASR system for Urdu language has been presented in [8], however, no informa-tion on the use of a standard corpus of Urdu has been provided. The recognitionrate is limited to 55 % accuracy for continuous speech. Furthermore, it lacks theinformation about the use of number of words/sentences and the training/testdata. Azam [9] has proposed an Artificial Neural Networks (ANN) based Urduspeech recognition system however; this work is limited to digits recognition only.Moreover, the application of the system is limited to single speaker only. Ahadet al [10] has used a different class of ANN called multilayer perceptrons (MLP)however; they have achieved recognition of Urdu digits from 0 to 9 for mono-speaker database only. Hasnain et al [11] has made yet another effort to achievethe task of digits recognition for 0 to 9, based on the use of feed-forward neuralnetwork models developed in Matlab. A more recent contribution to isolatedwords recognition has been made by [12], developing a Hidden Markov Model(HMM) [13] based speaker-independent speech recognition system for Urdu. Inthis work the open source framework Sphinx-4 has been used for the classifi-cation. A wordlist grammar language model was adopted where each word wasrepresented as a single phoneme instead of dividing into sub-units. An appar-ent limitation of this approach is that this may be applicable to shorter wordsbut for longer words, the performance may degrade drastically. Huda [14] hasused a relatively larger data set for the training purpose, however, the systemdeveloped is for continuous speech recognition task and the recognition resultsare yet modest. Research on ASR can be targeted at small, medium or largevocabulary applications; it may be for digits only, isolated words only or contin-uous speech applications. The applications of isolated words recognition are wellknown including the automated banking applications, automatic data and PINcodes entry applications, e-health monitoring and voice dialing phone applica-tions etc. In this paper the ASR task for medium vocabulary isolated words hasbeen undertaken containing 100 isolated words of Urdu. The three importantcomponents of an ASR system are the corpus i.e. the database of speech data,the features extraction and the classification. In Section II of this paper, thecorpus used for this work has been discussed briefly. The features extraction ap-

proach and the major steps involved in the extraction of these features have beenpresented in Section III. The classification of the different words based upon thefeatures obtained for each word, has been discussed in Section IV. Finally, theresults have been summarized in Section V.
2 Corpus Selection
One of the most important components of an ASR system is the use of a standardcorpus covering a range of acoustic variations and different aspects of a language.In this work, the corpus developed in [15], has been used. The corpus contains 250isolated words selected from the list of most frequently used words, developed bythe Center for Language Engineering [16]. Audio files for one hundred isolatedwords have been selected from the corpus and used in the training and testing ofthe system. The one hundred words used contain the digits from 0 to 9, namesof seasons, days of the week and the names of months. Besides this, for fewof the words, their antonyms have also been included. The words are availablein separate audio files with an average length of 500 milliseconds and storedin mono format with .wav extension. Based upon the attributes such as age,gender and origin, this corpus provides a balanced distribution. The files includethe words uttered by both male and female speakers of different ages. Similarly,a variety of accents has been covered by including the audio recordings by bothnative and non-native speakers originating from different areas. For example,Pashto speakers from different regions of Pakistan differ in the pronunciationof Urdu words, thus, data from these speakers provide a variety of samples fortraining and testing purpose. A sample representation of the attributes of thespeakers has been shown in Table 1.
Table 1. Sample of Representation of the Speech Data (as in [15])
S. No Speaker Name Age Group Gender Native Non-Native
1 AAMNG1 G1 Male Non-Native2 ABMNG1 G1 Male Non-Native3 ACMNG2 G2 Male Non-Native4 AEFYG1 G1 Female Native5 AFFYG1 G1 Female Native6 AGMNG1 G1 Male Non-Native7 AHMNG1 G1 Male Non-Native
3 Feature Selection
Feature Extraction is one of the most important modules of an Automatic SpeechRecognition System. For continuous speech recognition, the feature extraction is

typically aimed to capture the distinguishing characteristics of the phonemes i.e.the smallest unit of sound. However, for isolated words recognition, each wordis usually split into equal number of segments and features are extracted fromeach of the segments. In this work, each word is split into four segments and theMel Frequency Cepstral Coefficients (MFCC) based features have been obtainedfor each segment.
3.1 Mel Frequency Cepstral Coefficients
The MFCC features are the most commonly used features for Automatic SpeechRecognition as MFCCs most closely resembles the human hearing mechanism.The Mel scale is based on the fact that the frequency response of the humansear to the audio signal is not a linear function of frequency. This response canbe best modeled on a Mel scale where the spacing between frequencies above1000 Hz is logarithmic [17]. The relation between the Mel scale frequencies andthe Hertz frequencies can be represented by equation 1;
fmel = 2595× log (1 +f
700Hz) (1)
The Mel Frequency Cepstrum is the power spectrum of a speech signal for shortterm and is based upon a linear cosine transform of a log power spectrum onthe Mel scale. The Mel Frequency Cepstrum comprises of the MFC coefficients.Several methods for MFCC extraction have been proposed by [17–19]. The majorsteps in the extraction of MFCC are shown in Algorithm 1.
In the pre-processing step, the segmentation of the words and noise removalhave been achieved by using Adobe Audition Software. The sampling rate wasset to 16000 Hz and the audio samples were saved as .wav files in mono formatbefore being input to the algorithm. The Adobe Audition software has alsobeen utilized for amplification or attenuation of the audio signal, as necessary,to obtain a uniform db level for all the samples. Besides, as the recording wasperformed in a controlled environment, this helps out in assuring minimum effectof noise. A snapshot of the Adobe Audition environment has been shown in Fig.1.
The pre-processing stage also includes the Pre-emphasis of the signal to in-crease the energy of the higher frequency contents. The pre-emphasis is achievedusing filter of the form, as in Equation 2.
H(z) = 1− 0.97z−1 (2)
The pre-processing is followed by the windowing of the speech signal. A rect-angular window as defined by equation for w(n) in equation 3 has been used.For speech processing applications, hamming window is more commonly usedto avoid information loss, however for isolated words processing, rectangularwindow is equally beneficial.
w(n) =
{1 0 ≤ x ≤M − 10 otherwise
(3)
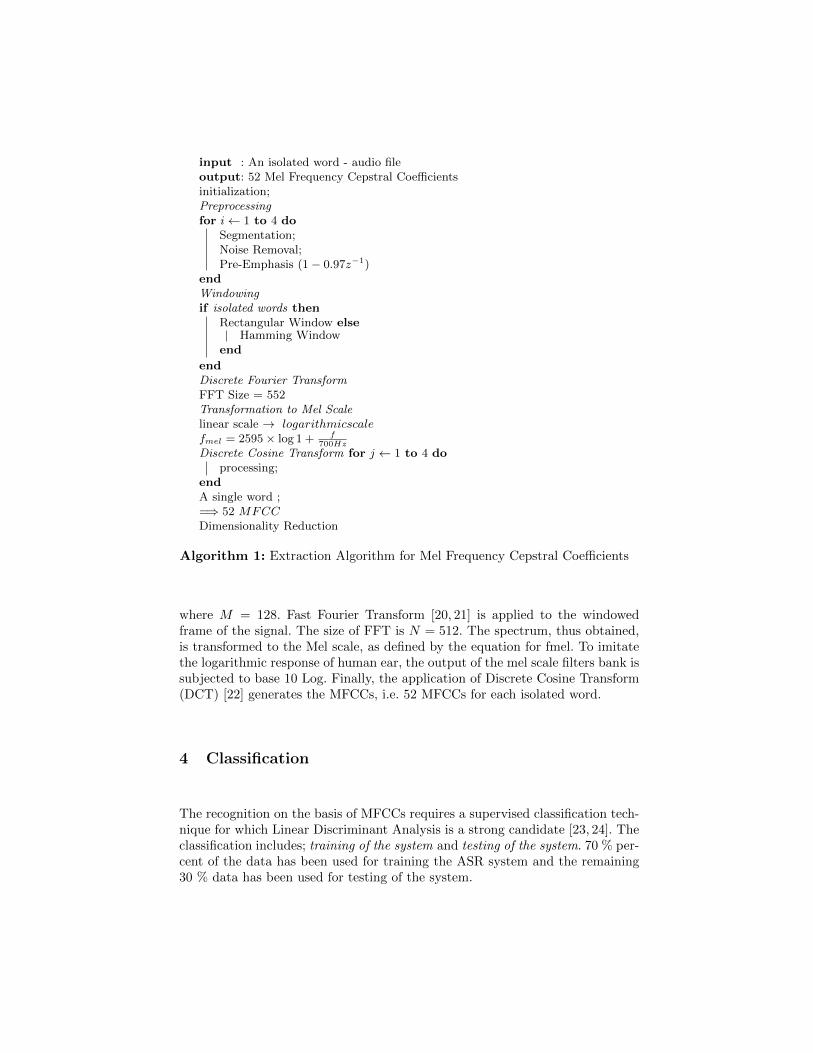
input : An isolated word - audio fileoutput: 52 Mel Frequency Cepstral Coefficientsinitialization;Preprocessingfor i← 1 to 4 do
Segmentation;Noise Removal;Pre-Emphasis (1− 0.97z−1)
endWindowingif isolated words then
Rectangular Window elseHamming Window
end
endDiscrete Fourier TransformFFT Size = 552Transformation to Mel Scalelinear scale → logarithmicscalefmel = 2595× log 1 + f
700Hz
Discrete Cosine Transform for j ← 1 to 4 doprocessing;
endA single word ;=⇒ 52 MFCCDimensionality Reduction
Algorithm 1: Extraction Algorithm for Mel Frequency Cepstral Coefficients
where M = 128. Fast Fourier Transform [20, 21] is applied to the windowedframe of the signal. The size of FFT is N = 512. The spectrum, thus obtained,is transformed to the Mel scale, as defined by the equation for fmel. To imitatethe logarithmic response of human ear, the output of the mel scale filters bank issubjected to base 10 Log. Finally, the application of Discrete Cosine Transform(DCT) [22] generates the MFCCs, i.e. 52 MFCCs for each isolated word.
4 Classification
The recognition on the basis of MFCCs requires a supervised classification tech-nique for which Linear Discriminant Analysis is a strong candidate [23, 24]. Theclassification includes; training of the system and testing of the system. 70 % per-cent of the data has been used for training the ASR system and the remaining30 % data has been used for testing of the system.
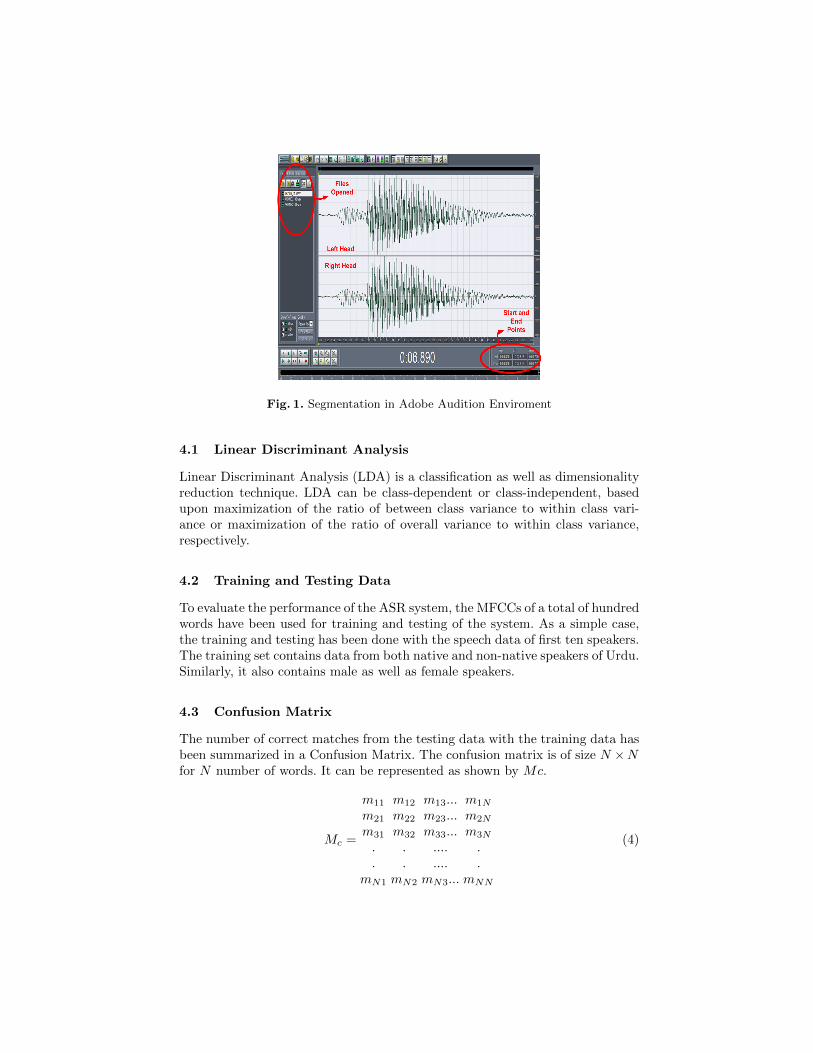
Fig. 1. Segmentation in Adobe Audition Enviroment
4.1 Linear Discriminant Analysis
Linear Discriminant Analysis (LDA) is a classification as well as dimensionalityreduction technique. LDA can be class-dependent or class-independent, basedupon maximization of the ratio of between class variance to within class vari-ance or maximization of the ratio of overall variance to within class variance,respectively.
4.2 Training and Testing Data
To evaluate the performance of the ASR system, the MFCCs of a total of hundredwords have been used for training and testing of the system. As a simple case,the training and testing has been done with the speech data of first ten speakers.The training set contains data from both native and non-native speakers of Urdu.Similarly, it also contains male as well as female speakers.
4.3 Confusion Matrix
The number of correct matches from the testing data with the training data hasbeen summarized in a Confusion Matrix. The confusion matrix is of size N ×Nfor N number of words. It can be represented as shown by Mc.
Mc =
m11 m12 m13... m1N
m21 m22 m23... m2N
m31 m32 m33... m3N
. . .... .
. . .... .mN1 mN2 mN3... mNN
(4)
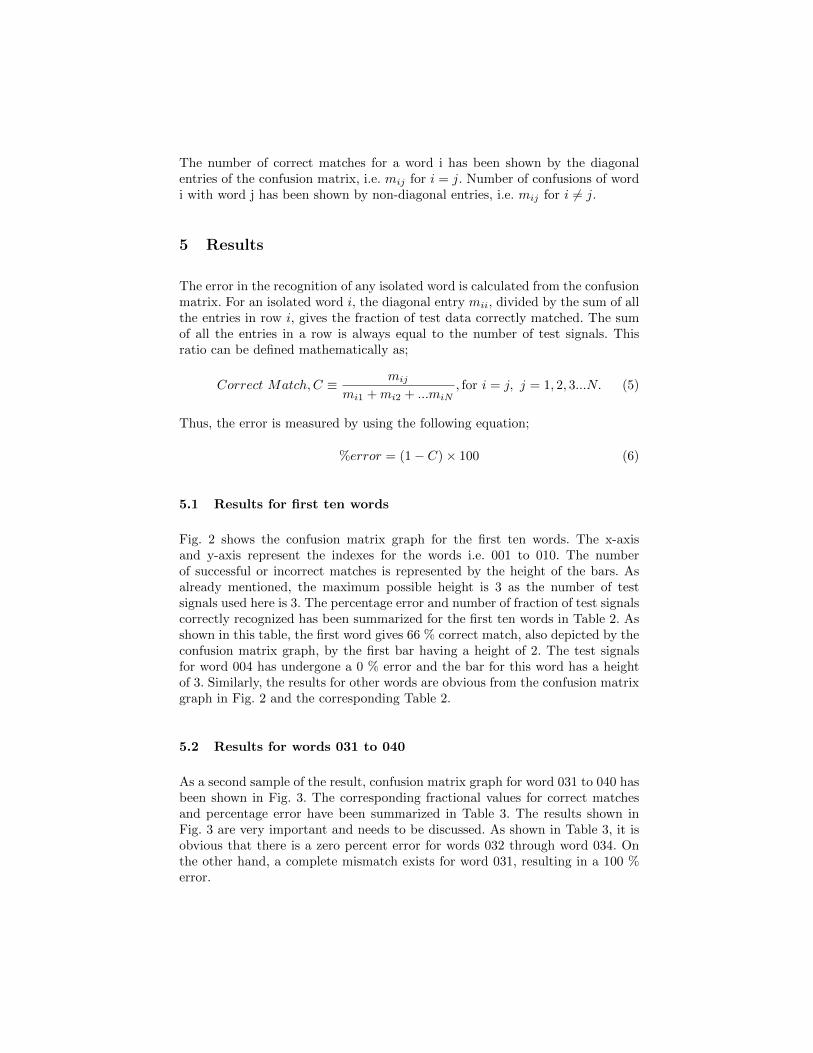
The number of correct matches for a word i has been shown by the diagonalentries of the confusion matrix, i.e. mij for i = j. Number of confusions of wordi with word j has been shown by non-diagonal entries, i.e. mij for i 6= j.
5 Results
The error in the recognition of any isolated word is calculated from the confusionmatrix. For an isolated word i, the diagonal entry mii, divided by the sum of allthe entries in row i, gives the fraction of test data correctly matched. The sumof all the entries in a row is always equal to the number of test signals. Thisratio can be defined mathematically as;
Correct Match, C ≡ mij
mi1 + mi2 + ...miN, for i = j, j = 1, 2, 3...N. (5)
Thus, the error is measured by using the following equation;
%error = (1− C)× 100 (6)
5.1 Results for first ten words
Fig. 2 shows the confusion matrix graph for the first ten words. The x-axisand y-axis represent the indexes for the words i.e. 001 to 010. The numberof successful or incorrect matches is represented by the height of the bars. Asalready mentioned, the maximum possible height is 3 as the number of testsignals used here is 3. The percentage error and number of fraction of test signalscorrectly recognized has been summarized for the first ten words in Table 2. Asshown in this table, the first word gives 66 % correct match, also depicted by theconfusion matrix graph, by the first bar having a height of 2. The test signalsfor word 004 has undergone a 0 % error and the bar for this word has a heightof 3. Similarly, the results for other words are obvious from the confusion matrixgraph in Fig. 2 and the corresponding Table 2.
5.2 Results for words 031 to 040
As a second sample of the result, confusion matrix graph for word 031 to 040 hasbeen shown in Fig. 3. The corresponding fractional values for correct matchesand percentage error have been summarized in Table 3. The results shown inFig. 3 are very important and needs to be discussed. As shown in Table 3, it isobvious that there is a zero percent error for words 032 through word 034. Onthe other hand, a complete mismatch exists for word 031, resulting in a 100 %error.

Fig. 2. Confusion Matrix Graph for First Ten Words
Table 2. Percentage Error for Words 001 to 010
S. No Word Number Value of C % error
1 001 0.667 33.33%2 002 0.333 66.67%3 003 0.333 66.67%4 004 1 0%5 005 0.667 33.33%6 006 0.667 33.33%7 007 0.333 66.67%8 008 0.667 33.33%9 009 0.667 33.33%10 010 0.667 33.33%
Table 3. Percentage Error for Words 031 to 040
S. No Word Number Value of C % error
1 031 0 100%2 032 1 0%3 033 1 0%4 034 1 0%5 035 0.667 33.33%6 036 0.333 66.67%7 037 0.667 33.33%8 038 0.667 33.33%9 039 0.667 33.33%10 040 1 0%
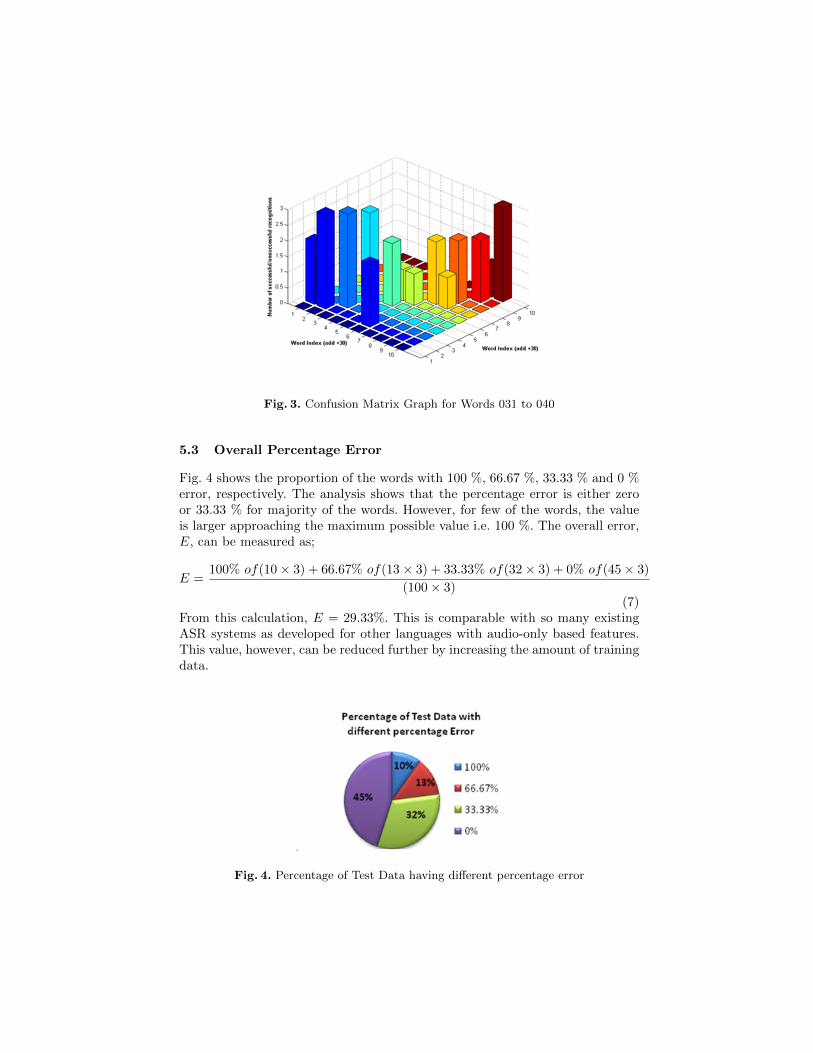
Fig. 3. Confusion Matrix Graph for Words 031 to 040
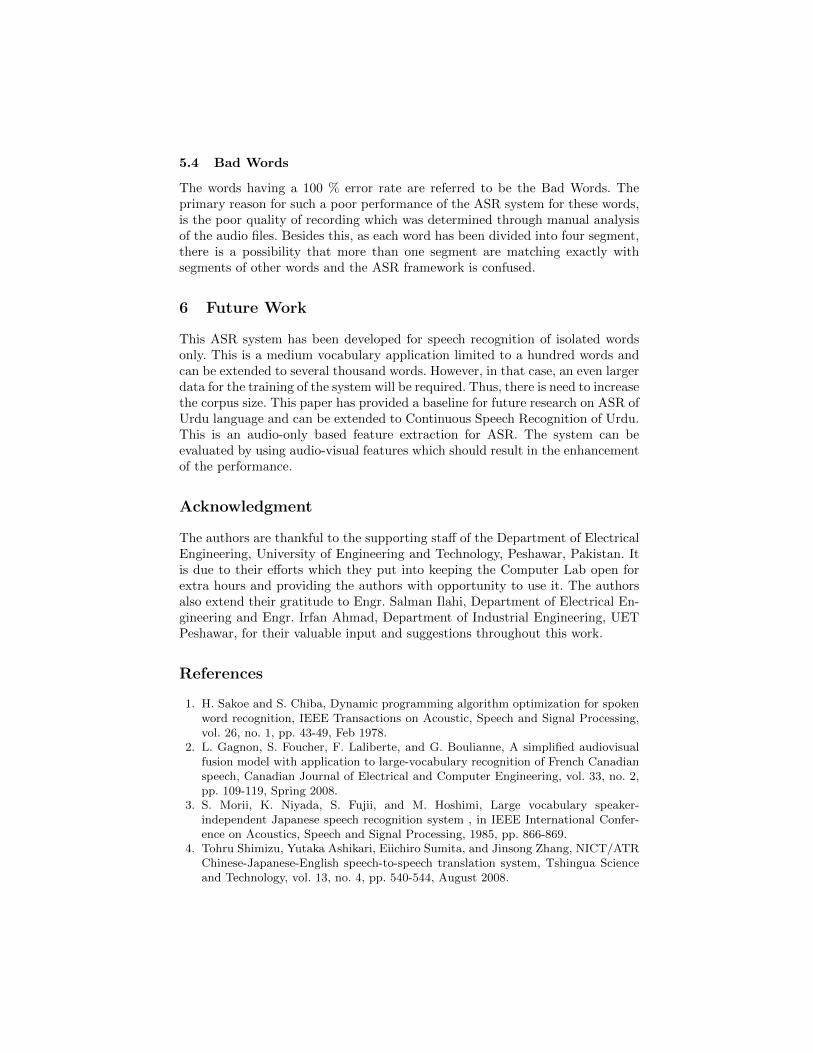
5.3 Overall Percentage Error
Fig. 4 shows the proportion of the words with 100 %, 66.67 %, 33.33 % and 0 %error, respectively. The analysis shows that the percentage error is either zeroor 33.33 % for majority of the words. However, for few of the words, the valueis larger approaching the maximum possible value i.e. 100 %. The overall error,E, can be measured as;
E =100% of(10× 3) + 66.67% of(13× 3) + 33.33% of(32× 3) + 0% of(45× 3)
(100× 3)(7)
From this calculation, E = 29.33%. This is comparable with so many existingASR systems as developed for other languages with audio-only based features.This value, however, can be reduced further by increasing the amount of trainingdata.
Fig. 4. Percentage of Test Data having different percentage error
5.4 Bad Words
The words having a 100 % error rate are referred to be the Bad Words. Theprimary reason for such a poor performance of the ASR system for these words,is the poor quality of recording which was determined through manual analysisof the audio files. Besides this, as each word has been divided into four segment,there is a possibility that more than one segment are matching exactly withsegments of other words and the ASR framework is confused.
6 Future Work
This ASR system has been developed for speech recognition of isolated wordsonly. This is a medium vocabulary application limited to a hundred words andcan be extended to several thousand words. However, in that case, an even largerdata for the training of the system will be required. Thus, there is need to increasethe corpus size. This paper has provided a baseline for future research on ASR ofUrdu language and can be extended to Continuous Speech Recognition of Urdu.This is an audio-only based feature extraction for ASR. The system can beevaluated by using audio-visual features which should result in the enhancementof the performance.
Acknowledgment
The authors are thankful to the supporting staff of the Department of ElectricalEngineering, University of Engineering and Technology, Peshawar, Pakistan. Itis due to their efforts which they put into keeping the Computer Lab open forextra hours and providing the authors with opportunity to use it. The authorsalso extend their gratitude to Engr. Salman Ilahi, Department of Electrical En-gineering and Engr. Irfan Ahmad, Department of Industrial Engineering, UETPeshawar, for their valuable input and suggestions throughout this work.
References
1. H. Sakoe and S. Chiba, Dynamic programming algorithm optimization for spokenword recognition, IEEE Transactions on Acoustic, Speech and Signal Processing,vol. 26, no. 1, pp. 43-49, Feb 1978.
2. L. Gagnon, S. Foucher, F. Laliberte, and G. Boulianne, A simplified audiovisualfusion model with application to large-vocabulary recognition of French Canadianspeech, Canadian Journal of Electrical and Computer Engineering, vol. 33, no. 2,pp. 109-119, Spring 2008.
3. S. Morii, K. Niyada, S. Fujii, and M. Hoshimi, Large vocabulary speaker-independent Japanese speech recognition system , in IEEE International Confer-ence on Acoustics, Speech and Signal Processing, 1985, pp. 866-869.
4. Tohru Shimizu, Yutaka Ashikari, Eiichiro Sumita, and Jinsong Zhang, NICT/ATRChinese-Japanese-English speech-to-speech translation system, Tshingua Scienceand Technology, vol. 13, no. 4, pp. 540-544, August 2008.

5. Mao Jiaju, Chen Qiulin, Gao Feng, Guo Rong, and Lu Ruzhan, SHTQS: Atelephone-based Chinese spoken dialogue system, Journal of Systems Engineeringand Electronics, vol. 16, no. 4, pp. 881-885, December 2005.
6. S. Khadivi and S. Ney, Integration of Speech Recognition and Machine Transla-tion in Computer-Assisted Translation, IEEE Transactions on Audio, Speech andLanguage Processing, vol. 16, no. 8, pp. 1551-1564, November 2008.
7. Wiqas Ghai and Navdeep Singh, Analysis of Automatic Speech Recognition Sys-tems for Indo-Aryan Languages: Punjabi A Case Study, International Journal ofSoft Computing and Engineering (IJSCE), vol. 2, no. 1, pp. 379-385, March 2012.
8. M. U. Akram and M. Arif, Design of an Urdu Speech Recognizer based uponacoustic phonetic modeling, in 8th International Multitopic Conference, 2004, pp.91-96.
9. S. M. Azam, Z. A. Mansoor, M. Shahzad Mughal, and S. Mohsin, Urdu SpokenDigits Recognition Using Classified MFCC and Backpropgation Neural Network,in Computer Graphics, Imaging and Visualization, CGIV’07, 2007, pp. 414-418.
10. Abdul Ahad, Ahsan Fayyaz, and Tariq Mehmood, Speech recognition using mul-tilayer perceptron, in Proceedings of IEEE Students Conference, ISCON’02, 2002,pp. 103-109.
11. S. K. Hasnain and M. S. Awan, Recognizing spoken Urdu numbers using fourierdescriptor and neural networks with Matlab, in Second International Conferenceon Electrical Engineering, (ICEE 2008), 2008, pp. 1-6.
12. Javed Ashraf, Naveed Iqbal, Naveed Sarfraz Khattak, and Ather Mohsin Zaidi,Speaker Independent Urdu speech recognition using HMM, in The 7th Interna-tional Conference on Informatics and Systems (INFOS 2010), March 2010, pp.1-5.
13. Lawrence R. Rabiner, A tutorial on hidden markov models and selected applica-tions in speech recognition, Proceedings of the IEEE, vol. 77, no. 2, pp. 257-286,Feburary 1989.
14. Huda Sarfraz et al., Large Vocabulary Continuous Speech Recognition for Urdu,in 8th International Conference on Frontiers of Information Technology, (FIT’10),2010.
15. Hazrat Ali, Nasir Ahmad, Khawaja M. Yahya, and Omar Farooq, A Medium Vo-cabulary Urdu Isolated Words Balanced Corpus for Automatic Speech Recognition,in 2012 International Conference on Electronics Computer Technology (ICECT2012), 2012, pp. 473-476.
16. Center for Language Engineering. (2012, May) [Online]. http://www.cle.org.pk/17. Sirko Molau, Michael Ptiz, Ralf Schluter, and Herman Ney, Computing Mel-
frequency cepstral coefficients on the power spectrum, in IEEE International Con-ference on Acoustics, Speech, and Signal Processing, ((ICASSP ’01), 2001, pp.73-76.
18. Wei Han, Cheong-Fat Chan, Chiu-Sing Choy, and Kong-Pang Pun, An efficientMFCC extraction method in speech recognition, in IEEE International Symposiumon Circuits and Systems, (ISCAS 2006), 2006.
19. Bojan Kotnik, Damjan Vlaj, and Bogomir Horvat, Efficient Noise Robust Fea-ture Extraction Algorithms for Distributed Speech Recognition (DSR) Systems,International Journal of Speech Technology, vol. 6, no. 3, pp. 205-219, 2003.
20. John G. Proakis, and Dimitris G. Manolakis, Digital Signal Processing; Principles,Algorithms & Applications, 4th ed. Pearson Education, Inc, 2007.
21. Vinay K. Ingle and John G. Proakis, Digital Signal Processing Using Matlab, 3rded. Standford, USA: Cengage Learning, 2010.
22. David Salomon, Data Compression; The Complete Reference, 4th ed. London,United Kingdom: Springer, 2007.
23. S. Balakrishnama, A. Ganapathiraju, and J. Picone, Linear discriminant analysisfor signal processing problems, in Proceedings of the IEEE Southeastcon, March1999, pp. 36-39.
24. S. Balakrishnama and A. Ganapathiraju. (Accessed: 2012, March) Linear Discrim-inant Analysis; A Brief Tutorial. [Online]. http://www.music.mcgill.ca/ ich