lineament study of the semanggol formation and adjacent ... · lineament study of the semanggol...
TRANSCRIPT

Lineament study of the Semanggol Formation and adjacent areas from Landsat 8 Image
Ali Imran Azman*, Jasmi Ab Talib & Mohamad Shaufi Sokiman
Department of Geosciences, Faculty of Science and Information Technology,Universiti Teknologi PETRONAS, 32610 Seri Iskandar, Perak Darul Ridzuan
*Corresponding author email address: [email protected]
Abstract: This study utilises the image of Landsat 8 for lineament mapping, covering the whole Semanggol Formation and its adjacent areas. Since Landsat 8 satellite launched on 11th February 2013, there is no detailed lineament study in the study area produced using Landsat 8 image. The objective of this study is to produce a lineament map for the Semanggol Formation and adjacent areas based on comparison of several spectral band and band combination. Landsat 8 image was digitally processed which involved atmospheric correction, geometric correction, histogram equalization and pan-sharpening to enhance the quality of the image up to 15 m resolution. Spectral band 5 and 7 and band combination of RGB 5, 4, 3, RGB 7, 5, 2 and RGB 7, 6, 4 were used to trace and map lineaments. From the lineament maps produced, band 5 image showed the best lineament traced with a total of 186 lineaments and total length of 449.0 km were mapped. Based on rose diagram analysis, N-S lineaments, NNE-SSW lineaments, and ENE-WSW lineaments are dominance for north Kedah, central Kedah, and north Perak parts respectively, and the orientation of the lineaments for both adjacent areas of the Semanggol Formation are trending to NE-SW and NW-SE directions. Fieldwork was conducted to compare orientation between fieldwork data with lineaments traced using rose diagram analysis, and the analysis showed similarities in terms of orientation direction. In conclusion, spectral band 5 of Landsat 8 image could clearly identify lineaments to produce lineament map and could be related with orientations collected from fieldwork.
Keywords: band combination, Landsat 8 image, lineament map, rose diagram, Semanggol Formation, spectral band
Abstrak: Kajian ini menggunakan imej Landsat 8 untuk pemetaan lineamen, meliputi seluruh kawasan Formasi Semanggol dan sekitarannya. Sejak satelit Landsat 8 dilancarkan pada 11 Februari 2013, tiada kajian lineamen terperinci di kawasan kajian dihasilkan menggunakan imej Landsat 8. Objektif kajian ini adalah untuk menghasilkan peta lineamen Formasi Semanggol dan sekitarannya berdasarkan perbandingan antara beberapa jalur spektrum dan gabungan jalur. Imej Landsat 8 telah diproses secara digital yang melibatkan pembetulan atmosfera, pembetulan geometrik, penyamaan histogram dan penajaman lapisan untuk meningkatkan kualiti imej sehingga resolusi 15 m. Jalur spektrum 5 dan 7 dan gabungan jalur RGB 5, 4, 3, RGB 7, 5, 2 dan RGB 7, 6, 4 telah digunakan untuk menyurih dah memetakan lineamen. Dari peta lineamen terhasil, imej jalur 5 telah menunjukkan penyurihan lineamen terbaik dengan jumlah 186 lineamen dan jumlah panjang 449.0 km telah dipetakan. Berdasarkan analisa gambarajah mawar, lineamen N-S, lineamen NNE-SSW dan lineamen ENE-WSW mendominasi untuk bahagian Kedah utara, Kedah tengah dan Perak utara, dan orientasi lineamen untuk kedua-dua kawasan sekitaran Formasi Semanggol berarah pada NE-SW dan NW-SE. Kerja lapangan telah dijalankan untuk membandingkan orientasi antara data kerja lapangan dengan lineamen tersurih menggunakan analisa gambarajah mawar, dan analisa tersebut menunjukkan persamaan dari segi arah orientasi. Sebagai kesimpulan, jalur spektrum 5 dalam imej Landsat 8 dapat mengenal pasti lineamen untuk menghasilkan peta lineamen dan boleh dikaitkan dengan orientasi terkumpul dari kerja lapangan.
Kata kunci: Formasi Semanggol, gabungan jalur, gambarajah mawar, imej Landsat 8, jalur spektrum, peta lineamen
INTRODUCTIONLineament is a straight-line feature, large scale and
clearly shown on the Earth’s surface (Ibrahim Abdullah & Juhari Mat Akhir, 1990). Lineament can be divided into two types (Ibrahim Komoo et al., 1989) which are positive lineament and negative lineament. Positive lineaments represent bedding which can be identified from ridges or ranges while negative lineaments represent fault or fracture which can be identified from valleys or rivers.
Landsat 8 is an American Earth observation satellite launched on 11th February 2013. It is the eighth satellite in the Landsat program; the seventh to reach orbit successfully. Providing moderate-resolution imagery ranging from 15 meters to 100 meters, Landsat 8 operates in the visible, near-infrared, short wave infrared, and thermal infrared
spectrums with total of 11 bands. In Malaysia, satellite images were more frequently used for lineament mapping. However, the previous Landsat images used in lineament interpretation are produced from non-digitally enhanced data (Foo, 1976; Raj, 1982; Tjia & Zaiton Harun, 1985; Syed Sheikh Almashoor & Tjia, 1987; Tjia, 1989). The benefits of using digitally processed satellite data in Malaysia were then known and shown by several workers (Juhari Mat Akhir, 1996; Mohamad Firuz Ramli et al., 2009; Simon et al., 2016). Until recent, there is no detailed study of lineament from the Landsat 8 image for the whole Semanggol Formation and its adjacent areas.
The purpose of this study is to produce a lineament map for the whole Semanggol Formation and its adjacent areas from the best spectral band or band combination of Landsat
0126-6187 / © 2018 Geological Society of Malaysia. All rights reserved.
Bulletin of the Geological Society of Malaysia, Volume 65, June 2018, pp. 119 – 124
Ali Imran Azman, Jasmi Ab Talib & Mohamad Shaufi Sokiman
Bulletin of the Geological Society of Malaysia, Volume 65, June 2018120
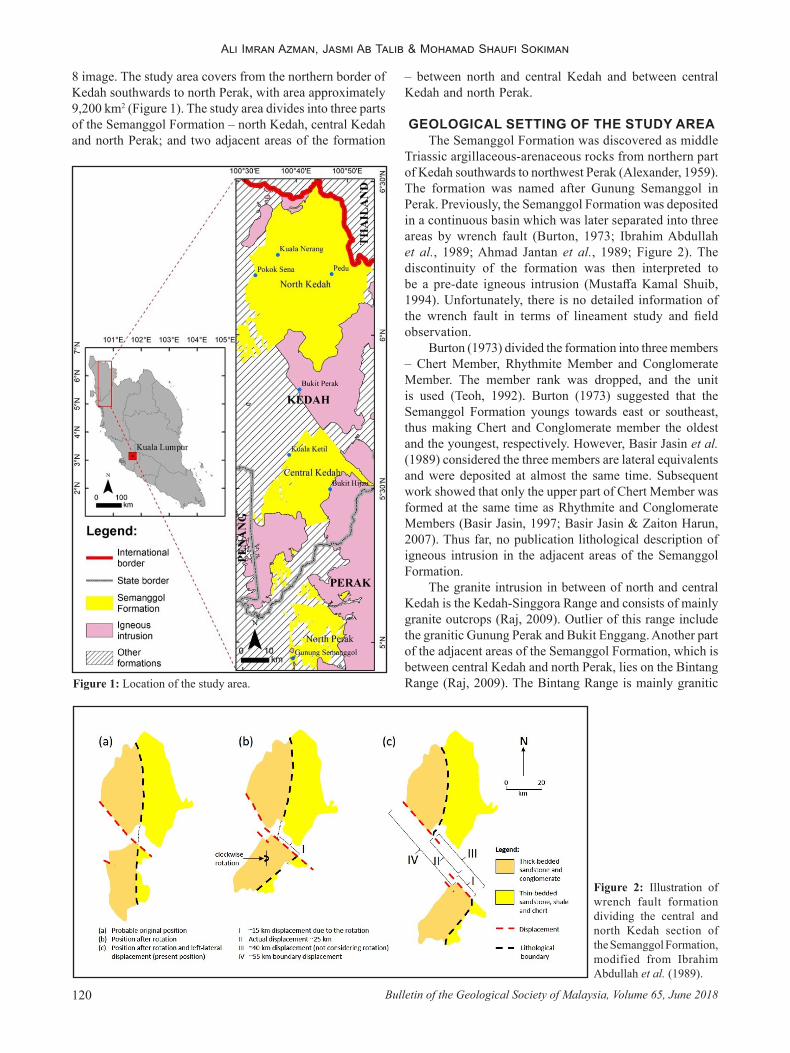
8 image. The study area covers from the northern border of Kedah southwards to north Perak, with area approximately 9,200 km2 (Figure 1). The study area divides into three parts of the Semanggol Formation – north Kedah, central Kedah and north Perak; and two adjacent areas of the formation
– between north and central Kedah and between central Kedah and north Perak.
GEOLOGICAL SETTING OF THE STUDY AREAThe Semanggol Formation was discovered as middle
Triassic argillaceous-arenaceous rocks from northern part of Kedah southwards to northwest Perak (Alexander, 1959). The formation was named after Gunung Semanggol in Perak. Previously, the Semanggol Formation was deposited in a continuous basin which was later separated into three areas by wrench fault (Burton, 1973; Ibrahim Abdullah et al., 1989; Ahmad Jantan et al., 1989; Figure 2). The discontinuity of the formation was then interpreted to be a pre-date igneous intrusion (Mustaffa Kamal Shuib, 1994). Unfortunately, there is no detailed information of the wrench fault in terms of lineament study and field observation.
Burton (1973) divided the formation into three members – Chert Member, Rhythmite Member and Conglomerate Member. The member rank was dropped, and the unit is used (Teoh, 1992). Burton (1973) suggested that the Semanggol Formation youngs towards east or southeast, thus making Chert and Conglomerate member the oldest and the youngest, respectively. However, Basir Jasin et al. (1989) considered the three members are lateral equivalents and were deposited at almost the same time. Subsequent work showed that only the upper part of Chert Member was formed at the same time as Rhythmite and Conglomerate Members (Basir Jasin, 1997; Basir Jasin & Zaiton Harun, 2007). Thus far, no publication lithological description of igneous intrusion in the adjacent areas of the Semanggol Formation.
The granite intrusion in between of north and central Kedah is the Kedah-Singgora Range and consists of mainly granite outcrops (Raj, 2009). Outlier of this range include the granitic Gunung Perak and Bukit Enggang. Another part of the adjacent areas of the Semanggol Formation, which is between central Kedah and north Perak, lies on the Bintang Range (Raj, 2009). The Bintang Range is mainly granitic Figure 1: Location of the study area.
Figure 2: Illustration of wrench fault formation dividing the central and north Kedah section of the Semanggol Formation, modified from Ibrahim Abdullah et al. (1989).

Lineament study of the Semanggol Formation and adjacent areas from Landsat 8 Image
121Bulletin of the Geological Society of Malaysia, Volume 65, June 2018
Table 1: Landsat 8 band specifications, after Barsi et al., 2014.
Band Description Wavelength (µm) Resolution (m)
1 Coastal/Aerosol 0.435-0.451
30
2 Blue 0.452-0.5123 Green 0.533-0.5904 Red 0.636-0.6735 Near Infrared (NIR) 0.851-0.8796 Short Wavelength Infrared 1 (SWIR-1) 1.566-1.6517 Short Wavelength Infrared 1 (SWIR-2) 2.017-2.2948 Panchromatic 0.503-0.676 159 Cirrus 1.363-1.384 3010 Thermal Infrared 1 (TIR-1) 10.60-11.19
10011 Thermal Infrared 2 (TIR-2) 11.50-12.51
Table 2: Spectral bands and band combinations from the literature applied to the Landsat 8 image.
Researcher(s)Spectral Band Band Combination
Older Landsat Landsat 8 Older
Landsat Landsat 8
Juhari Mat Akhir (1996) 7 7
Ali & Pirasteh (2004)4, 3, 2 5, 4, 37, 4, 1 7, 5, 2
GahGah et al. (2007) 4 5Mohamad Firuz Ramli et al. (2009) 7, 5, 3 7, 6, 4
Table 3: Comparison of spectral bands between older version of Landsat images and Landsat 8 image, after Roy et al., 2014.
Older Landsat Landsat 8Band Description Description Band
Coastal/Aerosol 11 Blue Blue 22 Green Green 33 Red Red 44 NIR NIR 5
5SWIR-1 SWIR-1 6
TIRTIR-1 10
6 TIR-2 117 SWIR-2 SWIR-2 78 Panchromatic Panchromatic 8
Cirrus 9
and extends from southern Thailand, through Klian Intan in north Perak, to Beruas in southwest Perak. The exposed outcrop in the range is in Bukit Hijau area.
METHODOLOGYMaterials that were used in this study consist of 11 bands
of Landsat 8 image scene 128/56 acquired on 18th March 2015 which can be obtained from United States Geological Society (USGS) website and it is an open source data. The description of every spectral band of Landsat 8 image is shown in Table 1. This Landsat 8 image was chosen based on least percentage of cloud coverage within the study area which is only 0.64%.
Several digital processing techniques were done such as atmospheric correction, geometric correction and histogram equalization to remove errors in the image. Then, pan-sharpening using band 8 was conducted to enhance the quality of the image up to 15 m resolution by using ENVI 5.3 software. From visual evaluation, several spectral bands and band combinations were used for lineament tracing which already conducted by previous researchers (Table 2; Figure 3). Previous researchers used older version of Landsat images (Landsat 5 & Landsat 7) which have differences in terms of band description and band number compared with Landsat 8 image (Table 3). All negative lineaments observed in the images were traced and plotted in lineament map for each spectral band and band combination. The traced lineaments then were compared to choose the best spectral band or band combination for lineament mapping. The number and length
of lineaments for each part of the Semanggol Formation and its adjacent areas were plotted in rose diagram.
To verify the orientation observed from the Landsat 8 image, field verification of each part within the study area was conducted. Geological structures such as fault and fracture were recorded from selected outcrops of each area, which lineaments lied on the outcrop area. Then, the data were compared in terms of the orientation between Landsat 8 image and fieldwork data using rose diagram analysis.

Ali Imran Azman, Jasmi Ab Talib & Mohamad Shaufi Sokiman
Bulletin of the Geological Society of Malaysia, Volume 65, June 2018122
RESULTS AND DISCUSSIONSThe lineament maps produced for each spectral band
and band combination are shown in Figure 4. The total number and length of lineaments traced for each map are shown in Table 4. From the observation of these lineament maps, band 5 image identifies most lineament within the study area. This spectral band can trace lineaments in igneous intrusion and sedimentary rock based on the tone of the image. Valleys and rivers are clearly observed on the image. For band combinations used by Ali & Pirasteh (2004), the lineaments are mostly traced in igneous intrusion. However, the lineaments were hard to been seen in the parts of the Semanggol Formation. This is due to thin elevation of these areas which might not identify structural features using these band combinations. Band 7 image and band combination of RGB 5, 4, 3 delineate least lineaments. The reason is because the tone in igneous intrusions are very low, causing difficulties to recognise valleys or rivers. There are also difficulties to trace lineaments on thin elevation due to low brightness of these images.
Lineaments in length of more than 5 km are interpreted as faults because these lineaments are too long to be joints without displacements (Tjia, 1971). Several lineaments were correlated well with major strike-slip fault which is the Bok Bak Fault Zone, which lies on igneous intrusions between north and central Kedah of the Semanggol Formation, trending to NW-SE direction. There are also lineaments which separates between central Kedah and north Perak, but the lineaments seem to be discontinuous on other formations.
Figure 3: Spectral bands and band combinations from the literature applied to the Landsat 8 image, example of subset images in Bukit Perak, Kedah, located at the adjacent areas of the Semanggol Formation.
Table 4: Total lineaments and total length of lineaments for each map produced.
Spectral Band or Band Combination
Total lineaments
Total length (km)
Band 7 (Juhari Mat Akhir, 1996) 26 64.8
RGB 5, 4, 3 (Ali & Pirasteh, 2004) 77 177.5
RGB 7, 5, 2 (Ali & Pirasteh, 2004) 108 272.1
Band 5 (GahGah et al., 2007) 186 449.0
RGB 7, 6, 4 (Mohamad Firuz Ramli et al., 2009) 44 88.1
Figure 4: Lineament map produced from each spectral band and band combination from the literature.
Lineament study of the Semanggol Formation and adjacent areas from Landsat 8 Image
123Bulletin of the Geological Society of Malaysia, Volume 65, June 2018
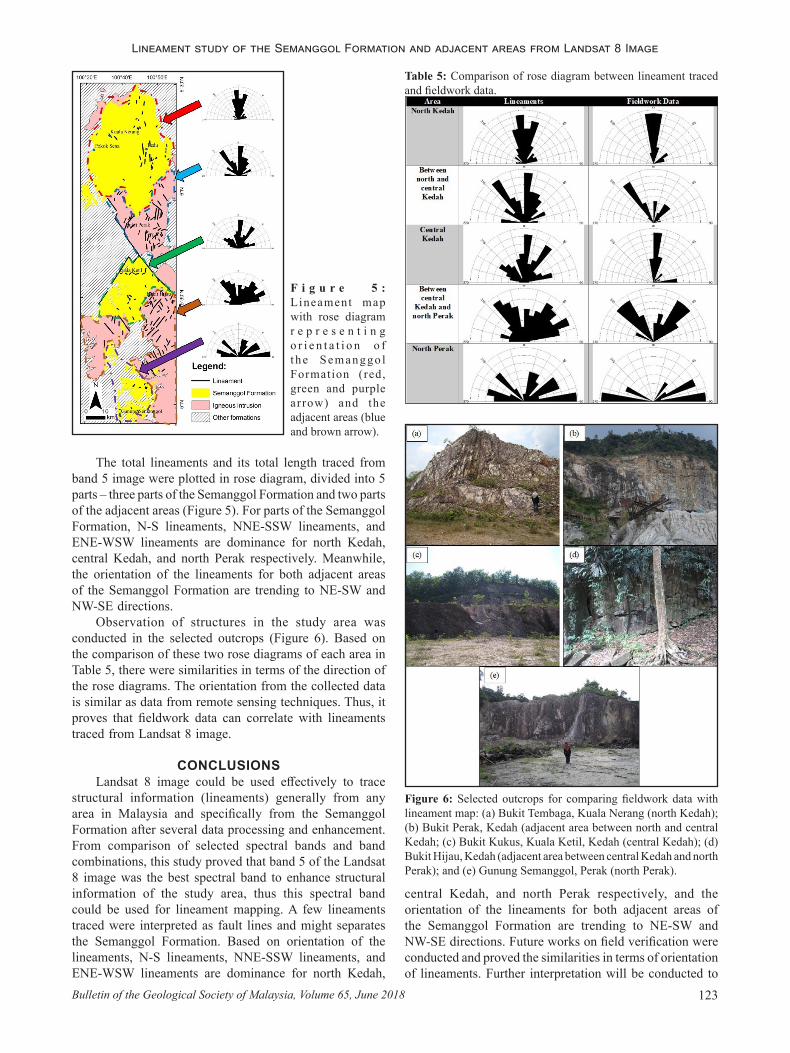
F i g u r e 5 : Lineament map with rose diagram r e p r e s e n t i n g o r i e n t a t i o n o f t he Semanggo l Formation (red, green and purple arrow) and the adjacent areas (blue and brown arrow).
The total lineaments and its total length traced from band 5 image were plotted in rose diagram, divided into 5 parts – three parts of the Semanggol Formation and two parts of the adjacent areas (Figure 5). For parts of the Semanggol Formation, N-S lineaments, NNE-SSW lineaments, and ENE-WSW lineaments are dominance for north Kedah, central Kedah, and north Perak respectively. Meanwhile, the orientation of the lineaments for both adjacent areas of the Semanggol Formation are trending to NE-SW and NW-SE directions.
Observation of structures in the study area was conducted in the selected outcrops (Figure 6). Based on the comparison of these two rose diagrams of each area in Table 5, there were similarities in terms of the direction of the rose diagrams. The orientation from the collected data is similar as data from remote sensing techniques. Thus, it proves that fieldwork data can correlate with lineaments traced from Landsat 8 image.
CONCLUSIONSLandsat 8 image could be used effectively to trace
structural information (lineaments) generally from any area in Malaysia and specifically from the Semanggol Formation after several data processing and enhancement. From comparison of selected spectral bands and band combinations, this study proved that band 5 of the Landsat 8 image was the best spectral band to enhance structural information of the study area, thus this spectral band could be used for lineament mapping. A few lineaments traced were interpreted as fault lines and might separates the Semanggol Formation. Based on orientation of the lineaments, N-S lineaments, NNE-SSW lineaments, and ENE-WSW lineaments are dominance for north Kedah,
Table 5: Comparison of rose diagram between lineament traced and fieldwork data.
Figure 6: Selected outcrops for comparing fieldwork data with lineament map: (a) Bukit Tembaga, Kuala Nerang (north Kedah); (b) Bukit Perak, Kedah (adjacent area between north and central Kedah; (c) Bukit Kukus, Kuala Ketil, Kedah (central Kedah); (d) Bukit Hijau, Kedah (adjacent area between central Kedah and north Perak); and (e) Gunung Semanggol, Perak (north Perak).
central Kedah, and north Perak respectively, and the orientation of the lineaments for both adjacent areas of the Semanggol Formation are trending to NE-SW and NW-SE directions. Future works on field verification were conducted and proved the similarities in terms of orientation of lineaments. Further interpretation will be conducted to
Ali Imran Azman, Jasmi Ab Talib & Mohamad Shaufi Sokiman
Bulletin of the Geological Society of Malaysia, Volume 65, June 2018124
justify the discontinuity of the Semanggol Formation based on remote sensing technique.
ACKNOWLEDGEMENTSThis work is partly funded by Department of
Geosciences, Universiti Teknologi PETRONAS (cost centre: 015240-002) and grant led by Ms Nur Huda Mohd Jamin (cost centre: 0153AA-F28). The first author would like to thank Assoc. Prof. Askury Abd Kadir and Dr Mohd Suhaili Ismail for helpful constructive reviews and suggestions of an earlier version of the manuscript.
REFERENCESAhmad Jantan, Basir Jasin, Ibrahim Abdullah, Uyop Said & Abdul
Rahim Samsudin, 1989. The Semanggol Formation – lithology, facies association and distribution, and probable basin setting. Warta Geologi, 15(1), 28.
Alexander, J.B., 1959. The pre-Tertiary stratigraphic succession in Malaya. Nature, 183, 230-232.
Ali, S.S. & Pirasteh, S., 2004. Geological applications of Landsat Enhanced Thematic Mapper (ETM) data and Geographic Information System (GIS): Mapping and structural interpretation in south-west Iran, Zagros Structural Belt. International Journal of Remote Sensing, 25(21), 4715-4727.
Barsi, J.A., Lee, K., Kvaran, G., Markham, B.L. & Pedelty, J.A., 2014. The spectral response of the Landsat-8 Operational Land Imager. Remote Sensing, 6, 10232-10251.
Basir Jasin, 1997. Permo-Triassic radiolaria from the Semanggol Formation, northwest Peninsular Malaysia. Journal of Asian Earth Science, 15(1), 43-53.
Basir Jasin & Zaiton Harun, 2007. Stratigraphy and sedimentology of the chert unit of the Semanggol Formation. Bulletin of the Geological Society of Malaysia, 53, 53-58.
Basir Jasin, Ahmad Jantan, Ibrahim Abdullah, Uyop Said & Abdul Rahim Samsudin, 1989. The Semanggol Formation – lithostratigraphy of the Semanggol rocks in the light of latest concept in stratigraphic practice: a suggestion. Warta Geologi, 15(1), 29.
Burton, C.K., 1973. Mesozoic. In: Gobbett, D.J. & Hutchison, C.S. (Eds.), Geology of the Malay Peninsula (West Malaysia and Singapore). Wiley-Interscience, New York, 97-141.
Foo, K.Y., 1976. Interpretation of Landsat-1 imagery of the Third East Asia IDOE Transect across Malaysia. Malaysian Geological Survey Annual Report, 183-192.
Gah Gah, M.M., Juhari Mat Akhir, Abdul Ghani M. Rafek & Ibrahim Abdullah, 2007. Correlation of geological discontinuities with remote sensing lineaments: case study from Cameron
Highlands, Pahang – Gua Musang, Kelantan. In: 28th Asian Conference on Remote Sensing 2007. Asian Association on Remote Sensing, Kuala Lumpur, 1784-1791.
Ibrahim Abdullah & Juhari Mat Akhir, 1990. Kamus Istilah Geologi Asas (Basic Geology Terminology Dictionary). Penerbit Universiti Kebangsaan Malaysia, Bangi. 195 p.
Ibrahim Abdullah, Ahmad Jantan, Basir Jasin, Abdul Rahim Samsudin & Uyop Said, 1989. Amount of displacement along the Bok Bak Fault: Estimation by using the lithofacies equivalence. Warta Geologi, 15(6), 255-262.
Ibrahim Komoo, Ibrahim Abdullah & Juhari Mat Akhir, 1989. Teknik Pemetaan Geologi (Geological Mapping Techniques). Penerbit Universiti Kebangsaan Malaysia, Bangi. 186 p.
Juhari Mat Akhir, 1996. Geological applications potential of satellite multispectral scanner satellite data in Malaysia: A Kedah-Perak case study. Borneo Science, 2, 1-19.
Mohamad Firuz Ramli, Tripathi, N.K., Norhakim Yusof, Helmi Zuhaidi Mohd Shafri & Zulfahmi Ali Rahman, 2009. Lineament mapping in a tropical environment using Landsat imagery. International Journal of Remote Sensing, 30(23), 6277-6300.
Mustaffa Kamal Shuib, 1994. Interference of compressional and strike slip related structures in the Semanggol Formation strata of N. Kedah. Warta Geologi, 20(2), 95-96.
Raj, J.K., 1982. A reappraisal of the Bok Bak fault zone. Warta Geologi, 8(2), 35-41.
Raj, J.K., 2009. Geomorphology. In: Hutchison, C.S. & Tan, D.N.K. (Eds.), Geology of Peninsular Malaysia. University of Malaya and the Geological Society of Malaysia, Kuala Lumpur, 5-29.
Roy, D.P., Wulder, M.A., Loveland, T.R., Woodcock, C.E., Allen, R.G., Anderson, M.C. & Zhu, Z., 2014. Landsat-8: Science and product vision for terrestrial global change research. Remote Sensing of Environment, 145, 154-172.
Simon, N., Che Aziz Ali, Kamal Roslan Mohamed & Kamilia Sharir, 2016. Best band ratio combinations for the lithological discrimination of the Dayang Bunting and Tuba Islands, Langkawi, Malaysia. Sains Malaysiana, 45(5), 659-667.
Syed Sheikh Almashoor & Tjia, H.D., 1987. A prominent fault across the Malaysia-Thai boundary: A preliminary report. Warta Geologi, 13(2), 35-37.
Teoh, L.H., 1992. Geology and mineral resources of Sungai Tiang Area, Kedah Darul Aman. Geological Survey of Malaysia Map Report, 5, 93 p.
Tjia, H.D., 1971. Lineament pattern on Penang Island, West Malaysia. Journal of Tropical Geography, 34, 56-61.
Tjia, H.D., 1989. Major faults of Peninsular Malaysia on remotely sensed images. Sains Malaysiana, 18(1), 101-114.
Tjia, H.D. & Zaiton Harun, 1985. Regional structures of Peninsular Malaysia. Sains Malaysiana, 14(1), 95-107.
Manuscript received 29 September 2017Revised manuscript received 23 April 2018
Manuscript accepted 26 April 2018