linden real estate market report - july 2014
TRANSCRIPT

How’s the Real Estate Market in Linden?
July, 2014

If you're planning on buying or selling a home
in Linden, the first step is to learn about the
Lindenreal estate market conditions.

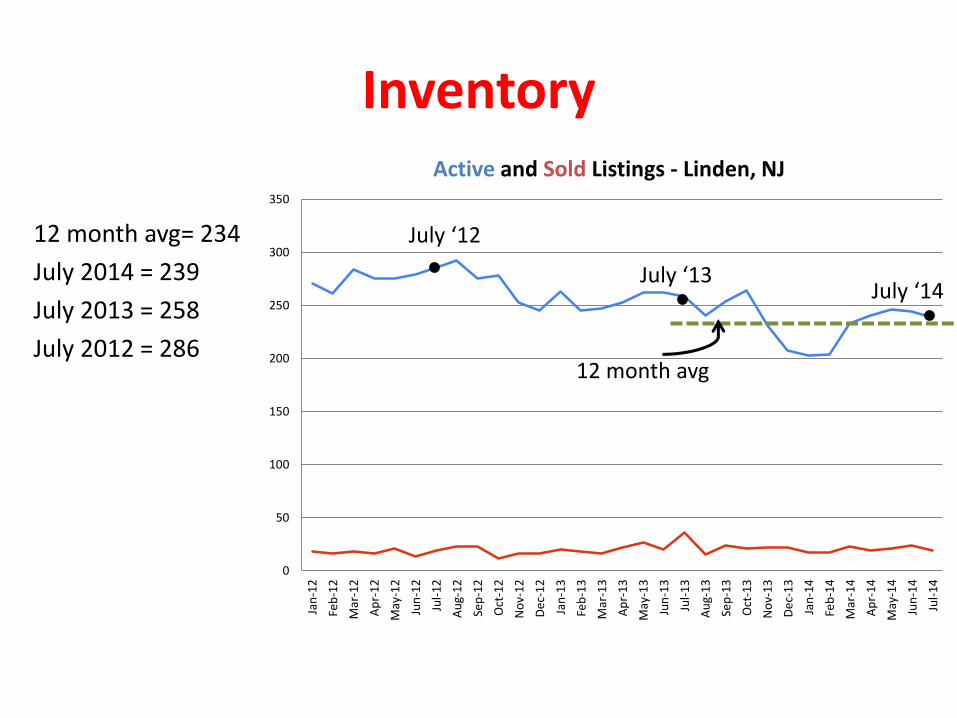
Inventory
There are currently 171homes offered for sale in Linden and they range in price from $109,000 to $649,000. 0
50
100
150
200
250
300
350
Jan
-12
Feb
-12
Mar
-12
Ap
r-1
2
May
-12
Jun
-12
Jul-
12
Au
g-1
2
Sep
-12
Oct
-12
No
v-1
2
De
c-1
2
Jan
-13
Feb
-13
Mar
-13
Ap
r-1
3
May
-13
Jun
-13
Jul-
13
Au
g-1
3
Sep
-13
Oct
-13
No
v-1
3
De
c-1
3
Jan
-14
Feb
-14
Mar
-14
Ap
r-1
4
May
-14
Jun
-14
Jul-
14
Active and Sold Listings - Linden, NJ
0
50
100
150
200
250
300
350
Jan
-12
Feb
-12
Mar
-12
Ap
r-1
2
May
-12
Jun
-12
Jul-
12
Au
g-1
2
Sep
-12
Oct
-12
No
v-1
2
De
c-1
2
Jan
-13
Feb
-13
Mar
-13
Ap
r-1
3
May
-13
Jun
-13
Jul-
13
Au
g-1
3
Sep
-13
Oct
-13
No
v-1
3
De
c-1
3
Jan
-14
Feb
-14
Mar
-14
Ap
r-1
4
May
-14
Jun
-14
Jul-
14
Active and Sold Listings - Linden, NJ
Inventory
12 month avg= 234
July 2014 = 239
July 2013 = 258
July 2012 = 286
July ‘12
July ‘13July ‘14
12 month avg
Inventory is definitely decreasing. Low supply usually means an increase in prices.

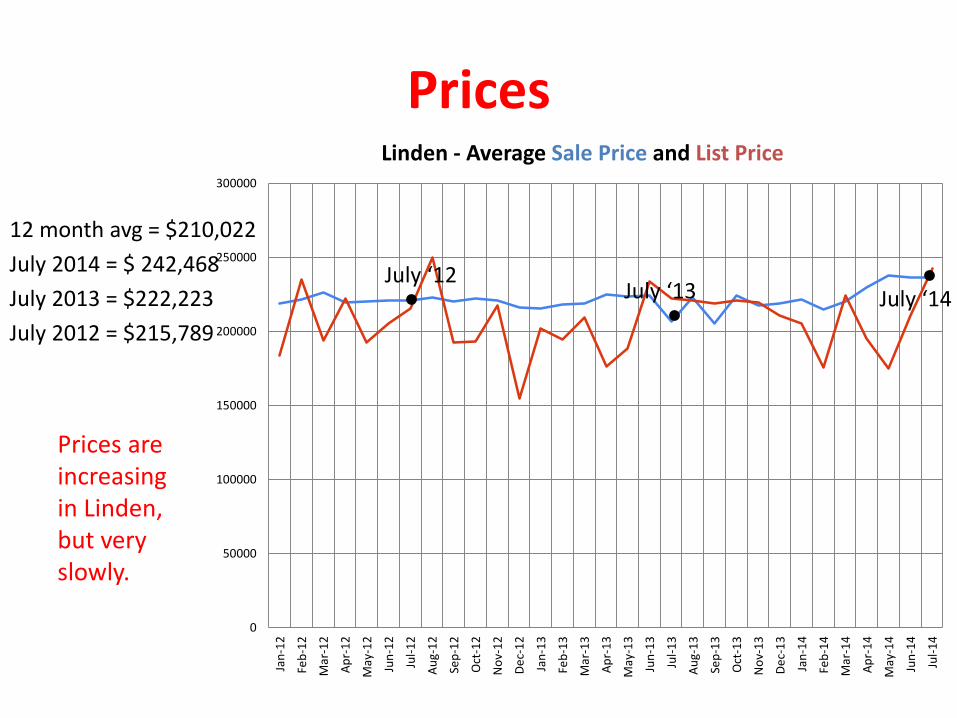
Prices
The average selling price of a home in Linden in July was $242,468.
0
50000
100000
150000
200000
250000
300000
Jan
-12
Feb
-12
Mar
-12
Ap
r-1
2
May
-12
Jun
-12
Jul-
12
Au
g-1
2
Sep
-12
Oct
-12
No
v-1
2
De
c-1
2
Jan
-13
Feb
-13
Mar
-13
Ap
r-1
3
May
-13
Jun
-13
Jul-
13
Au
g-1
3
Sep
-13
Oct
-13
No
v-1
3
De
c-1
3
Jan
-14
Feb
-14
Mar
-14
Ap
r-1
4
May
-14
Jun
-14
Jul-
14
Linden - Average Sale Price and List Price
Prices
12 month avg = $210,022
July 2014 = $ 242,468
July 2013 = $222,223
July 2012 = $215,789
July ‘12
July ‘13
July ‘14
0
50000
100000
150000
200000
250000
300000
Jan
-12
Feb
-12
Mar
-12
Ap
r-1
2
May
-12
Jun
-12
Jul-
12
Au
g-1
2
Sep
-12
Oct
-12
No
v-1
2
De
c-1
2
Jan
-13
Feb
-13
Mar
-13
Ap
r-1
3
May
-13
Jun
-13
Jul-
13
Au
g-1
3
Sep
-13
Oct
-13
No
v-1
3
De
c-1
3
Jan
-14
Feb
-14
Mar
-14
Ap
r-1
4
May
-14
Jun
-14
Jul-
14
Linden - Average Sale Price and List Price
Prices
12 month avg = $210,022
July 2014 = $ 242,468
July 2013 = $222,223
July 2012 = $215,789
July ‘12July ‘13 July ‘14
Prices are increasing in Linden, but very slowly.
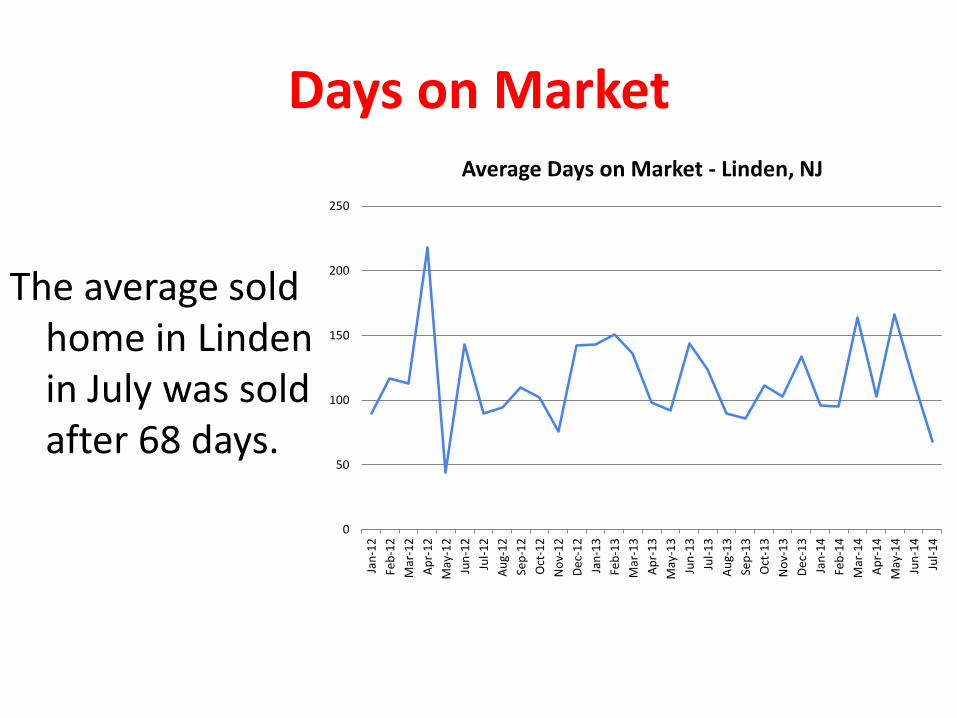
Days on Market
The average sold home in Linden in July was sold after 68 days.
0
50
100
150
200
250
Jan
-12
Feb
-12
Mar
-12
Ap
r-1
2
May
-12
Jun
-12
Jul-
12
Au
g-1
2
Sep
-12
Oct
-12
No
v-1
2
De
c-1
2
Jan
-13
Feb
-13
Mar
-13
Ap
r-1
3
May
-13
Jun
-13
Jul-
13
Au
g-1
3
Sep
-13
Oct
-13
No
v-1
3
De
c-1
3
Jan
-14
Feb
-14
Mar
-14
Ap
r-1
4
May
-14
Jun
-14
Jul-
14
Average Days on Market - Linden, NJ
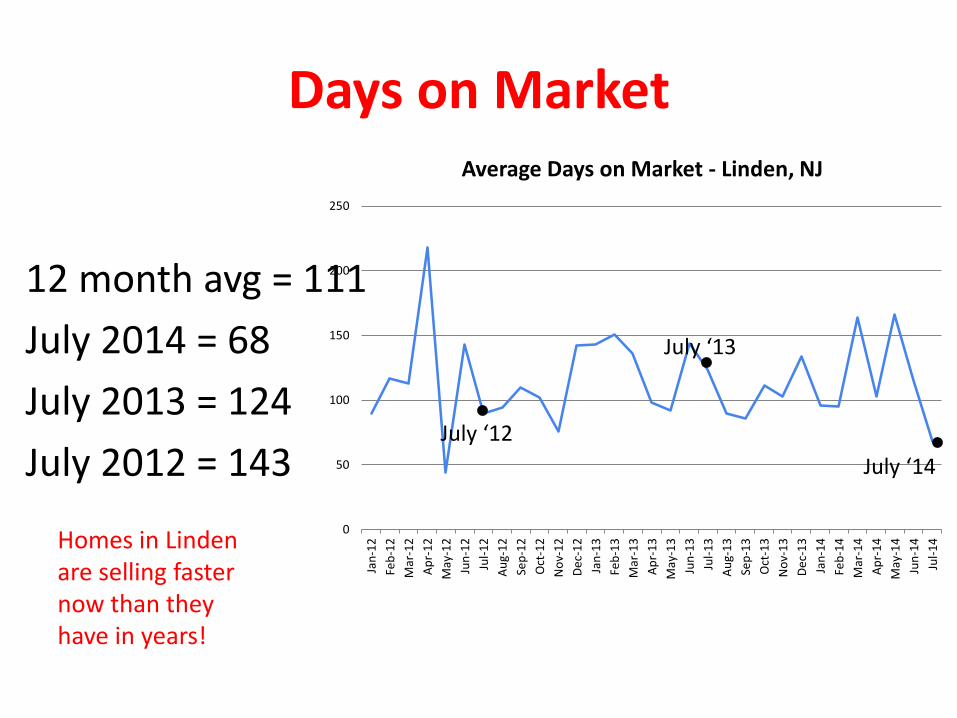
Days on Market
12 month avg = 111
July 2014 = 68
July 2013 = 124
July 2012 = 143July ‘12
July ‘13
July ‘14
0
50
100
150
200
250
Jan
-12
Feb
-12
Mar
-12
Ap
r-1
2
May
-12
Jun
-12
Jul-
12
Au
g-1
2
Sep
-12
Oct
-12
No
v-1
2
De
c-1
2
Jan
-13
Feb
-13
Mar
-13
Ap
r-1
3
May
-13
Jun
-13
Jul-
13
Au
g-1
3
Sep
-13
Oct
-13
No
v-1
3
De
c-1
3
Jan
-14
Feb
-14
Mar
-14
Ap
r-1
4
May
-14
Jun
-14
Jul-
14
Average Days on Market - Linden, NJ
Days on Market
12 month avg = 111
July 2014 = 68
July 2013 = 124
July 2012 = 143July ‘12
July ‘13
July ‘14
Homes in Linden are selling faster now than they have in years!

What does this mean to you?
Prices are up slightly, inventory is down, and homes are selling more quickly.
If you’re planning to BUY a home, this might be a great time to get a deal!
If you’re planning to SELL a home, you need to make sure your home is in top showing condition and that it’s priced right so that it stands up to the competition!
