linc modeling of august 19, 2004 queen city barrel · pdf filelinc modeling of august 19, 2004...
TRANSCRIPT

UCRL-TR-206580
LINC Modeling of August 19, 2004 QueenCity Barrel Company Fire In Cincinnati,OH
M. B. Dillon, J. S. Nasstrom, R. L. Baskett, B. M.Pobanz
September 15, 2004

Disclaimer
This document was prepared as an account of work sponsored by an agency of the United States Government. Neither the United States Government nor the University of California nor any of their employees, makes any warranty, express or implied, or assumes any legal liability or responsibility for the accuracy, completeness, or usefulness of any information, apparatus, product, or process disclosed, or represents that its use would not infringe privately owned rights. Reference herein to any specific commercial product, process, or service by trade name, trademark, manufacturer, or otherwise, does not necessarily constitute or imply its endorsement, recommendation, or favoring by the United States Government or the University of California. The views and opinions of authors expressed herein do not necessarily state or reflect those of the United States Government or the University of California, and shall not be used for advertising or product endorsement purposes.
This work was performed under the auspices of the U.S. Department of Energy by University of California, Lawrence Livermore National Laboratory under Contract W-7405-Eng-48.

LINC Modeling of August 19, 2004 Queen City Barrel Company Fire In Cincinnati, OH
Submitted by:
Michael B. Dillon, John S. Nasstrom, Ronald L. Baskett, and Brenda M. Pobanz Lawrence Livermore National Laboratory (LLNL)
[email protected] - (925) 422-7627
Summary
This report details the information received, assumptions made, actions taken, and products delivered by the Lawrence Livermore National Laboratory (LLNL) during the August 19, 2004 fire at the Queen City Barrel Company (QCB) in Cincinnati, OH. During the course of the event, LLNL provided four sets of plume model products to various Cincinnati emergency response organizations:
Set 1: Initial (Smoke) Projections, Set 2: Initial Fire Plume Health Effect Estimate, Set 3: Post-Analysis of the Fire Plume, and Set 4: Initial Smoldering Ember Health Effect Estimate. Each set of products was developed from information provided by the City of
Cincinnati as input to the centralized dispersion modeling system at LLNL’s National Atmospheric Release Advisory Center (NARAC). For more details on the modeling system, see: http://narac.llnl.gov.
This work was supported by the Department of Homeland Security (DHS) Local
Integration of NARAC with Cities (LINC) program. This program is working with pilot cities to test and demonstrate operational plume modeling tools and services from the NARAC to city agencies.
In using the information provided below, it is important to understand that
NARAC plume model predictions are intended to be emergency response guidance, and are not final recommendations. The accuracy of any prediction will be limited by the accuracy of the input data, such as estimates of the material amount and the available meteorological data for the area and time of the incident. Predictions should be confirmed and refined with field measurements before making any final assessment of potential impacts. Concentrations within the inner plume model contour level may be higher than indicated due to the limited resolution of the model and due to finer scale variation in the plume air concentrations that are not simulated by the model.
September 14, 2004 Page 1
Chronology
Set 1: Initial (Smoke) Projections ― Approximately 23:45-23:54 UTC August 19 (19:45-19:54 EDT)
At about 19:45 EDT on Thursday, August 19, 2004, the Cincinnati Health
Department (CHD) alerted the Lawrence Livermore National Laboratory (LLNL) to a fire in progress at the Queen City Barrel Company (QCB) through a call to the NARAC customer support desk. The incident was described as an extremely large fire at a barrel recycling facility with 20+ ft flames rising above the building. The facility was described as encompassing a city block with 4 floors above and 2 floors below ground, completely filled with 55 gal drums (stacked 3 high). The location was given as 39.10613N and 84.54837W. The fire reportedly started ~20 min prior to the call. CHD was particularly concerned about the health effects associated with the combustion of unknown, organic chemicals potentially contained in the barrels.
LLNL initially provided a set of “smoke” plume map plots to guide the first
responders and field monitoring teams to safely approach the scene and identify the downwind areas of concern. Due to the nominal source used, these plots have no estimates of health effects associated with them. As requested by CHD, LLNL posted the Set 1 plots to the NARAC Web site and shared these plume map plots with all Cincinnati related NARAC Web users.
Set 1 Plume Product – Posted 23:54 UTC (19:54 EDT) August 19: Hazard Released: A nominal amount, 1 g, of respirable particles (uniform size distribution from 0.01 to 10 µm, deposition velocity of 0.3 cm/s – consistent with fresh combustion particles) were released from a three-dimensional Gaussian spatial distribution (standard deviation of 18.3m) located at the top of the building, 54.9 m above ground level (LLNL used a conservative assumption that the plume rise was negligible). The particles were released at a constant rate during the entire model run (i.e. LLNL assumed the fire was constantly burning for the entire 6 hours and did not model changes in the fire intensity). Meteorology Used: LLNL used the National Weather Service ETA (12 km horizontal resolution) weather forecast model output valid at 8/19/04 21:00 UTC, 8/20/04 0:00 UTC, and 8/20/04 3:00 UTC to drive the NARAC dispersion model. Plots Produced: LLNL produced hourly integrated particulate air concentrations for the first 6 hours of the fire. These products demonstrate only the areas that may be affected by the plume and are not intended to estimate health effects.
September 14, 2004 Page 2

Set 2: Initial Fire Plume Health Effect Estimate ― Approximately 1:00-4:19 UTC August 20 (20:00 -23:19 EDT August 19) LLNL developed the Set 2 plots to include an estimated airborne release amount based on the choice of a surrogate chemical compound (benzene), field measurements, and a more complete meteorological analysis. The process of developing the Set 2 plots is described below.
1) CHD called the LLNL operations center and started providing air concentration measurements (see Field Measurement Appendix). These measurements were updated periodically over the next several hours.
2) Limited information was available about the burning compounds, thus
benzene was chosen as a surrogate compound to estimate the possible plume toxicity (see below). The choice of benzene as a surrogate compound implies dividing the FID measurements by 6 (6 carbon atoms per benzene molecule). Benzene was selected since it is a common industrial chemical and possesses a “middle of the road” acute toxicity in relation to other organic compounds. The accuracy of this assumption and the hazard areas predicted by the plume model strongly depend on how closely the actual hazards in the plume are similar to those posed by benzene. It is important to note that sufficient data did not exist to confirm these assumptions.
Benzene has Emergency Response Planning Guidelines (ERPG) 3, 2, and
1 air concentration levels of 3130, 470, and 156 mg/m3, respectively. The American Industrial Hygiene Association (www.aiha.org) described the ERPG level health implications as:
- The ERPG–3 is the maximum airborne concentration below which it is believed nearly all individuals could be exposed for up to one hour without experiencing or developing life-threatening health effects.
- he ERPG–2 is the maximum airborne concentration below which it is believed nearly all individuals could be expofor up to one hour without experiencing or developing irreversible or other serious health effects or symptomcould im
Tsed
s that pair an individual's ability to take protective
- Ted
action.
he ERPG–1 is the maximum airborne concentration below which it is believed nearly all individuals could be exposfor up to one hour without experiencing other than mild
September 14, 2004 Page 3

transient adverse health effects or perceiving a clearly
3) ilable
itself, would likely shift around considerably through the night if the fire remained in its current state
4) cy
f d the names of several
chemicals known to be present in the QCB over the phone to LLNL, the
5)
s as
amount is only an approximation
for the amount of benzene released, assuming compounds with a toxicity
6)
in se showers
was not well characterized. Including rainout typically reduces airborne
) After posting the Set 2 plots to the NARAC Web, CHD directed LLNL to
.
to 0.01
defined objectionable odor.
While the plume prediction was being updated to be consistent with avafield measurements, CHD called to notify LLNL that the smoke plume was shifting to areas not predicted by the Set 1 plume products. LLNL staff investigated, noted that the local surface weather stations reported light and variable (calm) winds. LLNL informed CHD of the updated weather and noted that the smoke plume, particularly near the fire
and would rise vertically if the fire gained intensity.
Before the benzene plume products were shared with Cincinnati emergenresponse organizations, CHD called with an inventory of the QCB: 20,00055 gal drums of which a quarter were empty fiber drums, a quarter were empty plastic drums, and half were steel drums. Of the steel drums, ~100 contained ~20 gal of organic chemicals, the remaining contained ~5 gal oorganic chemicals (~51,500 gal total). CHD relaye
chemicals listed had similar toxicity to benzene.
LLNL scaled the amount of benzene released to the atmosphere to be consistent with the FID measurements available and posted these productSet 2. The amount of organic chemicals released was consistent with the reported QCB inventory. It is important to note that field measurements provide only a limited sample of the variation, in time and space, of the airconcentration. As such the airborne release
similar to benzene were indeed released.
Both emergency responders and the National Weather Service reported scattered thundershowers. LLNL chose not to incorporate rainout effects the plume model since the spatial and temporal distribution of the
pollutant concentrations and so this assumption is conservative.
7stand down for the evening
et 2 Plume Products – S
Posted 4:19 UTC August 20, 2004 (23:19 EDT August 19): Hazard Released: 90 tons of benzene (a surrogate compound) was estimatedbe released over 12 hrs as respirable particles (uniform size distribution from
September 14, 2004 Page 4

to 10 µm, deposition velocity of 0.3 cm/s – consistent with fresh combustion particles) from a three-dimensional Gaussian spatial distribution (standard deviation of 18.3m) located above the QCB building (LLNL maintained the conservative assumption that the plume rise was negligible). The hazard was
leased at a constant rate during the entire model run time (i.e. LLNL assumed
rvations between 23:00 UTC to 3:00 UTC (Plots valid after 3:00 TC assume the winds after 3:00 UTC are identical those observed at 3:00 UTC,
ire. These products illustrate the possible health impacts from the re plume, but should be used with caution since this analysis has the following
lim
rial has the same toxicity as benzene (which
(the NARAC sion
5) used a limited set of field measurements which do not provide a complete
guidance during an emergency sponse, LLNL recommends that detailed field measurements be used to
etermine the potential for health impacts.
he Set
lots used a benzene release rate estimated using available field measurements. The amount of organic chemicals released was consistent with the reported QCB inventory.
rethe fire was burning for the entire 12 hrs). Meteorology Used: LLNL used the National Atmospheric Release Advisory Center (NARAC) system to integrated all available surface and upper air observations (~100 and 5 stations, respectively) within 25 km of the fire available that reported obseUi.e. persistence). Plots Produced: Hourly peak 10min benzene air concentrations for the first 12 hours of the ffi
itations:
1) assumes that all the toxic matewas unconfirmed), 2) does not account for rainout, 3) does not account for the generic particulate health effectsmodel uses the particulate information only to determine the plume dispercharacteristics and the hazard’s ability to enter the lungs), 4) only accounts for acute toxicity and does not address potential chronic effects, and
sampling of the plume. While these plume products are suitable forred
et 3: Post-Analysis of the Fire Plumes ― SApproximately 14:00-15:33 UTC August 20, 2004 (9:00-10:33 EDT) The next morning LLNL produced the Set 3 plume products as updates to t2 benzene hazard plots with new meteorological observations, and information that fire was quenched at ~6:00 UTC (1:00 EDT). These p
September 14, 2004 Page 5

Set 3 Plume Product - Posted 15:33 UTC (10:33 EDT) August 20: Hazard Released: 52.5ton of benzene (a surrogate compound) was estimated to be released over 7hrs as respirable particles (uniform size distribution from 0.01 to 10 µm, deposition velocity of 0.3 cm/s – consistent with fresh combustion particles) from a three-dimensional Gaussian spatial distribution (standard deviation of 18.3m) located at the top of the building (LLNL maintained the conservative assumption that the plume rise was negligible). The hazard was released at a constant rate during the entire model run time (i.e. LLNL assumed the fire was burning at the same intensity for the entire 7 hours). Meteorology Used: LLNL used the National Atmospheric Release Advisory Center (NARAC) model to integrated all available surface and upper air observations (~100 and 5 stations, respectively) within 25 km of the fire that reported observations between 23:00 UTC to 14:00 UTC. Plots Produced: Hourly peak 10 min benzene air concentrations for the first 8 hours of the fire. These products illustrate the possible health impacts from the fire plume, but should be used with caution since this analysis has the same set of limitations listed above for Set 2 calculations. While these plume products are suitable for guidance during an emergency response, LLNL recommends that detailed field measurements be used to determine the potential for health impacts.
Set 4: Initial Smoldering Ember Health Effect Estimate ― Approximately 17:00-18:36 UTC August 20, 2004 (12:00-15:36 EDT) CHD called the NARAC Operations Center and requested a new product to estimate the potential hazards associated with the remaining embers. A light drizzle was reported. LLNL produced the requested plume products and posted them to the NARAC Web.
Set 4 Plume Products – Posted 18:36 UTC (15:36 EDT) August 20: Hazard Released: 8.6 tons of benzene (a surrogate compound) was estimated to be released over 8 hrs as respirable particles (size distribution from 0.01 to 10 µm, deposition velocity of 0.3 cm/s – consistent with fresh combustion particles) from a 50 m radius circle at the surface (LLNL conservatively estimated negligible plume rise). The hazard was released at a constant rate during the entire model run time (i.e. LLNL assumed the embers smoldered for the entire 8 hours). The
September 14, 2004 Page 6

amount released was scaled to be consistent with the single 60 ppm FID measurement made at the corner of Guest and Evans (reported by CHD). Meteorology Used: LLNL used NARAC system to integrate all available surface and upper air observations (~100 and 5 stations, respectively) within 25 km of the fire that reported observations between 23:00 UTC to 17:00 UTC. Plots Produced: Hourly peak 10 min benzene air concentrations for the first 7 hours of smoldering embers. These products illustrate the possible health impacts from the fire plume, but should be used with caution since this analysis has the same set of limitations listed above for Set 2 calculations. While these plume products are suitable for guidance during an emergency response, LLNL recommends that detailed field measurements be used to determine the potential for health impacts.
Disclaimer
This work was prepared as an account of work sponsored by an agency of the United States Government. Neither the United States Government nor the University of California nor any of their employees, makes any warranty, express or implied, or assumes any liability or responsibility for the accuracy, completeness, or usefulness of any information, apparatus, products or process disclosed, or represents that its use would not infringe privately-owned rights. Reference herein to any specific commercial products, process or service by trade name, trademark, manufacturer or otherwise does not necessarily constitute or imply its endorsement, recommendation, or favoring by the United States Government or the University of California. The views and opinions of authors expressed herein do not necessarily state or reflect those of the United States Government or the University of California, and shall not be used for advertising or product endorsement purposes.
This work was produced at the University of California, Lawrence Livermore National Laboratory (UC LLNL) under contract W-7405-ENG-48 (Contract 48) between the U.S. Department of Energy (DOE) and The Regents of the University of California (University) for the operation of UC LLNL. Copyright is reserved to the University for purposes of controlled dissemination, commercialization through formal licensing, or other disposition under terms of Contract 48; DOE policies, regulations and orders; and U.S. statutes. The rights of the Federal Government are reserved under Contract 48 subject to the restrictions agreed upon by the DOE and University as allowed under DOE Acquisition Letter 97-1.
September 14, 2004 Page 7

Appendix 1:
Field Measurements used to scale the Set 2 and Set 3 source terms
CHD reported the following field measurements to the LLNL operation
center throughout the development of the Set 2 plots:
Approximate Time of
Measurement (UTC)
Location Description Latitude Longitude FID (ppm) Other
(ppb)
0030 Depot and 8th St. 39 06.339 -84 33.094 2 to 5 300
0030 Edwards and Observatory 39 08.905 -84 26.533 4.7 N/A
0145 University Hospital 39.0809 -84.3011 0 N/A
0145 Unknown 1† 39.11523 -84.5470 1.17 159 0145 Unknown 2 39.087 -84.54556 1.28 178 0145 Unknown 3 39.10765 -84.54797 1.5 N/A 0145 Unknown 4 39.10771 -84.54885 1.4 218
0145 Devon’s Hospital 39.0747 -84.3123 0 N/A
0100 Unknown 6 39.13903 -84.47932 5.7 0.17 After 0100 Sawyer Pt. 39.0604 -84.2959 0 N/A
† Additional measurements at Unknown 1 include: Hydrogen Sulfide < (unspecified) detection limit, Vinyl Chloride < 0.5 ppm, and Benzene < 0.2 ppm. The Vinyl Chloride and Benzene concentrations reported were below the levels of concern established by the Department of Energy Temporary Emergency Exposure Limits and American Industrial Hygiene Association Emergency Response Planning Guidelines.
LLNL used only the FID observations to estimate the emission source since, due to severe time constraints, LLNL was unable to obtain a sufficiently detailed description of the “Other” measurement technique. LLNL notes that FID detectors measure the total number of carbon atoms in the air sample. Thus the raw FID measurements were appropriately scaled to develop the benzene source term described above (e.g. [benzene] = FID/6). Benzene was used as a surrogate for chemical compounds potentially released (see discussion in the Second Set of Plume Model Products section above). This assumption was not confirmed by measurements.
September 14, 2004 Page 8

LLNL chose to exclude the Edwards and Observatory observation from
this analysis since the other reported values were consistent with the LLNL model typically within a factor of 2 and the Edwards location was significantly to the south of the modeled plume – consistent with eyewitness reports from this location that described the smoke plume to be “in the distance.”
September 14, 2004 Page 9

Appendix 2: LLNL Plume Products
Some figures are labeled "Not For Public Dissemination" because they are a
record of the original figures used during this event. The figures do not have that restriction now.
Set 1: Initial (Smoke) Projections
These plume model products illustrate downwind areas that may be affected by the Queen City Barrel Company fire plume using a forecast model (12km ETA). These products provide only relative concentrations. NO HEALTH AFFECTS ARE INDICATED IN THESE PLUME PRODUCTS.
Set 2: Initial Fire Plume Health Effect Estimates
These plume products illustrate the modeled health effects from the Queen City Barrel Company fire plume using local meteorological observations (persistence of the 3:00 UTC observations is assumed for plots valid at 4:00 UTC and after). This analysis incorporates a updated airborne chemical release amount compared to the Set 1 analysis. LLNL assumes that the hazard released is approximately as toxic as benzene. This assumption is unconfirmed by measurements.
Set 3: Post-analysis of the Fire Plume
These plume products use the same source term developed for Set 2, but the meteorology is based on the actual surface and upper air observations throughout the model run. LLNL assumes that the hazard released is approximately as toxic as benzene. This assumption is unconfirmed by measurements.
Set 4: Initial Smoldering Ember Health Effect Estimates
These plume products illustrate the modeled health effects from the smoldering ember plume. The compound released was assumed to be benzene and the release rate was scaled to match a single field measurement. LLNL assumes that the hazard released is approximately as toxic as benzene. This assumption is unconfirmed by measurements.
September 14, 2004 Page 10

Integ. Air Conc. of particulate
Set 1: Warehouse Fire - smoke plumeAutomated Report - Actual Release
Effects or contamination from 19 Aug 2004 23:00 UTC to 20 Aug 2004 00:00 UTC at or near ground level.
Source Location: 39.10613N, 84.54837W Material: particulate Comments: Release starting at 08/19/2004 23:00:00 UTC for 6 hr gridded met at 08/19/2004 21:00:00 UTC gridded met at 08/20/2004 00:00:00 UTC gridded met at 08/20/2004 03:00:00 UTC Not For Public Dissemination
Consequences and Actions
(g-s/m3)Area Extent
PopulationCasualtiesFatalities
Description
>1.00E-60.03 km2n/a
0 n/a n/a
Possibly contaminated area. Use to confirm with monitoring surveys.
>1.00E-72.4 km2n/a
7,330 n/a n/a
Possibly contaminated area. Use to confirm with monitoring surveys.
Note: Areas and counts in the table are cumulative.
Map Size: 4.28 km by 4.28 km Id: Production.rcE12286.rcC12215.0 NARAC Operations: [email protected]; (925) 424-6465 Requested by: { Michael Dillon; NARAC Operations }
September 14, 2004 Page 11

Integ. Air Conc. of particulate
Set 1: Warehouse Fire - smoke plumeAutomated Report - Actual Release
Effects or contamination from 19 Aug 2004 23:00 UTC to 20 Aug 2004 01:00 UTC at or near ground level.
Source Location: 39.10613N, 84.54837W Material: particulate Comments: Release starting at 08/19/2004 23:00:00 UTC for 6 hr gridded met at 08/19/2004 21:00:00 UTC gridded met at 08/20/2004 00:00:00 UTC gridded met at 08/20/2004 03:00:00 UTC Not For Public Dissemination
Consequences and Actions
(g-s/m3)Area Extent
PopulationCasualtiesFatalities
Description
>1.00E-60.3 km2n/a
17 n/a n/a
Possibly contaminated area. Use to confirm with monitoring surveys.
>1.00E-76.5 km2n/a
19,337 n/a n/a
Possibly contaminated area. Use to confirm with monitoring surveys.
Note: Areas and counts in the table are cumulative.
Map Size: 8.19 km by 8.19 km Id: Production.rcE12286.rcC12215.0 NARAC Operations: [email protected]; (925) 424-6465 Requested by: { Michael Dillon; NARAC Operations }
September 14, 2004 Page 12

Integ. Air Conc. of particulate
Set 1: Warehouse Fire - smoke plumeAutomated Report - Actual Release
Effects or contamination from 19 Aug 2004 23:00 UTC to 20 Aug 2004 02:00 UTC at or near ground level.
Source Location: 39.10613N, 84.54837W Material: particulate Comments: Release starting at 08/19/2004 23:00:00 UTC for 6 hr gridded met at 08/19/2004 21:00:00 UTC gridded met at 08/20/2004 00:00:00 UTC gridded met at 08/20/2004 03:00:00 UTC Not For Public Dissemination
Consequences and Actions
(g-s/m3)Area Extent
PopulationCasualtiesFatalities
Description
>1.00E-60.5 km2n/a
519 n/a n/a
Possibly contaminated area. Use to confirm with monitoring surveys.
>1.00E-710.9 km2n/a
31,946 n/a n/a
Possibly contaminated area. Use to confirm with monitoring surveys.
Note: Areas and counts in the table are cumulative.
Map Size: 9.67 km by 9.67 km Id: Production.rcE12286.rcC12215.0 NARAC Operations: [email protected]; (925) 424-6465 Requested by: { Michael Dillon; NARAC Operations }
September 14, 2004 Page 13

Integ. Air Conc. of particulate
Set 1: Warehouse Fire - smoke plumeAutomated Report - Actual Release
Effects or contamination from 19 Aug 2004 23:00 UTC to 20 Aug 2004 03:00 UTC at or near ground level.
Source Location: 39.10613N, 84.54837W Material: particulate Comments: Release starting at 08/19/2004 23:00:00 UTC for 6 hr gridded met at 08/19/2004 21:00:00 UTC gridded met at 08/20/2004 00:00:00 UTC gridded met at 08/20/2004 03:00:00 UTC Not For Public Dissemination
Consequences and Actions
(g-s/m3)Area Extent
PopulationCasualtiesFatalities
Description
>1.00E-60.8 km2n/a
1,537 n/a n/a
Possibly contaminated area. Use to confirm with monitoring surveys.
>1.00E-714.2 km2n/a
41,594 n/a n/a
Possibly contaminated area. Use to confirm with monitoring surveys.
Note: Areas and counts in the table are cumulative.
Map Size: 10.57 km by 10.57 km Id: Production.rcE12286.rcC12215.0 NARAC Operations: [email protected]; (925) 424-6465 Requested by: { Michael Dillon; NARAC Operations }
September 14, 2004 Page 14

Integ. Air Conc. of particulate
Set 1: Warehouse Fire - smoke plume
Automated Report - Actual Release
Effects or contamination from 19 Aug 2004 23:00 UTC to 20 Aug 2004 04:00 UTC at or near ground level.
Source Location: 39.10613N, 84.54837W Material: particulate Comments: Release starting at 08/19/2004 23:00:00 UTC for 6 hr gridded met at 08/19/2004 21:00:00 UTC gridded met at 08/20/2004 00:00:00 UTC gridded met at 08/20/2004 03:00:00 UTC Not For Public Dissemination
Consequences and Actions
(g-s/m3) Area Extent
PopulationCasualtiesFatalities
Description
>1.00E-50.003 km2n/a
0 n/a n/a
Possibly contaminated area. Use to confirm with monitoring surveys.
>1.00E-61.3 km2 n/a
3,163 n/a n/a
Possibly contaminated area. Use to confirm with monitoring surveys.
>1.00E-719.4 km2n/a
49,729 n/a n/a
Possibly contaminated area. Use to confirm with monitoring surveys.
Note: Areas and counts in the table are cumulative.
Map Size: 13.14 km by 13.14 km Id: Production.rcE12286.rcC12215.0 NARAC Operations: [email protected]; (925) 424-6465 Requested by: { Michael Dillon; NARAC Operations }
September 14, 2004 Page 15

Integ. Air Conc. of particulate
Set 1: Warehouse Fire - smoke plume
Automated Report - Actual Release
Effects or contamination from 19 Aug 2004 23:00 UTC to 20 Aug 2004 05:00 UTC at or near ground level.
Source Location: 39.10613N, 84.54837W Material: particulate Comments: Release starting at 08/19/2004 23:00:00 UTC for 6 hr gridded met at 08/19/2004 21:00:00 UTC gridded met at 08/20/2004 00:00:00 UTC gridded met at 08/20/2004 03:00:00 UTC Not For Public Dissemination
Consequences and Actions
(g-s/m3)Area Extent
PopulationCasualtiesFatalities
Description
>1.00E-50.01 km2n/a
0 n/a n/a
Possibly contaminated area. Use to confirm with monitoring surveys.
>1.00E-61.7 km2n/a
4,741 n/a n/a
Possibly contaminated area. Use to confirm with monitoring surveys.
>1.00E-725.1 km2n/a
61,032 n/a n/a
Possibly contaminated area. Use to confirm with monitoring surveys.
Note: Areas and counts in the table are cumulative.
Map Size: 14.89 km by 14.89 km Id: Production.rcE12286.rcC12215.0 NARAC Operations: [email protected]; (925) 424-6465 Requested by: { Michael Dillon; NARAC Operations }
September 14, 2004 Page 16

Total Deposition of particulate
Set 1: Warehouse Fire - smoke plume
Automated Report - Actual Release
Effects or contamination from 19 Aug 2004 23:00 UTC to 20 Aug 2004 05:00 UTC at or near ground level.
Source Location: 39.10613N, 84.54837W Material: particulate Comments: Release starting at 08/19/2004 23:00:00 UTC for 6 hr gridded met at 08/19/2004 21:00:00 UTC gridded met at 08/20/2004 00:00:00 UTC gridded met at 08/20/2004 03:00:00 UTC Not For Public Dissemination
Consequences and Actions
(g/m2) Area Extent
PopulationCasualtiesFatalities
Description
>1.00E-80.4 km2 n/a
343 n/a n/a
Possibly contaminated area. Use to confirm with monitoring surveys.
>1.00E-912.8 km2n/a
37,813 n/a n/a
Possibly contaminated area. Use to confirm with monitoring surveys.
>1.00E-1088.3 km2n/a
140,605 n/a n/a
Possibly contaminated area. Use to confirm with monitoring surveys.
Note: Areas and counts in the table are cumulative.
Map Size: 23.08 km by 23.08 km Id: Production.rcE12286.rcC12215.0 NARAC Operations: [email protected]; (925) 424-6465 Requested by: { Michael Dillon; NARAC Operations }
September 14, 2004 Page 17

Max 10-min Air Conc over 1 hr at 20Aug 0000 UTC
Set 2: Hourly 10 min Peak AveragesAutomated Report - Actual Release
Effects or contamination from 19 Aug 2004 23:00 UTC to 20 Aug 2004 00:00 UTC at or near ground level.
Source Location: 39.10613N, 84.54837W Material: BENZENE Comments: Release starting at 08/19/2004 23:00:00 UTC for 12 hr met obs at 08/19/2004 23:00:00 UTC met obs at 08/20/2004 00:00:00 UTC met obs at 08/20/2004 01:00:00 UTC met obs at 08/20/2004 02:00:00 UTC Not For Public Dissemination
Consequences and Actions
(ppm) Area Extent
PopulationCasualtiesFatalities
Description
>1.0 5.0 km2n/a
12,191 n/a n/a
Below health effect level
>0.1 17.9 km2n/a
45,177 n/a n/a
Below health effect level
>0.01 36.3 km2n/a
82,541 n/a n/a
Below health effect level
Note: Areas and counts in the table are cumulative.
Map Size: 12.3 km by 12.3 km Id: Production.rcE12286.rcC12215.1 NARAC Operations: [email protected]; (925) 424-6465 Requested by: { Michael Dillon; NARAC Operations }
September 14, 2004 Page 18

Max 10-min Air Conc over 1 hr at 20Aug 0100 UTC
Set 2: Hourly 10 min Peak AveragesAutomated Report - Actual Release
Effects or contamination from 20 Aug 2004 00:00 UTC to 20 Aug 2004 01:00 UTC at or near ground level.
Source Location: 39.10613N, 84.54837W Material: BENZENE Comments: Release starting at 08/19/2004 23:00:00 UTC for 12 hr met obs at 08/19/2004 23:00:00 UTC met obs at 08/20/2004 00:00:00 UTC met obs at 08/20/2004 01:00:00 UTC met obs at 08/20/2004 02:00:00 UTC Not For Public Dissemination
Consequences and Actions
(ppm) Area Extent
PopulationCasualtiesFatalities
Description
>1.0 12.6 km2n/a
27,998 n/a n/a
Below health effect level
>0.1 82.7 km2n/a
113,759 n/a n/a
Below health effect level
>0.01 136 km2n/a
178,972 n/a n/a
Below health effect level
Note: Areas and counts in the table are cumulative.
Map Size: 21.68 km by 21.68 km Id: Production.rcE12286.rcC12215.1 NARAC Operations: [email protected]; (925) 424-6465 Requested by: { Michael Dillon; NARAC Operations }
September 14, 2004 Page 19

Max 10-min Air Conc over 1 hr at 20Aug 0200 UTC
Set 2: Hourly 10 min Peak AveragesAutomated Report - Actual Release
Effects or contamination from 20 Aug 2004 01:00 UTC to 20 Aug 2004 02:00 UTC at or near ground level.
Source Location: 39.10613N, 84.54837W Material: BENZENE Comments: Release starting at 08/19/2004 23:00:00 UTC for 12 hr met obs at 08/19/2004 23:00:00 UTC met obs at 08/20/2004 00:00:00 UTC met obs at 08/20/2004 01:00:00 UTC met obs at 08/20/2004 02:00:00 UTC Not For Public Dissemination
Consequences and Actions
(ppm) Area Extent
PopulationCasualtiesFatalities
Description
>1.0 17.8 km2n/a
29,427 n/a n/a
Below health effect level
>0.1 114 km2n/a
145,370 n/a n/a
Below health effect level
>0.01 176 km2n/a
214,326 n/a n/a
Below health effect level
Note: Areas and counts in the table are cumulative.
Map Size: 23.35 km by 23.35 km Id: Production.rcE12286.rcC12215.1 NARAC Operations: [email protected]; (925) 424-6465 Requested by: { Michael Dillon; NARAC Operations }
September 14, 2004 Page 20

Max 10-min Air Conc over 1 hr at 20Aug 0300 UTC
Set 2: Hourly 10 min Peak AveragesAutomated Report - Actual Release
Effects or contamination from 20 Aug 2004 02:00 UTC to 20 Aug 2004 03:00 UTC at or near ground level.
Source Location: 39.10613N, 84.54837W Material: BENZENE Comments: Release starting at 08/19/2004 23:00:00 UTC for 12 hr met obs at 08/19/2004 23:00:00 UTC met obs at 08/20/2004 00:00:00 UTC met obs at 08/20/2004 01:00:00 UTC met obs at 08/20/2004 02:00:00 UTC Not For Public Dissemination
Consequences and Actions
(ppm) Area Extent
PopulationCasualtiesFatalities
Description
>1.0 18.8 km2n/a
44,825 n/a n/a
Below health effect level
>0.1 100 km2n/a
170,339 n/a n/a
Below health effect level
>0.01 192 km2n/a
253,037 n/a n/a
Below health effect level
Note: Areas and counts in the table are cumulative.
Map Size: 23.99 km by 23.99 km Id: Production.rcE12286.rcC12215.1 NARAC Operations: [email protected]; (925) 424-6465 Requested by: { Michael Dillon; NARAC Operations }
September 14, 2004 Page 21

Max 10-min Air Conc over 1 hr at 20Aug 0400 UTC
Set 2: Hourly 10 min Peak AveragesAutomated Report - Actual Release
Effects or contamination from 20 Aug 2004 03:00 UTC to 20 Aug 2004 04:00 UTC at or near ground level.
Source Location: 39.10613N, 84.54837W Material: BENZENE Comments: Release starting at 08/19/2004 23:00:00 UTC for 12 hr met obs at 08/19/2004 23:00:00 UTC met obs at 08/20/2004 00:00:00 UTC met obs at 08/20/2004 01:00:00 UTC met obs at 08/20/2004 02:00:00 UTC Not For Public Dissemination
Consequences and Actions
(ppm) Area Extent
PopulationCasualtiesFatalities
Description
>1.0 13.4 km2n/a
29,721 n/a n/a
Below health effect level
>0.1 43.3 km2n/a
87,371 n/a n/a
Below health effect level
>0.01 120 km2n/a
174,399 n/a n/a
Below health effect level
Note: Areas and counts in the table are cumulative.
Map Size: 23.12 km by 23.12 km Id: Production.rcE12286.rcC12215.1 NARAC Operations: [email protected]; (925) 424-6465 Requested by: { Michael Dillon; NARAC Operations }
September 14, 2004 Page 22

Max 10-min Air Conc over 1 hr at 20Aug 0500 UTC
Set 2: Hourly 10 min Peak AveragesAutomated Report - Actual Release
Effects or contamination from 20 Aug 2004 04:00 UTC to 20 Aug 2004 05:00 UTC at or near ground level.
Source Location: 39.10613N, 84.54837W Material: BENZENE Comments: Release starting at 08/19/2004 23:00:00 UTC for 12 hr met obs at 08/19/2004 23:00:00 UTC met obs at 08/20/2004 00:00:00 UTC met obs at 08/20/2004 01:00:00 UTC met obs at 08/20/2004 02:00:00 UTC Not For Public Dissemination
Consequences and Actions
(ppm) Area Extent
PopulationCasualtiesFatalities
Description
>1.0 9.8 km2n/a
19,389 n/a n/a
Below health effect level
>0.1 36.1 km2n/a
58,006 n/a n/a
Below health effect level
>0.01 85.1 km2n/a
111,358 n/a n/a
Below health effect level
Note: Areas and counts in the table are cumulative.
Map Size: 23.42 km by 23.42 km Id: Production.rcE12286.rcC12215.1 NARAC Operations: [email protected]; (925) 424-6465 Requested by: { Michael Dillon; NARAC Operations }
September 14, 2004 Page 23

Max 10-min Air Conc over 1 hr at 20Aug 0600 UTC
Set 2: Hourly 10 min Peak AveragesAutomated Report - Actual Release
Effects or contamination from 20 Aug 2004 05:00 UTC to 20 Aug 2004 06:00 UTC at or near ground level.
Source Location: 39.10613N, 84.54837W Material: BENZENE Comments: Release starting at 08/19/2004 23:00:00 UTC for 12 hr met obs at 08/19/2004 23:00:00 UTC met obs at 08/20/2004 00:00:00 UTC met obs at 08/20/2004 01:00:00 UTC met obs at 08/20/2004 02:00:00 UTC Not For Public Dissemination
Consequences and Actions
(ppm) Area Extent
PopulationCasualtiesFatalities
Description
>1.0 8.3 km2n/a
18,561 n/a n/a
Below health effect level
>0.1 37.7 km2n/a
62,156 n/a n/a
Below health effect level
>0.01 66.2 km2n/a
102,881 n/a n/a
Below health effect level
Note: Areas and counts in the table are cumulative.
Map Size: 21.81 km by 21.81 km Id: Production.rcE12286.rcC12215.1 NARAC Operations: [email protected]; (925) 424-6465 Requested by: { Michael Dillon; NARAC Operations }
September 14, 2004 Page 24

Max 10-min Air Conc over 1 hr at 20Aug 0700 UTC
Set 2: Hourly 10 min Peak AveragesAutomated Report - Actual Release
Effects or contamination from 20 Aug 2004 06:00 UTC to 20 Aug 2004 07:00 UTC at or near ground level.
Source Location: 39.10613N, 84.54837W Material: BENZENE Comments: Release starting at 08/19/2004 23:00:00 UTC for 12 hr met obs at 08/19/2004 23:00:00 UTC met obs at 08/20/2004 00:00:00 UTC met obs at 08/20/2004 01:00:00 UTC met obs at 08/20/2004 02:00:00 UTC Not For Public Dissemination
Consequences and Actions
(ppm) Area Extent
PopulationCasualtiesFatalities
Description
>1.0 9.0 km2n/a
19,572 n/a n/a
Below health effect level
>0.1 34.2 km2n/a
59,495 n/a n/a
Below health effect level
>0.01 54.5 km2n/a
92,712 n/a n/a
Below health effect level
Note: Areas and counts in the table are cumulative.
Map Size: 13.19 km by 13.19 km Id: Production.rcE12286.rcC12215.1 NARAC Operations: [email protected]; (925) 424-6465 Requested by: { Michael Dillon; NARAC Operations }
September 14, 2004 Page 25

Max 10-min Air Conc over 1 hr at 20Aug 0800 UTC
Set 2: Hourly 10 min Peak AveragesAutomated Report - Actual Release
Effects or contamination from 20 Aug 2004 07:00 UTC to 20 Aug 2004 08:00 UTC at or near ground level.
Source Location: 39.10613N, 84.54837W Material: BENZENE Comments: Release starting at 08/19/2004 23:00:00 UTC for 12 hr met obs at 08/19/2004 23:00:00 UTC met obs at 08/20/2004 00:00:00 UTC met obs at 08/20/2004 01:00:00 UTC met obs at 08/20/2004 02:00:00 UTC Not For Public Dissemination
Consequences and Actions
(ppm) Area Extent
PopulationCasualtiesFatalities
Description
>1.0 9.1 km2n/a
19,449 n/a n/a
Below health effect level
>0.1 36.3 km2n/a
58,298 n/a n/a
Below health effect level
>0.01 62.4 km2n/a
99,153 n/a n/a
Below health effect level
Note: Areas and counts in the table are cumulative.
Map Size: 15.29 km by 15.29 km Id: Production.rcE12286.rcC12215.1 NARAC Operations: [email protected]; (925) 424-6465 Requested by: { Michael Dillon; NARAC Operations }
September 14, 2004 Page 26

Max 10-min Air Conc over 1 hr at 20Aug 0900 UTC
Set 2: Hourly 10 min Peak AveragesAutomated Report - Actual Release
Effects or contamination from 20 Aug 2004 08:00 UTC to 20 Aug 2004 09:00 UTC at or near ground level.
Source Location: 39.10613N, 84.54837W Material: BENZENE Comments: Release starting at 08/19/2004 23:00:00 UTC for 12 hr met obs at 08/19/2004 23:00:00 UTC met obs at 08/20/2004 00:00:00 UTC met obs at 08/20/2004 01:00:00 UTC met obs at 08/20/2004 02:00:00 UTC Not For Public Dissemination
Consequences and Actions
(ppm) Area Extent
PopulationCasualtiesFatalities
Description
>1.0 8.3 km2n/a
18,099 n/a n/a
Below health effect level
>0.1 38.5 km2n/a
62,557 n/a n/a
Below health effect level
>0.01 60.6 km2n/a
95,038 n/a n/a
Below health effect level
Note: Areas and counts in the table are cumulative.
Map Size: 15.39 km by 15.39 km Id: Production.rcE12286.rcC12215.1 NARAC Operations: [email protected]; (925) 424-6465 Requested by: { Michael Dillon; NARAC Operations }
September 14, 2004 Page 27

Max 10-min Air Conc over 1 hr at 20Aug 1000 UTC
Set 2: Hourly 10 min Peak AveragesAutomated Report - Actual Release
Effects or contamination from 20 Aug 2004 09:00 UTC to 20 Aug 2004 10:00 UTC at or near ground level.
Source Location: 39.10613N, 84.54837W Material: BENZENE Comments: Release starting at 08/19/2004 23:00:00 UTC for 12 hr met obs at 08/19/2004 23:00:00 UTC met obs at 08/20/2004 00:00:00 UTC met obs at 08/20/2004 01:00:00 UTC met obs at 08/20/2004 02:00:00 UTC Not For Public Dissemination
Consequences and Actions
(ppm) Area Extent
PopulationCasualtiesFatalities
Description
>1.0 9.8 km2n/a
20,452 n/a n/a
Below health effect level
>0.1 35.5 km2n/a
60,403 n/a n/a
Below health effect level
>0.01 56.5 km2n/a
89,030 n/a n/a
Below health effect level
Note: Areas and counts in the table are cumulative.
Map Size: 14.41 km by 14.41 km Id: Production.rcE12286.rcC12215.1 NARAC Operations: [email protected]; (925) 424-6465 Requested by: { Michael Dillon; NARAC Operations }
September 14, 2004 Page 28

Max 10-min Air Conc over 1 hr at 20Aug 1100 UTC
Set 2: Hourly 10 min Peak AveragesAutomated Report - Actual Release
Effects or contamination from 20 Aug 2004 10:00 UTC to 20 Aug 2004 11:00 UTC at or near ground level.
Source Location: 39.10613N, 84.54837W Material: BENZENE Comments: Release starting at 08/19/2004 23:00:00 UTC for 12 hr met obs at 08/19/2004 23:00:00 UTC met obs at 08/20/2004 00:00:00 UTC met obs at 08/20/2004 01:00:00 UTC met obs at 08/20/2004 02:00:00 UTC Not For Public Dissemination
Consequences and Actions
(ppm) Area Extent
PopulationCasualtiesFatalities
Description
>1.0 9.7 km2n/a
20,399 n/a n/a
Below health effect level
>0.1 35.1 km2n/a
59,933 n/a n/a
Below health effect level
>0.01 55.6 km2n/a
87,022 n/a n/a
Below health effect level
Note: Areas and counts in the table are cumulative.
Map Size: 13.79 km by 13.79 km Id: Production.rcE12286.rcC12215.1 NARAC Operations: [email protected]; (925) 424-6465 Requested by: { Michael Dillon; NARAC Operations }
September 14, 2004 Page 29

Max 10-min Air Conc over 1 hr at 20Aug 0000 UTC
Set 3: Benzene off at 2am EDTBenzene off at 2am EDT - Actual Release
Effects or contamination from 19 Aug 2004 23:00 UTC to 20 Aug 2004 00:00 UTC at or near ground level.
Source Location: 39.10613N, 84.54837W Material: BENZENE Comments: 7500 kg/hr of Benzene released over 7hr. (Source off at 2am EDT) Hourly met observations throughout run duration. Not For Public Dissemination
Consequences and Actions
(ppm) Area Extent
PopulationCasualtiesFatalities
Description
>5.0 0.3 km2n/a
26 n/a n/a
>10% of ERPG-1
>0.5 10.0 km2n/a
25,025 n/a n/a
>1% of ERPG-1
Note: Areas and counts in the table are cumulative.
Map Size: 7.4 km by 7.4 km Id: Production.rcE12286.rcC12215.2 NARAC Operations: [email protected]; (925) 424-6465 Requested by: { Michael Dillon; NARAC Operations }
September 14, 2004 Page 30

Max 10-min Air Conc over 1 hr at 20Aug 0100 UTC
Set 3: Benzene off at 2am EDTBenzene off at 2am EDT - Actual Release
Effects or contamination from 20 Aug 2004 00:00 UTC to 20 Aug 2004 01:00 UTC at or near ground level.
Source Location: 39.10613N, 84.54837W Material: BENZENE Comments: 7500 kg/hr of Benzene released over 7hr. (Source off at 2am EDT) Hourly met observations throughout run duration. Not For Public Dissemination
Consequences and Actions
(ppm) Area Extent
PopulationCasualtiesFatalities
Description
>5.0 0.2 km2n/a
1 n/a n/a
>10% of ERPG-1
>0.5 26.5 km2n/a
55,782 n/a n/a
>1% of ERPG-1
Note: Areas and counts in the table are cumulative.
Map Size: 12.26 km by 12.26 km Id: Production.rcE12286.rcC12215.2 NARAC Operations: [email protected]; (925) 424-6465 Requested by: { Michael Dillon; NARAC Operations }
September 14, 2004 Page 31

Max 10-min Air Conc over 1 hr at 20Aug 0200 UTC
Set 3: Benzene off at 2am EDTBenzene off at 2am EDT - Actual Release
Effects or contamination from 20 Aug 2004 01:00 UTC to 20 Aug 2004 02:00 UTC at or near ground level.
Source Location: 39.10613N, 84.54837W Material: BENZENE Comments: 7500 kg/hr of Benzene released over 7hr. (Source off at 2am EDT) Hourly met observations throughout run duration. Not For Public Dissemination
Consequences and Actions
(ppm) Area Extent
PopulationCasualtiesFatalities
Description
>5.0 0.5 km2n/a
318 n/a n/a
>10% of ERPG-1
>0.5 29.9 km2n/a
48,419 n/a n/a
>1% of ERPG-1
Note: Areas and counts in the table are cumulative.
Map Size: 12.06 km by 12.06 km Id: Production.rcE12286.rcC12215.2 NARAC Operations: [email protected]; (925) 424-6465 Requested by: { Michael Dillon; NARAC Operations }
September 14, 2004 Page 32

Max 10-min Air Conc over 1 hr at 20Aug 0300 UTC
Set 3: Benzene off at 2am EDTBenzene off at 2am EDT - Actual Release
Effects or contamination from 20 Aug 2004 02:00 UTC to 20 Aug 2004 03:00 UTC at or near ground level.
Source Location: 39.10613N, 84.54837W Material: BENZENE Comments: 7500 kg/hr of Benzene released over 7hr. (Source off at 2am EDT) Hourly met observations throughout run duration. Not For Public Dissemination
Consequences and Actions
(ppm) Area Extent
PopulationCasualtiesFatalities
Description
>5.0 1.5 km2n/a
823 n/a n/a
>10% of ERPG-1
>0.5 27.3 km2n/a
61,519 n/a n/a
>1% of ERPG-1
Note: Areas and counts in the table are cumulative.
Map Size: 8.68 km by 8.68 km Id: Production.rcE12286.rcC12215.2 NARAC Operations: [email protected]; (925) 424-6465 Requested by: { Michael Dillon; NARAC Operations }
September 14, 2004 Page 33
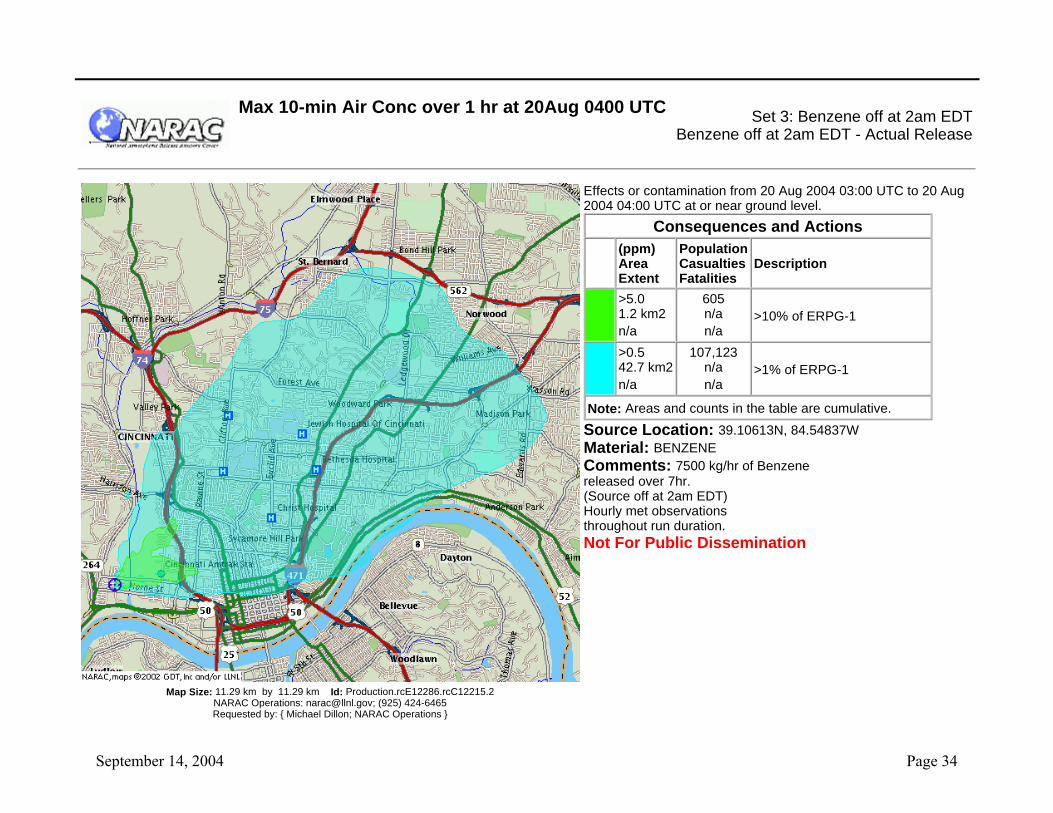
Max 10-min Air Conc over 1 hr at 20Aug 0400 UTC
Set 3: Benzene off at 2am EDTBenzene off at 2am EDT - Actual Release
Effects or contamination from 20 Aug 2004 03:00 UTC to 20 Aug 2004 04:00 UTC at or near ground level.
Source Location: 39.10613N, 84.54837W Material: BENZENE Comments: 7500 kg/hr of Benzene released over 7hr. (Source off at 2am EDT) Hourly met observations throughout run duration. Not For Public Dissemination
Consequences and Actions
(ppm) Area Extent
PopulationCasualtiesFatalities
Description
>5.0 1.2 km2n/a
605 n/a n/a
>10% of ERPG-1
>0.5 42.7 km2n/a
107,123 n/a n/a
>1% of ERPG-1
Note: Areas and counts in the table are cumulative.
Map Size: 11.29 km by 11.29 km Id: Production.rcE12286.rcC12215.2 NARAC Operations: [email protected]; (925) 424-6465 Requested by: { Michael Dillon; NARAC Operations }
September 14, 2004 Page 34

Max 10-min Air Conc over 1 hr at 20Aug 0500 UTC
Set 3: Benzene off at 2am EDTBenzene off at 2am EDT - Actual Release
Effects or contamination from 20 Aug 2004 04:00 UTC to 20 Aug 2004 05:00 UTC at or near ground level.
Source Location: 39.10613N, 84.54837W Material: BENZENE Comments: 7500 kg/hr of Benzene released over 7hr. (Source off at 2am EDT) Hourly met observations throughout run duration. Not For Public Dissemination
Consequences and Actions
(ppm) Area Extent
PopulationCasualtiesFatalities
Description
>5.0 0.4 km2n/a
275 n/a n/a
>10% of ERPG-1
>0.5 33.9 km2n/a
51,305 n/a n/a
>1% of ERPG-1
Note: Areas and counts in the table are cumulative.
Map Size: 18.86 km by 18.86 km Id: Production.rcE12286.rcC12215.2 NARAC Operations: [email protected]; (925) 424-6465 Requested by: { Michael Dillon; NARAC Operations }
September 14, 2004 Page 35

Max 10-min Air Conc over 1 hr at 20Aug 0600 UTC
Set 3: Benzene off at 2am EDTBenzene off at 2am EDT - Actual Release
Effects or contamination from 20 Aug 2004 05:00 UTC to 20 Aug 2004 06:00 UTC at or near ground level.
Source Location: 39.10613N, 84.54837W Material: BENZENE Comments: 7500 kg/hr of Benzene released over 7hr. (Source off at 2am EDT) Hourly met observations throughout run duration. Not For Public Dissemination
Consequences and Actions
(ppm) Area Extent
PopulationCasualtiesFatalities
Description
>5.0 1.5 km2n/a
891 n/a n/a
>10% of ERPG-1
>0.5 37.2 km2n/a
55,263 n/a n/a
>1% of ERPG-1
Note: Areas and counts in the table are cumulative.
Map Size: 14.59 km by 14.59 km Id: Production.rcE12286.rcC12215.2 NARAC Operations: [email protected]; (925) 424-6465 Requested by: { Michael Dillon; NARAC Operations }
September 14, 2004 Page 36

Max 10-min Air Conc over 1 hr at 20Aug 0700 UTC
Set 3: Benzene off at 2am EDTBenzene off at 2am EDT - Actual Release
Effects or contamination from 20 Aug 2004 06:00 UTC to 20 Aug 2004 07:00 UTC at or near ground level.
Source Location: 39.10613N, 84.54837W Material: BENZENE Comments: 7500 kg/hr of Benzene released over 7hr. (Source off at 2am EDT) Hourly met observations throughout run duration. Not For Public Dissemination
Consequences and Actions
(ppm) Area Extent
PopulationCasualtiesFatalities
Description
>0.5 17.2 km2n/a
18,982 n/a n/a
>1% of ERPG-1
Note: Areas and counts in the table are cumulative.
Map Size: 16.38 km by 16.38 km Id: Production.rcE12286.rcC12215.2 NARAC Operations: [email protected]; (925) 424-6465 Requested by: { Michael Dillon; NARAC Operations }
September 14, 2004 Page 37

Max 10-min Air Conc ovr 1 hr at 20Aug 1100 UTC
Set 4: Smoldering Plume scaled to measurement (8.6e6g)
Automated Report - Actual Release
Effects or contamination from 20 Aug 2004 10:00 UTC to 20 Aug 2004 11:00 UTC at or near ground level.
Source Location: 39.10613N, 84.54837W Material: BENZENE Comments: Release starting at 08/20/2004 10:00:00 UTC for 8 hr gridded met at 08/20/2004 04:00:00 UTC gridded met at 08/20/2004 05:00:00 UTC gridded met at 08/20/2004 06:00:00 UTC gridded met at 08/20/2004 07:00:00 UTC Not For Public Dissemination
Consequences and Actions
(ppm) Area Extent
PopulationCasualtiesFatalities
Description
>50 0.008 km2n/a
0 n/a n/a
>ERPG-1: Minor reversible health effects. Possible odor.
>5.0 0.3 km2 n/a
278 n/a n/a
> 10% of the ERPG -1
Note: Areas and counts in the table are cumulative.
Map Size: 1.08 km by 1.08 km Id: Production.rcE12286.rcC12215.3 NARAC Operations: [email protected]; (925) 424-6465 Requested by: { Michael Dillon; NARAC Operations }
September 14, 2004 Page 38

Max 10-min Air Conc ovr 1 hr at 20Aug 1200 UTC
Set 4: Smoldering Plume scaled to measurement (8.6e6g)
Automated Report - Actual Release
Effects or contamination from 20 Aug 2004 11:00 UTC to 20 Aug 2004 12:00 UTC at or near ground level.
Source Location: 39.10613N, 84.54837W Material: BENZENE Comments: Release starting at 08/20/2004 10:00:00 UTC for 8 hr gridded met at 08/20/2004 04:00:00 UTC gridded met at 08/20/2004 05:00:00 UTC gridded met at 08/20/2004 06:00:00 UTC gridded met at 08/20/2004 07:00:00 UTC Not For Public Dissemination
Consequences and Actions
(ppm) Area Extent
PopulationCasualtiesFatalities
Description
>50 0.006 km2n/a
0 n/a n/a
>ERPG-1: Minor reversible health effects. Possible odor.
>5.0 0.3 km2 n/a
251 n/a n/a
> 10% of the ERPG -1
Note: Areas and counts in the table are cumulative.
Map Size: 985.94 m by 985.94 m Id: Production.rcE12286.rcC12215.3 NARAC Operations: [email protected]; (925) 424-6465 Requested by: { Michael Dillon; NARAC Operations }
September 14, 2004 Page 39

Max 10-min Air Conc ovr 1 hr at 20Aug 1300 UTC
Set 4: Smoldering Plume scaled to measurement (8.6e6g)
Automated Report - Actual Release
Effects or contamination from 20 Aug 2004 12:00 UTC to 20 Aug 2004 13:00 UTC at or near ground level.
Source Location: 39.10613N, 84.54837W Material: BENZENE Comments: Release starting at 08/20/2004 10:00:00 UTC for 8 hr gridded met at 08/20/2004 04:00:00 UTC gridded met at 08/20/2004 05:00:00 UTC gridded met at 08/20/2004 06:00:00 UTC gridded met at 08/20/2004 07:00:00 UTC Not For Public Dissemination
Consequences and Actions
(ppm) Area Extent
PopulationCasualtiesFatalities
Description
>50 0.004 km2n/a
0 n/a n/a
>ERPG-1: Minor reversible health effects. Possible odor.
>5.0 0.2 km2 n/a
199 n/a n/a
> 10% of the ERPG -1
Note: Areas and counts in the table are cumulative.
Map Size: 959.99 m by 959.99 m Id: Production.rcE12286.rcC12215.3 NARAC Operations: [email protected]; (925) 424-6465 Requested by: { Michael Dillon; NARAC Operations }
September 14, 2004 Page 40

Max 10-min Air Conc ovr 1 hr at 20Aug 1400 UTC
Set 4: Smoldering Plume scaled to measurement (8.6e6g)
Automated Report - Actual Release
Effects or contamination from 20 Aug 2004 13:00 UTC to 20 Aug 2004 14:00 UTC at or near ground level.
Source Location: 39.10613N, 84.54837W Material: BENZENE Comments: Release starting at 08/20/2004 10:00:00 UTC for 8 hr gridded met at 08/20/2004 04:00:00 UTC gridded met at 08/20/2004 05:00:00 UTC gridded met at 08/20/2004 06:00:00 UTC gridded met at 08/20/2004 07:00:00 UTC Not For Public Dissemination
Consequences and Actions
(ppm) Area Extent
PopulationCasualtiesFatalities
Description
>50 0.001 km2n/a
1 n/a n/a
>ERPG-1: Minor reversible health effects. Possible odor.
>5.0 0.1 km2 n/a
159 n/a n/a
> 10% of the ERPG -1
Note: Areas and counts in the table are cumulative.
Map Size: 693.5 m by 693.5 m Id: Production.rcE12286.rcC12215.3 NARAC Operations: [email protected]; (925) 424-6465 Requested by: { Michael Dillon; NARAC Operations }
September 14, 2004 Page 41

Max 10-min Air Conc ovr 1 hr at 20Aug 1500 UTC
Set 4: Smoldering Plume scaled to measurement (8.6e6g)
Automated Report - Actual Release
Effects or contamination from 20 Aug 2004 14:00 UTC to 20 Aug 2004 15:00 UTC at or near ground level.
Source Location: 39.10613N, 84.54837W Material: BENZENE Comments: Release starting at 08/20/2004 10:00:00 UTC for 8 hr gridded met at 08/20/2004 04:00:00 UTC gridded met at 08/20/2004 05:00:00 UTC gridded met at 08/20/2004 06:00:00 UTC gridded met at 08/20/2004 07:00:00 UTC Not For Public Dissemination
Consequences and Actions
(ppm) Area Extent
PopulationCasualtiesFatalities
Description
>5.0 0.05 km2n/a
29 n/a n/a
> 10% of the ERPG -1
Note: Areas and counts in the table are cumulative.
Map Size: 458.01 m by 458.01 m Id: Production.rcE12286.rcC12215.3 NARAC Operations: [email protected]; (925) 424-6465 Requested by: { Michael Dillon; NARAC Operations }
September 14, 2004 Page 42

Max 10-min Air Conc ovr 1 hr at 20Aug 1600 UTC
Set 4: Smoldering Plume scaled to measurement (8.6e6g)
Automated Report - Actual Release
Effects or contamination from 20 Aug 2004 15:00 UTC to 20 Aug 2004 16:00 UTC at or near ground level.
Source Location: 39.10613N, 84.54837W Material: BENZENE Comments: Release starting at 08/20/2004 10:00:00 UTC for 8 hr gridded met at 08/20/2004 04:00:00 UTC gridded met at 08/20/2004 05:00:00 UTC gridded met at 08/20/2004 06:00:00 UTC gridded met at 08/20/2004 07:00:00 UTC Not For Public Dissemination
Consequences and Actions
(ppm) Area Extent
PopulationCasualtiesFatalities
Description
>5.0 0.04 km2n/a
32 n/a n/a
> 10% of the ERPG -1
Note: Areas and counts in the table are cumulative.
Map Size: 335.48 m by 335.48 m Id: Production.rcE12286.rcC12215.3 NARAC Operations: [email protected]; (925) 424-6465 Requested by: { Michael Dillon; NARAC Operations }
September 14, 2004 Page 43

Max 10-min Air Conc ovr 1 hr at 20Aug 1700 UTC
Set 4: Smoldering Plume scaled to measurement (8.6e6g)
Automated Report - Actual Release
Effects or contamination from 20 Aug 2004 16:00 UTC to 20 Aug 2004 17:00 UTC at or near ground level.
Source Location: 39.10613N, 84.54837W Material: BENZENE Comments: Release starting at 08/20/2004 10:00:00 UTC for 8 hr gridded met at 08/20/2004 04:00:00 UTC gridded met at 08/20/2004 05:00:00 UTC gridded met at 08/20/2004 06:00:00 UTC gridded met at 08/20/2004 07:00:00 UTC Not For Public Dissemination
Consequences and Actions
(ppm) Area Extent
PopulationCasualtiesFatalities
Description
>5.0 0.04 km2n/a
27 n/a n/a
> 10% of the ERPG -1
Note: Areas and counts in the table are cumulative.
Map Size: 356.11 m by 356.11 m Id: Production.rcE12286.rcC12215.3 NARAC Operations: [email protected]; (925) 424-6465 Requested by: { Michael Dillon; NARAC Operations }
September 14, 2004 Page 44

Max 10-min Air Conc ovr 1 hr at 20Aug 1800 UTC
Set 4: Smoldering Plume scaled to measurement (8.6e6g)
Automated Report - Actual Release
Effects or contamination from 20 Aug 2004 17:00 UTC to 20 Aug 2004 18:00 UTC at or near ground level.
Source Location: 39.10613N, 84.54837W Material: BENZENE Comments: Release starting at 08/20/2004 10:00:00 UTC for 8 hr gridded met at 08/20/2004 04:00:00 UTC gridded met at 08/20/2004 05:00:00 UTC gridded met at 08/20/2004 06:00:00 UTC gridded met at 08/20/2004 07:00:00 UTC Not For Public Dissemination
Consequences and Actions
(ppm) Area Extent
PopulationCasualtiesFatalities
Description
>5.0 0.03 km2n/a
27 n/a n/a
> 10% of the ERPG -1
Note: Areas and counts in the table are cumulative.
Map Size: 301.96 m by 301.96 m Id: Production.rcE12286.rcC12215.3 NARAC Operations: [email protected]; (925) 424-6465 Requested by: { Michael Dillon; NARAC Operations }
September 14, 2004 Page 45