limit of metastability for liquid and vapor phases of...
TRANSCRIPT

Limit of Metastability for Liquid and Vapor Phases of Water
Woo Jong Cho,1,2 Jaegil Kim,3 Joonho Lee,2 Thomas Keyes,4 John E. Straub,4 and Kwang S. Kim1,*
1Department of Chemistry, Ulsan National Institute of Science and Technology (UNIST), Ulsan 689-798, Korea2Department of Chemistry, Pohang University of Science and Technology, Pohang 790-784, Korea
3Broad Institute of MIT and Harvard, Cambridge, Massachusetts 02142, USA4Department of Chemistry, Boston University, Boston, Massachusetts 02215, USA
(Received 14 September 2013; published 16 April 2014)
We report the limits of superheating of water and supercooling of vapor from Monte Carlo simulationsusing microscopic models with configurational enthalpy as the order parameter. The superheating limit iswell reproduced. The vapor is predicted to undergo spinodal decomposition at a temperature of Tvap
sp ¼46� 10 °C (0 °C ≪ Tvap
sp ≪ 100 °C) under 1 atm. The water-water network begins to form at thesupercooling limit of the vapor. Three-dimensional water-water and cavity-cavity unbroken networksare interwoven at critically superheated liquid water; if either network breaks, the metastable state changesto liquid or vapor.
DOI: 10.1103/PhysRevLett.112.157802 PACS numbers: 61.20.Ja, 64.60.Q−, 64.70.F−
Water is presumably the most used and the most studiedsubstance among all the chemicals known to mankind. Inparticular, scientists have been attracted to the diversestructures of water clusters, liquid, and ice resulting fromdifferent orientations of hydrogen bonds and the associatedphenomena [1–14]. However, the liquid-vapor transition ofwater has been a subject of less intense investigation[15,16] because of difficulties in both experiment andcomputation due to the complicated metastable statesseparating the liquid and vapor phases. Given that everydaylife experiences water evaporation and dew drops, it isironic that these physical or chemical phenomena are notadequately understood. Simply, we are familiar with thegenerally learned fact that water boils at 100 °C or 373 K at1 atm. However, water can be superheated up to 603 K at1 atm, and water vapor can be supercooled considerablybelow the boiling point [17–21] though the limit ofsupercooling is not known yet. This is due to unfavorableenergetics at the formation of the liquid-vapor interface,which allow for the temporary existence of metastablestates. According to the classical nucleation theory, themetastable states can be kept stable until stochastic fluc-tuations create the so-called critical cluster, which thengrows spontaneously to make a new phase [22].However, these metastable states cease to exist when the
liquid or vapor is brought to its stability limit, or spinodal.In this case, where the mother phase completely loses itsthermodynamic stability, the phase transition takes placevia spinodal decomposition [23]. It differs from classicalnucleation in which the phase transition takes place atlocalized regions of space. Instead, the phase transition isconsidered to proceed by merging small embryos ofdaughter phase distributed uniformly over the space[24]. The lifetime of systems near the stability limit istoo short to allow for accurate experimental determination
of the spinodal. Hence, predicting the stability limit from amicroscopic model of matter is of immense importance,given that there are a plethora of phenomena depending onthe metastability throughout biology, meteorology, andindustry [22].In this Letter, based on targeted sampling of metastable
and unstable states which are inaccessible to ordinaryMonte Carlo simulations, with the choice of configura-tional enthalpy as the order parameter, for the first time, wereport the limits of metastable states, or spinodals, obtainedfrommicroscopic models of water. The liquid can be heatedup to the liquid spinodal temperature without losing theconnectedness among water molecules while forming a fullspace-spanning connected network of cavity space arisingfrom density fluctuations. On the other hand, at the vaporspinodal temperature (the minimum temperature to whichthe metastable vapor phase extends), the water-water net-work of small liquid clusters (i.e., clusterization) just startsto develop in the vapor.To this end, using the generalized replica exchange
method (GREM) [25,26], we have performed umbrellasampling for a number of enthalpy windows, with athermometer in each window. The average temperatureTS, thus measured, as a function of configurationalenthalpy H and pressure p in the isobaric-isenthalpicensemble, is the statistical temperature TSðH;pÞ≡ð∂S=∂HÞ−1p , which is a system’s intrinsic property. Theentropy SðH;pÞ in this ensemble is expressed as
SðH;pÞ ¼ kB lnZ
dVdxNδðH − EðxNÞ − pVÞ; (1)
where V is the volume, xN is a possible configuration of Nmolecules, and kB is the Boltzmann constant. The stabilitycondition ð∂2S=∂H2Þp<0 is equivalent to ð∂TS=∂HÞp>0.
PRL 112, 157802 (2014) P HY S I CA L R EV I EW LE T T ER Sweek ending
18 APRIL 2014
0031-9007=14=112(15)=157802(5) 157802-1 © 2014 American Physical Society
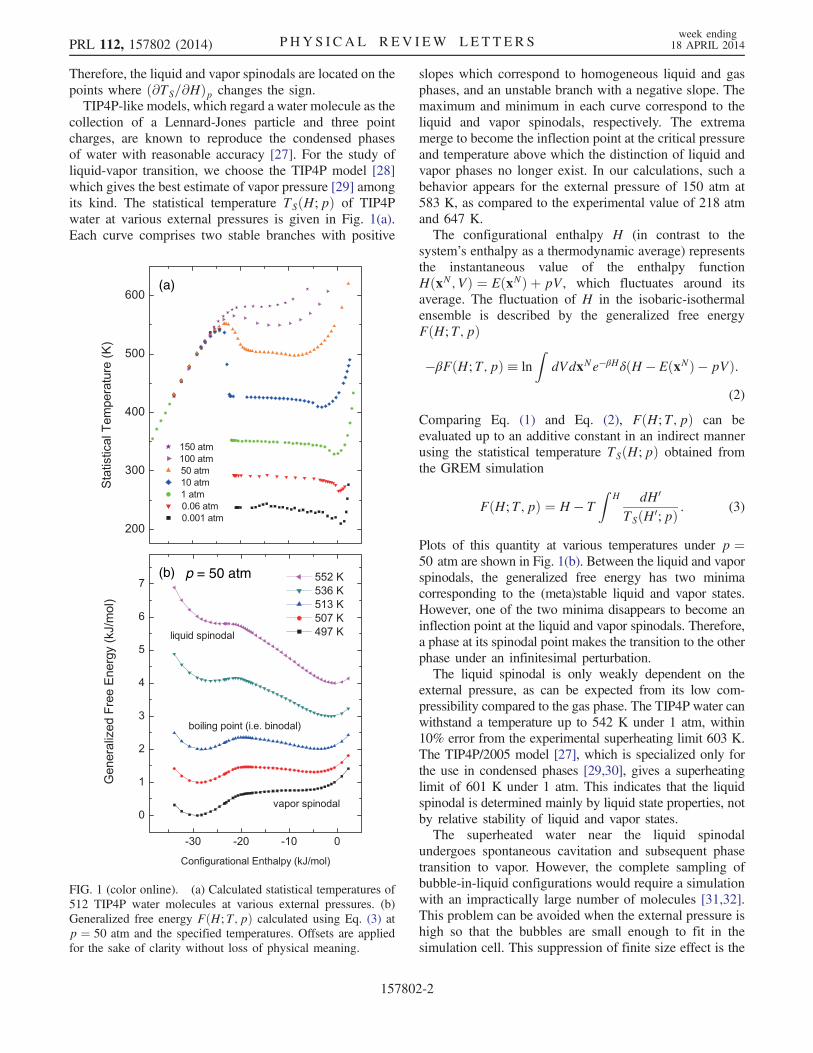
Therefore, the liquid and vapor spinodals are located on thepoints where ð∂TS=∂HÞp changes the sign.TIP4P-like models, which regard a water molecule as the
collection of a Lennard-Jones particle and three pointcharges, are known to reproduce the condensed phasesof water with reasonable accuracy [27]. For the study ofliquid-vapor transition, we choose the TIP4P model [28]which gives the best estimate of vapor pressure [29] amongits kind. The statistical temperature TSðH;pÞ of TIP4Pwater at various external pressures is given in Fig. 1(a).Each curve comprises two stable branches with positive
slopes which correspond to homogeneous liquid and gasphases, and an unstable branch with a negative slope. Themaximum and minimum in each curve correspond to theliquid and vapor spinodals, respectively. The extremamerge to become the inflection point at the critical pressureand temperature above which the distinction of liquid andvapor phases no longer exist. In our calculations, such abehavior appears for the external pressure of 150 atm at583 K, as compared to the experimental value of 218 atmand 647 K.The configurational enthalpy H (in contrast to the
system’s enthalpy as a thermodynamic average) representsthe instantaneous value of the enthalpy functionHðxN; VÞ ¼ EðxNÞ þ pV, which fluctuates around itsaverage. The fluctuation of H in the isobaric-isothermalensemble is described by the generalized free energyFðH;T; pÞ
−βFðH;T; pÞ≡ lnZ
dVdxNe−βHδðH − EðxNÞ − pVÞ:(2)
Comparing Eq. (1) and Eq. (2), FðH;T; pÞ can beevaluated up to an additive constant in an indirect mannerusing the statistical temperature TSðH;pÞ obtained fromthe GREM simulation
FðH;T; pÞ ¼ H − TZ
H dH0
TSðH0;pÞ : (3)
Plots of this quantity at various temperatures under p ¼50 atm are shown in Fig. 1(b). Between the liquid and vaporspinodals, the generalized free energy has two minimacorresponding to the (meta)stable liquid and vapor states.However, one of the two minima disappears to become aninflection point at the liquid and vapor spinodals. Therefore,a phase at its spinodal point makes the transition to the otherphase under an infinitesimal perturbation.The liquid spinodal is only weakly dependent on the
external pressure, as can be expected from its low com-pressibility compared to the gas phase. The TIP4P water canwithstand a temperature up to 542 K under 1 atm, within10% error from the experimental superheating limit 603 K.The TIP4P/2005 model [27], which is specialized only forthe use in condensed phases [29,30], gives a superheatinglimit of 601 K under 1 atm. This indicates that the liquidspinodal is determined mainly by liquid state properties, notby relative stability of liquid and vapor states.The superheated water near the liquid spinodal
undergoes spontaneous cavitation and subsequent phasetransition to vapor. However, the complete sampling ofbubble-in-liquid configurations would require a simulationwith an impractically large number of molecules [31,32].This problem can be avoided when the external pressure ishigh so that the bubbles are small enough to fit in thesimulation cell. This suppression of finite size effect is the
(a)
(b) p = 50 atm
FIG. 1 (color online). (a) Calculated statistical temperatures of512 TIP4P water molecules at various external pressures. (b)Generalized free energy FðH;T; pÞ calculated using Eq. (3) atp ¼ 50 atm and the specified temperatures. Offsets are appliedfor the sake of clarity without loss of physical meaning.
PRL 112, 157802 (2014) P HY S I CA L R EV I EW LE T T ER Sweek ending
18 APRIL 2014
157802-2

reason why smooth statistical temperature curves appear athigh pressures. The average density of critically super-heated water at 1 atm is found to be about 0.5 g=cm3. Thisdecrease in density can be explained by the frequentintervention of cavities in the liquid structure, as can beconfirmed by the radial distribution function (RDF) and thesubstantial fluctuation (see the Supplemental Material[33]). The RDF shows that the long-range order is almostsmeared out in the superheated water as compared to waterat ambient conditions. The fluctuation analysis reveals thatcavities as large as 10 Å in diameter form occasionally.However, the above analysis of the cavity space is rather
indirect. To quantify the network of cavity space appearingwithin the sampled configurations, we coarse-grained thesimulation cell into small cubes of liquid and cavity.Clustering of neighboring points is performed, and theconnectivity pc, defined in Eq. (4), is calculated for eachliquid and cavity lattice
pc ≡ 1
N2
XNi¼1
i2ni; (4)
where N, i, and ni are the total number of liquid or cavitylattice points, cluster size, and number of i-sized clusters,respectively. It is defined in such a way that big clusterscontribute more to the connectivity. The ensemble averageof connectivities of liquid and cavity lattices are calculatedfor coarse-grained configurations generated from the sim-ulation at 50 atm. Figure 2 shows the average connectivity
of liquid and cavity as the system is moved along thestatistical temperature curve. The liquid spinodal can beunderstood as the point from which the network of liquidwater starts to fragment into many pieces. The thermody-namic stability of water terminates at the liquid spinodal.Approaching from the vapor side, the vapor spinodal can beunderstood as the point where the recovery of liquidconnectivity begins, consistent with the traditional thermo-dynamic argument.Since the vapor spinodal is experimentally unknown,
we attempt to find the upper and lower bounds using twodifferent water models, namely the TIP4P and Matsuoka-Clementi-Yoshimine (MCY) [44] models. The TIP4Pmodel is fitted to the liquid phase, and thus exaggeratesthe dipole moment (2.18 D) from its gas-phase value1.86 D [45]. On the other hand, the MCY model is fittedto the ab initio potential energy surface of water dimer.Therefore, it has a tendency to underestimate the bindingenergy of a cluster [46]. On this ground, another set ofGREM simulations is performed to obtain the vaporspinodal temperatures of the MCY model in a wide rangeof external pressure. The calculated vapor spinodal ofTIP4P and MCY models are shown in Fig. 3(a), where itcan be seen that, upon isobaric cooling, the TIP4P vaporundergoes spinodal decomposition earlier (i.e., at highertemperature) than MCY vapor does. The critical super-saturation ratio to induce spinodal decomposition iscalculated from the simulated vapor spinodals and theexperimental vapor pressure of water, and shown in theinset of Fig. 3(a). Here, we expect that the true vaporspinodal of water lies in between that of TIP4P and MCYmodels, since the system is composed of small andintermediate-sized clusters as shown in Fig. 3(b). Forexample, water vapor at 1.0 atm (equilibrium vaporpressure at 100 °C) undergoes spinodal decompositionwhen supercooled to 46�10°C (319� 10 K). Currently,available experimental data [20,21] on the nucleation rate ofsupersaturated vapor do not cover the supersaturation rangewhere the spinodal decomposition is predicted to occur.Now, we turn our attention on the cluster distribution of
different enthalpy windows. The average mass fraction ofi-sized clusters fi is calculated in Fig. 3(b) using thedefinition fi ≡ ini=N where N is the total number ofmolecules, i is the cluster size, and ni is the number ofi-sized clusters. The cluster fraction has a peak for low-enthalpy ensembles, and this peak broadens as the system ismoved to high enthalpies, until it disappears at the vaporspinodal. This can be regarded as the transition fromclassical nucleation to the spinodal decomposition. Wenote that the critical nucleus does not diverge at thespinodal, consistent with the previous experimentalfindings [47].The process of liquid-vapor phase transition can be
visualized by showing representative snapshots of configu-rations along the statistical temperature curve (Fig. 4).
(a) (b)
FIG. 2 (color online). The connectivity index pc is averagedover 10 000 coarse-grained configurations obtained from thesimulation of 512 TIP4P waters under 50 atm. The vertical dottedlines represent (a) liquid at liquid spinodal temperature and(b) vapor at vapor spinodal temperature.
PRL 112, 157802 (2014) P HY S I CA L R EV I EW LE T T ER Sweek ending
18 APRIL 2014
157802-3
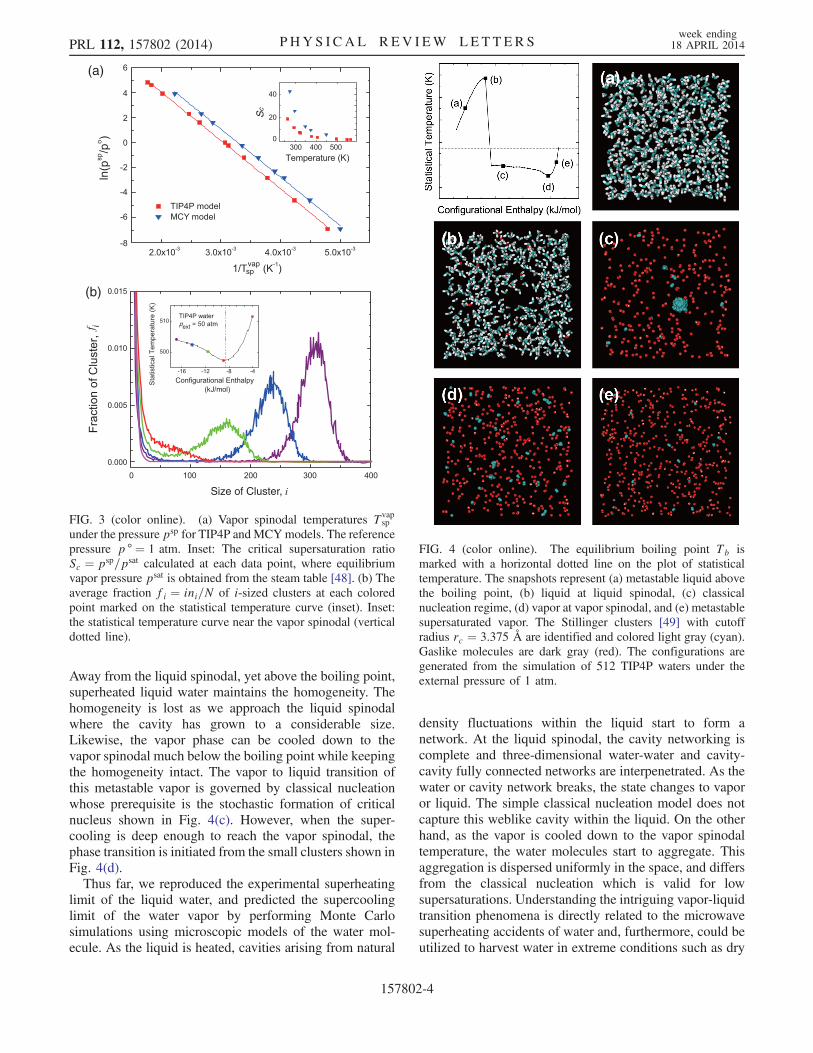
Away from the liquid spinodal, yet above the boiling point,superheated liquid water maintains the homogeneity. Thehomogeneity is lost as we approach the liquid spinodalwhere the cavity has grown to a considerable size.Likewise, the vapor phase can be cooled down to thevapor spinodal much below the boiling point while keepingthe homogeneity intact. The vapor to liquid transition ofthis metastable vapor is governed by classical nucleationwhose prerequisite is the stochastic formation of criticalnucleus shown in Fig. 4(c). However, when the super-cooling is deep enough to reach the vapor spinodal, thephase transition is initiated from the small clusters shown inFig. 4(d).Thus far, we reproduced the experimental superheating
limit of the liquid water, and predicted the supercoolinglimit of the water vapor by performing Monte Carlosimulations using microscopic models of the water mol-ecule. As the liquid is heated, cavities arising from natural
density fluctuations within the liquid start to form anetwork. At the liquid spinodal, the cavity networking iscomplete and three-dimensional water-water and cavity-cavity fully connected networks are interpenetrated. As thewater or cavity network breaks, the state changes to vaporor liquid. The simple classical nucleation model does notcapture this weblike cavity within the liquid. On the otherhand, as the vapor is cooled down to the vapor spinodaltemperature, the water molecules start to aggregate. Thisaggregation is dispersed uniformly in the space, and differsfrom the classical nucleation which is valid for lowsupersaturations. Understanding the intriguing vapor-liquidtransition phenomena is directly related to the microwavesuperheating accidents of water and, furthermore, could beutilized to harvest water in extreme conditions such as dry
FIG. 4 (color online). The equilibrium boiling point Tb ismarked with a horizontal dotted line on the plot of statisticaltemperature. The snapshots represent (a) metastable liquid abovethe boiling point, (b) liquid at liquid spinodal, (c) classicalnucleation regime, (d) vapor at vapor spinodal, and (e) metastablesupersaturated vapor. The Stillinger clusters [49] with cutoffradius rc ¼ 3.375 Å are identified and colored light gray (cyan).Gaslike molecules are dark gray (red). The configurations aregenerated from the simulation of 512 TIP4P waters under theexternal pressure of 1 atm.
(a)
(b)
spvap
Size of Cluster, i
f i
Sc
FIG. 3 (color online). (a) Vapor spinodal temperatures Tvapsp
under the pressure psp for TIP4P andMCYmodels. The referencepressure p ° ¼ 1 atm. Inset: The critical supersaturation ratioSc ¼ psp=psat calculated at each data point, where equilibriumvapor pressure psat is obtained from the steam table [48]. (b) Theaverage fraction fi ¼ ini=N of i-sized clusters at each coloredpoint marked on the statistical temperature curve (inset). Inset:the statistical temperature curve near the vapor spinodal (verticaldotted line).
PRL 112, 157802 (2014) P HY S I CA L R EV I EW LE T T ER Sweek ending
18 APRIL 2014
157802-4

areas by optimizing the liquid-vapor transition in ingen-uously designed confined or interface systems.
K. S. K. acknowledges support by NRF (National HonorScientist Program, No. 2010-0020414) and KISTI(No. KSC-2011-G3-02). J. E. S. acknowledges the supportof the National Science Foundation (No. CHE-1114676).
*Corresponding [email protected]
[1] C. Pérez, M. T. Muckle, D. P. Zaleski, N. A. Seifert, B.Temelso, G. C. Shields, Z. Kisiel, and B. H. Pate, Science336, 897 (2012).
[2] H. M. Lee, S. B. Suh, J. Y. Lee, P. Tarakeshwar, and K. S.Kim, J. Chem. Phys. 112, 9759 (2000).
[3] N. J. Singh, M. Park, S. K. Min, S. B. Suh, and K. S. Kim,Angew. Chem., Int. Ed. 45, 3795 (2006).
[4] J. R. R. Verlet, A. E. Bragg, A. Kammrath, O. Cheshnovsky,and D. M. Neumark, Science 307, 93 (2005).
[5] K. S. Kim, I. Park, S. Lee, K. Cho, J. Y. Lee, J. Kim, andJ. D. Joannopoulos, Phys. Rev. Lett. 76, 956 (1996).
[6] M. E. Tuckerman, D. Marx, and M. Parrinello, Nature(London) 417, 925 (2002).
[7] P. L. Geissler, C. Dellago, D. Chandler, J. Hutter, and M.Parrinello, Science 291, 2121 (2001).
[8] T. D. Kühne and R. Z. Khaliullin, Nat. Commun. 4, 1450(2013).
[9] O. Mishima and H. E. Stanley, Nature (London) 396, 329(1998).
[10] I. Park, K. Cho, S. Lee, K. S. Kim, and J. D. Joannopoulos,Comput. Mater. Sci. 21, 291 (2001).
[11] M. Matsumoto, S. Saito, and I. Ohmine, Nature (London)416, 409 (2002).
[12] E. B. Moore and V. Molinero, Nature (London) 479, 506(2011).
[13] J. R. Errington, P. G. Debenedetti, and S. Torquato, Phys.Rev. Lett. 89, 215503 (2002).
[14] M. Sharma, R. Resta, and R. Car, Phys. Rev. Lett. 98,247401 (2007).
[15] I. F. W. Kuo and C. J. Mundy, Science 303, 658 (2004).[16] D. Zahn, Phys. Rev. Lett. 93, 227801 (2004).[17] R. A. Apfel, Nature (London) 238, 63 (1972).[18] R. J. Speedy, J. Phys. Chem. 86, 982 (1982).[19] M. T. Carlson, A. J. Green, and H. H. Richardson, Nano
Lett. 12, 1534 (2012).[20] Y. Viisanen, R. Strey, and H. Reiss, J. Chem. Phys. 99, 4680
(1993).[21] D. Brus, V. Zdímal, and H. Uchtmann, J. Chem. Phys. 131,
074507 (2009).[22] P. G. Debenedetti, Metastable Liquids: Concepts and
Principles (Princeton University Press, Princeton, NJ,1996).
[23] J. W. Cahn, J. Chem. Phys. 42, 93 (1965).[24] P. Bhimalapuram, S. Chakrabarty, and B. Bagchi, Phys.
Rev. Lett. 98, 206104 (2007).[25] J. Kim, T. Keyes, and J. E. Straub, J. Chem. Phys. 132,
224107 (2010).[26] Q. Lu, J. Kim, and J. E. Straub, J. Chem. Phys. 138, 104119
(2013).[27] J. L. F. Abascal and C. Vega, J. Chem. Phys. 123, 234505
(2005).[28] W. L. Jorgensen, J. Chandrasekhar, J. D. Madura, R. W.
Impey, and M. L. Klein, J. Chem. Phys. 79, 926 (1983).[29] C. Vega, J. L. F. Abascal, and I. Nezbeda, J. Chem. Phys.
125, 034503 (2006).[30] A. Pérez and A. Rubio, J. Chem. Phys. 135, 244505
(2011).[31] V. K. Shen and P. G. Debenedetti, J. Chem. Phys. 111, 3581
(1999).[32] C. Vega and E. de Miguel, J. Chem. Phys. 126, 154707
(2007).[33] See Supplemental Material, which includes Refs. [34–43],
at http://link.aps.org/supplemental/10.1103/PhysRevLett.112.157802 for the RDF and number fluctuation shownin Fig. S1.
[34] D. J. Wales and M. P. Hodges, Chem. Phys. Lett. 286, 65(1998).
[35] T. James, D. J. Wales, and J. Hernndez-Rojas, Chem. Phys.Lett. 415, 302 (2005).
[36] J. Pillardy, K. A. Olszewski, and L. Piela, J. Mol. Struct.270, 277 (1992).
[37] F. N. Keutsch, J. D. Cruzan, and R. J. Saykally, Chem. Rev.103, 2533 (2003).
[38] K. Kim, M. Dupuis, G. Lie, and E. Clementi, Chem. Phys.Lett. 131, 451 (1986).
[39] S. S. Xantheas, C. J. Burnham, and R. J. Harrison, J. Chem.Phys. 116, 1493 (2002).
[40] Y. Wang, B. C. Shepler, B. J. Braams, and J. M. Bowman,J. Chem. Phys. 131, 054511 (2009).
[41] J. A. Anderson, K. Crager, L. Fedoroff, and G. S.Tschumper, J. Chem. Phys. 121, 11023 (2004).
[42] B. Temelso, K. A. Archer, and G. C. Shields, J. Phys. Chem.A 115, 12034 (2011).
[43] D. M. Bates and G. S. Tschumper, J. Phys. Chem. A 113,3555 (2009).
[44] O. Matsuoka, E. Clementi, and M. Yoshimine, J. Chem.Phys. 64, 1351 (1976).
[45] P. L. Silvestrelli and M. Parrinello, Phys. Rev. Lett. 82, 3308(1999).
[46] B. J. Mhin, J. Kim, S. Lee, J. Y. Lee, and K. S. Kim,J. Chem. Phys. 100, 4484 (1994).
[47] P. Debenedetti, Nature (London) 441, 168 (2006).[48] L. Haar, J. S. Gallagher, and G. S. Kell, NBS/NRC Steam
Tables (Hemisphere, New York, 1984).[49] F. H. Stillinger, Jr., J. Chem. Phys. 38, 1486 (1963).
PRL 112, 157802 (2014) P HY S I CA L R EV I EW LE T T ER Sweek ending
18 APRIL 2014
157802-5