lime & fly ash treated biosolids - a valuable agricultural additive p. fine et al. inst. soils,...
TRANSCRIPT

Lime & fly ash treated biosolids - a valuable agricultural additive
P. Fine et al.
Inst. Soils, Water and EnvironmentalSciences, Volcani Center, ARO,
P.O.Box 6, Bet-Dagan 50250, Israel

Why dispose of sewage sludge by sustainable application in agriculture:
• Replaces fertilizer application;• Improves soils: reduces runoff and erosion,
preserves seed bed;• Conserves nonrenewable resources, maintains
the recycling principal;• Less costly to the sludge producers (us);• Reduces on- and off-site GHG emissions;• Reduces landfill overloading;• Recycling benefits all sectors involved: urban,
agriculture and the environment; • Recycling is the less expensive and it is the solution
to sludge disposal that is advocated for by world-known environmental agencies (USA, EU etc.).


Effect of sludge treatment on chemical composition
Parameter Untreated Treated Compost N-Viro
(untreated) CMC
(organic)
DM (%) 18 20 65 50 67 OM (%) 84 69 49 21 C (%) 49 36 23 12 14-23 NH4 (%) 0.2 + 0.11 0.5 0.002 0.5 NO3 (mg/kg) 0 0 5 0 4 Total N (%) 7.0 - 5.0 5.1 2.3 1.6 1.2-2.3 Corg/NOrg 7.0 6.1 9 - >12 7.7 10-12 Total P (%) 3.8 – 2 3.2 1.5 0.7 0.8-1.5 POlsen (%) 0.55 0.21 0.14 0.15 0.15 POlsen % of PT 29 7 9.5 21 11-19 pH ≥12 EC dS/m (1:5) 1.9 5 4.5 7-15 7-15

Overview of possible benefits (and risks) from FA-based ATB (NVS):• Benefits the urban sector: significant reduction of expenditures on WWTF
construction and maintenance;• Benefits the Environment: (i) reuse of byproducts, (ii) reduced mining of
diminishing resources, (iii) reducing emissions of GHGs (on- and off-site) and ammonia; (iv) avoiding composting derived emissions of GHGs, ammonia, odors and dust.
• Direct agricultural benefits:• Fertilizer substitute and viable organic matter additive;• Means to control soil-borne diseases (in light-textured soils);• Improve quality of agricultural products;• Improve sodic soils (acid soils) and other problematic soils (e.g.,
sandy, crust forming);• Allegedly impairs soil quality due to high pH, salinity, phytoavailability
of heavy metals (especially oxyanions), diminishes the phytoavailability of P and essential micro-nutrients (Fe, Zn, Mn, Cu).
• Environmental effects of the fly ash component (70% of the product)

Fertilizer substitution:
Results from comparative lab and field studies
It is reasonable to assume that limed sludge and fly ash addition to soil will hamper phytoavailability
of phosphorus and micro-nutrients (Fe, Mn, Zn, Cu) and disproportionally increases the solubility and availability of oxyanions (Cr, Mo, Se, B, As)

Assessment of the availability of elements essential to plant growth: N

Net N minaralization(-t0; -net soil N mineralization)
Days
0 10 20 30 40 50 60
N m
g k
g-1
-20
0
20
40
60
80
100
SS-ShafdanNVS-ShafdanSSC (1/08)SSC (7/08)
Net mineralization of organic Nin sludge amended sand: an incubation study. Application rate
equivalent to 500 kg N/ha; (incubation at optimal moisture content, 30⁰C)

Sludge type N0 (mg N kg-1)
p N0/NT (%)
k (day-1) p r2
Untreated (Tel-Aviv) 90.5 ± 5.8 <0.0001 45 0.12 ± 0.02 0.008 0.97
NVS (Tel-Aviv) 88.5 ± 4.6 <0.0001 44 0.13 ± 0.02 0.002 0.98
Compost(Jan 08) 37.0 ± 2.0 <0.0001 19 0.18 ± 0.03 0.004 0.97
Compost(July 08) -20 -10 - 0
Mineralization parameters of sludge organic N in amended sand at a load equivalent to 500 kg
total NT ha-1
Calculated using a 2 parametric exponential rise equation:Nt = N0*(1-e-kt): Nt = mineral N at time = t; N0 = potentially mineralizable organic N; k = the equation rate constant
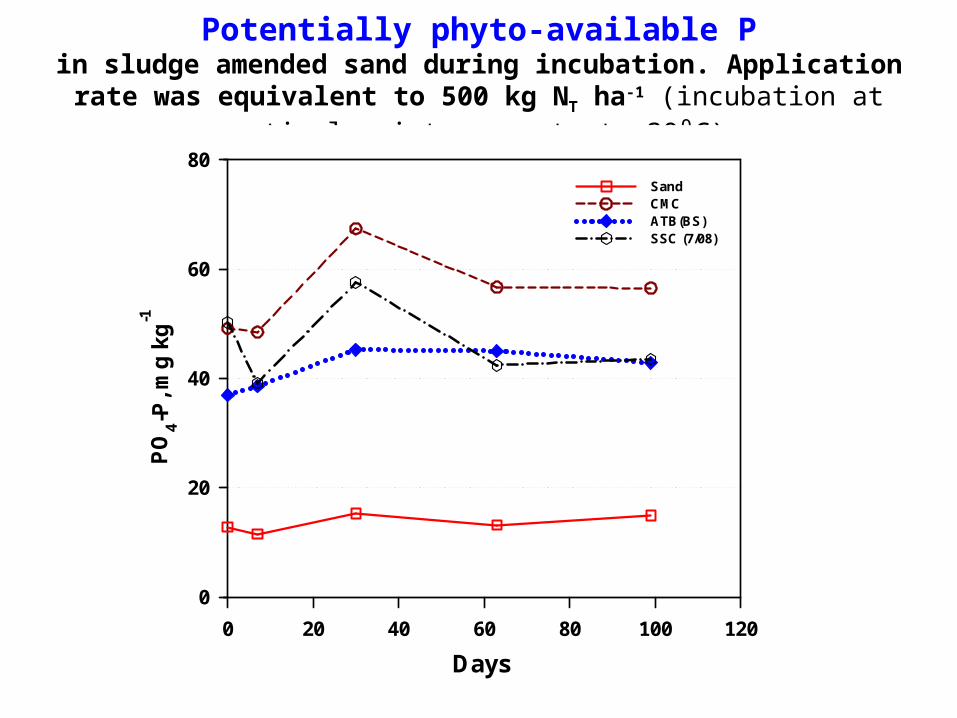
Potentially phyto-available Pin sludge amended sand during incubation. Application rate was
equivalent to 500 kg NT ha-1 (incubation at optimal moisture content, 30⁰C)
Days
0 20 40 60 80 100 120
PO
4-P, m
g k
g-1
0
20
40
60
80SandCMCATB(BS)SSC (7/08)

A field experiment where N-Viro is compared to two sludges
(anaerobically digested and compost) and to source-separated MSW
compost. The fertilizer replacement capacity for corn growth is shown for
2 consecutive years.(Revadim parcel #20, 16 treatments, 96 plots of 72 m2
2011-2012)


Treatments Nitrogen
application Times
applied
2011 Yield
2012 Yield
Base Side % of commercial
1 Cont 0-0 0 0 100 69 d 2 Cont N-0 100 0 106 95 bc 3 Cont 0-N 0 150 100 84 c 4 Cont N-N 100 150 100 100 ab 5 SS-500+N 500 150 2 86 110 a 6 SC-500+N 500 150 2 94 99 ab 7 NVS-500+N 500 150 2 95 101 ab 8 MSW-500+N 500 150 2 102 92 bc 9 SS-500-0 500 0 2 103 103 ab 10 SC-500-0 500 0 2 104 94 bc 11 NVS-500-0 500 0 2 98 95 bc 12 MSW-500-0 500 0 2 105 87 c 13 SS-1500-0 1500 0 1 92 93 bc 14 SC-1500-0 1500 0 1 104 94 bc 15 NVS-1500-0 1500 0 1 82 86 c 16 MSW-1500-0 1500 0 1 - 86 c
Yields of silage corn 2011 and 2012 (Revadim, plot 20)

Overall amounts of N,P,K taken up by the corn plants in 2012
Treatments
Nitrogen application Times
applied
2012 N Yield (kg ha-1)
& Student's 't' test
2012 P Yield (kg
ha-1)
2012 K Yield (kg ha-1)
& Student's 't' test
Base Side
1 Cont 0-0 0 0 193 d 50 306 d 2 Cont N-0 100 0 243 bcd 51 328 bcd 3 Cont 0-N 0 150 288 abc 51 319 cd 4 Cont N-N 100 150 303 ab 51 374 a 5 SS-500+N 500 150 2 316 a 53 365 ab 6 SC-500+N 500 150 2 303 ab 54 344 abcd 7 NVS-500+N 500 150 2 301 ab 49 360 abc 8 MSW-500+N 500 150 2 297 ab 48 359 abc 9 SS-500-0 500 0 2 264 abc 60 328 bcd 10 SC-500-0 500 0 2 250 bcd 51 319 cd 11 NVS-500-0 500 0 2 311 a 52 376 a 12 MSW-500-0 500 0 2 239 cd 58 335 abcd 13 SS-1500-0 1500 0 1 247 bcd 51 349 abcd 14 SC-1500-0 1500 0 1 263 abc 62 330 bcd 15 NVS-1500-0 1500 0 1 297 ab 59 341 abcd 16 MSW-1500-0 1500 0 1 280 abc 57 312 d AVERAGE 275
53 340
p 0.005
ns 0.03

ControlN-Viro – 43 tons/ha

Treatments Tubers yield
(tons/ha)
Mean tuber weight
(gr)
Tubers number
(/m2) Control (all) 37 b 212 b 68 b
N-Viro (all) 54 a 272 a 77 a
p <.0001
<.0001
0.004
Control – no amendment 36 B 195 B 71 A
Control – plastic cover 39 B 231 AB 65 A
Commercial disionfection 37 B 209 B 68 A
N-Viro 54 A 264 A 79 A
N-Viro +1.8 ton/ha (NH4)2SO4 56 A 273 A 80 A
N-Viro +3.6 ton/ha (NH4)2SO4 52 A 279 A 73 A
p <.0001 <.0001 0.044
Yield of potatoes – Besor 2011/2012

Ca
1 20
100
200
300
400 Fe
1 20
5
10
15
20
25
30
35
Mn
1 2
mg
kg
-1 D
M
0
2
4
6
8 Zn
1 20
5
10
15
20
25
Cu
Treatment1) C
ontol
2) ASB
0
1
2
3
4
5Ni
1) Contol
2) ASB
0.00.05.10.15.20.25.30.35.40
Metals in potato tubers - Besor 2012a
b

Cd
Contol ASB0.000
.005
.010
.015
.020
.025
.030
.035
.040 Pb
Contol ASB0.00
.05
.10
.15
.20
Se
Contol ASB
mg
kg
-1 D
M
0.0
.1
.2
.3
.4
.5
.6 Mo
Contol ASB0.0
.2
.4
.6
.8
Cr
TreatmentsContol ASB
0.00
.05
.10
.15
.20V
Contol ASB0.00
.02
.04
.06
.08
.10
.12
Metals in potato tubers - Besor 2012
a
b
a
b

Current recommendations
The current Dietary Reference Intake recommendation is composed of:
Estimated Average Requirements (EAR), expected to satisfy the needs of
a From pill only, not including food and water intake.
EAR: Estimated Average Requirements; RDA: Recommended Dietary Allowances; AI: Adequate Intake; UL: Tolerable upper intake levels.
It is also recommended that the following substances not be added to food or dietary supplements. Research has been conducted into adverse effects, but was not conclusive in many cases:
Substance RDA/AI UL units per day
Arsenic - ND -
Silicon - ND -
Nutrient EAR RDA or AI UL Unit/day
Boron NE - 20 mg
Calcium NE 1000 2500 mg
Chloride NE 2300 3600 mg
Chromium NE 35 ND µg
Copper 700 900 10000 µg
Fluoride NE 4 10 mg
Iodine 95 150 1100 µg
Iron 6 8 45 mg
Magnesium 330 420 350a mg
Manganese NE 2.3 11 mg
Molybdenum 34 45 2000 µg
Nickel NE - 1.0 mg
Phosphorus 580 700 4000 mg
Potassium NE 4700 ND mg
Selenium 45 55 400 µg
Sodium NE 1500 2300 mg
Sulfate NE - ND -
Zinc 9.4 11 40 mg
•ERA – Estimated average requirement;•RDA - Recommended Dietary Allowances•AI - Adequate Intake•UL - Tolerable upper intake levels
At 35 µg/day &100 µg Cr/kg in dry potatoes; ≈2.5 kg will supply the Cr RDA, 4-5 kg dry potatoes per the MoRDA & SeRDA

Using fly ash and ATB in the field to
improve sodic soils and plant yield
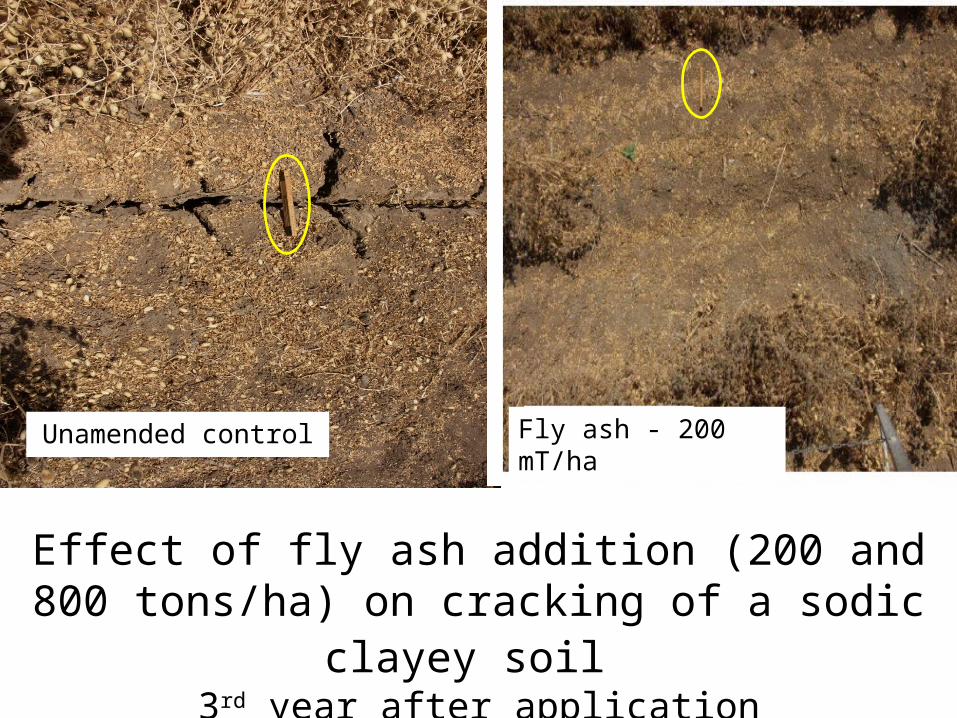
Unamended control Fly ash - 200 mT/ha
Effect of fly ash addition (200 and 800 tons/ha) on cracking of a sodic clayey soil
3rd year after application

800 tons/ha Fly ash plots in 2010(6 years after application)

Fly ashNot amended


B
1 2 30
2
4
6
8
10
12
14
16Mo
1 2 30
2
4
6
8
10
12
14
As
1 2 3
mg
kg
-1 D
M
0.00
.02
.04
.06
.08
.10
.12
.14Cr
1 2 30.00
.01
.01
.02
.02
Co
TreatmentNo additio
n
200 mT/ha
800 mT/ha
0.00
.05
.10
.15
.20
.25
.30V
No addition
200 mT/ha
800 mT/ha
0.000
.005
.010
.015
.020
Metals in chikpea seeds - Revadim 20073 years after FA application

Cr
1 2 3 4 5 6 1302468
101214161820
V
1 2 3 4 5 6 13
mg
kg
-1
0.00
.05
.10
.15
.20
.40
.50
Mo
Treatment #
1 2 3 4 5 6 130
1
2
3
4
Metals in corn grains grown in sand-NVS mixtures in 4-L pots. Application rates equivalent to 8 (#1, 4),
17 (#2, 5), & 33 (#3, 6) dry tons ha-1 (65% FA). #13 is control and the blue line is the value measured in the field trial
Metals in corn grains grown in sand-NVS mixtures in 4-L pots
Application rates equivalent to 8 (#1, 4), 17 (#2, 5), & 33 (#3, 6) dry tons ha-1 (65% FA).
#13 is the control treatment and the blue lines are the value measured in the control treatment in the field experiment.

11-5-0931-5-09 Lint yield
+ ATB
Satellite imaging of LAI in Cotton: Response to biosolids (lime stabilized) application at 50 m3/ha
(Revadim 2009)

Soil sanitation using ASBsefficient in light-textured soils
(in collaboration with A. Gips, U. Zig, N. Borgan, G. Kritzman, Y. Ben-Yephet, M. Reuven, B. Kirshner, …)

Ammonia concentration at different exposure times needed for 100% mortality of F. oxysporum dianthi chlamydospore, Verticillium dahliae microsclerotia and Sclerotium rolfsii
sclerotia
Time of exposure
(minutes)
Ammonia concentration (µL L-1)
Fusarium oxysporum
Verticillium
dahliae
Sclerotium rolfsii
1014.814.85.5
206.914.82.3
306.914.82.3
Resting spores were mounted on agar discs that were pre-dipped in proper growth medium, and placed in gas-tight glass jars at 25C. Ammonia gas was injected into the jars.
Mortality was determined after 6 days of incubation (n= 10).

0
10
20
30
40
50
60
70
80
90
100
7 8 9 10 11
pH
% o
f to
tal
pH-dependence of NH3/NH4 ratio at 25C and 50C(log [NH3(g)] / NH4
+(aq)] = pH - A)
NH3
NH4
A at 25CA at 50C

Addition of an ammonia source ((NH4)2SO4)
31

32

ControlN-Viro – 43 tons/ha

Treatment #0 1 2 3 4 5 6P
ath
og
en
ic s
tre
pto
myc
es
(c
fu/g
r s
oil
)
1e+0
1e+1
1e+2
1e+3
1e+4
1e+5
1) Control 2) Cont-plastic4) ASB 43 tons/ha5) ASB 43 tons/ha + 1.8 ton ammonium sulfate6) ASB 43 tons/ha + 3.6 tons ammonium sulfate
Soil disinfection using ASB – Besor farm (Negev R&D) summer 2011. Pathogenic Streptomyces in the 0-20 cm soil layer. Treatments 2-6
were covered with plastic for 1 week
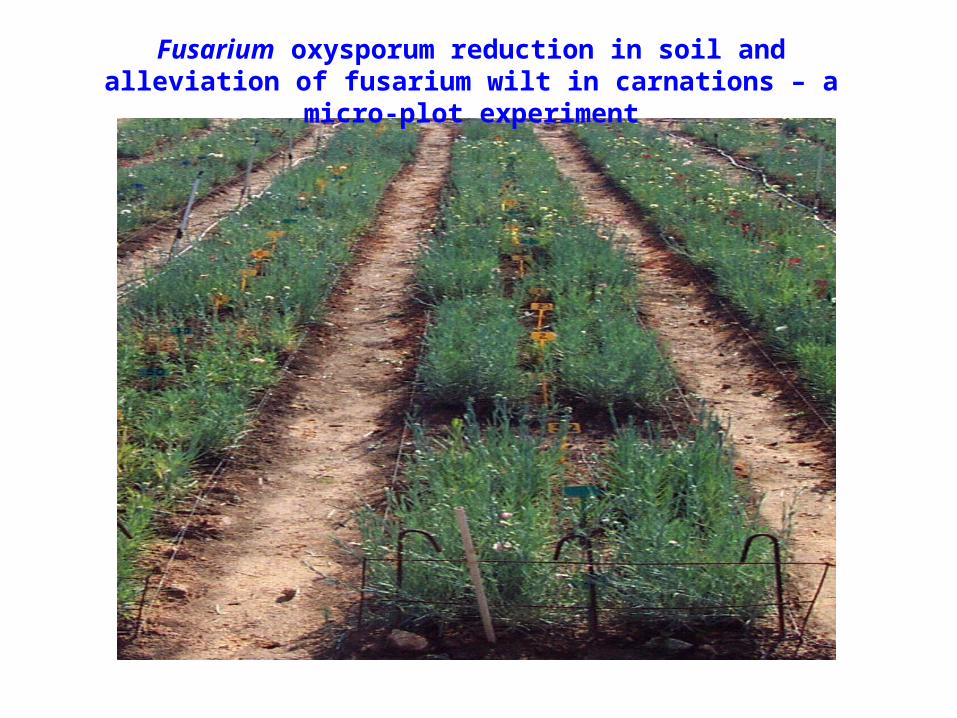
Fusarium oxysporum reduction in soil and alleviation of fusarium wilt in carnations – a micro-plot experiment

Unamended control
ASB + NH4

0
500
1000
1500
2000
2500
3000
Unamendedcontrol
ASB 75 t/ha ASB 75t/ha+155 kgNH4-N/ha
ASB 75t/ha+300 kgNH4-N/ha
ASB 75t/ha+625 kgNH4-N/ha
Sludge only
cfu
/g
-1 day
5 days
47 days
120 days
165 days
days from treatment
Effect of ASB+NH4 application to the 0-20 cm layer of infested red Mediterranean sand on viability of Fusarium
oxysporum dianthi (averages of 8 replicate plots)
1 2 3 4 5 6 7 8 9 10 11 12
0.0
0.5
1.0
1.5
2.0
2.5
3.0
3.5
1 2 3 4 5 6 7 8 9 10 11 12
log
CF
U/g
so
il
0.0
0.5
1.0
1.5
2.0
2.5
3.0
Treatment #1 2 3 4 5 6 7 8 9 10 11 12
Infe
cte
d s
ee
dli
ng
s (
%)
0
20
40
60
80
100
120
Verticillium
1 2 3 4 5 6 7 8 9 10 11 12
0.0
0.5
1.0
1.5
2.0
2.5
3.0
Rhizoctonia
1 2 3 4 5 6 7 8 9 10 11 12
0
20
40
60
80
100
120
Before treatment 56 days after treatment
Pythium sp.
1 2 3 4 5 6 7 8 9 10 11 12
0.0
0.5
1.0
1.5
2.0
2.5
3.0
3.5
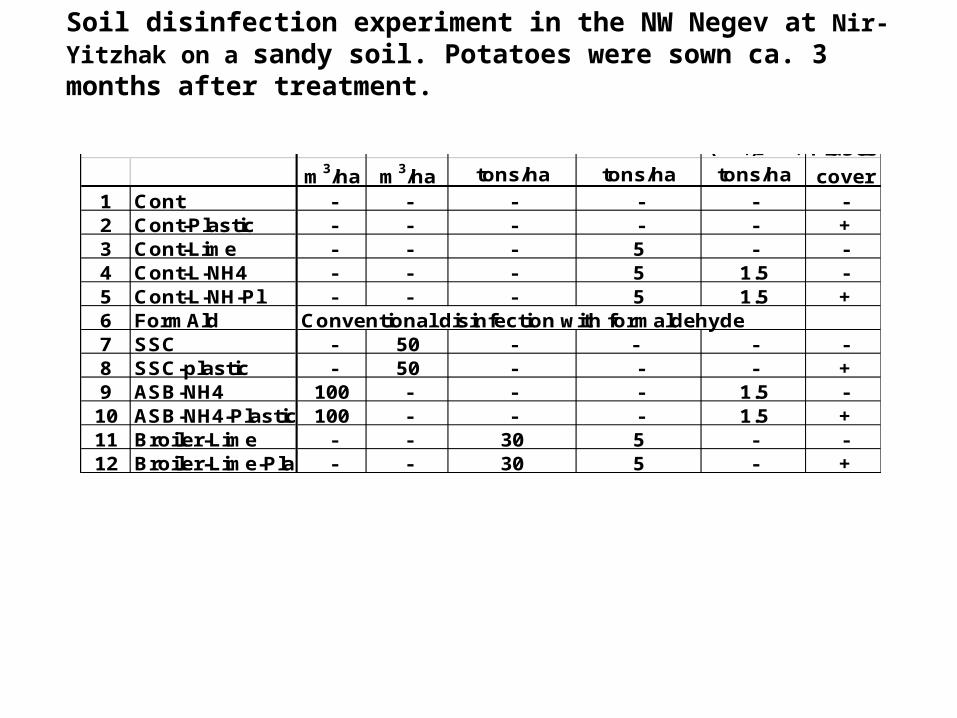
Treatment # & code ASB SSC Broiler litter Slaked lime (NH4)2SO4 Plastic
m3/ha m3/ha tons/ha tons/ha tons/ha cover1 Cont - - - - - -2 Cont-Plastic - - - - - +3 Cont-Lime - - - 5 - -4 Cont-L-NH4 - - - 5 1.5 -5 Cont-L-NH-Pl - - - 5 1.5 +6 FormAld Conventional disinfection with formaldehyde7 SSC - 50 - - - -8 SSC-plastic - 50 - - - +9 ASB-NH4 100 - - - 1.5 -10 ASB-NH4-Plastic 100 - - - 1.5 +11 Broiler-Lime - - 30 5 - -12 Broiler-Lime-Plastic- - 30 5 - +
No
t D
term
ine
d
No
t D
term
ine
d
No
t D
term
ine
d
No
t D
term
ine
d
Soil disinfection experiment in the NW Negev at Nir-Yitzhak on a sandy soil. Potatoes were sown ca. 3 months after treatment.

1 2 3 4 5 6 7 8 9 10 11 12
0.0
0.5
1.0
1.5
2.0
2.5
3.0
3.5
1 2 3 4 5 6 7 8 9 10 11 12
log
CF
U/g
so
il
0.0
0.5
1.0
1.5
2.0
2.5
3.0
Treatment #1 2 3 4 5 6 7 8 9 10 11 12
Infe
cted
see
dlin
gs
(%)
0
20
40
60
80
100
120
Verticillium
1 2 3 4 5 6 7 8 9 10 11 12
0.0
0.5
1.0
1.5
2.0
2.5
3.0
Rhizoctonia
1 2 3 4 5 6 7 8 9 10 11 12
0
20
40
60
80
100
120
Before treatment 56 days after treatment
Pythium sp.
1 2 3 4 5 6 7 8 9 10 11 12
0.0
0.5
1.0
1.5
2.0
2.5
3.0
3.5
Treatment # & code ASB SSC Broiler litter Slaked lime (NH4)2SO4 Plastic
m3/ha m3/ha tons/ha tons/ha tons/ha cover1 Cont - - - - - -2 Cont-Plastic - - - - - +3 Cont-Lime - - - 5 - -4 Cont-L-NH4 - - - 5 1.5 -5 Cont-L-NH-Pl - - - 5 1.5 +6 FormAld Conventional disinfection with formaldehyde7 SSC - 50 - - - -8 SSC-plastic - 50 - - - +9 ASB-NH4 100 - - - 1.5 -10 ASB-NH4-Plastic 100 - - - 1.5 +11 Broiler-Lime - - 30 5 - -12 Broiler-Lime-Plastic - - 30 5 - +
No
t D
term
ined
No
t D
term
ined
No
t D
term
ined
No
t D
term
ined
של CFUה-אורגניזמים נבדקים
ס"מ 20-0בשכבה של קרקע חול משדה תפו"א
בניר יצחק לפני יישום התוספים ואחרי היישום.
: 8, 7טיפולים קומפוסט בוצה,
: 10, 9טיפולים במ"ס + אמוניום.

Treatment #
1 2 3 4 5 6 7 8 9 10 11 12
0
1
2
3
4
1 2 3 4 5 6 7 8 9 10 11 12
0
2
4
6
8
1 2 3 4 5 6 7 8 9 10 11 12
log
CF
U/g
so
il
0
1
2
3
4
5
1 2 3 4 5 6 7 8 9 10 11 12
0
2
4
6
8
Pathogenic streptomyces
1 2 3 4 5 6 7 8 9 10 11 12
0
1
2
3
4
5
Total fungi
1 2 3 4 5 6 7 8 9 10 11 12
0
2
4
6
8
Fusarium sp.
1 2 3 4 5 6 7 8 9 10 11 12
0
1
2
3
4
Before treatment After treatment
Total Streptomyces
1 2 3 4 5 6 7 8 9 10 11 12
0
2
4
6
8
של אורגניזמים CFUה- 20-0נבדקים בשכבה
ס"מ של קרקע חול משדה תפו"א
בניר יצחק לפני יישום התוספים ואחרי : 8, 7היישום. טיפולים קומפוסט בוצה,
: במ"ס + 10, 9טיפולים אמוניום.

• Coal fly ash and FA-based ASB do not add to soil significant loads of priority pollutants (and other oxyanions and heavy metals).
• FA-based ASBs can replace base application of fertilizer N, P and K. It positively affects crop nutrition of essential micro-elements and with oxyanions essential for human nutrition.
• ASB, can effectively disinfect slight-textured oils. This is unique to this biosolids type. This is based on activation of ammonia toxicity.
• FA at 200 and 800 tons ha-1 had a positive long-term influence on the structure and aggregation of a sodium-affected clayey soil, without actually changing the bioavailability of oxyanions and other trace elements.
• The data thus far collected strongly suggests that incremental FA accumulation to soils via FA-based ASB loading has no foreseen long-term risks to soil, crop and groundwater quality. Furthermore, the benefits from the FA and ASB overwhelmingly outweigh possible risks. Sandy soils deserve special attention.
Conclusions:

• There are however potential pitfalls mainly with respect to the high initial pH and the load of salinity that comes with it (especially at
disinfection loads).
• More research is always needed...
More conclusions:

Thank you
11/12/2012
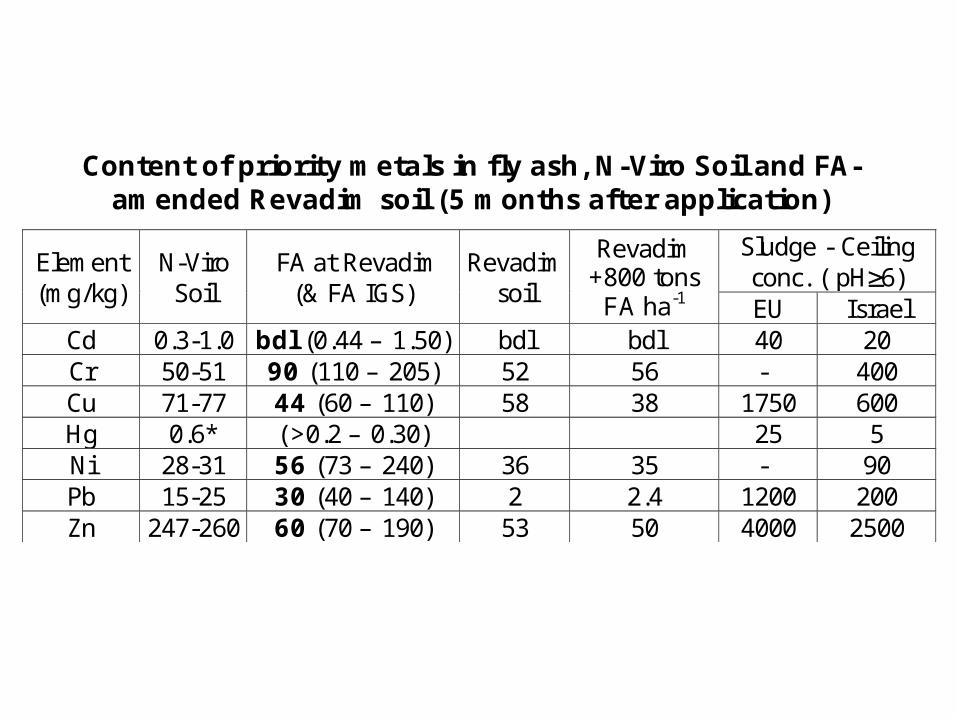
Content of priority metals in fly ash, N-Viro Soil and FA-amended Revadim soil (5 months after application)
Element (mg/kg)
N-Viro Soil
FA at Revadim (& FA IGS)
Revadim soil
Revadim +800 tons
FA ha-1
Sludge - Ceiling conc. ( pH6) EU Israel
Cd 0.3-1.0 bdl ( 1.50 – 0.44 ) bdl bdl 40 20 Cr 50-51 90 ( 205 – 110 ) 52 56 - 400 Cu 71-77 44 ( 110 – 60 ) 58 38 1750 600 Hg 0.6* ( 0.30 – 0.2> ) 25 5 Ni 28-31 56 ( 240 – 73 ) 36 35 - 90 Pb 15-25 30 ( 140 – 40 ) 2 2.4 1200 200 Zn 247-260 60 ( 190 – 70 ) 53 50 4000 2500

Using ASB to improve sodic soils
Field trial:
ASB application to natric vertisol
(kibbutz Revadim) improved water
availability to cotton plants and
increased lint yield.
Green color signifies better plant development
and higher yield
(In collaboration with G. Levy and Y. Kilmann)