limbic frontal cortex in hominoids: a comparative study of area 13
TRANSCRIPT

Limbic Frontal Cortex in Hominoids: A Comparative Studyof Area 13
KATERINA SEMENDEFERI,1,* ESTE ARMSTRONG,2AXEL SCHLEICHER,3 KARL ZILLES,3 AND GARY W. VAN HOESEN4
1Department of Anthropology, University of California,San Diego, La Jolla, CA 920932Department of Cellular Pathology, Armed Forces Institute of Pathology,Washington, DC 203063C. and O. Vogt Institute for Brain Research, Heinrich-Heine UniversityDuesseldorf, Duesseldorf D-40225, Germany4Departments of Neurology and Anatomy, University of Iowa,Iowa City, Iowa 52242
KEY WORDS orbitofrontal; neuroanatomy; brain;cytoarchitecture; stereology; apes; humans; evolution
ABSTRACT The limbic frontal cortex forms part of the neural substrateresponsible for emotional reactions to social stimuli. Area 13 is one of thecortical areas long known to be part of the posterior orbitofrontal cortex inseveral monkey species, such as the macaque. Its presence nevertheless in thehuman brain has been unclear, and the cortex of the frontal lobe of the greatand lesser apes remains largely unknown.
In this study area 13 was identified in human, chimpanzee, bonobo, gorilla,orangutan, and gibbon brains, and cortical maps were generated on the basisof its cytoarchitecture. Imaging techniques were used to characterize andquantify the microstructural organization of the area, and stereological toolswere applied for estimates of the volume of area 13 in all species.
Area 13 is conservative in its structure, and features such as size of corticallayers, density of neurons, and space available for connections are similaracross hominoids with only subtle differences present. In contrast to thehomogeneity found in its organization, variation is present in the relative sizeof this cortical area (as a percentage of total brain volume). The human andthe bonobo include a complex orbitofrontal cortex and a relatively smallerarea 13. On the contrary the orangutan stands out by having a shorterorbitofrontal region and a more expanded area 13.
Differences in the organization and size of individual cortical areas involvedin emotional reactions and social behavior can be related to behavioralspecializations of each hominoid and to the evolution of emotions in hominids.Am J Phys Anthropol 106:129–155, 1998. r 1998 Wiley-Liss, Inc.
The orbitofrontal cortex of primates hasbeen an odd bedfellow to the motor andassociation cortices of the frontal lobe.Clearly, it is neither a motor (or motor-related) cortex nor a classical associationcortex, having few ‘‘higher-order’’ functionalattributes ascribed to it (Eslinger and Dama-sio, 1985). Set very much apart from thedorsolateral prefrontal cortex, the orbitofron-tal cortex has been linked more closely towhat could be termed ‘‘limbic’’ or ‘‘emotional’’
mechanisms (Damasio et al., 1990; Klingand Steklis, 1976). Stimulation or destruc-tion of the posterior orbitofrontal area isassociated with alterations in autonomic,
Contract grant sponsor: Leakey Foundation; Contract grantnumber: QM54; Contract grant sponsor: Wenner-Gren Founda-tion; Contract grant number: 5553; Contract grant sponsor:National Science Foundation; Contract grant number: G13.
*Correspondence to: Katerina Semendeferi, Department ofAnthropology, University of California, San Diego, 9500 GilmanDrive, La Jolla, CA 92093-0532. E-mail: [email protected]
Received 13 May 1997; accepted 5 March 1998.
AMERICAN JOURNAL OF PHYSICAL ANTHROPOLOGY 106:129–155 (1998)
r 1998 WILEY-LISS, INC.

emotional, and social behaviors (Damasioand Van Hoesen, 1983). Thus, area 13 alongwith the surrounding posterior orbitofrontalcortex constitutes a significant part of theneural substrate responsible for behaviorsrelated to responses to social stimuli andsocial cognition.
On neuroanatomical grounds some partsof the orbitofrontal cortex deserve designa-tion as part of the limbic lobe, includingproisocortical areas (areas that lack a granu-lar layer typical of prefrontal associationcortices). Nevertheless, the largest expanseof the orbitofrontal cortex seems very much‘‘prefrontal,’’ sharing substantial granular-ity and a network of cortical connectionswhich link it with frontal, parietal, andtemporal association neural systems (VanHoesen, 1982; Goldman-Rakic, 1984). Poste-rior orbital areas, by contrast, are stronglyinterconnected to the insular, temporal po-lar, and parahippocampal cortices as well aswith basal forebrain structures like the ven-tral striatum, nucleus basalis of Meynert,and amygdala (Nauta, 1962; Van Hoesen,1981).
Area 13 forms the core posterior orbitofron-tal area, and its cytoarchitecture and connec-tions are now well described in the macaquemonkey (Barbas and Pandya, 1989; Preussand Goldman-Rakic, 1991; Morecraft et al.,1992; Carmichael and Price, 1994). Less isknown about it in the human brain, andvirtually nothing is known about it in thebrains of the apes.
Here we compare area 13 using conven-tional and quantitative cytoarchitectonictechniques in all extant hominoids and onemonkey species. In particular:
1. Cortical maps of area 13 are generatedfor human, chimpanzee, bonobo, gorilla, or-angutan, and gibbon brains. A qualitativemicroscopic analysis is presented from se-rial sections stained with the Gallyas stainfor cell bodies (cytoarchitecture), including aphotographic documentation of the area inthe above species.
2. The size of area 13 in hominoids isestimated using stereological tools for anunbiased estimate of its volume.
3. The microstructural organization of area13 is investigated using quantitative cytoar-chitectonic techniques. These include a) the
application of a quantitative imaging tech-nique (the Grey-Level Index method or GLI),which yields the ratio between neuropil spaceand space occupied by cellular somata, forthe whole cortex and for individual corticallayers; b) the relative width of the corticallayers; c) the total number of neurons andtheir density.
Changes in emotional states and disinhibi-tion of emotional reactions have been associ-ated with area 13 in the macaque. Is area 13present in all hominoids? Are there species-specific structural features that can be iden-tified in the neural circuitry underlying com-plex social behaviors in apes and humans?Are there differences in size of this corticalarea among species with different socialorganizations?
MATERIALS AND METHODSMaterials
All extant hominoids (humans, chimpan-zees, bonobos, gorillas, orangutans, and gib-bons) were studied, as well as one Old Worldmonkey, the rhesus monkey. Two to tenhemispheres per species were included inthe qualitative part of the investigation, andsections from one hemisphere (right hemi-sphere in all species) were digitized andquantified for each hominoid species.1
Histological sections from all the collec-tions (see footnote 1) were used in the quali-tative investigation, whereas the quantita-tive techniques were applied only to the newspecimens (described under e) that were allembedded in paraffin, serially sectioned at20 µm, and every tenth or 15th section wasstained with a modification of the Gallyassilver stain for neuronal perikarya (Gallyas,
1The material investigated forms part of the following collec-tions: a) two human brains and two macaque brains are part ofG.H. Van Hoesen’s collection; b) brains from one chimpanzee, onegorilla, one orangutan, and one gibbon are part of E. Armstrong’scollection at the Armed Forces Institute of Pathology (A.F.I.P); c)one human brain, two macaque brains, and one chimpanzeebrain are part of the Yakovlev Collection at the A.F.I.P. (all brainsare sectioned at 20 or 35 µm, stained either with Nissl, forneuronal perikarya, or silver stain); d) three human brains, onemacaque brain, one chimpanzee, one gorilla, and one hemisphereof the orangutan are part of K. Zilles’ and H. Stephan’s primatebrain collection at the Vogt Institute for Brain Research inDuesseldorf, Germany; and e) five new ape brain specimens fromthe Yerkes Primate Regional Research Center and the BushGardens Zoo form part of K. Semendeferi’s primate brain collec-tion at UCSD (chimpanzee Chimp1, bonobo YN 86-137, gorillaYN 82-140, orangutan YN85-38, and gibbon YN 81-146). Thespecimens belong to adult individuals of both sexes, except forthe bonobo (a 2-year-old female).
130 K. SEMENDEFERI ET AL.
1971; Merker, 1983). The human brain in-cluded in the quantification (male, 75 yearsold) was processed like the ape specimens.None of the monkeys, apes, or humans diedof neurological disease.
Methods
Estimates of volumes. After area 13 wasidentified (see Results) and outlined, itsvolume and that of the total volume of thebrain were estimated on the histologicalsections. Stereological techniques which es-timate unbiased volume of brain structuresand other irregularly shaped objects, suchas the cortex, were used (Gundersen et al.,1988a,b).
A grid test system of regularly spacedpoints on an acetate sheet was superim-posed randomly on 10 to 15 coronal sectionsof known intersection distance, and of whichthe first one was randomly determined. Onthese sections, all the points P(struct) thatfell within the hemispheres and cerebellumas well as within the boundaries of area 13were counted. The absolute area of the crosssection of each region of interest was deter-mined by
A(s) 5 [P(struct)/P(total)] [A(p)/M2]
where A(s) is the area of the region ofinterest, P(struct) is the number of pointscounted from that region, P(total) is thetotal number of grid points, A(p) is the totalgrid area, and M is the magnification of thesection.
The total volume of the brain and of area13 was estimated by applying the following:
V 5 A 3 T 3 D
where V is the volume of the region, A is thearea of the cross section, T is the thickness ofeach section, and D is the distance betweenthe sections. The above procedure providedan unbiased estimate of the volume of thebrain and of cortical area 13 of the humanand ape brains, with a precision better than5% (Gundersen et al., 1988a,b).
Comparison of the brain volume prior toprocessing and the volume of the braintissue as estimated from the above methodproduced a correction factor for each brain.The correction factor was applied to the
volume of area 13. This factor corrects forthe effects of shrinkage during processing ofthe tissue, as discussed by Stephan (1961),Stephan et al. (1991), and Frahm (personalcommunication).
Grey-Level Index (GLI). The Grey-LevelIndex (GLI) method (Schleicher and Zilles,1989) detects the area-percent of stainedperikarya versus neuropil, and demon-strates interareal and interlaminar differ-ences in these densities across species. TheGLI values include neuronal cell bodies,glial nuclei, and endothelial cell nuclei. Theregional and laminar changes in corticalGLI are primarily a function of neuronalvolume density, because glial and endothe-lial cell nuclei constitute a relatively smallportion of the total volume, and because thepacking density of glial cells does not differsignificantly between the cortical layers(Wree et al., 1982; Armstrong et al., 1986).The GLI is defined by the following formula:
GLI 5 [A/F] 3 100
where GLI is the grey-level index in percent,A is the absolute area of the cellular profilesin the measuring field, and F is the area ofthe measuring field (here 20 3 20 µm). De-termining GLIs requires three major steps(Fig. 1):
I. Histological sections were digitized, andimages were obtained with a CCD-Cameraattached to a light microscope. The GLIswere measured automatically with an IBAS2000 image analyzer. The darkly stainedcellular profiles were segmented from thebackground by adaptive thresholding, a pro-cedure based on the relative grey valuedifference between the background and thecellular profiles, and independent of stain-ing intensity. The cellular profiles includethe cytoplasm, nucleus, and nucleolus ofboth neurons and glia (Fig. 1A–C).
A total of 12 locations in cortical area 13 ofthe seven quantified hemispheres were se-lected. The selection of sites was basedmainly on the quality of the histologicalsection and the orientation of the layers(non-tangential cuts). Selected locations,with a maximum size of 9 mm 3 9 mm, weremarked and outlined on the slides.
131LIMBIC FRONTAL CORTEX IN HOMINOIDS

The microscopic image (253) was trans-mitted through the CCD-Camera to the im-age analyzer (Fig. 1D). The video frame of512 3 512 pixels covered a square micro-scopic field of 165 µm2 wide. Each videoframe included a set of 8 3 8 square measur-ing fields, and each measuring field was 203 20 µm (spatial resolution of 20 µm). Afterall the fields in each video frame weremeasured, the histological section was movedby a mechanical scanning stage to the imme-diately adjoining non-overlapping videoframe. A maximum of 10 hr was needed tomeasure a large rectangle on the histologi-cal section. The data were stored in a picture
matrix and printed. The resulting computerplots from the seven primate species showthe regional distribution of the GLIs with aspatial resolution defined by the size of ameasuring field (20 3 20 µm).
II. The above computer images and plotswere used to generate laminar profiles of thecell distribution. The profiles describe varia-tion in cell body volume density (GLI)throughout the cortical depth, starting atthe pial surface and ending in the whitematter.
Two straight lines at a distance of 23 to 50pixels from each other and perpendicular tothe pial surface, were drawn on each com-
Fig. 1. Grey-Level Index method. A: Histological section in the light microscope. B,C: Histological sectiondigitized. The darkly stained cellular profiles are segmented from the background. D: Profiles are drawn from thepial surface to white matter.
132 K. SEMENDEFERI ET AL.
puter plot, from the pial surface to the whitematter. Then, in order to superimpose thelines on the picture matrix, each plot wasfixed to a digitizing tablet, and the corre-sponding digitized image was presented inthe monitor. Three corner points of the plotwere marked, so that the digitized coordi-nates could be transformed to pixel coordi-nates. The lines were traced over with themouse, and the GLI values were stored. Theentire cortical segment included betweenthe two lines was averaged, resulting in onethick profile for each selected location (Fig.1D).
III. A characteristic profile for each specieswas derived by standardizing individualthick profiles to the same relative width,then averaged. The x-axis represents therelative cortical depth, and the y-axis repre-sents the GLI value which shows the areapercentage covered by cell bodies versusneuropil space.
Subsequently, mean GLI values were cal-culated for the entire profile, the supragranu-lar layers (II and III), layer IV, and theinfragranular layers (V and VI).
Relative size of cortical layers. Theabove profiles helped to determine the thick-ness of the cortical layers and the mean GLIvalues for each layer. The cortex in themicroscopic slides was projected through acamera lucida over each profile, and theborders of layers were outlined for area 13 inall seven species. This allows a direct super-imposition of the profile curves onto theimage of the histological section. Thereby,the maxima and minima of the profile can becorrelated with the cytoarchitectonically de-fined layers in each area across species.
Neuronal counts. The total number ofneurons was determined for area 13 byapplying the optical fractionator, a modernstereological method for obtaining estimatesof total numbers of neurons in a cortical area(West and Gundersen, 1990; West et al.,1991) (Hyman, personal communication).Neurons were identified and counted in alight microscope using a 603 oil immersionobjective with a numerical aperture of 1.4.The microscopic image was transmittedthrough a CCD-Video camera to a computer
screen at a total magnification of 2,0563.Superimposed on the screen was a transpar-ency of a counting square with extendedexclusion edges drawn on it.
Neurons were separated from glial cellsbecause the former are larger in most cases,and their cell nuclei are surrounded bystained cytoplasm, which is hardly visible inglial cells. Moreover, with the Gallyas cellstain, one can identify the initial segmentsof proximal dendritic processes in most neu-rons. The close association of some glial cellswith capillaries is easily seen, because thelatter are stained and are very distinct.Nevertheless, there were occasional in-stances where it was unclear whether thestructure represented a neuron, and sothroughout this research only those struc-tures were counted that were clearly identi-fied as neurons.
First, density of neurons was determinedby counting neuronal bodies in a knownvolume of tissue. The standard volume oftissue in this case had a 100 micron X-axis,100 micron Y-axis (drawn on the transpar-ency superimposed on the screen), and 20microns Z-axis that equals the thickness ofthe tissue sections. All neurons included inthe box were counted, except those touchingthe three exclusion planes (X and Y axes onthe screen) and the first level of focus (on theZ axis).
Second, a number of disectors was chosenaccording to a systematic random scheme(Hyman, personal communication) acrossthe cortical area under investigation. A totalof 50 disectors or more per cortical area perspecies were included in the measurements.This figure involved either every or everyother stained section in the series, depend-ing on the extent of the cortical area in theparticular species. As a first step, the corti-cal area of each species was measured by thex and y coordinates attached to the micro-scope. The sampling of the boxes was accom-plished with the help of a software devel-oped for these measurements. The squarearea of the cortex under consideration wasgiven to the computer as x and y axes, aswell as the number of boxes that should besampled (10 or more). The software ran-domly chose the first box and then gave thecoordinates of all boxes needed to be sampled
133LIMBIC FRONTAL CORTEX IN HOMINOIDS

(that were located in an equal distance fromeach other). Only those boxes that fell withinthe cortex (layers I–VI) were included in themeasurements. All boxes that fell within thewhite matter, the pial surface, or neighbor-ing cortical areas were excluded.
Finally, the mean number of neurons pertest volume was expanded to total number ofneurons per regional volume by the formula
N 5 [SQ/SD]XV
where SQ and SV are the summations of theneurons and the volumes of the disectorssampled, and V is the volume of the entirecortical area.
RESULTS
Cytoarchitecture of area 13: qualitativedescription
In order to identify a structural homo-logue for the hominoids to the well-de-scribed area 13 of the macaque, the investi-gation of the orbitofrontal cortex in eachspecies was approached in two ways. First,each species was examined independently ofthe others, and the regions of interest (corti-cal areas in the posterior parts of the orbitalsurface) were investigated and defined inrelation to the surrounding cortex. Then,parallels were drawn across species, andarea 13 was identified on the basis of similarcytoarchitectonic features common in allspecies investigated. Area 13, although simi-lar, is not identical across species as will beshown here, and its position and structuralappearance in relation to that of the sur-rounding cortex can vary among species.
Human. Most earlier studies of the hu-man orbitofrontal cortex do not recognize astructural homologue to the macaque area13. Here the cytoarchitectonic features thatdefine area 13 in the rhesus monkey weresearched for and were found in the posteriorparts of the medial orbital gyrus and theposterior orbital gyrus of the human brain.
Area 13 is bordered medially by the gyrusrectus and laterally by the lateral orbitalgyrus and is found in the proximity of theolfactory trigone. The most complete mani-festation of the cytoarchitectonic featuresthat define this area can be found in the
sections where the medial and posteriororbital gyri tend to merge into one gyrus andthe medial orbital sulcus starts to disappear(Fig. 2).
In silver-stained and Nissl-stained histo-logical sections the posterior orbitofrontalcortex has a complex appearance suggestingthe presence of several divisions and subdivi-sions of cortical areas with a relatively shortextent. The cortex lateral to the olfactorytrigone shows several cytoarchitectonic fea-tures that clearly distinguish it from thesurrounding cortex. More specifically, layer Ihas irregular borders with layer II. Layer IIis thin and in some sections, incipient, form-ing clusters of cells rather than a continuouslayer. It includes small granular cells thathave pale nuclear and cytoplasmic staining.The borders with layer III are hard to define.Layer III is a homogeneous layer that con-tains medium-sized pyramids. They in-crease slightly in size toward the borderswith IV, but a separation of this layer intosublayers is not as easy as in more rostralparts of the prefrontal cortex. Nevertheless,there is a slight increase in the density of thecells close to the interface with IV. Thepyramids in layer III are prominent andhave dense nuclear and cytoplasmic stain-ing.
Layer IV is incipient. Its cells are granu-lar and small, with moderate nuclear andpale cytoplasmic staining. Layer V is themost prominent layer and includes darklystained medium-to-larger pyramids. Mostare located in Va. Sublayer Vb and layer VIare poorly segregated. The pyramidal andfusiform cells that are part of Vb and VIhave a characteristic horizontal laminarstriation, in a direction parallel to the pialsurface. Layer VI contains medium-sizedpyramidal cells and large fusiform cells thathave moderate nuclear and cytoplasmicstaining. The boundary with the white mat-ter is not sharp.
In summary, the presence of an incipientlayer IV and a medial-to-lateral horizontalstriated appearance of the cells in the infra-granular layers (V and VI) defines this corti-cal area. In the surrounding cortex, one orboth of the above features is absent. More-rostral cortex is differentiated from area 13by having a better-defined layer IV that
134 K. SEMENDEFERI ET AL.
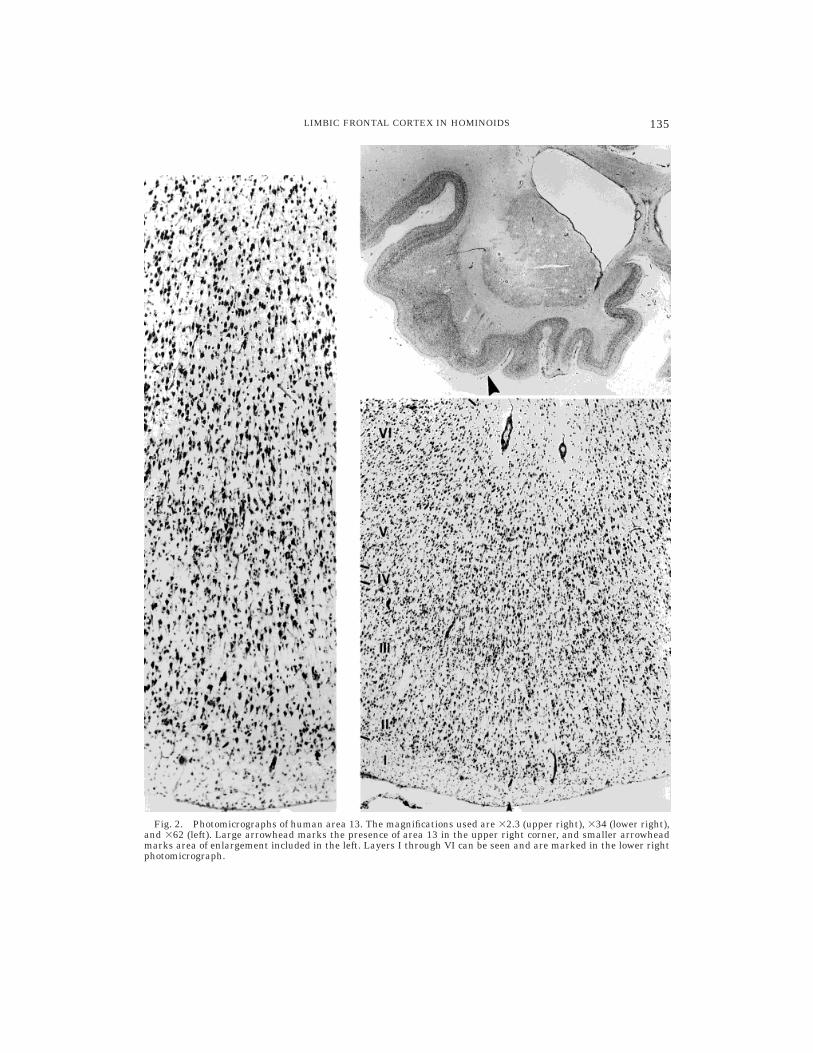
Fig. 2. Photomicrographs of human area 13. The magnifications used are 32.3 (upper right), 334 (lower right),and 362 (left). Large arrowhead marks the presence of area 13 in the upper right corner, and smaller arrowheadmarks area of enlargement included in the left. Layers I through VI can be seen and are marked in the lower rightphotomicrograph.
135LIMBIC FRONTAL CORTEX IN HOMINOIDS
cannot be considered incipient. Caudally,the orbitofrontal cortex does not have layerIV, and eventually the cortex disappears.
Medially area 13 is bound by the olfactorytrigone and the cortex of the gyrus rectus.The latter exhibits a very different andcharacteristic structure including a veryprominent and darkly stained layer II, anddense but thin layers V and VI. These fea-tures are present in the posterior medialorbital gyrus in more-rostral sections. To thelateral side of area 13, the horizontal stri-ated appearance of the cells is completelylost, layer IV is absent, and layer III in-cludes particularly prominent pyramids.
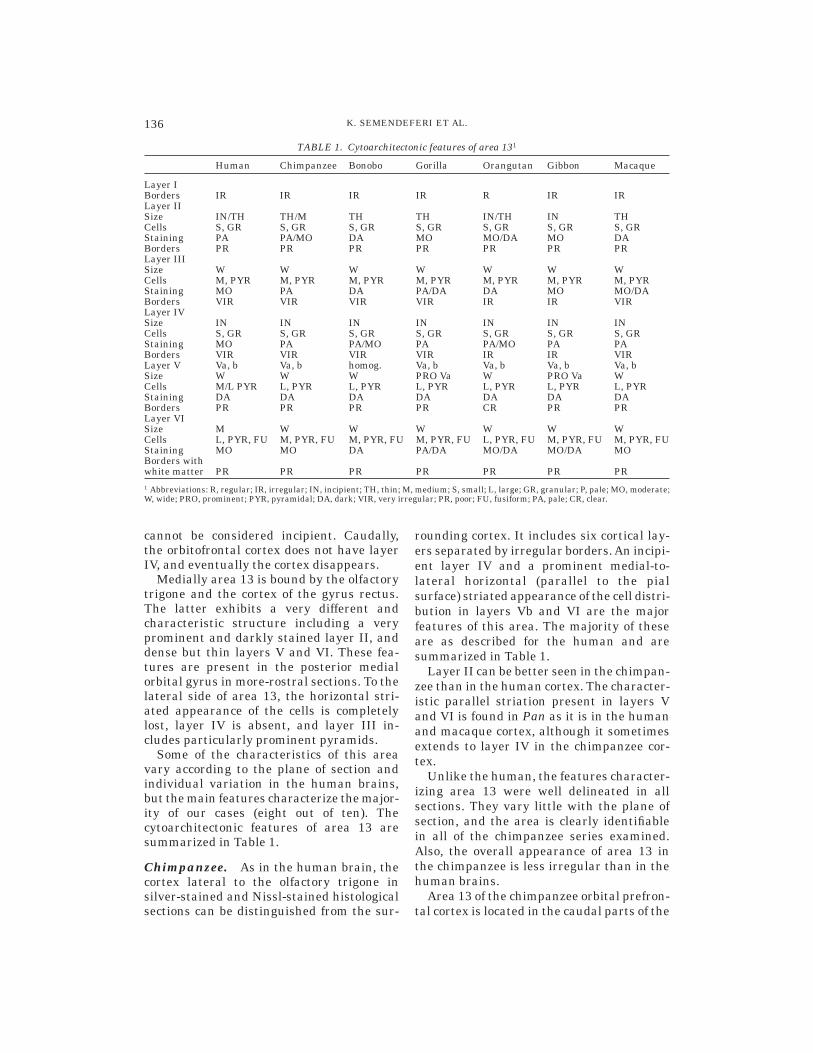
Some of the characteristics of this areavary according to the plane of section andindividual variation in the human brains,but the main features characterize the major-ity of our cases (eight out of ten). Thecytoarchitectonic features of area 13 aresummarized in Table 1.
Chimpanzee. As in the human brain, thecortex lateral to the olfactory trigone insilver-stained and Nissl-stained histologicalsections can be distinguished from the sur-
rounding cortex. It includes six cortical lay-ers separated by irregular borders.An incipi-ent layer IV and a prominent medial-to-lateral horizontal (parallel to the pialsurface) striated appearance of the cell distri-bution in layers Vb and VI are the majorfeatures of this area. The majority of theseare as described for the human and aresummarized in Table 1.
Layer II can be better seen in the chimpan-zee than in the human cortex. The character-istic parallel striation present in layers Vand VI is found in Pan as it is in the humanand macaque cortex, although it sometimesextends to layer IV in the chimpanzee cor-tex.
Unlike the human, the features character-izing area 13 were well delineated in allsections. They vary little with the plane ofsection, and the area is clearly identifiablein all of the chimpanzee series examined.Also, the overall appearance of area 13 inthe chimpanzee is less irregular than in thehuman brains.
Area 13 of the chimpanzee orbital prefron-tal cortex is located in the caudal parts of the
TABLE 1. Cytoarchitectonic features of area 131
Human Chimpanzee Bonobo Gorilla Orangutan Gibbon Macaque
Layer IBorders IR IR IR IR R IR IRLayer IISize IN/TH TH/M TH TH IN/TH IN THCells S, GR S, GR S, GR S, GR S, GR S, GR S, GRStaining PA PA/MO DA MO MO/DA MO DABorders PR PR PR PR PR PR PRLayer IIISize W W W W W W WCells M, PYR M, PYR M, PYR M, PYR M, PYR M, PYR M, PYRStaining MO PA DA PA/DA DA MO MO/DABorders VIR VIR VIR VIR IR IR VIRLayer IVSize IN IN IN IN IN IN INCells S, GR S, GR S, GR S, GR S, GR S, GR S, GRStaining MO PA PA/MO PA PA/MO PA PABorders VIR VIR VIR VIR IR IR VIRLayer V Va, b Va, b homog. Va, b Va, b Va, b Va, bSize W W W PRO Va W PRO Va WCells M/L PYR L, PYR L, PYR L, PYR L, PYR L, PYR L, PYRStaining DA DA DA DA DA DA DABorders PR PR PR PR CR PR PRLayer VISize M W W W W W WCells L, PYR, FU M, PYR, FU M, PYR, FU M, PYR, FU L, PYR, FU M, PYR, FU M, PYR, FUStaining MO MO DA PA/DA MO/DA MO/DA MOBorders withwhite matter PR PR PR PR PR PR PR1 Abbreviations: R, regular; IR, irregular; IN, incipient; TH, thin; M, medium; S, small; L, large; GR, granular; P, pale; MO, moderate;W, wide; PRO, prominent; PYR, pyramidal; DA, dark; VIR, very irregular; PR, poor; FU, fusiform; PA, pale; CR, clear.
136 K. SEMENDEFERI ET AL.
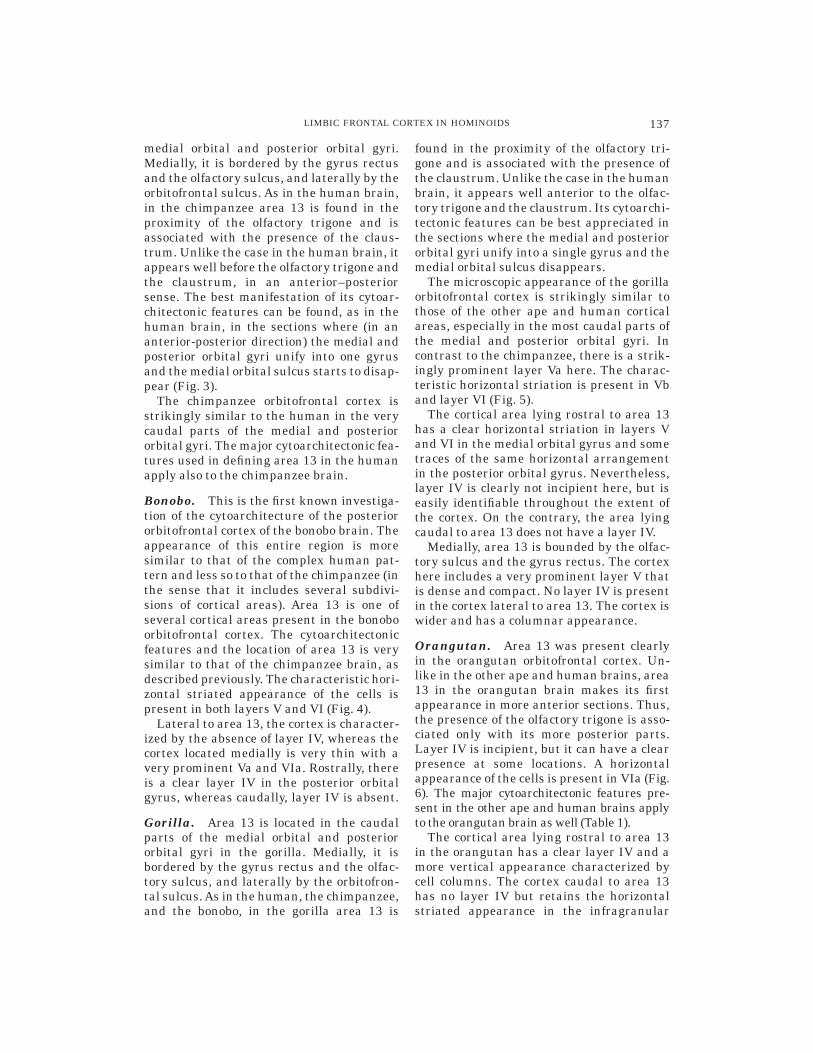
medial orbital and posterior orbital gyri.Medially, it is bordered by the gyrus rectusand the olfactory sulcus, and laterally by theorbitofrontal sulcus. As in the human brain,in the chimpanzee area 13 is found in theproximity of the olfactory trigone and isassociated with the presence of the claus-trum. Unlike the case in the human brain, itappears well before the olfactory trigone andthe claustrum, in an anterior–posteriorsense. The best manifestation of its cytoar-chitectonic features can be found, as in thehuman brain, in the sections where (in ananterior-posterior direction) the medial andposterior orbital gyri unify into one gyrusand the medial orbital sulcus starts to disap-pear (Fig. 3).
The chimpanzee orbitofrontal cortex isstrikingly similar to the human in the verycaudal parts of the medial and posteriororbital gyri. The major cytoarchitectonic fea-tures used in defining area 13 in the humanapply also to the chimpanzee brain.
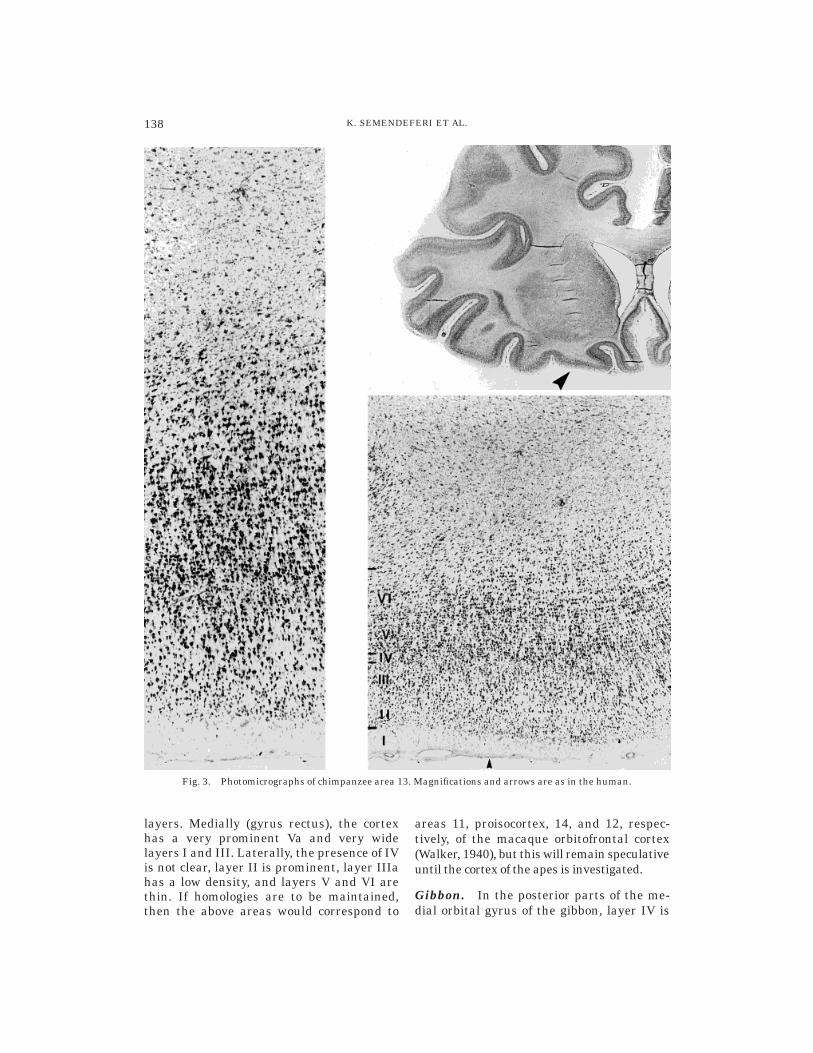
Bonobo. This is the first known investiga-tion of the cytoarchitecture of the posteriororbitofrontal cortex of the bonobo brain. Theappearance of this entire region is moresimilar to that of the complex human pat-tern and less so to that of the chimpanzee (inthe sense that it includes several subdivi-sions of cortical areas). Area 13 is one ofseveral cortical areas present in the bonoboorbitofrontal cortex. The cytoarchitectonicfeatures and the location of area 13 is verysimilar to that of the chimpanzee brain, asdescribed previously. The characteristic hori-zontal striated appearance of the cells ispresent in both layers V and VI (Fig. 4).
Lateral to area 13, the cortex is character-ized by the absence of layer IV, whereas thecortex located medially is very thin with avery prominent Va and VIa. Rostrally, thereis a clear layer IV in the posterior orbitalgyrus, whereas caudally, layer IV is absent.
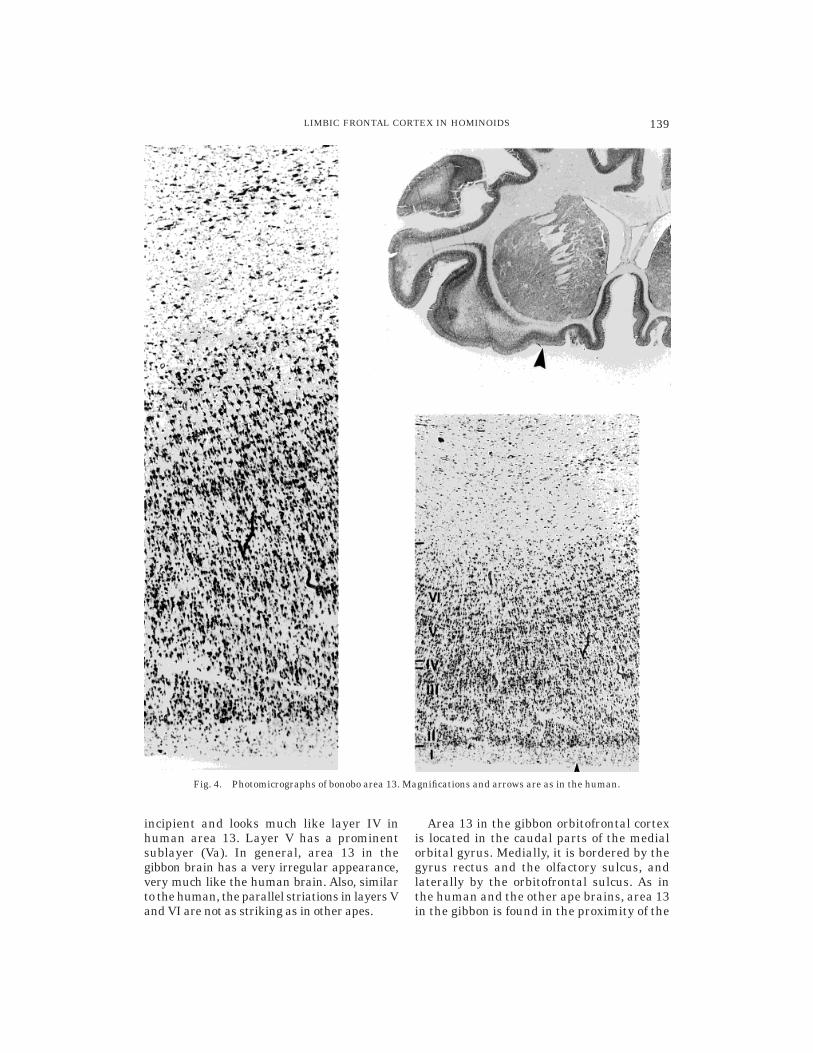
Gorilla. Area 13 is located in the caudalparts of the medial orbital and posteriororbital gyri in the gorilla. Medially, it isbordered by the gyrus rectus and the olfac-tory sulcus, and laterally by the orbitofron-tal sulcus. As in the human, the chimpanzee,and the bonobo, in the gorilla area 13 is
found in the proximity of the olfactory tri-gone and is associated with the presence ofthe claustrum. Unlike the case in the humanbrain, it appears well anterior to the olfac-tory trigone and the claustrum. Its cytoarchi-tectonic features can be best appreciated inthe sections where the medial and posteriororbital gyri unify into a single gyrus and themedial orbital sulcus disappears.
The microscopic appearance of the gorillaorbitofrontal cortex is strikingly similar tothose of the other ape and human corticalareas, especially in the most caudal parts ofthe medial and posterior orbital gyri. Incontrast to the chimpanzee, there is a strik-ingly prominent layer Va here. The charac-teristic horizontal striation is present in Vband layer VI (Fig. 5).
The cortical area lying rostral to area 13has a clear horizontal striation in layers Vand VI in the medial orbital gyrus and sometraces of the same horizontal arrangementin the posterior orbital gyrus. Nevertheless,layer IV is clearly not incipient here, but iseasily identifiable throughout the extent ofthe cortex. On the contrary, the area lyingcaudal to area 13 does not have a layer IV.
Medially, area 13 is bounded by the olfac-tory sulcus and the gyrus rectus. The cortexhere includes a very prominent layer V thatis dense and compact. No layer IV is presentin the cortex lateral to area 13. The cortex iswider and has a columnar appearance.
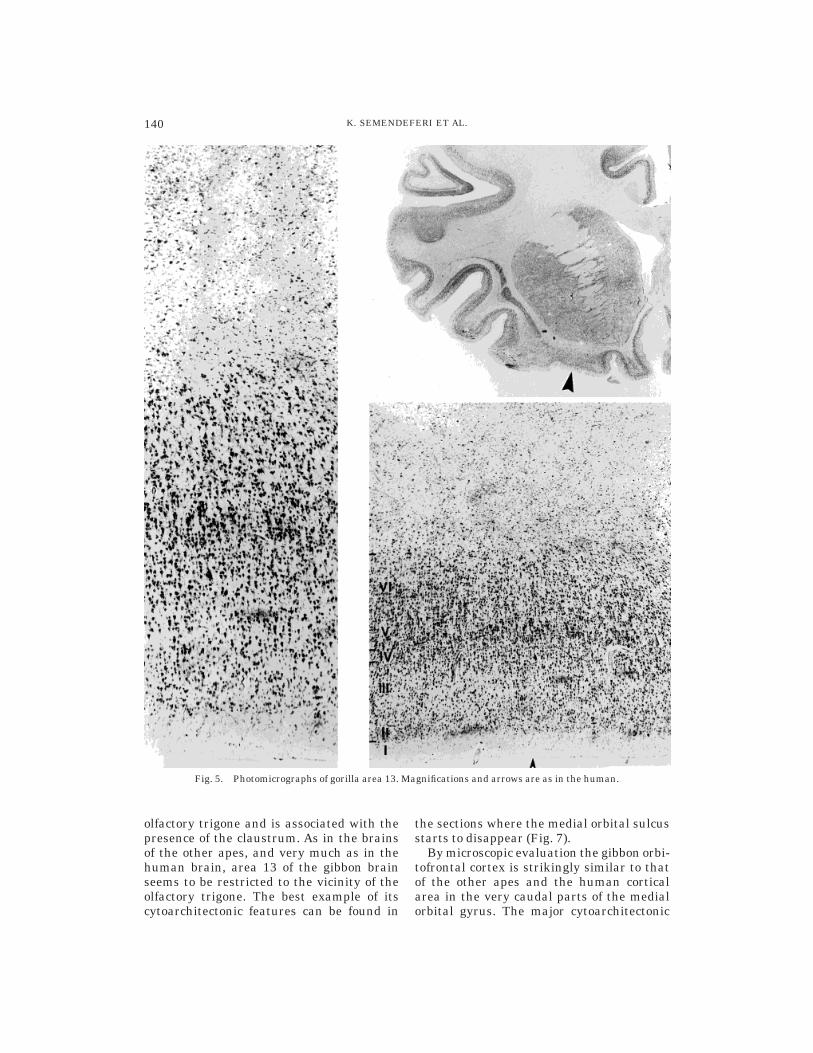
Orangutan. Area 13 was present clearlyin the orangutan orbitofrontal cortex. Un-like in the other ape and human brains, area13 in the orangutan brain makes its firstappearance in more anterior sections. Thus,the presence of the olfactory trigone is asso-ciated only with its more posterior parts.Layer IV is incipient, but it can have a clearpresence at some locations. A horizontalappearance of the cells is present in VIa (Fig.6). The major cytoarchitectonic features pre-sent in the other ape and human brains applyto the orangutan brain as well (Table 1).
The cortical area lying rostral to area 13in the orangutan has a clear layer IV and amore vertical appearance characterized bycell columns. The cortex caudal to area 13has no layer IV but retains the horizontalstriated appearance in the infragranular
137LIMBIC FRONTAL CORTEX IN HOMINOIDS
layers. Medially (gyrus rectus), the cortexhas a very prominent Va and very widelayers I and III. Laterally, the presence of IVis not clear, layer II is prominent, layer IIIahas a low density, and layers V and VI arethin. If homologies are to be maintained,then the above areas would correspond to
areas 11, proisocortex, 14, and 12, respec-tively, of the macaque orbitofrontal cortex(Walker, 1940), but this will remain speculativeuntil the cortex of the apes is investigated.
Gibbon. In the posterior parts of the me-dial orbital gyrus of the gibbon, layer IV is
Fig. 3. Photomicrographs of chimpanzee area 13. Magnifications and arrows are as in the human.
138 K. SEMENDEFERI ET AL.
incipient and looks much like layer IV inhuman area 13. Layer V has a prominentsublayer (Va). In general, area 13 in thegibbon brain has a very irregular appearance,very much like the human brain. Also, similarto the human, the parallel striations in layers Vand VI are not as striking as in other apes.
Area 13 in the gibbon orbitofrontal cortexis located in the caudal parts of the medialorbital gyrus. Medially, it is bordered by thegyrus rectus and the olfactory sulcus, andlaterally by the orbitofrontal sulcus. As inthe human and the other ape brains, area 13in the gibbon is found in the proximity of the
Fig. 4. Photomicrographs of bonobo area 13. Magnifications and arrows are as in the human.
139LIMBIC FRONTAL CORTEX IN HOMINOIDS
olfactory trigone and is associated with thepresence of the claustrum. As in the brainsof the other apes, and very much as in thehuman brain, area 13 of the gibbon brainseems to be restricted to the vicinity of theolfactory trigone. The best example of itscytoarchitectonic features can be found in
the sections where the medial orbital sulcusstarts to disappear (Fig. 7).
By microscopic evaluation the gibbon orbi-tofrontal cortex is strikingly similar to thatof the other apes and the human corticalarea in the very caudal parts of the medialorbital gyrus. The major cytoarchitectonic
Fig. 5. Photomicrographs of gorilla area 13. Magnifications and arrows are as in the human.
140 K. SEMENDEFERI ET AL.
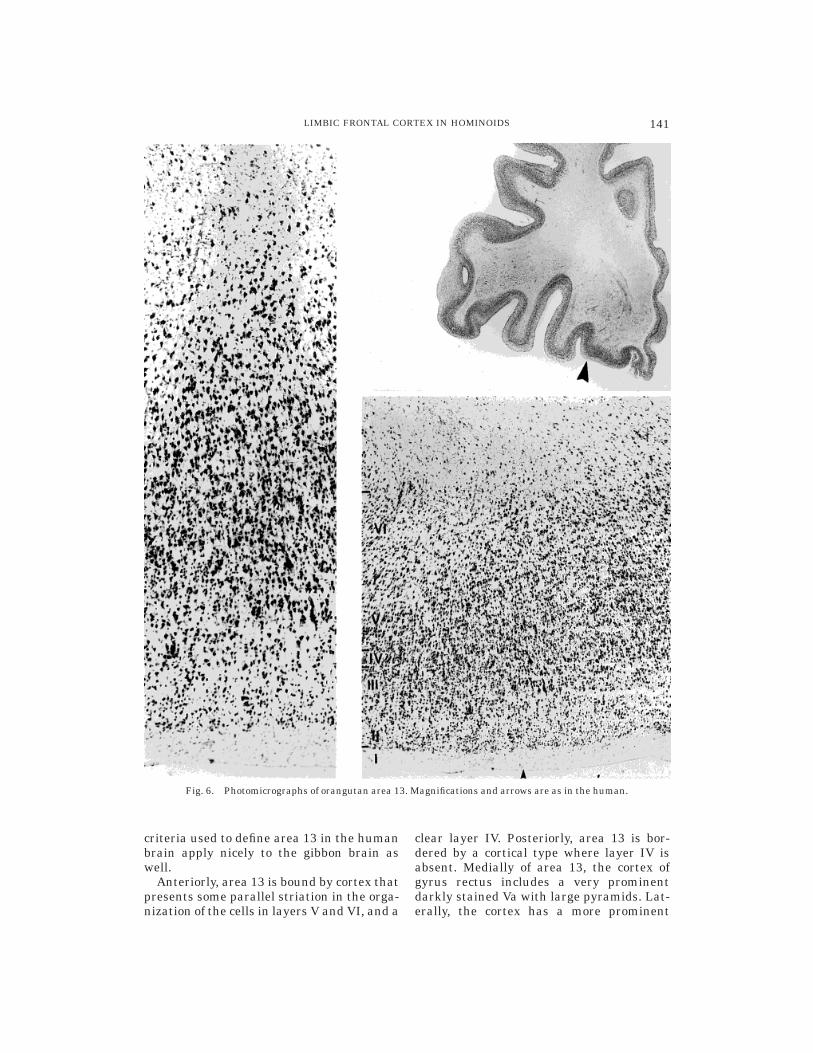
criteria used to define area 13 in the humanbrain apply nicely to the gibbon brain aswell.
Anteriorly, area 13 is bound by cortex thatpresents some parallel striation in the orga-nization of the cells in layers V and VI, and a
clear layer IV. Posteriorly, area 13 is bor-dered by a cortical type where layer IV isabsent. Medially of area 13, the cortex ofgyrus rectus includes a very prominentdarkly stained Va with large pyramids. Lat-erally, the cortex has a more prominent
Fig. 6. Photomicrographs of orangutan area 13. Magnifications and arrows are as in the human.
141LIMBIC FRONTAL CORTEX IN HOMINOIDS

vertical organization, a better-outlined andprominent Va, and a layer IV.Macaque. Area 13 in the macaque hasbeen extensively described by many re-searchers. The present analysis agrees withthe reports of most other investigators re-garding its main characteristics (Barbas andPandya, 1989; Preuss and Goldman-Rakic,1991; Morecraft et al., 1992; Carmichael and
Price, 1994). Layer IV is incipient, althoughat some locations it has a clear presencesimilar to the orangutan.
The cortex rostral to area 13 has a distinctlayer IV, a very prominent layer V, and ahorizontally striated appearance of the cellsin layers IV and V, which contrasts with thatof area 13. Caudally the above cortex ‘‘shifts’’medially toward gyrus rectus and area 13
Fig. 7. Photomicrographs of gibbon area 13. Magnifications and arrows are as in the human.
142 K. SEMENDEFERI ET AL.
appears laterally. The cortex caudal to area13 does not have a layer IV, whereas thecortex lying laterally does. The cortex lo-cated medial to area 13 has a clear horizon-tally striated appearance in the cell layersIII, V, and VI. Layer Va is very prominent.The cortex lateral to area 13 has a very clearlayer IV (area 12). It should be noted thatlayer IV in area 13 of the macaque is more‘‘robust’’ than in the apes and humans, andas a whole, area 13 in the macaque has amore homogeneous appearance than area 13in the hominoids.
It is clear from a qualitative perspectivethat the cytoarchitectonic features of area13 in the well-studied macaque are presentin the posterior parts of the orbital cortex ofall hominoids. Cortical area 13 is a distinctunit in the medial orbital and posteriororbital gyri of the human, chimpanzee,bonobo, gorilla, and orangutan brain, as wellas in the medial orbital gyrus of the gibbonbrain.
Size
Total volume of the brain and of area 13,as well as length of the hemisphere, of theorbitofrontal cortex, and of area 13 (in ananterior-posterior direction), were deter-mined for all species.
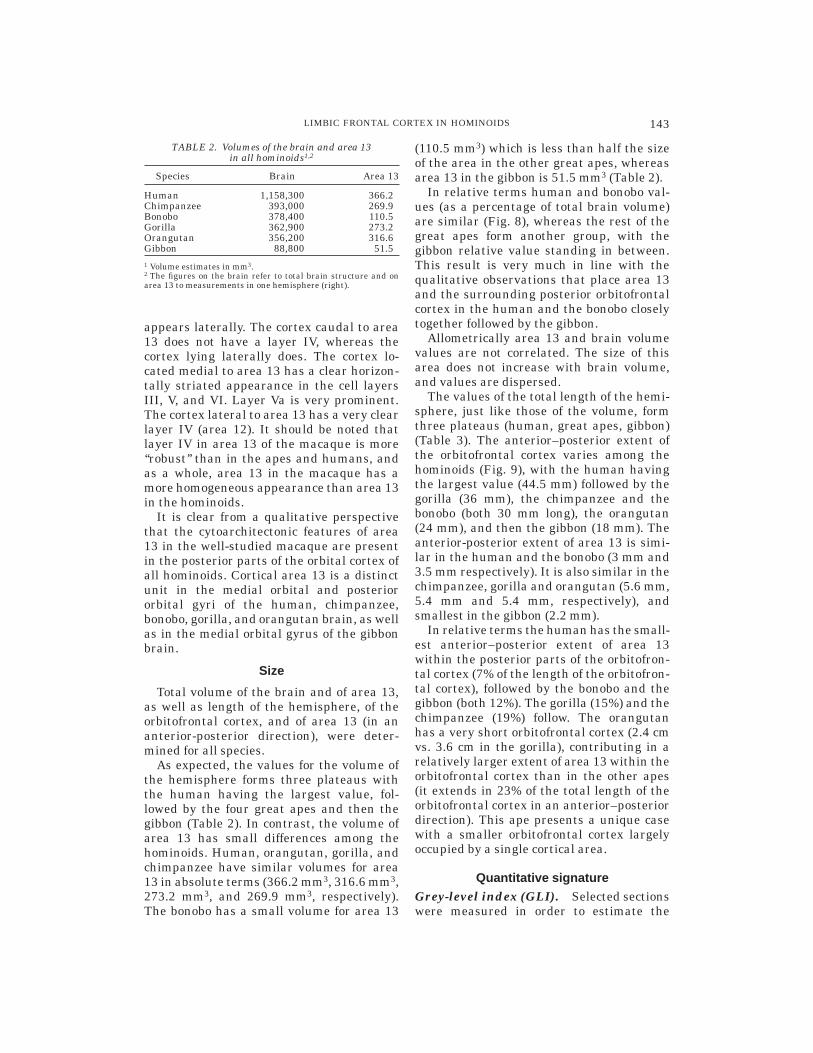
As expected, the values for the volume ofthe hemisphere forms three plateaus withthe human having the largest value, fol-lowed by the four great apes and then thegibbon (Table 2). In contrast, the volume ofarea 13 has small differences among thehominoids. Human, orangutan, gorilla, andchimpanzee have similar volumes for area13 in absolute terms (366.2 mm3, 316.6 mm3,273.2 mm3, and 269.9 mm3, respectively).The bonobo has a small volume for area 13
(110.5 mm3) which is less than half the sizeof the area in the other great apes, whereasarea 13 in the gibbon is 51.5 mm3 (Table 2).
In relative terms human and bonobo val-ues (as a percentage of total brain volume)are similar (Fig. 8), whereas the rest of thegreat apes form another group, with thegibbon relative value standing in between.This result is very much in line with thequalitative observations that place area 13and the surrounding posterior orbitofrontalcortex in the human and the bonobo closelytogether followed by the gibbon.
Allometrically area 13 and brain volumevalues are not correlated. The size of thisarea does not increase with brain volume,and values are dispersed.
The values of the total length of the hemi-sphere, just like those of the volume, formthree plateaus (human, great apes, gibbon)(Table 3). The anterior–posterior extent ofthe orbitofrontal cortex varies among thehominoids (Fig. 9), with the human havingthe largest value (44.5 mm) followed by thegorilla (36 mm), the chimpanzee and thebonobo (both 30 mm long), the orangutan(24 mm), and then the gibbon (18 mm). Theanterior-posterior extent of area 13 is simi-lar in the human and the bonobo (3 mm and3.5 mm respectively). It is also similar in thechimpanzee, gorilla and orangutan (5.6 mm,5.4 mm and 5.4 mm, respectively), andsmallest in the gibbon (2.2 mm).
In relative terms the human has the small-est anterior–posterior extent of area 13within the posterior parts of the orbitofron-tal cortex (7% of the length of the orbitofron-tal cortex), followed by the bonobo and thegibbon (both 12%). The gorilla (15%) and thechimpanzee (19%) follow. The orangutanhas a very short orbitofrontal cortex (2.4 cmvs. 3.6 cm in the gorilla), contributing in arelatively larger extent of area 13 within theorbitofrontal cortex than in the other apes(it extends in 23% of the total length of theorbitofrontal cortex in an anterior–posteriordirection). This ape presents a unique casewith a smaller orbitofrontal cortex largelyoccupied by a single cortical area.
Quantitative signatureGrey-level index (GLI). Selected sectionswere measured in order to estimate the
TABLE 2. Volumes of the brain and area 13in all hominoids1,2
Species Brain Area 13
Human 1,158,300 366.2Chimpanzee 393,000 269.9Bonobo 378,400 110.5Gorilla 362,900 273.2Orangutan 356,200 316.6Gibbon 88,800 51.51 Volume estimates in mm3.2 The figures on the brain refer to total brain structure and onarea 13 to measurements in one hemisphere (right).
143LIMBIC FRONTAL CORTEX IN HOMINOIDS

areal percentage of the cortex covered bystained particles versus neuropil space. HighGLI values indicate increased space occu-pied by cell bodies, whereas lower GLI val-ues may suggest increased space filled withneural processes, such as dendrites andaxons (Schlaug et al., 1993).
The mean values for area 13, including allcortical layers (II through VI), as well as themean value for the supragranular (or outer)layers (II and III), granular layer IV, and infra-granular layers (V and VI) are given in Table 4.
The lowest mean GLI value for area 13 isthat of the gibbon brain (13.33), followedimmediately by the human and the gorilla(14.18 and 14.62, respectively). Next comethe bonobo (16.98), macaque (18.36), orangu-tan (18.55), and chimpanzee (18.63). Thedistribution of the values among the layers
is as follows: The granular layer (layer IV)has in every species the highest GLI value(ranging from 15 to 20), whereas supragranu-lar values are somewhat lower than thevalues in the infragranular layers in mostspecies, with the exception of the bonobo andthe macaque, in which values are similar inthe supra- and infragranular layers.
The small differences in the GLI valuesbetween the supra- and infragranular layersis in agreement with the qualitative analy-sis of the microscopic sections, where nomajor differences were observed in cell sizeor cell density throughout the depth of thecortex in area 13. Nevertheless the smalldifferences (infragranular layers reachslightly higher values than the supragranu-lar layers) suggest that the infragranularlayers are more densely populated or in-clude larger neurons than the supragranu-lar ones.
The variation in the percentage of spaceoccupied by cell bodies versus neuropil spacecan be illustrated in the form of profiles (Fig.10). In such a profile the x-axis representsthe cortical depth and the y-axis representsthe GLI values. The profiles start at the pialsurface and extend to the border of layer VIwith the white matter.
Fig. 8. Absolute and relative size of area 13.
TABLE 3. Length of the right hemisphere, orbitofrontalcortex, and area 13 (in mm)
Species HemisphereOrbitofrontal
cortex Area 13
Human 151.5 44.5 3.0Chimpanzee 85.0 30.0 5.6Bonobo 90.0 30.0 3.5Gorilla 97.0 36.0 5.4Orangutan 91.0 24.0 5.4Gibbon 55.0 18.0 2.2
144 K. SEMENDEFERI ET AL.
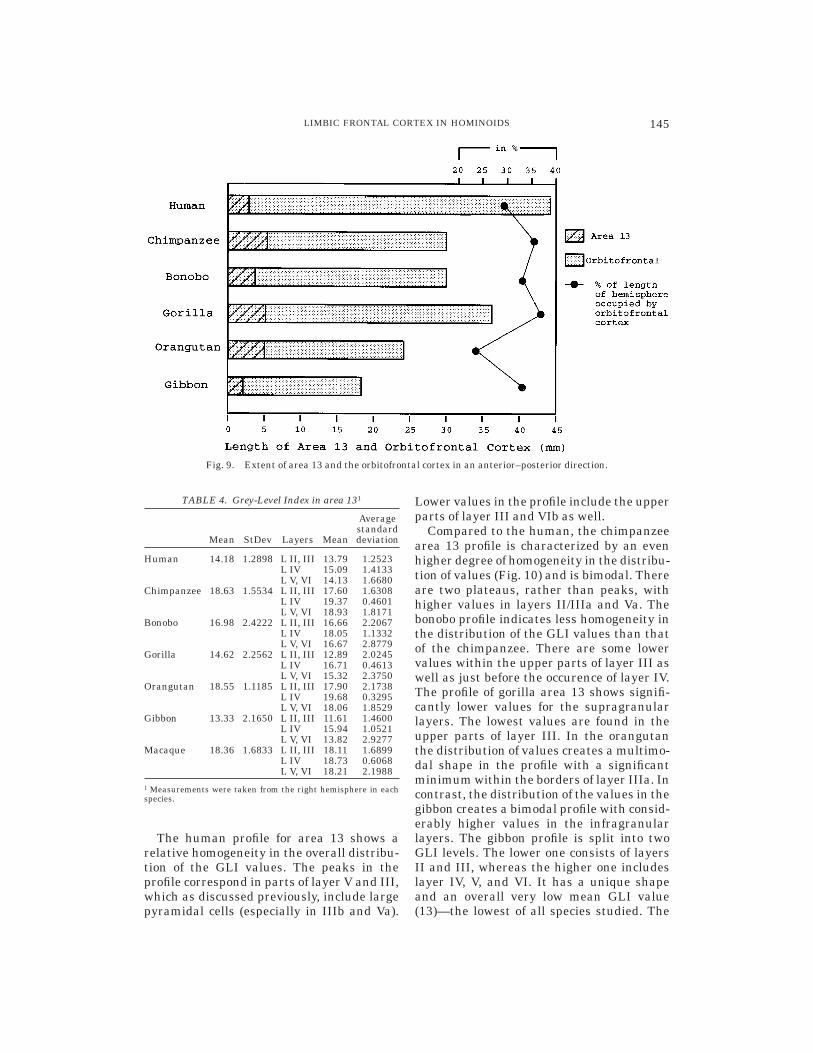
The human profile for area 13 shows arelative homogeneity in the overall distribu-tion of the GLI values. The peaks in theprofile correspond in parts of layer V and III,which as discussed previously, include largepyramidal cells (especially in IIIb and Va).
Lower values in the profile include the upperparts of layer III and VIb as well.
Compared to the human, the chimpanzeearea 13 profile is characterized by an evenhigher degree of homogeneity in the distribu-tion of values (Fig. 10) and is bimodal. Thereare two plateaus, rather than peaks, withhigher values in layers II/IIIa and Va. Thebonobo profile indicates less homogeneity inthe distribution of the GLI values than thatof the chimpanzee. There are some lowervalues within the upper parts of layer III aswell as just before the occurence of layer IV.The profile of gorilla area 13 shows signifi-cantly lower values for the supragranularlayers. The lowest values are found in theupper parts of layer III. In the orangutanthe distribution of values creates a multimo-dal shape in the profile with a significantminimum within the borders of layer IIIa. Incontrast, the distribution of the values in thegibbon creates a bimodal profile with consid-erably higher values in the infragranularlayers. The gibbon profile is split into twoGLI levels. The lower one consists of layersII and III, whereas the higher one includeslayer IV, V, and VI. It has a unique shapeand an overall very low mean GLI value(13)—the lowest of all species studied. The
Fig. 9. Extent of area 13 and the orbitofrontal cortex in an anterior–posterior direction.
TABLE 4. Grey-Level Index in area 131
Mean StDev Layers Mean
Averagestandarddeviation
Human 14.18 1.2898 L II, III 13.79 1.2523L IV 15.09 1.4133L V, VI 14.13 1.6680
Chimpanzee 18.63 1.5534 L II, III 17.60 1.6308L IV 19.37 0.4601L V, VI 18.93 1.8171
Bonobo 16.98 2.4222 L II, III 16.66 2.2067L IV 18.05 1.1332L V, VI 16.67 2.8779
Gorilla 14.62 2.2562 L II, III 12.89 2.0245L IV 16.71 0.4613L V, VI 15.32 2.3750
Orangutan 18.55 1.1185 L II, III 17.90 2.1738L IV 19.68 0.3295L V, VI 18.06 1.8529
Gibbon 13.33 2.1650 L II, III 11.61 1.4600L IV 15.94 1.0521L V, VI 13.82 2.9277
Macaque 18.36 1.6833 L II, III 18.11 1.6899L IV 18.73 0.6068L V, VI 18.21 2.1988
1 Measurements were taken from the right hemisphere in eachspecies.
145LIMBIC FRONTAL CORTEX IN HOMINOIDS
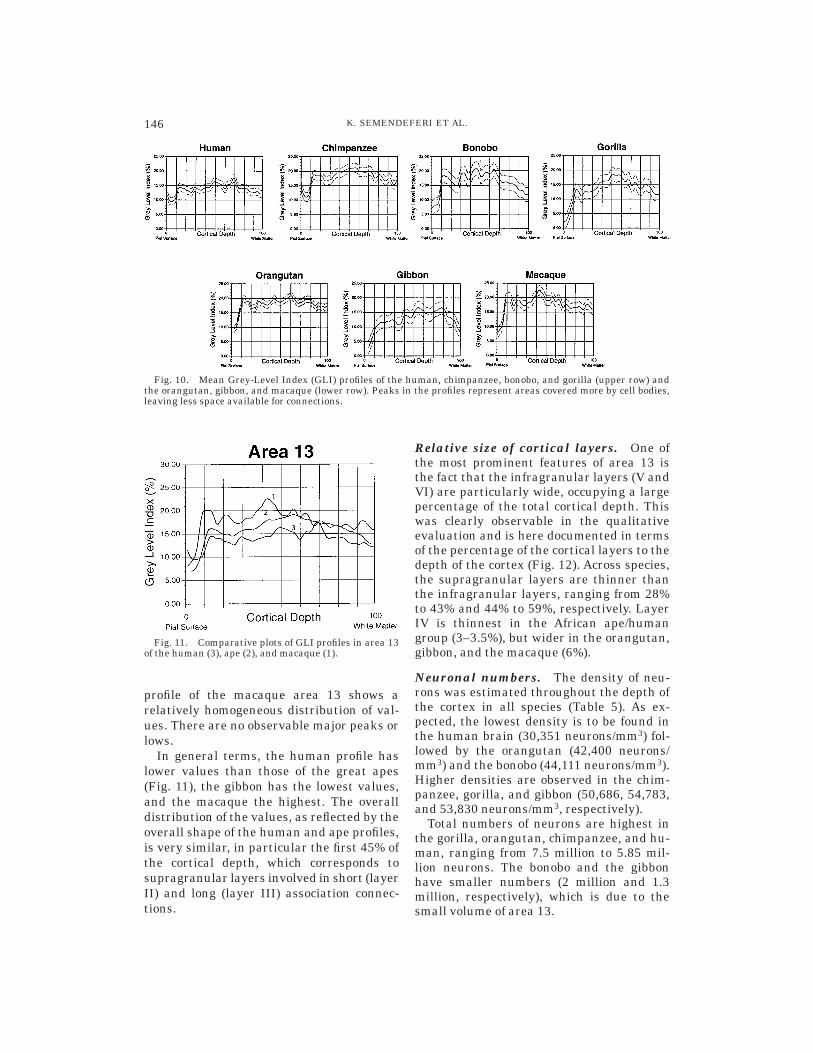
profile of the macaque area 13 shows arelatively homogeneous distribution of val-ues. There are no observable major peaks orlows.
In general terms, the human profile haslower values than those of the great apes(Fig. 11), the gibbon has the lowest values,and the macaque the highest. The overalldistribution of the values, as reflected by theoverall shape of the human and ape profiles,is very similar, in particular the first 45% ofthe cortical depth, which corresponds tosupragranular layers involved in short (layerII) and long (layer III) association connec-tions.
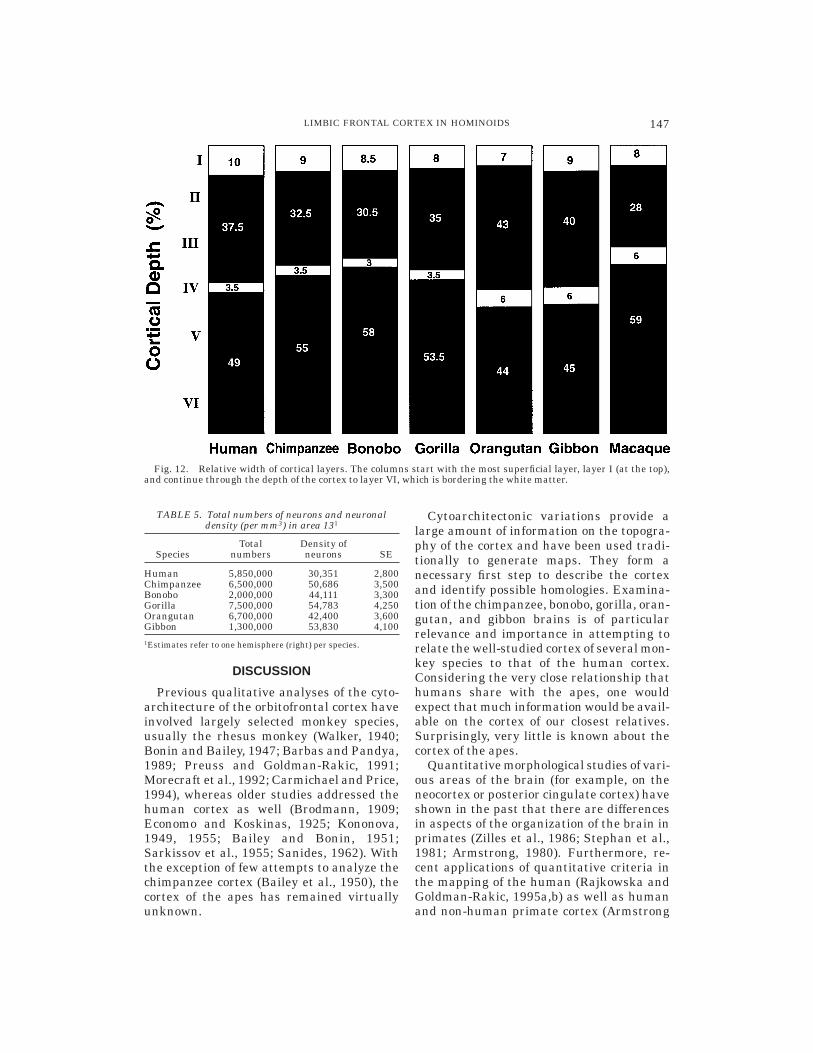
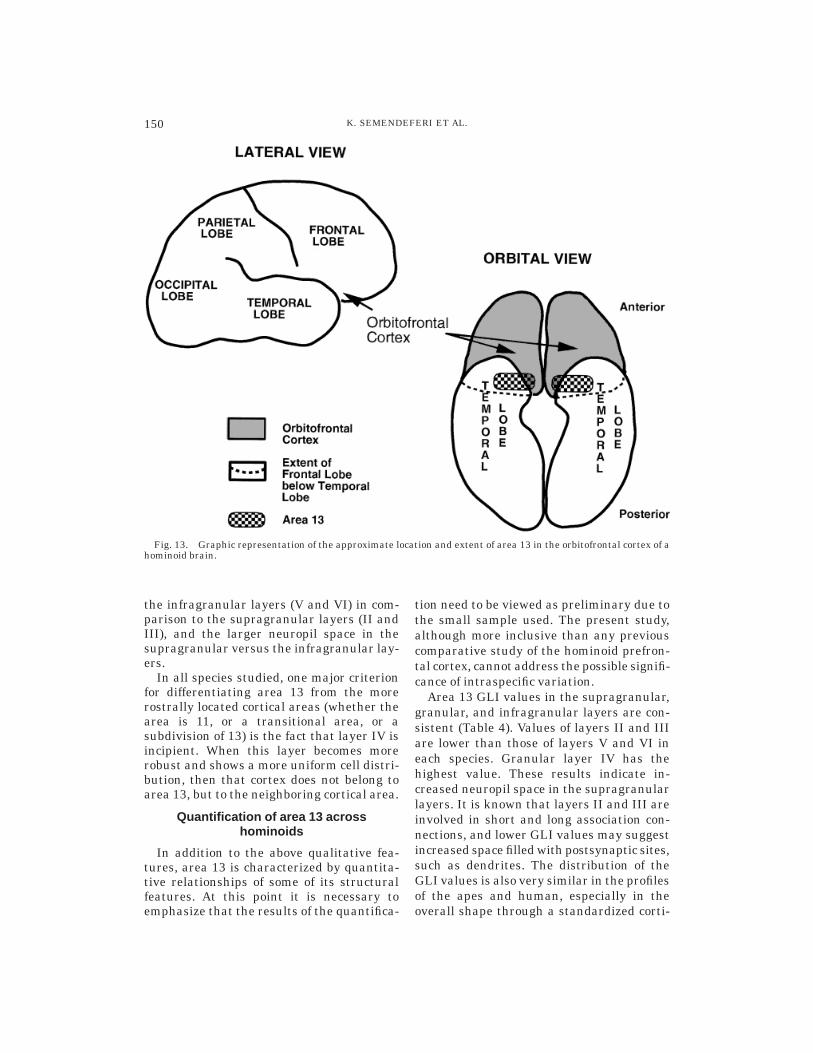
Relative size of cortical layers. One ofthe most prominent features of area 13 isthe fact that the infragranular layers (V andVI) are particularly wide, occupying a largepercentage of the total cortical depth. Thiswas clearly observable in the qualitativeevaluation and is here documented in termsof the percentage of the cortical layers to thedepth of the cortex (Fig. 12). Across species,the supragranular layers are thinner thanthe infragranular layers, ranging from 28%to 43% and 44% to 59%, respectively. LayerIV is thinnest in the African ape/humangroup (3–3.5%), but wider in the orangutan,gibbon, and the macaque (6%).
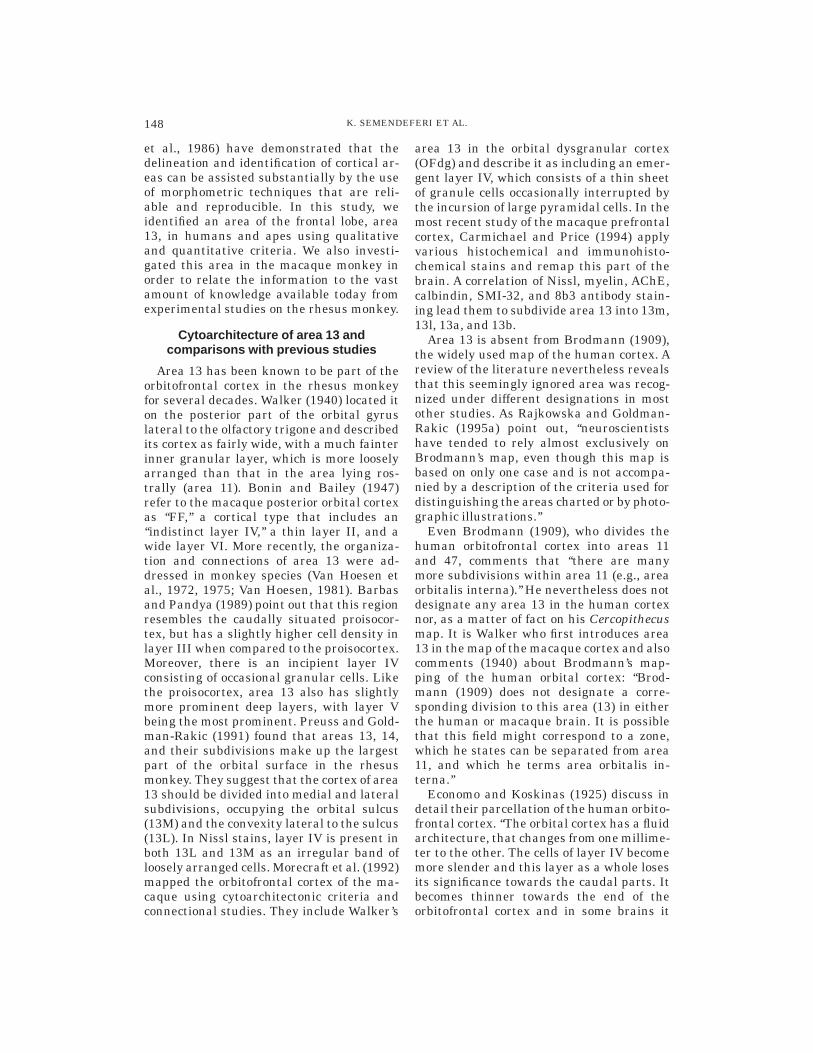
Neuronal numbers. The density of neu-rons was estimated throughout the depth ofthe cortex in all species (Table 5). As ex-pected, the lowest density is to be found inthe human brain (30,351 neurons/mm3) fol-lowed by the orangutan (42,400 neurons/mm3) and the bonobo (44,111 neurons/mm3).Higher densities are observed in the chim-panzee, gorilla, and gibbon (50,686, 54,783,and 53,830 neurons/mm3, respectively).
Total numbers of neurons are highest inthe gorilla, orangutan, chimpanzee, and hu-man, ranging from 7.5 million to 5.85 mil-lion neurons. The bonobo and the gibbonhave smaller numbers (2 million and 1.3million, respectively), which is due to thesmall volume of area 13.
Fig. 10. Mean Grey-Level Index (GLI) profiles of the human, chimpanzee, bonobo, and gorilla (upper row) andthe orangutan, gibbon, and macaque (lower row). Peaks in the profiles represent areas covered more by cell bodies,leaving less space available for connections.
Fig. 11. Comparative plots of GLI profiles in area 13of the human (3), ape (2), and macaque (1).
146 K. SEMENDEFERI ET AL.
DISCUSSION
Previous qualitative analyses of the cyto-architecture of the orbitofrontal cortex haveinvolved largely selected monkey species,usually the rhesus monkey (Walker, 1940;Bonin and Bailey, 1947; Barbas and Pandya,1989; Preuss and Goldman-Rakic, 1991;Morecraft et al., 1992; Carmichael and Price,1994), whereas older studies addressed thehuman cortex as well (Brodmann, 1909;Economo and Koskinas, 1925; Kononova,1949, 1955; Bailey and Bonin, 1951;Sarkissov et al., 1955; Sanides, 1962). Withthe exception of few attempts to analyze thechimpanzee cortex (Bailey et al., 1950), thecortex of the apes has remained virtuallyunknown.
Cytoarchitectonic variations provide alarge amount of information on the topogra-phy of the cortex and have been used tradi-tionally to generate maps. They form anecessary first step to describe the cortexand identify possible homologies. Examina-tion of the chimpanzee, bonobo, gorilla, oran-gutan, and gibbon brains is of particularrelevance and importance in attempting torelate the well-studied cortex of several mon-key species to that of the human cortex.Considering the very close relationship thathumans share with the apes, one wouldexpect that much information would be avail-able on the cortex of our closest relatives.Surprisingly, very little is known about thecortex of the apes.
Quantitative morphological studies of vari-ous areas of the brain (for example, on theneocortex or posterior cingulate cortex) haveshown in the past that there are differencesin aspects of the organization of the brain inprimates (Zilles et al., 1986; Stephan et al.,1981; Armstrong, 1980). Furthermore, re-cent applications of quantitative criteria inthe mapping of the human (Rajkowska andGoldman-Rakic, 1995a,b) as well as humanand non-human primate cortex (Armstrong
Fig. 12. Relative width of cortical layers. The columns start with the most superficial layer, layer I (at the top),and continue through the depth of the cortex to layer VI, which is bordering the white matter.
TABLE 5. Total numbers of neurons and neuronaldensity (per mm3) in area 131
SpeciesTotal
numbersDensity ofneurons SE
Human 5,850,000 30,351 2,800Chimpanzee 6,500,000 50,686 3,500Bonobo 2,000,000 44,111 3,300Gorilla 7,500,000 54,783 4,250Orangutan 6,700,000 42,400 3,600Gibbon 1,300,000 53,830 4,1001Estimates refer to one hemisphere (right) per species.
147LIMBIC FRONTAL CORTEX IN HOMINOIDS
et al., 1986) have demonstrated that thedelineation and identification of cortical ar-eas can be assisted substantially by the useof morphometric techniques that are reli-able and reproducible. In this study, weidentified an area of the frontal lobe, area13, in humans and apes using qualitativeand quantitative criteria. We also investi-gated this area in the macaque monkey inorder to relate the information to the vastamount of knowledge available today fromexperimental studies on the rhesus monkey.
Cytoarchitecture of area 13 andcomparisons with previous studies
Area 13 has been known to be part of theorbitofrontal cortex in the rhesus monkeyfor several decades. Walker (1940) located iton the posterior part of the orbital gyruslateral to the olfactory trigone and describedits cortex as fairly wide, with a much fainterinner granular layer, which is more looselyarranged than that in the area lying ros-trally (area 11). Bonin and Bailey (1947)refer to the macaque posterior orbital cortexas ‘‘FF,’’ a cortical type that includes an‘‘indistinct layer IV,’’ a thin layer II, and awide layer VI. More recently, the organiza-tion and connections of area 13 were ad-dressed in monkey species (Van Hoesen etal., 1972, 1975; Van Hoesen, 1981). Barbasand Pandya (1989) point out that this regionresembles the caudally situated proisocor-tex, but has a slightly higher cell density inlayer III when compared to the proisocortex.Moreover, there is an incipient layer IVconsisting of occasional granular cells. Likethe proisocortex, area 13 also has slightlymore prominent deep layers, with layer Vbeing the most prominent. Preuss and Gold-man-Rakic (1991) found that areas 13, 14,and their subdivisions make up the largestpart of the orbital surface in the rhesusmonkey. They suggest that the cortex of area13 should be divided into medial and lateralsubdivisions, occupying the orbital sulcus(13M) and the convexity lateral to the sulcus(13L). In Nissl stains, layer IV is present inboth 13L and 13M as an irregular band ofloosely arranged cells. Morecraft et al. (1992)mapped the orbitofrontal cortex of the ma-caque using cytoarchitectonic criteria andconnectional studies. They include Walker’s
area 13 in the orbital dysgranular cortex(OFdg) and describe it as including an emer-gent layer IV, which consists of a thin sheetof granule cells occasionally interrupted bythe incursion of large pyramidal cells. In themost recent study of the macaque prefrontalcortex, Carmichael and Price (1994) applyvarious histochemical and immunohisto-chemical stains and remap this part of thebrain. A correlation of Nissl, myelin, AChE,calbindin, SMI-32, and 8b3 antibody stain-ing lead them to subdivide area 13 into 13m,13l, 13a, and 13b.
Area 13 is absent from Brodmann (1909),the widely used map of the human cortex. Areview of the literature nevertheless revealsthat this seemingly ignored area was recog-nized under different designations in mostother studies. As Rajkowska and Goldman-Rakic (1995a) point out, ‘‘neuroscientistshave tended to rely almost exclusively onBrodmann’s map, even though this map isbased on only one case and is not accompa-nied by a description of the criteria used fordistinguishing the areas charted or by photo-graphic illustrations.’’
Even Brodmann (1909), who divides thehuman orbitofrontal cortex into areas 11and 47, comments that ‘‘there are manymore subdivisions within area 11 (e.g., areaorbitalis interna).’’ He nevertheless does notdesignate any area 13 in the human cortexnor, as a matter of fact on his Cercopithecusmap. It is Walker who first introduces area13 in the map of the macaque cortex and alsocomments (1940) about Brodmann’s map-ping of the human orbital cortex: ‘‘Brod-mann (1909) does not designate a corre-sponding division to this area (13) in eitherthe human or macaque brain. It is possiblethat this field might correspond to a zone,which he states can be separated from area11, and which he terms area orbitalis in-terna.’’
Economo and Koskinas (1925) discuss indetail their parcellation of the human orbito-frontal cortex. ‘‘The orbital cortex has a fluidarchitecture, that changes from one millime-ter to the other. The cells of layer IV becomemore slender and this layer as a whole losesits significance towards the caudal parts. Itbecomes thinner towards the end of theorbitofrontal cortex and in some brains it
148 K. SEMENDEFERI ET AL.
eventually disappears and FF seems to beagranular in these cases’’ (1925).
Bailey and Bonin (1951) state that ‘‘com-ing from subhuman primates we are moreimpressed by the astounding homogeneity ofthe human cortex than by its divisibility intoa host of elemental organs as Brodmannwould have it.’’ Throughout their book theycriticize previous attempts to map the hu-man brain and they break down the humanisocortex into only a few major cortical types.At the same time, Bailey and Bonin recog-nize two prominent trends present in theorbitofrontal cortex: ‘‘the gradual disappear-ance of the inner granular layer as theposterior margin of the orbital surface isapproached, and the gradual appearance ofallocortical characteristics as the gyrus rec-tus is approached. The overlapping of thesetwo tendencies make possible numerous sub-divisions.’’ It is of interest to note that evenvon Bonin and Bailey, who severely criticizeothers’ attempts for multiple subdivisions ofthe cortex, admit to the following: ‘‘E. Beckhas some justification for extending Brod-mann’s area 13, which that author recog-nized in Hapale and Lemur, to the posteriorzone of the orbital cortex’’ (1951).
Beck (1949) compared the posterior partsof the orbitofrontal cortex in the macaqueand in humans. She found a clear structuralhomologue to the macaque area 13 in thehuman cortex, and furthermore states that‘‘area 13 in man is far more restricted . . .’’and ‘‘can be termed an agranular subdivi-sion of area 11. It retains all the maincharacteristics of area 11, including a verymarked layer Va with especially large cellstowards the posterior end and a well-developed layer Vla. The latter two featuresgive rise to distinct horizontal striation,which also constitutes the main differencefrom area posterior. The transition fromgranular to agranular cortex is gradual, butextends only over 100 sections as comparedwith 200 on gyrus rectus’’ (Beck, 1949).
Sanides (1964), who mapped the humanfrontal lobes, includes the posterior parts ofthe orbitofrontal cortex within what henames FoZ. He notices ‘‘a stepwise granular-ization and stronger lamination as well asdiminishing of V pyramids with an increas-ing accentuation of IIIc pyramids and de-
creasing overall cell size at the same time’’(1964), as one moves from the most caudalparts of the orbital cortex toward the frontalpole. Furthermore, ‘‘The caudal fields of theorbital cortex reveal the rhinencephalic influ-ence, moreover, in the less pronounced layer-ing and fainter granularization. This is consis-tent with the cytoarchitectonic observations ofBeck (1949).’’
It is obvious from the above brief review ofthe literature that most researchers agreethat area 13 is part of the orbital surface ofthe human frontal lobes, which is in agree-ment with the findings presented here.
Regarding the cortex of the apes, it is onlyBailey et al. (1950) who make a comparativecytoarchitectonic analysis of the chimpan-zee cortex. In their discussion of the orbito-frontal cortex, they include areas FE, FF,and FG. In FE they demarcate the orbitalpart of the frontal pole area that, accordingto their figures, occupies the most rostralone-third of the total length of the orbitalsurface. FG represents the cortex of thegyrus rectus, and FF occupies most of themedial and posterior orbital gyri. They de-scribe FF as including an irregular lamina-tion, tenuous layer IV, and a blurred bound-ary with the white matter. Again, ourfindings on the chimpanzee cortex are inagreement with the above descriptions.
Based on silver and Nissl stains, thisstudy of cortical cytoarchitecture estab-lishes that the well-studied macaque area13 has a structural homologue in the brainsof the gibbon, orangutan, gorilla, bonobo,chimpanzee, and human. The observationsmade here on the cytoarchitecture of thispart of the orbitofrontal cortex in the humanbrain are in agreement with most of theolder studies, as presented above, that de-scribe a similar cortical organization undera variety of names.
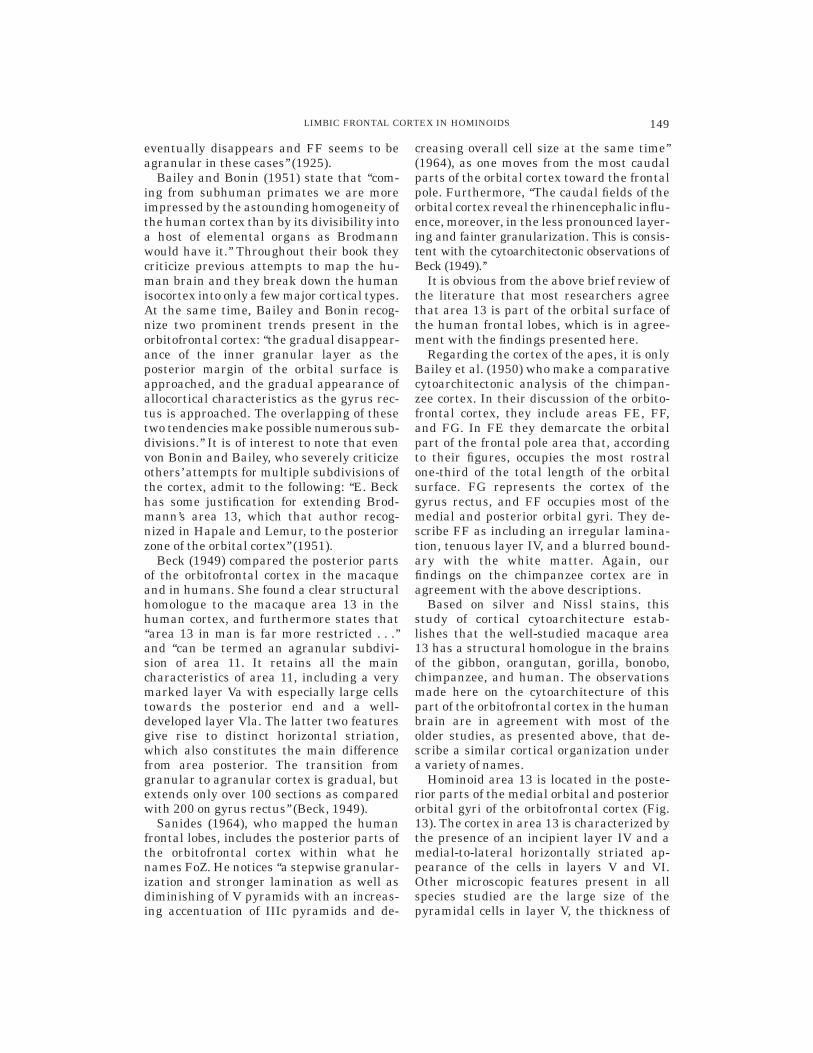
Hominoid area 13 is located in the poste-rior parts of the medial orbital and posteriororbital gyri of the orbitofrontal cortex (Fig.13). The cortex in area 13 is characterized bythe presence of an incipient layer IV and amedial-to-lateral horizontally striated ap-pearance of the cells in layers V and VI.Other microscopic features present in allspecies studied are the large size of thepyramidal cells in layer V, the thickness of
149LIMBIC FRONTAL CORTEX IN HOMINOIDS
the infragranular layers (V and VI) in com-parison to the supragranular layers (II andIII), and the larger neuropil space in thesupragranular versus the infragranular lay-ers.
In all species studied, one major criterionfor differentiating area 13 from the morerostrally located cortical areas (whether thearea is 11, or a transitional area, or asubdivision of 13) is the fact that layer IV isincipient. When this layer becomes morerobust and shows a more uniform cell distri-bution, then that cortex does not belong toarea 13, but to the neighboring cortical area.
Quantification of area 13 acrosshominoids
In addition to the above qualitative fea-tures, area 13 is characterized by quantita-tive relationships of some of its structuralfeatures. At this point it is necessary toemphasize that the results of the quantifica-
tion need to be viewed as preliminary due tothe small sample used. The present study,although more inclusive than any previouscomparative study of the hominoid prefron-tal cortex, cannot address the possible signifi-cance of intraspecific variation.
Area 13 GLI values in the supragranular,granular, and infragranular layers are con-sistent (Table 4). Values of layers II and IIIare lower than those of layers V and VI ineach species. Granular layer IV has thehighest value. These results indicate in-creased neuropil space in the supragranularlayers. It is known that layers II and III areinvolved in short and long association con-nections, and lower GLI values may suggestincreased space filled with postsynaptic sites,such as dendrites. The distribution of theGLI values is also very similar in the profilesof the apes and human, especially in theoverall shape through a standardized corti-
Fig. 13. Graphic representation of the approximate location and extent of area 13 in the orbitofrontal cortex of ahominoid brain.
150 K. SEMENDEFERI ET AL.

cal depth, suggesting a similar distributionof cell types and/or cell sizes.
All hominoids have a similar ratio inwidth of cortical layers (Fig. 12). In all thespecies, the infragranular layers are largerthan the supragranular layers. Layer IV isthinner in the African ape/human group(3–3.5%) and slightly thicker in the orangu-tan, gibbon, and the macaque (6%).
The neuronal density in area 13 is thelowest in the human (30,351 neurons/mm3),followed by the orangutan (42,400 neurons/mm3), the bonobo (44,111 neurons/mm3), thechimpanzee (50,686 neurons/mm3), the gib-bon (53,830 neurons/mm3), and the gorilla(54,783 neurons/mm3). The human value isconsiderably smaller than the ape values,and the density of neurons in area 13 corre-lates with brain volume (r 5 0.87). A highdensity of neurons is observed, as expected,in the small-sized gibbon brain.
The absolute number of neurons in area13 is the largest in the gorilla (7.5 million),followed by the orangutan (6.7 million), thechimpanzee (6.5 million), the human (5.9million), the bonobo (2 million), and thegibbon (1.3 million). Because the absolutenumber of neurons is a function of totalvolume, the low total number of neurons inthe bonobo is attributed to the small size ofarea 13. The similarity of the numbers in thehuman and the other great apes is attrib-uted to similar size as well.
The total volume of area 13 in the righthemisphere of the great apes and humans isvery similar, ranging from 269.9 mm3 in thechimpanzee to 366.2 mm3 in the human(Table 2). The only noticeable exceptionamong the great apes is the bonobo, with110.5 mm3. In this species, the difference inthe volume of the area should be attributedto its restricted relative length (present onlyin a few millimeters of the posterior orbitalcortex, as will be discussed).
The relative (to the entire brain) volume ofarea 13 is very small in humans (0.03%) andbonobos (0.03%) (Fig. 8). The gibbon has amedium relative value (0.06%). The orangu-tan with the highest (0.09%) relative valueis close to that of the gorilla and the chimpan-zee (0.08%).
Another measure of the size of area 13 isits extent in an anterior–posterior direction.
Table 3 includes the absolute values for thelength of area 13, and Figure 9 reflects therelative values for its presence in the lengthof the hemisphere and the orbitofrontal cor-tex. Area 13 in the gibbon has the smallestlength (2.2 mm), followed by the human (3mm) and the bonobo (3.5 mm). Area 13 ismore extended in the macaque (5.8 mm), thechimpanzee (5.6 mm), the orangutan, andthe gorilla (5.4 mm in both apes) (Fig. 9).Obviously its anterior–posterior extent isindependent of brain size.
In relation to the length of the orbitofron-tal cortex, area 13 in the human brain ispresent in only 7% of its length, whereas inthe orangutan it is present in 23% (largestrelative values among the apes). In relativeterms, area 13 of the human brain is presentin only 2% of the total length of the hemi-sphere; in the apes it is present in 3.9% to5.9%. The homogeneity in the distribution ofthe volume values does not match the rela-tive size of the area within the orbitofrontalcortex.
In the human brain, the overall volume ofarea 13 is larger than that in the orangutanbrain (404.8 mm3 versus 316.6 mm3), but itextends for only 3 mm in the orbitofrontalcortex versus 5.4 mm in the orangutan. Thisindicates that the difference in size of thisarea is due to a medial to lateral expansionof the orbitofrontal cortex (that includesarea 13) along with the overall increasedsize of the entire brain, rather than anexpansion in an anterior–posterior direc-tion. If we take into consideration that layerIV becomes more robust in more rostralparts of the orbitofrontal cortex, then thefindings indicate that there may be an in-creased number of cortical areas or subdivi-sions in the human orbitofrontal cortex. Thesame might be true for the bonobo as well.
Three of the great apes (orangutan, go-rilla, and the chimpanzee) have large valuesfor area 13, while the gibbon, bonobo, andhuman have small areas 13 (Fig. 9). Thisindicates that the gibbon, bonobo, and hu-man orbitofrontal cortex have smaller areas13 than would be expected from a hominoidof their brain size. A larger sample numberis desirable, but regarding the uniquenessin the size and organization of the orbitofron-tal sector of the orangutan, this was noticed
151LIMBIC FRONTAL CORTEX IN HOMINOIDS

in several specimens and is thus less likelyto change with the addition of more speci-mens.
CONCLUSIONS
The presence of cortical area 13 has longbeen recognized in the macaque brain(Walker, 1940). Although it was largely ig-nored in the classical parcellations of thecortex (Brodmann, 1909), some early studieshave also acknowledged its distinct featuresin the human brain (Beck, 1949). The pre-sent study reveals that humans, great apes(Pan troglodytes, Pan paniscus, Gorilla go-rilla, Pongo pygmaeus), and lesser apes (Hy-lobates lar) have a distinct area 13 located inthe posterior parts of their orbitofrontalcortex.
In all hominoids this cortical area is char-acterized by the presence of several commoncytoarchitectonic features that set it apartfrom the surrounding cortex. These featuresand the relationships between them as de-scribed and compared in qualitative andquantitative terms point to an overall simi-lar structural organization of area 13 acrossspecies. Nevertheless, minor differences inits structure are clearly present, and there isa degree of interspecific variation in therelative size of area 13.
The orangutan has a unique organizationin the orbital sector of the frontal lobe. Thisincludes a smaller overall size for this sectorin both absolute and relative terms than inany other hominoid, a more homogeneousorbital sector with a single cortical areaoccupying a relatively larger segment of it,and a limbic area (area 13) that is ‘‘lesslimbic’’ in its organization in comparison tothe other great apes (it has a wider granularlayer more typical of prefrontal associationcortices than frontal limbic cortices).
Recent evidence from lesion studies inhumans associates the orbital and mesialfrontal sector, the limbic frontal cortex, witha variety of deficits in behaviors in the socialdomain (frontal lobe damage causes socio-pathic behavior, insensitivity to future conse-quences, drastic changes in personality). Itis reasonable to believe that this sector isimportant for the survival of members ofcomplex social groups. The orangutans havea smaller and more homogeneous frontal
limbic cortex. Orangutans are also known tohave a more solitary life-style and less com-plex social organization than the rest of thehominoids.
In contrast, it was shown here that hu-mans and bonobos have a relatively smallerarea 13 and a complex organization in thesurrounding orbitofrontal cortices that mightsuggest the presence of a larger number ofcortical subdivisions in these species. It istempting to associate this finding with thewell-known complex social and emotionalbehaviors of humans and bonobos, althoughsuch a finding is hard to reconcile with thefact that chimpanzees have complex societ-ies as well. Given the small sample size inthe case of the bonobos (an outlier?), it isimperative that more cortical areas are in-vestigated in a larger number of individualsbefore any firm conclusions can be reached.
Area 13 has been known to be associatedwith changes in emotional states and disin-hibition of emotional reactions in the ma-caque. Removal of this cortex has been foundto enhance aversive reactions and reduceaggressive reactions in several threateningsituations. These emotional alterations havebeen interpreted on the basis of the closerelationships that the posterior orbital cor-tex has with the limbic structures, espe-cially the mediodorsal nucleus of the thala-mus and the amygdala (Butter and Snyder,1972). Studies performed in the wild, as wellas in laboratory social settings, on monkeyswith orbitofrontal ablations have shown sig-nificant reductions and losses of behaviorsthat are considered important for the main-tenance of social bonds (Kling and Steklis,1976). Studies of social cognition amongprimates (De Waal andAureli, 1996; Ingman-son, 1996; Byrne, 1996; Van Schaik and VanHooff, 1996) emphasize species-specific pat-terns in the way that individuals deal withconspecifics and the importance of this be-havior for the survival and reproduction.
Cytoarchitectonic qualitative evaluationsdo not provide a complete account of homol-ogy between cortical areas. Nevertheless,examination of several species with the sametechnique in a consistent manner is thenecessary first step, but unfortunately israrely attempted. The quantification of thecortex stained with conventional techniques,
152 K. SEMENDEFERI ET AL.
as well as studies involving connections,myelin, and immunohistological markerswill provide eventually a more comprehen-sive basis to fully map the cortex. As shownby Rajkowska and Goldman-Rakic (1995a,b)in the human brain there is variation in theextent and precise location of a cortical area.A larger sample for each species is neces-sary, and caution needs to apply in theinterpretation of results based on smallsamples due to intraspecific variation andpossible hemispheric assymetries in the or-ganization of the cortex.
In the past, an accurate quantitative ap-proach to the study of the prefrontal cortexwas not available. Problems are presentthat involve the purely descriptive basis ofoutlining and evaluating cortical areas, themore restricted technical means and sam-pling techniques, and the small number ofavailable brain specimens that did not allowfor such effort. Computerized imaging tech-nology, stereological sampling methods, andimproved staining techniques are now avail-able and can help to overcome many of thethese obstacles. Some of these new advanceshave been successfully applied in other partsof the cortex, including the cingulate cortex,and the occipital and temporal lobes (Zilleset al., 1986; Armstrong et al., 1986; West andGundersen, 1990; West et al., 1991; Schlauget al., 1993).
Knowledge of the organization and size ofindividual cortical areas is necessary for theevolutionary study of the brain. The humanbrain is not an enlarged ape brain, nor arethe ape and monkey brains enlarged orreduced versions of each other (Holloway,1968). Different areas changed to a differentextent over time under different selectionpressures for each species, resulting in dis-tinct neural organizations (Armstrong,1990). The organization and size of indi-vidual cortical areas vary across species,and such knowledge is necessary for theevolutionary study of the brain. In particu-lar, knowledge of the brain of the extantapes, as compared to the human brain, canassist in the identification of features thatare shared among hominoids or are uniqueto humans and developed during hominidevolution.
In terms of absolute size, area 13 is aconservative (primitive) area in the homi-noid orbitofrontal cortex. It also has similarstructural features among species as wasshown in this cytoarchitectonic study. It issuggested here that area 13 was part of thePlio-Pleistocene hominoid and hominidbrain. A hypothetical reconstruction of thisbrain would place area 13 in a restrictedarea, occupying the most posterior parts ofthe medial orbital gyrus and the posteriororbital gyrus, with structural features simi-lar to those present in the extant species.
There is variation in the size and inaspects of the organization of the frontallobes among the hominoids (Semendeferi etal., 1997). Differences in size and aspects ofthe organization are present and might re-flect species-specific adaptations, functionalspecializations, and/or major evolutionaryevents relating to changes in the organiza-tion of the hominoid brain. Mere consider-ation of relationships such as total brain sizeto body size is inadequate for the understand-ing of species-specific adaptations in behav-ior and underlying neural circuitry. Thisstudy revealed differences in the organiza-tion of parts of the limbic frontal cortex,involved in social cognition in species thathave very similar absolute brain sizes (oran-gutan versus chimpanzee). It is clear thatspecific neural circuits or cortical areas haveto be targeted and compared in closely re-lated species.
SUMMARY
Area 13 was known to be present in theposterior orbitofrontal cortex of the ma-caque and to form part of the limbic systeminvolved in behaviors related to responses tosocial stimuli and social cognition. It wasshown here that area 13 is present in allextant hominoids and is characterized acrossspecies by the presence of conservative struc-tural features. Anatomical differences thatmight relate to species-specific adaptationsin behavior were found to exist in the rela-tive size of this cortical area. The humanand the bonobo were found to have a highlydiversified posterior orbitofrontal cortex thatincludes many subdivisions of cortical areasand a relatively small area 13. In contrastthe brain of the orangutan was found tohave a smaller and more homogeneous orbi-
153LIMBIC FRONTAL CORTEX IN HOMINOIDS

tofrontal cortex, with area 13 occupying alarger percentage of its total volume.
ACKNOWLEDGMENTS
We thank Bush Gardens Zoo and YerkesRegional Primate Research Center for pro-viding us with ape specimens, R.L. Ciochonand K. Amunts for helpful comments, U.Blohm for technical support, and P. Reimanfor photography. This study was supportedby Leakey Foundation QM54, Wenner-GrenFoundation 5553, and National ScienceFoundation G13. This report is part of alarger work that received the 1995 AlesHrdlicka Prize.
LITERATURE CITED
Armstrong E (1980) A quantitative comparison of thehominoid thalamus. II. Limbic nuclei anterior princi-palis. Am. J. Phys. Anthropol. 52:43–54.
Armstrong E (1990) Evolution of the Brain. In PaxinosG (ed.): The Human Nervous System. New York:Academic Press, pp. 1–16.
Armstrong E, Zilles K, Schlaug G, and Schleicher A(1986) Comparative aspects of the primate posteriorcingulate cortex. J. Comp. Neurol. 253:539–548.
Bailey PA, and Bonin G (1951) The Isocortex of Man.Urbana: The University of Illinois Press.
Bailey P, Bonin G, and McCulloch WS (1950) TheIsocortex of the Chimpanzee. Urbana: The Universityof Illinois Press.
Barbas H, and Pandya DN (1989) Architecture andintrinsic connections of the prefrontal cortex in therhesus monkey. J. Comp. Neurol. 286:353–375.
Beck E (1949) A cytoarchitectural investigation into theboundaries of cortical areas 13 and 14 in the humanbrain. J. Anat. 83:147–157.
Bonin G and Bailey P (1947) The Neocortex of Macacamulatta. Urbana: The University of Illinois Press.
Brodmann K (1909) Vergleichende Lokalisationslehreder Grosshirnrinde. Leipzig: Barth.
Butter CM, and Snyder DR (1972) Alterations in aver-sive and aggressive behaviors following orbital frontallesions in rhesus monkeys. Acta Neurobiol. Exp. 32:525–565.
Byrne RW (1996) The misunderstood ape: cognitiveskills of the gorilla. In Russon AE, Bard KA, andParker ST (eds.): Reaching Into Thought: The Mindsof the Great Apes. Cambridge: Cambridge UniversityPress, pp. 111–130.
Carmichael ST, and Price JL (1994) Architectonic subdi-vision of the orbital and medial prefrontal cortex inthe macaque monkey. J. Comp. Neurol. 346:366–402.
Damasio AR, and Van Hoesen GW (1983) Emotionaldisturbances associated with focal lesions of the fron-tal lesions of the frontal lobe. In Heilman K and Satz P(eds.): Neuropsychology of Human Emotion: RecentAdvances. New York: Guilford Press, pp. 85–110.
Damasio AR, Tranel D, and Damasio H (1990) Individu-als with sociopathic behavior caused by frontal dam-age fail to respond autonomically to social stimuli.Behav. Brain Res. 41:81–94.
De Waal FBM, and Aurelli F (1996) Consolation, recon-ciliation, and a possible cognitive difference betweenmacaques and chimpanzees. In Russon AE, Bard KA,and Parker ST (eds.): Reaching Into Thought: The
Minds of the Great Apes. Cambridge: CambridgeUniversity Press, pp. 80–110.
Economo C, and Koskinas GN (1925) Die Cytoarchitec-tonik der Hirnrinde des Erwachsenen Menschen.Berlin: Verlag von Julius Springer.
Eslinger PJ, and Damasio AR (1985) Severe disturbanceof higher cognition after bilateral frontal lobe abla-tion: patient EVR. Neurology 35:1731–1741.
Gallyas F (1971) A principle for silver staining of tissueelements by physical development. Acta Morphol.Acad. Sci. Hung. 19:57–71.
Goldman-Rakic PS (1984) The frontal lobes: unchartedprovinces of the brain. Trends Neurosci. 7:425–429.
Gundersen HJG, Bendtsen TF, Korbo L, Marcussen N,Moller A, Nielsen K, Nyengaard JR, Pakkenberg B,Sorensen FB, Vesterby A, and West MJ (1988a) Somenew, simple and efficient stereological methods andtheir use in pathological research and diagnosis.APMIS 96:379–394.
Gundersen HJG, Bagger P, Bendtsen TF, Evans SM,Korbo L, Marcussen N, Moller A, Nielsen K, Nyen-gaard JR, Pakkenberg B, Sorensen FB, Vesterby A,and West MJ (1988b) The new stereological tools:disector, fractionator, nucleator and point sampledintercepts and their use in pathological research anddiagnosis. APMIS 96:857–881.
Holloway RL (1968) The evolution of the primate brain:some aspects of quantitative relations. Brain Res.7:121–172.
Ingmanson EJ (1996) Tool-using behavior in wild Panpaniscus: Social and ecological considerations. In Rus-son AE, Bard KA, and Parker ST (eds.): Reaching IntoThought: The Minds of the Great Apes. Cambridge:Cambridge University Press, pp. 190–210.
Kling A, and Steklis HD (1976) A neural substrate foraffiliative behavior in nonhuman primates. BrainBehav. Evol. 13:216–238.
Kononova IP (1949): Frontal region (in Russian). InSarkissov SA, Filimonoff IN, and Preobarzenskaja NS(eds.): Cytoarchitectonics of the Human Cerebral Cor-tex. Moscow: Medgiz, pp. 298–343.
Kononova IP (1955) Frontal region (in Russian). InSarkissov SA, Filimonoff IN, Kononova IP, Preobarzen-skaja NS, and Kukueva LA (eds.): Atlas of the Cytoar-chitectonics of the Human Cerebral Cortex. Moscow:Medgiz, pp. 108–167.
Merker B (1983) Silver staining of cell bodies by meansof physical development. J. Neurosci. Methods 9:235–241.
Morecraft RJ, Geula C, and Mesulam MM (1992) Cytoar-chitecture and neural afferents of orbitofrontal cortexin the brain of the monkey. J. Comp. Neurol. 323:341–358.
Nauta WJH (1962) Some efferent connections of theprefrontal cortex in the monkey. In Warren JM andAkert K (eds): The Frontal Granular Cortex andBehavior. New York: McGraw-Hill Book Company, pp.397–409.
Preuss T, and Goldman-Rakic PS (1991) Myelo- andcytoarchitecture of the granular frontal cortex andsurrounding regions in the strepsirhine primateGalago and the anthropoid primate Macaca. J. Comp.Neurol. 310:429–474.
Rajkowska G, and Goldman-Rakic PS (1995a) Cytoarchi-tectonic definition of prefrontal areas in the normalhuman cortex: I. Remapping of areas 9 and 46 usingquantitative criteria. Cereb. Cortex 5:307–322.
Rajkowska G, and Goldman-Rakic PS (1995b) Cytoarchi-tectonic definition of prefrontal areas in the normalhuman cortex: II. Variability in locations of areas 9and 46 and relationship to the Talairach coordinatesystem. Cereb. Cortex 5:323–337.
154 K. SEMENDEFERI ET AL.

Sanides F (1962) Die Architektonik des MenschlichenStirnhirns. Monograf fur Neurologie und Psychologie98. Berlin: Springer.
Sanides F (1964) The cyto-myeloarchitecture of thehuman frontal lobe and its relation to phylogeneticdifferentiation of the cerebral cortex. J Hirnforsch.6:269–292.
Sarkissov SA, Filimonoff IN, Kononowa EP, Preobra-schenskja IS, and Kukuew LA (1955) Atlas of theCytoarchitectonics of the Human Cerebral Cortex.Moscow: Medgiz.
Schlaug G, Armstrong E, Schleicher A, and Zilles K(1993) Layer V pyramidal cells in the adult humancingulate cortex: a quantitative golgi study. Anat.Embryol. (Berl.) 187:515–522.
Schleicher A, and Zilles K (1989) A quantitative ap-proach to cytoarchitectonics: analysis of structuralinhomogeneities in nervous tissue using an imageanalyzer. J. Microsc. 157:367–381.
Semendeferi K, Damasio H, Frank R, and Van HoesenGW (1997) The evolution of the frontal lobes: avolumetric analysis based on three-dimensional recon-structions of magnetic resonance scans of human andape brains. J. Hum. Evol. 32:375–388.
Stephan H (1961) Vergleichend-anatomische Unter-suchungen an Insektivorengehirnen. V. Die quantita-tive Zusammensetzung der Oberflaechen des Allocor-tex. Acta Anat. (Basel) 44:12–59.
Stephan H, Frahm H, and Baron G (1981) New andrevised data on volumes of brain structures in isecti-vores and primates. Folia Primatol. (Basel) 35:1–29.
Stephan H, Baron G, and Frahm HD (1991) Insectivora:With a Stereotaxic Atlas of the Hedgehog Brain.Comparative Brain Research in Mammals, Vol. 1.New York: Springer Verlag.
Van Hoesen GW (1981) The differential distribution,diversity and sprouting of cortical projections to the
amygdala in the rhesus monkey. In Ben-Ari Y (ed):The Amygdaloid Complex: INSERM Symposium No.20. New York: Elsevier/North Holland BiomedicalPress, pp. 77–90.
Van Hoesen GW (1982) The parahippocampal gyrus.Trends Neurosci. 5:345–350.
Van Hoesen GW, Pandya DN, and Butters N (1972)Cortical afferents to the entorhinal cortex in therhesus monkey. Science 175:1471–1473.
Van Hoesen GW, Pandya DN, and Butters N (1975)Some connections of the entorhinal (area 28) andperirhinal (area 35) cortices in the rhesus monkey: III.Entorhinal cortex efferents. Brain Res. 95:39–59.
Van Schaik CP, and Van Hoof JARAM (1996) Toward anunderstanding of the orangutan’s social system. InMcGrew WC, Marchant LF, and Nishida T (eds.):Great Ape Societies. Cambridge: Cambridge Univer-sity Press, pp. 3–15.
Walker AE (1940) A cytoarchitectural study of theprefrontal area of the macaque monkey. J. Comp.Neurol. 73:59–86.
West MJ, and Gundersen HJG (1990) Unbiased stereo-logical estimation of the number of neurons in thehuman hippocampus. J. Comp. Neurol. 296:1–22.
West MJ, Slomianka L, and Gundersen HJG (1991)Unbiased stereological estimation of the total numberof neurons in the subdivisions of the rat hippocampususing the optical fractionator. Anat. Rec. 231:482–497.
Wree A, Schleicher A, and Zilles K (1982) Estimation ofvolume fractions in nervous tissue with an imageanalyzer. J. Neurosci. Methods 6:29–43.
Zilles K, Armstrong E, Gottfried S, and Schleicher A(1986) Quantitative cytoarchitectonics of the posteriorcingulate cortex in primates. J. Comp. Neurol. 253:514–524.
155LIMBIC FRONTAL CORTEX IN HOMINOIDS