limate change adaptation report - home | eco … · low carbon building group, ... adaptation...
TRANSCRIPT

Low Carbon Building Group, School of Architecture
CLIMATE CHANGE ADAPTATION REPORT
09 JULY 2012
NW BICESTER ECO TOWN
TECHNOLOGY STRATEGY BOARD
DESIGN FOR FUTURE CLIMATE:
ADAPTING BUILDINGS PROGRAMME
SUBMITTED TO
PHILIP HARKER
HYDER CONSULTING
29 BRESSENDEN PLACE
LONDON SW1E 5DZ
PREPARED BY
PROFESSOR RAJAT GUPTA,
DR HU DU AND MATT GREGG
LOW CARBON BUILDING GROUP
SCHOOL OF ARCHITECTURE
OXFORD BROOKES UNIVERSITY
HEADINGTON CAMPUS
GIPSY LANE, OXFORD OX3 0BP
TEL: 01865 484049
FAX: 01865 483298
1 Low Carbon Building Group, School of Architecture
NW Bicester Eco Town
Summary
This report provides climate change adaption measures for NW Bicester development.
Adaption measures for comfort were tested by dynamic building simulation software IES VE
and adaption measures for construction and water were given based on empirical
experience.
Firstly the performances of twenty seven individual adaptation measures for designing for
comfort were tested on a south-facing end-terraced house. The most effective individual
measures were combined as three adaptation packages. These packages allow the house
to stay within comfort range during the 2050s and 2080s with minimized change to the
existing building design.
Then the performance of the three adaption packages were then applied to all house types
(bungalow, flat, detached house and mid-terraced house) in NW Bicester eco town
development. A timeline of when and which adaptation package could tackle future
overheating for domestic home types in NW Bicester development is also given (table 21). It
is suggested that adaptation package 1 (external shutter and window opening) could allow
most of house types to stay within comfort range in 2050s and package 3 (package 1
including heavy weight construction and white paint) could allow all house types to stay
within comfort range in 2080s.
Based on empirical experience, 37 adaptation measures for water, construction, landscape
and infrastructure are given in sections 3, 4 and 5.
This report is provided for Hyder Consulting as information for the Technology Strategy Board’s
Design for Future Climate: Adapting Buildings project, application number: 3404-23352.

2 Low Carbon Building Group, School of Architecture
NW Bicester Eco Town
Contents
Summary ............................................................................................................................. 1
Contents .............................................................................................................................. 2
1 Introduction .................................................................................................................. 3
2 Designing for comfort .................................................................................................. 6
2.1 Modelling of the performance of individual measures on the worst case ................. 9
2.1.1 High albedo surface ......................................................................................... 9
2.1.2 Window film technology ................................................................................. 10
2.1.3 Thermal mass in fabric and internal ............................................................... 11
2.1.4 Ventilation ...................................................................................................... 13
2.1.5 Shading ......................................................................................................... 16
2.1.6 Orientation ..................................................................................................... 19
2.2 Modelling of the performance of adaptation packages .......................................... 21
2.3 Performance of adaptation packages on other house types .................................. 23
2.4 Timelines .............................................................................................................. 29
3 Designing for construction ....................................................................................... 30
3.1 Wind load .............................................................................................................. 30
3.2 Wind driven rain .................................................................................................... 31
4 Designing to manage water ....................................................................................... 32
4.1 Flood..................................................................................................................... 32
4.2 Water conservation ............................................................................................... 34
4.2.1 In-house grey water system ........................................................................... 34
4.2.2 Rainwater catchment system ......................................................................... 34
4.3 Energy for hot water system ................................................................................. 35
5 Green landscape and infrastructure ......................................................................... 36
6 Summary of adaption measures ............................................................................... 38
References ........................................................................................................................ 40

3 Low Carbon Building Group, School of Architecture
NW Bicester Eco Town
1 Introduction
The previous report (Gupta and Gregg 2011) identified future climate changes for NW
Bicester eco town project, e.g. Increase in maximum temperatures of 1.9 °C by 2020s (50
percentile of high emission) rising to 4.0°C by the 2050s (50 percentile of high emission)
and 6.2°C by the 2080s (50 percentile of high emission).
This report suggests a range of climate change adaptation measures for NW Bicester eco
town project. It is focused on adaptation measures for water, construction and comfort.
Based on empirical experience which authors have, adaptation measures for water and
construction are given. Numerical modelling of the worst case building type was conducted
in IES VE to test 27 individual adaptation measures for comfort. Three adaptation packages
were developed to allow the building to stay within comfort range by 2050s or 2080s.
To arrive at practical adaptation strategies, the generic adaptation measures (table 1)
suggested by Gething (2010) were considered for NW Bicester eco town project.
Table 1 Generic adaptation measures (Gething 2010)
No. Adaptation measures
Desig
nin
g f
or
com
fort
Adaptation design challenge - keeping cool for internal spaces
1 Shading - manufactured
2 Shading - building form
3 Glass technologies
4 Film technologies
5 Green roofs/transpiration cooling
6 Shading - planting
7 Reflective materials
8 Conflict between maximising daylight and overheating
9 Secure and bug free night ventilation
10 Interrelationship with noise & air pollution
11 Interrelationship with ceiling height
12 Role of thermal mass in significantly warmer climate
13 Enhancing thermal mass in lightweight construction
14 Energy efficient/ renewable powered cooling systems
15 Groundwater cooling
16 Enhanced control systems - peak lopping
Adaptation design challenge - keeping cool for spaces around buildings
17 Maximum temperature legislation
18 Built form - building to building shading
19 Access to external space -overheating relief
20 Shade from planting
21 Manufactured shading
22 Interrelationship with renewables
23 Shading parking/ transport infrastructure
24 Role of water - landscape/ swimming pools

4 Low Carbon Building Group, School of Architecture
NW Bicester Eco Town
Adaptation design challenge - keeping warm
25 Building fabric insulation standards
26 Relevance of heat reclaim systems
27 Heating appliance design for minimal heating
28 Energy efficient/ renewable powered cooling systems
Desig
nin
g f
or
co
nstr
uctio
n
Adaptation design challenge - Structural stability -below ground
29 Foundation design - subsidence/ heave/ soils/ regions
30 Underpinning
31 Retaining wall and slope stability
Adaptation design challenge - Structural stability -above ground
32 Lateral stability -wind loading standards
33 Loading from ponding
Adaptation design challenge - Fixings and weatherproofing
34 Fixing standards - walls, roofs
35 Detail design for extremes - wind - 3 step approach
36 Lightning strikes (storm intensity)
37 Tanking/ underground tanks in relation to water table- contamination, buoyancy, pressure
38 Detail design for extremes - rain -thresholds/ joints
Adaptation design challenge -Materials behaviour
39 Effect of extended wetting -permeability, rotting, weight
40 Effect of extended heat/ UV -drying out, shrinkage, expansion, de-lamination, softening, reflection, admittance, colour fastness
41 Performance in extremes - wind - air tightness, strength, suction/ pressure
42 Performance in extremes - rain
Adaptation design challenge - work on site
43 Temperature limitations for building processes
44 Stability during construction
45 Inclement winter weather -rain (reduced freezing?)
46 Working conditions -Site accommodation
47 Working conditions - internal conditions in incomplete/ unserviced buildings (overlap with robustness in use)
Desig
nin
g t
o m
ana
ge
wate
r
Adaptation design challenge - Water supply/ conservation
48 Low water use fittings
49 Grey water storage
50 Rain water storage
51 Alternatives to water based drainage
52 Pools as irrigation water storage
53 Limits to development
54 Water-intensive construction processes
Adaptation design challenge - Drainage external/building related
55 Drain design
56 SUDS and soak away design
57 Gutter/ roof/ upstand design
Adaptation design challenge - Flood Avoidance/ Resistance/ resilience
58 Environment Agency guidance -location, infrastructure

5 Low Carbon Building Group, School of Architecture
NW Bicester Eco Town
59 Combination effects -wind + rain + sea level rise
60 Flood defence – permanent
61 Flood defence - temporary -products etc
62 Evacuation/ self sufficiency
63 Flood tolerant construction
64 Flood tolerant products and materials
65 Post-flood recovery measures
De
sig
nin
g f
or
lan
dsca
pe
Adaptation design challenge - Landscape
66 Plant selection - drought resistance vs cooling effect of transpiration
67 Changes to ecology
68 Irrigation techniques
69 Limitations on use of water features -mosquitoes etc
70 Role of planting and paving in modifying micro climate & heat island effect
71 Failsafe design for extremes -water
72 Firebreaks
Above measures for designing for comfort were investigated in section 2. Sections 3, 4 and
5 discussed adaptation measures for construction, managing water and landscape
respectively. A summary of all adaption measures for NW Bicester development were given
in section 6.
Note that due to the probabilistic feature of UKCP09 projections, several risk levels were
nominated by the research group who generated PROMETHEUS weather data for building
simulation. By examining the process of generating future weather data, the authors
selected the 50 percentile of high emission weather data as the inputs for building
performance simulation.
6 Low Carbon Building Group, School of Architecture
NW Bicester Eco Town
2 Designing for comfort
To design buildings without overheating issues under a future climate, the following steps
were conducted to develop adaptation measures for NW Bicester development.
1. Adaptation measures for comfort mentioned in Design for Future Climate report
(Gething 2010) were considered.
2. The adaptation measures which are applicable for NW Bicester development were
selected (highlighted table 2).
3. To test the performance of these adaptation measures, detailed house level energy
models were built in the building thermal simulation package IES. IES was selected
partly due to the wide international usage by both research and practice
communities, and partly due to the extensive historical testing and verification
(Gough and Rees 2004).
4. The performance of individual measures was tested on the worst case, south-facing
end-terraced house. CIBSE overheating guidance was selected as evaluation metric,
because it is an efficient and transparent, and it is widely used by practitioners. The
CIBSE guidance of overheating for living areas is 1% annual occupied hours over
operative temperature of 28 ⁰C, and for bedrooms, the benchmark is 1% annual
occupied hours over operative temperature of 26 ⁰C (CIBSE 2006).
5. Three packages which are the combinations of the most effective adaptation
measures were proposed for NW Bicester development. The performance of three
adaptation packages were tested on the worst case house type under current, 2030s,
2050s and 2080s’ climate.
6. The three adaptation packages were tested on other house types in NW Bicester
development and the timeline of application of adaptation packages were
summarised at the end.

NW Bicester Eco Town
7 Low Carbon Building Group, School of Architecture
Table 2 Adaptation measures for comfort
Design opportunity (adaptation measure) Adapted element Overheating modelling in IES
Keeping cool for internal spaces
1 Shading - manufactured 1.1 Interstitial blinds Window Not applicable at this stage of NW Bicester project
1.2 Internal blinds Window IES model case 1, 2, 3, 4
2 Shading - building form
2.1 External fixed shades Window IES model case 5
2.2 External adjustable shading - time control Window IES model case 6, 7
2.3 External adjustable shading - radiation control Window IES model case 8, 9
2.4 Orientation Building IES model case 20-27
3 Glass technologies 3.1 Double glazing Window Not applicable, base models used triple glazing
3.2 Triple glazing Window Not applicable, base models used triple glazing
4 Film technologies 4.1 Window film technology Window IES model case 10, 11
5 Green roofs/transpiration cooling 5.1 Green roof Roof Not implementable in IES VE
6 Shading - planting 6.1 Deciduous planting on south façade Facade Not implementable in IES VE
7 Reflective materials 7.1 Reflective coatings on external walls Wall IES model case 12, 13
7.2 Reflective coatings on roof Wall IES model case 12, 13
8 Conflict between maximising daylight and overheating
8.1 Adjust window size Window Not applicable at this stage of NW Bicester project
9 Secure and bug free night ventilation 9.1 Secure and bug free night ventilation Window IES model case 14
10 Interrelationship with noise & air pollution
10.1 Acoustic HVAC system Not implementable in IES VE
10.2 Air purifier HVAC system Not implementable in IES VE
10.3 Mechanical ventilation HVAC system IES model case 15, 16, 17
11 Interrelationship with ceiling height 11.1 Adjust ceiling height Wall Not applicable at this stage of NW Bicester project

NW Bicester Eco Town
8 Low Carbon Building Group, School of Architecture
Design opportunity (adaptation measure) Adapted element Overheating modelling in IES
12 Role of thermal mass in significantly warmer climate
12.1 Apply concrete floor Floor IES model case 18, 19, 20
12.2 Apply concrete internal wall Wall IES model case 18, 19, 20
12.3 Apply heavy weight external wall Wall IES model case 18, 19, 20
13 Enhancing thermal mass in lightweight construction
13.1 Apply concrete staircase and fireplace Internal space Not applicable at this stage of NW Bicester project
13.2 Install phase change material Wall Could implement in IES VE by using air-conditioned cavity, however its accuracy is not guaranteed
14 Energy efficient/ renewable powered cooling systems
14.1 Heat Recovery Ventilation (operation in summer, when outdoor T> indoor T)
HVAC system Not effective at current climate, may be implemented at future
15 Groundwater cooling 15.1 Groundwater cooling Space nearby Not applicable for overheating modelling
16 Enhanced control systems - peak lopping 16.1 Enhanced control systems - peak lopping HVAC system Not applicable for overheating modelling
17 Maximum temperature legislation 17.1 Change building regulation Building regulation Apply adaptive thermal comfort limit
Keeping cool for spaces around buildings
18 Built form - building to building shading 18.1 building to building shading Planning Not applicable at this stage of NW Bicester project
19 Access to external space -overheating relief
19.1 Access to external space Planning Not implementable in IES VE
20 Shade from planting 20.1 Listed above Listed above
21 Manufactured shading 21.1 Listed above Listed above
22 Interrelationship with renewables 22.1 Listed above Listed above
23 Shading parking/ transport infrastructure 23.1 Shading parking/ transport infrastructure Planning Need review overheating metric for transportation
24 Role of water - landscape/ swimming pools
24.1 Role of water - landscape/ swimming pools Landscape Not implementable in IES VE

NW Bicester Eco Town
9 Low Carbon Building Group, School of Architecture
The selected individual measures for NW Bicester project (highlighted in grey in table 2)
were categorised in 6 groups: high albedo surface, window film, thermal mass, ventilation,
shading and orientation. The performance of these individual measures was tested on the
worst case, 3-bed, south-facing end-terraced house.
CIBSE overheating benchmark was selected as evaluation metric, because it is an efficient
and transparent, and it is widely used by practitioners. The benchmark is 1% annual
occupied hours over operative temperature of 28 ⁰C for living areas, and for bedrooms, it is
over operative temperature of 26 ⁰C (CIBSE 2006).
2.1 Modelling of the performance of individual measures on the worst case
2.1.1 High albedo surface
By reducing irradiative gains, high albedo surface (light-coloured roof and external wall) can
reduce interior air temperature, peak cooling demand. It also helps reduces the urban heat
island effect. Two types of paint were tested in IES.
Description of measures
White paint: paint outside surface of roof and external wall in white colour.
Cream paint: paint outside surface of roof and external wall in cream colour.
Note that all the settings of base model are reported in Overheating metrics and base IES
model report (Gupta and Du 2012). The settings of white and cream paint surface are
suggested by Halewood and Wilde (2010).
Implementation of adaptation measure in IES:
Table 3 Implementations of high albedo surface in IES
Settings Base model White paint Cream paint
Outside surface emissivity 0.9 0.9 0.87
Outside surface solar absorptance 0.7 for external wall
0.4 for roof 0.2 0.4
Results:
The percentage of annual occupied hours over operative temperature 28 ⁰C for living room
and the percentages of annual occupied hours over operative temperature 26 ⁰C for
bedrooms in south facing end-terraced 3-bedroom house were calculated in building thermal
simulation software. The average overheating percentages for a living room and 3 bedrooms
at current and 2080s are listed in following table. The results shows that the white paint does
help relieve overheating issue now and in future.

NW Bicester Eco Town
10 Low Carbon Building Group, School of Architecture
Table 4 Overheating percentages of adaptation measures
Time lines Base model White paint Cream paint
Current 7.1% 6.5% 6.8%
2080s 25.7% 24.8% 25.4%
2.1.2 Window film technology
Reflective solar film, also known as "mirror" film, is designed to ward off the sun's glare and
heat and to keep building space cooler. The film can be applied to most glass surfaces. Two
types of windows films were tested in IES.
Description:
Dark film: The dark reflective window film allows 18% of light through (PURLFROST
Ltd 2012).
Light film: The light reflective window film allows 48% of light through (PURLFROST
Ltd 2012).
Implementation of adaptation measure in IES:
Table 5 Implementation of windows film in IES
Settings Base model Light film Dark film
Inside surface emissivity 0.9 0.74 0.7
Visible light normal transmittance 0.76 0.36 (48%) 0.137 (18%)
Transmittance of internal layer 0.44 0.176 (40%) 0.0528 (12%)
Outside/inside reflectance 0.23 0.0713 (31%) 0.1265 (55%)
Results:
The average overheating percentages for a living room and 3 bedrooms at current and
2080s are listed in following table. The results shows that the dark film does help reduce
overheating percentages at current climate and in future.
Table 6 Overheating percentages of adaptation measures
Time lines Base model Light film Dark film
Current 7.1% 5.45% 5.25%
2080s 25.7% 23.26% 22.93%
NW Bicester Eco Town
11 Low Carbon Building Group, School of Architecture
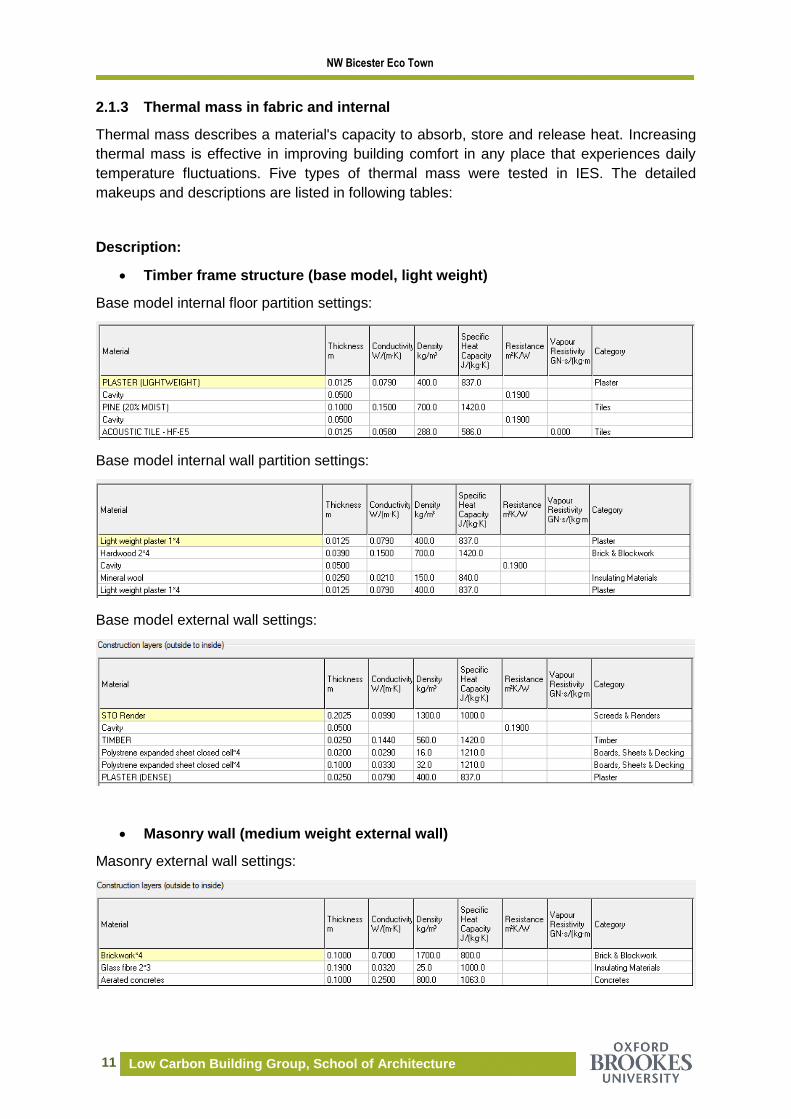
2.1.3 Thermal mass in fabric and internal
Thermal mass describes a material's capacity to absorb, store and release heat. Increasing
thermal mass is effective in improving building comfort in any place that experiences daily
temperature fluctuations. Five types of thermal mass were tested in IES. The detailed
makeups and descriptions are listed in following tables:
Description:
Timber frame structure (base model, light weight)
Base model internal floor partition settings:
Base model internal wall partition settings:
Base model external wall settings:
Masonry wall (medium weight external wall)
Masonry external wall settings:

NW Bicester Eco Town
12 Low Carbon Building Group, School of Architecture
Heavy weight external wall
Heavy weigh external wall settings:
Heavy weight external wall and internal partition
Combination of heavy weight external wall (table above), heavy weight internal floor and wall
partitions listed below:
Heavy weight internal floor
Heavy weight internal wall partition
Implementation of adaptation measure in IES:
Above measures were implemented in IES by imputing their physical and thermal properties.
The thermal capacities and admittance of above five measures are summarised in following
tables 7 and 8:
Table 7 Implementation of thermal mass in IES
SBEM Thermal capacity (kJ/m2K) External
wall Internal wall
partition Internal floor
partition
Timber frame
(base model, light weight) 8.37 4.19 39.38
Masonry wall
(medium weight external wall) 85.04 4.19 39.38
Heavy weight external wall 191.34 4.19 39.38
Heavy weight external wall and heavy weight internal partition
191.34 149.09 126.31

NW Bicester Eco Town
13 Low Carbon Building Group, School of Architecture
Table 8 Implementation of thermal mass in IES
Admittance (W/m2K) External
wall Internal wall
partition Internal floor
partition
Timber frame
(base model, light weight) 0.7123 0.6667 1.3629
Masonry wall
(medium weight external wall) 3.2197 0.6667 1.3629
Heavy weight external wall 3.9057 0.6667 1.3629
Heavy weight external wall and heavy weight internal partition
3.9057 3.0914 2.5636
Results:
The average overheating percentages for a living room and 3 bedrooms at current, 2050s
and 2080s are listed in the following table. The results show that heavy weight structure
does help reduce overheating percentages under current climate condition; however in
2080s heavy thermal mass would make overheating worse.
Table 9 Overheating percentages of adaptation measures
Time lines CIBSE baseline
Prometheus 2050s H
50%
Prometheus 2080s H
50%
Timber frame structure (base model, light weight) 7.10% 19.63% 25.68%
Masonry wall (medium weight external wall) 6.58% 20.10% 26.53%
Heavy weight external wall 6.08% 19.80% 26.65%
Heavy weight external wall and heavy weight internal partition
5.28% 19.08% 26.15%
2.1.4 Ventilation
When external air temperature is lower than indoor air temperature, increasing ventilation
rate could help reduce indoor air temperature. The following five ventilation strategies were
tested in IES.
Description:
Base model (one air change rate): Building space with constant 1 air change rate
ventilation rate which provided by exhaust fans or windows opening.
Two air change rate: Building space with constant 2 air change rate ventilation rate
which provided by exhaust fans or windows opening.
Three air change rate: Building space with constant 3 air change rate ventilation
rate which provided by exhaust fans or windows opening.
NW Bicester Eco Town
14 Low Carbon Building Group, School of Architecture
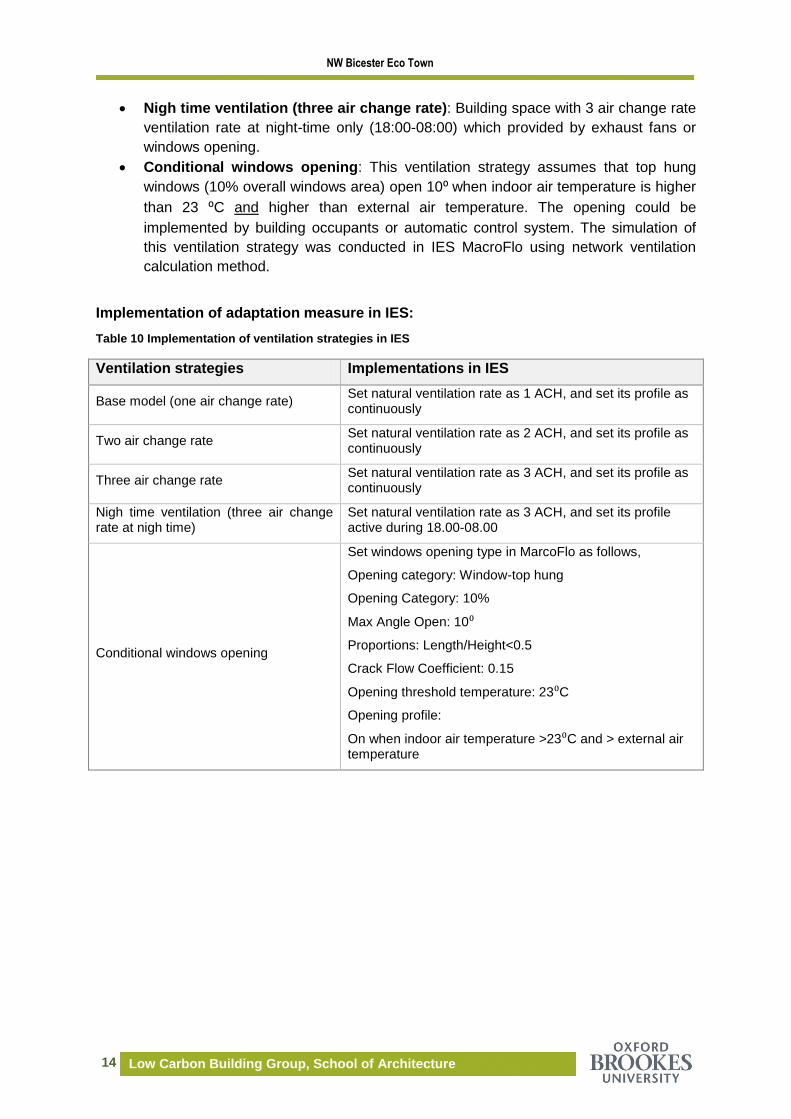
Nigh time ventilation (three air change rate): Building space with 3 air change rate
ventilation rate at night-time only (18:00-08:00) which provided by exhaust fans or
windows opening.
Conditional windows opening: This ventilation strategy assumes that top hung
windows (10% overall windows area) open 10⁰ when indoor air temperature is higher
than 23 ⁰C and higher than external air temperature. The opening could be
implemented by building occupants or automatic control system. The simulation of
this ventilation strategy was conducted in IES MacroFlo using network ventilation
calculation method.
Implementation of adaptation measure in IES:
Table 10 Implementation of ventilation strategies in IES
Ventilation strategies Implementations in IES
Base model (one air change rate) Set natural ventilation rate as 1 ACH, and set its profile as continuously
Two air change rate Set natural ventilation rate as 2 ACH, and set its profile as continuously
Three air change rate Set natural ventilation rate as 3 ACH, and set its profile as continuously
Nigh time ventilation (three air change rate at nigh time)
Set natural ventilation rate as 3 ACH, and set its profile active during 18.00-08.00
Conditional windows opening
Set windows opening type in MarcoFlo as follows,
Opening category: Window-top hung
Opening Category: 10%
Max Angle Open: 10⁰
Proportions: Length/Height<0.5
Crack Flow Coefficient: 0.15
Opening threshold temperature: 23⁰C
Opening profile:
On when indoor air temperature >23⁰C and > external air temperature

NW Bicester Eco Town
15 Low Carbon Building Group, School of Architecture
Results:
The average overheating percentages at current, 2050s and 2080s are listed in following
table. The results show that conditional opening windows could significantly reduce indoor
air temperature. It is the most effective measure so far.
Table 11 Overheating percentages of adaptation measures
Ventilation strategies CIBSE baseline
Prometheus 2050s H 50%
Prometheus 2080s H 50%
Base model (one air change rate) 7.1% 19.6% 25.7%
Two air change rate 2.9% 10.9% 16.0%
Three air change rate 1.9% 7.7% 11.7%
Nigh time ventilation (three air change rate at nigh time) 4.2% 12.5% 17.2%
Conditional windows opening 1.2% 5.8% 8.4%
NW Bicester Eco Town
16 Low Carbon Building Group, School of Architecture
2.1.5 Shading
Solar energy is the most important factor causing overheating in building spaces. To avoid
overheating, shading devices can be used to reduce the total amount of radiation entering
the room by reflection and absorption, and they also help improve the distribution of the light
in room.
Shading devices can be categorised into 2 types: internal shading and external shading. In
this study, 4 types of internal shading and 5 types of external shading were tested.
For internal shading, the performance of 2 types of curtain and 2 types of blinds were
examined. For external shading, fixed shading devices, 2 types of external shutter and 2
types of louver were tested. The descriptions of them are followed.
Descriptions:
Base model: No shading devices.
Internal curtain with control: This shading strategy assumes that building
occupants draw curtains closed when incident radiation is higher than 100 W/m2.
Internal curtain without control: Curtains are closed during 10am to 6pm.
Internal blinds with control: This shading strategy assumes that building occupants
close blinds when incident radiation is higher than 100 W/m2.
Internal blinds without control: blinds are closed during 10am to 6pm.
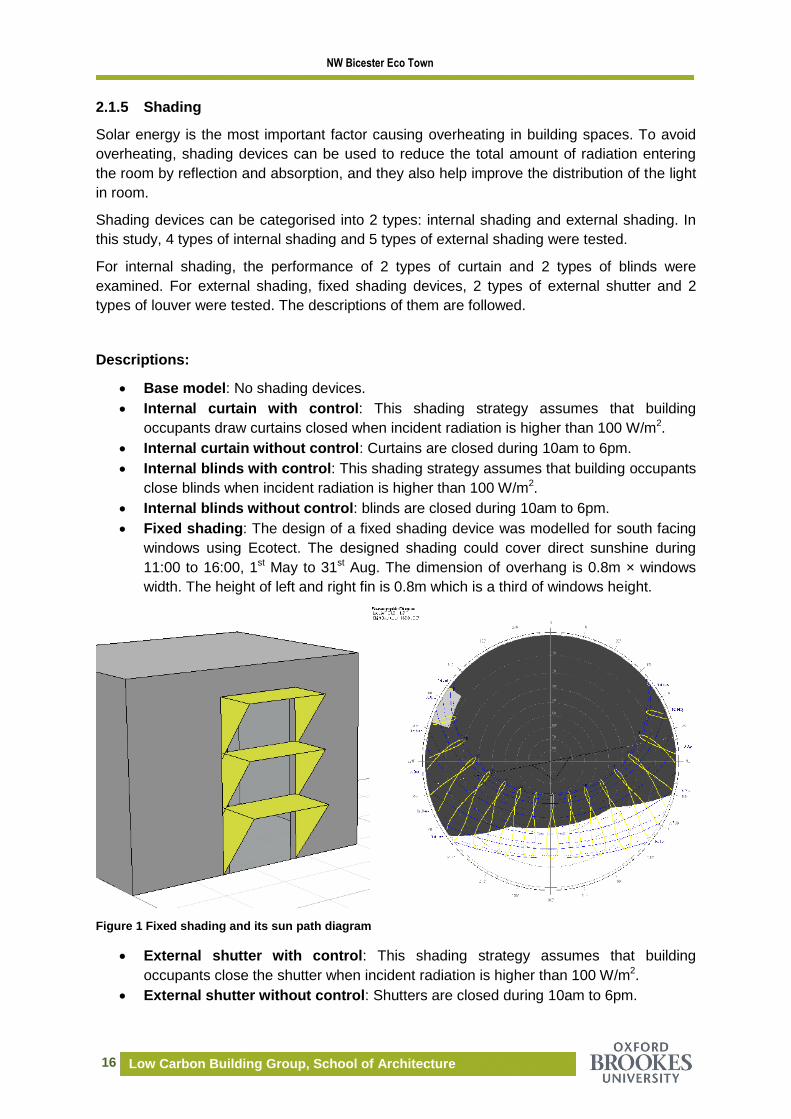
Fixed shading: The design of a fixed shading device was modelled for south facing
windows using Ecotect. The designed shading could cover direct sunshine during
11:00 to 16:00, 1st May to 31st Aug. The dimension of overhang is 0.8m × windows
width. The height of left and right fin is 0.8m which is a third of windows height.
Figure 1 Fixed shading and its sun path diagram
External shutter with control: This shading strategy assumes that building
occupants close the shutter when incident radiation is higher than 100 W/m2.
External shutter without control: Shutters are closed during 10am to 6pm.

NW Bicester Eco Town
17 Low Carbon Building Group, School of Architecture
External louver with control: This shading strategy assumes that building
occupants turn louver closed when incident radiation is higher than 100 W/m2.
External louver without control: Louvers are closed during 10am to 6pm.
Implementation of adaptation measure in IES:
Table 12 Implementation of shading strategies in IES
Shading strategies Implementations in IES
Base model No shading device
Internal curtain with control
Set curtains as internal shading devices
Incident radiation to lower device: 100 W/m2
Incident radiation to raise device: 100 W/m2
Internal curtain without control Set curtains as internal shading devices
Percentage profile group: Active during 10:00-18:00
Internal blinds with control
Set blinds as internal shading devices
Incident radiation to lower device: 100 W/m2
Incident radiation to raise device: 100 W/m2
Internal blinds without control Set blinds as internal shading devices
Percentage profile group: Active during 10:00-18:00
Fixed shading
Set Projections as local shading devices
Windows width: 1.1m
Window height: 0.8m
Overhang projection: 0.8m
Left fin projection: 0.8m
Right fin projection: 0.8m
External shutter with control
Set shutter as external shading devices
Incident radiation to lower device: 100 W/m2
Incident radiation to raise device: 100 W/m2
External shutter without control Set shutter as external shading devices
Percentage profile group: Active during 10:00-18:00
External louver with control
Set louver as external shading devices
Incident radiation to lower device: 100 W/m2
Incident radiation to raise device: 100 W/m2
External louver without control Set louver as external shading devices
Percentage profile group: Off during 10:00-18:00

NW Bicester Eco Town
18 Low Carbon Building Group, School of Architecture
Results:
The average overheating percentages for the south-facing end-terraced house at current,
2050s and 2080s are listed in the following table. The results show that external shading
devices have better performance than internal shading devices. External shutter or louver
can significantly reduce overheating percentages. Controlled external shading devices can
allow the south-facing end-terraced house to stay within comfort range by 2050s. Note that
the performance of external louver is the same as external shutter.
Table 13 Overheating percentages of adaptation measures
Shading strategies CIBSE baseline
Prometheus 2050s H 50%
Prometheus 2080s H 50%
Base model 7.1% 19.6% 25.7%
Internal curtain with control 2.6% 12.2% 19.1%
Internal curtain without control 3.7% 14.5% 21.2%
Internal blinds with control 2.6% 12.2% 19.1%
Internal blinds without control 3.7% 14.5% 21.2%
Fixed shading 0.3% 4.0% 8.8%
External shutter with control 0.0% 0.5% 2.4%
External shutter without control 0.4% 4.4% 9.7%
External louver with control 0.0% 0.5% 2.4%
External louver without control 0.4% 4.4% 9.7%
Figure 2 Overheating percentages of shading adaptation measures
0.00%
5.00%
10.00%
15.00%
20.00%
25.00%
30.00%
Current 2050s 2080s
Base model
Internal curtain with control
Internal curtain without control
Internal blinds with control
Internal blinds without control
Fixed shading
External shutter with control
External shutter without control
External louver with control
External louver without control

NW Bicester Eco Town
19 Low Carbon Building Group, School of Architecture
2.1.6 Orientation
Building orientation and windows opening directions have significant impacts on building
performance. They are often limited by land and existing surroundings. When this research
was conducted, the site plan of phase 1 development has already been decided. Therefore,
exploring best orientation is the author’s interest and it might be useful for future
development.
Description:
The orientation here is site rotation angle (bearing angle of model) in IES. The default (base
model) angle is 79⁰.
Implementation of adaptation measure in IES:
Set site rotation angle in IES as 79, 79+45, 79+90, 79+135, 79+180, 79+225, 79+270,
79+315-360.
Results:
The results in the following table show that 180 degree rotation of existing building could
reduce overheating percentage from 7.1% to 0.9% at current climate condition. Note that the
180 degree rotation of this south-facing end-terraced house would result in another south-
facing end-terraced house (was north-facing). Therefore the performance of terraced houses
block should be considered when conducting orientation optimization.

NW Bicester Eco Town
20 Low Carbon Building Group, School of Architecture
Table 14 Overheating percentages of adaptation measures
Site rotation angle in IES Ground floor plan
(↑ North)
CIBSE
baseline
Prometheus
2050s H 50%
Prometheus
2080s H 50%
79+0 (base model)
Door
7.10% 19.60% 25.70%
79+45
5.60% 17.70% 24.40%
79+90
2.40% 11.30% 18.50%
79+135
1.30% 7.40% 14.60%
79+180
0.90% 6.60% 13.40%
79+225
1.20% 7.30% 14.50%
79+270
2.30% 10.60% 17.90%
79+315-360
5.30% 16.50% 23.00%
NW Bicester Eco Town
21 Low Carbon Building Group, School of Architecture
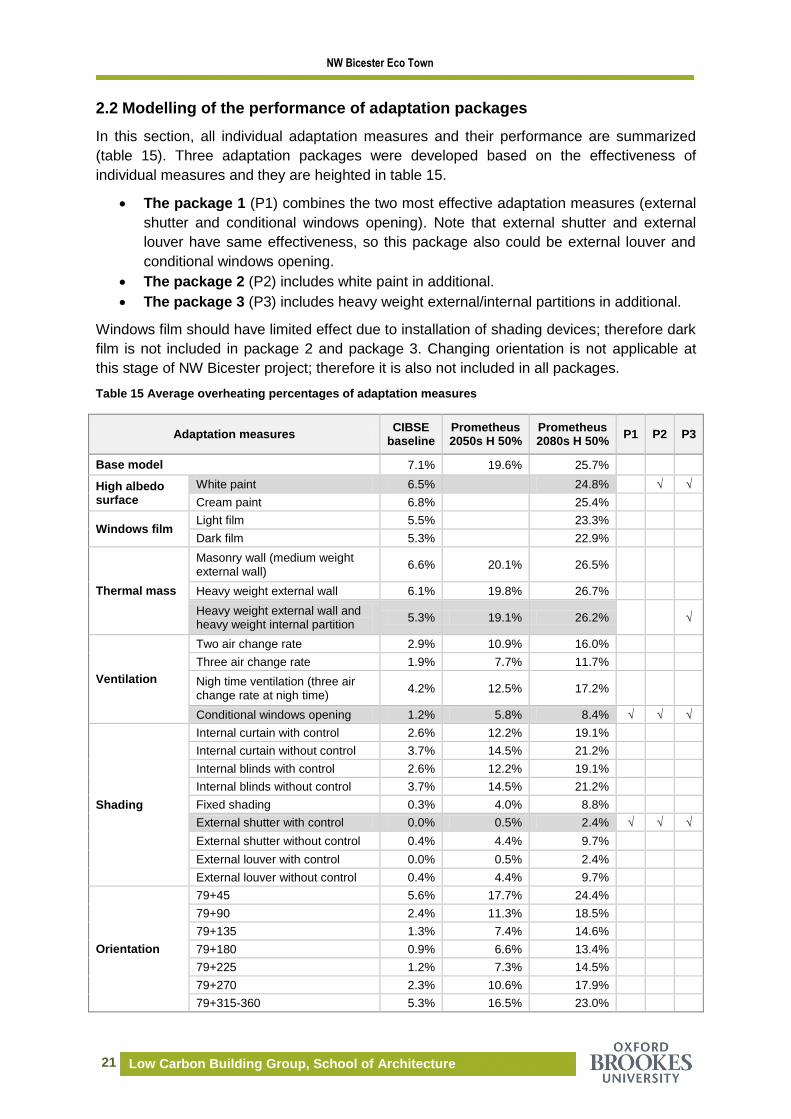
2.2 Modelling of the performance of adaptation packages
In this section, all individual adaptation measures and their performance are summarized
(table 15). Three adaptation packages were developed based on the effectiveness of
individual measures and they are heighted in table 15.
The package 1 (P1) combines the two most effective adaptation measures (external
shutter and conditional windows opening). Note that external shutter and external
louver have same effectiveness, so this package also could be external louver and
conditional windows opening.
The package 2 (P2) includes white paint in additional.
The package 3 (P3) includes heavy weight external/internal partitions in additional.
Windows film should have limited effect due to installation of shading devices; therefore dark
film is not included in package 2 and package 3. Changing orientation is not applicable at
this stage of NW Bicester project; therefore it is also not included in all packages.
Table 15 Average overheating percentages of adaptation measures
Adaptation measures CIBSE
baseline Prometheus 2050s H 50%
Prometheus 2080s H 50%
P1 P2 P3
Base model 7.1% 19.6% 25.7%
High albedo surface
White paint 6.5%
24.8%
√ √
Cream paint 6.8%
25.4%
Windows film Light film 5.5%
23.3%
Dark film 5.3%
22.9%
Thermal mass
Masonry wall (medium weight external wall)
6.6% 20.1% 26.5%
Heavy weight external wall 6.1% 19.8% 26.7%
Heavy weight external wall and heavy weight internal partition
5.3% 19.1% 26.2%
√
Ventilation
Two air change rate 2.9% 10.9% 16.0%
Three air change rate 1.9% 7.7% 11.7%
Nigh time ventilation (three air change rate at nigh time)
4.2% 12.5% 17.2%
Conditional windows opening 1.2% 5.8% 8.4% √ √ √
Shading
Internal curtain with control 2.6% 12.2% 19.1%
Internal curtain without control 3.7% 14.5% 21.2%
Internal blinds with control 2.6% 12.2% 19.1%
Internal blinds without control 3.7% 14.5% 21.2%
Fixed shading 0.3% 4.0% 8.8%
External shutter with control 0.0% 0.5% 2.4% √ √ √
External shutter without control 0.4% 4.4% 9.7%
External louver with control 0.0% 0.5% 2.4%
External louver without control 0.4% 4.4% 9.7%
Orientation
79+45 5.6% 17.7% 24.4%
79+90 2.4% 11.3% 18.5%
79+135 1.3% 7.4% 14.6%
79+180 0.9% 6.6% 13.4%
79+225 1.2% 7.3% 14.5%
79+270 2.3% 10.6% 17.9%
79+315-360 5.3% 16.5% 23.0%

NW Bicester Eco Town
22 Low Carbon Building Group, School of Architecture
The performances of three packages were then tested under current climate and 50
percentile of high emission scenario of 2030s, 2050s and 2080s climate condition. The
overheating percentages of each room in the 3-bed south-facing end-terraced house are
listed in table 16 and the values higher than 1% are highlighted. The average values of
whole house are shown in figure 3.
Table 16 Overheating percentages of adaptation packages on south-facing end-terraced house
Percentage of occupied hours over 26 /28 ⁰C
CIBSE baseline
Prometheus 2030s H 50%
Prometheus 2050s H 50%
Prometheus 2080s H 50%
End-terraced 3-bed house without adaptation
Bedroom1 12.7% 18.8% 26.3% 31.2%
Bedroom2 4.1% 9.6% 16.6% 24.0%
Bedroom3 8.0% 14.7% 22.3% 28.3%
Living room 3.6% 7.1% 13.3% 19.2%
Average 7.1% 12.6% 19.6% 25.7%
Adaptation package 1 (shutter and windows opening)
Bedroom1 0.0% 0.0% 0.5% 1.9%
Bedroom2 0.0% 0.0% 0.2% 1.3%
Bedroom3 0.0% 0.0% 0.1% 1.0%
Living room 0.0% 0.0% 0.0% 0.1%
Average 0.0% 0.0% 0.2% 1.1%
Adaptation package 2 (white paint + package 1)
Bedroom1 0.0% 0.0% 0.2% 1.1%
Bedroom2 0.0% 0.0% 0.0% 0.4%
Bedroom3 0.0% 0.0% 0.0% 0.3%
Living room 0.0% 0.0% 0.0% 0.0%
Average 0.0% 0.0% 0.1% 0.5%
Adaptation package 3 (heavy weight + package 2)
Bedroom1 0.0% 0.0% 0.0% 0.0%
Bedroom2 0.0% 0.0% 0.0% 0.1%
Bedroom3 0.0% 0.0% 0.0% 0.0%
Living room 0.0% 0.0% 0.0% 0.0%
Average 0.0% 0.0% 0.0% 0.0%
Figure 3 Average overheating percentages of adaptation packages
0.00%
5.00%
10.00%
15.00%
20.00%
25.00%
30.00%
CIBSE baseline Prometheus2030s H 50%
Prometheus2050s H 50%
Prometheus2080s H 50%
End-terraced 3-bed housewithout adaptation
Adaptation package 1(shutter and windowsopening)Adaptation package 2(white paint + package 1)
Adaptation package 3(heavy weight + package 2)

NW Bicester Eco Town
23 Low Carbon Building Group, School of Architecture
Adaptation package 1 (shutter and windows opening) could allow the worst case building in
NW Bicester project to stay within comfort range by 2050s. Note that the control of shutter
and windows opening is relied on users’ expectation and experience. For vulnerable
occupants, automatic control system should be introduced.
To solve the problem in 2080s, white paint surface (package 2) could be applied at that time.
This could allow the building to stay within comfort range by 2080s in general (just 0.1% over
the comfort limit in one of bedrooms.).
The package 3 could allow the building to stand by 2080s without any overheating issue.
2.3 Performance of adaptation packages on other house types
In this section, three adaptation packages were applied on other four house types in NW
Bicester development. Their performance is summarized in tables 18-20 and figures 5-7. To
compare their performance with original building model, table 17 and figure 4 also listed the
overheating percentages of the buildings without adaptation measures.
Table 18 and figure 5 show that adaptation package 1 could allow bungalow, detached
house, mid-terraced house and most rooms of flat (with exception of 2 bedrooms) to stay
within comfort limits in 2050s.
Table 19 and figure 6 show that adaptation package 2 could allow mid-terraced house to
stay within comfort limits in 2080s.
Table 20 and figure 7 show that adaptation package 3 could allow all building types to stay
within comfort limits in 2080s

NW Bicester Eco Town
24 Low Carbon Building Group, School of Architecture
Table 17 Overheating percentages (without adaptation)
Type No.
Percentage of occupied hours over 26 /28 ⁰C
CIBSE baseline
Prometheus 2030s H 50%
Prometheus 2050s H 50%
Prometheus 2080s H 50%
2 Bungalow
Bedroom 1 0.8% 2.8% 7.4% 13.4%
Lounge 2.9% 5.2% 9.8% 12.6%
Bedroom 2 0.2% 1.1% 4.7% 10.5%
Average 1.3% 3.0% 7.3% 12.2%
3.1 Ground floor 1 bed flat west
Bedroom 0-A 1.7% 5.4% 10.5% 18.3%
Living room 0-A 1.6% 3.9% 8.4% 13.8%
Average 1.7% 4.7% 9.5% 16.1%
3.2 Ground floor 1 bed flat east
Bedroom 0-B 1.8% 5.5% 10.7% 18.6%
Living room 0-B 1.5% 4.0% 9.0% 14.7%
Average 1.7% 4.8% 9.9% 16.7%
3.3 First floor 2-bed flat west
Bedroom 1-A1 1.8% 5.7% 11.4% 19.0%
Bedroom 1-A2 1.8% 5.4% 11.4% 20.2%
Living room 1-A 2.3% 5.3% 11.6% 18.6%
Average 2.0% 5.5% 11.5% 19.3%
3.4 First floor 2-bed flat east
Bedroom 1-B1 2.2% 6.2% 11.8% 19.9%
Bedroom 1-B2 2.2% 6.6% 12.4% 21.2%
Living room 1-B 2.8% 6.6% 13.1% 19.9%
Average 2.4% 6.5% 12.4% 20.3%
3.5 Second floor 2-bed flat west
Bedroom 2-A1 1.4% 4.9% 10.8% 18.8%
Bedroom 2-A2 1.4% 4.9% 11.0% 20.2%
Living room 2-A 2.1% 5.4% 12.1% 19.5%
Average 1.6% 5.1% 11.3% 19.5%
3.6 Second floor 2-bed flat east
Bedroom 2-B1 1.6% 5.3% 11.1% 19.2%
Bedroom 2-B2 1.5% 5.9% 12.2% 21.1%
Living room 2-B 2.7% 6.6% 14.0% 21.1%
Average 1.9% 5.9% 12.4% 20.5%
4 Detached 5-bed house
Living room 0.0% 0.0% 0.6% 3.3%
Bedroom1 0.0% 0.0% 1.8% 6.4%
Bedroom2 0.0% 0.0% 1.8% 7.0%
Bedroom3 0.0% 0.0% 3.2% 9.5%
Bedroom4 0.1% 0.3% 4.1% 10.3%
Bedroom5 0.5% 2.0% 5.5% 11.9%
Average 0.1% 0.4% 2.8% 8.1%
5 Mid-terraced 3-bed house
Bedroom1 4.5% 9.4% 16.7% 24.1%
Bedroom2 3.3% 7.6% 14.2% 21.5%
Bedroom3 7.6% 13.4% 20.7% 26.7%
Living room 1.3% 3.5% 8.5% 14.3%
Average 4.2% 8.5% 15.0% 21.7%

NW Bicester Eco Town
25 Low Carbon Building Group, School of Architecture
Table 18 Overheating percentages (adaptation package 1)
Type No.
Percentage of occupied hours over 26 /28 ⁰C
CIBSE baseline
Prometheus 2030s H 50%
Prometheus 2050s H 50%
Prometheus 2080s H 50%
2 Bungalow
Bedroom 1 0.0% 0.0% 0.5% 3.3%
Lounge 0.0% 0.0% 0.0% 0.3%
Bedroom 2 0.0% 0.0% 0.1% 1.9%
Average 0.0% 0.0% 0.2% 1.8%
3.1 Ground floor 1 bed flat west
Bedroom 0-A 0.0% 0.0% 0.7% 3.5%
Living room 0-A 0.0% 0.0% 0.0% 0.3%
Average 0.0% 0.0% 0.4% 1.9%
3.2 Ground floor 1 bed flat east
Bedroom 0-B 0.0% 0.0% 0.7% 3.6%
Living room 0-B 0.0% 0.0% 0.0% 0.5%
Average 0.0% 0.0% 0.4% 2.1%
3.3 First floor 2-bed flat west
Bedroom 1-A1 0.0% 0.0% 1.1% 4.2%
Bedroom 1-A2 0.0% 0.0% 0.9% 3.6%
Living room 1-A 0.0% 0.0% 0.0% 0.3%
Average 0.0% 0.0% 0.7% 2.7%
3.4 First floor 2-bed flat east
Bedroom 1-B1 0.0% 0.0% 1.2% 4.3%
Bedroom 1-B2 0.0% 0.0% 0.9% 3.9%
Living room 1-B 0.0% 0.0% 0.0% 0.4%
Average 0.0% 0.0% 0.7% 2.9%
3.5 Second floor 2-bed flat west
Bedroom 2-A1 0.0% 0.0% 1.0% 4.4%
Bedroom 2-A2 0.0% 0.0% 0.7% 4.0%
Living room 2-A 0.0% 0.0% 0.0% 0.2%
Average 0.0% 0.0% 0.6% 2.9%
3.6 Second floor 2-bed flat east
Bedroom 2-B1 0.0% 0.0% 1.0% 4.5%
Bedroom 2-B2 0.0% 0.0% 0.8% 4.3%
Living room 2-B 0.0% 0.0% 0.0% 0.3%
Average 0.0% 0.0% 0.6% 3.0%
4 Detached
Living room 0.0% 0.0% 0.0% 0.1%
Bedroom1 0.0% 0.0% 0.1% 1.3%
Bedroom2 0.0% 0.0% 0.1% 1.4%
Bedroom3 0.0% 0.0% 0.3% 1.9%
Bedroom4 0.0% 0.0% 0.3% 2.2%
Bedroom5 0.0% 0.0% 0.4% 2.6%
Average 0.0% 0.0% 0.2% 1.6%
5 Mid-terraced 3-bed house
Bedroom1 0.0% 0.0% 0.2% 1.4%
Bedroom2 0.0% 0.0% 0.5% 1.8%
Bedroom3 0.0% 0.0% 0.2% 1.4%
Living room 0.0% 0.0% 0.0% 0.1%
Average 0.0% 0.0% 0.2% 1.2%

NW Bicester Eco Town
26 Low Carbon Building Group, School of Architecture
Table 19 Overheating percentages (adaptation package 2)
Type No.
Percentage of occupied hours over 26 /28 ⁰C
CIBSE baseline
Prometheus 2030s H 50%
Prometheus 2050s H 50%
Prometheus 2080s H 50%
2 Bungalow
Bedroom 1 0.0% 0.0% 0.6% 2.9%
Lounge 0.0% 0.0% 0.0% 0.3%
Bedroom 2 0.0% 0.0% 0.1% 1.6%
Average 0.0% 0.0% 0.2% 1.6%
3.1 Ground floor 1 bed flat west
Bedroom 0-A 0.0% 0.0% 0.6% 2.2%
Living room 0-A 0.0% 0.0% 0.0% 0.1%
Average 0.0% 0.0% 0.3% 1.2%
3.2 Ground floor 1 bed flat east
Bedroom 0-B 0.0% 0.0% 0.6% 2.2%
Living room 0-B 0.0% 0.0% 0.0% 0.2%
Average 0.0% 0.0% 0.3% 1.2%
3.3 First floor 2-bed flat west
Bedroom 1-A1 0.0% 0.0% 0.7% 2.4%
Bedroom 1-A2 0.0% 0.0% 0.3% 1.4%
Living room 1-A 0.0% 0.0% 0.0% 0.0%
Average 0.0% 0.0% 0.3% 1.3%
3.4 First floor 2-bed flat east
Bedroom 1-B1 0.0% 0.0% 0.7% 2.5%
Bedroom 1-B2 0.0% 0.0% 0.4% 1.7%
Living room 1-B 0.0% 0.0% 0.0% 0.0%
Average 0.0% 0.0% 0.4% 1.4%
3.5 Second floor 2-bed flat west
Bedroom 2-A1 0.0% 0.0% 0.7% 2.6%
Bedroom 2-A2 0.0% 0.0% 0.3% 1.6%
Living room 2-A 0.0% 0.0% 0.0% 0.0%
Average 0.0% 0.0% 0.3% 1.4%
3.6 Second floor 2-bed flat east
Bedroom 2-B1 0.0% 0.0% 0.7% 2.7%
Bedroom 2-B2 0.0% 0.0% 0.4% 2.0%
Living room 2-B 0.0% 0.0% 0.0% 0.0%
Average 0.0% 0.0% 0.4% 1.6%
4 Detached
Living room 0.0% 0.0% 0.0% 0.0%
Bedroom1 0.0% 0.0% 0.1% 1.0%
Bedroom2 0.0% 0.0% 0.1% 1.0%
Bedroom3 0.0% 0.0% 0.2% 1.2%
Bedroom4 0.0% 0.0% 0.2% 1.3%
Bedroom5 0.0% 0.0% 0.3% 1.5%
Average 0.0% 0.0% 0.2% 1.0%
5 Mid-terraced 3-bed house
Bedroom1 0.0% 0.0% 0.0% 0.6%
Bedroom2 0.0% 0.0% 0.1% 1.0%
Bedroom3 0.0% 0.0% 0.0% 0.8%
Living room 0.0% 0.0% 0.0% 0.0%
Average 0.0% 0.0% 0.0% 0.6%

NW Bicester Eco Town
27 Low Carbon Building Group, School of Architecture
Table 20 Overheating percentages (adaptation package 3)
Type No.
Percentage of occupied hours over 26 /28 ⁰C
CIBSE baseline
Prometheus 2030s H 50%
Prometheus 2050s H 50%
Prometheus 2080s H 50%
2 Bungalow
Bedroom 1 0.0% 0.0% 0.0% 0.1%
Lounge 0.0% 0.0% 0.0% 0.0%
Bedroom 2 0.0% 0.0% 0.0% 0.4%
Average 0.0% 0.0% 0.0% 0.2%
3.1 Ground floor 1 bed flat west
Bedroom 0-A 0.0% 0.0% 0.0% 0.0%
Living room 0-A 0.0% 0.0% 0.0% 0.0%
Average 0.0% 0.0% 0.0% 0.0%
3.2 Ground floor 1 bed flat east
Bedroom 0-B 0.0% 0.0% 0.0% 0.0%
Living room 0-B 0.0% 0.0% 0.0% 0.0%
Average 0.0% 0.0% 0.0% 0.0%
3.3 First floor 2-bed flat west
Bedroom 1-A1 0.0% 0.0% 0.0% 0.1%
Bedroom 1-A2 0.0% 0.0% 0.0% 0.1%
Living room 1-A 0.0% 0.0% 0.0% 0.0%
Average 0.0% 0.0% 0.0% 0.1%
3.4 First floor 2-bed flat east
Bedroom 1-B1 0.0% 0.0% 0.0% 0.1%
Bedroom 1-B2 0.0% 0.0% 0.0% 0.1%
Living room 1-B 0.0% 0.0% 0.0% 0.0%
Average 0.0% 0.0% 0.0% 0.1%
3.5 Second floor 2-bed flat west
Bedroom 2-A1 0.0% 0.0% 0.0% 0.1%
Bedroom 2-A2 0.0% 0.0% 0.0% 0.2%
Living room 2-A 0.0% 0.0% 0.0% 0.0%
Average 0.0% 0.0% 0.0% 0.1%
3.6 Second floor 2-bed flat east
Bedroom 2-B1 0.0% 0.0% 0.0% 0.1%
Bedroom 2-B2 0.0% 0.0% 0.0% 0.2%
Living room 2-B 0.0% 0.0% 0.0% 0.0%
Average 0.0% 0.0% 0.0% 0.1%
4 Detached
Living room 0.0% 0.0% 0.0% 0.1%
Bedroom1 0.0% 0.0% 0.0% 0.0%
Bedroom2 0.0% 0.0% 0.0% 0.0%
Bedroom3 0.0% 0.0% 0.0% 0.0%
Bedroom4 0.0% 0.0% 0.0% 0.0%
Bedroom5 0.0% 0.0% 0.0% 0.0%
Average 0.0% 0.0% 0.0% 0.0%
5 Mid-terraced 3-bed house
Bedroom1 0.0% 0.0% 0.0% 0.0%
Bedroom2 0.0% 0.0% 0.0% 0.0%
Bedroom3 0.0% 0.0% 0.0% 0.0%
Living room 0.0% 0.0% 0.0% 0.0%
Average 0.0% 0.0% 0.0% 0.0%

NW Bicester Eco Town
28 Low Carbon Building Group, School of Architecture
Figure 4 Average overheating percentages (without adaptation)
Figure 5 Average overheating percentages (adaptation package 1)
Figure 6 Average overheating percentages (adaptation package 2)
0.00%
5.00%
10.00%
15.00%
20.00%
25.00%
CIBSE baseline Prometheus2030s H 50%
Prometheus2050s H 50%
Prometheus2080s H 50%
Bungalow
Ground floor 1 bed flat west
Ground floor 1 bed flat east
First floor 2-bed flat west
First floor 2-bed flat east
Second floor 2-bed flat west
Second floor 2-bed flat east
Detached 5-bed house
Mid-terraced 3-bed house
0.00%
1.00%
2.00%
3.00%
4.00%
5.00%
CIBSE baseline Prometheus2030s H 50%
Prometheus2050s H 50%
Prometheus2080s H 50%
Bungalow
Ground floor 1 bed flat west
Ground floor 1 bed flat east
First floor 2-bed flat west
First floor 2-bed flat east
Second floor 2-bed flat west
Second floor 2-bed flat east
Detached 5-bed house
Mid-terraced 3-bed house
NW Bicester Eco Town
29 Low Carbon Building Group, School of Architecture
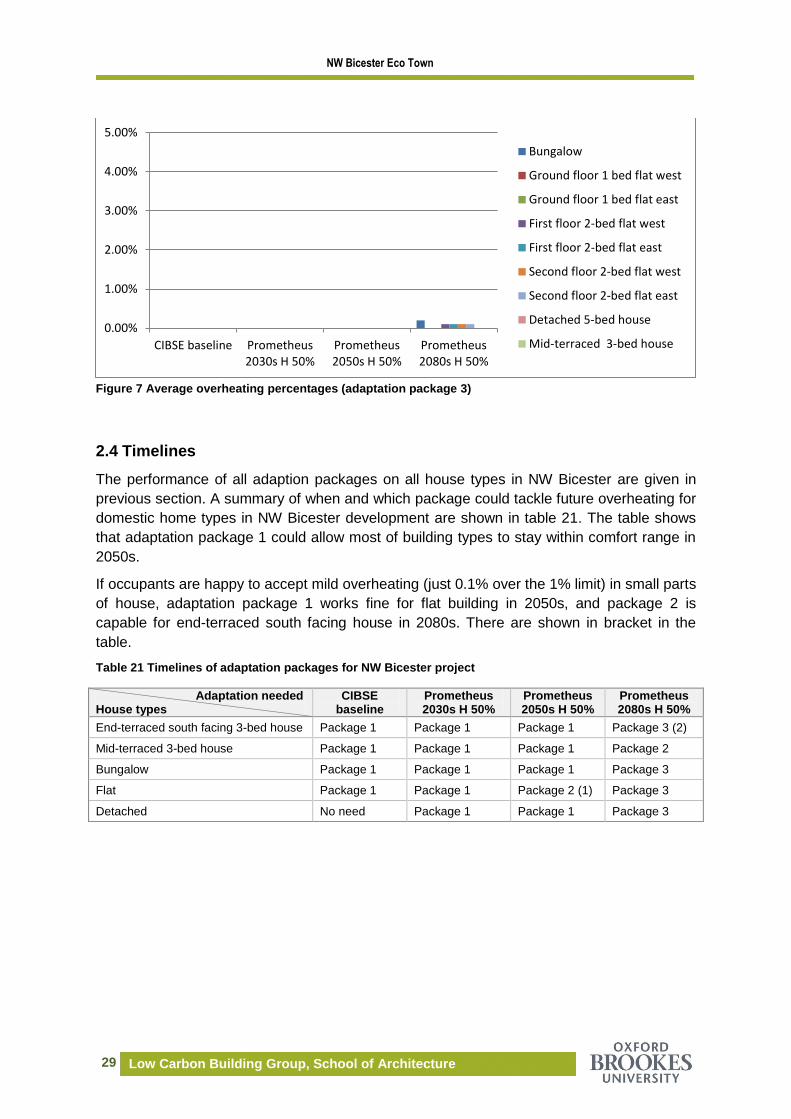
Figure 7 Average overheating percentages (adaptation package 3)
2.4 Timelines
The performance of all adaption packages on all house types in NW Bicester are given in
previous section. A summary of when and which package could tackle future overheating for
domestic home types in NW Bicester development are shown in table 21. The table shows
that adaptation package 1 could allow most of building types to stay within comfort range in
2050s.
If occupants are happy to accept mild overheating (just 0.1% over the 1% limit) in small parts
of house, adaptation package 1 works fine for flat building in 2050s, and package 2 is
capable for end-terraced south facing house in 2080s. There are shown in bracket in the
table.
Table 21 Timelines of adaptation packages for NW Bicester project
Adaptation needed House types
CIBSE baseline
Prometheus 2030s H 50%
Prometheus 2050s H 50%
Prometheus 2080s H 50%
End-terraced south facing 3-bed house Package 1 Package 1 Package 1 Package 3 (2)
Mid-terraced 3-bed house Package 1 Package 1 Package 1 Package 2
Bungalow Package 1 Package 1 Package 1 Package 3
Flat Package 1 Package 1 Package 2 (1) Package 3
Detached No need Package 1 Package 1 Package 3
0.00%
1.00%
2.00%
3.00%
4.00%
5.00%
CIBSE baseline Prometheus2030s H 50%
Prometheus2050s H 50%
Prometheus2080s H 50%
Bungalow
Ground floor 1 bed flat west
Ground floor 1 bed flat east
First floor 2-bed flat west
First floor 2-bed flat east
Second floor 2-bed flat west
Second floor 2-bed flat east
Detached 5-bed house
Mid-terraced 3-bed house

NW Bicester Eco Town
30 Low Carbon Building Group, School of Architecture
3 Designing for construction
3.1 Wind load
Due to a high degree of variation of wind speed and a lack of systematic change wind speed
projections were not included in the UKCP09 probabilistic output (Murphy et al. 2009). But it
is possible to access wind speed in the regional climate model output on which UKCP09 was
partly based on. This provided 11 perturbed physic projections which has approximately
25km resolution (Barclay et al. 2012). The upper limits of these projections could be used to
calculate wind load.
Another approach to calculate wind speed which was used by COPSE and Prometheus
projects is to obtain it by the Penman-Monteith equation (Allen et al. 1998). Watkins et al.
(2011) evaluated the reliability of this equation by non-UKCP09 data.
The well-established wind load calculation tool was developed by BRE. It is dependent on
location (height above sea level, distance from sea, surrounds) and the shaping (height and
form) of the building itself. E.g. the historical wind speed is illustrated in figure 2.
An online wind load calculator (Roofconsult 2012) is also available to carry out calculation
based on the method in British Standard (BS 6399-2:1997).
Figure 8 Basic wind speed map 1997(Gething 2010)

NW Bicester Eco Town
31 Low Carbon Building Group, School of Architecture
3.2 Wind driven rain
The previous report (Gupta and Gregg 2011) identified precipitation changes for NW
Bicester eco town project. In the long-term under high emissions scenario, winter
precipitation is very unlikely to increase by less than 7% and very unlikely to increase by
more than 61% (central estimate: 28% increase). Summer precipitation is very unlikely to
decrease by more than 55% and very unlikely to increase by more than 5% (central
estimate: 28% reduction).
The current approximate wind driven rain for NW Bicester is moderate (33-56.5 Litres/m2 per
shell) based on the map illustrated in Design for future climate report (Gething 2010).
To prevent the increase of winter wind driven rain, following protections would be introduced
with a relatively small cost.
Table 22 Adaptation measures for wind driven rain
Adaptation Element
Measures for Adapting to impacts
from
Climatic change that the adaptation is responding to
Climate change hazard
Climatic change impact
Construction element
Recessed window and door reveals
Structural stability Winter precipitation increase and wind change
Fabric damage
Render finishes
Structural stability Winter precipitation increase and wind change
Fabric damage
Projecting sills with drips
Structural stability Winter precipitation increase and wind change
Fabric damage
Extended eaves
Structural stability Winter precipitation increase and wind change
Fabric damage
Greater laps and fixings to roof and cladding fixings
Structural stability Winter precipitation increase and wind change
Fabric damage
Avoidance of fully filled cavities
Structural stability Winter precipitation increase and wind change
Fabric damage

NW Bicester Eco Town
32 Low Carbon Building Group, School of Architecture
4 Designing to manage water
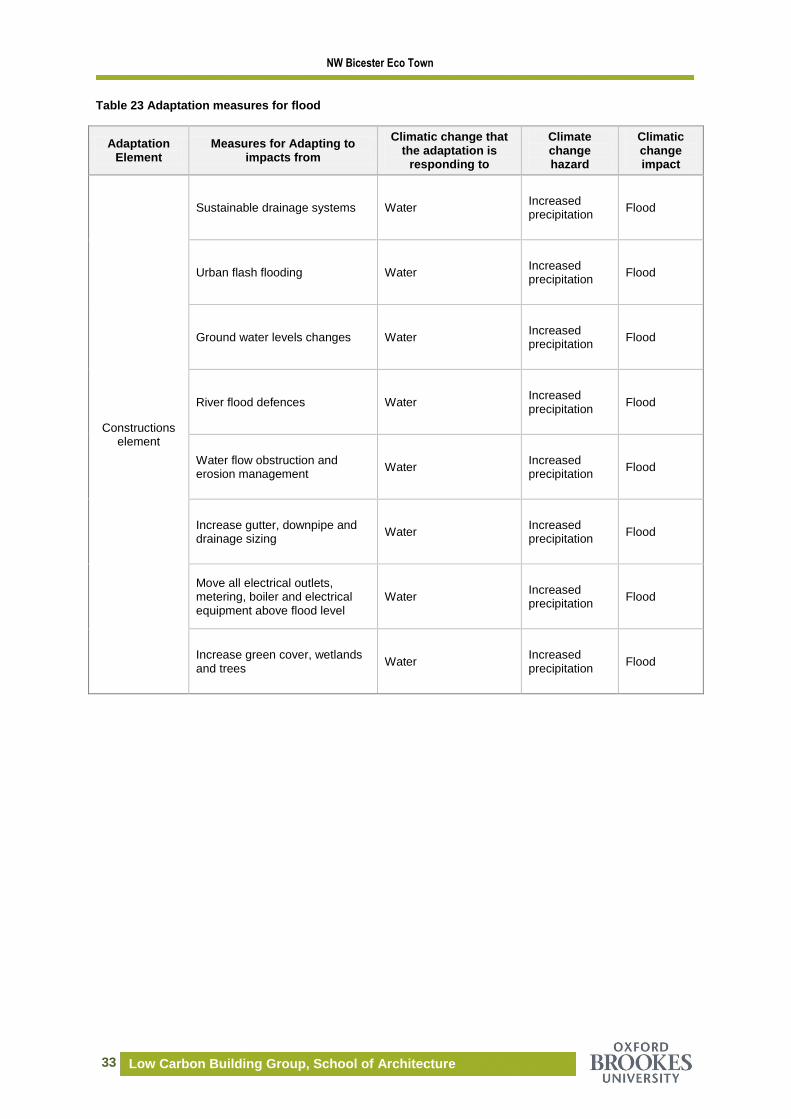
4.1 Flood
According to the Environment Agency (2010), the development site in Bicester is not
currently at significant risk for flooding. The flood risk relative to the development site is
shown below (figure 3). However due to the precipitation changes in future for NW Bicester
eco town, sustainable drainage systems (SUDS) may be needed. It is also needed to
consider following adaption measures.
Figure 9 Flood map for the development site of NW Bicester
NW Bicester Eco Town
33 Low Carbon Building Group, School of Architecture
Table 23 Adaptation measures for flood
Adaptation Element
Measures for Adapting to impacts from
Climatic change that the adaptation is
responding to
Climate change hazard
Climatic change impact
Constructions element
Sustainable drainage systems Water Increased precipitation
Flood
Urban flash flooding
Water Increased precipitation
Flood
Ground water levels changes Water Increased precipitation
Flood
River flood defences Water Increased precipitation
Flood
Water flow obstruction and erosion management
Water Increased precipitation
Flood
Increase gutter, downpipe and drainage sizing
Water Increased precipitation
Flood
Move all electrical outlets, metering, boiler and electrical equipment above flood level
Water Increased precipitation
Flood
Increase green cover, wetlands and trees
Water Increased precipitation
Flood

NW Bicester Eco Town
34 Low Carbon Building Group, School of Architecture
4.2 Water conservation
4.2.1 In-house grey water system
Nearly half of the water usage in a domestic building is flushed down the toilet. Recycling
graywater under sink units can save up to 32 litres per person each day. This system also
can reclaim water from clothes washers, dishwashers and showers. The system requires
plumbing system; therefore there is an electricity cost.
Figure 10 In-house grey water system (Internet image)
4.2.2 Rainwater catchment system
Rainwater Catchment System is defined as a system that utilizes the principal of collecting
and using precipitation from a rooftop or other manmade, above ground collection surface.
The rainwater reaching a roof in a year can be estimated as the annual rainfall times the
roof’s plan area. The collection of run-off water from roof is typically 85% of rainwater
reaching a roof due to evaporation and splashing.
Figure 11 Rainwater catchment system (Internet image)

NW Bicester Eco Town
35 Low Carbon Building Group, School of Architecture
4.3 Energy for hot water system
Solar hot water system increases the energy security of a building by providing an on-site
energy supply for water heating. Solar hot water use solar energy to heat water rather than
relying on electricity or natural gas. The system works all year round, though the water
needs to be heated further with a boiler during the winter months.
Figure 12 Domestic solar hot water system (Internet image)
The adaptation measures for water conservation and energy are summarized in table below.
Table 24 Adaptation measures for water (building level)
Element of built environment
being adapted
Measures for Adapting to impacts from, and mitigating
future climate change
Climatic change that the
adaptation is responding to
Climate change hazard
Climatic change impact
Water
(building level)
In-house grey water system
WATER STRESS Summertime mean precipitation reduction
Water stress and/or drought
Water
(building level)
Install rainwater catchment system
WATER STRESS / DROUGHT
Summertime mean precipitation reduction
Water stress and/or drought
Hot water system Install domestic solar hot water system
ENERGY Summertime mean precipitation reduction
Water stress and/or drought

NW Bicester Eco Town
36 Low Carbon Building Group, School of Architecture
5 Green landscape and infrastructure
The future climate of hotter and drier summer will have significant impact on outdoor
environment; therefore green landscape and infrastructure have important roles on providing
comfort environment. Following adaptation measures are suggested to be considered for
NW Bicester eco town development.
Table 25 Adaptation measures (infrastructure)
Adaptation Element
Measures for Adapting to impacts from
Climatic change that the
adaptation is responding to
Climate change hazard
Climatic change impact
Pu
blic
am
enitie
s
an
d in
frastr
uctu
re
Add shading to transport infrastructure, such as bus stops and cycle racks
HEAT
Peak summertime temperature increase Summertime solar intensity increase
Overheating in summer leading to discomfort, ill health and degradation of materials
Add seating in shaded areas, on streets & in POS
HEAT
Summertime temperature increase and measurable heat wave projections
Building overheating in summer leading to discomfort, ill health
Identify and allocate appropriate buildings as ‘community cool rooms’
HEAT WAVES
Summertime temperature increase and measurable heat wave projections
Overheating in buildings further increased by urban heat island effects
Ensure pedestrian and cycle routes are sheltered from high winds/storms, e.g. by soft landscaping
STORM Wintertime mean precipitation increase
Increased flood vulnerability and building structure/material degradation
Replace pavements and roads with porous, ‘cool’ materials
HEAT & INCREASED RAIN AND STORMS
Wintertime mean precipitation increase
Increased flood vulnerability and water ingress for buildings
Use energy efficient street lighting and/ or switch street lights off for periods of the night
ENERGY Peak summertime temperature increase
Higher temperatures cause increased cooling load increases energy demand & energy poverty
Remodel streets to encourage walking, cycling and public transport, e.g. reduce parking spaces, develop ‘home zones’
HEAT Peak summertime temperature increase
Building overheating in summer and urban heat island effect leading to increased energy demand
Wa
ter
(ne
igh
bo
urh
ood
level)
Install blue infrastructure: lakes, ponds, and other water landscape features
HEAT
Summertime temperature increase and measurable heat wave projections
Overheating in buildings further increased by urban heat island effects
Install a pond or other water feature e.g. pool
HEAT
Summertime temperature increase and measurable heat wave projections
Overheating in buildings further increased by urban heat island effects

NW Bicester Eco Town
37 Low Carbon Building Group, School of Architecture
Table 26 Adaptation measures (landscape)
Adaptation Element
Measures for Adapting to impacts from, and
mitigating future climate change
Climatic change that the adaptation
is responding to
Climate change hazard
Climatic change impact
Green landscaping features
Plant more street trees/ Shaded outdoor space
HEAT
Summertime temperature increase and measurable heat wave projections
Overheating in buildings, high urban temperatures leading to possible increased energy use
Convert selected streets into greenways
HEAT, STORMS and INCREASED RAINFALL
Summertime temperature increase and Wintertime mean precipitation increase
Overheating in buildings and Increased flood vulnerability
Enhance vegetation if the soil has good infiltration qualities
HEAVY RAIN and FLOODS
Wintertime mean precipitation increase
Increased flood vulnerability and water ingress for buildings
Plant trees with large canopies - using caution not to compromise building stability
HEAT
Summertime temperature increase and measurable heat wave projections
Overheating in buildings, high urban temperatures leading to possible increased energy use
Plant heat, drought and pollution tolerant plants (Xeriscaping)
HEAT
Summertime temperature increase and measurable heat wave projections
Overheating in buildings, high urban temperatures leading to possible increased energy use
Plant drought resistant plants -Good examples Birch, Alder, Yew, Beech, Italian Alder, Box, Privet.
DROUGHT Summertime mean precipitation reduction
Water stress and/or drought
Species (Willows, poplars & oaks) should not include as these can cause low level ozone production under high temperatures
HEAT AND AIR POLLUTION
Summertime temperature increase and Summertime mean precipitation reduction
Overheating in buildings leading to possible increased energy use and increased dust levels
Set aside space to grow food HEAT/FOOD
Summertime temperature increase and Summertime mean precipitation reduction
Water stress but increased growing season
Remove/ reduce non-porous garden surfaces. Replace with an alternative: grass-reinforcement concrete or plastic mesh, gravel, brick (with drainage channels), cellular paving, or lawn or vegetable plots
INCREASED PRECIPITATION
Winter mean precipitation increase
Increased flood vulnerability and water ingress for dwellings

NW Bicester Eco Town
38 Low Carbon Building Group, School of Architecture
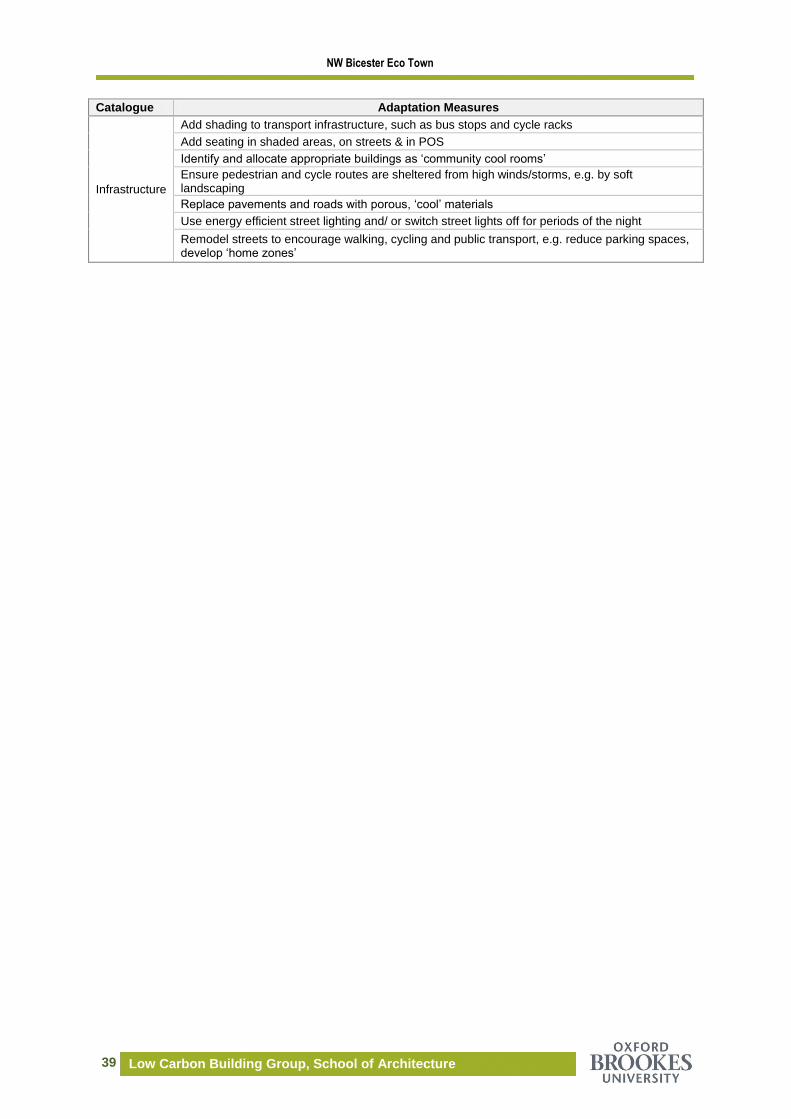
6 Summary of adaption measures
In summary, all adaption measures for comfort, construction, water, green landscape and
infrastructure were listed in following table. Building designers could choose the suitable
measures from the list based on their judgement and costs of these adaption measures.
Table 27 Summary of adaption measures
Catalogue Adaptation Measures
Comfort
Package 1: External shutter closed when incident radiation is higher than 100 W/m
2; Top hung windows (10% overall windows area) open 10⁰ when indoor air
temperature is higher than 23 ⁰C and higher than external air temperature. Both of
them could be implemented by occupants or automatic control system.
Package 2: package 1 + paint outside surface of roof and external wall in white colour
Package 3: package 2 + heavy weight external and internal partitions
Construction
Wind load change
Recessed window and door reveals
Render finishes
Projecting sills with drips
Extended eaves
Greater laps and fixings to roof and cladding fixings
Avoidance of fully filled cavities
Flood
Sustainable drainage systems
Urban flash flooding
Ground water levels changes
River flood defences
Water flow obstruction and erosion management
Increase gutter, downpipe and drainage sizing
Move all electrical outlets, metering, boiler and electrical equipment above flood level
Increase green cover, wetlands and trees
Water \conservation (building level)
In-house grey water system
Install rainwater catchment system
Water/ energy for hot water
Install domestic solar hot water system
Water \conservation (neighbourhood level)
Install blue infrastructure: lakes, ponds, and other water landscape features
Install a pond or other water feature e.g. pool
Green landscaping features
Plant more street trees/
Shaded outdoor space
Convert selected streets into greenways
Enhance vegetation if the soil has good infiltration qualities
Plant trees with large canopies - using caution not to compromise building stability
Plant heat, drought and pollution tolerant plants (Xeriscaping)
Plant drought resistant plants -Good examples Birch, Alder, Yew, Beech, Italian Alder, Box, Privet.
Species (Willows, poplars & oaks) should not include as these can cause low level ozone production under high temperatures
Set aside space to grow food
Remove/ reduce non-porous garden surfaces. Replace with an alternative: grass-reinforcement concrete or plastic mesh, gravel, brick (with drainage channels), cellular paving, or lawn or vegetable plots
NW Bicester Eco Town
39 Low Carbon Building Group, School of Architecture
Catalogue Adaptation Measures
Infrastructure
Add shading to transport infrastructure, such as bus stops and cycle racks
Add seating in shaded areas, on streets & in POS
Identify and allocate appropriate buildings as ‘community cool rooms’
Ensure pedestrian and cycle routes are sheltered from high winds/storms, e.g. by soft landscaping
Replace pavements and roads with porous, ‘cool’ materials
Use energy efficient street lighting and/ or switch street lights off for periods of the night
Remodel streets to encourage walking, cycling and public transport, e.g. reduce parking spaces, develop ‘home zones’
NW Bicester Eco Town
40 Low Carbon Building Group, School of Architecture
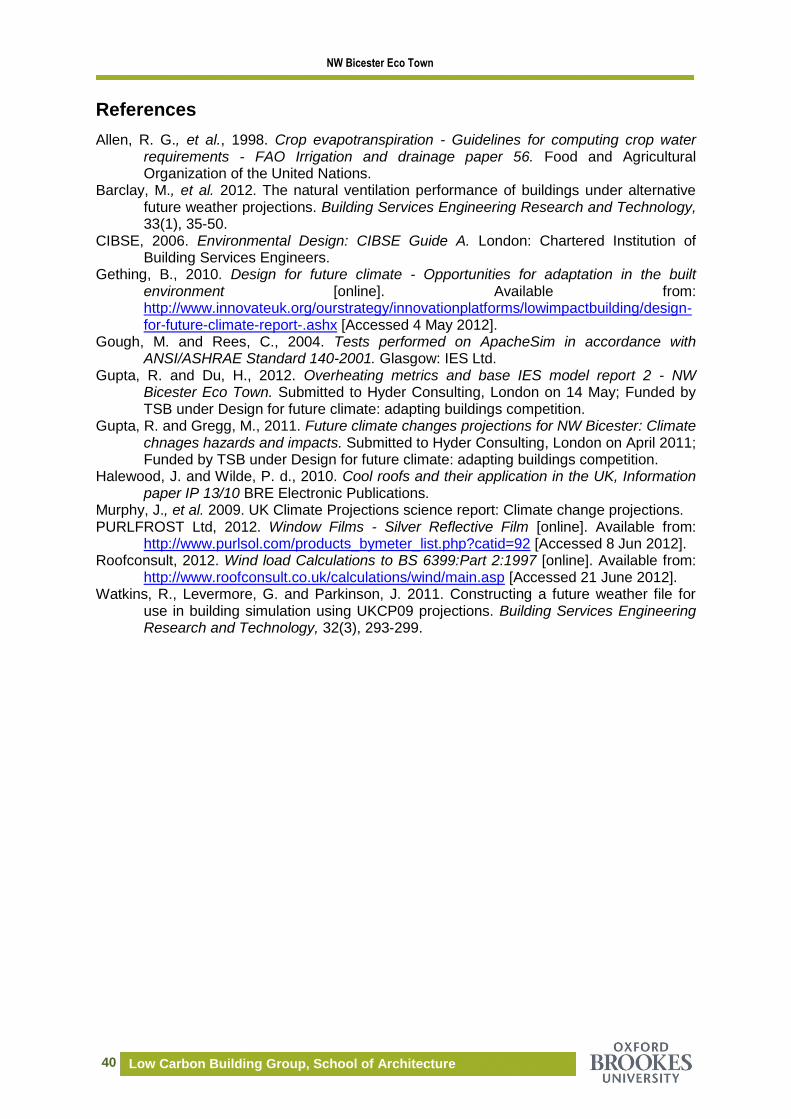
References
Allen, R. G., et al., 1998. Crop evapotranspiration - Guidelines for computing crop water requirements - FAO Irrigation and drainage paper 56. Food and Agricultural Organization of the United Nations.
Barclay, M., et al. 2012. The natural ventilation performance of buildings under alternative future weather projections. Building Services Engineering Research and Technology, 33(1), 35-50.
CIBSE, 2006. Environmental Design: CIBSE Guide A. London: Chartered Institution of Building Services Engineers.
Gething, B., 2010. Design for future climate - Opportunities for adaptation in the built environment [online]. Available from: http://www.innovateuk.org/ourstrategy/innovationplatforms/lowimpactbuilding/design-for-future-climate-report-.ashx [Accessed 4 May 2012].
Gough, M. and Rees, C., 2004. Tests performed on ApacheSim in accordance with ANSI/ASHRAE Standard 140-2001. Glasgow: IES Ltd.
Gupta, R. and Du, H., 2012. Overheating metrics and base IES model report 2 - NW Bicester Eco Town. Submitted to Hyder Consulting, London on 14 May; Funded by TSB under Design for future climate: adapting buildings competition.
Gupta, R. and Gregg, M., 2011. Future climate changes projections for NW Bicester: Climate chnages hazards and impacts. Submitted to Hyder Consulting, London on April 2011; Funded by TSB under Design for future climate: adapting buildings competition.
Halewood, J. and Wilde, P. d., 2010. Cool roofs and their application in the UK, Information paper IP 13/10 BRE Electronic Publications.
Murphy, J., et al. 2009. UK Climate Projections science report: Climate change projections. PURLFROST Ltd, 2012. Window Films - Silver Reflective Film [online]. Available from:
http://www.purlsol.com/products_bymeter_list.php?catid=92 [Accessed 8 Jun 2012]. Roofconsult, 2012. Wind load Calculations to BS 6399:Part 2:1997 [online]. Available from:
http://www.roofconsult.co.uk/calculations/wind/main.asp [Accessed 21 June 2012]. Watkins, R., Levermore, G. and Parkinson, J. 2011. Constructing a future weather file for
use in building simulation using UKCP09 projections. Building Services Engineering Research and Technology, 32(3), 293-299.