light-driven growth in amazon evergreen forests explained by seasonal ... · light-driven growth in...
TRANSCRIPT
Light-driven growth in Amazon evergreen forestsexplained by seasonal variations of verticalcanopy structureHao Tanga,1 and Ralph Dubayaha
aDepartment of Geographical Sciences, University of Maryland, College Park, MD 20742
Edited by Inez Y. Fung, University of California, Berkeley, CA, and approved January 24, 2017 (received for review October 12, 2016)
Light-regime variability is an important limiting factor constrainingtree growth in tropical forests. However, there is considerabledebate about whether radiation-induced green-up during the dryseason is real, or an apparent artifact of the remote-sensingtechniques used to infer seasonal changes in canopy leaf area. Directand widespread observations of vertical canopy structures thatdrive radiation regimes have been largely absent. Here we analyzeseasonal dynamic patterns between the canopy and understorylayers in Amazon evergreen forests using observations of verticalcanopy structure from a spaceborne lidar. We discovered that net leafflushing of the canopy layer mainly occurs in early dry season, and isfollowed by net abscission in late dry season that coincides withincreasing leaf area of the understory layer. Our observations ofunderstory development from lidar either weakly respond to or arenot correlated to seasonal variations in precipitation or insolation, butare strongly related to the seasonal structural dynamics of the canopylayer. We hypothesize that understory growth is driven by increasedlight gaps caused by seasonal variations of the canopy. This light-regime variability that exists in both spatial and temporal domains canbetter reveal the drought-induced green-up phenomenon, whichappears less obvious when treating the Amazon forests as a whole.
Amazon | precipitation | phenology | forest structure | remote sensing
Light is regarded as the main limiting factor for tree growth intropical rainforests (1–3). High radiation exposure in gaps
that result from tree fall in dense canopies can promote thegrowth of seedlings and juvenile trees, and this regenerationprocess is characterized by gap dynamic theory (4, 5). Similarly,enhanced light availability during early dry season can increasecanopy leaf area and total productivity of canopy and emergenttrees, such as the seasonal greening-up phenomenon in Amazonforests (3, 6–8).However, conflicting observations from field and satellite data
challenge the paradigm of light-driven growth. For example, thegap dynamic theory cannot universally explain the advancegrowth of shade-tolerant trees that dominate tropical forests (5,9). Most species when facing a tradeoff between high growth ratein large tree-fall gaps and survivorship in shade try to avoid ei-ther extreme (5, 10). Adult trees with leaves high in the main andemergent canopy layer have direct access to high radiation loadsfor increased growth during the dry season. Whether this light-induced greening-up phenomenon in the Amazon is real, or anartifact of passive optical remote-sensing techniques, is still inquestion (11–15). Multiple studies, from both field surveys andremote-sensing observations, further suggest that water is themain constraint for forest growth during the dry season, and evenmild drought can decrease the net carbon uptake with significantleaf abscission and high mortality rates, particularly in thesouthern Amazon (13, 16–20).Whereas temporal interactions among herbivory, environ-
mental factors, and forest phenology, and their interannualvariability may play a role in determining phenological state,exact mechanisms remain unclear (1, 16, 17). For example, both
increased total leaf area and enhanced leaf photosynthetic ca-pacity may possibly contribute to the dry-season greening of theAmazon forests (1, 3, 6–8). Wu et al. (6) suggest increases incapacity occur as old leaves are replaced by new leaves of higherlight-use efficiency in the dry season, helping to explain ecosys-tem photosynthesis dynamics. A further possible explanation isthe seasonal dynamics of vertical canopy structure in response tocontinuous changes of microenvironmental conditions. To ex-plore this issue, we analyzed seasonal leaf area index (LAI) dy-namics of both canopy and understory over intact Amazonforests using data from the Geosciences Laser Altimeter System(GLAS), onboard NASA’s Ice, Cloud and land Elevation Sat-ellite (ICESat) (21). Lidar-based observations provide direct andaccurate measurements of leaf area density for both the canopyand understory layer in tropical forests (22, 23), and can alsocharacterize multitemporal canopy structure dynamics (24).Additionally, lidar does not suffer from potentially confoundingartifacts in passive optical satellite images, e.g., resulting fromvariations in sun-sensor geometry (11, 12, 14). We first mappedseasonal LAI changes of canopy and understory across threeacquisition periods mainly in March, June, and October, re-spectively (Fig. S1). Next, we examined relationships betweenLAI changes and seasonal variations of two climatic variables,precipitation and solar radiation, over the Amazon as a whole,and within four different climate zones identified from monthlyprecipitation data (Fig. S2). Finally, we quantified observeddifferences between canopy and understory LAI seasonally andinvestigated their potential interaction.
ResultsCanopy LAI exhibited significant seasonal variations (Fig. 1A–C, Table 1, and Fig. S3), the spatial pattern of which coincided
Significance
Observations of field experiments and satellite imagery haveled to a significant debate about light-driven growth of Ama-zon forests during the dry season. We help resolve these con-flicts using observations from spaceborne lidar, and show thatboth canopy and understory have an opportunistic ecologicalresponse to the radiation and moisture regimes. Our research isplaced within a consistent ecological framework that linksgap theory, field-based studies, and the remote-sensing datarecord, and which illuminates mechanistic responses of theunderstory and canopy forming trees to changes in lightand water.
Author contributions: H.T. and R.D. designed research; H.T. performed research; H.T. andR.D. analyzed data; and H.T. and R.D. wrote the paper.
The authors declare no conflict of interest.
This article is a PNAS Direct Submission.1To whom correspondence should be addressed. Email: [email protected].
This article contains supporting information online at www.pnas.org/lookup/suppl/doi:10.1073/pnas.1616943114/-/DCSupplemental.
2640–2644 | PNAS | March 7, 2017 | vol. 114 | no. 10 www.pnas.org/cgi/doi/10.1073/pnas.1616943114
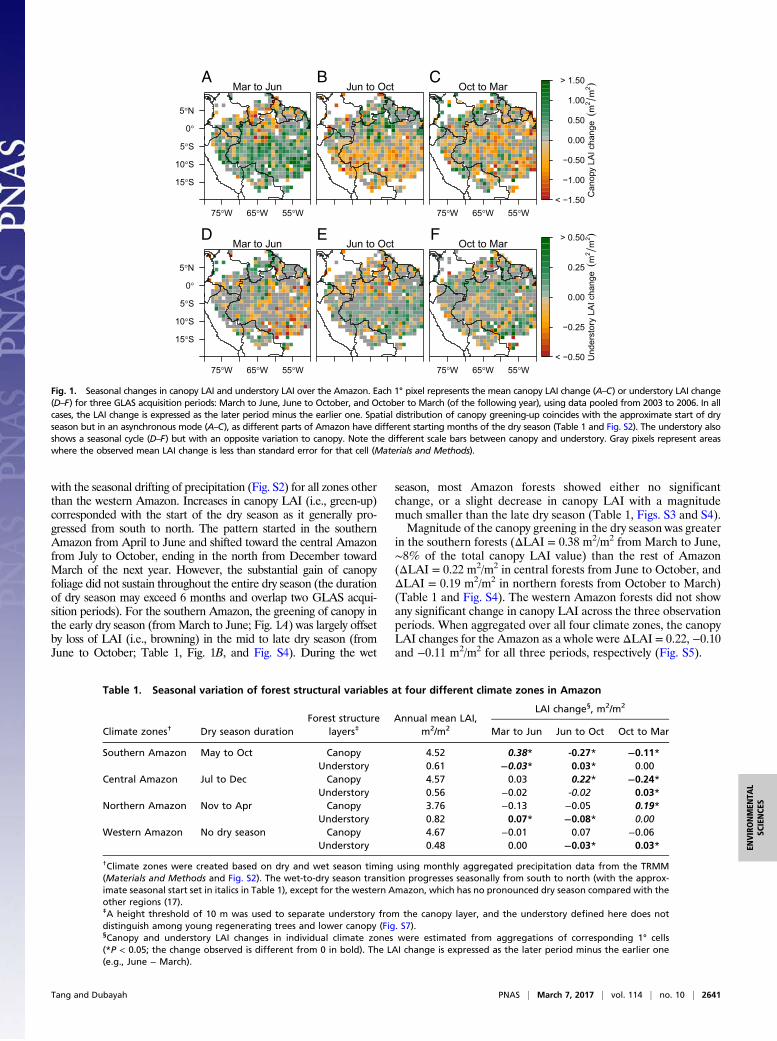
with the seasonal drifting of precipitation (Fig. S2) for all zones otherthan the western Amazon. Increases in canopy LAI (i.e., green-up)corresponded with the start of the dry season as it generally pro-gressed from south to north. The pattern started in the southernAmazon from April to June and shifted toward the central Amazonfrom July to October, ending in the north from December towardMarch of the next year. However, the substantial gain of canopyfoliage did not sustain throughout the entire dry season (the durationof dry season may exceed 6 months and overlap two GLAS acqui-sition periods). For the southern Amazon, the greening of canopy inthe early dry season (fromMarch to June; Fig. 1A) was largely offsetby loss of LAI (i.e., browning) in the mid to late dry season (fromJune to October; Table 1, Fig. 1B, and Fig. S4). During the wet
season, most Amazon forests showed either no significantchange, or a slight decrease in canopy LAI with a magnitudemuch smaller than the late dry season (Table 1, Figs. S3 and S4).Magnitude of the canopy greening in the dry season was greater
in the southern forests (ΔLAI = 0.38 m2/m2 from March to June,∼8% of the total canopy LAI value) than the rest of Amazon(ΔLAI = 0.22 m2/m2 in central forests from June to October, andΔLAI = 0.19 m2/m2 in northern forests from October to March)(Table 1 and Fig. S4). The western Amazon forests did not showany significant change in canopy LAI across the three observationperiods. When aggregated over all four climate zones, the canopyLAI changes for the Amazon as a whole were ΔLAI = 0.22, −0.10and −0.11 m2/m2 for all three periods, respectively (Fig. S5).
15°S
10°S
5°S
0°
5°N
75°W 65°W 55°W
AMar to Jun
BJun to Oct
75°W 65°W 55°W
COct to Mar
< −1.50
−1.00
−0.50
0.00
0.50
1.00
> 1.50
Can
opy
LAI c
hang
e (m
2m
2 )
15°S
10°S
5°S
0°
5°N
75°W 65°W 55°W
DMar to Jun
EJun to Oct
75°W 65°W 55°W
FOct to Mar
< −0.50
−0.25
0.00
0.25
> 0.50
Und
erst
ory
LAI c
hang
e (m
2m
2 )
Fig. 1. Seasonal changes in canopy LAI and understory LAI over the Amazon. Each 1° pixel represents the mean canopy LAI change (A–C) or understory LAI change(D–F) for three GLAS acquisition periods: March to June, June to October, and October to March (of the following year), using data pooled from 2003 to 2006. In allcases, the LAI change is expressed as the later period minus the earlier one. Spatial distribution of canopy greening-up coincides with the approximate start of dryseason but in an asynchronous mode (A–C), as different parts of Amazon have different starting months of the dry season (Table 1 and Fig. S2). The understory alsoshows a seasonal cycle (D–F) but with an opposite variation to canopy. Note the different scale bars between canopy and understory. Gray pixels represent areaswhere the observed mean LAI change is less than standard error for that cell (Materials and Methods).
Table 1. Seasonal variation of forest structural variables at four different climate zones in Amazon
Climate zones† Dry season durationForest structure
layers‡Annual mean LAI,
m2/m2
LAI change§, m2/m2
Mar to Jun Jun to Oct Oct to Mar
Southern Amazon May to Oct Canopy 4.52 0.38* -0.27* −0.11*Understory 0.61 −0.03* 0.03* 0.00
Central Amazon Jul to Dec Canopy 4.57 0.03 0.22* −0.24*Understory 0.56 −0.02 -0.02 0.03*
Northern Amazon Nov to Apr Canopy 3.76 −0.13 −0.05 0.19*Understory 0.82 0.07* −0.08* 0.00
Western Amazon No dry season Canopy 4.67 −0.01 0.07 −0.06Understory 0.48 0.00 −0.03* 0.03*
†Climate zones were created based on dry and wet season timing using monthly aggregated precipitation data from the TRMM(Materials and Methods and Fig. S2). The wet-to-dry season transition progresses seasonally from south to north (with the approx-imate seasonal start set in italics in Table 1), except for the western Amazon, which has no pronounced dry season compared with theother regions (17).‡A height threshold of 10 m was used to separate understory from the canopy layer, and the understory defined here does notdistinguish among young regenerating trees and lower canopy (Fig. S7).§Canopy and understory LAI changes in individual climate zones were estimated from aggregations of corresponding 1° cells(*P < 0.05; the change observed is different from 0 in bold). The LAI change is expressed as the later period minus the earlier one(e.g., June − March).
Tang and Dubayah PNAS | March 7, 2017 | vol. 114 | no. 10 | 2641
ENVIRONMEN
TAL
SCIENCE
S

The understory also exhibited a seasonal variation of LAI, butmostly in an opposing temporal pattern compared with the canopylayer (Fig. 1 D–F, Table 1, and Figs. S3 and S6), decreasing duringthe start of dry season. Increases in understory LAI mainly occurredin the middle or end of dry season when the shedding of canopyleaves was largely completed, as inferred by the negative changes incanopy LAI. The increases could also happen at the end of wetseason but before the start of dry season (e.g., around 10°S, 55°W inFig. 1F). Although the magnitude of understory LAI changes wassmall (Fig. S7), its relative change rate (i.e., percentage change toits annual mean) exceeded 50% for individual cells (Fig. S8).Significant relationships were observed between shifts in
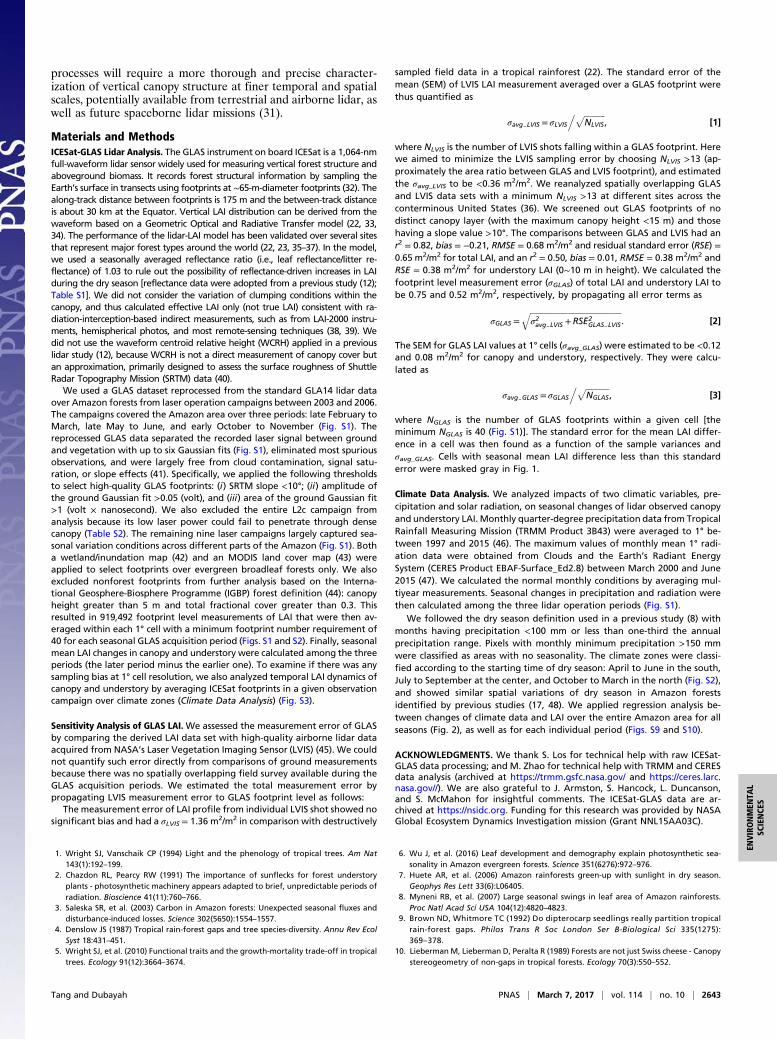
canopy LAI and climatic variables, similar to previous studies (8,11). Seasonal changes in canopy LAI showed a negative corre-lation with changes in precipitation (r2 = 0.17, 0.15, and 0.05,respectively, for the three periods with all P <0.01), and a slightlyweaker positive correlation with variations of solar radiation(r2 = 0.08, 0.03, and 0.03, respectively, with all P < 0.01; Fig. S9).However, only a weak (r2 ≤ 0.05) or insignificant relationship (P >0.05) was found when relating understory LAI changes with eitherprecipitation or radiation (Fig. S10). In contrast, increases in un-derstory LAI had strong negative correlations with the decrease ofcanopy LAI for all three periods (Fig. 2 and Fig. S10).
DiscussionThe spatial pattern of lidar-derived canopy LAI dynamics showsan increase of ∼5–8% during the wet-to-dry season transition,although the magnitude of observed changes varied geographi-cally, with a maximum in the southern Amazon (Table 1 and Fig.S3). These results support the hypothesis of dry season green-upwithin Amazon forests reported in previous studies (3, 6–8, 11,14, 19). Our changes are largely consistent with results from Wuet al. and Guan et al. (6, 19), which reported increases varying
from ∼5–10% using Moderate Resolution Imaging Spectro-radiometer (MODIS) enhanced vegetation index (EVI).Our analyses also reveal that seasonal change of canopy phe-
nology corresponds with the spatial and temporal change of pre-cipitation (Fig. 1 and Fig. S9). These results support field studiesthat leaf flushing coincides with the increased light exposure at theearly stage of the dry season (3, 6). The loss of LAI of canopyleaves (Fig. 1 A–C) during the middle or late dry season highlightsthe importance of water availability on leaf development as well,and supports the hypothesis that mild drought potentially mayhave a negative impact on forest growth when plant water deficitsexceed critical thresholds (15, 17, 19). Such is the example in thesouthern Amazon, where we observed a significant loss of canopyfoliage during its 6-month dry season. We note that a similar lidarstudy over Amazon forests did not see these dynamics (12), be-cause it used limited ICESat data from only one period (June andOctober), thus missing the pervasive spatial temporal variations incanopy and understory LAI present in the complete record.The greening of understory at late dry season and its opposing
seasonal variation with the canopy layer reveal a potential in-teraction between canopy and understory in the Amazon. We didnot observe this interaction in dry forests outside the basin areawhere water is the main limiting factor (Fig. S8). These results areconsistent with previous findings that, in tropical rainforests, thegrowth of light-limited understory plants has a strong phenologicalpreference for maximal irradiance conditions when the canopylayer is deciduous during the dry season (1, 25). Our results alsosuggest that crown structural dynamics and associated changes inmicroenvironment on understory development may contribute astronger influence than seasonal climatic variability in precipitationand radiation (2, 4, 26). One potential explanatory mechanism maybe that understory plants do not benefit from the increased in-solation (i.e., top of canopy solar radiation) during the early dryseason because most of it is intercepted by new canopy leaves withhigh light-use efficiency. Subsequently, understory plants and smalltrees grow with increased canopy gap openings either in the midlatedry season (after canopy abscission) or at the end of wet season (butbefore canopy flushing). Previous studies in dense tropical forestssuggest that even a decrease of 5% in dry-season LAI can enhancethe light reaching the forest floor by more than 50% relative to thewet season, although the absolute radiation level may still remain aslow as 1% (27, 28). Meanwhile, strong evapotranspiration fromlargely intact canopy allows the understory to maintain low waterdeficits by moistening the air at boundary layer (29). The favorablemicroenvironment, combined from light and water conditions,therefore promotes the growth of understory in the late dry seasonas indicated by the increase of understory LAI in the Amazon.This seasonal gap-creation growth hypothesis provides a com-
plementary explanation for the growth of shade-tolerant and slow-growing trees in tropical rainforests. It suggests that enhancedsubcanopy radiation transmission caused by seasonal variations ofthe canopy layer (e.g., from sun flecks or enhanced diffuse light)may play a critical role in tropical forest regeneration in addition tolarge tree-fall gaps (5, 9, 28). This is consistent with the strategytaken by tropical dry semideciduous forests, where partial crowncover may optimize seed germination and seedling establishment,balancing light requirements and water limitations (26, 30). Mosttropical forests are essentially semideciduous with abscission levelsvarying along moisture gradients (1, 30).Our results further suggest that Amazon forests may optimize
phenological processes with an anticipatory response to reliableenvironmental factors (1), such as regular seasonality. The large-scale LAI dynamics we observed with lidar agrees with theconceptual leaf turnover hypothesis and field studies that treesmaximize the carbon gain by flushing new leaves of high pho-tosynthetic capacity at the end of the wet season, and reduce therespiratory loss by dropping old leaves before water stress duringthe dry season (1, 6, 27, 28, 30). Further examination of these
−2 −1 0 1 2
−1.0
−0.5
0.0
0.5
1.0
All seasons
Seasonal canopy LAI change (m2 m2)
Sea
sona
l und
erst
ory
LAI c
hang
e (m
2m
2 )
Y = −0.15 X + 0.00r2 = 0.40 , p < 0.01
Southern AmazonCentral AmazonNorthern AmazonWestern Amazon
Fig. 2. Relationship between seasonal understory and canopy LAI changesacross Amazon forests. Strong and consistent negative correlations arefound across all climate zones throughout the seasonal cycle (dashed linegenerated from an ordinary least-squares model), suggesting the abscissionof crown structure plays a fundamental role on understory developmentacross Amazon forests (Fig. S11).
2642 | www.pnas.org/cgi/doi/10.1073/pnas.1616943114 Tang and Dubayah
processes will require a more thorough and precise character-ization of vertical canopy structure at finer temporal and spatialscales, potentially available from terrestrial and airborne lidar, aswell as future spaceborne lidar missions (31).
Materials and MethodsICESat-GLAS Lidar Analysis. The GLAS instrument on board ICESat is a 1,064-nmfull-waveform lidar sensor widely used for measuring vertical forest structure andaboveground biomass. It records forest structural information by sampling theEarth’s surface in transects using footprints at ∼65-m-diameter footprints (32). Thealong-track distance between footprints is 175 m and the between-track distanceis about 30 km at the Equator. Vertical LAI distribution can be derived from thewaveform based on a Geometric Optical and Radiative Transfer model (22, 33,34). The performance of the lidar-LAI model has been validated over several sitesthat represent major forest types around the world (22, 23, 35–37). In the model,we used a seasonally averaged reflectance ratio (i.e., leaf reflectance/litter re-flectance) of 1.03 to rule out the possibility of reflectance-driven increases in LAIduring the dry season [reflectance data were adopted from a previous study (12);Table S1]. We did not consider the variation of clumping conditions within thecanopy, and thus calculated effective LAI only (not true LAI) consistent with ra-diation-interception-based indirect measurements, such as from LAI-2000 instru-ments, hemispherical photos, and most remote-sensing techniques (38, 39). Wedid not use the waveform centroid relative height (WCRH) applied in a previouslidar study (12), because WCRH is not a direct measurement of canopy cover butan approximation, primarily designed to assess the surface roughness of ShuttleRadar Topography Mission (SRTM) data (40).
We used a GLAS dataset reprocessed from the standard GLA14 lidar dataover Amazon forests from laser operation campaigns between 2003 and 2006.The campaigns covered the Amazon area over three periods: late February toMarch, late May to June, and early October to November (Fig. S1). Thereprocessed GLAS data separated the recorded laser signal between groundand vegetation with up to six Gaussian fits (Fig. S1), eliminated most spuriousobservations, and were largely free from cloud contamination, signal satu-ration, or slope effects (41). Specifically, we applied the following thresholdsto select high-quality GLAS footprints: (i) SRTM slope <10°; (ii) amplitude ofthe ground Gaussian fit >0.05 (volt), and (iii) area of the ground Gaussian fit>1 (volt × nanosecond). We also excluded the entire L2c campaign fromanalysis because its low laser power could fail to penetrate through densecanopy (Table S2). The remaining nine laser campaigns largely captured sea-sonal variation conditions across different parts of the Amazon (Fig. S1). Botha wetland/inundation map (42) and an MODIS land cover map (43) wereapplied to select footprints over evergreen broadleaf forests only. We alsoexcluded nonforest footprints from further analysis based on the Interna-tional Geosphere-Biosphere Programme (IGBP) forest definition (44): canopyheight greater than 5 m and total fractional cover greater than 0.3. Thisresulted in 919,492 footprint level measurements of LAI that were then av-eraged within each 1° cell with a minimum footprint number requirement of40 for each seasonal GLAS acquisition period (Figs. S1 and S2). Finally, seasonalmean LAI changes in canopy and understory were calculated among the threeperiods (the later period minus the earlier one). To examine if there was anysampling bias at 1° cell resolution, we also analyzed temporal LAI dynamics ofcanopy and understory by averaging ICESat footprints in a given observationcampaign over climate zones (Climate Data Analysis) (Fig. S3).
Sensitivity Analysis of GLAS LAI. We assessed the measurement error of GLASby comparing the derived LAI data set with high-quality airborne lidar dataacquired from NASA’s Laser Vegetation Imaging Sensor (LVIS) (45). We couldnot quantify such error directly from comparisons of ground measurementsbecause there was no spatially overlapping field survey available during theGLAS acquisition periods. We estimated the total measurement error bypropagating LVIS measurement error to GLAS footprint level as follows:
The measurement error of LAI profile from individual LVIS shot showed nosignificant bias and had a σLVIS = 1.36 m2/m2 in comparison with destructively
sampled field data in a tropical rainforest (22). The standard error of themean (SEM) of LVIS LAI measurement averaged over a GLAS footprint werethus quantified as
σavg LVIS = σLVIS. ffiffiffiffiffiffiffiffiffiffiffi
NLVIS
p, [1]
where NLVIS is the number of LVIS shots falling within a GLAS footprint. Herewe aimed to minimize the LVIS sampling error by choosing NLVIS >13 (ap-proximately the area ratio between GLAS and LVIS footprint), and estimatedthe σavg_LVIS to be <0.36 m2/m2. We reanalyzed spatially overlapping GLASand LVIS data sets with a minimum NLVIS >13 at different sites across theconterminous United States (36). We screened out GLAS footprints of nodistinct canopy layer (with the maximum canopy height <15 m) and thosehaving a slope value >10°. The comparisons between GLAS and LVIS had anr2 = 0.82, bias = −0.21, RMSE = 0.68 m2/m2 and residual standard error (RSE) =0.65 m2/m2 for total LAI, and an r2 = 0.50, bias = 0.01, RMSE = 0.38 m2/m2 andRSE = 0.38 m2/m2 for understory LAI (0∼10 m in height). We calculated thefootprint level measurement error (σGLAS) of total LAI and understory LAI tobe 0.75 and 0.52 m2/m2, respectively, by propagating all error terms as
σGLAS =ffiffiffiffiffiffiffiffiffiffiffiffiffiffiffiffiffiffiffiffiffiffiffiffiffiffiffiffiffiffiffiffiffiffiffiffiffiffiffiffiffiffiffiffiffiffiffiσ2avg LVIS +RSE2
GLAS LVIS
q. [2]
The SEM for GLAS LAI values at 1° cells (σavg_GLAS) were estimated to be <0.12and 0.08 m2/m2 for canopy and understory, respectively. They were calcu-lated as
σavg GLAS = σGLAS. ffiffiffiffiffiffiffiffiffiffiffiffi
NGLAS
p, [3]
where NGLAS is the number of GLAS footprints within a given cell [theminimum NGLAS is 40 (Fig. S1)]. The standard error for the mean LAI differ-ence in a cell was then found as a function of the sample variances andσavg_GLAS. Cells with seasonal mean LAI difference less than this standarderror were masked gray in Fig. 1.
Climate Data Analysis. We analyzed impacts of two climatic variables, pre-cipitation and solar radiation, on seasonal changes of lidar observed canopyand understory LAI. Monthly quarter-degree precipitation data from TropicalRainfall Measuring Mission (TRMM Product 3B43) were averaged to 1° be-tween 1997 and 2015 (46). The maximum values of monthly mean 1° radi-ation data were obtained from Clouds and the Earth’s Radiant EnergySystem (CERES Product EBAF-Surface_Ed2.8) between March 2000 and June2015 (47). We calculated the normal monthly conditions by averaging mul-tiyear measurements. Seasonal changes in precipitation and radiation werethen calculated among the three lidar operation periods (Fig. S1).
We followed the dry season definition used in a previous study (8) withmonths having precipitation <100 mm or less than one-third the annualprecipitation range. Pixels with monthly minimum precipitation >150 mmwere classified as areas with no seasonality. The climate zones were classi-fied according to the starting time of dry season: April to June in the south,July to September at the center, and October to March in the north (Fig. S2),and showed similar spatial variations of dry season in Amazon forestsidentified by previous studies (17, 48). We applied regression analysis be-tween changes of climate data and LAI over the entire Amazon area for allseasons (Fig. 2), as well as for each individual period (Figs. S9 and S10).
ACKNOWLEDGMENTS. We thank S. Los for technical help with raw ICESat-GLAS data processing; and M. Zhao for technical help with TRMM and CERESdata analysis (archived at https://trmm.gsfc.nasa.gov/ and https://ceres.larc.nasa.gov//). We are also grateful to J. Armston, S. Hancock, L. Duncanson,and S. McMahon for insightful comments. The ICESat-GLAS data are ar-chived at https://nsidc.org. Funding for this research was provided by NASAGlobal Ecosystem Dynamics Investigation mission (Grant NNL15AA03C).
1. Wright SJ, Vanschaik CP (1994) Light and the phenology of tropical trees. Am Nat143(1):192–199.
2. Chazdon RL, Pearcy RW (1991) The importance of sunflecks for forest understoryplants - photosynthetic machinery appears adapted to brief, unpredictable periods ofradiation. Bioscience 41(11):760–766.
3. Saleska SR, et al. (2003) Carbon in Amazon forests: Unexpected seasonal fluxes anddisturbance-induced losses. Science 302(5650):1554–1557.
4. Denslow JS (1987) Tropical rain-forest gaps and tree species-diversity. Annu Rev EcolSyst 18:431–451.
5. Wright SJ, et al. (2010) Functional traits and the growth-mortality trade-off in tropicaltrees. Ecology 91(12):3664–3674.
6. Wu J, et al. (2016) Leaf development and demography explain photosynthetic sea-sonality in Amazon evergreen forests. Science 351(6276):972–976.
7. Huete AR, et al. (2006) Amazon rainforests green-up with sunlight in dry season.Geophys Res Lett 33(6):L06405.
8. Myneni RB, et al. (2007) Large seasonal swings in leaf area of Amazon rainforests.Proc Natl Acad Sci USA 104(12):4820–4823.
9. Brown ND, Whitmore TC (1992) Do dipterocarp seedlings really partition tropicalrain-forest gaps. Philos Trans R Soc London Ser B-Biological Sci 335(1275):369–378.
10. LiebermanM, Lieberman D, Peralta R (1989) Forests are not just Swiss cheese - Canopystereogeometry of non-gaps in tropical forests. Ecology 70(3):550–552.
Tang and Dubayah PNAS | March 7, 2017 | vol. 114 | no. 10 | 2643
ENVIRONMEN
TAL
SCIENCE
S
11. Hilker T, et al. (2014) Vegetation dynamics and rainfall sensitivity of the Amazon. ProcNatl Acad Sci USA 111(45):16041–16046.
12. Morton DC, et al. (2014) Amazon forests maintain consistent canopy structure andgreenness during the dry season. Nature 506(7487):221–224.
13. Saleska SR, et al. (2016) Dry-season greening of Amazon forests. Nature 531(7594):E4–E5.
14. Bi J, et al. (2015) Sunlight mediated seasonality in canopy structure and photosyn-thetic activity of Amazonian rainforests. Environ Res Lett 10(6):64014.
15. Jones MO, Kimball JS, Nemani RR (2014) Asynchronous Amazon forest canopy phenologyindicates adaptation to both water and light availability. Environ Res Lett 9(12):124021.
16. Lewis SL, Brando PM, Phillips OL, van der Heijden GMF, Nepstad D (2011) The 2010Amazon drought. Science 331(6017):554.
17. Brando PM, et al. (2010) Seasonal and interannual variability of climate and vege-tation indices across the Amazon. Proc Natl Acad Sci USA 107(33):14685–14690.
18. Davidson EA, et al. (2012) The Amazon basin in transition. Nature 481(7381):321–328.19. Guan KY, et al. (2015) Photosynthetic seasonality of global tropical forests con-
strained by hydroclimate. Nat Geosci 8(4):284–289.20. Asner GP, Alencar A (2010) Drought impacts on the Amazon forest: The remote
sensing perspective. New Phytol 187(3):569–578.21. Schutz BE, Zwally HJ, Shuman CA, Hancock D, DiMarzio JP (2005) Overview of the
ICESat Mission. Geophys Res Lett 32(21):L21S01.22. Tang H, et al. (2012) Retrieval of vertical LAI profiles over tropical rain forests using
waveform lidar at La Selva, Costa Rica. Remote Sens Environ 124:242–250.23. Stark SC, et al. (2012) Amazon forest carbon dynamics predicted by profiles of canopy
leaf area and light environment. Ecol Lett 15(12):1406–1414.24. Dubayah RO, et al. (2010) Estimation of tropical forest height and biomass dynamics
using lidar remote sensing at La Selva, Costa Rica. J Geophys Res 115:G00E09.25. Engelbrecht BMJ, et al. (2007) Drought sensitivity shapes species distribution patterns
in tropical forests. Nature 447(7140):80–82.26. Vieira DLM, Scariot A (2006) Principles of natural regeneration of tropical dry forests
for restoration. Restor Ecol 14(1):11–20.27. Parker G, Tinoco-Ojanguren C, Martinez-Yrizar A, Maass M (2005) Seasonal balance
and vertical pattern of photosynthetically active radiation within canopies of atropical dry deciduous forest ecosystem in Mexico. J Trop Ecol 21:283–295.
28. Wirth R, Weber B, Ryel RJ (2001) Spatial and temporal variability of canopy structurein a tropical moist forest. Acta Oecologica-International J Ecol 22(5–6):235–244.
29. Juarez RIN, Hodnett MG, Fu R, Goulden ML, von Randow C (2007) Control of dryseason evapotranspiration over the Amazonian forest as inferred from observationsat a southern Amazon forest site. J Clim 20(12):2827–2839.
30. Murphy PG, Lugo AE (1986) Ecology of tropical dry forest. Annu Rev Ecol Syst 17:67–88.
31. Dubayah R, et al. (2014) The Global Ecosystem Dynamics Investigation. AmericanGeophysical Union, Fall Meeting 2014 (AGU, San Francisco).
32. Abshire JB, et al. (2005) Geoscience Laser Altimeter System (GLAS) on the ICESatMission: On-orbit measurement performance. Geophys Res Lett 32(21):L21S02.
33. Ni-Meister W, Jupp DLB, Dubayah R (2001) Modeling lidar waveforms in heteroge-neous and discrete canopies. IEEE Trans Geosci Remote Sens 39(9):1943–1958.
34. Harding D (2001) Laser altimeter canopy height profiles: Methods and validation forclosed-canopy, broadleaf forests. Remote Sens Environ 76(3):283–297.
35. Tang H, et al. (2014) Deriving and validating Leaf Area Index (LAI) at multiple spatialscales through lidar remote sensing: A case study in Sierra National Forest, CA.Remote Sens Environ 143:131–141.
36. Tang H, et al. (2016) Characterizing leaf area index (LAI) and vertical foliage profile(VFP) over the United States. Biogeosciences 13(1):239–252.
37. Armston J, et al. (2013) Direct retrieval of canopy gap probability using airbornewaveform lidar. Remote Sens Environ 134:24–38.
38. Chen JM, Cihlar J (1995) Plant canopy gap-size analysis theory for improving opticalmeasurements of leaf-area index. Appl Opt 34(27):6211–6222.
39. Chen J, Menges C, Leblanc S (2005) Global mapping of foliage clumping index usingmulti-angular satellite data. Remote Sens Environ 97(4):447–457.
40. Carabajal CC, Harding DJ (2006) SRTM C-band and ICESat laser altimetry elevationcomparisons as a function of tree cover and relief. Photogramm Eng Remote Sensing72(3):287–298.
41. Los SO, et al. (2012) Vegetation height and cover fraction between 60° S and 60° Nfrom ICESat GLAS data. Geosci Model Dev 5(2):413–432.
42. Hess LL, et al. (2015) Wetlands of the Lowland Amazon Basin: Extent, vegetativecover, and dual-season inundated area as mapped with JERS-1 Synthetic ApertureRadar. Wetlands 35(4):745–756.
43. Friedl MA, et al. (2010) MODIS Collection 5 global land cover: Algorithm refinementsand characterization of new datasets. Remote Sens Environ 114(1):168–182.
44. Belward AS (1996) The IGBP-DIS Global 1 km Land Cover Data Set “DISCover”:Proposal and Implementation Plans (IGBP-DIS Office, Toulouse, France).
45. Blair JB, Rabine DL, Hofton MA (1999) The Laser Vegetation Imaging Sensor : Amedium-altitude, digitization-only, airborne laser altimeter for mapping vegeta-tion and topography. ISPRS J Photogramm Remote Sens 54(2–3):115–122.
46. Huffman GJ, Stocker EF, Bolvin DT, Nelkin EJ, Adler RF (2012) TRMM Version 7 3B42and 3B43 Data Sets.
47. Kato S (2015) CERES Level 3 EBAF-Surface Terra+Aqua netCDF File - Edition 2.8,10.5067/Terra+Aqua/CERES/EBAF-Surface_L3B.002.8.
48. Xiao X, Hagen S, Zhang Q, Keller M, Moore B (2006) Detecting leaf phenology ofseasonally moist tropical forests in South America with multi-temporal MODIS im-ages. Remote Sens Environ 103(4):465–473.
2644 | www.pnas.org/cgi/doi/10.1073/pnas.1616943114 Tang and Dubayah