light absorption – lambert-beer la · 2015-07-16 · lambert-beer law contd. a t 01 10.1 20.01 30...
TRANSCRIPT

where i is the number of cuvettes. The last expression may be generalized for any cuvette with light path-length l:
Light Absorption – Lambert-Beer Law
I0 I1 I2 I3 I4 nII
II
II
II
====4
3
3
2
2
1
1
0
0
0.2
0.4
0.6
0.8
1
0 1 2 3 4
Light pathlength (l )
Ligh
t Int
ensi
ty (I )
log 1010 niii o i oI I n I I −−= ⇒ =
kloII −= 10
where k is a coefficient which depends on concentration, c, and molar absorptivity, ε:k = ε × c
Therefore,
This qualitative relationship is described by the following function for light intensity:
0 0
0
10 10 10 logcl cl clo
I III I clI I I
ε ε ε ε− −= ⇒ = ⇒ = ⇒ =
clIIAAbsorbance o ε=== log
A
IITnceTransmitta −=== 100
Light goes through a number of cuvettes.

Lambert-Beer Law Contd.
A T0 11 0.12 0.013 0∞ 0
Dimensions:A dimensionlessl cmc Mε M-1cm-1 (molar absorptivity or extinction coefficient)
Connection between absorbance and transmittance:
Major application of Beers’ law - determination of unknown concentration by measuring absorbance: l
Acε
=

Absorption SpectraclA λλ ε=Light absorption depends on wavelength of light
Light has dual nature1. Wave
λ c
λ − wavelengthc – speed of light wave propagationν = c/λ − frequency
2. ParticleEnergy of light particle:
λν hch ==E
λ (or ν) determines the color of light
0.0
0.1
0.2
0.3
0.4
400 500 600 700
Wavelength, nm
Abs
orba
nce
Absorption spectrum of red wine (Canadian merlot, 1998)

Spectrum of Electromagnetic Waves
Spectrophotometry deals with light within ~200–1000 nm

Mechanism of light absorption
Diagram of potential energy in diatomic molecule
Electronic transition is the transition between different electronic statesGround state is the state with lowest electronic energyExcited state is the state with higher electronic energy.Electronic transition to the excited state is caused by absorption of a photon
1) Inter-nuclear distance is greater in the excited state than in the ground state Vertical transitions
are most probable2) Franck-Condon principle: electronic transition is much faster than rearrangement of nuclei → the distance between nuclei is not able to change during electronic transition
Vertical transition results in occupation of higher vibrational energy levels ⇒ Vibrational energy dissipates producing heat ⇒ Light
absorption is always accompanied by sample heating

Small molecules at low temperatureEven at 0K the molecule has vibration. Therefore, a number of vertical transitions can occur to different vibrational levels of the excited state.
This transitions will require photons of different energy, resulting in an absorption spectrum.At low temperatures for small molecules transitions to different vibrational levels can be resolved
⇓The spectrum consists of very narrow bands.

Multi-atomic molecules at high temperatures
1) Multiatomic molecules have many possible electronic transitions
Absorption spectra consist of broad bands2) At high temperatures excitation
can also occur from different vibrational levels of the ground state

Using absorption spectra to study biochemical reactions
Absorption spectrum is sensitive to minor changes in chemical structure of a molecule. Therefore, chemical reactions and changes in biopolymer conformation can be followed by monitoring absorption spectra.
N
N N
NFe
OO
N
NHis F8
N
NH
Heme
Example: oxygenation of hemoglobinHemoglobin is a protein with MW of 70 kDaContains 4 heme groupsEvery heme can bind a molecule of oxygen non-covalently (oxygenation)Oxygenation drastically changes the absorption spectrum
His E7

Oxygenation of Hemoglobin
0
0.2
0.4
0.6
0.8
1
1.2
300 400 500 600 700
Wavelength, nm
Abso
rban
ce
Oxyhemoglobin
Hemoglobin
0
0.2
0.4
0.6
0.8
1
1.2
300 400 500
Wavelength, nm
Abs
orpt
ion
Isosbestic points
- Isosbestic points are wavelengths at which the molar absorptivities of the substances are equal
- The presence of isosbestic points is a good indication that only one product forms from a substrate

Analysis of a MixtureAbsorbance is an additive function → Absorbance of a mixture is a sum of the absorbances of the components:
...][][][ +++= lZlYlXA ZYX εεε
- It is a linear equation. [X], [Y], [Z] are unknowns. - To find the unknowns the number of unknowns must be equal to the number of equations → to determine the unknown concentrations of N substances in a mixture absorbances of the mixture must be measured at N wavelengthsThe molar absorptivities of all the pure components at N wavelengths must be measured a priory using pure substances.

Analysis of two-component mixture (hemoglobin and oxyhemoglobin)
0
0.2
0.4
0.6
0.8
1
1.2
300 350 400 450 500
Wav e le ngth, nm
Ab
sorb
ance
HO
Two components require two wavelengths. The wavelength are chosen to maximize the differential molar absorptivity:For wavelength λ1:For wavelength λ2:
max11 =− OH εε
max22 =− OH εε
Absorption of the mixture at wavelength λ1:lOlHA OH ][][ 111 εε +=
Absorption of the mixture at wavelength λ2:lOlHA OH ][][ 222 εε +=
To solve this system of equation with regards to [H] and [O] we must:1) measure the molar absorptivities of pure hemoglobin and oxyhemoglobin at two wavelengths: 1 2 1 1, , , and H H O Oε ε ε ε

Hemoglobin and Oxyhemoglobin Contd.
0
20000
40000
60000
80000
100000
120000
300 350 400 450 500
Wavelength, nm
Mol
ar A
bsor
ptiv
ity, M
-1cm
-1
OH2) Measure absorbances, A1 and A2, of
the mixture at two wavelengths.3) Solve the system:From equation 1:
Substitute [H] in equation 2:
Solve last expression with regards to [O]:
Using expressions 3 and 4:
llOAH H
O
1
11 ][][εε−
=
lOll
lOAA OH
OH ][][
21
1122 ε
εεε +
−=
lAAO OHHO
HH
)(][
1212
2112
εεεεεε
−−
=
lAAH OHHO
OO
)(][
1212
1221
εεεεεε
−−
=

Spectrophotometers
Monochromator
Broad spectrum Narrow
line
Cuvet
DetectorI0 I
1. Baseline is the measurement of I0 as a function of λ using a cuvet with only a solvent.2. Sample reading is the measurement of I as a function of λ using the cuvet with a sample. 3. Calculation of absorbance: A = log(I0/I)
Conventional spectrophotometersPrice range CA$ 15-20K

Jablonski Diagram - Fluorescence vs. Phosphorescence
012
012
012
012
hνA1 hνA
2
Internalconversion10-12 s
Lightabsorption10-15 s
hνF
Inter-system conversionThe rate varies in a large rangeThe influence of heavy metals
Fluorescence10-8 s
Phosphorescence>10-6 s
S0
S1
S2
T1

Fluorescence Lifetime Fluorescence intensity decays exponentially:
I = I0e-kt
where k is the monomolecular rate constant of fluorescence decay, which can be determined experimentally from the kinetics of decay
Definition: lifetime of fluorescence:τ = 1/k
do not confuse with half-life time, t1/2= ln2/k
The rate constant of fluorescence decay is in general a function of two components, radiative rate, kr and non-radiative rate, knr:
k = kr + knr
The lifetime accordingly is τ = 1/(kr + knr)
Natural lifetime, τn, is that for knr = 0: τn = 1/kr
τ/τn = kr/(kr + knr)

Quantum YieldQuantum yield:
Substances with the highest Q (~1), such as rhodamines are the brightest emitters
Quantum yield relates with the lifetime:Q = kr/(kr+ knr)
hotonsabsorbed p ofnumber otonsemitted ph ofnumber
=Q
τ/τn = kr/(kr + knr) = Q
Thus, τn can be found as: τn = τ/QNote: that both τ and Q are experimentally measurable parameters
Problem:kr typical for fluorescence is 108 s-1
knr typical is ~ 109 s-1
Calculate Q typical for fluorescenceSolution: Q = kr/(kr+ knr) = 108/(108 + 109) ≈ 0.1

Quenching of FluorescenceTwo major mechanisms of quenching exist:- Dynamic or collisional (depends on the diffusion of fluorophore and quencher)- Static (the formation of non-radiative complexes with quenchers that does not depend on the diffusion of fluorophore and quencher)
Dynamic quenching is characterized by the Stern-Volmer eqn.:
I0/I = 1 + kqτ0[Q]
Where I0 and I are fluorescence intensities with and without quencher, kq is a bimolecular rate constant of quenching (M-1s-1), τ0is the lifetime of the fluorophore in the absence of quenchers, [Q] is the concentration of quencher.

Stern-Volmer Equation
f(t) k = τ0-1
Q
Qkq[Q]
* Simplified Jablonski diagram:f(t) is the rate of excitation which
depends on: (i) incident light intensity,(ii) concentration of fluorophore, (iii) absorptivity of fluorophore
In the steady state, when f(t) = const, the concentration of thefluorophore in the excited state does not change:
[F*] = constThus:
d[F*]/dt = 0Note: d[F*]/dt = the rate of formation minus the rate of decay
k = τ0-1 is the decay rate of fluorophore in the absence of the quencher
τ0 is the lifetime of fluorophore in the absence of the quencher[F*] is the concentration of fluorophore in the excited (*) state

Stern-Volmer Equation contd.In the absence of the quencher: d[F*]/dt = f(t) - k[F*]0 = 0Where [F*]0 is the concentration of F* in the the absence of quencher
In the presence of the quencher: d[F*]/dt = f(t) - k[F*] - kq[F*][Q] = 0
f(t) - k[F*]0 = f(t) - k[F*] - kq[F*][Q]k[F*]0 = (k + kq[Q])[F*][F*]0 /[F*] = (k + kq[Q]) /k = 1 + kq[Q]/k = 1 + kqτ0[Q][F*]0 /[F*] = 1 + kqτ0[Q]
The intensities of irradiation in the absence and the presence of quencher, I0 and I, are proportional to the concentration of fluorophore in the excited state: I0 = k[F*]0, and I = k[F*], then:
I0 /I = 1 + kqτ0[Q] Prove that: τ0/τ = 1 + kqτ0[Q]

Stern-Volmer Constant, KSV = kqτ0I0 /I = 1 + kqτ0[Q] = 1 + KSV[Q]KSV can be experimentally measured from the Stern-Volmer plot:
I0/I
[Q]10
Slope = KSV
- The linearity of the SV plot in general indicates that there is a single class of fluorophore- The increase of the slope with T indicates that quenching is dynamic (collision frequency increases with T)
I0/I
[Q]10
More than 1 fluorophore with at least one of them less accessible to the quencher leads to SV plot deviation toward the [Q]-axis
Highertemp.

Efficiency of QuenchingThe bimolecular rate constant of quenching, kq, is proportional to the diffusion controlled bimolecular rate constant, kd. The coefficient of proportionality is the efficiency of quenching ϕ:
kq = ϕ kd ϕ ≤ 1
Determination of ϕ: ϕ = kq / kdkq can be calculated from kq = KSV/τ0KSV can be determined from the SV plotsτ0 can be determined from the kinetics of fluorescence decaykd can be calculated using the Smoluchovski equation:
))((10004
qfqfA
d DDRRNk ++=π
where NA is Avogadro number, Rf and Rq are molecular radii of the fluorophore and quencher, respectively, Df and Dq are diffusion coefficients of the fluorophore and quencher, respectively

Efficiency of Quenching contd.The radii can be estimated from the molecular structuresDiffusion coefficients can be calculated from the Stokes-Einstein eqn.:
D = kT/6πηRwhere k = 1.38 × 10⁻²³ JK-1 is the Boltzman constantη is the solvent viscosity (~ 9 × 10⁻⁴ kg m-1 s-1 for water)
At 25°C in water: DO2 = 2.5 × 10⁻⁵ cm2/s, Dtrypt = 0.66 × 10⁻⁵ cm2/sAssume that RO2 + Rtryp = 5 Å
1110102.1))((10004
22
−−×=++= sMDDRRNk trypOtrypOA
d
π
Example: Find ϕ for quenching of tryptophan by oxygenStep 1: finding kqThe experimental value of KSV = 32.5 M-1
The experimental value of τ0 = 2.7 ns
Step 2: finding kd
kq = KSV/τ0 = 1.2 × 10¹⁰ M-1s-1
Step 2: finding ϕϕ = kq / kd = 1

- Fluorophores preferably absorb photons whose electric vector is aligned with the transition dipole moment, , of fluorophore.- The has a defined orientation with respect to molecular axes.- Thus, if a fluorophore solution is illuminated by polarized light then only a fraction of randomly oriented molecules will absorb light (those with a favorable orientation).- Thus, the population of molecules excited with polarized light will have the same orientation.
ex
Fluorescence Polarization or Anisotropy1. Absorption of Polarized Light
μ
Photon PhotonPolarization favorable for absorption of photon
- Polarization is the direction of the electric vector of the electromagnetic wave. Light is polarized if all photons have thesame direction of (lasers are most convenient sources of polarized light)
Photonc
E
B
B
E B
E
Polarization unfavorablefor absorption of photon
exμ exμ
E
exμ

2. Maximum possible anisotropy of 1 (when I⊥ = 0) would be observed if: (i) the fluorophore had , (ii) all fluorophore molecules were oriented favorably and (ii) all fluorophore molecules were immobile
Note: 1. (I|| + 2I⊥) is the total intensity of fluorescence, so that fluorescence anisotropy does not depend on fluorescence intensity. “2” in the denominator shows that in a 3-D space there are 2 indistinguishable directions perpendicular to
2. Emission of Polarized Light- The emission dipole moment, μem, is not the same as the excitation dipole moment, μem. It is associated with the change of molecule geometry in the excited state.
exμemμ
- Therefore, the polarization of emitted light will be different from that of excitation light.- The degree of differences in the polarization of excitation and emission lights is described by fluorescence anisotropy:
Total
||
||
||
III
I2III
r ⊥
⊥
⊥ −=
+−
=
where I|| and I⊥ are the intensities of fluorescence in the direction parallel and perpendicular to respectively.exμ
exμ
emex μμ =
3. Maximum fluorescence anisotropy of randomly oriented solution of fluorophore is 0.4 due to excitation photoselection4. Light scattering and reflection can produce r = 1

Calculation of Fluorescence AnisotropyProblem: Calculate fluorescence anisotropy for a solid solution of fluorophore which is oriented so that μex of all molecules are aligned with the direction of polarization of excitation light. The angle between is αemex μand μ
α
||
⊥1
⊥2
Solution:- To calculate the anisotropy we need to know I|| and I⊥. - I|| and I⊥ are dependent on the projections of μem on the || (μem ||) and ⊥ axes (μem ⊥1 and μem ⊥2):
I|| = a μem || I⊥1= a μem ⊥1 I⊥2= a μem ⊥2where a is a constant- The projections μem ⊥1 and μem ⊥2 are identical due to the two ⊥ axes being indistinguishable from each another, thus:I|| = a μem || = a μem cos αI ⊥ = I⊥1= I⊥2 = a μem sin α cos 45º = 0.5 × 21/2 a μem sin α
μem ||
μem ⊥1μem ⊥2
μex
μem
45°
αααα
αμαμαμαμ
sin2cossin25.0cos
sin a25.02cos asin a25.0cos a
I2III
r 2/1
2/1
2/1
2/1
||
||
+×−
=××+
×−=
+−
=⊥
⊥
emem
emem

2. Rotational Depolarization of Fluorescence
emex μμ ≠.1
Reasons for fluorescence anisotropy of a random solution of fluorophore to be less than 0.4:
2. Rotation of a fluorophore molecule during the lifetime of fluorescence
exμemμ
exμemμ
emμexμ
t = 5 nst = 0
emμexμ
t = 10 ns

Anisotropy Increases with Increasing Size of Fluorophore Molecule
- The rate of rotational depolarization increases with an increasing rate of molecular rotation (rotational diffusion)- The rate of rotational diffusion increases with decreasing the size of fluorophore.- This property of fluorescence anisotropy is used to sense interactions between small fluorophores and large biomolecules: anisotropy increases upon binding of fluorophore to a large molecule.- The equilibrium dissociation constant of the protein-fluorophorecomplex, Kd = koff/kon, can be calculated based on the anisotropy measurements.
on
offProtein + Fluorophore Protein•Fluorophore
k
k⎯⎯→←⎯⎯

Experimental Design for Anisotropy Measurements
LaserE
⊥E
||E
B
BAt the interface of two prisms, a two-prism polarization analyzer reflects one direction of polarization (parallel to the plane of interface) and transmits two other directions
B
Detector 1
Detector 2
⊥E
B

The equilibrium binding constant is defined as:
where [P]eq, [F]eq, and [P•F]eq are equilibrium concentrations of free protein, free fluorophore, and the complex, respectively. We will express [P]eq[F]eq [P•F]eqthrough fluorescence anisotropy and total concentrations of protein and fluorophore, [P]0 and [F]0 using two principles:
1) Anisotropy is an additive function, that is
2) Mass balance requires that:
[P]0 = [P•F]eq + [P]eqand
[F]0 = [P•F]eq + [F]eq
Determination of Kd Using Anisotropy
0
eqFP
0
eqF [F]
F][Pr
[F][F]
rr•
+= •
Assume that fluorophore F forms a dynamic complex with protein P:
[ ] [ ][ ]
eq eqd
eq
P FK
P F=
•
on
offP + F P•F
k
k⎯⎯→←⎯⎯

Determination of Kd Using Anisotropy contd.
( )
eq eq eq 0 eq eq eqF P F F P F F P F
0 0 0 0 0 0
eq eq eq eq P FF P F P F P F F P F
0 0 0 0 F P F
[F] [P F] [F] [F] -[F] [F] [F]r r r r r r r 1
[F] [F] [F] [F] [F] [F][F] [F] [F] [F] r rr r r r r r R[F] [F] [F] [F] r r
• • •
•• • • •
•
• ⎛ ⎞= + = + = + − =⎜ ⎟
⎝ ⎠−
+ − = + − ⇒ = =−
Thus:1. [F]eq = [F]0R2. [P•F]eq = [F]0 – [F]eq = [F]0 – [F]0R = [F]0 (1 - R)3. [P]eq = [P]0 – [P•F]eq = [P]0 – [F]0 (1 - R)
By substituting the expressions 1-3 into we get:
{ }0 0 0 0 P Fd
0 F P F
[P] [F] (1 R) [F] R [P] (1 R) r rwhere R[F] (1 R) (1/R 1) r r
K •
•
− − − − −= = =
− − −
0 P Fd
F P F
[P] (1 R) r rwhere R , 0 1(1/R 1) r r
K R•
•
− − −= = < <
− −
[ ] [ ][ ]
eq eqd
eq
P FK
P F=
•
Experimentally measurable parameter

Determination of r, rF and rP•F
- rF is anisotropy of free fluorophore. It is measured in the absence of the protein- r is the anisotropy of fluorophore at a finite concentration of protein so that only part of fluorophore is bound to a protein:
- rP•F is the anisotropy of the P•F complex, that can be experimentally found by using high enough concentration of protein to ensure that [P•F]eq/[F]0 → 1 and [F]eq/[F]0 → 0 and thus
- Practically, r is measured as a function of [P]0 (Scotchard plot) to find the saturating value of r which is assumed to be equal to rP•F
5.0[F][F]
y preferabl,1[F][F]
0[F]
F][Pr
[F][F]
rr0
eq
0
eq
0
eqFP
0
eqF ≈<<
•+= • and
FPFPF0
eqFP
0
eqF r1r0r
[F]F][P
r[F][F]
rr ••• =×+×=•
+=

Other Parameters that Can be Used for the Determination of Kd
- Anisotropy can be used for the determination of Kd because it is an additive parameter (anisotropy of a mixture is equal to the sum of anisotropies of its components) - Any additive parameter that has a different value for F and P•F can be used to find Kd- Can fluorescence lifetime or intensity be used?- Can fluorescence resonance energy transfer (FRET) be used?- Mobility in capillary electrophoresis can be used for calculation of Kd, because:
1 1 1eq eq
F 0 P F 0
[F] [P F][F] [F]t t t •
•= +
eq eqF P F
0 0
[F] [P F],
[F] [F] E tLE
vμ μ μ μ•
•= + = =
Homeassignment
where t is migration time

Fluorescence Energy TransferReaction involved in ET between donor (D) and acceptor (A):
D + hv → D*D* + A → D + A* + heat
Two types of processes are distinguished:• Non-Resonance Energy Transfer requires collision of D and A:
d[A*]/dt = kET[D*][A]where kET = ϕ × kd, ϕ is the efficiency of ET and kd is a diffusion-controlled rate constant. The process is similar to quenching! It is rare (e.g. spin-forbidden T→S or S→T) and is not widely used as an analytical tool.
2. Fluorescence Resonance Energy Transfer (FRET) by the Förster mechanism is widely used to study the dynamics of molecular interactions. The rate constant of FRET is conventionally expressed as a monomolecular one:
where τ0
D is the lifetime of D in the absence of A, R0 is the Förster radius, and r is the distance between the D and A.
kET
6
0
0
1)( ⎟⎠⎞
⎜⎝⎛=
rRrk DFRET τ

FRET – the Meaning of R06
0
0
1)( ⎟⎠⎞
⎜⎝⎛=
rRrk DFRET τ
What is the physical meaning of R0?R0 is the distance between D and A at which the efficiency of energy transfer is equal to 1/2 (half of energy is transferred from D to A). Indeed, when r = R0, then:
Q: What is the efficiency of ET for r = R0?Recall that the rate constant, k, of radiative+non-radiative transitions in D is the same as that of FRET: k = kFRET = 1/τ0
D
DDFRET Rrk0
6
00
1111)(
ττ=⎟
⎠⎞
⎜⎝⎛==
D ADFRET Rrk0
0
1)(τ
==
Dk0
1τ
=hv
Typical R0 are 20 – 90 Å
The efficiency of ET: ϕ = kFRET/(kFRET + k) (=1/2 for r = R0)
heat

Calculation of R0
where - QD is the quantum yield of D in the absence of A- n is the refractive index of the medium (1.4 for biomolecules in aqueous solns.)- NA is Avogadro’s number- κ2 is the orientation factor (2/3 for randomly oriented molecules)- FD( λ) is the normalized spectrum of fluorescence of D and ε(λ) is the extinction coefficient of A
64
0450 )()(
128)10(ln9000 2
λλλελπ
κ dFnN
QR DA
D ∫∞
=
λλλελ dFD4
0
)()(∫∞
is called the integral of spectral overlap
What is the reason of 6 in (R0/r)6?
Dipole-dipole coupling mechanism makes the distance dependence so strong

Types of intermolecular interactions in solution

1. Calculation of the distance between two fluorophores:- The distance between tyrosine and tryptophan in a protein- R0 is calculated using the formula
and, then, r is calculated as follows:
FRET – The Bioanalytical Use
6 60
6
60
60
60
6
0
60 )1/1(
1/11
1/1)(
RRkR
rkRr
DD
FRET
−=
−
=
−
== ϕ
ϕτ
ϕτ
ϕ = kFRET/(kFRET + k) k = 1/τ0D
The efficiency of FT, ϕ is determined experimentally
2. FRET-based reporters such as molecular beacons
64
0450 )()(
128)10(ln9000 2
λλλελπ
κ dFnN
QR DA
D ∫∞
=

Characteristics of lamps as light sources: Tunable λ (requires monochromator), Low cost, Low power at any fixed λ, No polarization
Light Sources. LampsNever touch optical surfaces with bare fingers
Mercury and Xenon arc lamps require caution during operation because of the danger of explosion due to very high internal gas pressures and extreme heat generated during use.
Widely used in fluorescence microscopes

Light Sources. LasersAdvantages: monochromatic light, high power, high level of polarizationDisadvantages: high cost, impossible to tune λ
Examples- Helium-cadmium laser, 325nm, 442 nm- Helium-neon laser, 543 nm, 594 nm, 632.8 nm- Diode-pumped solid-state lasers, 457 nm, 640-685 nm (temp-dependant), 1064 nm.- Argon-ion, 488 nm, 514 nm
Lasers deliver 1-200 mW in light. Eye damage is possible during direct exposure

ObjectivesMagnification: The ratio between the sizes of the image and object when object is at the working distance. Working distance: Distance from the objective to the object at which the image will be in focusAngular Aperture: AA = sin αNumerical Aperture: NA = n(sin α) where n is the refractive index of the imaging medium between the front lens of the objective and the specimen cover glass, a value that ranges from 1.00 for air to 1.51 for specialized immersion oils.
Most objectives in the magnification range between 60x and 100x (and higher) are designed for use with immersion oils.
Manufacturers: Melles Griot,Newport, Leica, Olympus, etc.
α
αα
α
αα
α

How Much of Isotropic Fluorescence Light Does the Air Lens of Known Angular Aperture Collect?
βααβααβα ddldldlRddldS sin)sin( 2===
)cos1(2)cos1()1(cos
)|(cos)(sin
22
0
22
0
2
0
2
0
22
0 0
2
απβαβα
βαβαα
ππ
αππ α
−=−=−−
=−==
∫∫
∫∫ ∫
ldldl
dlddlS
dβdα
α
l RdS
S
The part of light collected by a lens is the ratio between the solid body S that defines the aperture and the solid body Ssph of the sphere:S/Ssph = S/4πl2
specimen
Working distance
Objective lens
S/Ssph = S/4πl2 = 2 πl2 (1- cosα)/4πl2 = (1- cosα)/2

How Much of Isotropic Fluorescence Light Does an Air Lens of Known AA Collect? Contd.
AA = sin α
α = arcsin (AA)
S/Ssph = (1- cosα)/2 =
= {1 – cos(arcsin(AA))}/2
Angular aperture

Raman Scattering on H2O
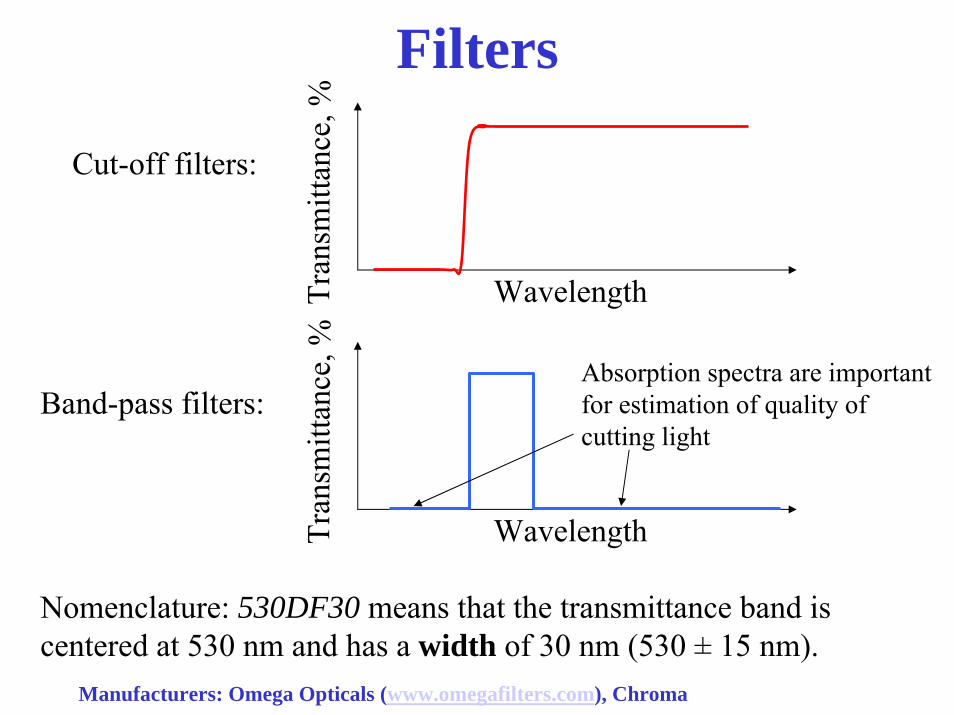
Filters
Cut-off filters:
WavelengthTran
smi tt
a nce
, %
Band-pass filters:
WavelengthTran
smi tt
a nce
, %
Nomenclature: 530DF30 means that the transmittance band is centered at 530 nm and has a width of 30 nm (530 ± 15 nm).
Absorption spectra are important for estimation of quality of cutting light
Manufacturers: Omega Opticals (www.omegafilters.com), Chroma

Mirrors
Glass Reflective coating
- In household mirrors, the reflecting surface is protected by glass, we look through glass. - In optical mirrors the reflective surface is exposed; therefore it should be protected from oxidation by a layer of dielectric coating
Domestic mirror Optical mirror
Manufacturers: Omega Opticals (www.omegafilters.com), Chroma

Dichroic Mirrors (Beamsplitters)Dichroic beamsplitters typically operate at 45° to incident light. They are designed to separate light of short and long wavelengths into two separate channels. Dichroic mirrors reflect low-wavelength light and transmit high-wavelength light
Nomenclature: for example 490DCLP meansDiChroic Long Pass. 490 nm corresponds to 80%/20% transmittance/refraction
Manufacturers: Omega Opticals (www.omegafilters.com), Chroma

Filter Cubes
exciter
emitter
dichroic mirror
Filter cubes are used in fluorescence microscopes and fluorescence detection systems to allow excitation of fluorescence and collection of fluorescence light with the same objective lens
Manufacturers: Omega Opticals (www.omegafilters.com), ChromaEYE or detector
specimen

Light Detectors - PMTs
Modes of operation: 1) Current (higher noise, higher dynamic range)2) Photon counting (noise reduction due to the discrimination of pulses that
correspond to single electrons born on the photocathode. Lower dynamic range due to the need to resolve between single photons. The pulse width is 50 ns (5 × 10⁻⁸ s). The dynamic range is 0 – 105 counts/s.
+1 kV
Manufacturers: Hamamatsu (www.hamamatsu.com)