lifetime of human visual sensory memory: properties and
TRANSCRIPT

University of PennsylvaniaScholarlyCommons
IRCS Technical Reports Series Institute for Research in Cognitive Science
January 1999
Lifetime of Human Visual Sensory Memory:Properties and Neural SubstrateWei YangUniversity of Pennsylvania
Follow this and additional works at: http://repository.upenn.edu/ircs_reports
University of Pennsylvania Institute for Research in Cognitive Science Technical Report No. IRCS-99-03.
This paper is posted at ScholarlyCommons. http://repository.upenn.edu/ircs_reports/42For more information, please contact [email protected].
Yang, Wei, "Lifetime of Human Visual Sensory Memory: Properties and Neural Substrate" (1999). IRCS Technical Reports Series. 42.http://repository.upenn.edu/ircs_reports/42

Lifetime of Human Visual Sensory Memory: Properties and NeuralSubstrate
AbstractThe classic partial-report procedure was modified to optimize the condition to measure the transient decay ofvisual sensory memory (VSM, also known as iconic memory). A model was developed to isolate the VSM andvisual working memory (VWM) underlying the partial-report performance. The decay of VSM in eachsubject was well characterized by a single exponential function, thus a lifetime could be defined for VSMdecay in individual subjects. It was found that intensive practice with partialreport task prolonged VSMlifetime. This practice effect shows an unexpected adaptive property of VSM and reveals VSM lifetime as aspecific dimension for perceptual learning. Of the stimulus parameters, a change of the mean luminance of thestimuli from that of the background shortened the VSM lifetime. Such a "luminance effect" is consistent withthe temporal properties of the spatial frequency channels in the visual pathway, most likely revealing thedifferences in the time course of the decay of the memory traces in these channels.
To identify the neural substrate of VSM, the lifetime for the decay of the neural activation trace in the humanprimary visual cortex (area V1) were deduced from the visually evoked potential (VEP) recordings for eachsubject. There was a precise match between the V1 lifetime and the VSM lifetime for each subject. The matcheven held when both psychophysical and physiological lifetimes were prolonged by practice, or shortened byenhancing the mean luminance of the stimuli above the background. This precise match indicates that thecortical location for VSM is V1.
CommentsUniversity of Pennsylvania Institute for Research in Cognitive Science Technical Report No. IRCS-99-03.
This thesis or dissertation is available at ScholarlyCommons: http://repository.upenn.edu/ircs_reports/42

LIFETIME OF HUMAN VISUAL SENSORY MEMORY:
PROPERTIES AND NEURAL SUBSTRATE
Wei Yang
A dissertation submitted in partial fulfillment of the requirements for the degree of
Doctor of Philosophy
Department of Psychology
New York University
January 1999
Approved: ________________________________

© Wei Yang
All Rights Reserved, 1999

iii
To my father: Qingyu Yang (1933-1980),
who devoted his life to his dream that his sons go to college

iv
Acknowledgement
I greatly appreciate the encouragement and support from my sponsor Prof.
Samuel Williamson. Thanks to my committee members Prof. Marisa Carrasco, Prof.
Robert Shapley and readers Prof. Lloyd Kaufman and Prof. Doris Aaronson for their
valuable comments. Thanks also go to Vincent Di Lollo, Sacha Nelson, John Rinzel,
Nava Rubin, George Sperling, and Jonathan Victor for their comments, to John Daws for
his advice on statistical tests, and to Prof. Lloyd Kaufman and Prof. Aaronson Doris for
their generous help with the final revision and the interesting discussions.
It took me years of effort to get to the area of my interest. Thank Prof. Linchu
Guan and Prof. Xingmin Zhu at the Chinese Academy of Sciences and Prof. Thom
Verhave at Queen College (QC) of CUNY for helping me through this. My early study
in psychology and neural science was supported by a fellowship from the Center for
Developmental Neural Science (CDNS) of New York State. Thank Prof. Lloyd Kaufman
for taking me to NYU, and Prof. Bruce Brown (QC), Prof. Ted Coons, and Prof. Gay
Snodgrass for their guidance for surviving graduate school.
Zhonglin Lu, Jin Fan, and Chao Tang helped with programming and building a
PC based VEP data acquisition system. My subjects JH, YS, LX, SH, KB, JM, and JT
are to be thanked for participating in the tests numerous times.
I especially thank my wife Joy, for her patience and support through these years.
Also to be recognized is my little neighbor friend Annie, for the fun and pleasure
she created, and the many "whys" she asked (none was about my project though!).

v
Abstract
The classic partial-report procedure was modified to optimize the condition to
measure the transient decay of visual sensory memory (VSM, also known as iconic
memory). A model was developed to isolate the VSM and visual working memory
(VWM) underlying the partial-report performance. The decay of VSM in each subject
was well characterized by a single exponential function, thus a lifetime could be defined
for VSM decay in individual subjects. It was found that intensive practice with partial-
report task prolonged VSM lifetime. This practice effect shows an unexpected adaptive
property of VSM and reveals VSM lifetime as a specific dimension for perceptual
learning. Of the stimulus parameters, a change of the mean luminance of the stimuli
from that of the background shortened the VSM lifetime. Such a "luminance effect" is
consistent with the temporal properties of the spatial frequency channels in the visual
pathway, most likely revealing the differences in the time course of the decay of the
memory traces in these channels.
To identify the neural substrate of VSM, the lifetime for the decay of the neural
activation trace in the human primary visual cortex (area V1) were deduced from the
visually evoked potential (VEP) recordings for each subject. There was a precise match
between the V1 lifetime and the VSM lifetime for each subject. The match even held
when both psychophysical and physiological lifetimes were prolonged by practice, or
shortened by enhancing the mean luminance of the stimuli above the background. This
precise match indicates that the cortical location for VSM is V1.

vi
Table of Contents
Dedication Page iii
Acknowledgements iv
Abstract v
List of Figures viii
1. A REVIEW OF VSM STUDIES IN PARTIAL-REPORT PARADIGM 1
1.1 Classic Concept of Visual Sensory Memory (VSM) 2
1.2 Challenges to the Classic Concept of VSM 6
1.3 Models for Partial-Report Performance after Coltheart's Review 9
1.4 Current Status of VSM Research 12
1.5 Causes of the Controversies about the Concept of VSM 14
1.6 Confusions about the Properties of VSM 18
1.7 Conclusions 30
1.8 Goal and Plan of This Study 31
2. A NEW PROCEDURE AND MODEL FOR VSM LIFETIME 33
2.1 A New Procedure to Characterize Partial-Report Performance 33
2.2 A Model to Isolate VSM from Partial-Report Performance 38
3. INDIVIDUAL DIFFERENCES IN VSM LIFETIME 44
3.1 Exp. 1: VSM Lifetime in Individual Subjects 44
3.2 Exp. 2: Time Course of Retrieval and Partial-Report Performance 55
3.3 Exp. 3: Effect of Practice on VSM Lifetime 60

vii
3.4 Conclusions 68
4. EFFECT OF STIMULUS PARAMETERS ON VSM LIFETIME 70
4.1 Exp. 4: Effect of Stimulus Duration on VSM Lifetime 71
4.2 Exp. 5: Effect of Stimulus Contrast on VSM Lifetime 75
4.3 Exp. 6: Effect of Luminance Increase on VSM Lifetime 78
4.4 Exp. 7: Effect of Luminance Increase on VSM Lifetime:
Separate Tests 82
4.5 Exp. 8: Effect of Luminance Decrease on VSM Lifetime:
Separate Tests 87
4.6 Exp. 9: Effect of Stimulus Contrast on VSM Lifetime:
Separate Tests 90
4.7 Conclusions 93
5. NEURAL SUBSTRATE OF VSM 94
5.1 Current Studies of Memories in the Brain 94
5.2 Approaches to the Temporal Properties of Visual Cortical Activation 95
5.3 Primary Visual Cortex (V1) and VSM 98
5.4 Exp. 10: Individual Differences in V1 Lifetime 99
5.5 Exp. 11: Effect of Luminance Increase on V1 Lifetime 106
5.6 Conclusions 109
6. GENERAL CONCLUSIONS AND DISCUSSIONS 110
References 115

viii
LIST OF FIGURES
Fig. 1.1 Illustration of the basic results in Sperling (1960) 2
Fig. 1.2 Replotting of the results of Townsend (1973) 26
Fig. 1.3 Replotting of the results of Mewhort and Leppmann (1985) 27
Fig. 2.1 An example of the standard visual stimuli. 37
Fig. 3.1 Partial-report performance for each of eight subjects 46
Fig. 3.2 Comparison of partial-report performances in practiced and naïve subjects 50
Fig. 3.3 Partial report performance, the deduced visual sensory memory (VSM) and
visual working memory (Cw) for each subject 51
Fig. 3.4 Initial level of visual sensory memory (Pi), lifetime of visual sensory
memory (τ ), and capacity of visual working memory (Cw) for each subject 52
Fig. 3.5 Probability of correct response as a function of the stimulus onset
asynchrony (SOA) between the stimulus and the probe bar for naïve subjects 57
Fig. 3.6 Partial-report performance for subject SS who failed the assessment in the
standard visual sensory memory (VSM) test 59
Fig. 3.7 Partial-report performance in repeated tests for two naïve subjects 62
Fig. 3.8 Initial level of visual sensory memory (Pi), lifetime of visual sensory
memory (τ ), and the capacity of visual working memory (Cw) in repeated
tests for two naive subjects 62
Fig. 3.9 Partial-report performance in repeated tests for two practiced subjects 64

ix
Fig. 3.10 Initial level of visual sensory memory (Pi), lifetime of visual sensory
memory (τ ), and capacity of visual working memory (Cw) in repeated
tests for two practiced subjects 64
Fig. 3.11 Form of the visual sensory memory decay 68
Fig. 4.1. Effect of stimulus duration on partial-report performance for three subjects 73
Fig. 4.2. Effect of stimulus duration on initial level of visual sensory memory (Pi),
lifetime of visual sensory memory (τ ), and capacity of visual working
memory (Cw) 73
Fig. 4.3 Effect of stimulus contrast on partial-report performance 76
Fig. 4.4 Effect of stimulus contrast on initial level of visual sensory memory (Pi),
lifetime of visual sensory memory (τ ), and capacity of visual working
memory (Cw) 76
Fig. 4.5 Effect of luminance increase on partial-report performance 80
Fig. 4.6 Effect of luminance increase on initial level of visual sensory memory (Pi),
lifetime of visual sensory memory (τ ), and capacity of visual working
memory (Cw) 80
Fig. 4.7 Effect of luminance increase on partial-report performance in separate tests 83
Fig. 4.8 Effect of luminance increase on initial level of visual sensory memory (Pi),
lifetime of visual sensory memory (τ ), and capacity of visual working
memory (Cw) 84
Fig. 4.9 Effect of luminance decrease on partial-report performance in separate tests 88

x
Fig. 4.10 Effect of luminance decrease on initial level of visual sensory memory (Pi),
lifetime of visual sensory memory (τ ), and capacity of visual working
memory (Cw) 88
Fig. 4.11 Effect of stimulus contrast on partial-report performance in separate tests 91
Fig. 4.12 Effect of stimulus contrast on initial level of visual sensory memory (Pi),
lifetime of visual sensory memory (τ ), and capacity of visual working
memory (Cw) 91
Fig. 5.1 Visually evoked potentials (VEPs) for different interstimulus
intervals (ISIs) in one representative subject 102
Fig. 5.2 Habituation of the primary visual cortex (V1) response for each subjects 103
Fig. 5.3 Correspondence between lifetime of visual sensory memory (VSM) and
lifetime of the activation trace in the primary visual cortex (V1) 104
Fig. 5.4 Enhancement of lifetime of visual sensory memory (VSM) by intensive
practice for subject JT 105
Fig. 5.5 Effect of luminance increase on the habituation of primary visual
cortex (V1) response 107
Fig. 5.6 Effect of luminance increase on lifetime of the activation trace in primary
visual cortex (V1) 107
Fig. 5.7 Parallel effects of luminance increase on lifetime of visual sensory
memory (VSM) and lifetime of the activation trace in primary visual
cortex (V1) 108

Wei Yang 1
CHAPTER 1. A REVIEW OF VSM STUDIES IN PARTIAL-REPORT
PARADIGM
Psychophysical studies of visual sensory memory (VSM) have been extremely
controversial. This is evidenced by inconsistent results and competing models.
Consequently, the properties and neural substrate of VSM have remained ambiguous.
The goals of this project were to accurately measure the time course of the VSM decay,
characterize the properties of VSM and identify its neural substrate. To lay the foundation
for an accurate measurement of VSM lifetime in this study, this chapter reviewed the
literature to identify the problems in previous VSM studies.
This review was focused on the VSM studies based on the partial-report paradigm
developed by Sperling (1960). Sperling's paradigm was chosen because (1) it was the
first paradigm in modern cognitive psychology to reveal and define VSM and (2) it has
been most extensively studied.
The review started with Sperling's 1960 study and his classic model for partial-
report performance (Sperling, 1967). Then several challenges to the classical concept of
VSM as an icon were outlined. The challenge having the strongest impact was in
Coltheart's (1980) tutorial review, in which he argued that iconic memory is not visible
persistence, but an invisible and postcategorical information persistence. Alternative
models for partial-report performance following his arguments were described, and the
current status of studies on VSM was summarized. Finally, the problems that caused
these controversies were identified.

Wei Yang 2
1.1 The Classic Concept of Visual Sensory Memory
It has been recognized since Aristotle (384 -322 B. C.) that a vivid memory
persists briefly after the termination of a visual stimulus. Its physiological basis and
phenomenal consequences have long been debated (for reviews, see Allen, 1926 and
Boynton, 1972). Modern cognitive studies of this phenomenon were ignited by
Sperling's elegant demonstration of such transient vivid visual memory with his partial-
report procedure (Sperling, 1960).
1.1.1 Sperling's Partial-Report Study
0.0 0.2 0.4 0.6 0.8 1.00
4
8
12
Partial-Report
Superiority
Partial Report
Whole Report
Nu
mb
er
of
Ite
ms
Av
aila
ble
Test Delay (s)
Figure 1.1. Illustration of the basic results in Sperling (1960). The shaded area, the
partial-report superiority, reveals the decay of VSM. The area below the dashed line represents
the contribution of the durable memory.
In his 1960 experiment, Sperling displayed a set of letters arranged in a 3 x 4
matrix for 50 ms. In the partial-report condition, a tone was delivered after a delay to
indicate a row to report. In the whole-report condition, subjects were instructed to report
as much as they can from the whole display. The performance was measured by the

Wei Yang 3
number of items available at various test delays. Performances for these two conditions
are illustrated in Figure 1.1.
The main finding was that partial-report performance rapidly decreases within a
fraction of a second and falls to the asymptotic level of about 4.5 items. The asymptote
was equivalent to the whole-report performance level. The number of items reported in
the whole-report condition was independent of the test delay. The difference between
partial-report performance at shorter time delays and its asymptotic level performance at
longer time delays was called the partial-report superiority (the shaded area in Figure
1.1). This difference was thought to reveal the "visual information store" (Sperling,
1960) or "iconic memory" (Neisser, 1967). In Sperling's experiment, the time course of
VSM was roughly 0.25 s.
1.1.2 The Classic Concept of Visual Sensory Memory: Iconic Memory
The studies of VSM in the 60s' and 70's characterized VSM as a transient, visible,
precategorical, high-capacity visual icon. It registers incoming visual information for
further processing by other components of the information processing system (Coltheart,
Lea, & Thompson, 1974; Dick, 1974; Von Wright, 1972). It was thought of as a sensory
buffer in the visual modality in most of the models of human information processing (e.g.
Atkinson & Shiffrin, 1968; Haber, 1969; Lindsay & Norman, 1977, pp.310-315; Neisser,
1967, chapter 2; Sperling, 1960).

Wei Yang 4
Although the locus of VSM in the visual pathway was not specified, the idea of a
passive, large-capacity, and rapidly decaying central store pointed to the early visual
sensory cortical areas.
1.1.3 Classic Two-Memory Model for Partial-Report Performance
As illustrated in Figure 1.1, performance in the whole-report task was constant at
all test delays (Averbach & Sperling, 1961; Dick, 1967; Sperling, 1960) and was not
affected by a post-stimulus mask (Averbach & Sperling, 1961; Sperling, 1960, 1963). By
contrast, the partial-report superiority was maskable. The whole-repot performance and
the long-lasting asymptotic level of partial-report performance were thought to be
supported by a postcategorical durable memory which has limited-capacity (see, for
example, Coltheart 1972, 1977; Sperling 1967). Thus, according to the classic account
for partial-report performance, partial-report performance is jointly supported by two
memories: the initial rapid decaying, precategorical, large-capacity VSM, and a
sustained, postcategorical, limited-capacity durable memory. In addition, in the serial
comparison paradigm (Philips, 1974), the performance at the short test delays was
maskable and was considered as a VSM component. He also found that a slight shift of
the retinal location of the two sequential stimuli decrements the performance at these
short delays. This suggests that VSM is retinotopic, with durable memory being
spatiotopic
According to Sperling's model (1967), the visual pattern first enters the VSM.
The information in VSM is rapidly scanned (1 item / 10 ms) into a recognition buffer

Wei Yang 5
where it is maintained for retrieval. At short test delays where VSM is available, the
subject can selectively scan the cued items for insertion into later stages of the processor
for subsequent report. For longer test delays when the VSM is gone, the subject retrieves
information from the durable, limited-capacity storage for report. This model represents
the classical explanation for the performance in the partial-report paradigm (e.g.
Coltheart, 1977).
These two memory components in partial-report performance exhibited different
time courses. VSM has a time-course of about 0.2 - 0.3 s. By contrast, the second
memory is durable. In the early partial-report studies subjects were able to maintain the
durable memory with full capacity of about 4 items for a few seconds. However, the
durable memory could decay to a lower level after a second or two if subjects are
distracted by a concurrent task (Sakitt & Appelman, 1978). The time course for the
decay of this durable memory has been shown to be a few seconds in a serial comparison
paradigm by Philips (1974, 1983). Cowan (1995) also speculated that it has a half-life of
2-4 seconds.
1.1.4 The Unitary Persistence Hypothesis
Sperling's study stimulated considerable interest in VSM. Several alternative
procedures were developed to directly measure the duration of the VSM (see, Coltheart,
1980; Long, 1980, for reviews). These procedures were thought to measure the different
aspects of the same visual persistence. This was called the unitary persistence hypothesis
(Weichselgartner & Sperling, 1995).

Wei Yang 6
However, there have been many discrepancies between the estimates of the time
course for VSM. These discrepancies are probably caused by the differences in stimulus
parameters and task requirements. In addition, these discrepancies might be caused by
specific systematic biases in the procedures. In other words, VSM might play a dominant
role in these tasks, but the procedures may not have been optimized to measure the time
course of VSM. A critical review of the problems for an accurate measure of VSM in
various procedures was provided by Long (1980).
Hawkins and Shulman (1979) recognized that the duration of a stimulus could be
estimated as the period between the sensation of the stimulus onset to the sensation of the
beginning of the disappearance or, alternatively, to the end of the disappearance. These
two subjective durations minus the real stimulus duration resulted in the Type I and Type
II persistences suggested by Hawkins and Shulman (1979). Although the exact
mechanism of detecting the stimulus offset was controversial (Di Lollo, 1984; Long,
1979), such a categorization of the two types of measurements suggested that these
different procedures measure the same sensory residual, not two different types of
residuals. Di Lollo (1984) noted that the above Type I and Type II persistences have also
been interpreted with little or no additional justification, as referring to different types of
persistence, each with different mechanisms.
1.2 Challenges to the Classic Concept of VSM
The studies with partial-report procedure had soon become a primary paradigm in
cognitive studies of human information processing. However, the partial-report task is

Wei Yang 7
difficult for the subjects perform and many studies found little or no partial-report
superiority effects. Consequently, inconsistent results emerged and the properties of
VSM have been controversial. The classic concept of VSM described above has been
challenged in several ways.
1.2.1 Does Partial-Report Superiority Reveal Iconic Memory?
In a series of papers, Holding (1970, 71,72,73) challenged the iconic memory
paradigm by citing the failures to obtain the partial-report superiority. He suggested that
the partial-report superiority was due to some artifacts, such as guessing and response
selection. Von Wright (1972) and Dick (1974) clarified this issue by specifying the
conditions where the partial-report superiority is obtained and where it is not. This
challenge was also systematically defended by Coltheart (Coltheart, et. al, 1974; 1980).
In general, the failures to obtain partial-report superiority were caused by output
interference, using an ineffective cue, or using a small number of items in the display that
did not overload the short-term memory system. Coltheart et al (1974) concluded that the
iconic memory concept is necessary to account for the partial-superiority effect.
1.2.2 Is the Icon a Central Cortical Effect?
The classic concept of iconic memory implies that the early visual cortex is the
location of the icon in the visual pathway. Sakitt and Long proposed that iconic memory
is a retinal afterimage effect. Their studies (e.g., Long, 1982; Long & Beaton, 1982;
Sakitt & Long, 1978, 1979) revealed that the partial-report superiority effect is enhanced
by increases in stimulus duration and intensity. These properties simulated those of the

Wei Yang 8
retinal afterimage (Brown, 1975). However, they used dark-adapted subjects with
relatively bright, large-sized stimuli on a dark or very low luminance background which
favor the production of a retinal afterimage.
The studies of Sakitt and Long indicated that an afterimage could produce the
partial-report superiority. Nevertheless, there are circumstances where the partial-report
superiority can be observed without afterimages (Breitmeyer, 1984). Therefore,
afterimages are not necessary for the partial-report superiority to occur. The notion that
the retinal afterimage accounts for iconic memory cannot be generalized to typical visual
conditions. As Breitmeyer (1984) stated, "This should not be taken to imply that
photoreceptor persistence is the source of visible persistence. Rather it suggests that
photoreceptor persistence is a source of neural persistence; and, hence, one possible
precursor of visible persistence"(p. 86). Thus a cortical source account for iconic
memory (defined here as visible persistence) is implied in various psychophysical studies
(for a review see, Breitmeyer, 1984, p. 87-94). No experiment has provided direct
evidence for the cortical source of iconic memory.
1.2.3 Is Iconic Memory a Necessary Concept?
Haber (1983) introduced a controversial argument against the iconic memory
paradigm. His basic argument was that because the icon plays no role in visual
perception outside the laboratory, it is not necessary to propose such an idea. However,
30 out of 32 commentaries took issue with Haber's position (Haber, 1983).
Wei Yang 9
1.2.4 Is Iconic Memory Visible Persistence?
The most severe challenge to the classic concept of VSM as the icon was from
Coltheart (1980), and the issues he raised have yet to be settled. Based on his review of
the literature, Coltheart concluded that the duration of the visible persistence measured by
a variety of techniques exhibit a dual-inverse effect: an inverse duration effect (the
longer the stimulus lasts, the shorter is its persistence after stimulus offset) and an inverse
intensity effect (the more intense the stimuli, the shorter its persistence). By contrast, the
duration of iconic memory measured by the partial-report superiority did not show such
dual-inverse effect. Based on this observation, Coltheart augured that iconic memory
cannot be identified with visible persistence because they show different functional
properties. He suggested that the partial-report procedure measures information
persistence which is nonvisible and postcategorical.
Although not everyone agrees with Coltheart (e.g. Long, 1980), his review had a
substantial influence on the theories of iconic memory. Most scholars in the field of
vision believe that there is no unitary "iconic memory", but rather that there is a variety of
visual memories in the early visual processing stages.
1.3 Models for Partial-Report Performance after Coltheart's Review
All of the models for partial-report performance after Coltheart (1980) were based
on the notion that iconic memory revealed by partial-report superiority differs from
visible persistence. As discussed earlier, partial-report performance reveals an initial
transient memory and a more durable memory. These subsequent models also contain

Wei Yang 10
two or three components to account for partial-report performance. Another feature of
these models is that they have mainly focused on accounting for the observation that
most errors in the partial-report task are location errors rather than item intrusion errors
(e.g. Dick, 1969; Townsend, 1973). This observation was also taken as evidence for the
argument that the partial-report task taps a postcategorical storage in which items from
the display are identified and well remembered, but their locations are forgotten (e.g.
Irwin & Yeomans, 1986).
1.3.1 The Dual-Buffer Model
This model was developed by Mewhort and co-workers (Campbell & Mewhort,
1980; Mewhort, Campbell, Marchetti, & Campbell, 1981; Mewhort, Marchetti, Gurnsey,
& Campbell, 1984). According to this model, information from a letter display is first
stored in a raw, precategorical form in a feature buffer, and is transformed to an abstract,
postcategorical representation that is stored in a character buffer, which will also preserve
the relative spatial positions of items in the display.
1.3.2 Irwin's Two-Component Model
Another model was proposed by Irwin and his co-workers (Irwin & Brown, 1987;
Irwin & Yeomans, 1986; Yeomans & Irwin, 1985). In his initial model (e.g., Irwin &
Yeomans, 1986), the nonvisible information persistence has two components: (1) a visual
analog representation of the display which contains form and location information of the
display; it is maskable and decays rapidly within 0.1 to 0.3 s after the offset; and (2) a
durable, nonvisual identity representation which is not maskable by perceptual masks and

Wei Yang 11
contains less accurate spatial information. The latter component was subsequently
updated to be a location-specific, limited capacity memory (Irwin & Brown, 1987).
These two models are very similar and only differ in some details. For example,
the latter model assumes that the selection occurs from a precategorical, maskable,
duration-independent representation, rather than from a duration-dependent
postcategorical representation. They also have different mechanisms for error patterns
and the effect of a mask stimulus.
1.3.3 Di Lollo's Three-Component Model
Not all the models exclude visible persistence from partial-report performance.
Di Lollo and Dixon (1988; Dixon & Di Lollo, 1991) proposed that the initial rapid
decaying memory which maintains spatial information is determined jointly by two
components. One is the schematic persistence which is postcategorical and is time
locked to the stimulus offset. The other is the visible persistence which is precategorical
and is time-locked to the onset of the stimulus. The asymptotic performance was
attributed to a verbal short-term memory which corresponds to the durable memory of
Coltheart (1977, 1980). In this model, there are at least three memories involved in the
partial-report task. By incorporating three memory components, they were able to
account for the intensity and duration effect they observed with partial-report procedures.
However, there is no direct evidence for the idea that schematic memory decay is
involved in the partial-report superiority effect. In addition, this model predicts that for
long stimulus durations (e.g. > 200 ms), the partial-report superiority effect will be

Wei Yang 12
caused by only the schematic memory decay and will be not affected by stimulus
intensity and duration. Such predictions need to be explicitly tested.
1.3.4 How Far Have These Models Progressed?
Interestingly, the theoretical developments following Coltheart's arguments did
not proceed beyond the classical models for partial-report performance. As Irwin and
Brown (1987) noted, "…it is interesting that this modification, which posits a
precategorical visual representation feed into an abstract, limited capacity representation,
is very similar to the traditional notion of an iconic memory which feeds into short-term
memory. The major difference is that the information in the precategorical representation
of Irwin and Yeomans is hypothesized to be nonvisible. Nonetheless, it would be ironic
if a slightly-modified version of the traditional theory turned out to be correct after all
these years" (p.337). Even the last modification may not be necessary because whether
visible persistence is involved in partial-report performance is still an open question.
Thus, the development of the theories intended to substitute the classic two-memory
model for partial-report performance (e.g. Coltheart, 1972; Sperling, 1967) turned out to
approach the two-memory model. This circular theorizing represents the chaotic status in
this area and raises doubts about Coltheart's arguments.
1.4 Current Status of Visual Sensory Memory Research
Although the classic concept of VSM as iconic memory has been challenged and
the concept of VSM has changed over the years (e.g. Cowan, 1995), the basic finding of
Sperling's experiment and the classical account are widely accepted in cognitive

Wei Yang 13
psychology and are taught in most textbooks of cognition. However, due to inconsistent
results and unsettled theoretical issues, the VSM studies which used to be emphasized in
the early days of cognitive psychology have recently become quiet recently. Another
reason for this situation was according to Cowan (1995), a shift of interest to the higher-
level semantic and lexical representations due to the development of new experimental
procedures such as priming.
The controversial situation in VSM studies has severely hindered the application
of the paradigm for assessing individual performance and investigating its neural
substrate. Given the recent expansion of our understanding of information processing in
the visual pathways, our understanding about the neural substrate of VSM is
embarrassingly limited. Why is the neural substrate for VSM interesting? One reason is
that it is a vivid form of awareness, as Crick and Koch (1990) noted. The identification
of the neural substrate of VSM might help to open a window to the neural substrate for
human consciousness.
To conclude, it is worth citing an observation by Cowan (1995) on the current
status of sensory memory in general: "…the research on sensory memory has reached a
plateau at which it is difficult to know how to proceed. Although much has been learned
and important questions remain, a muddle of alternative methods exists, each with
accompanying methodological concerns" (p. 51).

Wei Yang 14
1.5 Causes of the Controversies about the Concept of VSM
The classic concept of VSM as a transient, precategorical, large-capacity visible
persistence has been widely accepted in cognitive psychology, but it is largely
controversial among the researchers in VSM studies. It seems that there are evidence
against this concept of VSM, but none is sufficient to prove that it is wrong. The study of
VSM is full of inconsistent results and controversial theories regarding the properties of
VSM. This merits a survey of the literature to identify the problems that caused the
confusion so that they could be avoided. My literature survey identified three causes for
the confusions in the study of VSM.
1.5.1 Problem 1: Difficulties with the Partial-Report Task
Sperling's partial-report procedure is not an easy task for naïve subjects. It is easy
to understand but not easy to perform, as pointed out by Long (1985). Thus, some
studies reported no partial-report superiority effect (Eriksen & Steffy, 1964; Mayzner, et
al. 1964) while others reported a lack of partial-report superiority for some subjects (e.g.
Appelman, 1980). This led to wide individual differences under identical conditions.
Because a monotonic decay is not always observed in individual data, many studies
ended by averaging data across large numbers of subjects to obtain a monotonic decay of
performance to reveal VSM. Thus, it is difficult for the original partial-report task to
accurately characterize the time course of VSM for individual subjects. Averaged data
based on large numbers of subjects are not sufficiently sensitive to detect a change in the

Wei Yang 15
time course of VSM. Long (1985) has attributed the lack of sensitivity or temporal
resolution of the procedures to the ambiguities of the temporal properties of VSM.
Although a modified version of the partial-report procedure, the bar-probe
procedure, has been used in some VSM studies, the accurate characterization of
individual VSM lifetimes and illustration of its functional properties have not been
achieved.
1.5.2 Problem 2: No Well-defined Measure for the Time Course of VSM
Most studies of VSM or iconic memory with the partial-report procedure have
been concerned with its time course, but this time course has not been appropriately
characterized. Usually, the time course of VSM decay in the partial-report paradigm is
measured to the point where the performance is no longer significantly above the
asymptote (Gegenfurtner & Sperling, 1993). Cowan (1995) has pointed out that it is not
appropriate to speak of the "duration" of an exponential decay, because in principle it
takes an infinitely long period of time to reach the asymptote.
The consequence of the lack of a well-defined measure for the time course of
VSM is that its temporal properties have been ambiguous in published studies. Scholars
have different opinions regarding how the time course of VSM should be assessed. For
example, Keele and Chase (1967) measured partial-report performance with stimuli of
three intensity levels. Coltheart (1980) recognized that it is difficult to compare the time
courses of VSM for stimuli of different intensity in that study because the icons started to
decay from different levels in different conditions. Long (1980) and Nisly and

Wei Yang 16
Wasserman (1989) concluded that there is a positive intensity effect because stronger
stimuli led to larger partial-report superiority effect. It has become a routine in this area
to assess the time course of VSM by the overall performance or the performance at a
specific test delay.
However, higher performance does not necessarily indicate longer persistence
because the performance level also depends on the initial and asymptotic levels. The
form of VSM decay has been assumed as exponential. For an exponential decay, the
appropriate measure for its time course should be the time constant of the exponential
function. Unfortunately, the exponential decay of VSM has not been well established.
1.5.3 Problem 3: Identifying Iconic Memory as Partial-Report Performance
Problems 1 & 2 reflected the difficulties in using the partial-report procedure to
accurately characterize the time courses of VSM; however, the primary cause for the
controversies in VSM studies is a different usage of the term "iconic memory".
Sperling (1960; 1967; Averbach & Sperling, 1961) carefully discriminated the
two memory components in the partial-report procedure by attributing the partial-report
superiority as a measure of iconic memory and the asymptote of the partial-report or the
whole-report performance as a measure of durable memory. Although no explicit
method was developed to dissociate these two components from the performance, it was
clearly indicated that the partial-report superiority effect, not the overall performance,
corresponds to VSM or the iconic memory component. However, most of the published
studies based on the partial-report paradigm identified partial-report performance, instead

Wei Yang 17
of the partial-report superiority, as the measure of VSM or iconic memory. The
consequence of this is that any change in partial-report performance, including those
caused by a change in the durable memory component, has been attributed to iconic
memory component. This led to the confusion regarding the properties of VSM when
examined with the partial-report paradigm. This will be further illustrated in section 1.6.
Referring to partial-report performance as iconic memory is also common in the
theoretical evaluations of the classic concept of iconic memory, which led to the "split of
the icon". For example, the abstract of Mewhort et al. (1981) started with the statement,
"the partial-report tachistoscopic has been used to define iconic memory, a labile image-
like precategorical visual store"(p. 50). Then they summarized their data and stated at the
end that "Iconic memory is a construct that oversimplifies the information processing
system used in the bar-probe task" (p. 50). Evidently, the authors referred to partial-
report performance as "iconic memory" and overlooked the durable memory component.
They used their dual-buffer model that contains two memories to explain their data for
the different location and intrusion errors in the bar probe performance, and argued that
these data cannot be explained by a single icon. Obviously, they assumed that only
iconic memory is involved in the bar-probe performance.
In fact, in the first bar-probe study, Averbach and Coriell (1961) recognized that
two memory components are involved in the bar-probe task by noting:
The fact that the measured decay curves do not fall to zero suggests that
the measured performance contain components of a more permanent
Wei Yang 18
memory, as well as the short-term memory components that we would like
to measure. In this context, the 25 to 35 per cent final performance level
(which represents 4 to 5.6 letters) is attributed to what the subject has read
into his more permanent memory (p. 315).
Other lines of theories for the iconic memory (e.g. Di Lollo & Dixon, 1988; Irwin
& Yeomans, 1986) also identified partial-report performance as the experimental
measure of iconic memory and concluded that the concept of iconic memory is not
efficient to account for partial-report performance.
1.6 Confusions about the Properties of VSM
This section examined the controversies regarding the classic concept of VSM to
illustrate how the failure of discriminating iconic memory from partial-report
performance resulted in confusion about the properties of VSM.
1.6.1 Is VSM Visible Persistence?
Coltheart (1980) challenged the classic idea of VSM as the visible persistence
based on his conclusion that the visible persistence shows the dual-inverse effect and the
partial-report procedure does not. His argument had a great impact on the subsequent
models for partial-report performance. However, this argument is problematic.
First, his conclusion about the dual-inverse effect in visible persistence is
problematic. Some scholars (Long, 1980; Nisly & Wasserman, 1989) have questioned
his conclusion and pointed out that (1) not all of the measures of visible persistence
exhibit the dual inverse effect; and (2) the procedures he considered as measuring visible

Wei Yang 19
persistence might measure different aspects of the persistence such as Type I and Type II
defined by Hawkins and Shulman (1979).
Second, the evidence showing a lack of the dual-inverse effects on partial-report
performance is rather sparse. The lack of such an effect in these experiments might be
due to a small change of energy in the stimuli or lack of sensitivity in the procedure
(Long, 1985; Massaro & Loftus, 1997). It was found that under appropriate conditions,
there is a robust inverse duration effect in partial-report performance (Di Lollo & Dixon,
1988, 1992; Dixon, 1985; Dixon & Di Lollo, 1991). However, these effects were
assessed by comparing the overall performance, which does not necessarily reveal the
time course of iconic memory. Thus, effects of the stimulus parameters on the time
course of iconic memory remain to be accurately assessed.
Third, Coltheart's direct comparison of the results of the visible persistence and
that of the iconic memory studies was problematic, because these experiments differed in
procedure and stimulus parameters (Massaro & Loftus, 1996).
Finally, Coltheart did not explain why such information is not used for the partial-
report task if subjects see the visual pattern persist for hundreds of milliseconds. One
probable explanation is that visible persistence has a shorter lifetime than the nonvisible
information persistence. However, no experiment has been done to compare these
lifetimes. As pointed out by Pashler & Carrier (1996), the empirical evidence for the
existence of a separate identity representation from visible persistence is far from
Wei Yang 20
compelling. There is no direct evidence that visible persistence is not involved in partial-
report performance.
The only study that measured both iconic memory and visible persistence in the
same experimental condition and for the same subjects was that of Appelman (1980).
For visible persistence, he provided a click of 10 ms duration after various delays
following a visual display (50 ms) and asked the subjects to report whether the image of
the display was still visible at the time of the click. Visible persistence was measured by
the probability of saying "yes" as a function of the test delay. Only one of nine subjects
showed a monotonic decaying partial-report superiority effect. For this subject, both the
partial-report superiority and the probability of responding "yes" in the visible persistence
performance reaches zero at the test delay of about 450 ms. Such a similar time course
between iconic memory and visible persistence also holds in the averaged data. These
data seem to suggest the involvement of visible persistence in the partial-report task. So
far, the relation between visible persistence and iconic memory has been primarily
discussed on the basis of results from different experiments concerned with other issues.
It should be directly assessed in future studies.
1.6.2 Is VSM Precategorical?
In his review, Coltheart (1980) also suggested a postcategorical store as an
alternative account for iconic memory. This idea was taken seriously by subsequent
theorists. The main evidence was a categorical effect on partial-report performance and
the observation of the well-kept identity information in partial-report performance.

Wei Yang 21
According to the classic two-memory model for partial-report performance,
partial-report performance is jointly supported by a precategorical iconic memory and a
postcategorical durable memory. To attribute a specific effect to iconic memory, one has
to make sure that the iconic memory is captured. As Dick (1974) pointed out, to capture
the iconic memory one has to overload the perceptual system. The more items in the
display, the more partial-report superiority could be obtained.
Moreover, any change in partial-report performance caused by a shift of the
asymptote which represents the contribution of durable memory should not be attributed
to iconic memory. In practice, a specific effect on iconic memory should be a change of
the partial-report superiority effect while the asymptote is maintained stable. A change of
performance below the durable memory capacity could not be attributed to iconic
memory unless additional validation is provided.
Category effect on partial-report performance. A category effect on partial-
report performance refers to the superiority of partial-report performance by category
cueing over the whole-report performance. The results of this effect were not consistent
in previous studies. Some studies did not obtain such an effect (e.g. Bourne,
Dominowski, Loftus, & Healy, 1986; Moates & Schumacher, 1980; Von Wright, 1972),
while others did (Dick, 1969; Dixon, 1985; Dixon & Shedden, 1987; Duncan, 1983;
Merikle, 1980). In general, there seems to be a small category effect on partial-report
performance. An important question arises as to why the effect was small and whether
this effect could be attributed to the iconic memory component.

Wei Yang 22
Dick (1969) did not obtain a significant partial-report superiority, and the number
of available items was between only two and three. He acknowledged that the category
effect "seems to be the result of the short-term storage system and not of the sensory
register". The studies by Dixon (1985; Dixon & Shedden, 1987) used 7 items in the
display, and the highest number of items available was between 2 and 3. Additional
validation is required to attribute to iconic memory the category effect found at the
asymptotic performance level.
Duncan (1983) used only six items in the display, and he obtained partial-report
superiority of about 1.5 items at best. Merikle (1980) used 8 items in the displays and
found partial-report superiority of about 0.5 items. In both experiments, the largest
number of available items was no more than 5.5 items. Consequently, the perceptual
system in these two experiments was slightly overloaded, and only a small partial-report
superiority effect was obtained by perceptual cueing. Such a small effect might well be
due to the change of the asymptote that is produced by the effect on the durable memory.
This might be the case, because the data in Merikle (1980) show that most of the category
effect was the shift of the asymptote, which suggests that such an effect could be mainly
from a change in the durable memory.
It must be pointed out that the inference as to whether specific information is
processed in the icon by the effectiveness of a specific cue may not be appropriate, as
pointed out by several authors (Allport, 1989; Duncan, 1981; Pashler, 1998). It is
possible that the category information may not be a good cue, even if the items were

Wei Yang 23
categorized. This is somewhat like the situation where one cannot retrieve a book from a
shelf by its contents, although the contents are in the book. Therefore, the absence of
partial-report superiority by category cueing cannot be taken as evidence for the argument
that categorical information is not in the icon.
Obviously, if category information were contained in the icon, it is difficult to
understand that the number of items a subject can recognize after a brief display of
multiple items is never above the capacity of durable memory, as we will see in the next
section. One might argue that the recognition test is not sensitive enough. A more
sensitive procedure to detect residual memory is the priming technique. It has been
shown that strongly divided attention can eliminate conceptual priming completely
(Mulligan, 1997). Such results imply that if an item in the icon is not selected to be
processed into the durable memory system, it may not be perceptually categorized. So
far, all of the category effects found in partial-report performance are likely to be in the
durable memory system, the evidence of a categorical effect specific to the iconic
memory has not been shown.
A similar issue exists in visual search where the visual scene is consistently
available. The question is whether the representation in which the search is processed is
precategory or postcategory, and evidence for both possibilities exists. Lavie (1995)
reviewed such studies and proposed that a critical variable is the perceptual load.
The proposition of the necessity to overload the perceptual system for taping the
precategorical sensory system (Dick, 1974; Lavie, 1995) is consistent with the idea that

Wei Yang 24
the output in both partial-report and visual search paradigms is from a postcategorical
limited capacity system. When the perceptual load is within the limit, all items are fully
processed and a postcategorical effect is shown. When the processing system is
overloaded, only a small number of items in the sensory system are further processed,
and the rest items, which are seen but not recognized exhibit precategorical properties.
Effort is needed to dissociate these two systems and characterize how the large capacity
precategorical sensory representation and the limited postcategorical representation
system cooperatively operate in various tasks and usual life.
Independent identity and location information in partial-report performance.
All of the models developed after Coltheart's argument made a strong distinction between
spatial and identity information. The main evidence for this distinction is that the rapid
initial decay in partial-report performance is accompanied by an increase of location error
while the intrusion error remains relatively constant (e.g. Dick, 1969; Mewhort,
Campbell, Marchetti, & Campbell, 1981; Townsend, 1973). These authors concluded
that location information is lost before identity information, and it was further argued that
the partial-report procedure taps a post categorical store in which items were identified
and well kept, but their location information may be forgotten (Irwin & Brown, 1987).
Here I will examine whether the data actually support these arguments.
The most frequently cited study for the different spatial and location information
decay is Townsend (1973). She compared partial-report performance in a bar probe
procedure in two conditions. In the first condition, the subject has to report the item at a

Wei Yang 25
cued location; this task requires both location and identity information about the item. In
the second condition, an item was presented and the subject was required to report if it
was in the display. The latter task does not require spatial location information about the
item. Based on her data, she concluded that identity information in a display was not lost
as the test delay in increased, and further concluded that "the decay function found in
partial-report experiments using a visual probe result from Ss' inability to retain
information about where a letter is relative to a visual probe".
What has been ignored and should be made clear is that the relatively stable
identity information is just a small portion of all the items presented. To make this point
clear, we can replot the relevant data, the short cue condition in Experiment I and II in
Townsend (1973), in terms of the number of items available after correction for chance.
The formula for this chance correction is given by:
I = [(P- Pc)/(1 - Pc)] x Itot (1.1)
Where P is the probability of correct, Itot and I are the number of items in the
display and the number of items available respectively. Pc is the probability of a correct
response by chance. According to this formula, responding at chance level (Pc )
corresponds to the condition that no item is available in memory; responding perfectly (P
= 1) corresponds to the condition that all the items presented are available in memory.
The intermediate values of P are linearly scaled between these two extremes.

Wei Yang 26
0 100 200 300 400 5000
4
8
Identity only
Identity & Location
SO A (ms)
Nu
mb
er
of
Ite
ms
Av
aila
ble
Figure 1.2. Replotting of the results of Townsend (1973). Data were replotted as the
number of items available at different SOAs.
Figure 1.2 presents the data after correcting for chance. This figure shows aspects
of the results that were not explicit in the original graphs. First, the partial-report
superiority effect in the identity & location condition was small; the number of items
available at the zero delay was about 4.8, which was slightly above the asymptote. This
indicates that the experiment did not catch the iconic memory components well. Second,
the difference between these two conditions was much smaller than in the original graphs
where the chance was not corrected; the difference was about only 1.5 items for the test
delays longer than 150 ms. Such an effect might well be due to the durable memory,
because the difference was mainly an asymptote shift. Last, and most strikingly, the
number of items available was constantly about 4.5 in the identity-only condition which
was exactly the capacity of the durable memory identified by Sperling (Sperling, 1960).
Mewhort & Leppmann (1985) explicitly compared the performance when only
identity was tested and the performance when only location was tested. In Experiment I,
they presented the subjects with eight-letter string for 50 ms and asked whether a spoken
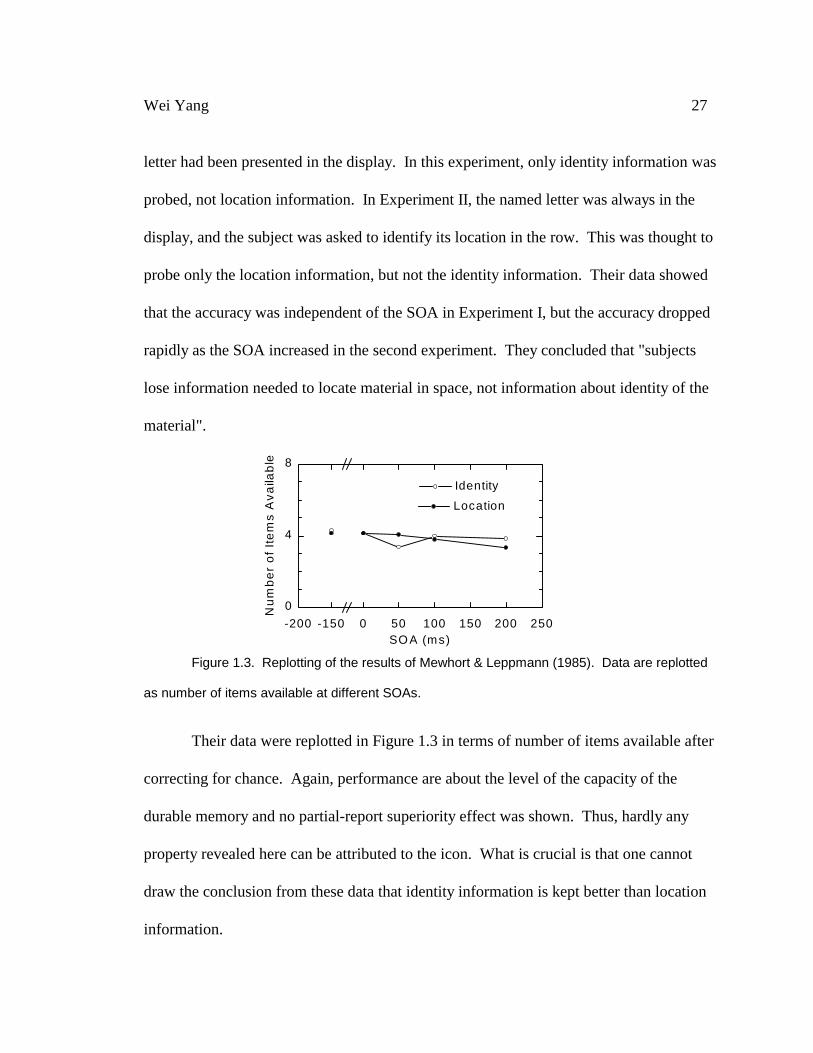
Wei Yang 27
letter had been presented in the display. In this experiment, only identity information was
probed, not location information. In Experiment II, the named letter was always in the
display, and the subject was asked to identify its location in the row. This was thought to
probe only the location information, but not the identity information. Their data showed
that the accuracy was independent of the SOA in Experiment I, but the accuracy dropped
rapidly as the SOA increased in the second experiment. They concluded that "subjects
lose information needed to locate material in space, not information about identity of the
material".
-200 -150 0 50 100 150 200 250
0
4
8
Location
Identity
SO A (ms)
Nu
mb
er
of
Ite
ms
Av
aila
ble
Figure 1.3. Replotting of the results of Mewhort & Leppmann (1985). Data are replotted
as number of items available at different SOAs.
Their data were replotted in Figure 1.3 in terms of number of items available after
correcting for chance. Again, performance are about the level of the capacity of the
durable memory and no partial-report superiority effect was shown. Thus, hardly any
property revealed here can be attributed to the icon. What is crucial is that one cannot
draw the conclusion from these data that identity information is kept better than location
information.

Wei Yang 28
The decrease in partial-report performance accompanied by the loss of location
information with increasing test delay was convincing in the data of Dick (1969) and of
Mewhort et al. (1981). They also found that when subjects made location errors, they are
more likely to report the item next to the probed location than other items. The classic
two-memory model for partial-report performance has no trouble with these error
patterns. For example, Gegenfurtner and Sperling (1993) suggested that such error
patterns could be caused by the fact that when not sure about the right answer, subjects
tend to report the items in their short-term memory because it is better to report an item
that has been presented than a wild guess.
In conclusion, the above reviewed studies on the categorical effect and on the
identity versus location information captured only a very small portion of the partial-
report superiority effect, and the small categorical effects obtained could hardly be
attributed to iconic memory. Also, there is no explicit evidence in data for a conclusion
that identity information is kept better than location information in partial-report
performance.
1.6.3 Is VSM Limited in Capacity?
The question of whether iconic memory is limited in capacity has been addressed
by examining the effect of concurrent task on partial-report performance. Three studies
of this kind arrived at three different conclusions. Doost and Turvey (1971) did not find
a significant effect of concurrent task on partial-report performance and concluded that
iconic memory is relatively independent of the central processing system. Chow and

Wei Yang 29
Murdock (1975) found a significant effect of concurrent task on partial-report
performance at all test delays and concluded that iconic memory is also subject to the
limitation of the central processor. Sakitt and Appelman (1978) found that increasing
memory load resulted in larger partial-report superiority and they concluded that the
partial-report superiority does not imply the existence of an icon.
The results in Doost and Turvey (1971) were consistent with the classic concept
of iconic memory that it has large capacity and should not be affected by concurrent task.
The majority of the concurrent task on partial-report performance in Chow & Murdock
(1975) implies that what was affected is the asymptotic performance, not the time course
of the partial-report superiority. Their results may have revealed the effect of concurrent
task on the durable memory, not the iconic memory.
Sakitt and Appelman (1978) found that the partial-report superiority effect was
increased by adding a concurrent task. The increment of the partial-report superiority
effect was however, due to the decrement in the asymptote of the decay measured at the
delay of 2 and 5 seconds. This indicates that the durable memory is not maintained at the
full capacity for the partial-report task due to the concurrent task. In this case, the partial-
superiority effect, which was thought of as the decay of iconic memory, was
contaminated by the decay of durable memory.
From the studies reviewed above, we can see that most of the confusion in the
experimental studies regarding the properties of iconic memory has been caused by the
practice of identifying partial-report performance as iconic memory and ignoring the
Wei Yang 30
contribution of the durable memory to partial-report performance. To assess the
properties of iconic memory, it is critical to isolate it from the durable memory which is
also involved in partial-report task.
1.7 Conclusions
The early studies on VSM in the partial-report paradigm recognized that both
VSM and a durable memory are involved and the VSM component, the icon has been
identified as the partial-report superiority effect. The VSM have been characterized as
transient, visible, precategorical, and of large capacity. However, due to the difficulties
in measuring the partial-superiority effect and the lack of a method to isolate the VSM
component from the performance, this classic concept of VSM has been subject to
several lines of challenge and the basic properties of VSM have remained largely
controversial. In addition to the problems in the measurement, another cause for the
confusions of this area is a mistake in the theoretical interpretation of the data -- the
identification of partial-report performance as VSM. These problems caused the
"splitting of the icon" in the theoretical evaluations of the classical concept of VSM and
the misattribution of the properties of the durable memory to the VSM.
The survey of the main evidence against the classic concept of VSM indicates that
these data did not disprove the idea that VSM, or iconic memory is visible,
precategorical, and of large capacity. To clarify the confusions in this area, we need a
more effective procedure to characterize partial-report performance with substantial
contribution from VSM component. We also need a mathematical model to isolate the

Wei Yang 31
VSM component form the performance so that properties of VSM can be specifically
assessed.
1.8 Goal and Plan of This Study
The primary goal of this study is to identify the neural substrate of VSM by
assessing the correlation between the lifetime of VSM and the lifetime of the activation
trace in V1. Because the lifetime measurement for VSM has not been well established
and its properties have been controversial in the literature, the goal of this study was
reached by several steps which determine the global structure of this thesis.
Chapter 1 reviewed the studies of VSM in the context of the partial-report
paradigm and identified problems in both the measurement and the theoretical
interpretations that led to controversies. This provided a basis for achieving an efficient
measurement and clear concept for VSM in this study.
Chapter 2 describes an improved partial-report procedure to achieve an efficient
and accurate measure of partial-report performances that contains a substantial VSM
component. A mathematical model was introduced to isolate the VSM component from
the performance so that its lifetime could be quantified and the properties of VSM could
be appropriately assessed.
Chapter 3 contains experiments to characterize the VSM lifetimes for each of a
group of subjects. The purpose was to assess whether the VSM lifetime is correlated
with V1 lifetime measured later for each of these subjects.

Wei Yang 32
Chapter 4 contains experiments assessing the influences of several stimulus
parameters on VSM lifetime to identify the critical parameter that determines VSM
lifetime. One motivation was that such variable has not been identified in the literature.
Another motivation was to provide information to identify the neural substrate of VSM.
To identify a neural activation as the substrate for VSM, it is critical to show that it is
sensitive to the same stimulus factor as is the VSM.
Chapter 5 reports experiments to explore the neural substrate of VSM by
assessing the correlation between its lifetime and the lifetime of the activation trace in V1
deduced from visually evoked potential (VEP) recordings. Two experiments will assess
whether V1 lifetime correlates with VSM lifetime across subjects and whether it is
sensitive to the same variable as VSM, respectively.
Chapter 6 summarizes the main results of this study and remarks on the
implications of these results on future research.

Wei Yang 33
CHAPTER 2. A NEW PROCEDURE AND MODEL FOR VSM LIFETIME
As discussed in Chapter 1, the classic partial-report task is difficult for subjects to
perform and many studies using this procedure obtained either no effect or a small
partial-report-superiority effect. Because partial-report-superiority reveals the
contribution of VSM to the performance while the asymptotic performance reveals the
contribution of the durable memory, partial-report performance with small partial-report
superiority effect is dominated by the durable memory. In this case, a change in partial-
report performance most likely reveals a change in the durable memory rather than the
VSM. To characterize the VSM decay underlying partial-report performance, it is crucial
to make the task rely heavily on the VSM to maximize the partial-report superiority
effect. It is also necessary to isolate the contributions of the VSM and the durable
memory respectively so that the properties of the VSM decay could be specifically
characterized. This chapter introduces a new partial-report procedure to produce a
partial-report performance having a significant VSM component for individual subjects.
It also proposes a model to isolate the underlying VSM component.
2.1 A New Procedure to Characterize Partial-Report Performance
The problems resulting in an inaccurate measurement of VSM decay have been
discussed by Long (1980). Here, I shall outline these problems and propose
corresponding strategies to avoid them.
Exclusive use of letter or number stimuli. The use of letters or numbers in
stimuli automatically triggers categorization and phonological coding. This necessarily

Wei Yang 34
involves the high level processing beyond the sensory representation. Kaufman (1974,
p.530) argued that "the fact that linguistic stimuli such as words, letters, and numbers
have been the predominating stimuli in the study of information processing is one of the
great limitations in this field". Another problem with using symbols in stimuli is that it is
difficult to independently manipulate the sensory features (e.g. spatial frequency,
contrast, and luminance) as in psychophysical and physiological studies of the temporal
properties of the visual sensory system. This made it difficult for the researches in these
areas to communicate and the psychophysical studies of VSM have remained isolated
from the studies of the temporal properties of the visual pathways.
In this study, a display contained sinusoidal patches arranged in a circle, and a
simple feature, the orientation of sinusoidal gratings, was tested. This will presumably
make the task more focused on an early visual sensory representation and thereby
minimize the involvement of the higher-level symbolic and phonological processing.
Presenting items at different eccentricities. Most partial-report studies presented
items in one or several rows. The accuracy for reporting items at different eccentricities
exhibits a typical W-shaped pattern. Because visual information at different
eccentricities are processed differentially (e.g. Carrasco & Frieder, 1997), averaging data
across these items might result in a systematic error in the data. This might reduce the
power of the procedure to detect a change in the underlying memories. In this study, the
eccentricity of the items are equalized by presenting the items on a circle centered on the
Wei Yang 35
subject's fixation point. This modification was originally proposed by Keele and Chase
(1967).
Retrieving multiple items in a trial. In Sperling's partial-report procedure,
subjects had to report the items in the cued row which contained 4 items. The
performance is subject to output interference. In this study, I shall adopt the modification
by Averbach and Coriell (1961) where only one item was probed in a trial.
Verbal response. It was a common practice in partial-report studies to require the
subject to verbally report the probed item or items. This led to phonological coding of
the items, which result in an additional source of variance. In addition, verbal recording
requires an experimenter to write down the subjects' responses, which is not efficient in
data recording. In this study, subjects responded by simply pressing one of four keys.
Averaging data across subjects. Most published partial-report studies reported
data averaged across subjects. Because different subjects usually show different amount
of partial-report superiority effect, the averaged data may contains a large inter-subject
variance. In this study, individual data were examined to characterize individual
performance. In addition, an assessment session was conducted for each subject before
the partial-report test to insure that a partial-report superiority effect will be obtained
2.1.1 Method
Because most experiments of this study involved minor changes of this method,
for convenience, the stimuli and procedure described here were called the standard
stimuli and standard procedure, respectively.
Wei Yang 36
Standard stimuli. An IBM-compatible PC with a 14 inch VGA monitor (viewing
area 16 cm high by 26 cm width) having a refresh rate of 70 Hz was used to present
stimuli and record responses. The monitor was calibrated for gamma correction so that
the luminance on the screen is a linear function of the pixel value in the image file. After
gamma correction, the pixel value 0 to 255 linearly code the screen luminance from 0 to
40 cd/m2, thus, the resolution of the luminance control was about 40/256 = 0.16 cd/m2.
The images were made by HIPS, an image generating and processing software under
UNIX (Landy, Cohen, Sperling, 1984). The stimulus display is illustrated in Figure 2.1.
With the properties stated in the figure caption, eight spatial configurations of the
grating patches were constructed (include the display illustrated in Figure 2.1). The
displays were viewed binocularly at a distance of 57 cm, where the visual angle between
the center of each patch and the fixation point was 6.5o, the diameter of each patch was
2.5o and the spatial frequency of the gratings was 1c/deg.
Long (1985) pointed out that the lack of the dual-inverse effect in the previous
partial-report studies might be due to a small change of energy in the stimuli. These
studies presented multiple items in or near the fovea and size of each item was small. It
is more appropriate to assess the dual-intensity effect with larger items to compare the
results with those of the visible persistence studies because the latter generally used
stimuli with larger visual angle. In this study, the eccentricity of 6.5o was a compromise
of presenting items of large visual angle and to the fovea as close as possible.

Wei Yang 37
Standard procedure. Subject sat in a quiet, dark room. The test session started
after the subject looked at the screen for two minutes to adapt to the background
luminance of 20 cd/m2 on the screen. The subject maintained fixation during the
experiment, with a chin-rest to maintain the head position.
1 cm
Figure 2.1. An example of the standard visual stimuli. Twelve patches of sinusoidal
gratings were equally spaced around a circle surrounding the center of the screen. The four
orientations were horizontal, vertical, and 45o to the left or right of the vertical. Each orientation
appeared three times in a display. To avoid perceptual grouping, neighboring patches differed in
orientation. The mean luminance of each grating was the same as the background of 20 cd/m2,
and the contrast of the gratings was 20%.
Subject pressed a key to initiate a partial-report test trial. Two seconds after the
key pressing, a display as illustrated by Figure 2.1 was presented for 28 ms. After a delay
ranging from about 0 to 1.5 sec, a probe bar of 2 cm length pointed from the fixation
point to one of the 12 locations where the patches were presented. There were 7 test
delays in this standard test. However, the exact number of the test delays and their values
might be changed in different experiments for different subjects. The subject pressed one
of four keys to indicate the orientation of the indicated patch and had to guess when he or

Wei Yang 38
she was not sure. The subject's response terminated the bar probe and a feedback of
either “RIGHT” or “WRONG” was presented 1 cm above the fixation point.
During a test session, each of the 12 locations in each of the 8 displays was tested
twice at each of the 7 test delays. Thus a test session contained 12 x 8 x 7 x 2 = 1344
trials. The order of these 1344 trials was determined by a random sequence of the
integers from 1 to 1344 generated by random sampling without replacement. A prompt
for a short break was presented after every 192 trials. The whole test session was usually
completed in 1.5-2 hours.
Before the partial-report test, an assessment session was conducted for each
subject. This session was similar to the partial-report test except that the bar was
presented right after the display offset with no delay. This session was to make sure that
the subject can accurately report the orientation of the indicated patch at zero test delay to
insure a substantial decay can be obtained when the test delay is increased. The criterion
for passing the assessment was 80% correct in 20 consecutive trials.
2.2 A Model to Isolate VSM from Partial-Report Performance
2.2.1 The descriptive function for partial-report performance
Typical partial-report performance is a decay which asymptotes to an above
chance level, and the decay is generally thought to be exponential. The simplest function
for such a pattern is:
P(t) = A + B e - t / ττττ [2.1]

Wei Yang 39
where P(t) is the probability of a correct response at test delay t; A, and B e - t / ττττ
characterize the asymptotic performance and partial-report superiority effect respectively.
The parameters A, B and τ could be obtained by fitting the data with function [2.1].
2.2.2 A Mathematical Model for partial-report performance
The classic two-memory model proposed that partial-report performance is jointly
supported by a constant durable storage and an exponentially decaying VSM (Coltheart,
1972, 1977; Sperling, 1967). In the following modeling, I would follow the classic
notion of VSM as iconic memory and these two concepts were used interchangeably in
this study. The present task is unlikely to involve phonological processing of the stimuli,
and the durable memory is the active maintenance of visual-spatial information for a
short period of time before it is discarded. Such memory was characterized by Baddeley
and Hitch (1974) as visual working memory or a "visuospatial scratch pad". In this
study, the durable memory component is denoted visual working memory (VWM).
To deduce the underlying VSM and VWM from partial-report performance, it is
further assumed that these two memories are combined in additive manner. So, if Pi (t)
represents the probability of a correct response based on VSM when probed at t after
stimulus offset, and Pw(t) represents the probability of a correct response based on the
durable memory when probed at t after stimulus offset, then P'(t), the probability of being
correct based on either memory when probed at t after display offset is:
P'(t) = Pw (t)+ Pi (t) - Pw(t)Pi (t) [2.2]

Wei Yang 40
Because it is found in previous experiments that the durable memory is constant
across test delays, Pw (t) is independent of time and could be expressed as:
Pw (t) = Pw [2.3]
The exponential decay of VSM can be expressed as:
Pi (t) = Pi e - t / τ [2.4]
Parameter Pi is Pi (t)|t=0, and τ is the time constant for the exponential decay of VSM. I
define τ as the "lifetime" of VSM. It is the time for VSM to decay to about 1/3 of its
original level, because when t = τ, Pi (τ ) = Pi e - τ / τ = Pi e -1 = Pi /e ≅ Pi /3.
Function [2.3] and [2.4] with three parameters Pw, Pi, and τ completely describe
the VSM and VWM underlying partial-report performance.
The quantitative relation between partial-report performance and the underlying
memories could be obtained by taking [2.3] and [2.4], into [2.2]:
P'(t) = Pw + Pi e - t /ττττ - Pw Pi e - t /ττττ
= Pw + (1 - Pw)Pi e - t /ττττ [2.5]
Be note that P(t) of [2.1] and P'(t) in [2.5] are the probability of a correct response
at test delay of t in the present task before and after correction for chance, respectively.
2.2.3 Deducing the VSM and VWM from partial-report performance
Let us first correct the chance probability for P(t) with:
P'(t) = [P(t) - Pc]/(1-Pc) [2.6]

Wei Yang 41
Where P'(t) and P(t) are the probability of a correct response with and without correction
for chance respectively; Pc = 0.25, which is the probability of correct by chance in the
present test. Substituting equation [2.1] into this expression and simplify it, we have:
P'(t) = (A - Pc)/(1-Pc) + [B/(1-Pc)] e - t / ττττ [2.7]
Compare equation [2.7] with [2.5], we have:
Pw = (A - Pc)/(1-Pc) [2.8]
and (1 - Pw)Pi = B/(1-Pc) [2.9]
Take [2.8] into [2.9], we have:
Pi = B/(1-A) [2.10]
Equation [2.8] and [2.10] provide the formula to deduce the parameters Pw and Pi
for the memories underlying partial-report performance from the parameters A and B for
partial-report performance.
These two memories could also be expressed in the terms of number of items
available by the following functions:
I i(t) = Itot Pi(t)
= Itot Pi e - t / ττττ
= Itot [B/(1-A)] e - t / ττττ [2.11]
Cw = Itot Pw(t)
= Itot Pw
= Itot [(A - Pc)/(1-Pc)] [2.12]

Wei Yang 42
Here Itot, is the number of items in a display; and I i, Cw are the number of items
available in VSM and VWM, respectively. Parameter Cw is called the capacity of VSM
because it is the maximum number of items the subject could fully keep in VWM for a
short period. It is the maximum amount of information subject could capture form a
brief display and could actively maintain for a short period.
Two conditions must be satisfied to apply the present model to deduce the VSM
and VWM components from partial-report performance function. The first is that there
must be a partial-report superiority effect. Which is, B > 0. If B = 0, function [2.9] can
not be solved. The second requirement is that partial-report performance must show a
stable asymptote to satisfy the assumption that the VWM is constant.
2.2.4 Why It Is Necessary to Overload the Perceptual System to Characterize VSM?
It was discussed in sections 1.6.2 & 1.6.3 that it is critical that the perceptual
system be overloaded to reveal the VSM component in the partial-report paradigm. The
present model for partial-report performance clearly illustrates this point.
When the number of items in the display equals or is below the capacity of
VWM, all the items could be transferred and maintained in VWM for a short period of
time. During the period the information in VWM is fully maintained, the probability of a
correct response based on VSM, the Pw (t) is 1. So, from [2.2],
P'(t) = Pw (t) + Pi (t) - Pw(t)Pi (t)
= Pw (t) +[1 - Pw(t)]Pi (t)
= 1 + (1 - 1)Pi (t) = 1

Wei Yang 43
In this case, P'(t) is independent of Pi (t), any change in the VSM will not
influence partial-report performance. However, it should be careful not to generalize this
conclusion to other paradigms. It is possible that when perceptual system is not
overloaded, VSM could still be revealed by more sensitive measurements such as
priming, discrimination threshold, or responding time.

Wei Yang 44
CHAPTER 3. INDIVIDUAL DIFFERENCES IN VSM LIFETIME
This chapter will apply the new procedure described in section 2.1 to characterize
partial-report performance for individual subjects and apply the model developed in
section 2.2 to isolate VSM and VWM from the performance. The main concern of this
chapter was the different VSM lifetimes exhibited by different subjects. Two additional
experiments were conducted to assess some issues in the measurement of partial-report
performance for revealing the VSM component.
3.1 Experiment 1: VSM Lifetime in Individual Subjects
With few exceptions (e.g. Appelman, 1980; Sperling, 1960), most studies of
partial-report performance report data averaged across subjects. Long (1985)
acknowledged extensive individual differences and suggested that such differences
reduce the power of the procedures that are based on averaged data to detect a change in
the performance. However, the individual differences in partial-report performance and
the underlying VSM and VWM have not been specifically examined. The lack of such
information is reflected by a recent chapter on individual differences in memory (Bors &
MacLeod, 1996), which contained only individual differences in working memory and
long-term memory, but not the differences in VSM.
3.1.1 Method
Subjects. Ten adults (four female, six male) ranged in age from 18 - 56 years
(mean 30 years old) volunteered as subjects. One of them was the author. All had
normal or corrected-to-normal vision. Subjects SL, SS, YS, KB, SH, and HG were naïve

Wei Yang 45
to the task, and subjects WY, JH, LX, and JM had intensively practiced (about 10,000
trials within one month) in the standard method using different grating contrasts, mean
grating luminances, spatial frequencies, or presentation durations.
Procedure. Each subject took a session of the standard test (see section 2.1).
3.1.2 Results & Discussion
The practiced subjects passed the assessment session in 20-40 trials. Naïve
subjects passed the assessment criterion (80% correct in consecutive 20 trials) within 100
to 200 trials. Two naïve subjects, SS and SL could not pass the assessment even after
extensive practice (>500 trials), so they were excluded from this experiment.
The probability of a correct response P(t) at test delay t was calculated and plotted
against test delay for each subject, as presented in Figure 3.1. Test delay was defined as
the time interval from the offset of the display to the onset of the probe bar. The standard
error σp for each probability value P(t) was obtained by:
where P(t) is the probability of a correct response at test delay t, n is the number of trials
used to estimate the probability.
For each subject, an initial rapid decay followed by a short period of stable, above
chance level performance was clearly shown. These are the features of a typical partial-
report performance when the partial-report superiority is obtained.
[3.1])](1)[(
n
tPtPp
−=σ

Wei Yang 46
0.25
0.50
0.75
1.00
R2= 0.999(0.986)
LX
P( t ) = 0.41 + 0.59 e
R2= 0.926(0.781)
P( t ) = 0.42 + 0.28 e
SH
0.25
0.50
0.75
1.00
R2= 0.948
- t / 0.71
- t / 0.42 P( t ) = 0.43 + 0.49 e
WY
R2= 0.991
- t / 0.18
- t / 0.12
- t / 0.14 P( t ) = 0.43 + 0.57 e
KB
0.25
0.50
0.75
1.00
R2= 0.995
- t / 0.38 P( t ) = 0.48 + 0.55 e
JH
R2= 0.999(0.827)
P( t ) = 0.49 + 0.38 e
HG
0 1 2 30.25
0.50
0.75
1.00
R2= 0.949
- t / 0.07- t / 0.36 P(
t ) = 0.47 + 0.54 e
Chance Level
JM
0 1 2 3
R2= 1.000(0.953)
P( t ) = 0.51 + 0.31 e
Pro
babi
lity
of C
orre
ct R
espo
nse
Test Delay (s)
YS
Figure 3.1. Partial-Report Performance for each of eight subjects. The left column
contains plots for the practiced subjects, and the right column the naïve subjects. Error bars
represent the standard errors (n = 192) of the probabilities. The solid lines represent the best
exponential fitting functions in the form: P(t) = A + B e - t / ττττ. The open circles show collapse of
the asymptote the initial decay and were not included in the fits. R 2 represents goodness of the
fit. Values in the parenthesis for the R 2 are the values when the open circles were included in the
fitting.

Wei Yang 47
However, for subjects LX, SH, HG, and YS, the asymptote of the initial decay
was not maintained for all the test delays. It dropped to chance or near chance level.
This collapse of the asymptote indicates the failure of maintaining information in the
VWM with full capacity. Because this study primarily concerned with the VSM lifetime
and the requirements for applying the model (section 2.1) were satisfied by the clear
initial decay and evident asymptote in the individual performance, the model was applied
to the initial decay and its asymptote while the points fall bellow the asymptote in some
subjects were not included in fitting the function [2.1]. The obtained best-fitting function
was plotted for each subject in Figure 3.1.
The quality of the fit was assessed by R2, the proportion of variance accounted for
by the fit, adjusted for the number of free parameters:
∑
∑−=
=
=
−−
−′−
n
ii
n
iii
nyy
knyy
R
1
2
1
2
)1()(
)()(2 1 [3.2]
Where yi are the observed data values, yi' are the predicted values, y is the mean of yi, n is
the number of data points, and k is the number of free parameters (Reed, 1976).
Please note that the asymptote of the best fitting function indicated the level of the
performance maintained by the full capacity VWM, not the actual time course of VWM.
To characterize the decay of the VWM, longer test delays should have been included. To
apply the present model to isolate VSM and VWM and take the decay of VWM into
consideration, the assumption of a prolonged constant VWM should be changed to
account for its decay after a relatively short period.

Wei Yang 48
3.1.3 Loss of Information from VWM
How can the collapse of the asymptote of the initial decay in partial-report
performance be attributed to the loss of information from VWM? Equation [2.2]
presents the relation between partial-report performance and its underlying memories
without any assumption regarding the form of the VSM and VWM.
P'(t) = Pw (t)+ Pi (t) - Pw(t)Pi (t)
= Pw (t)+ Pi (t)[1 - Pw(t)]
Because the typical time course of VSM is about 0.25 s and it is conceivable that
0.5 s after the offset of the display, the VSM has decayed completely or nearly to a zero
level. In the above equation, when Pi (t) → 0, P'(t) → Pw (t). So any change in partial-
report performance beyond 0.5 s should be solely attributed to the VWM.
As indicated in the left panel of Figure 3.1, the asymptotic performance was
maintained at a stable above-chance level up to 1.5 s for the four practiced subjects. By
contrast, the performance decreases to a near chance level near the delay of 1.5 s for three
of four naïve subjects. These results indicate that full capacity VWM information could
be kept longer in practiced subjects than in naïve subjects. For the practiced subject, the
asymptotic performance would collapse to chance level if the test delay were long
enough. This is indicated by the dropping of the last point below the asymptote at test
delay of 2.9 s for LX. In a pilot study for WY when the test delays were further
increased, the asymptote of the initial decay was maintained up to 2.5 s and then decays
to nearly chance level appeared with longer delays.

Wei Yang 49
Such collapse of the asymptote of the initial rapid decay in partial-report
performance has not been recognized in the previous partial-report studies. One possible
reason for this is that the decay of VWM starts at different test delay for different subjects
as indicated in Figure 3.1. This made it difficult to detect a two-stage decay in averaged
data. Another possibility is that that the intertrial intervals in the previous partial-report
studies were much longer than the interval of 2 s in present experiment. For example,
Keele & Chase (1967) used intertrial interval of 10 s and their subjects were able to
maintain 2 to 4 items out of 10 items in the display for up to 5 seconds.
The collapse of the asymptote performance in partial-report task more likely
occurs for naïve subjects or when intertrial interval is short. Although the asymptote
performance was maintained up to 1.5 sec for the practiced subjects shown in the left
panel of Figure 3.1, it was observed in the pilot studies that the asymptote collapsed at
short test delays about 1 s when these practiced subjects were distracted by fatigue or
hunger etc. Because the asymptote performance is solely supported by the VWM, the
conditions for the collapse of the asymptote performance reveal the condition where
VWM fail to maintain in full capacity.
The observation of the initial decay to an above chance asymptote followed by a
further decay to chance level in partial-report performance shows cascade decaying
pattern in a single memory task. Such cascade decay clearly indicates two memory
components of different time course are involved in the partial-report task. Thus, when

Wei Yang 50
the measurement of partial-report performance is accurate enough, the VSM and VWM
could be dissociated by their temporal properties.
3.1.4 Inter-Subject Variance in Partial-Report Performance
0 1 2 30.00
0.25
0.50
0.75
1.00
Chance Performance
Test Delay (s)
Pro
babi
lity
(Cor
rect
)
Figure 3.2. Comparison of partial-report performances in practiced and naïve subjects.
The solid and dashed lines represent the best-fit exponential functions when the decay of the
VWM was ignored, for practiced and naïve subjects respectively. Each type of symbol represents
a different subject.
Figure 3.2 shows partial-report performance for each subject in a single plot to
illustrate the inter-subject variance. For clarity, the error bars were not included in this
figure. The functions clearly clustered into two groups depend on whether the subject
was practiced. The main difference between the performance of the practiced subjects
and that of the naïve subjects were that 1) the initial decay of the naïve subjects were
more rapid than those of the naïve subjects indicating a shorter VSM lifetime for the
naïve subjects, 2) the performance of the naïve subjects collapsed to chance level earlier
than those of the practiced subjects.
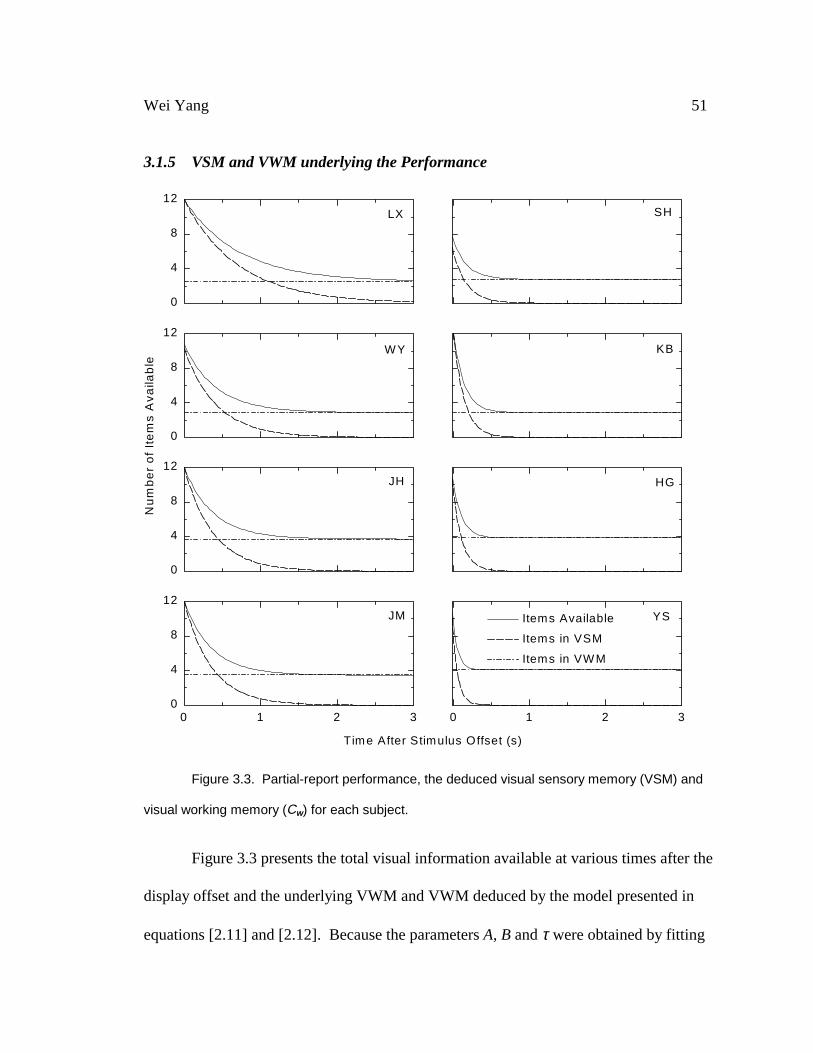
Wei Yang 51
3.1.5 VSM and VWM underlying the Performance
0
4
8
12LX
Items Available
Items in VSM
Items in VWM
SH
0
4
8
12
WY
Nu
mb
er
of
Ite
ms
Av
aila
ble
KB
0
4
8
12JH
HG
0 1 2 30
4
8
12JM
Time After Stimulus Offset (s)
0 1 2 3
YS
Figure 3.3. Partial-report performance, the deduced visual sensory memory (VSM) and
visual working memory (Cw) for each subject.
Figure 3.3 presents the total visual information available at various times after the
display offset and the underlying VWM and VWM deduced by the model presented in
equations [2.11] and [2.12]. Because the parameters A, B and τ were obtained by fitting

Wei Yang 52
only the initial decay and its asymptote with the assumption of a constant VWM, the
VWM illustrated in this figure represents the level of the fully maintained VWM, not the
time course of the VWM.
0.0
0.5
1.0
Initi
al V
SM
0.0
0.5
1.0
VS
M L
ifetim
e (s
)
LX WY JH JM SH KB HG YS0
4
8
12
Subject
Naive Subject
Practiced Subject
Cap
acity
of
VW
M
Figure 3.4. Initial level of visual sensory memory (Pi), lifetime of visual sensory
memory (τ ), and capacity of visual working memory (Cw) for each subject. Error bars represent
the standard error of the values.
As discussed in section 2.2.2, function [2.3] and [2.4] with three parameters Pw,
Pi, and τ completely describe the VSM and VWM which jointly support partial-report
performance. To compare the memories underlying the performance across subjects,

Wei Yang 53
Figure 3.4 presents these three parameters for each subject. Note that Pw was converted
to Cw by equation [2.12] because it actually represents the capacity of the VWM.
Inter-subject difference in initial VSM level (Pi). The parameter Pi is the
probability of a correct response based on VSM (or iconic memory) when probed right
after the display offset with no delay. It represents the initial level of the VSM
characterized. As indicated by the top panel of Figure 3.4, it was about the same for the
practiced subjects but was more variable among the naïve subjects. Because the overall
performance of the naïve subjects was poorer than that of the practiced subjects, it was
expected that the initial VSM levels of the naïve subjects would be lower than those of
the practiced subjects. The difference was found to be significant [( t (6) = -2.41, p <
0.05, one-tailed test]. Such an effect was also indicated in individual data presented in
Fig. 3.5 where the performance at the shortest positive SOA was consistently enhanced in
the second test for every single naïve subject.
Inter-subjects difference in VSM lifetime (ττττ ). The difference between the
lifetimes of VSM (τ ) in the two groups was significant [ t (6) = - 4.02, p < 0.05]. This
suggests that practicing on this task enhance the VSM lifetime. This enhancement will
be further illustrated in Experiment 3 & 6 using a within subject design.
The naïve subjects exhibited lifetimes shorter than those of the practiced subjects
and their initial VSM level was lower than those of the practiced subjects. Further
research is needed to elucidate the mechanisms of the enhancement of lifetime and the
improvement of the initial VSM level. Yet shorter lifetime of the naïve subjects should

Wei Yang 54
not be attributed to the lower initial VSM level. As will be shown in section 3.3.4, the
VSM decay strictly follows an exponential function. For an exponential function, its
lifetime is independent of the initial amplitude.
Inter-subject difference in capacity of VWM (Cw). There was a relatively small
variance in Cw within each of these two groups, and the difference between the naïve and
practiced subjects was not significant [t (6) = 0.48, p =0.65 > 0.05]. The mean of Cw of
all the subjects was 3.3 ± 0.5 items in this experiment when items were presented at
peripheral level of 6.5º. This result was consistent with the estimation for the VWM
capacity of 4 items in the fovea and 2 in the peripheral (Wolford and Hollingsworth
1974). This capacity was found to be the number of integrated objects rather than the
number of individual features (Luck & Vogel, 1997).
The capacity of the durable memory in Sperling's (1960) experiment was 4.5
items. Sperling (1960, p.4) noted that the correction for guessing would be about 0.4
letters for the 4/4/4 (12 letter) display. Thus the corrected value should be about 4 items
in this experiment. This value was slightly higher than what would be expected from the
estimation of Wolford and Hollingsworth (1974) because not all the items were presented
in the fovea in Sperling's experiment. One possible reason for this slightly larger
capacity might be a perceptual grouping between the items in rows and columns.
Such limited capacity of VWM has also been revealed in a task requiring subjects
to track several identical moving spots. These experiments found that subjects can

Wei Yang 55
accurately track 4 or 5 targets for a short period (Fisher, 1984; Kahneman, Treisman, &
Gibbs, 1992; Pylyshyn & Storm, 1988; Yantis, 1992).
VWM, involving both item and spatial location information was found to involve
cortical areas such as the inferior temporal (IT), posterior, ventrolateral and dorsal
prefrontal cortex in both humans and monkeys (Baddeley, 1998; Miller, Li, & Desimone,
1991; Ungerleider, Courtney, & Haxby, 1998). By contrast, the cortical site for VSM has
not been investigated. Chapter 6 of this study will explore the cortical location for the
VSM.
The capacity of VWM was negatively correlated to VSM lifetime in both groups
but the correlation was not significant in the combined groups. Such a trend in the data
suggests that subjects having a shorter VSM lifetime find the task more difficult, and they
concentrate more on the task with the result of a slightly higher VWM performance.
3.2 Experiment 2: Time Course of Retrieval and Partial-Report Performance
Well-practiced subjects in Experiment 1 passed the assessment right away, with
occasional errors. The naïve subjects needed one to two hundreds of trials to reach the
criterion of 80% correct in 20 consecutive trials. Even after the assessment was passed,
performance in the no delay trials was not as good as that of the practiced subjects. This
indicates that that the practiced subject has higher initial VSM level than the naïve
subject. One explanation is that the practiced subjects can perceive the displays better
than the naïve subjects. An alternative explanation is that the naïve subjects perceive the
display as well as the practiced subjects, but it takes little longer for the naïve subjects to

Wei Yang 56
retrieve to the indicated location, so that the VSM has experienced a slight decay when
the VSM being retrieved. The failure of subjects SS and SL in the assessment of
Experiment 1 might also be due to a slow retrieval because they both claimed that they
could clearly see the patterns. Experiment 2 was designed to measure the time course of
retrieval for these subjects.
3.2.1 Method
Subjects. Subject SS who failed the assessment in Experiment 1 participated in
this experiment. Subject SL was not available for this experiment. Four naïve subjects
(three male, one female) within the age range 18 - 28 years were recruited by payment.
All had normal or corrected-to-normal vision.
Procedure. The standard test procedure described in section 2.1 was modified for
this experiment. The change for the test session was that some test delays are negative
which indicates the probe was presented before the display. The change for the
assessment session was that the probe bar was presented 0.5 s before the display.
Subjects RS, JS, and TD took the test for two sessions, whereas PC took additional two
sessions to see whether his performance could be further improved. Test sessions were
separated by one to two weeks.
3.2.2 Results and Discussion
Data for the four naïve subjects are presented in Figure 3.5. The time interval
between the probe and the stimulus display in a trial was measured by stimulus onset
asynchrony (SOA).

Wei Yang 57
0.25
0.50
0.75
1.00
RS JS
-1.0 -0.5 0.0 0.5 1.0
0.25
0.50
0.75
1.00TD
Pro
ba
bili
ty o
f C
orr
ec
t R
es
po
ns
e
-1.0 -0.5 0.0 0.5 1.0
SO A (s)
4th Test3rd Test2nd Test1st Test
PC
Figure 3.5. Probability of correct response as a function of the stimulus onset asynchrony
(SOA) between the stimulus and the probe bar for naïve subjects. A negative SOA indicates that
the probe bar was presented before the stimulus. The error bars represent the standard
error (n = 192) of the probabilities.
The positive SOA side of the performance for each subject was similar to the
performance of the naïve subjects presented in Figure 3.1. The response accuracy at the
shortest positive SOA ranged from 57% to 97% in the first test session and increased for
each subject in the second test session.
If the lower values of response accuracy at the shortest positive SOA were due to
slower retrieval process, presenting the probe bar ahead of the display should increase the
performance. This was the case for subjects JS and TD whose response accuracy at the
shortest positive SOA was relatively low. Because the time course of the enhancement
for the pre-cueing effect reveals the time course of retrieval for these subjects, these

Wei Yang 58
results indicate that the lower accuracy in the condition of the simultaneous presentation
of the display and probe bar is due to a slow retrieval process. The speed of retrieval
could be enhanced in the first one to two thousand trials as indicated by the data of TD.
For PC and RS, whose response accuracy at the shortest positive SOA was
relatively higher than other two subjects, presenting the bar probe right before the display
slightly improves the performance, but presenting the probe bar earlier slightly decreases
the response accuracy. This shows that the retrieval is a dynamic process: once the
retrieval process reaches a location where the information is not yet available, it cannot
be fully maintained at that location.
In conclusion, the low accuracy at short test delay for naïve subjects is at least
partly due to a slower retrieving process as indicated by the negative-SOA performance
in the first test session for TD. Such slower retrieving process could be speeded up by a
session of practice to be nearly instantaneous. Other retrieval factors such as a
misjudgment of the probed location might also contributed to the lower initial
performance in the present partial-report task because for TD and JS, presenting the bar 1
s and 0.5 s respectively did not improve their performance to a near perfect level.
3.2.1 Time Course of Retrieval for Subject SS
The results for subject SS who did not pass the assessment are shown in
Figure 3.6. The open circles show the results of SS in this experiment where the standard
stimuli were used. Positive-SOA performance was maintained at an above chance level,
indicating that a few items were transferred into WVM. The capacity of VWM for SS

Wei Yang 59
was not lower than other subjects in this experiment. The main difference between the
positive-SOA performance of SS's and other naïve subjects was the initial performance at
the short test delays. This was clearly due to a slow retrieval process which is shown by
the large improvement of the performance with more negative SOAs. Because his
performance at -0.5 s was very accurate, his poor performance in present task was not
likely due to a difficulty in judging the probed location.
-1.0 -0.5 0.0 0.5 1.0
0.25
0.50
0.75
1.00
H igher C ontrast Longer D uration
C hance Level
Pro
ba
bili
ty (
Co
rre
ct)
SO A (s)
SS
Standard Stim uli
Figure 3.6. Partial-report performance for subject SS who failed the assessment in the
standard visual sensory memory (VSM) test. A negative SOA indicates that the probe bar was
presented before the stimulus. Different symbols represent different stimuli conditions. The error
bars represent the standard error (n = 96) of the probabilities.
Subsequent tests with longer stimulus duration (200 ms) or higher contrast (90%)
did not change the general pattern. In preliminary experiments these stimulus conditions
enabled naïve subjects to pass the assessment in the standard test immediately. The
improvement of performance with pre-cueing increased to a maximum at about
SOA = -0.5 s and dropped slightly at SOA = -1 s. This pattern shows that the retrieval
process for SS takes about 0.5 s and was not able to fully maintain at the indicated

Wei Yang 60
location. The absence of VSM component in the performance is not due to lower
contrast sensitivity or inability of the subject to see the display well, because the increase
of the stimulus contrast did not improve the performance to a level comparable to other
naïve subjects.
It could be conclude that the failure of SS in the assessment of the standard test is
not due to deficits in visual perception, but a slower retrieval process. This is consistent
with his claim that he can see the patterns clearly but "just cannot remember them". Such
cases represent a small portion (about 5%) of the normal functioning people and are
probably high risky in driving because they can not efficiently respond to transient visual
scenes. Because a retrieval process involves the encoding of the orientation of the probe
bar, shifting of covert attention to the indicated location, additional tests are needed to
specify which of these processes underlying the performance is impaired.
3.3 Experiment 3: Effect of Practice on VSM Lifetime
In Experiment 1, the main difference between partial-report performance of the
practiced subjects and that of the naïve subjects was that the VSM lifetime was longer for
the practiced subjects. In addition, the initial VSM level in the practiced subjects is close
to be perfect, while only one of four in the naïve group exhibits near perfect initial VSM.
Such differences in VSM between the naïve and practiced subjects suggested that there is
a practice effect on the VSM. Long (1980) noted such a practice effect in partial-report
performance and suggested that it might account for the different results between
experiments using naïve subjects and those using practiced subjects. However, no

Wei Yang 61
experiment has been done to characterize the practice effect. Experiment 2 was to
examine the practice effect using a within subject design.
3.3.1 Method
Subjects. Four of the subjects in Experiment 1 volunteered for this experiment.
Two (YS, KB) were naïve and two (WY, LX) were practiced.
Procedure. After participating in Experiment 1, the four subjects took the
standard partial-report test repeatedly 8 times for KB, 7 times for WY, and 5 times for
LX and YS. The time interval between the test sessions ranged from 1 to 2 weeks. There
was a 1 month inter-session interval between 4th and 5th sessions for KB, and between 3rd
and 4th sessions for YS.
3.3.2 Results and Discussion
Results from the two naïve subjects and the two practiced subjects showed
different patterns and are therefore reported separately.
Results of repeated tests for naïve subjects. The results of the repeated tests for
the two naïve subjects are presented in Figure 3.7. The test in Experiment 1 was referred
to as the 1st test session. Overall performance gradually improved with repeated tests for
both subjects. An obvious difference between these two subjects were that the asymptote
was always maintained up to 1.5 s for KB while not maintained beyond 0.56 s for YS in
the first two test sessions. This indicates that YS was not able to maintain information in
VWM with full capacity beyond 0.56 s in the first two test sessions. Relatively stable
asymptotic performance was achieved after the second test session for YS.

Wei Yang 62
0.5 1.0 1.50.25
0.50
0.75
1.00
Test Delay (s)
1st (data in Exp. 1) 2nd 6th 3rd 7th 4th 8th 5th 9th
KB
Chance LevelPro
babi
lity(
corr
ect)
0.5 1.0 1.50 0
YS
Figure 3.7. Partial-report performance in repeated tests for two naïve subjects. Different
symbols represent different test sessions.
0.0
0.2
0.4
0.6
0.8
1.0
Initi
al V
SM
0.0
0.2
0.4
0.6
0.8
1.0
VS
M L
ifetim
e (s
)
1 2 3 4 5 6 7 8 902468
1012
YSKB
Test Session
Cap
acity
of
VW
M
1 2 3 4 5 6 7 8 9
"
Figure 3.8. Initial level of visual sensory memory (Pi ), lifetime of visual sensory
memory (τ ), and the capacity of visual working memory (Cw) in repeated tests for two naïve
subjects. The error bars represent the standard error of the values.

Wei Yang 63
Data of each test session were fit with the function in Equation [2.1]. VSM
lifetime (τ ) was obtained from the fits. The initial VSM (Pi), and capacity of VWM (Cw)
were deduced by equation [2.10] and [2.12] respectively. Figure 3.8 presents the change
of VSM and VWM in the repeated test sessions for these two subjects. The last two dots
in the 1st and 2nd test sessions for YS, which were caused by the failure of maintain
information in VWM with full capacity, were not included in the fitting.
The initial VSM level was continuously enhanced for YS. By contrast, for KB it
was perfect in the first test. Moreover, the lifetime of VSM significantly increased from
1st to 2nd test for YS and from 4th to 5th test for KB. Repeating the test session would
enhance the lifetime in the initial repetitions and reach a relatively stable level
afterwards. There was no significant improvement of lifetime for YS in the last four test
sessions, nor for KB in the last 5 test sessions. Although the lifetime of these two naïve
subjects reached a stable level after 2 to 3 repeated tests, the results of Experiment 10
indicates that further massive repetition would continue to enhance the lifetime up to 20
session, but the enhancement was slow.
The capacity of VWM for KB was continuously enhanced, but the enhancement
was slow and the total change was very small (less than one item). The capacity of
VWM for YS showed an unusual "U" shaped change. This was mainly caused by the
lower value in the 4th session. The large standard error for this session suggests that the
small value was caused by the deviation of the decay pattern from an exponential
function due to a failure to maintain information in VWM with full capacity.

Wei Yang 64
0 1 2 30.25
0.50
0.75
1.00
0
LX
Pro
babi
lity
(cor
rect
)
0.5 1.0 1.5Test Delays (s)
WY
Chance Level
Figure 3.9. Partial-report performance in repeated tests for two practiced subjects.
Note that the time scales in these two plots are different.
Initi
al V
SM
0.0
0.2
0.4
0.6
0.8
1.0
VS
M L
ifetim
e (s
)
0.0
0.2
0.4
0.6
0.8
1.0
1 2 3 4 5 6 7 8
Cap
acity
of
VW
M
Test Session
LX WY
1 2 3 4 5 6 7 802468
1012
Figure 3.10. Initial level of visual sensory memory (Pi), lifetime of visual sensory
memory (τ ), and capacity of visual working memory (Cw) in repeated tests for two practiced
subjects. The error bars represent the standard error of the values.
Wei Yang 65
Results of repeated tests for practiced subjects. Figure 3.9 presents the results of
the repeated tests for the two practiced subjects. The performances in the repeated tests
for the two practiced subjects were much more stable than in the two naïve subjects.
Figure 3.10 shows the two memory components underlying performances in the
repeated tests. There was no consistent significant across-sessions difference for
practiced subjects in each aspect of VSM. The VSM lifetime of all the practiced subjects
in Experiment 1 were about 0.2 s in the pilot studies when they just started participating
this project. This suggests that their lifetime had been improved by the intensive
practice. The stable performance of the two practices subjects in this experiment
indicates their performance have reached the ceiling.
3.3.3 Practice Effect on VSM Lifetime: A New Dimension of Perceptual Learning?
The VSM has been considered as a passive sensory buffer and its activation is
stimulus driven and should not be changed by experience. The observations of the
enhancement VSM lifetime in this study indicates that the time course of the VSM could
be enhanced by practice. It is not clear at this moment whether the enhancement of the
lifetime is due to the repeatedly stimulation of the visual sensory system or due to the fact
that the present task requires a longer lifetime to achieve better performance. The latter
would predict that VSM lifetime could be reduced by practicing a task where subject has
to suppress visual persistence to achieve better temporal resolution. The above two
possibilities suggest different neural mechanisms underlying the lifetime change. An
enhancement of VSM lifetime by repeated stimulation implies a change in synaptic

Wei Yang 66
efficiency or other intrinsic properties of neurons in the early sensory area merely because
of their repeated activation. The change of lifetime by task requirement implies a top-
down modulation of the early visual sensory activity by higher cortical areas. There is
evidence for a modulation of V1 activation by processing at the higher levels (e.g. Ishai
& Sagi, 1995; Kosslyn et al., 1995; Le Bihan et. al., 1993).
The enhancement of VSM lifetime with practice is consistent with the dramatic
enhancement of performance in other visual tasks by extended practice which is often
regarded as perceptual learning (e.g. Cavanagh, 1993; Sagi & Tanne, 1994). The
enhancement of lifetime reveals a new perceptual learning phenomenon and a new
dimension by which the visual sensory system could be changed with practice.
Perceptual learning has been generally characterized as specifically related to
stimulus parameters and retinal location, and shows no interocular transfer. This
suggests that visual perceptual learning involves plastic changes at very early levels in the
visual system, such as V1 where some units are monocularly driven. It could also be
specific to the attended sensory feature (Ahissar & Hochstein, 1993) which suggests that
learning could not be solely attributed to the changes of the processing in the sensory
system. The practice effects can be acquired within a single experimental session and/or
progressively from one session to the next one, often continuing to improve until
thousands of trials have been performed. The effect could be maintained for 2-3 years
(e.g. Karni & Sagi, 1993).

Wei Yang 67
The enhancement of VSM lifetime with practice shares some features of
perceptual learning revealed in other paradigms. The lifetime is rapidly increased in the
first one to two thousand trials and increased slowly with additional practice. The
improved performance was maintained for at least 3 and 8 months respectively for JM
and LX. It is not clear whether the enhanced lifetime is specific to the retinal location of
6.5° or the attended stimulus feature of orientation. Identification of these specificities
will shed light on the mechanism of the lifetime enhancement.
3.3.6 Form of VSM Decay
The mathematical form of the memory decay function has been a question of
concern for the theorists because "An important step in the evolution of science,
including the behavioral science, is the identification of lawful empirical regularities"
(Anderson & Tweney, 1997, p. 409). The decay of VSM has been widely assumed to be
exponential (e.g. Di Lollo & Dixon, 1988; Massaro & Loftus, 1997; Sperling, 1970), but
no effort was made to test this assumption. The exponential decay of auditory sensory
memory has been revealed psychophysically with the central-tendency paradigm (Lu et
al., 1992). In this section, the exact mathematical form of the VSM decay was examined
by assessing the fitness of the exponential function [2.1] to the data with very low
standard error obtained by averaging the stable performance from the repeated VSM tests
in this experiment (all the test sessions for the two practiced subjects, sessions 3-6 for
subject YS, and sessions 5-9 for KB). These results and the corresponding best-fit
exponential decays are presented in Figure 3.11.

Wei Yang 68
0.25
0.50
0.75
1.00
R2=0.997
LXP
rob
ab
ility
of
Co
rre
ct
Re
sp
on
se
R2=0.992
W Y
C hance Level
0 1 2 30.25
0.50
0.75
1.00
R2=0.996
Test D ecay (s)
YS
0 1 2 3
R2=0.992
KB
Figure 3.11. Form of visual sensory memory decay. The standard errors for the
probabilities are smaller than the symbol size. The solid lines represents the best-fit exponential
function in the form: P(t) = A + B e - t / ττττ. R 2 represents the goodness of fit. The open circle is
not included in the fit (See 3.1.2. for relevant discussion).
The quality of the fit was assessed by R2 calculated by [3.2]. The function P(t) =
A + B e - t / ττττ accounts for over 99% of the variance for the data of each subject. Such a
near-perfect fitting indicates that the initial rapid decay in partial-report performance
caused by the decay of VSM is strictly exponential.
3.4 Conclusions
1). Application of the procedure and model developed in Chapter 2 revealed the
exponential decay of VSM and characterized its lifetime for each subject. The lifetimes
for the eight subjects range from 0.07 to 0.7 s, and majority of the inter-subject
differences were due to intensive practice with the present task.
Wei Yang 69
2). A few subjects (~5%) did not exhibit the VSM component in the performance
due to a slower retrieving process. For most naïve subjects, the time course of retrieval
does not cause a problem for revealing the VSM component in their performance.
3). With repeated tests for naïve subjects, VSM lifetime exhibits a substantial
increase in the first 2000 to 3000 trials and followed by a slower enhancement and finally
reaches a ceiling of about 0.4 s (except LX, who reached 0.7 s). Such enhancement of
VSM lifetime reveals a new dimension by which perceptual learning might occur.

Wei Yang 70
CHAPTER 4. EFFECT OF STIMULUS PARAMETERS ON
THE LIFETIME OF VSM
VSM has been described as a stimulus-driven passive storage of visual
information. However, it is not clear how its lifetime is influenced by the stimulus
parameters is not clear in the previous studies. This part of the study examines which
features of stimulus influence the VSM lifetime. This was accomplished by changing the
parameters of the standard stimulus (Fig. 2.1). Such information is also needed to
identify the neural substrate of VSM. To identify a neural activity as the substrate of
VSM, it is critical to show that its lifetime is sensitive to the same stimulus parameters as
VSM.
The stimulus parameters chosen in this study were the duration and intensity of
the stimulus because there has no current agreement regarding how these parameters
affect the time course of VSM, characterizing how these parameters affect the time
course also gives us a basis for determining if similar effects are present in physiological
measures. In addition, such information will shed light on theoretical issues regarding
the relationship between VSM and visible persistence. Coltheart (1980) argued that
VSM is not visible persistence, because partial-report performance, which defines VSM,
is not affected by the stimulus duration and stimulus intensity, while visible persistence is
inversely affected by both parameters.
Previous studies assessing these effects were primarily based on the examination
of the change of overall performance, which does not necessarily indicate the change of

Wei Yang 71
the VSM lifetime. Furthermore, it was pointed out that the absence of these effects was
probably due to the lack of the sensitivity of the procedures (Long, 1984). The
experiments of this chapter exploited the standard procedure and the model developed in
Chapter 2 to assess the influences of these stimulus parameters on the VSM lifetime
specifically.
Experiment 4 examined the effect of stimulus duration on the VSM lifetime,
while experiments 5 through 9 examined the stimulus intensity effects on VSM lifetime
in detail. Previous studies of the stimulus intensity effect involved changing the
luminance of stimuli (letters and digits) relative to that of the background. Such a
manipulation changes both the contrast of the contours and the overall luminance of the
display. In this study with sinusoidal gratings, it was possible to present gratings with a
mean luminance that is the same as the background, so that it is possible to change the
contrast without changing the overall luminance. In addition, the stimulus conditions
were carefully chosen to avoid the production of a retinal afterimage, so that the partial-
report superiority could be attributed to VSM.
4.1 Experiment 4: Effect of Stimulus Duration on VSM Lifetime
The influence of stimulus duration on the time course of VSM has been assessed
by examining its effect on partial-report performance, but the results have been
inconsistent. For example, partial-report performance was not affected by stimulus
duration in Sperling (1960), Di Lollo (1978), and Yeomans & Irwin (1985), but an
inverse effect was found by Di Lollo and Dixon (1988, 1992), as well as by Dixon and Di

Wei Yang 72
Lollo (1991). What accounts for these differences is not clear. Nevertheless, the effect
of stimulus duration on VSM lifetime has not been specifically assessed in these studies.
This experiment was to examine the effect of stimulus duration in VSM lifetime.
4.1.1 Method
Subjects. Three subjects (one was the author) having intensive experience
(10,000 trials within a month) with the present task volunteered as subjects. All had
normal or corrected-to-normal vision.
Procedure. A session of trials of the standard test (section 2.1) were randomly
mixed with a second set of trials. The trials of the second set were the same as that of the
standard test except that the stimulus duration was increased to 200 ms. These two
session of trials were completed in two consecutive days.
4.1.2 Results and Conclusions
Partial-report performance for the two stimulus conditions for each subject are
presented in Figure 4.1. The performances under these two conditions was not
significantly different for LX [ t(6) = 1.24, p > 0.10 ] and WY [ t(6) = -2.21, 0.01 > p >
0.05 ], but was significant for JM [ t(6) = 3.51, p < 0.05 ], with the performance being
more accurate for stimuli of short duration, especially at the short test delays. The results
for JM showed an inverse stimulus duration effect on partial-report performance.

Wei Yang 73
0.25
0.50
0.75
1.00
"
LX
0.25
0.50
0.75
1.00P
rob
ab
ility
of
Co
rre
ct
Re
sp
on
se
WY
0.0 0.5 1.0 1.50.25
0.50
0.75
1.00
Test D elay (s)
D uration = 28 m s
D uration = 200 m s""""""
"
JM
Figure 4.1. Effect of stimulus duration on partial-report performance for three subjects.
The solid and dashed lines represent the best-fit exponential function for performance in the short
and long stimulus duration respectively.
0.0
0.5
1.0
WY
Initi
al V
SM
0.0
0.5
1.0
WY
VS
M L
ifetim
e (s
)
0
4
8
12
*
*
Subject
JM JMLXLX
Duration = 200 ms
WY JMLX
Duration = 28 ms
Cap
acity
of
VW
M
Figure 4.2. Effect of stimulus duration on initial level of visual sensory memory (Pi),
lifetime of visual sensory memory (τ ), and capacity of visual working memory (Cw). Error bars
represent the standard error of the values.

Wei Yang 74
The specific effects of stimulus duration on the VSM and VWM are presented by
contrasting the parameters of these two memories for stimulus of different duration for
each subjects in Figure 4.2. The parameters were deduced from the model introduced in
section 2.1.
For subject LX and WY, there was no significant effect of stimulus duration on
any of the three parameters. For JM, a significant inverse effect was found for the initial
level of VSM (z = 9.23, p < 0.05) and capacity of VWM (z = 2.63, p < 0.05). The
stimulus duration effect on the VSM lifetime of JM was not significant (z = -1.50, 0.01 >
p > 0.05).
In conclusion, increasing the stimulus duration from 28 ms to 200 ms had a
significant effect on partial-report performance for one of three subjects. The effect for
this subject was specific to a large reduction of initial VSM level and a small reduction
for the capacity of VWM. What led to this individual difference is unknown. Such
results call attention to individual differences in partial-report studies.
The inverse intensity effect on partial-report performance for JM is consistent
with some reports of such effects presented in group data (Di Lollo & Dixon, 1988, 1992;
Dixon and Di Lollo, 1991). Because individual data were not reported in the above-cited
studies, it is not clear whether such an inverse duration effect on the overall performance
was also specific to some subjects in these studies.
For subject JM of this experiment, a significant decrement of initial VSM level by
increasing stimulus duration was accompanied by an increment of VSM lifetime.

Wei Yang 75
Although the lifetime increment was not significant, the opposite direction of the changes
indicates that it is not appropriate to assess the time course of VSM by examining the
overall performance level.
4.2 Experiment 5: Effect of Stimulus Contrast on VSM Lifetime
This experiment examined the effect of changing the contrast of the sinusoidal
gratings while maintaining the mean luminance of the stimuli remained the same as that
of the background. In this case, the presentation of either the low and high contrast
stimuli involves no change in overall luminance.
4.2.1 Method
Subjects. Four subjects with intensive experience in the present task volunteered
for this experiment. All had normal or corrected-to-normal vision.
Procedure. A session of trials of the standard test (section 2.1) were randomly
mixed with a second set of trials. The trials of the second set were the same as that of the
standard test except that the contrast of the gratings was increased to 90% while the mean
luminance of the gratings was maintained the same as the background. These two
session of trials were completed in two consecutive days.
4.2.2 Results and Conclusions
Partial-report performance for stimuli of different contrast are presented in Figure
4.3 by plotting the probability of a correct response against the test delay.

Wei Yang 76
0.25
0.50
0.75
1.00
LX
WY
0.0 0.5 1.0 1.50.25
0.50
0.75
1.00
Contrast = 20%
Contrast = 90%
Chance Level
JH
Pro
ba
bili
ty o
f C
orr
ect
Re
spo
nse
Test Delay (s)
0.0 0.5 1.0 1.5
JM
Figure 4.3. Effect of stimulus contrast on partial-report performance. Trials with stimuli
of different contrast were mixed in a test session. The solid and dashed lines represent the best-
fit function for contrasts of 20% and 90% respectively.
0.0
0.5
1.0
Initi
al V
SM
0.0
0.5
1.0
VS
M L
ifetim
e (s
)
0
4
8
12
***
Subject
JM JM JHJHWY WYLX LX
Contrast = 90%
WY JH JMLX
Contrast = 20%
Cap
acity
of
VW
M
Figure 4.4. Effect of stimulus contrast on initial level of visual sensory memory (Pi),
lifetime of visual sensory memory (τ ), and capacity of visual working memory (Cw). Trials with
stimuli of different contrast were mixed in a test session. Error bars represent the standard error
of values.

Wei Yang 77
The effect of stimulus contrast on partial-report performance was significant for
LX [ t (6) = 2.511, p < 0.05] and JM [t (6) = 3.417, p < 0.05], but not significant for WY
[ t (6) = 1.381, p > 0.10] and JH [t (5) = -0.635, p > 0.10].
The specific effects of stimulus contrast on VSM and VWM are presented by
contrasting the parameters for these two memories in the two experimental conditions for
each subject as shown in Figure 4.4. The parameters were deduced from the model
introduced in section 2.1.
Contrast effect on initial VSM. Although there was a consistent slight
enhancement of initial VSM level by increasing the stimulus contrast for all subjects, the
effect was not significant for either the group data [ t (3) = -2.54, 0.10 > p > 0.05] or for
each subject ( z = -0.33, p > 0.10 for LX; z = -1.07, p > 0.10 for WY; z = -1.17, p > 0.10
for JH; and z = -0.14, 0.10 > p > 0.05 for JM). The 20% stimuli were clearly visible for
each subject in the assessment before the test, but subjects reported that the stimuli were
invisible in a few trials. The 90% contrast stimuli were always clearly visible. Thus, the
small enhancement of contrast is consistent with the enhancement of the visibility of the
stimuli by increasing the contrast of the gratings.
Contrast effect on VSM lifetime. Although there was a consistent slight
decrement of VSM lifetime by increasing the stimulus contrast for each subject, the
effect was not significant for either the group data [ t (3) = 1.38, p > 0.10] or for each
subject ( z = 1.23, p > 0.10 for LX; z = -0.05, p > 0.10 for WY; z = 0.68, p > 0.10 for JH;

Wei Yang 78
and z = -0.2, p > 0.10 for JM). This indicates that increasing stimulus contrast slightly
shortens the VSM lifetime, but the effect was too small to reach a significant level.
Contrast effect on the capacity of VWM. The effect of stimulus contrast on the
capacity of VWM was not consistent across subjects. There was a significant decrement
of CW by enhancing contrast for WY (z = 2.27, p < 0.05) and JM ( z = 3.13, p < 0.05), but
there was a significant increment effect for JH ( z = -1.69, p < 0.05). There was no
significant effect for LX ( z = 0.18, p > 0.10).
Therefore, increasing the stimulus contrast from 20% to 90% causes a small but
significant enhancement in partial-report performance for two of four subjects. It also
has a small decrement effect on VSM lifetime for each of four subjects, but the effect was
too small to be significant. It also produces small but significant effects on VWM for
three of four subjects, but the direction of the effect for these subjects was not consistent.
It should be noted that further decrease of the contrast resulted in a larger number
of trials in which the display was not visible, and the data were much more variable.
Thus, the contrast range used in this experiment covered the range that provides clear
visibility and stable performance.
4.3 Experiment 6: Effect of Luminance Increase on VSM Lifetime
This experiment examined the effect of the overall luminance change in the
stimuli on partial-report performance and the underlying memories. In this experiment,
the performance for the equal-luminance stimuli which involve no change in overall
Wei Yang 79
luminance upon presentation was compared with that for higher-luminance stimuli which
involve a transient increment of the overall luminance upon stimulus presentation.
4.3.1 Method
Subjects. Four subjects with intensive experience with the present task
volunteered as subjects for this experiment. All had normal or corrected-to-normal
vision.
Procedure. A session of trials of the standard test (section 2.1) were randomly
mixed with a second set of trials. The trials of the second set were the same as that of the
standard test except that the mean luminance of the gratings was increased by 6.5 cd/m2.
Thus the mean luminance of the gratings was 6.5 cd/m2 above that of the background.
These two session of trials were completed in two consecutive days.
It should be noted that the contrast of the gratings was slightly changed by
luminance increase; however, it was shown in Exp. 5 that such a contrast change had no
significant effect on any aspect of the performance. Thus, these two stimulus conditions
mainly differ whether the stimulus presentation involve an overall luminance change.
4.3.2 Results and Conclusions
Partial-report performances for the two stimulus conditions for each subject are
presented in Figure 4.5 by plotting the probability of a correct response against test delay.
The increment of the mean luminance of the gratings decreased the overall partial- report
performance for each of four subjects (z = 3.22, p < 0.05 for LX; z = 8.67, p < 0.05 for
WY; z = 10.0, p < 0.05 for JH; and z = 3.22, p < 0.05 for JM).

Wei Yang 80
0.25
0.50
0.75
1.00
LX
W Y
0.0 0.5 1.0 1.5 2.00.25
0.50
0.75
1.00
Test D elays (s)
Equal Lum inance
Higher Lum inance
Chance Level
JH
Pro
ba
bili
ty o
f C
orr
ec
t R
es
po
ns
e
0 .0 0.5 1.0 1.5 2.0
JM
Figure 4.5. Effect of luminance increase on partial-report performance. Trials with
stimuli of different luminance were mixed in a test session. The solid and dashed lines represent
the best-fit exponential function for the performance of equal-luminance and higher-luminance
stimuli respectively. Error bars represent the standard error of the probabilities.
0.0
0.5
1.0
**
Initi
al V
SM
0.0
0.5
1.0
1.5
**
VS
M L
ifetim
e (s
)
0
4
8
12
*
*
Subject
JMJM JHJH WYWY LXLX
Higher Luminance
WY JH JMLX
Equal Luminance
Ca
paci
ty o
f V
WM
Figure 4.6. Effect of luminance increase on initial level of visual sensory memory (Pi),
lifetime of visual sensory memory (τ ), and capacity of visual working memory (Cw). Trials with
stimuli of different luminance were mixed in a test session. Error bars represent the standard
error of the values.

Wei Yang 81
The specific effects of luminance increase on VSM and VWM are presented in
Figure 4.6 by contrasting the parameters of these memories in the two conditions for each
subject. The parameters were deduced from the model introduced in section 2.1.
Effect of a luminance increment on initial VSM. There was a consistent slight
decrement of initial VSM level by increasing stimulus luminance for each subject. The
effect was significant for WY ( z = 4.24, p < 0.05) and JH ( z = 2.94, p < 0.05), but not
significant for LX ( z = 0.59, p > 0.10) and JM ( z = 0.23, p > 0.10). This indicates that
an increment of stimulus luminance relative to the background slightly decreases the
initial VSM level, although the effect was too small to be significant for each subjects.
Effect of a luminance increment on VSM lifetime. Although there was a
consistent decrement effect on VSM lifetime by increasing the stimulus luminance above
the background for each subject, the effect was large and significant for LX ( z = 4.77,
p < 0.05 ) and JM ( z = 3.18, p < 0.05 ), not significant for WY ( z = 0.63, p > 0.10 ) and
JH( z = 1.41, 0.10 > p > 0.05 ). This indicates that increasing the stimulus luminance
above the background shortens VSM lifetime for some subjects, but not for others in this
experimental condition.
Effect of a luminance increment on the capacity of VWM. There was no
consistent effect of luminance increment on the capacity of VWM for these subjects.
There was a significant decrement of VWM capacity by enhancing luminance for WY (z
= 14.44, p < 0.05) and JH ( z = 4.16, p < 0.05), but a significant increment effect for

Wei Yang 82
LX ( z = -1.72, p < 0.05). There was no significant effect for JM ( z = -0.03, p > 0.10).
The effect on the group was not significant [ t (3) = 0.776, p > 0.10].
In conclusion, the effect of a luminance increase on the two memories was not
consistent for these four subjects: it reduces the initial VSM level and VWM and leaves
VSM lifetime unaffected for two subjects (WY and JH), but decreases the VSM lifetime
and leaves the initial VSM level and VWM unaffected for the other two subjects (LX and
JM).
Particularly striking was that the luminance increment markedly reduced the VSM
lifetime for two subjects (LX and JM), but not for the other two (WY and JH). The VSM
lifetimes for the higher luminance stimuli for WY and JH are, however, significantly
shorter than for the equal luminance stimuli tested in Experiment 1. This indicates that
the absence of the inverse luminance effect for WY and JH in this experiment was due to
the fact that the lifetimes for the equal luminance stimuli are shortened by being mixed
with the higher luminance stimuli for subjects WY and JH.
4.4 Experiment 7: Effect of Luminance Increase on VSM Lifetime: Separate Tests
Experiment 7 was to measure the VSM lifetime for higher luminance stimuli
when they were not mixed with the isoluminant stimuli. The results will be compared
with the performance for equal-luminance stimuli tested separately in previous
experiments to assess the effect of a luminance increase without interactions.

Wei Yang 83
4.4.1 Method
Subjects. Three of the four subjects of Experiment 6 volunteered as subjects for
this experiment. All had normal or corrected-to-normal vision.
Procedure. The procedure was the same as the standard test (section 2.1) except
that the mean luminance of the gratings was increased by 6.5 cd/m2. Thus the mean
luminance of the gratings was 6.5 cd/m2 above that of the background.
4.4.2 Results and Conclusions
0.25
0.50
0.75
1.00
LX
0.25
0.50
0.75
1.00
WY
0 1 2 30.25
0.50
0.75
1.00
Test Delay (s)
Equal LuminanceHigher Luminance
JHPro
babi
lity
of C
orre
ct R
espo
nse
Figure 4.7. Effect of luminance increase on partial-report performance in separate tests.
The solid and dashed lines represent the best-fit exponential function for the equal-luminance and
higher-luminance stimuli respectively. Error bars represent the standard errors for the values.
The standard error for the dots with no error bar is smaller than the symbol size.

Wei Yang 84
Partial-report performances for the higher luminance stimuli when they were
tested separately are presented in Figure 4.7. These performances were compared with
the performances for the equal-luminance stimuli (Figure 2.1) in separate test sessions for
each subject. The equal luminance data for LX and WY were from Figure 3.11 and from
Figure 2.1 for JH.
The results were similar to those of Experiment 6: a significant effect of the
luminance increase on performance was found for each subject. The specific effect on
VSM and VWM were presented by contrasting the parameters of these memories in the
two stimulus conditions for each subject as shown in Figure 4.8. The parameters were
deduced from the model developed in section 2.1.
0.0
0.5
1.0 **
Initi
al V
SM
0.0
0.5
1.0
***
VS
M L
ifetim
e (s
)
0
4
8
12
***
*
Subject
JHJH WYWYLX LX WY JHLX
Equal LuminanceHigher Luminance
Cap
acity
of
VW
M
Figure 4.8. Effect of luminance increase on initial level of visual sensory memory (Pi),
lifetime of visual sensory memory (τ ), and capacity of visual working memory (Cw). Stimuli of
different luminance were tested in separate test sessions. Error bars represent the standard error
of the values.
When the equal-luminance and higher-luminance stimuli were separately tested in
different sessions, there was a consistently significant decrement of initial VSM level
with an enhanced stimulus luminance for LX ( z = 2.24, p < 0.05), WY ( z = 1.90, p <

Wei Yang 85
0.05), and JH ( z = 4.47, p < 0.05). Enhancing the stimuli luminance above the
background significantly reduces VSM lifetime for LX ( z = 11.93, p < 0.05), WY ( z =
7.01, p < 0.05), and JH ( z = 8.05, p < 0.05). Enhancing the stimulus luminance also
significantly reduces VWM capacity for LX ( z = 2.48, p < 0.05), WY ( z = 4.19,
p < 0.05), and JH ( z = 8.05, p < 0.05).
In conclusion, when the two types of stimuli were used in separate test sessions,
an increase in the mean luminance of the gratings significantly decreases initial VSM
level, VSM lifetime, and VWM capacity for each of the three subjects.
4.4.3 Possible Mechanisms for the Effect of a Luminance Increase on VSM Lifetime
A slight increase of the mean luminance of the standard stimuli (Figure 2.1)
above that of the background shortens the VSM lifetime for each of the three subjects in
this experiment. As shown in Experiment 6, it also shortens the VSM lifetime for the
standard equal-luminance stimuli if trials of these two types of stimuli were mixed in a
test session. These results suggest that the presentation of the higher-luminance stimuli
increases the adaptation level of the visual system and shortens the lifetime of the sensory
memory system in general. This is called the adaptation hypothesis.
The adaptation hypothesis suggests that the VSM lifetime is determined by the
adaptation level of the system. It is equally possible that the VSM lifetime is under the
influence of the stimulus properties. Specifically, the luminance increase effect might be
due to the shift of the spatial frequency channels in the visual pathway (Graham, 1981;
Legge, 1978; Shapley & Lennie, 1995). When the mean luminance of the gratings was

Wei Yang 86
increased, the power of the lower spatial frequency components in the stimuli was largely
enhanced. Thus, the processing of information was shifted toward the low spatial
frequency channels which are more transient in temporal dynamics, thus resulting in a
shorter lifetime. This is called the spatial-frequency channel hypothesis.
Both mechanisms are consistent with the weak effect of a contrast change as
observed in Experiment 5. According to the adaptation hypothesis, changing the contrast
while maintaining the overall luminance the same as the background does not change the
adaptation level of the system, thus the lifetime of the sensory system is not changed.
The weak inverse contrast effect might be due to the possibility that the contrast change
slightly changes the adaptation level due to the nonlinearity in the subjective scaling of
luminance. According to the spatial-frequency channel hypothesis, changing the contrast
of the sinusoidal gratings primarily enhances the power of the spatial frequency of those
gratings which are the main components in the spatial frequency spectrum of the stimuli.
Therefore, the peak of the spatial frequency spectrum is not shifted, thus the lifetime of
the coherent activity of the channels involved remain unchanged. However, the low
spatial frequency components defining the global spatial arrangement of the display is
enhanced, which results in a slight increase in the power of the low spatial frequency
components in the display and produces the small decrement of VSM lifetime.
However, these two hypotheses have opposite predictions for the change in VSM
lifetime when the mean luminance of the standard stimuli is decreased below the
background. The adaptation hypothesis predicts that a luminance decrease has an

Wei Yang 87
opposite effect on the lifetime than a luminance increase because these manipulations
drive the adaptation level in opposite directions. The spatial-frequency channel
hypothesis predicts that the luminance decrease has the same effect on the lifetime as a
luminance increase, because either an increase or decrease of the mean luminance of the
isoluminant standard stimuli equally enhance the power of the very low spatial frequency
components. The following experiment will test these hypotheses.
4.5 Experiment 8: Effect of Luminance Decrease on VSM Lifetime: Separate Test
This experiment further explored the mechanism for the effect of luminance
change on the VSM lifetime. As discussed in Experiment 7, the adaptation hypothesis
and the spatial-frequency channel hypothesis have different predictions for the effect of a
luminance decrease on the lifetime of VSM. This experiment tested these hypotheses by
examining the effect of a luminance decrease on the VSM lifetime.
4.5.1 Method
Subjects. Two of the three subjects in Experiment 7 volunteered as subjects for
this experiment. All had normal or corrected-to-normal vision.
Procedure. The procedure was the same as the standard test (section 2.1) except
that the mean luminance of the gratings was decreased by 6.5 cd/m2. Thus the mean
luminance of the gratings was 6.5 cd/m2 below that of the background.

Wei Yang 88
4.5.2 Results and Conclusions
Partial-report performance for stimuli of lower luminance are presented in Figure
4.9. Also presented in the figures are the data for the equal-luminance stimuli presented
in Figure 3.11 for these two subjects.
0 1 2 30.25
0.50
0.75
1.00
Test Delay (s)
Lower Luminance
Pro
babi
lty (
Cor
rect
)
LX
0 1 2 3
Equal LuminanceWY
Figure 4.9. Effect of luminance decrease on partial-report performance in separate tests.
The solid and dashed lines represent the best-fit exponential function for the equal-luminance and
the lower-luminance stimuli respectively. Error bars represent the standard error for the values.
The standard errors for the equal luminance data averaged over several test sessions are smaller
than the symbol size.
0.0
0.5
1.0
Initi
al V
SM
0.0
0.5
1.0
*
*
VS
M L
ifetim
e (s
)
0
4
8
12
*
**
SubjectWYWYLX LX WYLX
Equal LuminanceLower Luminance
Cap
acity
of
VW
M
Figure 4.10. Effect of luminance decrease on initial level of visual sensory memory Pi),
lifetime of visual sensory memory (τ ), and capacity of visual working memory (Cw). Stimuli of
different luminance were tested in separate sessions. Error bars represent the standard error of
the values.

Wei Yang 89
A luminance decrease clearly produces a significant effect on partial-report
performance for both subjects. The specific effect on VSM and VWM are presented in
Figure 4.10 by contrasting the parameters for these memories in the two stimulus
conditions for each subject. The parameters were deduced from the model introduced in
section 2.1.
A decrement of the grating luminance below the background significantly
decreased initial VSM level for both LX (z = 1.70, p < 0.05) and WY (z = 2.53, p < 0.05).
This is similar to the effect of a luminance increase. Both manipulations enhance the
power of the low spatial frequency components defining the global structure of the
display, which is the large circle formed by the 12 grating patches. These similar effects
suggest a competition between the different stimulus features composed of different
spatial frequency components.
A luminance decrement also significantly decreases the VSM lifetime for both
LX ( z = 2.63, p < 0.05) and WY ( z = 1.79, p < 0.05). The decrements of the lifetimes
was 0.2 s for LX was and 0.08 s for WY, with the mean of 0.14 s, which was about half
of the mean lifetime reduction of 0.31 s caused by a luminance increase for the same
subjects in Experiment 7.
A luminance decrease has a significant inverse effect on the capacity of VWM for
WY ( z = 8.81, p < 0.05), but it was not significant for LX ( z = 1.39, 0.10 > p > 0.05).
In conclusion, the effect of a luminance decrement on the VSM was similar to
that of luminance increment: It decreases its initial level and shortens it lifetime. The

Wei Yang 90
results of this experiment confirm the prediction of the spatial-frequency channel
hypothesis. However, this decrement effect was about half of that caused by the
increasing the mean luminance of the isoluminant standard stimuli above that of the
background. It seems that adaptation also plays a role in these experiments, partially
canceling the effect caused by the spatial-frequency mechanism. These data suggest that
both mechanisms jointly influence the VSM lifetime, but the spatial-frequency
mechanism dominates in the specific experimental conditions of this study.
4.6 Experiment 9: Effect of Stimulus Contrast on VSM Lifetime: Separate Tests
This experiment examined the effect of a contrast change on VSM lifetime when
stimuli of different contrast were tested in separate sessions.
4.6.1 Method
Subjects. Two of the four subjects of Experiment 2 volunteered as subjects for
this experiment. All had normal or corrected-to-normal vision.
Procedure. The procedure was the same as the standard test (section 2.1) except
that the mean luminance of the gratings was decreased by 6.5 cd/m2.
4.6.2 Results and Conclusions
Partial-report performance for stimuli of high contrast are presented in Figure
4.11. Also presented in the figure are the data for the standard stimuli with lower
contrast as presented in Figure 3.11.

Wei Yang 91
0 1 2 30.25
0.50
0.75
1.00
Contrast = 90%
LX
0 1 2 3
Test Delay (s)
Pro
babi
lity(
Cor
rect
)
Contrast = 20%
WY
Figure 4.11. Effect of stimulus contrast on partial-report performance in separate tests.
The solid and dashed lines represent the best-fit exponential function for the contrast of 20% and
90% respectively.
The effect of increasing the stimulus contrast has no influence on partial-report
performance for LX [ t (6) = 0.53, p > 0.05], but it decreases the overall performance
significantly for subject WY [ t (6) = 2.97, p < 0.05]. The effect specific to VSM and
VWM are presented by contrasting the three parameters for these memories in the two
experimental conditions for each subject in Figure 4.12. The parameters were deduced
from the model introduced in section 2.1.
0.0
0.5
1.0 *
"
Initi
al V
SM
0.0
0.5
1.0
*
"
VS
M L
ifetim
e (s
)
0
4
8
12
*
Subject
Contrast = 90%
WYWY LXLX WYLX
Contrast = 20%
Cap
acity
of
VW
M
Figure 4.12. Effect of stimulus contrast on initial level of visual sensory memory (Pi),
lifetime of visual sensory memory (τ ), and capacity of visual working memory (Cw). Stimuli of
different contrast were tested in separate sessions. Error bars represent the standard error of
values.

Wei Yang 92
Contrast effect on initial VSM. Enhancement of the stimulus contrast increases
the initial VSM for both subjects: The enhancement was significant for WY ( z = -6.36, p
< 0.05) but not significant for LX ( z = -1.34, 0.10 > p > 0.05). The latter was probably
due to the fact that the initial VSM level for the equal luminance stimuli was close to
perfect so that there was no opportunity to improve. As shown in Experiment 1, WY had
a lower initial VSM level than the other practiced subjects, and a detailed examination of
the data suggests that he had difficulty in perceiving the items at locations corresponding
to 7 and 11 o'clock. The significant improvement of the initial VSM level in this
experiment indicates that his deficit in perceiving items at these two locations could be
largely remedied by enhancing the stimulus contrast. This suggests that the difficult at
these two locations was probably due to a higher contrast threshold.
Contrast effect on VSM lifetime. There was a consistent slight decrement of
VSM lifetime for LX and WY. The effect was significant for WY( z = 2.24, p < 0.05),
but not for LX ( z = 1.54, 0.10 > p > 0.05).
Contrast effect on VWM. There was a consistent slight decrement effect on
VWM by enhancing the stimulus contrast; the effect was significant for WY( z = 5.76, p
< 0.05), but not for LX ( z = -0.87, p > 0.10).
In conclusion, the results of this study are consistent with those of Experiment 2
where the trials with high and low contrast stimuli were mixed in a test session: Further
enhancement of the contrast of a clearly visible stimulus has no consistent effect on the
two memories underlying the performance. Although a significant effect of increasing
Wei Yang 93
the stimulus contrast on VSM lifetime was obtained only for WY in this experiment, the
direction of this effect was the same for all the subjects in this experiment and
Experiment 2. The decrement of the VSM lifetime caused by the contrast enhancement
was about only 1/4 of that caused by luminance increment in Experiment 7. It should be
noted that the change of contrast from 20% to 90% almost covered the range of the
clearly visible patterns with a presentation duration of 28 ms, while the luminance change
was about only 16% from the background. Thus, the critical variable for the inverse
stimulus intensity effect is the change of overall luminance.
4.7 Conclusions
For the standard stimuli (Figure 2.1), an increase in presentation time from 28 ms to
200 ms does not affect VSM lifetime; increasing the contrast of gratings from 20% to
90% while maintaining its mean luminance the same as the background slightly reduces
the VSM lifetime, but the effect was too small to be significant for each subject; a slight
change in the mean luminance of the gratings above or below the background largely
reduces the VSM lifetime for each subject. Such luminance effect might be due to the
different temporal properties of the spatial frequency channels in the visual pathway.

Wei Yang 94
CHAPTER 5. NEURAL SUBSTRATE OF VISUAL SENSORY MEMORY
This part of the study examines the neural basis for VSM by assessing the
correspondence between its lifetime and the lifetimes of cortical activation traces
established by the same visual pattern. Although a cortical source for VSM has been
implied by some psychophysical studies (see Breitmeyer, 1984 for a review), no direct
physiological evidence was provided, and the specific cortical area remained to be
identified.
5.1 Current Studies of Memories in the Brain
Investigations of memory functions in the human brain have been focused on the
changes in synapse efficacy (Bliss et al., 1993; Hawkins et al., 1993), and the early neural
network models simulate memory functions by changes in synaptic strength (Churchland
& Sejnowski, 1992). Recently, it was proposed that memory may well be represented by
the intrinsic membrane properties of neurons (Marder et al.,1996). Thus, memory in
networks may result from an ongoing interplay between changes in synaptic efficacy and
intrinsic membrane properties.
Experimental studies of memory functions in the human cortex have primarily
been based on relatively noninvasive brain imaging techniques like fMRI or PET. Due to
the limited temporal resolution of these techniques, these memory function studies focus
on the long-term explicit or implicit memories lasting from days to years (e.g., Squire &
Knowlton, 1995) and short-term working memory lasting for seconds to tens of seconds
(e.g., Desimone et al., 1995). Because of the highly transient nature of VSM neither

Wei Yang 95
fMRI nor PET are appropriate tools. Crick and Koch (1990) have referred to iconic
memory, the classic concept of VSM, as a "more transient awareness" or "fleeting
awareness", and acknowledged that as"…this appears very difficult to study, we should
say nothing more about it".
Crick and Koch (1990) suggested that iconic memory is a rapid synaptic
modification which always involves the continued firing of relevant neurons, with the
likely involvement of reverberatory circuits of neurons of some sort or another.
Grossberg and Mingolla (1985) suggested that visible persistence may be due to the
persistence of reverberating activation beyond stimulus offset, which is probably
generated by excitatory feedback loops. Such ideas were further pursued to simulate
visible persistence by Francis and his colleagues (Francis, 1996a; Francis, 1996b; Francis
& Grossberg, 1996; Francis, Grossberg, & Mingolla, 1994).
5.2 Approaches to the Temporal Properties of Visual Cortical Activation
5.2.1 Temporal Tuning
The responsiveness or the sensitivity of visual cortical neurons as a function of
the temporal frequency of sinusoidally modulated stimuli have been extensively
investigated to characterize the visual system's response properties (e.g. De Valois et al.,
1982; Hawken, Shapley, & Grosof, 1996; Lennie et al., 1990). The V1 cells that show
band-pass temporal-frequency tuning have been suggested to be the neural substrate of
the band-pass temporal frequency channels inferred from psychophysics.

Wei Yang 96
However, the relationship between these temporal properties measured by
temporal-frequency tuning and the time course of VSM has not been studied. It was
noted by Graham (1981) that if the system under consideration is linear, or approximately
linear, the time course of the persistence of the sensory response is revealed by the region
exhibiting the low-temporal-frequency decline.
5.2.2 Persistence of Firing
It is a common observation that the firing of neurons following a brief stimulus
can persist for short period beyond the stimulus offset. The relationship between the time
course of firing persistence and visible persistence has been assessed by Duysens et al.
(1985). They measured the firing rate of cortical cells in area 17 of the cat elicited by a
stationary light bar flashed for different duration. They found that 13 out of 72 cells with
non-overlapping On and Off subregions were able to respond to the briefest On stimulus
(12.5 ms) for low and moderate contrasts. The responses of these cells outlasted the brief
On stimuli, and this neural persistence increased as the On duration was shortened,
mimicking the inverse duration effect of visible persistence.
5.2.3 Synchronization
Fries et al. (1997) proposed that the synchronicity of the firing rather than the
amplitude of the firing rate in the primary visual cortex is correlated with visual
perception. This conclusion was based on their observation that in visual area 17 of
awake strabismic cats, dynamic selection and suppression of sensory signals are
associated with modifications of the synchrony rather than the rate of neuronal

Wei Yang 97
discharges. By contrast, only a small percentage of neurons in the primary visual cortex
in the awake monkey change their rate of discharge as a function of the perceptual state
in a rivalry situation (Leopold & Logothetis, 1996).
Synchronization in visual cortex has been proposed to serve as the mechanism for
feature linking within separate regions of cortex (Gray et al., 1992; Singer & Gray, 1995).
It is conceivable that the continued synchronization after stimulus termination supports
the VSM function. The duration of the synchronized response lasts from 100 to 900 ms
(Gray et al., 1992). Recent studies have shown that the synchronization in human visual
cortex could be measured by EEG and MEG recordings (Ribary et al., 1991; Tallon-
Baudry et al., 1997). However, the existence and the functional role of these oscillatory
synchronization remain controversial (Ghose & Freeman, 1992; Tovee & Rolls, 1992;
Young et al., 1992). Any correlation between VSM and synchronized activity in the
visual cortex is has yet to be established.
5.2.4 Activation Traces Deduced from the Habituation of Evoked Responses
A noninvasive method to characterize cortical activation traces in human brain
was developed by Lu et al. (1992) with the magnetic source imaging (MSI) technique,
which reveals intracellular cortical currents of coherently active populations of cells in
the cerebral cortex. They found that the amplitude of an auditory evoked response in the
primary auditory cortex follows the function: A(1-e-ISI/ ττττ), where ISI is the interstimulus
interval, τ is the lifetime for the activation trace, and A is the maximum response
amplitude achieved for very long ISIs. They assumed that the observed evoked response

Wei Yang 98
is the amount of input needed to recharge the activation trace to its full strength. Thus,
this habituation function is complementary to the decay of the activation trace.
Lu et al. (1992) found that the lifetime of the activation trace in the primary
auditory cortex elicited by a brief auditory stimulus accurately predicted the lifetime of
auditory sensory memory (echoic memory) determined psychophysically for each of four
subjects. This result suggests that the activation traces in different cortical regions serve
various memory functions.
With the same paradigm, Uusitalo, Williamson and Seppa (1997) characterized
the diverse cortical activation traces established by responses to a brief visual stimulus.
The lifetime for the activation trace in cortical area V1 was 0.19 ± 0.03 and 0.29 ± 0.05s
for two subjects respectively, and the activation traces in functionally higher cortical
areas exhibited progressively longer lifetimes, with the longest lifetimes attaining 19 s in
frontal cortex and 24 s in the parietal-occipital region.
5.3 Primary Visual Cortex (V1) and VSM
The V1 lifetimes 0.19 ± 0.03 to 0.29 ± 0.05s for the two subjects in Uusitalo,
Williamson and Seppa (1997) are comparable to the time course of VSM in the previous
studies (e.g. Sperling, 1960) and the results of this study. The mean VSM lifetime for the
naïve subjects in Experiment 1 and other pilot studies for their first test session was 0.17
s. This correspondence led to the hypothesis that the activation trace in V1 serves as the
neural substrate for VSM.

Wei Yang 99
In additional to a comparable time course, other similarities between V1
characteristics and that of VSM suggest that they are related. First, V1 is the first stage
of cortical processing of visual information, which is prior to the stages of recognition
and categorization. Second, it is the only cortical area that is free from the competition of
multiple items for further processing because of its relatively small receptive field of
about 0.2° (e.g., Boussaoud et al.,1991). It was found that when multiple items are
presented within the receptive field of a cell (which could be accomplished in only V2
and V4), the cell's response is strongly influenced by which item is attended (Luck et al,
1997; Moran and Desimone, 1985). Thus, the small receptive field of V1 provides it
with a large capacity to faithfully represent the detailed visual information which is
necessary for vivid visual experience.
The next two experiments were to test the hypothesis that the activation trace in
V1 is the neural mechanism for VSM. The strategy was to assess the correlation between
the VSM lifetime and V1 lifetime.
5.4 Experiment 10: Individual Differences in V1 Lifetime
This experiment applied the habituation paradigm to VEP recordings to deduce
the lifetime of the activation trace in V1 for the subjects whose VSM lifetimes were
known. The correlation between the V1 lifetime and VSM lifetime in these subjects was
assessed. A significant positive correlation would support the hypothesis that the
activation trace in V1 serves VSM.

Wei Yang 100
5.4.1 Method
Subjects. Subjects were those involved in Experiment 1. For subjects SH, HG,
and KB, the V1 lifetime was measured right after the psychophysical test of their VSM
lifetime in Experiment 1. For subject YS, the V1 lifetime was measured only after the
intensive practice. For the other subjects had tested for VSM lifetime repeatedly, the V1
lifetimes were measured in a separate day with an interval of one to three days relative to
the corresponding VSM lifetime measurement. To assess the intensive practice on V1
lifetime within a subject, a subject (JT) was recruited to repeatedly take the standard
VSM test as described in section 2.1 and the V1 lifetime was measured at the early stage
of practice and at the end of the intensive tests.
Apparatus and stimuli. The device for visual stimulation and the viewing
conditions were the same as the standard VSM test described in section 2.1. Only one
visual display was used for the habituation measurement, and it was the standard stimulus
illustrated in Figure 2.1.
The VEP data acquisition system was assembled by the author with an amplifier
(Grass, Model 12B-32), a Pentium-133 PC and an analog-to-digital (AD) board. The
data acquisition and analysis were controlled by programs written by the author in a
graphic programming language, LabView. The AD board and LabView are products of
National Instrument (http://www.natinst.com/). The system was synchronized by sending
a rectangular trigger signal of 5 ms duration from the stimulus presentation PC to the
VEP data acquisition PC. The temporal resolution, amplification and synchronization of

Wei Yang 101
the system were carefully calibrated before this experiment was conducted. The filter
band-pass was set to be 0.01-100 Hz. The electrode positions were at O1, O, O2, with
Cz as reference according to the 10-20 EEG system (Jasper, 1958).
Procedure. The stimulus presentation device and viewing condition were the
same as the standard test (section 2.1). The subject pressed a key to start a stimulus
presentation block where the stimulus was presented 210 times with a fixed interstimulus
interval (ISI). The stimulus presentation duration was 28 ms, the same as for the standard
test of VSM. The VEP recording started from the 10th stimulus presentation in a block to
record the stabilized VEP responses. The VEP for a given ISI was obtained by averaging
the response for each stimulation after deleting responses that exhibited artifacts from the
eye blinks. The percentage of trials deleted due to contamination of eye-blink varied
across subjects and ISI conditions, with mean of 24% and standard deviation of 8%. The
mean values and it ranged from 5% to 30% across subjects. After a block of recordings,
the subject took a 3- minute break and then the next block was run with a different ISI.
The order of the ISIs for the blocks was randomized.
5.4.2 Results and Conclusions
Lifetime of the activation trace in V1. For each subject, a component with
latency about 140 ms in the VEPs was consistently observed and it exhibited the biggest
amplitude at all three occipital locations. The latency of this component ranges from 130
to 150 ms across the subjects. The source of this component has been localized in V1 by
recent MSI studies (Hatanaka et al., 1997; Uusitalo, Williamson and Seppa, 1997).

Wei Yang 102
-100 0 100 200 300 400 500 600
0.0
0.5
1.0
1.5
2.0
2.5
Stimulus V1 Component
ISI = 2000 ms
ISI = 600 ms
ISI = 300 ms
Time (s)
VE
P A
mp
litu
de
(1
0 µ µµµ
V) WY
Figure 5.1. Visually evoked potentials (VEPs) for different ISIs in one representative
subject. The lines represent the VEPs for three different ISI conditions. The VEPs presented
here were recorded at the location O2 (reference Cz). Other two locations exhibited similar VEPs
with smaller amplitude.
Figure 5.1 shows this V1 component in the VEPs of three different ISIs for one
representative subject. Habituation of V1 response was evident in the decreasing of its
amplitude as the ISI was decreased. Pilot studies found that the location exhibits the
strongest V1 response varies across subjects, but its habituation characterized at these
three occipital locations exhibit the same time constant. To achieve the best signal-to-
noise ratio, the habituation of V1 response was characterized at the location exhibiting
the strongest response for each subject. Figure 5.2 presents the habituation of the V1
response for each subject. Also presented are the best-fitting functions: A - B e-ISI/ ττττ,
where ISI is the interstimulus interval, τ is the time constant of the habituation, A and B
characterize the response amplitude.

Wei Yang 103
0.0
0.6
1.2
= 0.74 ± 0.13 s
LX
τ0.0
0.8
1.6
= 0.49 ± 0.04 s
JT(Practiced)
τ
0
1
2
τ
WY
= 0.45 ± 0.04 s
0.0
0.8
1.6
= 0.23 ± 0.03 s
JT
τ
0.0
0.8
1.6
Res
pons
e A
mpl
itude
(10
µV
)
τ
JH
= 0.44 ± 0.08 s
0.0
0.6
1.2
τ
= 0.21 ± 0.06 s
SH
0.0
0.8
1.6
= 0.35 ± 0.10 s
JM
τ0.0
0.3
0.6
τ
= 0.15 ± 0.04 s
KB
0 1 2 3 40.0
1.5
3.0
Interstimulus Interval (s)
= 0.37 ± 0.04 sτ
YS
0 1 2 3 40.0
0.3
0.6
= 0.2 ± 0.07 s
HG
τ
Figure 5.2. Habituation of the primary visual cortex (V1) response for each subject.
The values for τ represent the 95% confidence interval for the time constant of the habituation
function. For subject JT, the habituation of V1 was characterized right after the 2nd and 24th visual
sensory memory (VSM) test respectively.

Wei Yang 104
According to the activation trace model (Lu, Williamson and Kaufman, 1992), the
time constant of the exponential function τ reveals the lifetime of the activation trace in
V1.
Correspondence between the VSM lifetime and V1 lifetime. To illustrate the
correspondence between the VSM lifetime and V1 lifetime, the VSM lifetime was
plotted against V1 lifetime for each subject in figure 5.3.
0.0 0.2 0.4 0.6 0.80.0
0.2
0.4
0.6
0.8
WY
JH
YS
JT
KB
SH
HG
JM
LXNaive SubjectPracticed Subject
VS
M L
ifetim
e (s
)
V1 Lifetime (s)
Figure 5.3. Correspondence between lifetime of visual sensory memory (VSM) and
lifetime of the activation trace in the primary visual cortex (V1) for each subject. Subjects are
indicated by their initials. Error bars represent the standard error of the lifetimes. The dashed
arrow for JT indicates the enhancement of VSM lifetime by intensive practice.
The VSM lifetime assessed psychophysically was correlated [R (df = 9) = 0.98, p
< 0.01] with the V1 lifetime measured physiologically. Furthermore, 96% of the variance
was accounted for by the function y = x which indicates that the lifetimes are precisely

Wei Yang 105
matched for each individual. This result provides strong evidence supporting the
hypothesis that the activation trace established by a brief visual stimulation underlies
VSM.
The effect of intensive practice on VSM lifetimes in JT. Figure 5.3 presents the
change of VSM lifetime with 30 repeated VSM tests for subject JT.
0 5 10 15 20 25 30 35 400.0
0.1
0.2
0.3
0.4
0.5
0.6
0.7
Test Time (Day)
Higher ContrastHigher LuminanceStandard Stimuli
VS
M L
ifetim
e (s
)
Figure 5.4. Enhancement of lifetime of visual sensory memory (VSM) by intensive
practice for Subject JT. Error bars represent the standard error of the lifetimes. The higher-
luminance stimuli were the same as those used in Exp. 7. The higher-contrast stimuli were the
same as those used in Exp. 9.
The VSM lifetime was enhanced from the original level of 0.15 s to a ceiling
level of about 0.45 s over 20 test sessions. Also presented in this figure were the VSM
lifetime for the higher-luminance stimuli and the higher-contrast stimuli. Enhancing the
contrast of the grating from 20% to 90% has no effect on the VSL lifetime. By contrast,
increasing the mean luminance of the grating 6.5 cd/m2 above the background decreases
the VSM lifetime for JT. These results replicated the results of Experiment 7 & 9.

Wei Yang 106
5.5 Experiment 11: Effect of Luminance Increase on V1 Lifetime
In Experiment 7, it was found that the VSM lifetime was reduced by about half by
slightly enhancing the mean luminance of the gratings above the background. If the V1
activation trace serves VSM, its lifetime should also be shortened by this luminance
increase. Experiment 11 assessed the effect of the luminance increase on the V1 lifetime.
5.5.1 Method
Subjects. Three of the practiced subjects in Experiment 1 volunteered to
participate in this experiment.
Procedure. The procedure for assessing the V1 lifetime in this experiment was
the same as in Experiment 10, except that the mean luminance of the gratings in the
display was increased by 6.5 cd/m2.
5.5.2 Results
The habituation functions of the V1 component of the VEP for the higher-
luminance stimulus for each subject are presented in Figure 5.4. Also plotted in this
figure are the habituation functions for the equal-luminance stimulus (Figure 2.1) for
these subjects. Figure 5.5 compares these V1 lifetimes for the equal-luminance and
higher- luminance stimulus for each subject.
Enhancing the mean luminance of the gratings above the background significantly
shortens the V1 lifetime for LX ( z = 6.57, p < 0.05), WY ( z = 3.6, p < 0.05 ), and JH ( z
= 5.58, p < 0.05). The V1 lifetime was affected by the luminance change just as the
VSM lifetime reported in Experiment 6.

Wei Yang 107
0.0
0.4
0.8
1.2
1.6
Interstimulus Interval (s)
Higher Luminance LXEqual Lumiance
Am
plitu
de o
f V
1 R
espo
nse
(10
µ µµµV
)
0.0
0.5
1.0
1.5
2.0
WY
0 1 2 3 40.0
0.5
1.0
1.5
2.0
2.5JH
Figure 5.5. Effect of luminance increase on the habituation of primary visual cortex (V1)
response.
0.0
0.5
1.0
* **
Equal Luminance Higher Luminance
WY JHLX
Subject
V1
Life
time
(s)
Figure 5.6. Effect of luminance increase on lifetime of the activation trace in primary
visual cortex (V1). The error bars represent the standard error of the lifetimes.
To illustrate the parallel change of the VSM lifetime and V1 lifetime under the
influence of luminance increase, Figure 5.6 presents the two lifetimes for each of the
three subject in the two stimulus conditions.

Wei Yang 108
0.2 0.4 0.6 0.8
0.2
0.4
0.6
0.8
00
Equal LuminanceHigher Luminance
JH
WY
LX
VS
M L
ifetim
e (s
)
V1 Lifetime (s)
Figure 5.7. Parallel effects of luminance increase on lifetime of visual sensory memory
(VSM) and lifetime of the activation trace in primary visual cortex (V1). Subjects are indicated by
their initials. Solid and open circles represent lifetimes for equal-luminance and higher-luminance
stimulus respectively. Error bars represent the standard error of the lifetimes.
This figure shows that the matched lifetimes for the equal-luminance stimulus
still match when they were reduced by more than half by enhancing the mean luminance
of the gratings above the background. Such a parallel change of these two lifetimes in
each subject indicates that the two lifetimes are influenced by luminance increase in the
same fashion. Thus, the VSM and V1 lifetimes are not just correlated across subjects,
but also dynamically linked when they are modulated by changing stimulus parameters.
This result further strengthens the hypothesis that the V1 activation trace underlies VSM.

Wei Yang 109
5. 6 Conclusions
The lifetime of activation trace in V1 matches VSM lifetime in individual
subjects over the range from 0.07 to 0.7 s. The psychophysical lifetime and physiological
lifetime were equally enhanced by extensive practice for naïve subjects, and equally
reduced by a luminance increase in stimuli. The close match of VSM lifetime and V1
lifetime provides strong evidence for the hypothesis that human VSM is represented at
the cortical area V1.
Wei Yang 110
CHAPTER 6. GENERAL CONCLUSIONS AND DISCUSSIONS
To achieve an accurate measurement for the time course of VSM in individual
subjects, this study first reviewed previous studies of VSM in partial-report paradigm and
identified the problems in this paradigm. Then the classic partial-report procedure
(Sperling, 1960) was modified to efficiently characterize partial-report performance for
individual subjects. A mathematical model was developed to isolate the VSM
component underlying the performance. The results confirmed the exponential decay of
VSM and its lifetime was defined.
The results of the experiments in chapters 3 & 4 indicate that the VSM lifetime of
a subject could be prolonged by intensive practice and shortened by a change of the
overall luminance in the stimuli. The enhancement effect of practice on VSM lifetime
indicates that the VSM, which was thought of as a stimulus-driven sensory buffer, is not
solely determined by the stimulus. It could be adapted by the task requirement to a
certain level. Meanwhile, the shortening effect of luminance change on VSM lifetime
suggests that the relative distribution of the spatial frequency components in the stimuli is
the primary stimulus feature that determines VSM lifetime. Thus, the factors that
influence VSM lifetime were identified. These results revealed the novel properties of
VSM and provided good foundation for the identification of its neural substrate.
Experiments in chapter 5 found that the lifetime of the activation trace in V1
matches the VSM lifetime in each of the subject involved in this study. Such match even
holds when the lifetimes were changed by the intensive practice and a luminance increase
Wei Yang 111
in the stimuli for the subjects examined. Such strong correspondence between the
lifetimes indicates that the activation trace in V1 is the cortical source for VSM.
The accurate measurement of the individual VSM lifetime revealed many novel
properties of VSM in this study and thus provided a powerful tool to investigate the
neural substrate of VSM. However, some questions regarding VSM still remain to be
answered. For example, it is not clear whether the VSM characterized in this study is the
subjective visible persistence. Although the inverse luminance effect observed favors the
idea that VSM is the visible persistence, further effort is needed to directly assess their
relationship.
The distribution of the spatial-frequency components in the stimuli was suggested
as the primary factor that influences the VSM lifetime. It needs to be tested by directly
by changing the distribution of the spatial-frequency components. In addition, the results
of this study revealed a practice effect on the VSM lifetime. However, it is not clear
whether the enhanced lifetime is specific to the tested stimulus feature, orientation of the
gratings or is a characteristic of a coherent visual representation of the whole display.
Further testing of the specificity of this practice effect will help to understand its
underlying mechanism.
The mathematical model proposed in section 2.2 to isolate the VSM component
underlying partial-report performance assumes that the VSM and VWM components
contribute to partial-report performance independently. It is expected that these two
memory components could be selectively influenced. For example, a concurrent VWM

Wei Yang 112
task should reduce the number of items in the VWM in the partial-report task but leave
the VSM lifetime unaffected. Such prediction should be tested in future studies.
The results of Experiments 11 & 12 provide strong evidence for the hypothesis
that the activation trace in V1 serves VSM. However, it must be noted that the cortical
activation trace is inferred from the habituation function based on the activation model.
This activation trace is not directly observed and its neural mechanism is not clear at this
moment.
The synchronized activity of neurons in the visual sensory cortex has been
proposed as the neural mechanism for visual perception (Gray et al., 1992; Singer et al.,
1995). The persistence of this activity in the primary visual cortex is a candidate for the
neural mechanism of VSM, because VSM could be thought of as the persistence of
perception beyond the real stimulus duration. A direct assessment of the correlation
between these activities and VSM is difficult to attain because of the difficulties of
applying the physiological measurements at the cellular level for human subjects. The 40
Hz component in the noninvasive VEP recordings for human subjects has been observed
by Tallon-Baudry et al. (1997), but its functional role in visual perception and its relation
to VSM is yet to be established.
The relation between the time course of habituation and that of memory is
counterintuitive. The activation model (Lu, Williamson, & Kaufman, 1992) assumes that
a component in VEP is what is needed to recharge the corresponding activation trace to
its full strength. By this assumption, the reduction of the observed response shown as

Wei Yang 113
habituation is caused by the residual activation trace at the time of responding. This
suggests a dynamic gain-control mechanism in the sensory system. Such a mechanism is
necessary to prevent saturation or overflow of the system, or to maintain a stable sensory
representation under the normal viewing condition which involves small transient inputs
due to microsaccades.
The relationship between the depression of a response and memory function has
also been proposed in studies of the visual cortical area in the inferior temporal (IT)
cortex (Miller & Desimone, 1994; Desimone, 1996). These researchers found that the
response of 1/3 of the neurons in the perirhinal portion of IT cortex is reduced in
amplitude when the same stimulus was repeatedly presented, and such a reduction in
response could be maintained for minutes or a day (Fahy, Riches, & Brown, 1993).
Desimone (1996) proposed that this repetition depression reveals a passive memory
mechanisms for visual short-term memory.
Such habituation of the visual sensory response has also been extensively studied
at the cellular level in the synaptic repetition-depression paradigm (Abbot et al, 1997;
Markram & Tsodyks, 1996; Nelson, 1991a, 1991b; Tsodyks & Markram, 1997; Varela et
al., 1997). The time constant of the repetition depression was found to be 150 – 900 ms
which is about the same range as that of the habituation of the V1 response by VEP
recordings in this study. The phenomenon of repetition depression was thought of as a
form of cortical gain-control by depressing the postsynaptic responses to rapidly-firing
afferents. Consequently, the postsynaptic cell can detect sudden rate changes in low- and

Wei Yang 114
high frequency afferents with about equal sensitivity (Tsodyks & Markram 1997; Varela
et al., 1997).
The synaptic repetition depression was found to be a presynaptic effect and was
attributed to the depletion of the ready vesicle pool (Nelson, 1991; Tsodyks & Markram
1997; Varela et al., 1997). This suggests that the time constant of the exponential
depression function reveals the time course of a passive recovery process. It was also
proposed that such an activity-dependent synaptic depression might be caused by a
postsynaptic activity via a negative feedback (O'Donovan & Rinzel, 1997). This idea is
consistent with our observation of the strong correlation between the time constant of the
habituation, or repetition depression of V1 response and the lifetime of VSM.
One possible mechanism for the dynamic link between the time course of the
repetition depression in V1 and that of VSM could be that the activation trace that serves
VSM sends a negative feedback to the presynaptic V1 relay and results in depressed
postsynaptic response. To achieve the match between the time constant of the response
depression in V1 and VSM lifetime, all that is needed is an assumption that the strength
of the inhibitory feedback is proportional to the strength of the activation trace at any
moment.

Wei Yang 115
References
Anderson, R. B., & Tweney R. D. (1997). Artifactual power curves in forgetting.
Memory and Cognition, 25, 724-730
Abbot, L. F., Varela, J. A., Sen, K., & Nelson, S. B. (1997). Synaptic depression
and cortical gain control, Science, 275, 220-224.
Ahissar, M., & Hochstein, S. (1993). Attentional control of early perceptual
learning. Proc Natl Acad of Sci USA, 90, 5718-5722.
Allen, F. (1926). The persistence of vision. American Journal of Physiological
Optics, 7, 439-457.
Allport, D. A. (1989). Visual attention. In M. I. Posner (Ed.), Foundations of
Cognitive Science (pp. 631-682). Cambridge, MA: MIT Press,.
Appelman, I. B. (1980). Partial report and other sampling procedures
overestimate the duration of iconic memory, American Journal of Psychology, 93, 79-97.
Atkinson, R., & Shiffrin, R. M. (1968). Human memory: A proposed system and
its control processes. In K. W. Spence (Ed.), Psychology of learning and motivation:
Advances in research and theory (vol. 2, pp. 89-195 ). New York: Academic Press.
Averbach, E., & Coriell, A. S. (1961). Short-term memory in vision. Bell System
Technical Journal, 40, 309-328.
Averbach, E., & Sperling, G. (1961). Short-term storage in vision. In C. Cherry
(Ed.), Symposium on information theory (pp. 196-211). London: Butterworth.

Wei Yang 116
Baddeley, A. (1998). Recent developments in working memory. Current Opinion
in Neurobiology, 8, 234-8.
Baddeley, A. D., & Hitch, G. (1974). Working Memory. In G. H. Bower (Ed.),
The Psychology of Learning and Motivation (pp. 47-89). San Diego: Academic Press.
Bliss, T. V, & Collingridge, G. L., (1993). A synaptic model of memory: long-
term potentiation in the hippocampus. Nature, 361, 31-39.
Bourne, L. E., Dominowski, R. L., Loftus, E. F., & Healy, A. F. (1986).
Cognitive processes (2nd ed.), Englewood Cloffs, NJ: Prentice-Hall.
Boussaoud, D., Desimone, R., & Ungerleider, L. G. (1991). Visual topography of
area TEO in the macaque. Journal of Comparative Neurology, 306, 554-75.
Boyton, R. M. (1972). Discrimination of homogeneous double pulses of light. In
D. Jameson, & L. J. Hurvich (Eds.), Handbook of sensory physiology: 4.Visual
Psychophysics (Vol. 7, pp. 202-232). New York: Springer.
Breitmeyer, B. G. (1984). Visual masking: An integrative approach, New York:
Oxford.
Bors, D. A., & MacLeod, C. M. (1996). Individual differences in Memory. In E.
L. Bjork, & R. A. Bjork (Eds.) Memory (pp. 412-436). Academic Press.
Brown, J. L. (1975). Afterimages. In C. H. Graham (Ed), Vision and visual
perception (pp.479-503). John Wiley and Sons, New York.
Campbell, A. J., & Mewhort, D. J. K. (1980). On the familiarity effects in visual
information processing. Canadian Journal of Psychology, 34, 134-154.

Wei Yang 117
Cavanagh, P. (1993). The perception of form and motion. Current Opinion in
Neurobiology, 3, 177-82.
Carrasco, M., & Frieder, K. S. (1997). Cortical magnification neutralizes the
eccentricity effect in visual search. Vision Research, 37, 63-82.
Chow, S. L., & Murdock, B. B., Jr. (1975). The effect of a subsidiary task on
iconic memory. Memory and Cognition, 3, 678-688.
Churchland, P. S., & Sejnowski, T. J. (1988). Perspectives on cognitive
neuroscience. Science, 242, 741-745.
Coltheart, M. (1972). Visual information processing. In P. C. Dodwell (Ed.),
New horizons in psychology. Harmondsworth, England: Penguin Books.
Coltheart, M. (1977). Contemporary models of the cognitive processes. I:
Information input and storage. In V. Hamilton, & M. D. Vernon (Eds.), The development
of cognitive processes. London: Academic Press.
Coltheart, M. (1980). Iconic memory and visible persistence. Perception &
Psychophysics, 27, 183-228.
Coltheart, M., Lea, C. D., & Thompson, K. (1974). In defense of iconic memory.
Quarterly Journal of Experimental Psychology, 26, 633-641.
Cowan, N. (1995). Attention and memory: an integrated framework, Oxford
University Press.
Crick, F., & Koch, C. (1990). Some reflections on visual awareness. Cold Spring
Harbor Symposia on Quantitative Biology, IV, 953-962.

Wei Yang 118
Desimone, R. (1996). Neural mechanisms for visual memory and their role in
attention. Proc Natl Acad Sci U S A, 93, 13494-13499.
Desimone, R., Miller, E. K., Chelazzi, L, & Lueschow, A. (1995). Multiple
memory systems in the visual cortex. In Gazzaniga M. S. et al. (Eds.). The Cognitive
Neuroscience (pp. 803-814). The MIT Press.
De Valois, R.L., Albrecht D. G., & Thorell L. G. (1982). Spatial frequency
selectivity of cells in macaque visual cortex. Vision Research, 22, 545-59.
Dick, A. O. (1967). Visual information processing and the memory trace.
Unpublished Ph.D. thesis, University of Waterloo.
Dick, A. O. (1969). Relations between the sensory register and short-term storage
in tachistoscopic recognition. Journal of Experimental Psychology, 82, 279-284.
Dick, A. O. (1974). Iconic memory and its relation to perceptual processing and
other memory mechanisms. Perception and Psychophysics, 16, 575-596.
Di Lollo, V. (1978). On the spatial-temporal interactions of brief visual displays.
In R. H. Day & G. V. Stanley (Eds), Studies in Perception (pp. 39-55), Perth: University
of Western Australia Press.
Di Lollo, V. (1984). On the relationship between stimulus intensity and duration
of visible persistence. Journal of Experimental Psychology: Hum Percept Perform, 10,
144-51.
Di Lollo, V., & Dixon, P. (1988). Two forms of persistence in visual information

Wei Yang 119
processing. Journal of Experimental Psychology: Human Perception and Performance,
14, 671-681.
Di Lollo, V., & Dixon, P. (1992). Inverse duration effects in partial-report.
Journal of Experimental Psychology: Human Perception and Performance, 18, 1089-
1100.
Dixon, P. (1985). Stimulus duration may affect partial-report performance.
Perception, 14, 63-66.
Dixon, P., & Di Lollo, V. (1991). Effects of display luminance, stimulus type,
and probe duration on visible and schematic persistence. Canadian Journal of
Psychology, 45, 54-74.
Dixon, P., & Shedden, J.M. (1987). Conceptual and physical differences in the
category effect. Perception & Psychophysics, 42, 457-464.
Doost, R., & Turvey, M. T. (1971). Iconic memory and central processing
capacity. Perception & psychophysics, 9, 269-274.
Duncan, J. (1981). Directing attention in the visual field. Perception &
Psychophysics, 30, 90-93.
Duncan, J. (1983). Perceptual selection based on alphanumeric class: evidence
from partial reports. Perception & Psychophysics, 33, 533-547.
Duysens, J., Orban, G. A., Cremieux, J., & Maes, H. (1985). Visual cortical
correlates of visible persistence. Vision Research, 25, 171-178.
Wei Yang 120
Eriksen, C. W., & Steffy, R. A. (1964). Short-term memory and retroactive
interference in visual perception. Journal of Experimental Psychology, 68, 423-434.
Fahy, F. L., Riches, I. P., & Brown, M., W. (1993). Neuronal activity related to
visual recognition memory: long-term memory and the encoding of recency and
familiarity information in the primate anterior and medial inferior temporal and rhinal
cortex. Experimental Brain Research, 96, 457-72.
Fisher, D. L. (1984). Central capacity limits in consistent mapping, visual search
tasks: four channels or more? Cognitive Psychology, 16, 449-484.
Francis, G. (1996). Cortical dynamics of lateral inhibition: visual persistence and
ISI. Perception & Psychophysics, 58, 1103-1109.
Francis, G (1996). Cortical dynamics of visual persistence and temporal
integration. Perception & Psychophysics, 58, 1203-1212.
Francis, G. & Grossberg, S. (1996). Cortical dynamics of boundary segmentation
and reset: persistence, afterimages, and residual traces. Perception, 25, 543-567.
Francis, G., Grossberg, S., & Mingolla, E. (1994). Cortical dynamics of feature
binding and reset: control of visual persistence. Vision Research, 34, 1089-1104.
Fries, P., Roelfsema, P. R., Engel, A. K., Konig, P., & Singer, W. (1997).
Synchronization of oscillatory responses in visual cortex correlates with perception in
interocular rivalry. Proc. Natl. Acad. Sci. 94, 12699-12704.

Wei Yang 121
Gegenfurtner, K. R., & Sperling, G. (1993). Information transfer in iconic
memory experiments. Journal of Experimental Psychology: Human Perception and
Performance, 19, 845-866.
Ghose, G. M., & Freeman, R. D. (1992). Oscillatory discharge in the visual
system: does it have a functional role? Journal of Neurophysiology, 68, 1558-1574.
Graham, N. (1981). Psychophysics of spatial-frequency channels. In M. Kubovy,
& J. R. Pomerantz (Eds.), Perceptual Organization. Lawrence Erlbaum Association
Gray, C. M., Engel, A. K., Konig, P., & Singer, W (1992). Synchronization of
oscillatory neuronal response in cat striate cortex: temporal properties. Visual
Neuroscience, 8, 337-347.
Grossberg, S., & Mingolla, E. (1985). Neural dynamics of perceptual grouping:
textures, boundaries, and emergent segmentations. Perception and Psychophysics, 38,
141-171.
Haber, R. N. (1983). The impending demise of the icon: A critique of the concept
of iconic storage in visual information processing. Behavioral and brain sciences, 6, 1-
54.
Haber, R. N. (1969). Information processing approaches to visual perception: An
introduction. In R. N. Haber (Eds). Information processing approaches to visual
perception, (pp. 1-15). Holt, Rinehart and Winston.
Hatanaka, K., Nakasato, N., Seki. K., Mizio, K., & Yoshimoto, T. (1997). Striate
cortical generators of the N75, P100, and N145 components localized by pattern reversal

Wei Yang 122
visual evoked magnetic fields. Tohoku Journal of Experimental Medicine, 182, 9-14.
Hawken, M. J., Shapley, R. M., & Grosof, D. H. (1996). Temporal-frequency
selectivity in monkey visual cortex. Visual Neuroscience, 13, 477-492.
Hawkins, R. D, Kandel, E. R, & Siegelbaum, S. A. (1993). Learning to modulate
transmitter release: themes and variations in synaptic plasticity. Annual Review of
Neuroscience, 16, 625-565.
Hawkins, H. L., & Shulman, G. L. (1979). Two definitions of persistence in
visual perception. Perception & Psychophysics, 25, 348-350.
Holding, D. H. (1970). Guessing behavior and the Sperling store. Quarterly
Journal of Experimental Psychology, 22, 248-256.
Holding, D. H. (1971). The amount seen in brief exposures. Quarterly Journal of
Experimental Psychology, 23, 72-81.
Holding, D. H. (1972). Brief visual memory for English and Arabic letters.
Psychonomic Science, 28, 241-242.
Holding, D. H. (1973). Recognition tests of visual information storage. British
Journal of Psychology, 64, 9-16.
Ishai, A., & Sagi, D. (1995). Common mechanisms of visual imagery and
perception. Science, 268, 1772-4.
Irwin, D. E., & Brown, J. S. (1987). Tests of a model of informational
persistence. Canadian Journal of Psychology, 41, 317-338.

Wei Yang 123
Irwin, D. E., & Yeomans, J. M. (1986). Sensory registration and informational
persistence. Journal of Experimental Psychology: Human Perception and Performance,
12, 343-360.
Jasper, H. H. (1958). The ten-twenty electrode system of the international
federation. Electroencephalography and Clinical Neurophysiology, 10, 371-375.
Kahneman, D., Treisman, A., & Gibbs, B. J. (1992). The reviewing of object
files: object-specific integration of information. Cognitive Psychology, 24, 175-219.
Karni A, & Sagi D, (1993). The time course of learning a visual skill. Nature,
365, 250-252.
Kaufman, L. (1974). Sight and mind: an introduction to visual perception.
Oxford University Press.
Keele, S. W., & Chase, W. G. (1967). Short-term visual storage. Perception &
Psychophysics, 2, 383-386.
Kosslyn S.M., Thompson W.L., Kim I. J., & Alpert, N. M. (1995).
Topographical representations of mental images in primary visual cortex, Nature, 378,
496-8.
Landy, M. S., Cohen, Y. & Sperling, G. (1984). HIPS: A UNIX-based image
processing system. Computer Vision, Graphics, and Image Processing, 25, 331-347.
Lavie, N. (1995). Perceptual load as a necessary condition for selective attention.
Journal of Experimental Psychology: Human Perception and Performance, 21, 451-68.

Wei Yang 124
Le Bihan, D., Turner, R., Zeffiro, T. A., Cuenod, C. A., Jezzard, P., & Bonnerot,
V. (1993). Activation of human primary visual cortex during visual recall: a magnetic
resonance imaging study, Proc Natl Acad Sci U S A, 90, 11802-11805.
Legge, G. E. (1978). Space domain properties of a spatial frequency channel in
human vision. Vision Research, 18, 959-69.
Lennie, P., Krauskopf, J., & Sclar, G. (1990). Chromatic mechanisms in striate
cortex of macaque. Journal of Neuroscience, 10, 649-669.
Leopold, D. A., & Logothetis, N. K. (1996). Activity changes in early visual
cortex reflect monkeys' percepts during binocular rivalry. Nature, 379, 549-553.
Lindsay, P. H., & Norman, D. A. (1977). Human Information Processing (2nd.
Ed.). New York: Academic Press, 1977.
Long, G. M., (1980). Iconic memory: A review and critique of the study of short-
term visual storage. Psychological Bulletin, 88, 785-820.
Long, G. M., (1982). Receptor interactions and visual persistence. Vision
Research, 22, 1285-1292.
Long, G. M., (1979). Comment on Hawkins and Shulman's Type I and Type II
visual persistence. Perception & Psychophysics, 26, 412-414.
Long, G. M., (1985). The variety of visual persistence: Comments on Yeomas
and Irwin. Perception & Psychophysics, 38, 381-385.

Wei Yang 125
Long, G. M., & Beaton, R. J. (1982). The case for peripheral persistence: effects
of target and background luminance on a partial-report task. Journal of Experimental
Psychology: Human Perception and Perform, 8, 383-391.
Lu, Z. -L., Williamson, S. J., & Kaufman, L. (1992). Physiological measures
predict behavioral lifetime of human auditory sensory memory, Science, 258, 1668-1670.
Luck, S. J., Chelazzi, L., Hillyard, S. A., & Desimone, R. (1997). Neural
mechanisms of spatial selective attention in areas V1, V2, and V4 of macaque visual
cortex. Journal of Neurophysiology, 77, 24-42.
Luck, S. J., & Vogel, E. K. (1997). The capacity of visual working memory for
features and conjunctions. Nature, 390, 279-81.
Massaro, D. W., & Loftus, G. R. (1996). Sensory and perceptual storage: Data
and theory. In E. L. Bjork & R. A. Bjork (Eds.) Memory (pp. 68-96). Academic Press.
Marder, E., Abbott, L. F., Turrigiano, G. G., Liu, Z., & Golowasch, J. (1996).
Memory from the dynamics of intrinsic membrane currents. Proc Natl Acad Sci U S A,
93, 13481-13486.
Markram, H., & Tsodyks, M (1996). Redistribution of synaptic efficiency
between neocortical pyramidal neurons. Nature, 382, 807-810.
Mayzner, M. S., Abrevayana, E. L., Frey, R. E., Kaufman, H. G., & Schoenberg,
K. M. (1964). Short-term memory in vision: A partial replication of the Averbach and
Coriell study. Psychonomic Science, 1, 225-226.

Wei Yang 126
Merikle, P. M. (1980). Selection from visual persistence by perceptual groups
and category membership. Journal of Experimental Psychology: General, 109, 279-295.
Mewhort, D. J., & Leppmann, K. P. (1985). Information persistence: testing
spatial and identity information with a voice probe. Psychological Research, 47, 51-58.
Mewhort, D. J. K., Campbell, A. J., Marchetti, F. M., & Cambpell, J. I. D. (1981).
Identification, localization, and “iconic memory”: An evaluation of the bar-probe task.
Memory & Cognition, 9, 50-67.
Miller, E. K., Desimone, R. (1994). Parallel neuronal mechanisms for short-term
memory. Science, 263, 520-2
Miller, E. K., Li, L., & Desimone, R. (1991). A neural mechanism for working
and recognition memory in inferior temporal cortex. Science, 254, 1377-1379.
Moates, D. R., & Schumacher, G. M. (1980). An introduction to cognitive
psychology. Belmont, CA: Wadsworth.
Moran, J., & Desimone, R. (1985). Selective attention gates visual processing in
the extrastriate cortex. Science, 229, 782-784.
Mulligan, N. W. (1997). Attention and implicit memory tests: the effects of
varying attentional load on conceptual priming. Memory & Cognition, 25, 11-17.
Neisser, U. (1967). Cognitive psychology. New York: Appleton-Century-Crofts.
Nelson, S. B., (1991a). Temporal interactions in the cat visual system. I.
Orientation-selective depression in the visual cortex. The Journal of Neuroscience, 11,
344-356.

Wei Yang 127
Nelson, S. B., (1991b). Temporal interactions in the cat visual system. III.
Pharmacological studies of cortical depression suggest a presynaptic mechanism. The
Journal of Neuroscience, 11, 369-380.
Nisly, S. J., & Wasserman, G. S. (1989). Intensity dependence of perceived
duration: data, theories, and neural integration. Psychological Bulletin, 106, 483-96.
O'Donovan, M. J., & Rinzel, J.(1997). Synaptic Depression: a dynamic regulation
of synaptic communication with varied functional roles. Trends in Neuroscience, 20,
431-433.
Pashler, H. (1998). The psychology of attention (pp. 54-55). Cambridge, MA:
MIT Press,
Pashler, H., & Carrier, M. (1996). Structure, process, and the flow of
information. In E. L. Bjork, & R. A. Bjork (Eds.), Memory (pp. 3-29). Academic Press.
Phillips, W. A. (1974). One of the distinction between sensory storage and short-
term visual memory. Perception & Psychophysics, 16, 283-290.
Phillips, W. A. (1983). Short-term visual memory. Philosophical Transaction to
the Royal Society of London, B 302, 295-309.
Pylyshyn, Z. W., & Storm, R. W. (1988). Tracking multiple independent targets:
evidence for a parallel tracking mechanism. Spatial Vision, 3, 179-197.
Reed, A. V. (1976). The time course of recognition in human memory, Memory
& Cognition, 4, 16-30.

Wei Yang 128
Ribary, U., Ioannides, A. A., Singh, K. D., Hasson, R., Bolton, J. P. R., Lado, F.,
Mogilner, A., & Linas, R. (1991). Magnetic field topography of coherent thalamocotical
40-Hz oscillations in humans. Proceedings to the National Academical Science of USA,
88, 11037-11041.
Sagi, D., & Tanne, D. (1994). Perceptual learning: learning to see. Current
Opinion in Neurobiology, 4, 195-199.
Sakitt, B., & Appelman, J. B. (1978). The effects of memory load and the
contrast of the rod signal on partial report superiority in a Sperling task. Memory &
Cognition, 6, 562-567.
Sakitt, B., & Long, G. M. (1978). Relative rod and cone contributions in iconic
storage. Perception & Psychophysics, 23, 527-536.
Sakitt, B., & Long, G. M. (1979). Spare the rod and spoil the icon. Journal of
Experimental Psychology: Human Perception and Performance, 5, 19-30.
Shapley, R., & Lennie, P. (1995). Spatial frequency analysis in the visual system.
Annual Review of Neuroscience, 8, 547-583.
Single, W., & Gray, C. M. (1995). Visual feature integration and the temporal
correlation hypothesis. Annual Review of Neuroscience, 18, 555-586.
Squire, L. R., & Knowlton, J. (1995). Memory, hippocampus, and brain systems.
In Gazzaniga M. S. et al. (Eds.). The Cognitive Neuroscience (pp. 803-814. The MIT
Press.
Sperling, G. (1960). The information available in brief visual presentations.

Wei Yang 129
Psychological Monographs, 74 (whole no. 498).
Sperling, G. (1963). A model for visual memory tasks. Human Factors, 5, 19-
31.
Sperling, G. (1967). Successive approximation to a model for short-term
memory. Acta Psychologica, 27, 285-293.
Sperling, G. (1970). Binocular vision: A physical and neural theory. American
Journal of Psychology, 83, 461-534.
Tallon-Baudry, C., Bertrand, O., Delpuech, C., & Pernier, J. (1997). The Journal
of Neuroscience, 17, 722-734.
Townsend, V. M. (1973). Loss of spatial and identity information following a
tachistoscopic exposure. Journal of Experimental Psychology, 98, 113-118.
Tovee, M. J., & Rolls, E. T. (1992). The functional nature of neuronal oscillations
[letter]. Trends in Neuroscience, 15, 387-388.
Tsodyks, M., & Markram, H., (1997). The neural code between neocortical
pyramidal neurons depends on neurotransmitter release probability, Proceedings to the
National Academic of Science of the USA, 94, 719-723.
Ungerleider, L. G., Courtney, S. M., & Haxby, J. V. (1998). A neural system for
human visual working memory. Proc Natl Acad Sci U S A, 95, 883-890.
Uusitalo, M. A., Williamson, S. J., & Seppa, M. T. (1996). Dynamic
Organization of the human visual system revealed by lifetimes of activation traces.
Neuroscience Letters, 213, 149-152.

Wei Yang 130
Varela, J. A., Sen, K., Gibson, J., Fost, J. Abbot, L. F., & Nelson, S. B. (1997). A
quantitative description of short-term plasticity at excitatory synapses in layer 2/3
of rat primary visual cortex. The Journal of Neuroscience, 17, 7926-7940.
Von Wright, J. M. (1972). On the problem of selection in iconic memory.
Scandinavia Journal of Psychology, 13, 159-171.
Walsh, V., Ashbridge, E., & Cowey, A. (1998). Cortical plasticity in perceptual
learning demonstrated by transcranial magnetic stimulation. Neuropsychologia, 36, 363-
367.
Weichselgartner, E. & Sperling, G. (1985). Continuous Measurement of visible
persistence. Journal of Experimental Psychology: Human Perception and Performance.
11, 711-725.
Wolford, G, & Hollingsworth, S. (1974). Retinal location and string position as
important variables in visual information processing. Perception and Psychophysics, 16,
437-442.
Yantis, S. (1992). Multielement visual tracking: attention and perceptual
organization. Cognitive Psychology, 24, 295-340
Yeomans, J.M., & Irwin, D. E. (1985). Stimulus duration and partial-report
performance. Perception & Psychophysics, 27, 183-338.
Young, M. P., Tanaka, K., & Yamane, S. (1992). On oscillating neuronal
responses in the visual cortex of the monkey. Journal of Neurophysiology, 67, 1464-
1474.