lifetime alcohol consumption and risk of barrett's esophagus
TRANSCRIPT

nature publishing group ORIGINAL CONTRIBUTIONS E
SO
PH
AG
US
1220
The American Journal of GASTROENTEROLOGY VOLUME 106 | JULY 2011 www.amjgastro.com
INTRODUCTION Esophageal cancer is the eighth most common malignancy and
the sixth leading cause of cancer death worldwide ( 1 ). Over the
past four decades, the incidence of esophageal adenocarcinoma
(EAC) has risen more rapidly than any other malignancy in many
Western populations, accounting for > 50 % of new esophageal
cancers ( 2 – 6 ). It is clear that environmental risk factors have an
important role in the etiology of EAC and have contributed signi-
fi cantly to the change in incidence ( 7 ). Barrett ’ s esophagus (BE),
an acquired premalignant condition characterized by a meta-
plastic replacement of the esophageal squamous epithelium into
specialized intestinal metaplasia ( 7 ), is the only known precursor
lesion of EAC and is associated with a risk of progression to
cancer of ~ 0.5 % per year ( 8,9 ).
Alcohol is a group 1 carcinogen and there is strong evidence of
a causal link between alcohol consumption and the risk of cancers
of the oral cavity, pharynx, liver, colon, rectum, and, in women,
breast ( 10 – 12 ). Alcohol consumption is of substantial impor-
tance in the causation of esophageal squamous cell carcinoma
( 10,13 – 17 ), although its association with EAC is less well defi ned.
Epidemiological studies have consistently shown no eff ect of total
alcohol consumption on risk of EAC ( 16,18 – 21 ), while recent
studies of beverage-specifi c alcohol consumption have reported
reduced risks of EAC associated with modest wine consump-
Lifetime Alcohol Consumption and Risk of Barrett ’ s Esophagus Aaron P. Thrift , BAppSc (Hons) 1 , 2 , Nirmala Pandeya , MMedSc, PhD 1 , Kylie J. Smith , MBBS 2 , Kylie - ann Mallitt , BSc (Hons) 2 , Ad è le C. Green , MBBS, PhD 2 , 3 , Penelope M. Webb , DPhil 2 and David C. Whiteman , MBBS, PhD 2
OBJECTIVES: Alcohol is a carcinogen that may increase the risk of Barrett ’ s esophagus (BE) through direct contact with esophageal mucosa. However, few studies have investigated this association and fi ndings have been inconsistent. We sought to examine the association between measures of total and beverage-specifi c alcohol consumption and BE risk.
METHODS: We conducted a large population-based case – control study that collected information on lifetime alcohol consumption and other exposures from 285 patients with nondysplastic BE, 108 patients with dysplastic BE, and two separate control groups: 313 endoscopy patients with acute infl amma-tory changes ( “ infl ammation controls ” ) and 644 population controls. We calculated odds ratios (ORs) and 95 % confi dence intervals (CIs) for categories of average alcohol consumption using unconditional multivariate logistic regression.
RESULTS: Relative to life-long nondrinkers and consumption of < 1 drink / week, consumption of 7 – 20 drinks / week (OR = 0.53, 95 % CI: 0.31 – 0.91) and 21 – 41 drinks / week (OR = 0.37, 95 % CI: 0.19 – 0.73) of total alcohol throughout the life was inversely associated with nondysplastic BE, for comparisons with population controls. Lifetime total alcohol consumption was also inversely associated with dysplastic BE (7 – 20 drinks / week OR = 0.52, 95 % CI: 0.19 – 1.43; 21 – 41 drinks / week OR = 0.22, 95 % CI: 0.07 – 0.73). Similarly, reduced risk estimates were found for comparisons with infl amma-tion controls. The inverse associations were observed separately for beer and wine consumption, with a signifi cant linear trend observed with beer consumption. The risks associated with liquor consumption were up to twofold higher; however, they were not statistically signifi cant. We found no evidence for effect modifi cation by factors known (or suspected) to cause BE.
CONCLUSIONS: Overall, alcohol consumption does not increase the risk of BE. Signifi cant inverse associations were observed for beer consumption, the underlying reasons for which remain unclear.
Am J Gastroenterol 2011; 106:1220–1230; doi: 10.1038/ajg.2011.89; published online 22 March 2011
1 School of Population Health, The University of Queensland , Brisbane , Australia ; 2 Queensland Institute of Medical Research , Brisbane , Australia ; 3 School of Translational Medicine, University of Manchester , Manchester , UK . Correspondence: David C. Whiteman, MBBS, PhD , Cancer Control Laboratory, Queensland Institute of Medical Research, Locked Bag 2000 Royal Brisbane Hospital , Brisbane, Queensland 4029 , Australia . E-mail: [email protected] Received 7 December 2010; accepted 15 January 2011

© 2011 by the American College of Gastroenterology The American Journal of GASTROENTEROLOGY
1221
ES
OP
HA
GU
S
Alcohol Consumption and Barrett ’ s Esophagus
tion ( 13,22,23 ). Th e eff ect, if any, of alcohol consumption on the
early events in the development of EAC cannot be evaluated
reliably from case – control studies of cancer; studies of the pre-
curser lesion would be informative in this regard. It is hypothesized
that alcohol consumption may increase the risk of BE indirectly
by increasing the frequency of gastro-esophageal refl ux (GER);
however, fi ndings from recent studies are confl icting. Although
some studies have reported no association with BE ( 24,25 ),
others have reported inverse associations with wine consumption
( 22,23 ) and positive associations with total alcohol ( 26 ) or liquor
consumption ( 27,28 ). Th ese studies did not collect information
on lifetime alcohol consumption and may be subject to misclas-
sifi cation and information bias, resulting from recent changes in
alcohol intake.
Here, we report the fi ndings of a study conducted to evaluate
in detail the association between alcohol consumption and risk of
BE. Further, we sought to assess whether any observed associations
between alcohol consumption and BE were modifi ed by known
causal factors for BE.
METHODS Data came from a population-based case – control study of BE
conducted in Brisbane, Australia, the details of which have been
described in full elsewhere ( 29 ). Approval to undertake the
study was obtained from the human research ethics committees
of the Queensland Institute of Medical Research and from all
participating hospitals.
Study participants Case patients with BE were recruited and compared with two
separate control groups: participants who had endoscopic evi-
dence of acute infl ammation consistent with GER disease (here-
aft er “ infl ammation controls ” ) and controls sampled at random
from a national population register. Eligible case patients were
people aged 18 – 79 years with a new (incident) histologically
confi rmed diagnosis of BE between 1 February 2003 and 30
June 2006. BE was defi ned as the presence of specialized intesti-
nal metaplasia (i.e., columnar epithelium with goblet cells) in an
esophageal biopsy taken from the tubular esophagus by upper gas-
tro-intestinal endoscopy, irrespective of the length of involvement.
We prospectively identifi ed BE patients from the private and
public pathology laboratories servicing metropolitan Brisbane
(population 1.5 million). Th is analysis was restricted to patients
with newly diagnosed BE (for nondysplastic BE cases), or newly
diagnosed dysplasia (for dysplastic cases). A total of 1,714 patients
with presumptive BE were approached through the pathology
laboratories, of whom 1,096 (64 % response rate) gave permis-
sion to the pathology laboratories to release their contact details
to the study investigators. Of these, 487 patients were found to
have a previous diagnosis of BE and a further 86 patients had
only intestinal metaplasia of the gastro-esophageal junction; both
groups were deemed ineligible for this analysis. A further 130
patients were ineligible (30 invalid address, 6 too old, 5 other) or
were excluded from the study (3 too ill, 5 unable to complete an
English language questionnaire, 5 unable to be contacted, 76 failed
to return a completed questionnaire). Th us, a total of 393 patients
returned a completed questionnaire, with data available for 285
nondysplastic BE and 108 dysplastic BE patients.
Infl ammation controls were those patients whose endoscopic
biopsies were referred to the same pathology laboratories for
histological assessment during the study period, but for whom
the histology report identifi ed only acute infl ammatory changes
in the esophagus consistent with GER and no other major
pathology. In total, 691 of 1,354 (51 % response rate) patients
approached as infl ammation controls agreed to release their
contact details to study investigators. Of these, 363 were eligible
infl ammation controls and 313 completed the study.
Population control participants were selected at random from
the Australian Electoral Roll (enrolment is compulsory by law
in Australia), frequency matched to the case series of non dysplastic
BE by sex and 5-year age group. Of 1,554 potentially eligible
control participants who were contacted and invited to partici-
pate, 2 were ineligible due to a diagnosis of BE, 30 were excluded
(2 deceased, 4 too ill, 17 were unable to read or write in English,
7 other exclusion) and 404 failed to respond to the invitation.
Of 1,118 remaining population controls, 746 accepted the invita-
tion, and 644 returned the completed questionnaires (the response
rate among controls was 72 % of those contacted). Population
controls were not required to undergo endoscopy as part of their
participation in the study. Written informed consent was obtained
from all case and control participants.
Data collection All participants self-completed a health and lifestyle question-
naire, followed by a standardized telephone interview with a
trained research nurse. A history of GER was elicited by asking
about experience of heartburn ( “ a burning pain behind the breast-
bone aft er eating ” ) or acid refl ux ( “ a sour taste from acid or bile
rising up into the mouth or throat ” ) at ages 10 – 19, 20 – 29, 30 – 49,
and 50 – 79 years. For analysis, we used the highest reported
frequency for either symptom during the age interval coinciding
with 10 years before the reference age. Body mass index (BMI,
kg / m 2 ) was calculated using self-reported height and weight
1 year before recruitment. Participants were asked whether, over
their whole life, they had ever smoked > 100 cigarettes or cigars
(or equivalent use of pipes). Positive responses led to further
questions regarding levels and duration of smoking, and life-
time cumulative smoking history was calculated by dividing the
number of cigarettes smoked on a typical day by 20 and multi-
plying by the total number of years smoked. Finally, participants
were asked if they had used aspirin or other nonsteroidal anti-
infl ammatory drugs (NSAIDs) during the past 5 years, and
whether they had ever taken H2-receptor antagonists and proton
pump inhibitors (PPIs).
Exposure assessment Participants self-reported whether they currently drank alcohol,
were life-long nondrinkers, or had previously drunk alcohol but
stopped. Th ose who had ever consumed alcohol were asked the

The American Journal of GASTROENTEROLOGY VOLUME 106 | JULY 2011 www.amjgastro.com
1222 E
SO
PH
AG
US
Thrift et al.
age at which they fi rst started drinking alcohol at least once a
month and when they stopped drinking (if applicable). Partici-
pants were asked to report their usual frequency of consumption
for six types of alcohol (reduced-alcohol beer, regular beer, white
wine, red wine, port or sherry, and spirits or liqueurs) during the
age intervals of 20 – 29 years, 30 – 49 years, and 50 years and older,
as applicable, on a nine-point ordinal scale (none, < 1, 1, 2 – 4, 5 – 6,
7 – 13, 14 – 20, 21 – 27, ≥ 28 drinks / week).
Within each age interval, the average weekly alcohol consump-
tion (in grams / week) for each type of beverage was estimated
by multiplying the midpoint value for each intake frequency by
the standard drink volume and percentage of alcohol content by
weight (in grams). We used the following percentages of alcohol
content for each class of beverage: 2.1, 3.8, 8.3, 9.6, 14.1, and 29.3 g
per 100 ml of reduced-alcohol beer, regular beer, white wine, red
wine, port / sherry, and spirits / liqueur, respectively. Total alcohol
consumption (g) within each age interval was calculated in two
phases: fi rst, we calculated beverage-specifi c total intakes (g) by
multiplying average weekly beverage-specifi c alcohol consumption
(grams / week) by the number of weeks per year (52 weeks) and the
number of drinking years in the age interval; and second, by then
summing the beverage-specifi c total intakes within each interval
to derive a total alcohol intake (g) for each interval. Th e total alco-
hol intakes for all age intervals then were summed to obtain the
total lifetime alcohol consumption (g). We then derived a measure
of average total lifetime alcohol consumption (hereaft er referred
to as the average lifetime total alcohol consumption ) in grams / week
by dividing total lifetime alcohol consumption by the number of
weeks in life starting from age 20 to their reference age (age at
diagnosis for cases and age at study participation for controls). For
comparability with other studies, we converted this to drinks / week
by dividing by 10 g / drink. We used similar algorithms to calculate
the average lifetime weekly intake (drinks / week) of each type of
alcoholic beverage. Recent alcohol consumption was derived from
the consumption of alcohol reported at the age interval coinciding
with the participant ’ s current age.
Statistical analysis Our primary aim was to estimate the relative risks of non dysplastic
BE and BE with dysplasia associated with average lifetime alcohol
consumption. Analyses were conducted separately with popu-
lation controls and infl ammation controls to address possible
issues of selection and detection biases. We used unconditional
multivariate logistic regression to calculate odds ratios (ORs)
and 95 % confi dence intervals (CIs). Alcohol consumption was
modeled as a fi ve-level categorical variable (life-long nondrinkers
or average alcohol consumption of < 1; 1 – 6; 7 – 20; 21 – 41; and ≥ 42
drinks / week). Th e referent group for all analyses was those who
were life-long nondrinkers or consumed < 1 drink / week. Terms
for potential confounders were retained in the fi nal models if they
changed the risk estimate or improved the fi t of the models. Final
multivariate models were adjusted for potential confounders,
including age (years), sex, education level, BMI ( < 25.0, 25.0 – 29.9,
≥ 30 kg / m 2 ), cumulative smoking history ( “ never smoker ” , “ < 30
pack-years ” , “ ≥ 30 pack-years ” ), frequency of GER symptoms
( “ never ” , “ less than weekly ” , “ at least weekly ” ), frequency of aspirin
or other NSAID use ( “ never ” , “ less than weekly ” , “ at least weekly ” ),
and ever use of PPIs ( “ yes ” vs. “ no ” ).
To test for trend, category of alcohol consumption was included
in the multivariate model as an ordinal variable (with category
values taking the median of the range for the whole group)
and nondrinkers were excluded. Furthermore, with the aim of
exploring the shape of the dose – response relation between alco-
hol consumption and risk of BE, we fi tted a logistic regression
model with restricted cubic spline for average lifetime alcohol con-
sumption (in drinks / week) as a continuous measure by means of
generalized additive logistic models (using the CRAN package
mgcv in R soft ware), adjusted for the same covariates. Smoothing
splines fi xed at 3 degrees of freedom were used to test for signi-
fi cance of nonlinearity against the linear eff ect. Finally, to assess
possible eff ect modifi cation, stratifi ed analyses were performed
when appropriate. We included an interaction term in the full
model to assess the statistical signifi cance of the diff erences in
association across strata. Unless otherwise specifi ed, all analyses
were conducted in SAS (version 9.1; SAS Institute, Cary, NC) and
all tests for statistical signifi cance were two sided at α = 0.05.
RESULTS Table 1 shows selected characteristics of cases and controls.
Distributions for age and sex were similar for nondysplastic BE
cases and population controls due to the frequency matching,
although dysplastic BE cases were somewhat older and more
likely to be male than population controls. Th e infl ammation
controls were younger and were more likely to be female than the
other groups. Compared with population controls, BE cases were
more likely to have a lower education status and be overweight
or obese. BE cases and infl ammation controls were more likely to
have smoked and have experienced GER symptoms than popu-
lation controls. Among cases and controls, life-long nondrinkers
were similar to those participants who consumed < 1 drink / week
of alcohol and so these groups were combined for analyses
(data not shown).
Lifetime alcohol consumption Overall, 11, 10, 13, and 4 % of population controls, infl ammation
controls, nondysplastic BE, and dysplastic BE patients, respectively,
reported never consuming alcohol over their lifetime. Among
population controls, 5 % of men and 21 % of women were life-
long nondrinkers ( Table 2 ). Among all population controls who
had drunk alcohol, the median lifetime total alcohol consump-
tion was 12 and 4 drinks / week for men and women, respectively.
Wine was the major contributor to total alcohol consumption for
women and beer for men, whereas median consumption of spirits
was considerably lower than that of beer or wine in most groups
of cases and controls, and consumption of port or fortifi ed wines
was negligible. Average lifetime alcohol intakes were similar for
controls with frequent GER symptoms as those with infrequent or
no symptoms (median lifetime total alcohol consumption: 10, 9,
8 drinks / week, respectively). As expected, the alcohol consump-

© 2011 by the American College of Gastroenterology The American Journal of GASTROENTEROLOGY
1223
ES
OP
HA
GU
S
Alcohol Consumption and Barrett ’ s Esophagus
tion among current smokers was considerably higher than that
for ex-smokers and never smokers (population controls: median
lifetime total alcohol consumption: 17, 13, 5 drinks / week,
respectively).
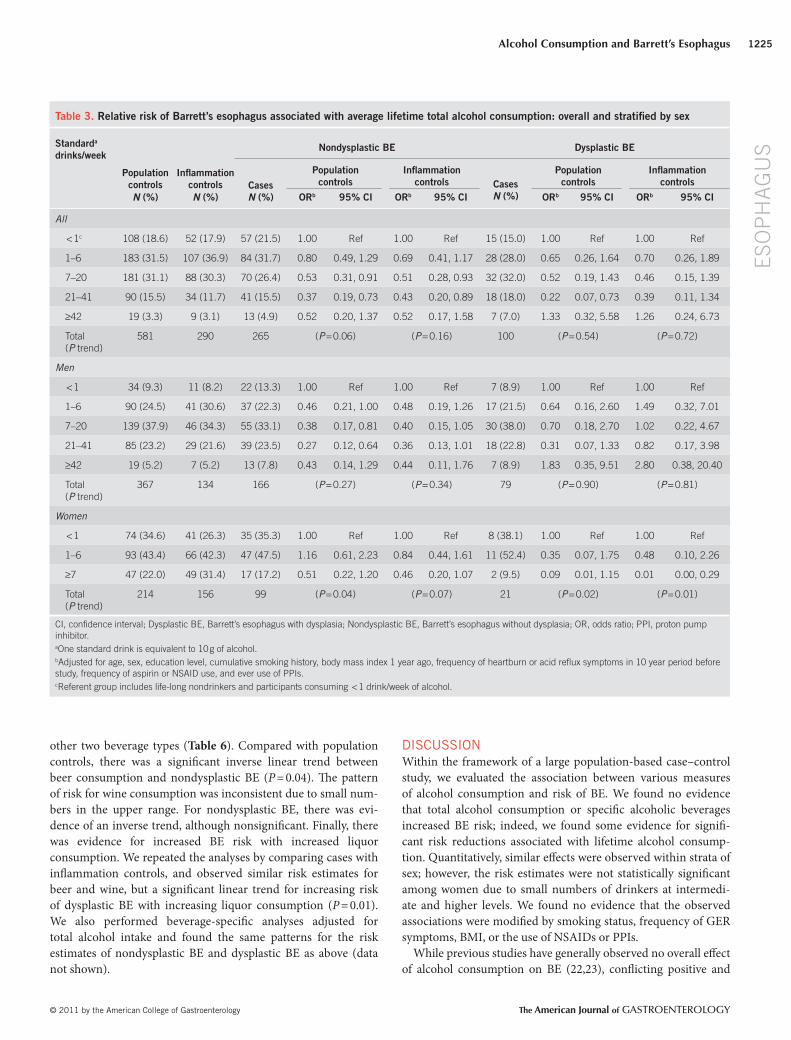
Amount of alcohol and risk of BE . Table 3 presents the overall
and sex-specifi c risk estimates for associations between lifetime
total alcohol consumption and BE. Th e risk patterns overall were
similar, and numbers of women were few, so for the remainder
of the paper the combined results have been presented. All fi nd-
ings reported below compare cases vs. population controls, unless
otherwise noted. We observed trends for lower risks of BE associ-
ated with intermediate or higher levels of lifetime total alcohol
consumption. Th ere was a signifi cant inverse association between
Table 1 . Characteristics of population and infl ammation controls, and nondysplastic BE and dysplastic BE patients
Variables Categories Population controls
( n = 644) Infl ammation controls
( n =313) Nondysplastic BE
( n = 285) Dysplastic BE
( n = 108) n ( % ) n ( % ) n ( % ) n ( % )
Age, years Mean (s.d.) 57.9 (11.3) 53.5 (12.7) 58.2 (11.9) 62.1 (10.9)
Sex
Female 229 (35.6) 166 (53.0) 104 (36.5) 23 (21.3)
Male 415 (64.4) 147 (47.0) 181 (63.5) 85 (78.7)
Highest level of education
School only 245 (38.0) 116 (37.1) 138 (48.4) 38 (35.2)
Technical college / diploma 254 (39.4) 129 (41.2) 111 (38.9) 56 (51.9)
University 145 (22.5) 68 (21.7) 36 (12.6) 14 (13.0)
Alcohol
Nondrinker 70 (10.9) 32 (10.2) 37 (13.0) 4 (3.7)
Current drinker 538 (83.5) 261 (83.4) 215 (75.4) 92 (85.2)
Ex-drinker 36 (5.6) 20 (6.4) 33 (11.6) 12 (11.1)
BMI last year (kg / m 2 )
< 25 232 (36.4) 119 (38.5) 87 (31.1) 30 (28.3)
25 – 29.9 263 (41.3) 124 (40.1) 110 (39.3) 48 (45.3)
≥ 30 142 (22.3) 66 (21.4) 83 (29.6) 28 (26.4)
Frequency of heartburn or acid refl ux symptoms 10 years ago
Never 329 (52.4) 69 (23.2) 43 (15.7) 11 (10.7)
Less than weekly 241 (38.4) 140 (47.0) 110 (40.1) 42 (40.8)
At least weekly 58 (9.2) 89 (29.9) 121 (44.2) 50 (48.5)
Smoking status
Non smoker 335 (54.6) 149 (49.2) 96 (34.9) 26 (25.0)
Ex-smoker 206 (33.6) 115 (38.0) 131 (47.6) 57 (54.8)
Current smoker 72 (11.7) 39 (12.9) 48 (17.5) 21 (20.2)
Frequency of aspirin or other NSAID use in the past 5 years
Never 146 (22.7) 67 (21.5) 72 (25.4) 24 (22.2)
Less than weekly 362 (56.3) 175 (56.1) 135 (47.5) 48 (44.4)
At least weekly 135 (21.0) 70 (22.4) 77 (27.1) 36 (33.3)
BMI, body mass index; dysplastic BE, Barrett’s esophagus with dysplasia; nondysplastic BE, Barrett’s esophagus without dysplasia; NSAID, nonsteroidal anti-infl ammatory drug. Some variables have missing values. Only observations with complete data on all confounding factors were used in the regression analysis (59 population controls, 22 infl ammation controls, 18 nondysplastic BE, and 7 dysplastic BE had at least one of the observations missing and hence were excluded from multivariate regression analysis). There was no difference in the alcohol consumption of these 106 missing observations compared with those with complete observations.

The American Journal of GASTROENTEROLOGY VOLUME 106 | JULY 2011 www.amjgastro.com
1224 E
SO
PH
AG
US
Thrift et al.
BE risk decreasing with increasing levels of total alcohol consump-
tion. When we repeated all of the stratifi ed analyses comparing
cases with infl ammation controls, we obtained similar patterns
of decreasing risk with increasing total alcohol consumption
(data not shown). Stratifi ed analyses could not be performed for
dysplastic BE due to the small number of participants who were
life-long nondrinkers or consumed < 1 drink / week.
Recent alcohol consumption and risk of BE Both population controls and BE patients reported slightly lower
levels of alcohol consumption during their current age interval
than during the age interval 20 – 29 years, but the reductions in
intake were similar for both groups. When we restricted the com-
parison to recent total alcohol consumption, nondysplastic BE
cases still reported consistently lower intakes than population
or infl ammation controls ( Table 5 ), although the disparity was
less marked than lifetime total alcohol consumption. We found
no consistent association between recent intake and dysplas-
tic BE. We performed stratifi ed analyses for nondysplastic BE
and found similar patterns of risk for recent total alcohol
consumption across all strata of known risk factors for BE (data
not shown).
Alcoholic beverage types and risk of BE Finally, we separately analyzed intake of beer, wine, and spirits
for associations with BE. For each of these analyses, we included
a term in the model to adjust for alcohol intake from the
the consumption of 7 – 20 drinks / week (OR = 0.53, 95 % CI: 0.31 –
0.91) and 21 – 41 drinks / week (OR = 0.37, 95 % CI: 0.19 – 0.73) of
alcohol and risk of nondysplastic BE. Similarly, those who con-
sumed 21 – 41 drinks / week of alcohol had lower risks of dysplas-
tic BE (OR = 0.22, 95 % CI: 0.07 – 0.73). We repeated the analyses
for lifetime total alcohol consumption by comparing cases with
infl ammation controls, and observed very similar estimates of
risk ( Table 3 ).
We also estimated risks of BE associated with lifetime total alco-
hol consumption as a continuous measure using both linear and
nonlinear regression functions and assigning nondrinkers a value
0 drink / week. Figure 1 shows the fi tted spline regression curve
and its 95 % CI, indicating that participants with lifetime total
alcohol consumption in the intermediate to higher range had
reduced risks of BE. Th ere was a statistically signifi cant nonlinear
dose relationship between lifetime total alcohol consumption and
nondysplastic BE ( P = 0.01 testing for departure from linearity)
and evidence for a nonlinear dose relationship with dysplastic BE
( P = 0.06).
Assessing possible eff ect modifi cation . Th e strength of the inverse
association between high lifetime total alcohol consumption and
nondysplastic BE was consistent across strata of smoking status,
frequency of GER symptoms, BMI, and use of NSAIDs ( Table 4 ).
We observed a statistically signifi cant interaction ( P interaction
= 0.01)
between PPI use and lifetime total alcohol consumption. How-
ever, the pattern across all cells was similar with the nondysplastic
Table 2 . Distribution of average lifetime alcohol consumption stratifi ed by sex among BE cases and controls
Average lifetime alcohol consump-tion (standard a drinks / week)
Men Women
Population controls ( n = 415)
Infl ammation controls ( n =147)
Nondys-plastic BE ( n =181)
Dysplastic BE ( n = 85)
Population controls ( n = 229)
Infl ammation controls ( n =166)
Nondys-plastic BE ( n =104)
Dysplastic BE ( n = 23)
Ever drank alcohol 94.9 % 93.2 % 92.3 % 95.3 % 78.6 % 86.7 % 77.9 % 100 %
Age started drinking median (25th, 75th percentile)
18 Years (17, 20)
18 Years (17, 20)
18 Years (17, 20)
18 Years (17, 18)
20 Years (18, 24)
18 Years (17, 22)
19 Years (18, 21)
19 Years (18, 22)
Duration of drinking median (25th, 75th percentile)
36 Years (29, 43)
32 Years (22, 42)
35 Years (27, 43)
41 Years (35, 48)
32 Years (21, 39)
27 Years (17, 35)
29 Years (21, 39)
34 Years (25, 45)
Total alcohol median (25th, 75th percentile)
12 (6, 25) 12 (5, 24) 11 (6, 29) 15 (7, 26) 4 (2, 8) 5 (2, 9) 4 (2, 7) 2 (1, 6)
Beer median (25th, 75th percentile)
8 (3, 17) 7 (2, 19) 7 (3, 19) 7 (2, 17) 0 (0, 1) 0 (0, 1) 0 (0, 1) 0 (0, 1)
Wine median (25th, 75th percentile)
1 (0, 4) 1 (0, 3) 1 (0, 3) 1 (0, 6) 2 (1, 5) 2 (0, 5) 1 (0, 4) 0 (0, 1)
Port / sherry median (25th, 75th percentile)
0 (0, 0) 0 (0, 0) 0 (0, 0) 0 (0, 0) 0 (0, 0) 0 (0, 0) 0 (0, 0) 0 (0, 0)
Spirits / liqueur median (25th, 75th percentile)
0 (0, 2) 0 (0, 2) 1 (0, 3) 1 (0, 3) 0 (0, 2) 1 (0, 2) 0 (0, 2) 0 (0, 1)
Dysplastic BE, Barrett’s esophagus with dysplasia; nondysplastic BE, Barrett’s esophagus without dysplasia. a One standard drink is equivalent to 10 g of alcohol. Alcohol intakes are described only for ever drinkers. Alcohol data were missing for a small number.
© 2011 by the American College of Gastroenterology The American Journal of GASTROENTEROLOGY
1225
ES
OP
HA
GU
S
Alcohol Consumption and Barrett ’ s Esophagus
other two beverage types ( Table 6 ). Compared with population
controls, there was a signifi cant inverse linear trend between
beer consumption and nondysplastic BE ( P = 0.04). Th e pattern
of risk for wine consumption was inconsistent due to small num-
bers in the upper range. For nondysplastic BE, there was evi-
dence of an inverse trend, although nonsignifi cant. Finally, there
was evidence for increased BE risk with increased liquor
consumption. We repeated the analyses by comparing cases with
infl ammation controls, and observed similar risk estimates for
beer and wine, but a signifi cant linear trend for increasing risk
of dysplastic BE with increasing liquor consumption ( P = 0.01).
We also performed beverage-specifi c analyses adjusted for
total alcohol intake and found the same patterns for the risk
estimates of nondysplastic BE and dysplastic BE as above (data
not shown).
DISCUSSION Within the framework of a large population-based case – control
study, we evaluated the association between various measures
of alcohol consumption and risk of BE. We found no evidence
that total alcohol consumption or specifi c alcoholic beverages
increased BE risk; indeed, we found some evidence for signifi -
cant risk reductions associated with lifetime alcohol consump-
tion. Quantitatively, similar eff ects were observed within strata of
sex; however, the risk estimates were not statistically signifi cant
among women due to small numbers of drinkers at intermedi-
ate and higher levels. We found no evidence that the observed
associations were modifi ed by smoking status, frequency of GER
symptoms, BMI, or the use of NSAIDs or PPIs.
While previous studies have generally observed no overall eff ect
of alcohol consumption on BE ( 22,23 ), confl icting positive and
Table 3 . Relative risk of Barrett’s esophagus associated with average lifetime total alcohol consumption: overall and stratifi ed by sex
Standard a drinks / week
Nondysplastic BE Dysplastic BE
Population
controls Infl ammation
controls Cases N ( % )
Population controls
Infl ammation controls Cases
N ( % )
Population controls
Infl ammation controls
N ( % ) N ( % ) OR b 95 % CI OR b 95 % CI OR b 95 % CI OR b 95 % CI
All
< 1 c 108 (18.6) 52 (17.9) 57 (21.5) 1.00 Ref 1.00 Ref 15 (15.0) 1.00 Ref 1.00 Ref
1 – 6 183 (31.5) 107 (36.9) 84 (31.7) 0.80 0.49, 1.29 0.69 0.41, 1.17 28 (28.0) 0.65 0.26, 1.64 0.70 0.26, 1.89
7 – 20 181 (31.1) 88 (30.3) 70 (26.4) 0.53 0.31, 0.91 0.51 0.28, 0.93 32 (32.0) 0.52 0.19, 1.43 0.46 0.15, 1.39
21 – 41 90 (15.5) 34 (11.7) 41 (15.5) 0.37 0.19, 0.73 0.43 0.20, 0.89 18 (18.0) 0.22 0.07, 0.73 0.39 0.11, 1.34
≥ 42 19 (3.3) 9 (3.1) 13 (4.9) 0.52 0.20, 1.37 0.52 0.17, 1.58 7 (7.0) 1.33 0.32, 5.58 1.26 0.24, 6.73
Total ( P trend)
581 290 265 ( P = 0.06) ( P = 0.16) 100 ( P = 0.54) ( P = 0.72)
Men
< 1 34 (9.3) 11 (8.2) 22 (13.3) 1.00 Ref 1.00 Ref 7 (8.9) 1.00 Ref 1.00 Ref
1 – 6 90 (24.5) 41 (30.6) 37 (22.3) 0.46 0.21, 1.00 0.48 0.19, 1.26 17 (21.5) 0.64 0.16, 2.60 1.49 0.32, 7.01
7 – 20 139 (37.9) 46 (34.3) 55 (33.1) 0.38 0.17, 0.81 0.40 0.15, 1.05 30 (38.0) 0.70 0.18, 2.70 1.02 0.22, 4.67
21 – 41 85 (23.2) 29 (21.6) 39 (23.5) 0.27 0.12, 0.64 0.36 0.13, 1.01 18 (22.8) 0.31 0.07, 1.33 0.82 0.17, 3.98
≥ 42 19 (5.2) 7 (5.2) 13 (7.8) 0.43 0.14, 1.29 0.44 0.11, 1.76 7 (8.9) 1.83 0.35, 9.51 2.80 0.38, 20.40
Total ( P trend)
367 134 166 ( P = 0.27) ( P = 0.34) 79 ( P = 0.90) ( P = 0.81)
Women
< 1 74 (34.6) 41 (26.3) 35 (35.3) 1.00 Ref 1.00 Ref 8 (38.1) 1.00 Ref 1.00 Ref
1 – 6 93 (43.4) 66 (42.3) 47 (47.5) 1.16 0.61, 2.23 0.84 0.44, 1.61 11 (52.4) 0.35 0.07, 1.75 0.48 0.10, 2.26
≥ 7 47 (22.0) 49 (31.4) 17 (17.2) 0.51 0.22, 1.20 0.46 0.20, 1.07 2 (9.5) 0.09 0.01, 1.15 0.01 0.00, 0.29
Total ( P trend)
214 156 99 ( P = 0.04) ( P = 0.07) 21 ( P = 0.02) ( P = 0.01)
CI, confi dence interval; Dysplastic BE, Barrett’s esophagus with dysplasia; Nondysplastic BE, Barrett’s esophagus without dysplasia; OR, odds ratio; PPI, proton pump inhibitor. a One standard drink is equivalent to 10 g of alcohol. b Adjusted for age, sex, education level, cumulative smoking history, body mass index 1 year ago, frequency of heartburn or acid refl ux symptoms in 10 year period before study, frequency of aspirin or NSAID use, and ever use of PPIs. c Referent group includes life-long nondrinkers and participants consuming < 1 drink / week of alcohol.

The American Journal of GASTROENTEROLOGY VOLUME 106 | JULY 2011 www.amjgastro.com
1226 E
SO
PH
AG
US
Thrift et al.
however, we found no evidence that BE patients drank more alco-
hol than controls at any stage. Th is was so regardless of whether we
compared BE patients with population controls or infl ammation
controls. Lifetime consumption is arguably a more stable expo-
sure measure than recent exposure, as it is less subject to “ reverse
causality ” bias.
We observed strongest inverse associations with lifetime beer
consumption, although we also observed inverse associations with
lifetime wine consumption. While previous studies have reported
no association with beer ( 22,23,27 ), the inverse association between
wine consumption and BE in our study agrees with the fi ndings
of two comparable population-based studies of BE conducted in
Ireland ( 23 ) and Northern California ( 22 ). While the overall low
levels of liquor consumption observed in our study meant that we
had limited statistical power to detect an eff ect, the suggested posi-
tive association agrees with the results from two previous studies
( 27,28 ). Th ese results accord with the fi ndings from prior studies
of EAC, which have reported that modest wine consumption (and
possibly other alcohol) is associated with reduced risks of EAC
( 13,23 ).
A number of plausible mechanisms have been proposed to
explain these fi ndings. For example, wine ( 30 ), and to a lesser
extent beer ( 31 ), contain antioxidants, which may confer benefi ts
when consumed ( 32 ), and the protective eff ects of ethanol con-
sumption may also arise from reductions in insulin resistance or
increased levels of lipoproteins ( 33 ). Another possibility is that
the seemingly protective eff ect of lifetime alcohol consumption
may simply be an aversion eff ect, as BE patients may refrain from
alcohol consumption over time aft er enduring prolonged refl ux
discomfort. Infl ammation controls may also reduce their alcohol
consumption due to underlying GER, thus making them similar
in that regard to BE patients. For comparisons with infl ammation
controls, we observed similar reduced risks of BE, suggesting that
alcohol avoidance by BE patients is unlikely to fully explain the
observed eff ects. Additionally, if this were true, we would have
expected to see strengthened inverse associations with current
consumption. However, compared with the eff ects for lifetime
alcohol consumption, the inverse associations were attenuated
for recent alcohol consumption. Finally, data suggest that people
with GER do not refrain from alcohol consumption, and do not
consume less alcohol than those without. Taken together with
the lack of evidence for eff ect modifi cation by GER symptoms,
there seems little to suggest that negative confounding by GER
is a plausible explanation for the observed inverse associations
with alcohol.
Strengths of the present study include the prospective, popu-
lation-based recruitment of patients with BE, the use of popula-
tion controls, the large sample size and collection of information
on a wide range of potential confounders. Strict and consistent
criteria were adopted throughout the study ascertainment period,
using standardized histologic and endoscopic defi nitions to make
the formal diagnosis of BE and dysplasia ( 34 ). We minimized
the possibility of recall bias, associated with long-standing aware-
ness of a BE diagnosis and refl ection on possible causes, by recruit-
ing incident cases soon aft er diagnosis. Comprehensive measures
negative associations have been reported for consumption of spe-
cifi c alcoholic beverages. Th ese inconsistent fi ndings may result
from information bias or limited power due to small numbers
of drinkers at higher levels. Because these studies did not collect
information on lifetime consumption, it is possible that partici-
pants may have been misclassifi ed with respect to alcohol expo-
sure. We assessed this in our study by considering both lifetime
and recent alcohol consumption. For recent consumption, the
inverse associations with nondysplastic BE were attenuated and we
saw no association with dysplastic BE. One possible explanation
for these somewhat discrepant fi ndings might be that BE patients
may have drunk more alcohol in early life, and then reduced their
intake in response to either their symptoms or their diagnosis. In
our study, both cases and controls reported higher levels of alcohol
intake on average between ages 20 – 49 years than aft er 50 years;
10
1
Odd
s ra
tio
0.1
0 10 20 30 40 50 60 70
Average lifetime total alcohol consumption (drinks/week)80 90 100 110 120 130
10
1
Odd
s ra
tio
0.1
0 10 20
Average lifetime total alcohol consumption (drinks/week)30 40 50 60 70 80 90
a
b
Figure 1 . Dose – response relation of average lifetime total alcohol consumption on ( a ) nondysplastic Barrett ’ s esophagus (BE) ( P = 0.01) and ( b ) dysplastic BE ( P = 0.06), compared with population controls. Results were obtained using generalized additive logistic models with a 3-degrees of freedom cubic spline function. The solid line represents the odds ratio, and the dotted lines represent its 95 % confi dence interval. The dashed line represents the null hypothesis of no association. The vertical axis is on a log scale. Odds ratios were adjusted for age, sex, education level, cumu-lative smoking history, body mass index 1 year ago, frequency of heartburn or refl ux symptoms in the 10-year period before study, frequency of aspirin or nonsteroidal anti-infl ammatory drug (NSAID) use, and ever use of proton pump inhibitors (PPIs).

© 2011 by the American College of Gastroenterology The American Journal of GASTROENTEROLOGY
1227
ES
OP
HA
GU
S
Alcohol Consumption and Barrett ’ s Esophagus
of lifetime total and beverage-specifi c alcohol consumption were
elicited to ensure that changes in drinking patterns were recorded
and integrated into measures of overall alcohol consumption.
Participants and interviewers were blinded to the specifi c study
hypotheses, reducing the possibility of diff erential recall bias.
Finally, inclusion of infl ammation controls should allay possible
concerns over detection bias, since those selected in this group
navigated exactly the same diagnostic pathways as the cases with
BE, and therefore would be expected to be subject to the same
selection pressures. Our fi ndings that overall alcohol consumption
was generally associated with reduced risks of BE, regardless of the
source of controls, suggests that our fi ndings are unlikely to be due
to bias in ascertainment or detection.
A limitation of these analyses was the relatively low rates of
participation, raising concerns about possible biased selection of
cases and controls. Th e greatest threat to validity would be if the
participating population controls diff ered from the “ true ” popula-
tion in terms of their alcohol consumption. Th e pattern of lifetime
alcohol consumption among population controls was similar to
that observed in the general population of the same age and sex
composition ( 35 ), although the proportion of nondrinkers among
our population controls was slightly higher (10.9 vs. 7.7 % ). Th is
would not however make alcohol look protective. As the preva-
lence of known causal factors for BE was similar in our popula-
tion controls to other Australian studies ( 36,37 ), we believe the
likelihood of biased selection to be no diff erent from previous
studies. As the majority of BE cases remain undiagnosed in the
general population ( 38 – 40 ), our study may be subject to selec-
tion bias if, for example, patients diagnosed diff er from those who
remain undiagnosed. However, this is the same for all studies of
BE. Moreover, if the prevalence of undiagnosed BE in the general
population is high, this would attenuate the observed inverse asso-
ciations since our control group would very likely include some
people with undiagnosed BE. Th ere may also have been random
Table 4 . Relative risk of nondysplastic Barrett’s esophagus associated with average lifetime total alcohol consumption: stratifi ed by risk factors for BE ( vs. population controls )
< 1 drink / week a 1 – 6 drinks / week 7 – 20 drinks / week ≥ 21 drinks / week
n ( % ) OR b
(95 % CI) n ( % ) OR b
(95 % CI) n ( % ) OR b
(95 % CI) n ( % ) OR b
(95 % CI) P trend
Smoking status
Never smoker 33 (36.3) 1.00 (Ref) 37 (40.7) 0.67 (0.34, 1.33) 17 (18.7) 0.66 (0.29, 1.52) 4 (4.4) 0.32 (0.08, 1.25) P = 0.27
Ever smoker 24 (13.8) 1.00 (Ref) 47 (27.0) 0.82 (0.37, 1.79) 53 (30.5) 0.48 (0.22, 1.05) 50 (28.7) 0.43 (0.19, 1.00) P = 0.35
( P interaction) ( P = 0.53)
GER symptoms
Never or less than weekly
28 (18.9) 1.00 (Ref) 53 (35.8) 0.98 (0.56, 1.73) 42 (28.4) 0.59 (0.32, 1.12) 25 (16.9) 0.49 (0.23, 1.01) P = 0.16
At least weekly 29 (24.8) 1.00 (Ref) 31 (26.5) 0.44 (0.15, 1.28) 28 (23.9) 0.45 (0.13, 1.54) 29 (24.8) 0.26 (0.06, 1.06) P = 0.17
( P interaction) ( P = 0.61)
BMI (kg / m 2 )
< 25.0 16 (20.5) 1.00 (Ref) 30 (38.5) 0.71 (0.31, 1.63) 12 (15.4) 0.25 (0.09, 0.67) 20 (25.6) 0.43 (0.15, 1.27) P = 0.62
≥ 25.0 41 (21.9) 1.00 (Ref) 54 (28.9) 0.82 (0.45, 1.50) 58 (31.0) 0.75 (0.38, 1.48) 34 (18.2) 0.40 (0.18, 0.89) P = 0.06
( P interaction) ( P = 0.11)
PPI use
Never 36 (21.3) 1.00 (Ref) 60 (35.5) 1.04 (0.60, 1.83) 42 (24.9) 0.46 (0.24, 0.88) 31 (18.3) 0.41 (0.20, 0.87) P = 0.03
Ever 21 (21.9) 1.00 (Ref) 24 (25.0) 0.28 (0.10, 0.80) 28 (29.2) 0.73 (0.21, 2.55) 23 (23.9) 0.21 (0.05, 0.88) P = 0.79
( P interaction) ( P = 0.01)
NSAID use
Never or less than weekly
47 (21.3) 1.00 (Ref) 67 (30.3) 0.70 (0.42, 1.19) 65 (29.4) 0.53 (0.30, 0.94) 42 (19.0) 0.41 (0.20, 0.81) P = 0.14
At least weekly 10 (22.7) 1.00 (Ref) 17 (38.6) 1.69 (0.44, 6.41) 5 (11.4) 0.21 (0.04, 1.23) 12 (27.3) 0.22 (0.04, 1.36) P = 0.04
( P interaction) ( P = 0.17)
BMI, body mass index; CI, confi dence interval; GER, gastro-esophageal refl ux; NSAID, nonsteroidal anti-infl ammatory drug; OR, odds ratio; PPI, proton pump inhibitor. a Referent group includes life-long nondrinkers and participants consuming < 1 drink / week of alcohol. b Adjusted for age, sex, education level, cumulative smoking history, body mass index 1 year ago, frequency of heartburn or acid refl ux symptoms in 10-year period before study, frequency of aspirin or NSAID use, and ever use of PPIs, where appropriate.

The American Journal of GASTROENTEROLOGY VOLUME 106 | JULY 2011 www.amjgastro.com
1228 E
SO
PH
AG
US
Thrift et al.
public perception may be such that the resulting recall bias is likely
to increase self-reported alcohol consumption among dyspla-
sia patients, suggesting that our estimates may actually be biased
towards the null and may underestimate the true eff ect. Finally,
because of the small number of nonwhite participants in this study,
our fi ndings are limited to white populations.
In summary, our results provide no evidence that alcohol
increases the risk of BE. In fact, we found a reduced risk of BE
associated with increased alcohol consumption. Th e consist-
ency of our results according to selected causal factors, including
smoking status, GER symptoms, BMI, use of NSAIDs or PPIs,
reassures against a major role of confounding or eff ect modifi -
cation. However, the direct public health applications of these
misclassifi cation of alcohol consumption, that is, simple errors of
over- or under-reporting of alcohol intake that are similar among
cases and controls. Th e problems of misclassifi cation of exposure
are inherent in retrospective studies and would serve to attenuate
risk estimates.
Modest associations observed in case – control studies can result
from unmeasured or residual confounding. While the consistency
across strata is reassuring, we cannot completely exclude the pos-
sibility that some residual negative confounding by an unmeas-
ured and uncontrolled factor may have occurred, although we
cannot speculate what that factor might be. Additionally, the risk
estimates for dysplastic BE may be subject to recall bias, resulting
from extended diagnostic awareness of their condition. However,
Table 5 . Relative risk of Barrett’s esophagus associated with average recent total alcohol consumption: overall and stratifi ed by sex
Standard a drinks / week
Nondysplastic BE Dysplastic BE
Population controls, N ( % )
Infl ammation controls, N ( % )
Population controls
Infl ammation controls
Population controls
Infl ammation controls
Cases, N ( % ) OR b 95 % CI OR b 95 % CI
Cases, N ( % ) OR b 95 % CI OR b 95 % CI
All
< 1 c 164 (28.2) 74 (25.7) 88 (33.3) 1.00 Ref 1.00 Ref 24 (24.0) 1.00 Ref 1.00 Ref
1 – 6 194 (33.4) 118 (41.0) 82 (31.1) 0.88 0.58, 1.35 0.62 0.39, 0.99 27 (27.0) 0.91 0.42, 1.97 0.72 0.31, 1.67
7 – 20 164 (28.2) 70 (24.3) 59 (22.3) 0.52 0.32, 0.85 0.54 0.32, 0.94 29 (29.0) 0.77 0.34, 1.73 0.87 0.35, 2.15
21 – 41 47 (8.1) 22 (7.6) 30 (11.4) 0.85 0.45, 1.63 0.58 0.28, 1.21 17 (17.0) 1.75 0.65, 4.69 1.03 0.32, 3.32
≥ 42 12 (2.1) 4 (1.4) 5 (1.9) 0.62 0.18, 2.16 0.45 0.11, 1.92 3 (3.0) 2.01 0.36, 11.21 0.97 0.11, 8.29
Total ( P trend)
581 288 264 ( P = 0.58) ( P = 0.24) 100 ( P = 0.14) ( P = 0.75)
Men
< 1 75 (20.4) 22 (16.4) 40 (24.2) 1.00 Ref 1.00 Ref 13 (16.5) 1.00 Ref 1.00 Ref
1 – 6 110 (30.0) 50 (37.3) 47 (28.5) 1.14 0.62, 2.10 0.60 0.29, 1.24 22 (27.8) 1.73 0.62, 4.79 1.24 0.38, 4.06
7 – 20 124 (33.8) 42 (31.3) 46 (27.9) 0.62 0.33, 1.16 0.51 0.23, 1.09 24 (30.4) 0.99 0.36, 2.70 1.26 0.37, 4.31
21 – 41 46 (12.5) 16 (11.9) 27 (16.4) 1.00 0.48, 2.10 0.60 0.24, 1.51 17 (21.5) 2.66 0.88, 8.08 1.54 0.39, 6.00
≥ 42 12 (3.3) 4 (3.0) 5 (3.0) 0.83 0.23, 3.02 0.45 0.10, 2.10 3 (3.8) 3.06 0.51, 18.25 1.85 0.18, 18.46
Total ( P trend)
367 134 165 ( P = 0.95) ( P = 0.39) 79 ( P = 0.07) ( P = 0.51)
Women
< 1 89 (41.6) 52 (33.8) 48 (48.5) 1.00 Ref 1.00 Ref 11 (52.4) 1.00 Ref 1.00 Ref
1 – 6 84 (39.3) 68 (44.1) 35 (35.3) 0.73 0.38, 1.38 0.67 0.36, 1.25 5 (23.8) 0.08 0.01, 0.57 0.39 0.09, 1.63
≥ 7 41 (19.1) 34 (22.1) 16 (16.2) 0.42 0.18, 0.99 0.52 0.23, 1.17 5 (23.8) 0.86 0.13, 5.79 0.40 0.07, 2.23
Total ( P trend)
214 154 99 ( P = 0.36) ( P = 0.30) 21 ( P = 0.58) ( P = 0.29)
CI, confi dence interval; dysplastic BE, Barrett’s esophagus with dysplasia; nondysplastic BE, Barrett’s esophagus without dysplasia; OR, odds ratio; PPI, proton pump inhibitor. a One standard drink is equivalent to 10 g of alcohol. b Adjusted for age, sex, education level, cumulative smoking history, body mass index 1 year ago, frequency of heartburn or acid refl ux symptoms in 10-year period before study, frequency of aspirin or NSAID use, and ever use of PPIs. c Referent group includes life-long nondrinkers and participants consuming < 1 drink / week of alcohol.

© 2011 by the American College of Gastroenterology The American Journal of GASTROENTEROLOGY
1229
ES
OP
HA
GU
S
Alcohol Consumption and Barrett ’ s Esophagus
fi ndings are limited, considering the casual link between mod-
erate-to-heavy alcohol consumption with increased risks of
several cancers ( 12 ). Nonetheless, given the rising incidence
of EAC and BE, it is important to understand the interplay of
dietary and lifestyle factors that infl uence the development of
these conditions.
ACKNOWLEDGMENTS We gratefully acknowledge the cooperation of the following institu-
tions: Sullivan and Nicolaides Pathology (Brisbane); Queensland
Medical Laboratory (Brisbane); and Queensland Health Pathology
Services (Brisbane). We also acknowledge the contribution of the
study nurses and research assistants and thank all of the people who
participated in the study. Study of Digestive Health Investigators in-
clude Queensland Institute of Medical Research, Brisbane, Australia:
David C. Whiteman, MBBS, PhD; Ad è le C. Green, MBBS, PhD;
Nicholas K. Hayward, PhD; Peter G. Parsons, PhD; Sandra J. Pavey,
PhD, David M. Purdie, PhD; Penelope M. Webb, DPhil. University
of Queensland, Brisbane, Australia: David Gotley, FRACS; Mark
Smithers, FRACS. Th e University of Adelaide, Adelaide, Australia:
Glyn G. Jamieson, FRACS. Flinders University, Adelaide, Australia:
Paul Drew, PhD; David I. Watson, FRACS. Envoi Pathology, Bris-
bane, Australia: Andrew Clouston, PhD, FRCPA. Study of Digestive
Health Research Staff include Project Manager: Suzanne O ’ Brien
(QIMR); Data Manager: Troy Sadkowsky (QIMR); Research Nurses:
Andrea McMurtrie, Linda Terry, Michael Connard,
Lea Jackman, Susan Perry, Marcia Davis; Clinical Collaborators:
Ian Brown (S & N Pathology), Neal Walker (QML Pathology).
CONFLICT OF INTEREST Guarantor of the article: David C. Whiteman, MBBS, PhD.
Specifi c author contributions: Performed the statistical analysis
and wrote the fi rst draft of the manuscript: Aaron P. Th rift ; designed
the original study, obtained funding, and provided overall supervi-
sion: David C. Whiteman, Penelope M. Webb, and Ad è le C. Green;
assisted in data preparation and interpretation: Kylie J. Smith, Kylie
Mallitt, and Nirmala Pandeya. All authors read and approved the
fi nal version of the manuscript.
Table 6 . Relative risk of Barrett’s esophagus associated with average lifetime beverage-specifi c alcohol consumption
Standard a drinks / week
Nondysplastic BE Dysplastic BE
Population controls, N ( % )
Infl ammation controls, N ( % )
Population controls
Infl ammation controls
Population controls
Infl ammation controls
Cases, N ( % ) OR b 95 % CI OR b 95 % CI
Cases, N ( % ) OR b 95 % CI OR b 95 % CI
Beer
< 1 c 239 (41.2) 143 (49.3) 110 (41.5) 1.00 Ref 1.00 Ref 31 (31.0) 1.00 Ref 1.00 Ref
1 – 6 156 (26.8) 74 (25.5) 77 (29.1) 0.90 0.57, 1.44 1.05 0.64, 1.72 30 (30.0) 0.86 0.38, 1.98 0.95 0.38, 2.38
7 – 20 115 (19.8) 45 (15.5) 43 (16.2) 0.53 0.29, 0.98 0.64 0.33, 1.23 23 (23.0) 0.50 0.19, 1.30 0.55 0.19, 1.59
≥ 21 71 (12.2) 28 (9.7) 35 (13.2) 0.49 0.25, 0.96 0.57 0.28, 1.18 16 (16.0) 0.53 0.17, 1.60 0.63 0.19, 2.07
Total ( P trend)
581 290 265 ( P = 0.04) ( P = 0.08) 100 ( P = 0.30) ( P = 0.34)
Wine
< 1 291 (50.1) 141 (48.6) 145 (54.7) 1.00 Ref 1.00 Ref 57 (57.0) 1.00 Ref 1.00 Ref
1 – 6 236 (40.6) 124 (42.8) 95 (35.8) 0.92 0.64, 1.34 0.98 0.66, 1.46 28 (28.0) 0.56 0.29, 1.07 0.69 0.33, 1.41
≥ 7 54 (9.3) 25 (8.6) 25 (9.4) 0.79 0.44, 1.42 1.08 0.55, 2.14 15 (15.0) 0.97 0.41, 2.33 1.31 0.45, 3.82
Total ( P trend)
581 290 265 ( P = 0.53) ( P = 0.66) 100 ( P = 0.85) ( P = 0.75)
Liquor
< 1 395 (68.0) 191 (65.9) 164 (61.9) 1.00 Ref 1.00 Ref 59 (59.0) 1.00 Ref 1.00 Ref
1 – 6 165 (28.4) 85 (29.3) 83 (31.3) 1.03 0.71, 1.50 1.39 0.91, 2.12 32 (32.0) 0.95 0.52, 1.73 1.42 0.66, 3.03
≥ 7 21 (3.6) 14 (4.8) 18 (6.8) 1.23 0.54, 2.82 1.75 0.72, 4.21 9 (9.0) 1.80 0.55, 5.93 6.80 1.65, 28.07
Total ( P trend)
581 290 265 ( P = 0.60) ( P = 0.12) 100 ( P = 0.40) ( P = 0.01)
CI, confi dence interval; dysplastic BE, Barrett’s esophagus with dysplasia; nondysplastic BE, Barrett’s esophagus without dysplasia; OR, odds ratio; PPI, proton pump inhibitor. a One standard drink is equivalent to 10 g of alcohol. b Adjusted for age, sex, education level, cumulative smoking history, body mass index 1 year ago, frequency of heartburn or acid refl ux symptoms in 10 year period before study, frequency of aspirin or NSAID use, ever use of PPIs, and total alcohol intake of other beverages consumed. c Referent group includes life-long nondrinkers and participants consuming < 1 drink / week of alcohol.

The American Journal of GASTROENTEROLOGY VOLUME 106 | JULY 2011 www.amjgastro.com
1230 E
SO
PH
AG
US
Thrift et al.
13 . Pandeya N , Williams G , Green AC et al. Alcohol consumption and the risks of adenocarcinoma and squamous cell carcinoma of the esophagus . Gastroenterology 2009 ; 136 : 1215 – 24 .
14 . Pelucchi C , Gallus S , Garavello W et al. Alcohol and tobacco use, and cancer risk for upper aerodiaestive tract and liver . Eur J Cancer Prev 2008 ; 17 : 340 – 4 .
15 . Kabat GC , Ng SKC , Wynder EL . Tobacco, alcohol intake, and diet in relation to adenocarcinoma of the esophagus and gastric cardia . Cancer Causes Control 1993 ; 4 : 123 – 32 .
16 . Steevens J , Schouten LJ , Goldbohm RA et al. Alcohol consumption, cigarette smoking and risk of subtypes of oesophageal and gastric cancer: a prospective cohort study . Gut 2010 ; 59 : 39 – 48 .
17 . Vioque J , Barber X , Bolumar F et al. Esophageal cancer risk by type of alcohol drinking and smoking: a case-control study in Spain . BMC Cancer 2008 ; 8 : 221 .
18 . Lagergren J , Bergstrom R , Lindgren A et al. Th e role of tobacco, snuff and alcohol use in the aetiology of cancer of the oesophagus and gastric cardia . Int J Cancer 2000 ; 85 : 340 – 6 .
19 . Gammon MD , Schoenberg JB , Ahsan H et al. Tobacco, alcohol, and socio-economic status and adenocarcinomas of the esophagus and gastric cardia . J Natl Cancer Inst 1997 ; 89 : 1277 – 84 .
20 . Wu AH , Wan P , Bernstein L . A multiethnic population-based study of smoking, alcohol and body size and risk of adenocarcinomas of the stomach and esophagus (United States) . Cancer Causes Control 2001 ; 12 : 721 – 32 .
21 . Lindblad M , Rodriguez LAG , Lagergren J . Body mass, tobacco and alcohol and risk of esophageal, gastric cardia, and gastric non-cardia adenocarcino-ma among men and women in a nested case-control study . Cancer Causes Control 2005 ; 16 : 285 – 94 .
22 . Kubo A , Levin TR , Block G et al. Alcohol types and sociodemographic characteristics as risk factors for Barrett’s esophagus . Gastroenterology 2009 ; 136 : 806 – 15 .
23 . Anderson LA , Cantwell MM , Watson RGP et al. Th e association between alcohol and refl ux esophagitis, Barrett’s esophagus, and esophageal adenocarcinoma . Gastroenterology 2009 ; 136 : 799 – 805 .
24 . Johansson J , Hakansson HO , Mellblom L et al. Risk factors for Barrett’s oeso-phagus: a population-based approach . Scand J Gastroenterol 2007 ; 42 : 148 – 56 .
25 . Conio M , Filiberti R , Blanchi S et al. Risk factors for Barrett’s esophagus: a case-control study . Int J Cancer 2002 ; 97 : 225 – 9 .
26 . Ronkainen J , Aro P , Storskrubb T et al. Prevalence of Barrett’s esophagus in the general population: an endoscopic study . Gastroenterology 2005 ; 129 : 1825 – 31 .
27 . Veugelers PJ , Porter GA , Guernsey DL et al. Obesity and lifestyle risk factors for gastroesophageal refl ux disease, Barrett esophagus and esophageal adenocarcinoma . Dis Esophagus 2006 ; 19 : 321 – 8 .
28 . Ritenbaugh C , Sampliner R , Aickin M et al. Risk factors for Barrett’s oesophagus: a life history approach to behavioural assessment in the distant past . Eur J Cancer Prev 1995 ; 4 : 459 – 68 .
29 . Smith KJ , O ’ Brien SM , Green AC et al. Current and past smoking signifi -cantly increase risk for Barrett’s esophagus . Clin Gastroenterol Hepatol 2009 ; 7 : 840 – 8 .
30 . Bianchini F , Vainio H . Wine and resveratrol: mechanisms of cancer prevention? Eur J Cancer Prev 2003 ; 12 : 417 – 25 .
31 . Gerhauser C . Beer constituents as potential cancer chemopreventive agents . Eur J Cancer 2005 ; 41 : 1941 – 54 .
32 . Kubo A , Levin TR , Block G et al. Dietary antioxidants, fruits, and vegetables and the risk of Barrett’s esophagus . Am J Gastroenterol 2008 ; 103 : 1614 – 23 .
33 . Vasdev S , Gill V , Singal PK . Benefi cial eff ect of low ethanol intake on the cardiovascular system: possible biochemical mechanisms . Vasc Health Risk Manag 2006 ; 2 : 263 – 76 .
34 . Sampliner RE . Updated guidelines for the diagnosis, surveillance, and therapy of Barrett’s esophagus . Am J Gastroenterol 2002 ; 97 : 1888 – 95 .
35 . Australian Bureau of Statistics . Apparent Consumption of Alcohol, Austral-ia, 2004 – 2005 . Vol cat. no. 4307.0.55.001. Released 27 June 2005. Australian Bureau of Statistics: Canberra , 2006 .
36 . Australian Bureau of Statistics . National Health Survey: Summary of Results 2007 – 2008 . Vol cat. no. 4364.0. Released 25 August 2009. Australian Bureau of Statistics: Canberra , 2009 .
37 . Watson DI , Lally CJ . Prevalence of symptoms and use of medication for gastro-esophageal refl ux in an Australian community . World J Surg 2009 ; 33 : 88 – 94 .
38 . Cameron AJ , Zinsmeister AR , Ballard DJ et al. Prevalence of columnar-lined (Barrett ’ s) esophagus. Comparison of population-based clinical and autopsy fi ndings . Gastroenterology 1990 ; 99 : 918 – 22 .
39 . Cameron AJ , Lomboy CT . Barrett ’ s esophagus: age, prevalence, and extent of columnar epithelium . Gastroenterology 1992 ; 103 : 1241 – 5 .
40 . Gerson LB , Shetler K , Triadafi lopoulos G . Prevalence of Barrett ’ s esophagus in asymptomatic individuals . Gastroenterology 2002 ; 123 : 461 – 7 .
Financial support: Th is publication was supported by grant number
5 RO1 CA 001833-02 from the National Cancer Institute. Its contents
are solely the responsibility of the authors and do not necessarily
represent the offi cial views of the National Cancer Institute. A.P.T.
is supported by an Australian Postgraduate Award (University of
Queensland) and the Cancer Council NSW STREP grant 08-04. N.P.
and P.M.W. are supported by Fellowships from the National Health
and Medical Research Council of Australia. D.C.W. is supported by a
Future Fellowship from the Australian Research Council.
Potential competing interests: None.
Study Highlights
WHAT IS CURRENT KNOWLEDGE 3 Barrett ’ s esophagus, a metaplastic change of the esopha-
geal lining, is the only known precursor to esophageal adenocarcinoma.
3 Alcohol is an esophageal carcinogen, and thus may increase the risk of Barrett ’ s metaplasia directly or indirectly by increasing the frequency of gastro-esophageal refl ux.
3 Findings from previous studies assessing alcohol as a risk factor for Barrett ’ s esophagus have been inconsistent, pos-sibly due to differences in measuring alcohol consumption.
WHAT IS NEW HERE 3 There was no evidence that alcohol consumption increased
the risk of Barrett ’ s esophagus; indeed, there was evidence for signifi cant risk reductions with lifetime alcohol consumption.
3 Alcohol avoidance by patients with Barrett ’ s esophagus is unlikely to fully explain the observed inverse associations.
3 Fears that modest alcohol consumption might promote Barrett ’ s esophagus or esophageal adenocarcinoma can be allayed.
REFERENCES 1 . Parkin DM , Bray F , Ferlay J et al. Global cancer statistics, 2002 . CA Cancer J
Clin 2005 ; 55 : 74 – 108 . 2 . Pohl H , Sirovich B , Welch HG . Esophageal adenocarcinoma incidence: are
we reaching the peak? Cancer Epidemiol Biomarkers Prev 2010 ; 19 : 1468 – 70 . 3 . Holmes RS , Vaughan TL . Epidemiology and pathogenesis of esophageal
cancer . Semin Radiat Oncol 2007 ; 17 : 2 – 9 . 4 . Brown LM , Devesa SS , Chow WH . Incidence of adenocarcinoma of the
esophagus among white Americans by sex, stage, and age . J Natl Cancer Inst 2008 ; 100 : 1184 – 7 .
5 . Bosetti C , Levi F , Ferlay J et al. Trends in oesophageal cancer incidence and mortality in Europe . Int J Cancer 2008 ; 122 : 1118 – 29 .
6 . Lord RVN , Law MG , Ward RL et al. Rising incidence of oesophageal adeno-carcinoma in men in Australia . J Gastroenterol Hepatol 1998 ; 13 : 356 – 62 .
7 . Reid BJ , Li XH , Galipeau PC et al. Barrett’s oesophagus and oesophageal adenocarcinoma: time for a new synthesis . Nat Rev Cancer 2010 ; 10 : 87 – 101 .
8 . Shaheen NJ , Crosby MA , Bozymski EM et al. Is there publication bias in the reporting of cancer risk in Barrett’s esophagus? Gastroenterology 2000 ; 119 : 333 – 8 .
9 . Sikkema M , De Jonge PJF , Steyerberg EW et al. Risk of esophageal adeno-carcinoma and mortality in patients with Barrett’s esophagus: a systematic review and meta-analysis . Clin Gastroenterol Hepatol 2010 ; 8 : 235 – 44 .
10 . Corrao G , Bagnardi V , Zambon A et al. A meta-analysis of alcohol consumption and the risk of 15 diseases . Prev Med 2004 ; 38 : 613 – 9 .
11 . International Agency for Research on Cancer . IARC Monographs on the Evaluation of Carcinogenic Risks to Humans, Alcohol Drinking (IARC Monographs, volume 44) . IARC: Lyon , 1998 .
12 . Boff etta P , Hashibe M . Alcohol and cancer . Lancet Oncol 2006 ; 7 : 149 – 56 .